Statistical Discrimination and A rmative Action in the Lab
38
Statistical Discrimination and Affirmative Action in the Lab * Ahrash Dianat University of Essex [email protected] Federico Echenique Caltech [email protected] Leeat Yariv Princeton University [email protected] October 21, 2021 Abstract We present results from laboratory experiments studying statistical discrimination and affirmative action. We induce statistical discrimination in simple labor-market inter- actions between firms and workers. We then introduce affirmative-action policies that vary in the size and duration of a subsidy that firms receive for hiring discriminated- against workers. These different affirmative-action policies have nearly the same effect, and practically eliminate discriminatory hiring practices. However, once lifted, few positive effects remain and discrimination reverts to its initial levels. One exception is lengthy affirmative-action policies, which exhibit somewhat longer-lived effects. Stick- iness of beliefs, which we elicit, helps explain the observed outcomes. JEL Classifications: J71, D04, C91 Keywords: Statistical Discrimination, Affirmative Action, Experiments * We thank Richard Sander for very helpful comments as well as the Editor Gary Charness, an anony- mous Associate Editor, and two anonymous reviewers. Echenique gratefully acknowledges the support of NSF grants SES-1558757 and CNS-1518941. Yariv gratefully acknowledges the support of NSF grant SES- 1629613. Prior to conducting the study, the authors obtained ethical approval from the Committee for the Protection of Human Subjects at the California Institute of Technology.
Transcript of Statistical Discrimination and A rmative Action in the Lab

Statistical Discrimination and Affirmative Actionin the Lab∗
Ahrash DianatUniversity of Essex
Federico EcheniqueCaltech
Leeat YarivPrinceton [email protected]
October 21, 2021
Abstract
We present results from laboratory experiments studying statistical discrimination andaffirmative action. We induce statistical discrimination in simple labor-market inter-actions between firms and workers. We then introduce affirmative-action policies thatvary in the size and duration of a subsidy that firms receive for hiring discriminated-against workers. These different affirmative-action policies have nearly the same effect,and practically eliminate discriminatory hiring practices. However, once lifted, fewpositive effects remain and discrimination reverts to its initial levels. One exception islengthy affirmative-action policies, which exhibit somewhat longer-lived effects. Stick-iness of beliefs, which we elicit, helps explain the observed outcomes.
JEL Classifications: J71, D04, C91Keywords: Statistical Discrimination, Affirmative Action, Experiments
∗We thank Richard Sander for very helpful comments as well as the Editor Gary Charness, an anony-mous Associate Editor, and two anonymous reviewers. Echenique gratefully acknowledges the support ofNSF grants SES-1558757 and CNS-1518941. Yariv gratefully acknowledges the support of NSF grant SES-1629613. Prior to conducting the study, the authors obtained ethical approval from the Committee for theProtection of Human Subjects at the California Institute of Technology.

1 Introduction
Affirmative-action policies have had a tumultuous history since their introduction over 50
years ago in the U.S.1 Intended to alleviate inequality in employment and pay, increase
access to education, and promote diversity, they have been a subject of legal and political
controversy. In their various forms, they are often set as a temporary “nudge”, put in place
for a limited duration. For instance, in 2003, the Supreme Court ruled the use of race for
affirmative action in school admissions as constitutional (Grutter v. Bollinger). Justice
Sandra Day O’Connor famously stated that:
“We expect that 25 years from now, the use of racial preferences will no longer
be necessary to further the interest [in student-body diversity] approved today.”
In this paper, we focus on statistical discrimination, where the source of unequal treatment
is a correct statistical evaluation of past performance of different groups of individuals,
rather than differential tastes. Our goal is to assess experimentally the efficacy of several
affirmative-action policies for generating equal treatment while in place and, especially, after
they are lifted.
Our results are threefold. The first is methodological: we are able to induce statistical
discrimination in the laboratory, where workers from a disadvantaged group are discrimi-
nated against despite the absence of any exogenous differences between them. We consider
affirmative-action policies that seek to reverse the induced discriminatory attitudes by re-
warding firms for hiring disadvantaged workers. Rewards are of varying amounts and dura-
tion. Our second finding is that such policies, while in place, generally succeed in eliminating
discrimination and lead to similar hiring rates of all workers. However, our third and arguably
most important finding is that when affirmative-action policies are removed, statistical dis-
crimination rears its head and returns to its original levels. Furthermore, our elicitation of
1The term “affirmative action” was introduced by President John F. Kennedy in an executive order in 1961as a method for redressing discrimination that had persisted in spite of civil rights laws and constitutionalguarantees. It was further developed and enforced under President Lyndon B. Johnson.
1

beliefs suggests one mechanism for the behavior we observe—beliefs change slower than ac-
tions. The main message of the paper therefore implies more limited optimism than Justice
O’Connor’s statement—while affirmative-action policies are effective tools for combating in-
equality while in place, their impact is short-lived. Once lifted, behavior reverts back to the
unequal treatment that affirmative action was designed to undo.
Arrow (1998) argues that taste-based discrimination cannot explain unequal treatment
of workers in the market since there would be arbitrage opportunities that would eventually
drive out discriminating employers. Arrow concludes that statistical discrimination is the
leading hypothesis for explaining the prevalence of discrimination in market settings. In
reality, taste-based discrimination might still be present despite competitive pressures. This
possibility makes field data particularly difficult to work with, as both types of discrimination
could impact observed outcomes. The experimental lab allows us to isolate one channel.
Our experimental design is a particularly simple operationalization of the statistical dis-
crimination model suggested by Kenneth Arrow (1971; 1973). In Arrow’s model, statistical
discrimination is the manifestation of a coordination failure.2 Simplified, the game under-
lying Arrow’s analysis can be described as follows. Agents interact in worker-firm pairs. A
worker may invest in a firm-specific skill, but this investment is worthwhile only if she is
hired. For the firm, hiring a worker is desirable only if the worker has invested in acquiring
the skill. However, workers and firms do not know each other’s choices when making their
own. The resulting game has two Pareto-ranked pure equilibria. In one, the worker invests
and the firm hires. In the other, the worker does not invest and the firm does not hire.
The game entails worker and firms simultaneously making decisions. This captures the
idea of limited information for both parties: workers do not know whether they will be hired
when deciding on their training investments and firms cannot perfectly observe investments.
Indeed, there are many examples of human capital investments that are unobservable by
2Arrow’s model assumes a perfectly symmetric situation and generates differences among groups endoge-nously. Phelps (1972) also proposes statistical discrimination as an explanation for observed discriminatoryoutcomes, but his explanation requires the existence of genuine exogenous differences between groups.
2

firms. Consider a student applying for a prestigious job from a ”non-standard” background—
having attended a low-ranked school, lacking a network of connections employers are linked
to, etc. Even if a student invests greatly in her education, accomplishes high grades, and
glowing recommendations, those indicators might be hard to read and assess for employers,
see e.g. Karimi et al. (2018). The relevant reputations, of schools and of unfamiliar references,
may take a long time to change.
In our experiments, workers are of two types: green and purple. Colors are a metaphor
for group association, and substitute for observable characteristics of real-world workers
(e.g., gender, race). Colors can serve as a coordination device, with different equilibria being
followed when different types of workers are involved. Importantly, worker color is observable,
both in our experiments and their real-world analogues. We term outcomes in which agents
play different equilibria, depending on the color of the worker, as discriminatory.
In each of our sessions, experimental workers and firms are randomly matched, and play
the game multiple times. All participants observe a moving average of historical play—worker
investment levels and firm hiring rates—pertaining to both green and purple workers. The
aggregate public history of play allows us to capture discriminatory path-dependent outcomes
observed in the real world. It also provides a channel for hysteresis that allows us to induce
discrimination in the lab.
Our sessions are comprised of four stages. First, our participants play a version of the
game in which purple workers are less productive than green workers, i.e. have higher costs
of investment. This first stage of the game “seeds” the discriminatory outcome.
In the second stage, we equalize the costs of investment across workers so that there
are no material differences between the two worker groups. The history of play is enough
to generate discriminatory outcomes: we find that participants coordinate on the inefficient
equilibrium (no-investment and no-hiring) when the participating worker is purple. Indeed,
in almost all sessions, firms hire purple workers at significantly lower rates than green workers,
as they correctly anticipate that purple workers will invest at lower rates. Conversely, purple
3

workers invest less than green workers as they correctly anticipate that they will not be
hired as often. These observations illustrate two points. First, our method of inducing
discrimination is effective. Second, when we equalize conditions, discrimination remains.
In particular, equalization in and of itself is insufficient to redress discrimination due to a
historically unequal environment.
The third stage introduces affirmative action. Namely, firms are rewarded for hiring
purple workers. We vary the magnitude of the reward and the duration of affirmative action
across treatments. The academic world provides ample examples for these type of subsidies.
While official records are difficult to attain, many universities reward departments for hiring
minority candidates by allowing more faculty lines as a response; for an anecdotal description,
see Newman (2020). Similarly, the public university systems in California, Florida, Georgia,
and Texas have introduced legislation that allows top high-school students admission in the
state’s colleges, with some funding from the state, see Bleemer (2021) and Kapor (2020).
Admission to these colleges is desirable for the future emplyment opportunities it offers.
Furthermore, to the extent that employers want to have a larger workforce, some quota
policies share features with our subsidy treatments. For instance, suppose an employer
needs to reach 50% representation of employees from a certain demographic. This means
that, for every person hired from that demographic, the employer can hire another person.
Naturally, not all quota policies fit our narrative. However, most affirmative-action policies
share two common features: they induce employers to hire more minority employees and,
in turn, provide prospective minority employees with greater promise of being hired. Our
design captures the essential ingredients of many such policies.
Despite a salient public history of inefficient outcomes associated with purple workers, we
now see firms more willing to hire purple workers. In turn, purple workers invest at greater
rates. Across our treatments, while affirmative action is in place, discrimination essentially
goes away.
Finally, in the last stage, we lift the affirmative-action policy. Thus, the last stage is
4

(a) Workers’ investment decisions (b) Firms’ hiring decisions
Figure 1: Behavior across experimental stages in benchmark treatment
identical to the second stage, in which the environment is perfectly symmetric across worker
types. In all our treatments, participants’ play reverts back to the discriminatory profile
we observed in the second stage of our experiment: purple workers invest less often than
green workers, and are hired less often. In other words, the effects of affirmative action are
short-lived. One exception is the treatment in which affirmative action was imposed for a
relatively long duration, for double the number of periods of each of the other stages. In
that case, some improvement is seen even after the policy is lifted, but outcomes are still
significantly different from those implied by an equal treatment of workers.
Figure 1 illustrates our main findings through our benchmark treatment, entailing a
moderate affirmative-action subsidy for a duration that equals the duration of our other
experimental stages. It shows investment and hiring rates for the different stages of our
experiment, using green and purple colors to distinguish matches. The figure illustrates the
findings described above: the baseline stage exhibits statistical discrimination; affirmative
action largely equalizes hiring and investment rates between green and purple workers; and
the removal of affirmative action sees participants reverting back to statistical discrimination.
In one of our treatments, the subsidy for hiring a purple worker is so high that it is
a dominant strategy for firms to hire, and therefore a best response for purple workers to
invest. This treatment exactly reverses the situation in the seed stage, where it is dominant
5

for purple workers not to invest. Even in this treatment, where we mirror the incentives
provided in the seed stage, affirmative action does not have lasting effects. We view this
result as particularly telling. Naturally, it is difficult to say when an experimental affirmative-
action policy comes close to capturing the mechanisms behind a real-world one. But a policy
that is the exact mirror image of the “seed” conditions that induced discrimination to begin
with seems like a natural candidate for undoing discrimination. We find, however, that
discrimination persists.
Why are the effects of affirmative action so short-lived? The patterns of participants’
beliefs provide some insights. Throughout our experiments, we elicit workers’ beliefs regard-
ing their probabilities of being hired, as well as firms’ beliefs regarding the probabilities that
the workers they encounter had invested. In our experiments, firms’ decisions to hire pur-
ple workers are consistent with their reported beliefs about whether workers had invested.
Affirmative-action policies change (temporarily) the decision to hire purple workers, but
firms’ beliefs do not change significantly—beliefs are sticky. These beliefs do not change
substantially when affirmative-action policies are introduced or removed. Their level is such
that hiring is optimal when subsidies are present, but not when they vanish. As firms appear
to be best responding to their beliefs and the incentives they face, this stickiness in firms’
expectations accounts for the quickly-fading impacts of affirmative action.
To summarize, with a growing desire to equalize the playing field across the market, our
results suggest that affirmative-action policies should be thought through carefully. In their
frequent forms, to be effective, they need to be both substantial in magnitude and long-lived.
2 Related Literature
Arrow (1998) argues that taste-based discrimination cannot explain unequal treatment of
workers in the market since there would be arbitrage opportunities that would eventually
drive out discriminating employers. Arrow concludes that statistical discrimination is the
6

leading hypothesis for explaining the prevalence of discrimination in market settings.
Statistical discrimination is consistent with a rich set of observations in the field. For
instance, Ewens, Tomlin, and Wang (2014) identify statistical discrimination in the US rental
market over race by analyzing renters’ responses to applications from white-sounding and
African American-sounding names in various neighborhoods. Glover, Pallais, and Pariente
(2017) consider interactions between managers and workers in grocery stores and find that
more biased managers are associated with lower performance of minority workers, a pattern
similar to that we induce in our seed stage.3
Coate and Loury (1993) provide a theoretical investigation of statistical discrimination
and affirmative action. They raise the possibility that discrimination may persist after a
period of affirmative action. Some of the basic ideas in their theoretical model are present
in our design: interactions are bilateral, between workers and firms. Workers can invest, but
an informative signal of their decision is available to the firms. Workers’ incentives to invest
are, in fact, channeled through the informative signal: greater investment is associated with
“better” signals, and higher likelihood of being hired. Our design, in contrast, is based on a
pure coordination game. Workers want to invest even if they are guaranteed to be hired: in
fact, workers’ incentives to invest are maximized then.
There are several studies that bring the Coate and Loury (1993) model to the lab. Ander-
son and Haupert (1999) and Fryer, Goeree, and Holt (2005) report on classroom experiments
that capture the main forces of Coate and Loury (1993). The design of our seeding stage is
inspired by these, with two important distinctions. First, we do not allow (explicit) random
signals on workers’ investment decisions. Second, workers’ incentives to invest respond to
whether they are hired or not.
Kidd, Carlin, and Pot (2008) seek to replicate some of the details in the Coate and Loury
model. In particular, their design, unlike ours, relies on an informative signal of whether a
3Bohren, Imas, and Rosenberg (2019) run a field experiment using a large online platform where userspost content that is evaluated by others on the platform. They consider the assessment of posts exogenouslyvaried by gender and history on the platform and find evidence for biased beliefs, as induced in our seedingstage, driving discriminatory attitudes.
7
worker has invested, and much of the analysis tests the comparative-statics results of Coate
and Loury (1993). In this setting, workers over-invest. The Kidd, Carlin, and Pot (2008)
design is one-sided: experimental participants play the role of workers, while firms’ choices
are computerized. In our study, firms’ choices are an important object for analysis, and
their evolving beliefs, which we elicit, provide hints as to the source of the limited long-run
efficacy of affirmative action we observe. Feltovich, Gangadharan, and Kidd (2013) use a
similar design to that used by Kidd, Carlin, and Pot (2008), but focus on outcomes following
the removal of an affirmative-action policy. They find that workers invest significantly more
after affirmative action is removed than when it is in place. In their design, since the
incentives to invest operate through their effects on the informative signal, workers who
know they will be hired do not have strong incentives to invest. Thus, affirmative action
suppresses investment. Our experiment has the opposite property, and we see that workers
invest more when the affirmative-action policy is in place.4
Outside of the Coate and Loury (1993) setting, various studies have looked at affirmative-
action policies in the lab. For example, in the context of gender discrimination, Niederle,
Segal, and Vesterlund (2013) illustrate the effectiveness of affirmative-action policies in in-
ducing women to compete. In contrast, Bracha, Cohen, and Conell-Price (2019) illustrate
the potential harmful effects of affirmative action through its production of stereotype threat,
whereby women are primed with negative stereotypes. Anderson, Fryer, and Holt (2006)
present a survey of experiments in psychology and economics dealing with discrimination.
There is important work using field data that suggests potential shortcomings of affir-
mative action. Sander (2004) illustrates several negative impacts on African-American law
students in the US. Sander and Taylor (2012) provide a comprehensive account of the im-
pacts of affirmative-action policies on racial equality in US higher education. They suggest
that even while in place, affirmative-action policies may have had detrimental effects on
4de Haan, Offerman, and Sloof (2017) study experimentally the impacts of of competition on statisticaldiscrimination. They show that, in the setting of Coate and Loury (1993), competition allows statisticaldiscrimination to emerge more easily and forcefully.
8

minority students.5
To conclude, we believe there are several features of our design whose combination is
absent from most of the literature on affirmative action. First, we generate discrimination
in the lab, rather than relying on participants’ existing prejudices that may vary in strength
and difficult to control for. Second, we allow both workers and firms to act strategically and
elicit all participants’ beliefs throughout the evolution of our experimental sessions. Beliefs
are challenging to elicit in the field and provide insights into the mechanisms driving the
successes and limitations of affirmative action. Last, we consider the impacts of affirmative
action not only when it is in place, but also after it is lifted.
Methodologically, our technique for seeding discrimination relies on the presence of
hysteresis—equilibrium selection at the start of the experiment affects selection later on.
Outside the context of discrimination, Brandts and Cooper (2006) and Romero (2015) illus-
trate the presence of hysteresis in standard coordination games in which payoff parameters
are changed over time.
3 Experimental Design
We start with a description of the game underlying our treatments. We then set forth a
detailed description of our experimental protocol.
3.1 The Underlying Game
We consider statistical discrimination as a self-fulfilling equilibrium phenomenon. The model
guiding our design is a stylized version of the model proposed by Arrow (1971)6: a worker
can decide to undertake a costly investment in productivity, and a firm has to decide whether
to hire the worker. The investment is only worthwhile to the worker if she is hired by the
5Krueger, Rothstein, and Turner (2006) assess empirically Justice O’Connor’s prediction that affirmativeaction would not be needed 25 years after the Grutter v. Bollinger ruling and find limited support for it.
6See Appendix F in Arrow’s paper; see also Coate and Loury (1993).
9

FirmHire Not Hire
WorkerInvest 1800 − c, 1600 1000 − c, 1200
Not Invest 1400, 400 1200, 1200
Table 1: The investment/hiring game, where c denotes the cost of investment.
firm, but the worker has to make the decision to invest or not before knowing if she will be
hired. The firm only wants to hire a worker if she has invested, but has to decide on hiring
the worker without knowing the worker’s choice. In our setting, summarized in Table 1,
for small enough investment costs c, there are two pure-strategy equilibria: (Invest, Hire)
and (Not Invest, Not Hire).7 The former Pareto dominates the latter; there is therefore
the possibility of coordination failure, whereby workers fail to invest because they correctly
anticipate that they will not be hired.
Suppose there are two kinds of workers: GREEN workers and PURPLE workers—these
categories can stand for different genders, races, etc. If worker color is observable, it is
possible that firms will coordinate on (Invest, Hire) with, say, GREEN workers and on
(Not Invest, Not Hire) with PURPLE workers. This situation corresponds to what we term
statistical discrimination.
The particular flavor of statistical discrimination we are interested in, based on self-
fulfilling expectations about hiring and investment, raises the question of how a society
arrives at different hiring and investment rates for GREEN and PURPLE workers. The
answer in our paper is path dependence. Our experiment starts with a “seed” stage, in which
we make investment more costly for PURPLE workers. The seed stage may then affect
beliefs in later, symmetric, rounds of play. Firms and PURPLE workers may coordinate on
the Pareto dominated equilibrium because their beliefs are anchored in a history in which
the outcome was (Not Invest, Not Hire).
7In principle, the presence of social preferences could alter players’ utilities such that Table 1 no longerinduces a coordination game. However, for the values of c used in the experiment, both equilibrium outcomesfeature less inequality across players’ payoffs compared to the non-equilibrium outcomes. Therefore, theequilibria of Table 1 should be unaffected under standard models of social preferences.
10

The difference in investment costs at the seed stage is certainly a simplification, and is
meant to capture a combination of possible real-world differences between people of different
genders, races, and ethnicities. One possibility is that it captures literal differences in invest-
ment costs for members of disadvantaged and minority groups; for example, differences in
the cost of schooling. The difference in investment cost may also reflect other difficulties in
accessing the labor market, including those arising from preference-based discrimination—
historical hiring rates may have been lower for some groups.
The numerical values in this game, which are proportional to the payoffs used in our
experiment, are chosen to satisfy several constraints. First, the firm prefers to hire a worker
if and only if the worker invests. Second, for high c, investing is strictly dominated. Third,
for low c, there are two Pareto-ranked pure equilibria. Furthermore, there is a fixed cost of
investment—say, the time required to acquire a skill that takes away from one’s earnings,
regardless of the quality and intensity of the educational period. Thus, even when c = 0, a
worker who is not hired is better off not investing (in our experiments, however, we set the
minimal cost at c = 200, leading the worker to indifference when not hired). Fourth, if the
firm receives a substantially high subsidy for hiring a worker of a particular type, which is
the affirmative-action policy we consider, hiring the worker is dominant. Last, experimental
payoffs need to be such that expected payoff differences across action profiles are meaningful
and ultimate payoffs fall within those commonly paid in the experimental lab.8
3.2 Overview of Treatments
For the purpose of describing the experiment, we define some standard terminology. Our
experiment consists of two players playing a simultaneous-move game. Each play of the
game is a round. Experimental participants play a number of rounds in a single one-hour
8One could certainly come up with other values that would satisfy these constraints and thereby captureidentical ordinal incentives. Robustness to variations in payoffs that retain such ordinal comparisons is aninteresting question more generally, but is outside the scope of this paper. Furthermore, we use a choicetask that we hope appears fairly neutral to participants. One could also contemplate similar designs withreal-effort tasks.
11

long sitting: each such sitting is a session. In a session, the same group of participants
plays the game repeatedly, each participant being randomly and anonymously matched with
other participants to play the two-player game. The different sessions vary in how we set
the game parameters. A treatment is one specification of game parameters.
Our experiment is comprised of three treatments, where each treatment is run in several
sessions. In all of our treatments, each session has four stages. Each stage consists of a fixed
number of rounds. At the beginning of the session, participants are randomly assigned to
the role of either a worker or a firm. Workers are also randomly assigned a color: GREEN or
PURPLE. Both a participant’s role, a firm or a worker, and workers’ color are fixed across
all session rounds.
Across treatments and stages, rounds follow a fixed protocol. In each round, workers
and firms are randomly matched in pairs to play an investment/hiring game, shown in
Table 1. Each worker decides whether to invest in costly training, where c represents the
cost of investment, which is common knowledge. Each firm, knowing the color of the worker
she is paired with, decides whether to hire the worker. Both worker and firm make their
decisions simultaneously, without observing each other’s decision. As we describe in the next
subsection, the firm’s profit from hiring a worker can depend on the stage, the worker’s color,
and the worker’s decision to invest or not. The determination of firms’ profits varies across
our three treatments. In each round, workers and firms are also asked to report their beliefs
about the other player’s decision. For instance, a worker is asked to report her belief about
how likely it is that the firm chose to hire her. Similarly, a firm is asked to report her belief
about how likely it is that the worker chose to invest in training. We use the binarized scoring
rule of Hossain and Okui (2013) to incentivize belief elicitation. The binarized scoring rule is
incentive compatible even for decision makers who are not risk neutral. Before making their
decisions, all participants can observe a public history consisting of four moving averages: (1)
GREEN workers’ average investment rate, (2) PURPLE workers’ average investment rate,
(3) firms’ average hiring rate when paired with a GREEN worker, and (4) firms’ average
12

hiring rate when paired with a PURPLE worker. These averages are based on the decisions
of all participants across all previous rounds of the session. For maximum clarity, these
averages are reported graphically and numerically. At the end of each round, participants
observe their own and their matched participant’s decisions and payoffs. All payoffs in the
experiment are expressed in tokens, where 1 token = $0.01.9
At the end of the experiment, participants complete two risk elicitation tasks and one
survey questionnaire. Specifically, we use the risk elicitation task from Gneezy and Potters
(1997). Each participant is given a token endowment and decides how many tokens to invest
in a risky project with a known chance of success. We use duplicate elicitations in order
to account for measurement error, see Gillen, Snowberg, and Yariv (2019). The survey
questionnaire contains basic demographic, academic, and lifestyle questions.10
3.3 Stages of the Experiment
We now describe the four stages of each session.
Stage 1: Seed Stage
In the first stage of each session (Rounds 1 - 10), GREEN and PURPLE workers face different
costs of investment. For a GREEN worker, the cost of investment is 200 tokens (c = 200
in Table 1). For a PURPLE worker, the cost of investment is 600 tokens (c = 600). These
parameters generate two different games depending on the particular worker-firm matching.
Notably, PURPLE workers have a dominant strategy of not investing. When a firm is paired
with a PURPLE worker, iterated elimination of strictly dominated strategies yields (Not
Invest, Not Hire) as the unique outcome; (Not Invest, Not Hire) is therefore the unique Nash
equilibrium of the game. When a firm is paired with a GREEN worker, however, the strategic
environment is a coordination game with two pure-strategy Nash equilibria: (Invest, Hire)
9The full set of instructions is available here: http://www.leeatyariv.com/papers/Discrimination_
Instructions.pdf10The survey details are available here: http://www.leeatyariv.com/papers/Discrimination_
Demographics.pdf
13

and (Not Invest, Not Hire). The (Invest, Hire) equilibrium is Pareto-dominant. For each
participant, playing their component of the Pareto-dominant equilibrium is a best response
if the other participant is playing their component of the equilibrium with a probability of
at least 23. Stage 1 serves to “seed” discrimination between GREEN and PURPLE workers.
Stage 2: Baseline Stage
In the second stage of each session (Rounds 11 - 20), investment costs are equalized. Both
GREEN and PURPLE workers now face an investment cost of 200 tokens (c = 200). Statis-
tical discrimination occurs if participants coordinate on the Pareto-dominant (Invest, Hire)
equilibrium when a firm plays against a GREEN worker, while participants coordinate on
the Pareto-dominated (Not Invest, Not Hire) equilibrium when a firm plays against a PUR-
PLE worker.11 The purpose of Stage 2 is twofold. The first is to test whether statistical
discrimination emerges in the lab, once “seeded” by Stage 1. The second is to assess the
extent to which it is alleviated over time, as the game with symmetric investment cost is
played repeatedly.
Stage 3: Introducing Affirmative Action
In the third stage of each session, we maintain equal investment costs for both colors, but we
implement an affirmative-action policy to incentivize the hiring of PURPLE workers. The
policy takes the form of a subsidy s for any firm that chooses to hire a PURPLE worker,
regardless of whether or not the worker invested in training. Our experimental treatments
vary the size of the subsidy and the length of this stage.
• Subsidy: For a period of 10 rounds (Rounds 21 - 30), each firm that hires a PURPLE
worker earns an additional payment of 200 tokens (s = 200). For a firm, hiring a
11We focus here on the two pure-strategy equilibria, though in principle, we could consider discriminatoryoutcomes as ones in which GREEN and PURPLE workers engage in different equilibrium behavior moregenerally. As will be seen, individuals do not appear to play the mixed-strategy equilibrium in our data.
14

Subsidy High Subsidy Long Subsidy
Length of Experiment 40 rounds 40 rounds 50 roundsLength of Stage 3 10 rounds 10 rounds 20 rounds
Subsidy for Hiring GREEN (Stage 3) s = 0 s = 0 s = 0Beliefs for Hiring GREEN (Stage 3) pInvest ≥ 2
3pInvest ≥ 2
3pInvest ≥ 2
3
Subsidy for Hiring PURPLE (Stage 3) s = 200 s = 900 s = 200Beliefs for Hiring PURPLE (Stage 3) pInvest ≥ 1
2pInvest ≥ 0 pInvest ≥ 1
2
Number of Sessions 5 5 5Number of Participants 88 84 96
Table 2: A summary of our experimental treatments.
PURPLE worker is now a best response if the worker is investing with a probability of
at least 12.
• High Subsidy: For a period of 10 rounds (Rounds 21 - 30), each firm that hires a
PURPLE worker earns an additional payment of 900 tokens (s = 900). For a firm,
hiring a PURPLE worker is now a dominant strategy. We note that by making the
hiring of PURPLE workers a dominant strategy, the High Subsidy treatment is the
mirror image of the seed stage.
• Long Subsidy: For a period of 20 rounds (Rounds 21 - 40), each firm that hires a
PURPLE worker earns an additional payment of 200 tokens (s = 200). For a firm,
hiring a PURPLE worker is now a best response if the worker is investing with a
probability of at least 12.
Stage 4: Removing Affirmative Action
In the fourth stage of each session (Subsidy and High Subsidy: Rounds 31 - 40, Long Subsidy:
Rounds 41 - 50), the subsidy is removed. The parameters of Stage 4 are identical to those
of Stage 2.
15

3.4 Implementation
All experimental sessions were run at the Experimental Social Science Laboratory (ESSL) at
UC Irvine. A total of 268 participants participated in 15 sessions. A summary of the treat-
ments and corresponding sessions appears in Table 2. Each session lasted approximately one
hour. Each participant’s earnings were the sum of a $7 show-up payment, their payoff from
one randomly selected experimental round, and their payoff from one randomly selected risk-
elicitation task. Average participant earnings were $24.46 (including the show-up payment).
The experiment was programmed and conducted using the oTree software (Chen, Schonger,
and Wickens, 2016).
4 Hiring and Investment Decisions
We describe our results using the entire set of data. In the Online Appendix, we replicate
the analysis using the last five rounds of each stage, in order to account for potential learning
effects. The analysis using the last five rounds yields identical conclusions. We also show
in the Online Appendix that responses of workers and firms to changing parameters are
simultaneous and neither appears to precede the other.
Our data is structured as follows: we have multiple observations (one for each round,
indexed by t) for each participant (indexed by i) who belongs in a particular session (indexed
by j). For the core results of the paper, we assess statistical significance using multi-level
random effects models.12 In particular, we estimate versions of the following model:
12We use the multi-level random effects approach to deal with the problem of clustering standard errors.The appropriate level of clustering for the econometric analysis of experimental data is still an open question.Ibragimov and Muller (2016) develop a statistical test for the appropriate level of clustering, which they applyto experimental data from Dal Bo and Frechette (2011). While they reject the null hypothesis of a fine levelof clustering (at the participant level) against the alternative hypothesis of a coarse level of clustering (at thesession level) in six out of seven cases, they also note that inference with so few clusters has the disadvantageof producing large variability in standard error estimates. Moffatt (2015), on the other hand, argues forexplicitly recognizing the panel structure of the data and using a multi-level modeling approach whenevermore than one level of clustering is appropriate. We adopt Moffatt (2015)’s recommendation.
16

yijt = α + βxit + ui + vj + εijt,
where yijt is a dummy variable that measures the outcome variable of interest (i.e.,
investment or hiring), xit is a dummy variable for worker color, ui is a participant-specific
error term, vj is a session-specific error term, and εijt is a conventional error term. Tables 3
- 6 summarize our main results by presenting average investment/hiring rates as well as
significance levels for the test of the null hypothesis that β = 0.
The multi-level random-effects model is a conservative approach to capturing the possi-
ble existence of unobserved dependencies between different observations in our data. The
composition of participant pools across sessions may induce unobserved heterogeneity that
can result in incorrect standard errors. Some participants in firm (worker) roles may sys-
tematically hire (invest) at higher rates than other participants, while some sessions may be
characterized by higher levels of hiring and investment than other sessions. We conduct like-
lihood ratio tests to check for the presence of both between-participant and between-session
variation in our data. In particular, we test the null hypothesis that there is neither between-
participant nor between-session variation (σ2u = 0, σ2
v = 0). Under the null hypothesis, the
relevant test statistic has a χ2(2) distribution since we are jointly testing two restrictions.
We find strong evidence for the presence of both types of variation (p < 0.10 in all cases,
p < 0.05 in all but one case). These results suggest that the multi-level random effects model
is preferable to the linear regression model given our data’s structure.13
For each stage, we consider 6 comparisons, pertaining to the investment and hiring of
green relative to purple workers across our three treatments. As discussed above, the regres-
sions utilized for these comparisons include only one explanatory variable. Nonetheless, an
important caveat is that multiple hypotheses are reported simultaneously.14
13The standard specification we use does not account for interactions between participant and sessioneffects—it presumes participant- and session-specific error terms are independent of one another. Our resultsshould therefore be interpreted with appropriate caution.
14As a benchmark, suppose each comparison was conclusive and determined fully at random, so thatthe coefficient on the worker’s color in the appropriate regression was strictly positive or strictly negative
17
Seed StageTreatment Investment Hiring
GREEN PURPLE GREEN PURPLE
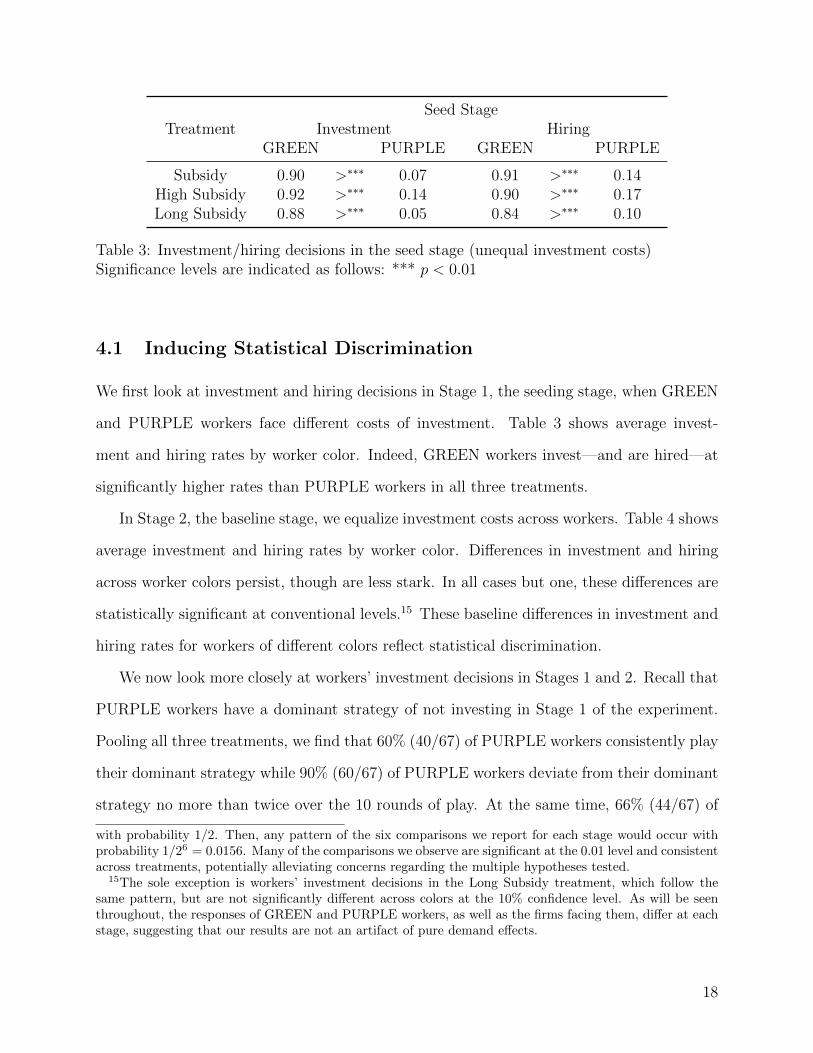
Subsidy 0.90 >∗∗∗ 0.07 0.91 >∗∗∗ 0.14High Subsidy 0.92 >∗∗∗ 0.14 0.90 >∗∗∗ 0.17Long Subsidy 0.88 >∗∗∗ 0.05 0.84 >∗∗∗ 0.10
Table 3: Investment/hiring decisions in the seed stage (unequal investment costs)Significance levels are indicated as follows: *** p < 0.01
4.1 Inducing Statistical Discrimination
We first look at investment and hiring decisions in Stage 1, the seeding stage, when GREEN
and PURPLE workers face different costs of investment. Table 3 shows average invest-
ment and hiring rates by worker color. Indeed, GREEN workers invest—and are hired—at
significantly higher rates than PURPLE workers in all three treatments.
In Stage 2, the baseline stage, we equalize investment costs across workers. Table 4 shows
average investment and hiring rates by worker color. Differences in investment and hiring
across worker colors persist, though are less stark. In all cases but one, these differences are
statistically significant at conventional levels.15 These baseline differences in investment and
hiring rates for workers of different colors reflect statistical discrimination.
We now look more closely at workers’ investment decisions in Stages 1 and 2. Recall that
PURPLE workers have a dominant strategy of not investing in Stage 1 of the experiment.
Pooling all three treatments, we find that 60% (40/67) of PURPLE workers consistently play
their dominant strategy while 90% (60/67) of PURPLE workers deviate from their dominant
strategy no more than twice over the 10 rounds of play. At the same time, 66% (44/67) of
with probability 1/2. Then, any pattern of the six comparisons we report for each stage would occur withprobability 1/26 = 0.0156. Many of the comparisons we observe are significant at the 0.01 level and consistentacross treatments, potentially alleviating concerns regarding the multiple hypotheses tested.
15The sole exception is workers’ investment decisions in the Long Subsidy treatment, which follow thesame pattern, but are not significantly different across colors at the 10% confidence level. As will be seenthroughout, the responses of GREEN and PURPLE workers, as well as the firms facing them, differ at eachstage, suggesting that our results are not an artifact of pure demand effects.
18

Baseline StageTreatment Investment Hiring
GREEN PURPLE GREEN PURPLE
Subsidy 0.86 >∗∗∗ 0.50 0.89 >∗∗∗ 0.52High Subsidy 0.89 >∗∗∗ 0.58 0.90 >∗∗∗ 0.54Long Subsidy 0.83 > 0.75 0.83 >∗∗∗ 0.63
Table 4: Investment/hiring decisions in the baseline stage (equal investment costs)Significance levels are indicated as follows: *** p < 0.01
GREEN workers consistently invest in all Stage 1 rounds. When the investment costs are
equalized in Stage 2, only 27% (18/67) of PURPLE workers invest in all rounds while 75%
(50/67) of GREEN workers invest in all rounds. However, we also observe that few PURPLE
workers continue to play their component of the Pareto-dominated equilibrium “seeded” in
Stage 1: only 12% (8/67) of PURPLE workers consistently fail to invest in all Stage 2 rounds.
The empirical cumulative distribution functions (CDFs) of participant-level investment
rates are shown in Figure 2 (panels a - f).16 Unsurprisingly, we observe sharp differences in
Stage 1 behavior. In all cases except one, it is clear that the empirical distribution for GREEN
workers first-order stochastically dominates the empirical distribution for PURPLE workers.
In all cases except one, we can also reject the null hypothesis that the average investment rates
for GREEN and PURPLE workers come from the same underlying theoretical distribution
(assessed with a Kolmogorov-Smirnov test yielding p < 0.001).17
We conduct a similar exercise with respect to firms’ hiring decisions.18 The empirical
CDFs of participant-level hiring rates are also shown in Figure 2 (panels g - l). Consistent
with our observations pertaining to workers’ behavior, the empirical distribution for hiring
GREEN workers first-order stochastically dominates the empirical distribution for hiring
16An independent observation corresponds to a worker’s average investment rate across all rounds of thestage.
17As before, the sole exception is workers’ investment decisions in Stage 2 of the Long Subsidy treatment,where the Kolmogorov-Smirnov test yields p = 0.183.
18Since firms interact with both worker types in a given stage, we calculate a pair of observations foreach firm: their average hiring rate when facing GREEN workers and their average hiring rate when facingPURPLE workers.
19

(a) (b) (c)
(d) (e) (f)
(g) (h) (i)
(j) (k) (l)
Figure 2: Empirical CDFs of participant-level behavior before affirmative action
20

PURPLE workers in all cases. We can also reject the null hypothesis that the average
hiring rates for GREEN and PURPLE workers come from the same theoretical distribution
(assessed with a Kolmogorov-Smirnov test yielding p < 0.001 in all cases).
Our analysis throughout utilizes our full experimental data. Given that discriminatory
behavior is less pronounced in the baseline stage of the Long Subsidy treatment, especially
when considering workers’ behavior, it is natural to worry that some of our conclusions are
driven by limited inducement of discrimination in that treatment. We note, however, that
the focus of most of our analysis is on the effects of affirmative action and its removal relative
to the baseline stage. In fact, even when we eliminate the three sessions exhibiting the least
difference in hiring rates across GREEN and PURPLE workers in the baseline stage (one of
which belongs to the High Subsidy treatment and two of which belong to the Long Subsidy
treatment), the results reported here remain qualitatively unchanged.
Looking at aggregate investment and hiring rates in Stage 2 could lead to the conclusion
that workers and firms are coordinating on the mixed-strategy equilibrium. However, Fig-
ure 2 casts doubt on this interpretation. In particular, at the individual level, both PURPLE
workers and firms paired with them do not appear to be concentrating their strategies around
those prescribed by the mixed-strategy equilibrium (i.e., invest and hire with 23
probability).
4.2 Introducing Affirmative Action
In Stage 3 of each experimental treatment, we introduce an affirmative-action policy in which
each firm who hires a PURPLE worker is paid an additional subsidy. The size of the subsidy
and its duration vary across our three treatments.
Table 5 shows average investment and hiring rates by worker color. Compared to the
rates in Table 4, we see a notable decrease in discriminatory outcomes. In particular, there
are no longer significant differences across worker color when it comes to workers’ invest-
ment decisions. That being said, the average investment rates of PURPLE workers still
21

Introducing AATreatment Investment Hiring
GREEN PURPLE GREEN PURPLE
Subsidy 0.76 > 0.65 0.73 > 0.70High Subsidy 0.78 > 0.69 0.72 < 0.86Long Subsidy 0.74 <∗∗ 0.88 0.69 <∗∗∗ 0.85
Table 5: Investment/hiring decisions during affirmative actionSignificance levels are indicated as follows: *** p < 0.01, ** p < 0.05
lag behind those of GREEN workers in both the Subsidy and High Subsidy treatments
(where affirmative action lasts only 10 rounds). In other words, PURPLE workers do not
fully internalize firms’ responses to subsidies. It may seem odd that this occurs even in the
High Subsidy treatment, when firms have a dominant strategy of hiring PURPLE workers
and hire PURPLE workers at even greater rates than those pertaining to GREEN work-
ers. However, investment by PURPLE workers in this treatment requires “second-order”
rationality—PURPLE workers have to be rational and to also believe that firms are ratio-
nal. The investment rate in our data (69%) is comparable to the estimate of second-order
rationality (71%) found in Kneeland (2015).
The three affirmative-action policies we test are also effective in manipulating firms’ hiring
behavior. In the Subsidy treatment (10 rounds, s = 200), firms no longer hire GREEN and
PURPLE workers at significantly different rates. However, intensifying the affirmative-action
policy by either increasing the size of the subsidy (from s = 200 to s = 900) or increasing the
length of the subsidy (from 10 rounds to 20 rounds) causes firms to favor PURPLE workers
in their hiring decisions. The impact of the subsidy increase is only modestly significant,
while the impact of lengthening the subsidy is highly significant.
It is interesting to note that investment and hiring rates of PURPLE workers in the
affirmative-action stage of the Long Subsidy treatment substantially exceed those observed
in the Subsidy treatment, especially given that the first 10 rounds of the affirmative-action
stage are identical in both treatments. This hints at an insight we will return to in Section 5.
22

(a) (b)
(c) (d)
(e) (f)
Figure 3: Empirical CDFs of participant-level behavior during affirmative action
23

Removing AATreatment Investment Hiring
GREEN PURPLE GREEN PURPLE
Subsidy 0.80 >∗∗∗ 0.48 0.72 >∗∗∗ 0.42High Subsidy 0.83 >∗∗ 0.59 0.78 >∗∗∗ 0.52Long Subsidy 0.80 > 0.67 0.71 >∗ 0.63
Table 6: Investment/hiring decisions after affirmative actionSignificance levels are indicated as follows: *** p < 0.01, ** p < 0.05, * p < 0.10
Knowing that the subsidy will remain in place for a long duration seems to affect behavior
even in the initial rounds following the introduction of affirmative action.
The individual-level data further confirm that affirmative action is largely successful
in reversing the previously-observed differences across worker colors. Figure 3 shows the
empirical CDFs of participant-level investment and hiring rates while affirmative action is
in place. For all treatments, we fail to reject the null hypothesis that GREEN and PURPLE
workers’ average investment rates come from the same distribution.19 Furthermore, for all
treatments, we fail to reject the null hypothesis that the average hiring rates of GREEN and
PURPLE workers come from the same distribution.20
4.3 Removing Affirmative Action
In Stage 4 of each treatment, we remove the affirmative-action subsidy. The parameters of
this stage are then identical to those of our baseline stage, Stage 2. The purpose of this
stage is to assess whether the benefits of affirmative action persist after the policy is lifted.
Table 6 depicts average investment and hiring rates by worker color. In terms of both
investment and hiring decisions, we observe a surprising reversion to pre-affirmative action
patterns of behavior. In all three treatments, GREEN workers invest at higher rates than
19Using a Kolmogorov-Smirnov test, we have the following p-values across treatments: Subsidy, p = 0.146;High Subsidy, p = 0.057; Long Subsidy, p = 0.183.
20Using a Kolmogorov-Smirnov test, we have the following p-values across treatments: Subsidy, p = 0.743;High Subsidy, p = 0.347; Long Subsidy, p = 0.187.
24
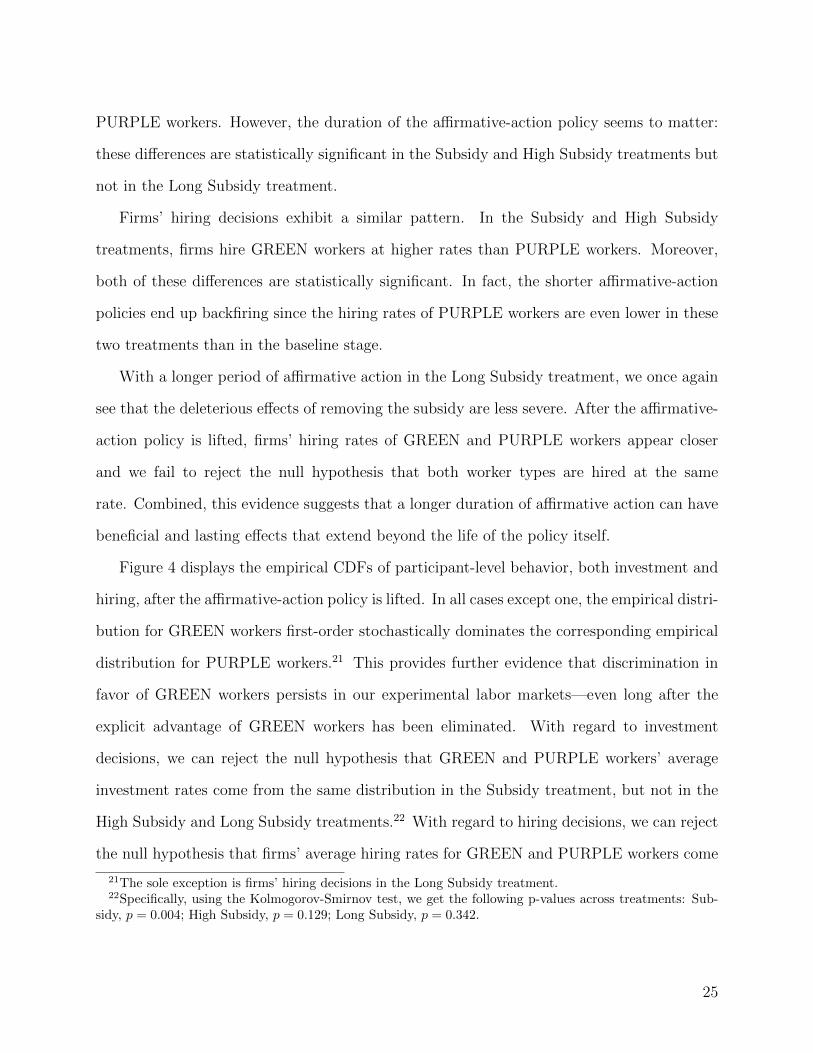
PURPLE workers. However, the duration of the affirmative-action policy seems to matter:
these differences are statistically significant in the Subsidy and High Subsidy treatments but
not in the Long Subsidy treatment.
Firms’ hiring decisions exhibit a similar pattern. In the Subsidy and High Subsidy
treatments, firms hire GREEN workers at higher rates than PURPLE workers. Moreover,
both of these differences are statistically significant. In fact, the shorter affirmative-action
policies end up backfiring since the hiring rates of PURPLE workers are even lower in these
two treatments than in the baseline stage.
With a longer period of affirmative action in the Long Subsidy treatment, we once again
see that the deleterious effects of removing the subsidy are less severe. After the affirmative-
action policy is lifted, firms’ hiring rates of GREEN and PURPLE workers appear closer
and we fail to reject the null hypothesis that both worker types are hired at the same
rate. Combined, this evidence suggests that a longer duration of affirmative action can have
beneficial and lasting effects that extend beyond the life of the policy itself.
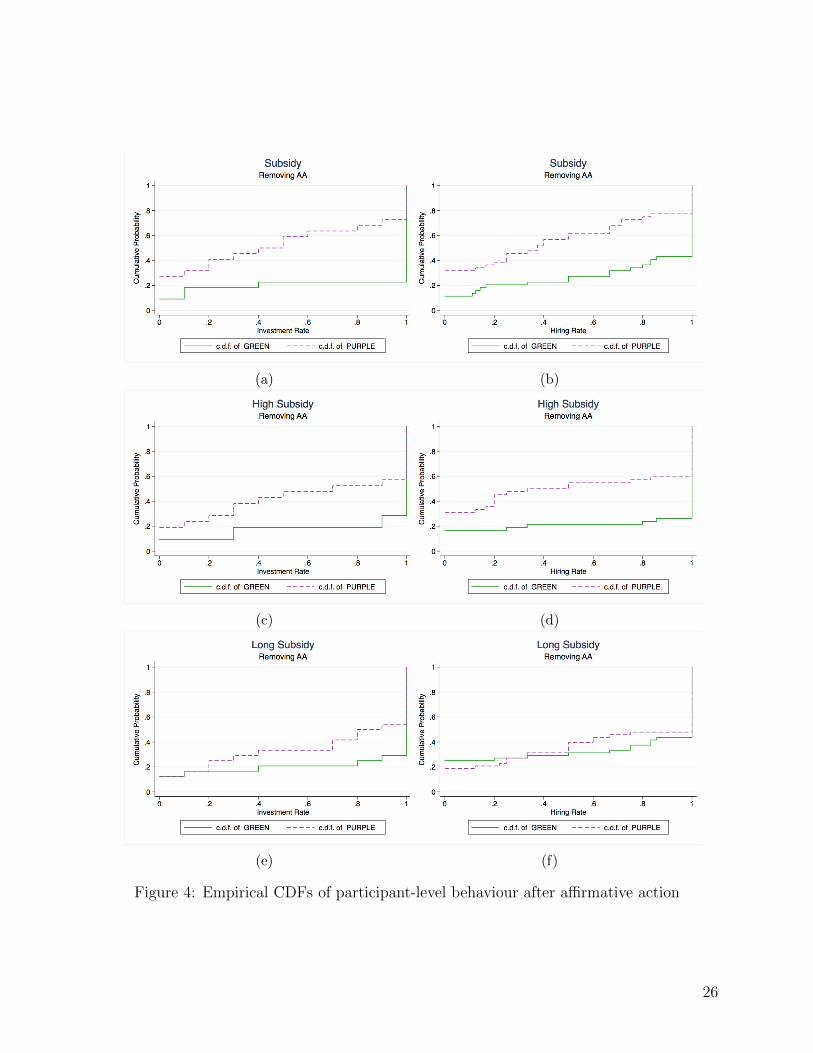
Figure 4 displays the empirical CDFs of participant-level behavior, both investment and
hiring, after the affirmative-action policy is lifted. In all cases except one, the empirical distri-
bution for GREEN workers first-order stochastically dominates the corresponding empirical
distribution for PURPLE workers.21 This provides further evidence that discrimination in
favor of GREEN workers persists in our experimental labor markets—even long after the
explicit advantage of GREEN workers has been eliminated. With regard to investment
decisions, we can reject the null hypothesis that GREEN and PURPLE workers’ average
investment rates come from the same distribution in the Subsidy treatment, but not in the
High Subsidy and Long Subsidy treatments.22 With regard to hiring decisions, we can reject
the null hypothesis that firms’ average hiring rates for GREEN and PURPLE workers come
21The sole exception is firms’ hiring decisions in the Long Subsidy treatment.22Specifically, using the Kolmogorov-Smirnov test, we get the following p-values across treatments: Sub-
sidy, p = 0.004; High Subsidy, p = 0.129; Long Subsidy, p = 0.342.
25
(a) (b)
(c) (d)
(e) (f)
Figure 4: Empirical CDFs of participant-level behaviour after affirmative action
26
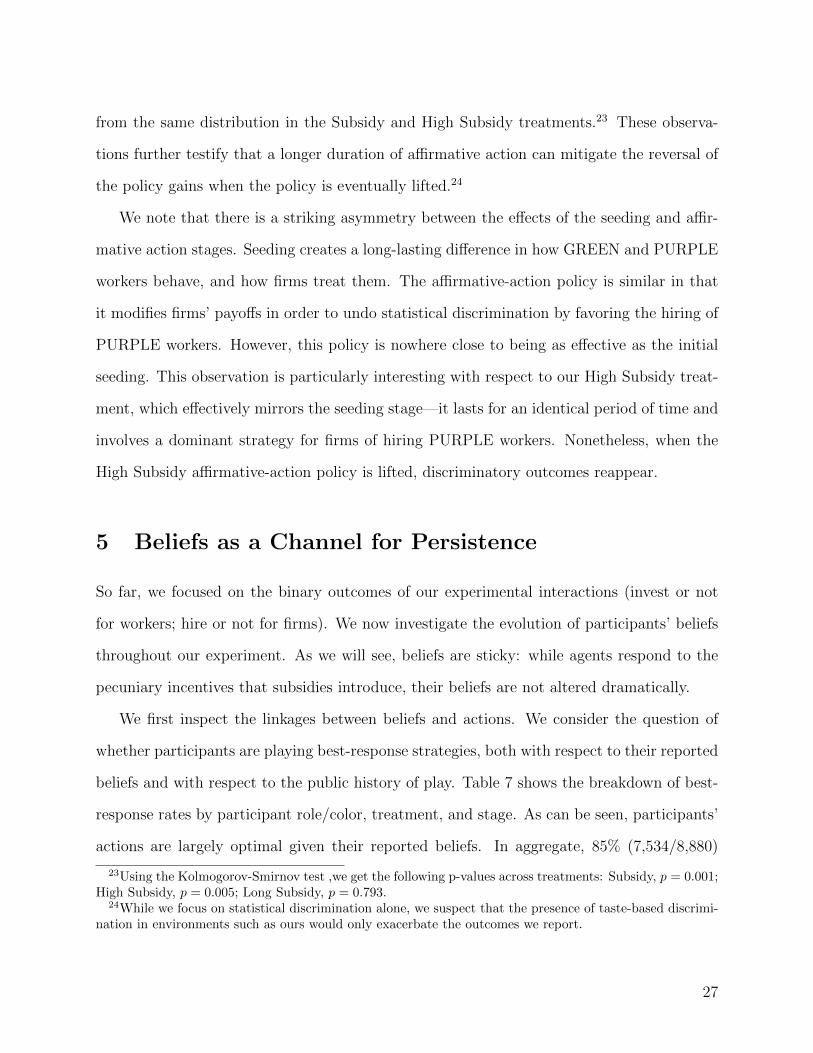
from the same distribution in the Subsidy and High Subsidy treatments.23 These observa-
tions further testify that a longer duration of affirmative action can mitigate the reversal of
the policy gains when the policy is eventually lifted.24
We note that there is a striking asymmetry between the effects of the seeding and affir-
mative action stages. Seeding creates a long-lasting difference in how GREEN and PURPLE
workers behave, and how firms treat them. The affirmative-action policy is similar in that
it modifies firms’ payoffs in order to undo statistical discrimination by favoring the hiring of
PURPLE workers. However, this policy is nowhere close to being as effective as the initial
seeding. This observation is particularly interesting with respect to our High Subsidy treat-
ment, which effectively mirrors the seeding stage—it lasts for an identical period of time and
involves a dominant strategy for firms of hiring PURPLE workers. Nonetheless, when the
High Subsidy affirmative-action policy is lifted, discriminatory outcomes reappear.
5 Beliefs as a Channel for Persistence
So far, we focused on the binary outcomes of our experimental interactions (invest or not
for workers; hire or not for firms). We now investigate the evolution of participants’ beliefs
throughout our experiment. As we will see, beliefs are sticky: while agents respond to the
pecuniary incentives that subsidies introduce, their beliefs are not altered dramatically.
We first inspect the linkages between beliefs and actions. We consider the question of
whether participants are playing best-response strategies, both with respect to their reported
beliefs and with respect to the public history of play. Table 7 shows the breakdown of best-
response rates by participant role/color, treatment, and stage. As can be seen, participants’
actions are largely optimal given their reported beliefs. In aggregate, 85% (7,534/8,880)
23Using the Kolmogorov-Smirnov test ,we get the following p-values across treatments: Subsidy, p = 0.001;High Subsidy, p = 0.005; Long Subsidy, p = 0.793.
24While we focus on statistical discrimination alone, we suspect that the presence of taste-based discrimi-nation in environments such as ours would only exacerbate the outcomes we report.
27

Seed StageSubsidy High Subsidy Long Subsidy
GREEN workers 0.85/0.84 0.71/0.85 0.78/0.81PURPLE workers 0.93/0.93 0.86/0.86 0.95/0.95Firms paired with GREEN 0.80/0.80 0.78/0.79 0.74/0.78Firms paired with PURPLE 0.90/0.86 0.85/0.83 0.90/0.90
Baseline StageSubsidy High Subsidy Long Subsidy
GREEN workers 0.90/0.86 0.83/0.89 0.86/0.83PURPLE workers 0.72/0.50 0.73/0.42 0.65/0.25Firms paired with GREEN 0.88/0.89 0.87/0.90 0.80/0.85Firms paired with PURPLE 0.69/0.48 0.75/0.46 0.67/0.37
Introducing Affirmative ActionSubsidy High Subsidy Long Subsidy
GREEN workers 0.93/0.76 0.87/0.81 0.84/0.88PURPLE workers 0.81/0.35 0.86/0.31 0.88/0.16Firms paired with GREEN 0.85/0.76 0.87/0.79 0.84/0.85Firms paired with PURPLE 0.78/0.30 0.86/0.86 0.89/0.66
Removing Affirmative ActionSubsidy High Subsidy Long Subsidy
GREEN workers 0.87/0.79 0.85/0.91 0.92/0.97PURPLE workers 0.85/0.52 0.86/0.50 0.86/0.56Firms paired with GREEN 0.85/0.80 0.89/0.87 0.89/0.90Firms paired with PURPLE 0.80/0.58 0.80/0.59 0.80/0.63
Table 7: Fraction of best-responses to reported beliefs/public histories
28

of participants’ actions are a best response to their reported beliefs.25 Participants best
respond to the public history at far lower rates, standing at 73% (6,483/8,880). This is
reasonable—since the public history includes the results from all previous rounds and does
not reset between stages, less sensitivity to the public history implies sensitivity to the
changing parameters/incentives of the experiment.
One might wonder whether participants “develop” taste-based discrimination throughout
our experiment. The patterns of best-responses suggest they do not. Indeed, firms that best
respond to their beliefs hire GREEN workers at significantly greater rates than PURPLE
workers. However, firms that do not best respond to their beliefs, whom one might suspect
to have developed discriminatory attitudes that go beyond the statistical, actually hire PUR-
PLE workers at comparable or higher rates (albeit, insignificantly so). Furthermore, firms’
beliefs regarding their paired workers’ investment conditional on hiring are less optimistic
for PURPLE workers. That is, firms do not appear to require a higher threshold of belief
for PURPLE workers.
While participants’ actions are consistent with their beliefs, actions are far coarser. The
evolution of beliefs throughout our sessions thus provides insight into the action choices we
observe. Figure 5 illustrates workers’ average beliefs across rounds and Figure 6 illustrates
firms’ average beliefs across rounds, along with the average public history that was visible
to participants on the experimental interface.
Reported beliefs reflect general trends of the public history, but differ in magnitudes and
slopes. In many cases, they are not co-monotonic. Relative to the public history, beliefs are
slightly less optimistic for GREEN workers and substantially more optimistic for PURPLE
workers. In particular, participants do not simply mirror the public history when reporting
beliefs.
Importantly, while we see a jump in beliefs pertaining to PURPLE workers’ investment
25This level is consistent, if somewhat higher, than other reported statistics of best responses, see e.g.Rey-Biel (2009) and references therein.
29
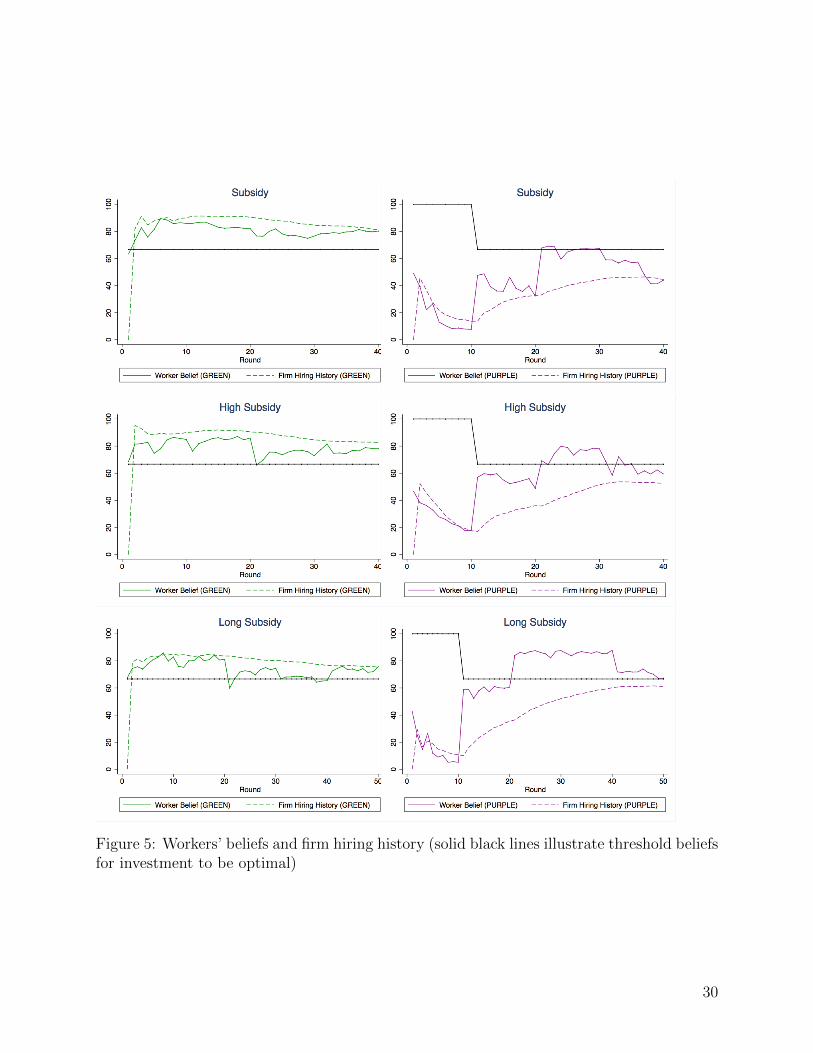
Figure 5: Workers’ beliefs and firm hiring history (solid black lines illustrate threshold beliefsfor investment to be optimal)
30

Figure 6: Firms’ beliefs and worker investment history (solid black lines illustrate thresholdbeliefs for hiring to be optimal)
31

after the seeding stage, beliefs remain fairly flat afterwards, with only slight increases during
the affirmative-action phase, which flattens out during the affirmative-action phase of our
Long Subsidy treatment. The level of beliefs is such that, absent subsidies, the decision to
hire is only marginally optimal in some cases, whereas it is clearly optimal when affirmative-
action incentives are in place.26
In contrast, beliefs regarding GREEN workers are slightly below those suggested by their
actual investment rates. Naturally, one needs to take with care any impression that beliefs
are pessimistic. Indeed, experimental investment rates by GREEN workers are rather high.
Therefore, any perturbations of those statistical rates that generate beliefs would generally
shift average assessments down. Regardless, beliefs are sufficiently high as to guarantee
hiring throughout the different experimental stages.
In the Online Appendix, we also show that participants generally hold well-calibrated
beliefs, tracking rather closely observed behavior. Nonetheless, in line with our description
above, when focusing on PURPLE workers and the firms they are paired with, we see
excessive optimism in the first, seeding stage. Firms and workers are overly pessimistic
when affirmative action is introduced, and then overly optimistic when it is lifted.
Finally, we note that affirmative action can work through two distinct channels in our
experiment. First, affirmative action can directly manipulate firms’ underlying beliefs about
the productivity of PURPLE workers. Second, even if firms’ beliefs are unchanged, firms
can still respond positively to the pecuniary incentive associated with affirmative action.
To decompose these two effects, we conduct a counterfactual exercise where we investigate
firms’ optimal hiring decisions given their beliefs while the policy is in place but in the absence
of the subsidy. When affirmative action lasts for only 10 rounds, we find that firms would
hire PURPLE workers in less than half of their interactions: 42% (92/220) in the Subsidy
treatment and 47% (98/210) in the High Subsidy treatment. In the Long Subsidy treatment,
26This could be an indication that participants are simply coordinating on the mixed-strategy equilibriumof the game in the baseline and final stages, which would be consistent with the reported beliefs. At theindividual level, however, behavior in these stages is inconsistent with that equilibrium (see Section 4.1).
32

however, firms would hire PURPLE workers in 67% (320/480) of their interactions. This
underscores our earlier points about the stickiness of firms’ beliefs and the limited efficacy of
a short duration of affirmative action. Given that firms’ beliefs are not responding sufficiently
in two of our three treatments to sustain hiring in the absence of a subsidy, it should come
as no surprise that discrimination reappears when the subsidy is lifted.
6 Discussion and Conclusion
In 1961, President John F. Kennedy first utilized the term affirmative action in its contem-
porary sense in Executive Order 10925. The intention was to have government contractors
“take affirmative action to ensure that applicants are employed, and employees are treated
during employment, without regard to their race, creed, color, or national origin.” Today,
affirmative action refers to the leading set of laws, policies, guidelines, and administrative
practices aimed at alleviating racial and gender-based discrimination. Our goal in this paper
is to use an array of lab experiments to assess the effects of affirmative-action policies in
combating statistical discrimination, while in place and after they are lifted.
Our results raise questions about the long-term effectiveness of affirmative-action policies.
To level the playing field, our findings suggest that affirmative-action policies need to be
activated for substantial periods of time. These implications relate to the empirical regularity
that affirmative-action policies tend to become entrenched, and left in place far longer than
initially intended, see Sowell (2004).
Any conclusion about the long-term effects of affirmative action should be qualified. We
have focused on affirmative action as an instrument for correcting statistical discrimination
in labor markets, but there are other sources of discrimination, and other environments in
which discrimination occurs. For instance, it is quite possible that exposing people to the
rich diversity of humankind may change their beliefs through various channels—role models,
exemplars, etc.—and thereby address taste-based discrimination.27 Even in our context,
27For instance, Miller (2017) illustrates some positive effects of temporary affirmative-action policies that
33

it might be that first-hand experience with minority employees who have invested in their
human capital would help change otherwise sticky beliefs. There is also a fairness argument
in favor of affirmative action—it serves as compensation for past discrimination. Affirmative
action in education does not only seek to change expectations, its objective includes granting
access to minority students who would not otherwise be able to attend good schools or to
obtain higher education (see the landmark study of Bowen and Bok (2016) for an elaborate
discussion of affirmative action in education). There are also possible dynamic benefits from
affirmative action. Even if affirmative action does not eliminate discrimination today, it may
help future generations of minorities access better opportunities. As in our experiments, the
fruits of affirmative action might simply take a long time to ripen.
he explains through employers improving their hiring practices.
34

References
Anderson, Donna M and Michael J Haupert. 1999. “Employment and Statistical Discrimination: A Hands-
On Experiment.” The Journal of Economics 25 (1):85–102.
Anderson, Lisa, Roland Fryer, and Charles Holt. 2006. “Discrimination: Experimental Evidence From
Psychology and Economics.” In Handbook on the Economics of Discrimination, edited by William M.
Rodgers. Edward Elgar Publishing Northampton, MA, 97–118.
Arrow, Kenneth J. 1971. “Some models of Racial Discrimination in the Labor Market.” Tech. Rep. RM-
6253-RC, RAND.
———. 1973. “The Theory of Discrimination.” In Discrimination in Labor Markets, edited by Orley
Ashenfelter and Albert Rees. Princeton University Press, 3–33.
———. 1998. “What Has Economics to Say About Racial Discrimination?” The Journal of Economic
Perspectives 12 (2):91–100.
Bleemer, Zachary. 2021. “Top Percent Policies and the Return to Postsecondary Selectivity.” Mimeo .
Bohren, Aislinn, Alex Imas, and Michael Rosenberg. 2019. “The Dynamics of Discrimination: Theory and
Evidence.” American economic review 109 (10):3395–3436.
Bowen, William G and Derek Bok. 2016. The shape of the river: Long-term consequences of considering
race in college and university admissions. Princeton University Press.
Bracha, Anat, Alma Cohen, and Lynn Conell-Price. 2019. “The Heterogeneous Effect of Affirmative Action
on Performance.” Journal of Economic Behavior & Organization 158:173–218.
Brandts, Jordi and David J Cooper. 2006. “A Change Would Do You Good.... An Experimental Study on
How to Overcome Coordination Failure in Organizations.” American Economic Review 96 (3):669–693.
Chen, Daniel L, Martin Schonger, and Chris Wickens. 2016. “oTree - An Open-Source Platform for Labo-
ratory, Online, and Field Experiments.” Journal of Behavioral and Experimental Finance 9:88–97.
Coate, Stephen and Glenn C Loury. 1993. “Will Affirmative-action Policies Eliminate Negative Stereotypes?”
American Economic Review 83 (5):1220–1240.
Dal Bo, Pedro and Guillaume R Frechette. 2011. “The Evolution of Cooperation in Infinitely Repeated
Games: Experimental Evidence.” American Economic Review 101 (1):411–29.
35

de Haan, Thomas, Theo Offerman, and Randolph Sloof. 2017. “Discrimination in the Labour Market: The
Curse of Competition between Workers.” The Economic Journal 127 (603):1433–1466.
Ewens, Michael, Bryan Tomlin, and Liang Choon Wang. 2014. “Statistical Discrimination or Prejudice? A
Large Sample Field Experiment.” Review of Economics and Statistics 96 (1):119–134.
Feltovich, Nick, Lata Gangadharan, and Michael P Kidd. 2013. “Implementation and Removal of an
Affirmative-Action Quota: The Impact on Task Assignment and Workers’ Skill Acquisition.” Canadian
Public Policy 39 (Supplement 1):S123–S140.
Fryer, Roland G, Jacob K Goeree, and Charles A Holt. 2005. “Experience-based Discrimination: Classroom
Games.” The Journal of Economic Education 36 (2):160–170.
Gillen, Ben, Erik Snowberg, and Leeat Yariv. 2019. “Experimenting with Measurement Error: Techniques
With Applications to The Caltech Cohort Study.” Journal of Political Economy 127 (4):1826–1863.
Glover, Dylan, Amanda Pallais, and William Pariente. 2017. “Discrimination as a Self-Fulfilling Prophecy:
Evidence from French Grocery Stores.” Quarterly Journal of Economics 132 (3):1219–1260.
Gneezy, Uri and Jan Potters. 1997. “An Experiment on Risk Taking and Evaluation Periods.” Quarterly
Journal of Economics 112 (2):631–645.
Hossain, Tanjim and Ryo Okui. 2013. “The Binarized Scoring Rule.” Review of Economic Studies 80 (3):984–
1001.
Ibragimov, Rustam and Ulrich K Muller. 2016. “Inference with Few Heterogeneous Clusters.” Review of
Economics and Statistics 98 (1):83–96.
Kapor, Adam. 2020. “Distributional Effects of Race-blind Affirmative Action.” Mimeo .
Karimi, Fariba, Mathieu Genois, Claudia Wagner, Philipp Singer, and Markus Strohmaier. 2018. “Homophily
Influences Ranking of Minorities in Social Networks.” Scientific reports 8 (1):1–12.
Kidd, Michael P, Paul S Carlin, and Jonathan Pot. 2008. “Experimenting with Affirmative Action: The
Coate and Loury Model.” Economic Record 84 (266):322–337.
Kneeland, Terri. 2015. “Identifying Higher-Order Rationality.” Econometrica 83 (5):2065–2079.
Krueger, Alan, Jesse Rothstein, and Sarah Turner. 2006. “Race, Income, and College in 25 Years: Evaluating
Justice O’Connor’s Conjecture.” American Law and Economics Review 8 (2):282–311.
36
Miller, Conrad. 2017. “The Persistent Effect of Temporary Affirmative Action.” American Economic Journal:
Applied Economics 9 (3):152–90.
Moffatt, Peter G. 2015. Experimetrics: Econometrics for Experimental Economics. Macmillan International
Higher Education.
Newman, Katherine. 2020. “Incentivizing Faculty Diversity.” Inside Higher Ed .
Niederle, Muriel, Carmit Segal, and Lise Vesterlund. 2013. “How Costly is Diversity? Affirmative Action in
Light of Gender Differences in Competitiveness.” Management Science 59 (1):1–16.
Phelps, Edmund S. 1972. “The Statistical Theory of Racism and Sexism.” American Economic Review
62 (4):659–661.
Rey-Biel, Pedro. 2009. “Equilibrium Play and Best Response to (Stated) Beliefs in Normal Form Games.”
Games and Economic Behavior 65 (2):572–585.
Romero, Julian. 2015. “The Effect of Hysteresis on Equilibrium Selection in Coordination Games.” Journal
of Economic Behavior & Organization 111:88–105.
Sander, Richard H. 2004. “A Systematic Analysis of Affirmative Action in Law Schools.” Stanford Law
Review 57:367–483.
Sander, Richard H. and Stuart Taylor. 2012. Mismatch: How Affirmative Action Hurts Students It’s Intended
to Help, and Why Universities Won’t Admit It. Basic Books.
Sowell, Thomas. 2004. Affirmative Action Around the World: An Empirical Study. Yale University Press.
37