Introduction to the Statistical Analysis of the Clinical Trials.
Statistical challenges in immunotherapy trials
European Organization for Research and Treatment of Cancer’sPerspectives
Michal Kicinski, PhD
Nathan Touati, MS
Cancer Immunotherapy
2
Major focus area for cancer treatment
Growing excitement about these agents the past few years
Immunotherapies targeting the immune systemvs
Chemotherapy and targeted therapies targeting directly the tumor
The immune and anti-tumor response to immunotherapies is dynamic
Innovative mechanism of action poses challenges for the classical methodology for trial design and analysis
Challenges are both clinical and statistical
New challenges – Response assessment (iRECIST)
3
Response assessment by RECIST criteria is globally accepted
Issue with immunotherapy: other response patterns have been observed, leading to PD diagnosis and therefore discontinuation of experimental treatment
Alternatives:
2009: immune-related response criteria (irRC) based on WHO criteria
2017: Newly proposed consensus-based guidelines: iRECIST
Source: Seymour 2017, “iRECIST: guidelines for response criteria for use in trials testing immunotherapeutics”, Lancet Oncol
New challenges – Response assessment (iRECIST)
4
Recommendations:
- Phase 3 trials: incorporate both RECIST 1.1 and iRECIST
But RECIST 1.1 should continue to be used to define the primary efficacy outcomes (when PFS, disease progression, BOR…)
- Early-phase trials: can consider using iRECIST as primary criteria
Next step:
- Validation of the efficacy of iRECIST with the creation and analysis of a warehouse of data from immunotherapeutic trials
New challenges – Safety & Endpoint
5
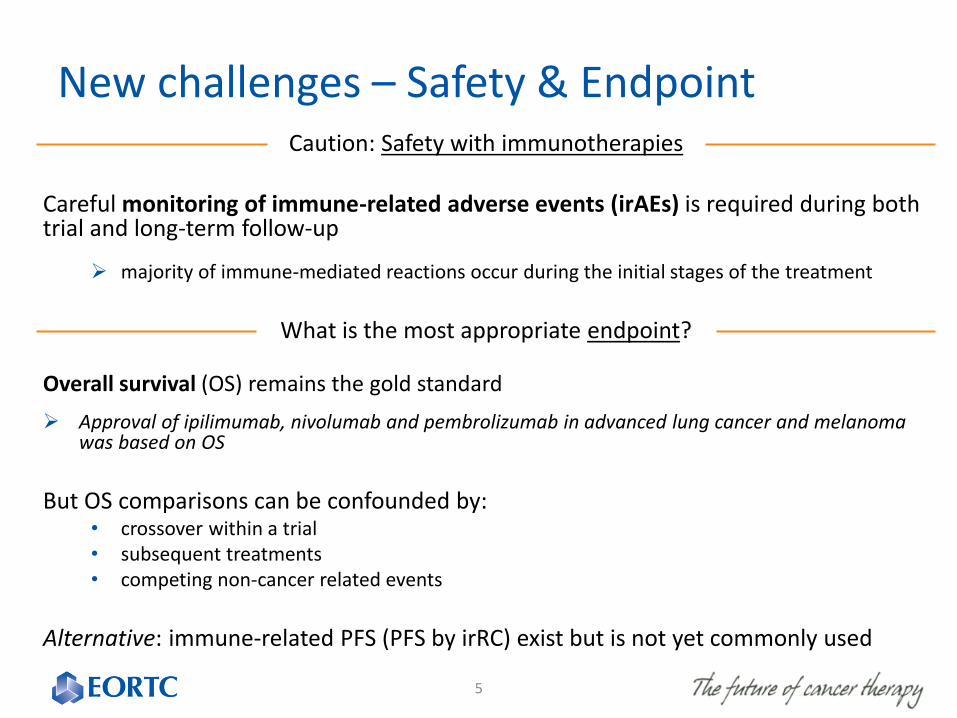
Caution: Safety with immunotherapies
Careful monitoring of immune-related adverse events (irAEs) is required during both trial and long-term follow-up
majority of immune-mediated reactions occur during the initial stages of the treatment
What is the most appropriate endpoint?
Overall survival (OS) remains the gold standard
Approval of ipilimumab, nivolumab and pembrolizumab in advanced lung cancer and melanoma was based on OS
But OS comparisons can be confounded by:• crossover within a trial• subsequent treatments• competing non-cancer related events
Alternative: immune-related PFS (PFS by irRC) exist but is not yet commonly used
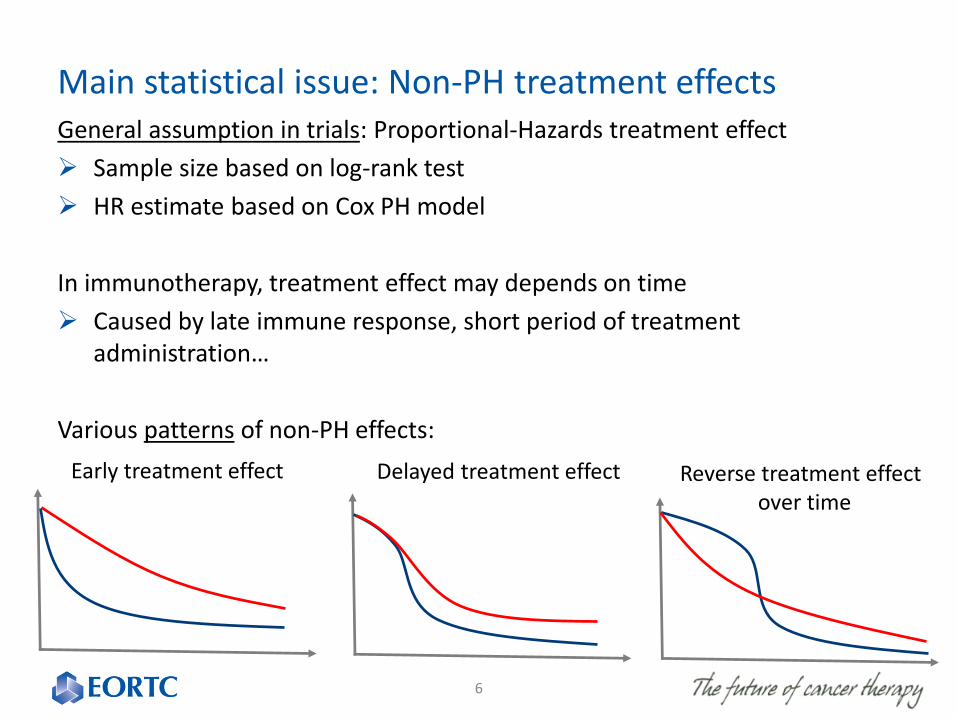
Main statistical issue: Non-PH treatment effectsGeneral assumption in trials: Proportional-Hazards treatment effect
Sample size based on log-rank test
HR estimate based on Cox PH model
In immunotherapy, treatment effect may depends on time
Caused by late immune response, short period of treatment administration…
Various patterns of non-PH effects:
6
Early treatment effect Delayed treatment effect Reverse treatment effect over time
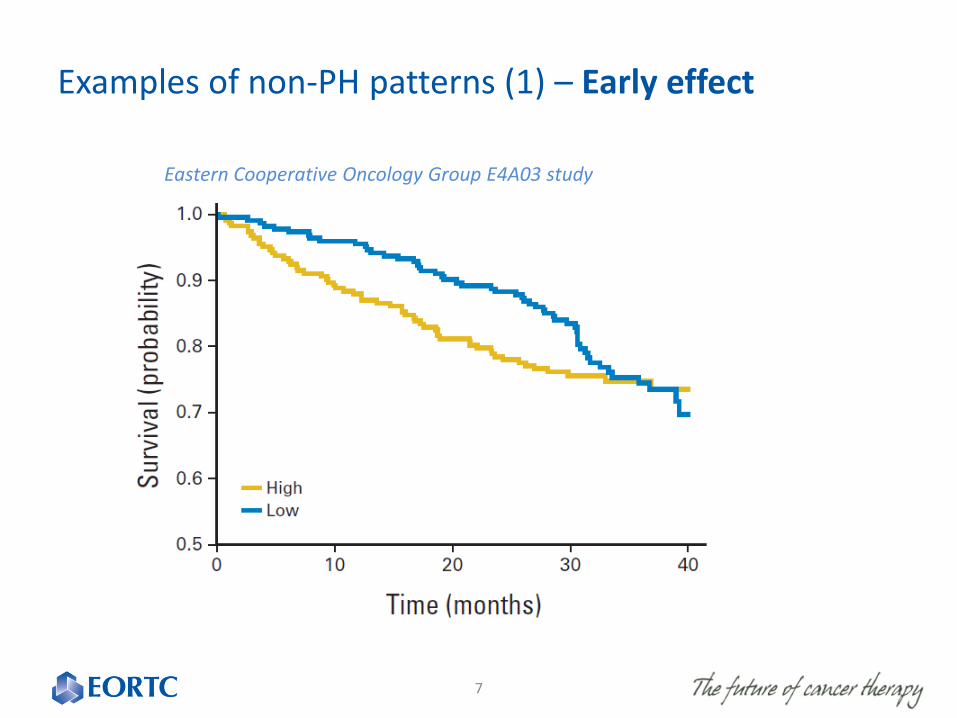
Examples of non-PH patterns (1) – Early effect
Eastern Cooperative Oncology Group E4A03 study
7
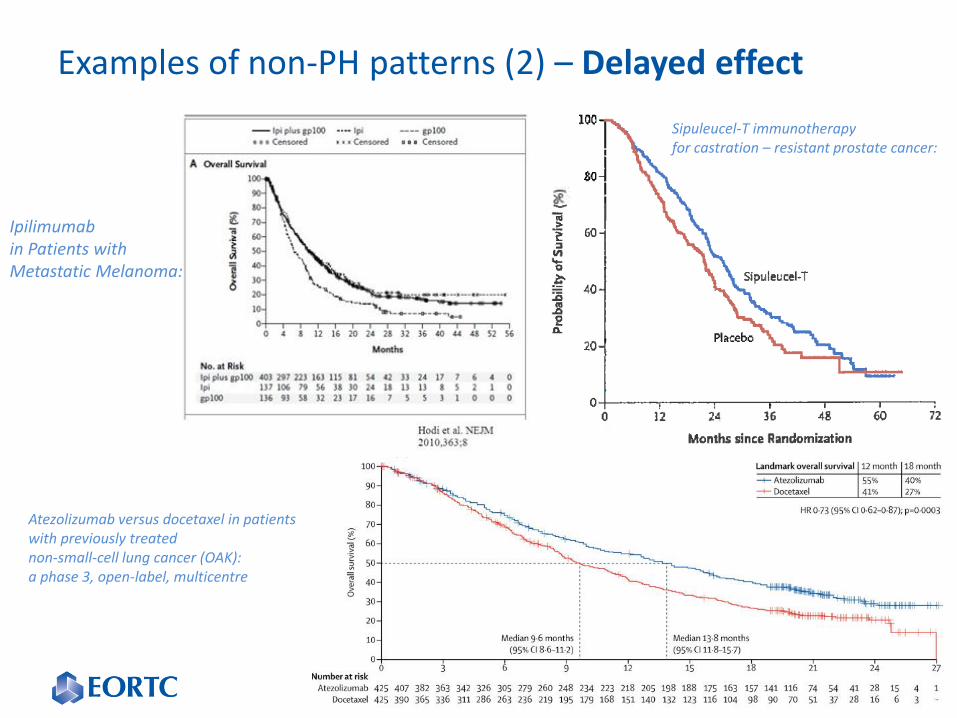
Examples of non-PH patterns (2) – Delayed effect
8
Sipuleucel-T immunotherapy for castration – resistant prostate cancer:
Ipilimumab in Patients with Metastatic Melanoma:
Atezolizumab versus docetaxel in patients with previously treated non-small-cell lung cancer (OAK): a phase 3, open-label, multicentre
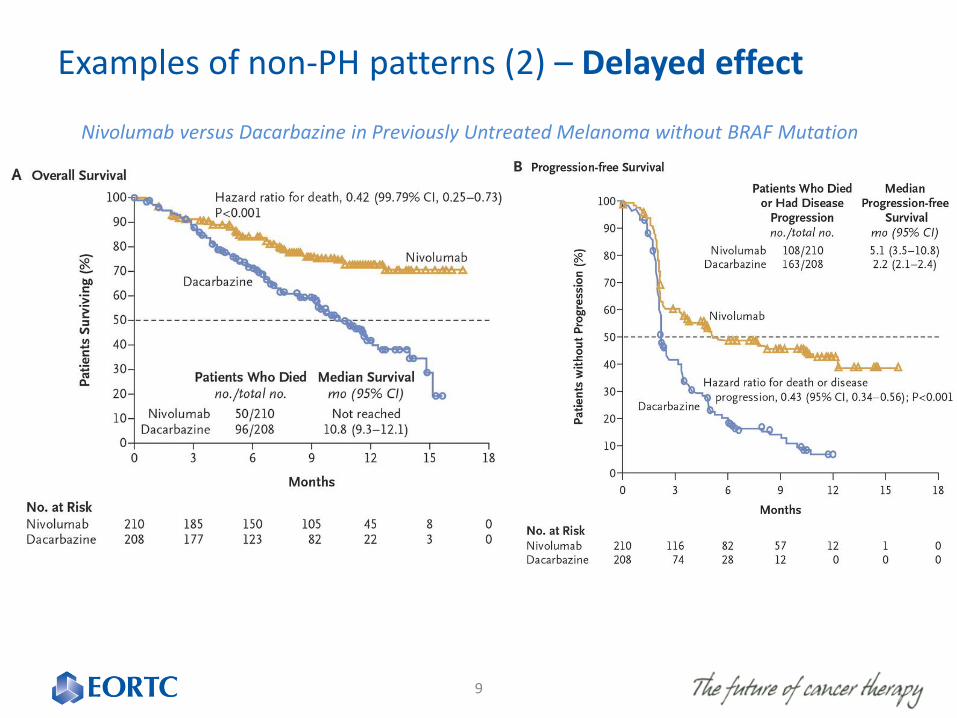
Examples of non-PH patterns (2) – Delayed effect
9
Nivolumab versus Dacarbazine in Previously Untreated Melanoma without BRAF Mutation
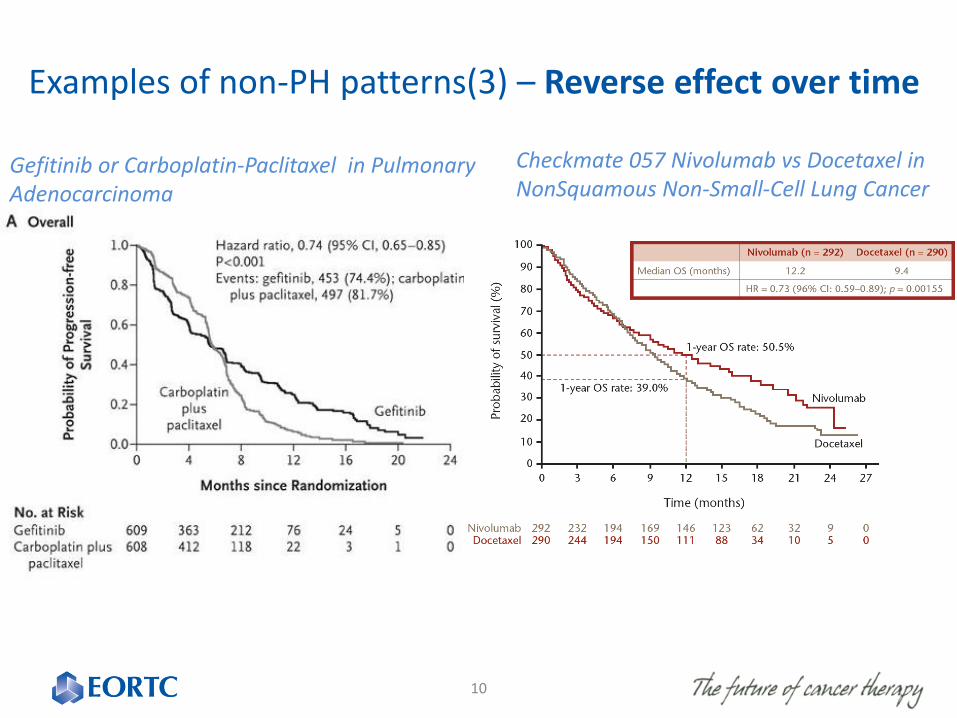
Examples of non-PH patterns(3) – Reverse effect over time
Gefitinib or Carboplatin-Paclitaxel in Pulmonary Adenocarcinoma
10
Checkmate 057 Nivolumab vs Docetaxel in NonSquamous Non-Small-Cell Lung Cancer
Log-rank test
• The most powerful non-parametric test to compare survival functions under PH
• Equivalent to the score test for HR from the Cox model: test-estimation coherency
11
If non-PH
• Log-rank test may not be the most powerful non-parametric test
• The interpretation of the corresponding treatment effect (HR) complicated
• Is not a simple average of the hazard ratios over time
• HR depends on the censoring distribution, which is study-specific
12
Wish list
• Proper control of type I error probability
• Substantial power gain compared to the standard practice when hazards non-proportional
• Limited power loss when hazards proportional
• Test-estimation coherency
• Simple and meaningful interpretation
• Possibility to condition on stratification factors
13
What else if not HR
• Median survival time (or other percentile)
• Survival time at certain time point
• Restricted mean survival time
14
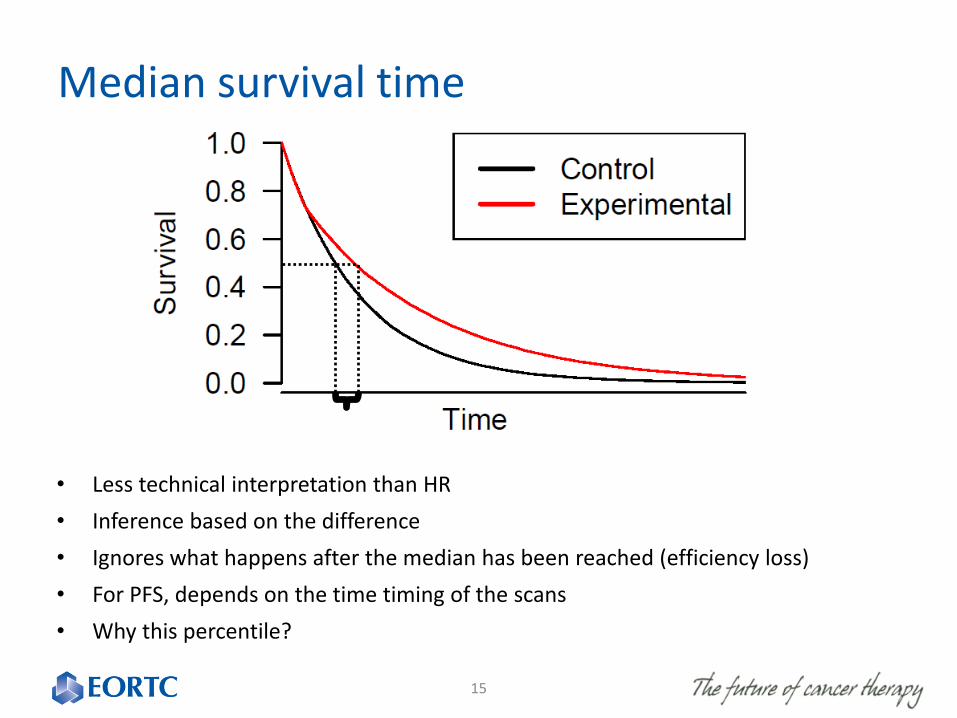
Median survival time
• Less technical interpretation than HR
• Inference based on the difference
• Ignores what happens after the median has been reached (efficiency loss)
• For PFS, depends on the time timing of the scans
• Why this percentile?
15
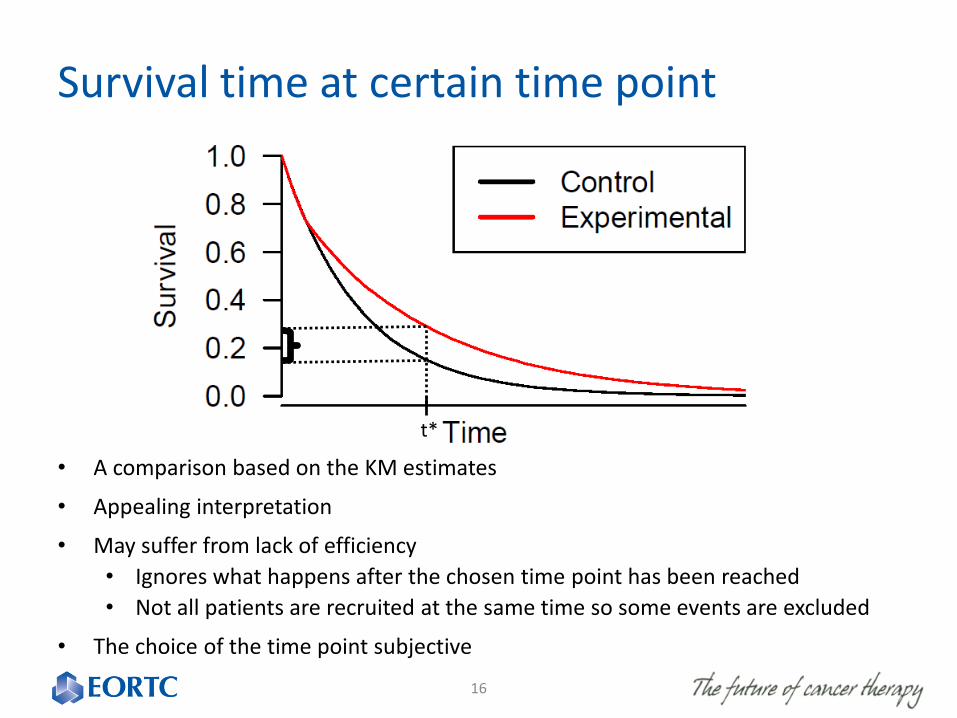
Survival time at certain time point
• A comparison based on the KM estimates
• Appealing interpretation
• May suffer from lack of efficiency
• Ignores what happens after the chosen time point has been reached
• Not all patients are recruited at the same time so some events are excluded
• The choice of the time point subjective
16
t*
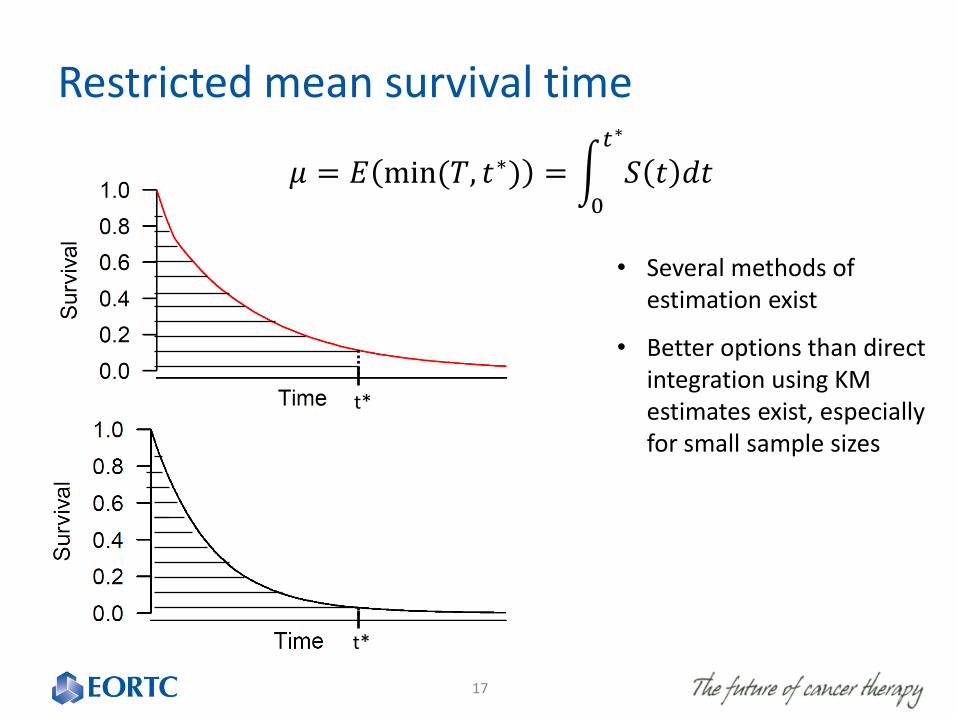
Restricted mean survival time
𝜇 = 𝐸 min(𝑇, 𝑡∗) = න0
𝑡∗
𝑆 𝑡 𝑑𝑡
17
t*
t*
• Several methods of estimation exist
• Better options than direct integration using KM estimates exist, especially for small sample sizes
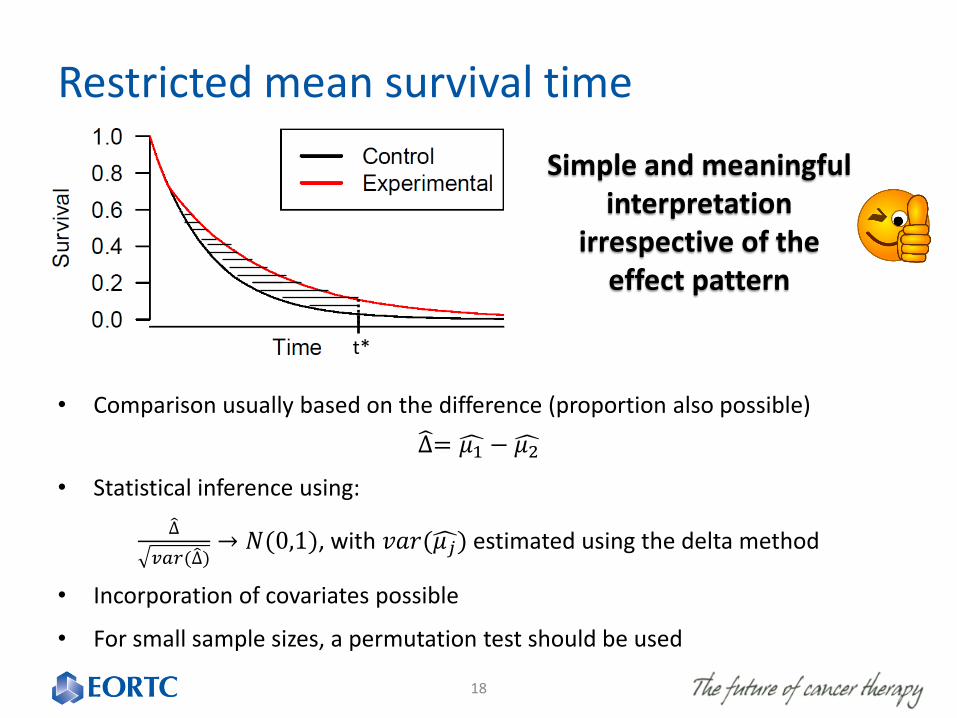
Restricted mean survival time
• Comparison usually based on the difference (proportion also possible)
∆= ෞ𝜇1 − ෞ𝜇2
• Statistical inference using:
∆
𝑣𝑎𝑟(∆)→ 𝑁(0,1), with 𝑣𝑎𝑟(ෞ𝜇𝑗) estimated using the delta method
• Incorporation of covariates possible
• For small sample sizes, a permutation test should be used
18
t*
Simple and meaningful interpretation
irrespective of the effect pattern
Other alternatives to the log-rank test
• Other tests based on event rates
• Kaplan-Meier test statistics
• Adaptive tests based on restricted mean survival time
• Combinations of two approaches
19
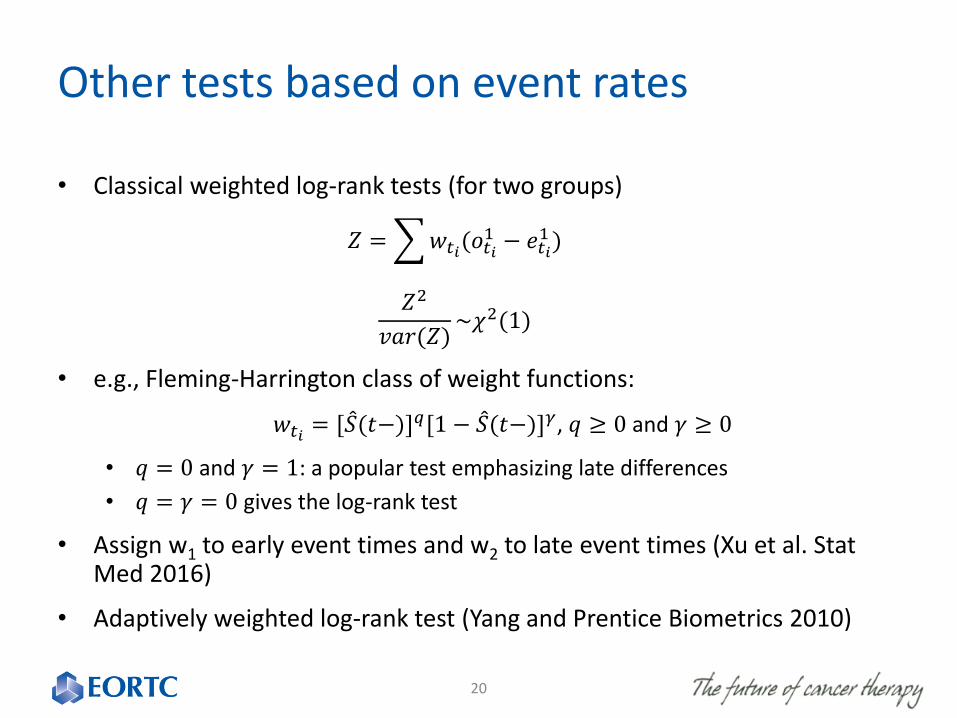
Other tests based on event rates
• Classical weighted log-rank tests (for two groups)
𝑍 =𝑤𝑡𝑖(𝑜𝑡𝑖1 − 𝑒𝑡𝑖
1 )
𝑍2
𝑣𝑎𝑟(𝑍)~𝜒2(1)
• e.g., Fleming-Harrington class of weight functions:
𝑤𝑡𝑖= [ መ𝑆(𝑡−)]𝑞[1 − መ𝑆(𝑡−)]𝛾, 𝑞 ≥ 0 and 𝛾 ≥ 0
• 𝑞 = 0 and 𝛾 = 1: a popular test emphasizing late differences
• 𝑞 = 𝛾 = 0 gives the log-rank test
• Assign w1 to early event times and w2 to late event times (Xu et al. Stat Med 2016)
• Adaptively weighted log-rank test (Yang and Prentice Biometrics 2010)
20
Kaplan-Meier test statistics
• Test statistics based on a weighted average of the difference between the KM survival estimates at different time points
• Higher weight given to time points with bigger differences and larger number of patients at risk
• Several approaches to estimate the weights have been proposed (Shen and Cai Biometrics 2001; Uno et al. Stat Med 2015)
21
Combinations of two approaches
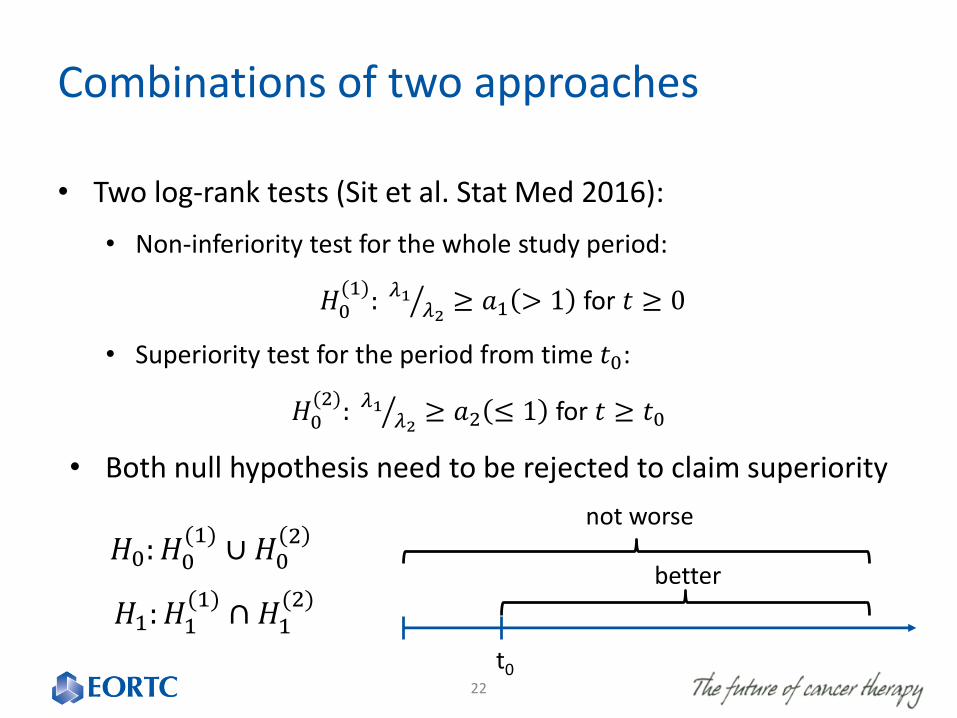
• Two log-rank tests (Sit et al. Stat Med 2016):
• Non-inferiority test for the whole study period:
𝐻0(1): ൗ𝜆1
𝜆2≥ 𝑎1 > 1 for 𝑡 ≥ 0
• Superiority test for the period from time 𝑡0:
𝐻0(2): ൗ𝜆1
𝜆2≥ 𝑎2 ≤ 1 for 𝑡 ≥ 𝑡0
• Both null hypothesis need to be rejected to claim superiority
22
t0
𝐻0: 𝐻0(1)
∪ 𝐻02
𝐻1: 𝐻1(1)
∩ 𝐻1(2)
not worse
better
Combinations of two approaches
• A two-stage procedure of Qiu and Sheng (Statist Soc B 2008)
• Stage I: log-rank test
• Stage II (only in case stage I does not reject H0): a test to distinguish cases when the hazard rates are identical and cross each other
• Test in stage II independent of the log-rank test, so no correction for multiplicity needed
23
Combinations of two approaches
• Augmented log-rank test (Royston and Parmar BMC Med Res Meth 2016)
• Calculate log-rank test p-value pL-R
• Calculate the p-value of the permutation test for RMST pRMST
• Take the minimum pmin=min(pL-R, pRMST)
• Compare pmin to the empirical distribution of Pmin under H0
24
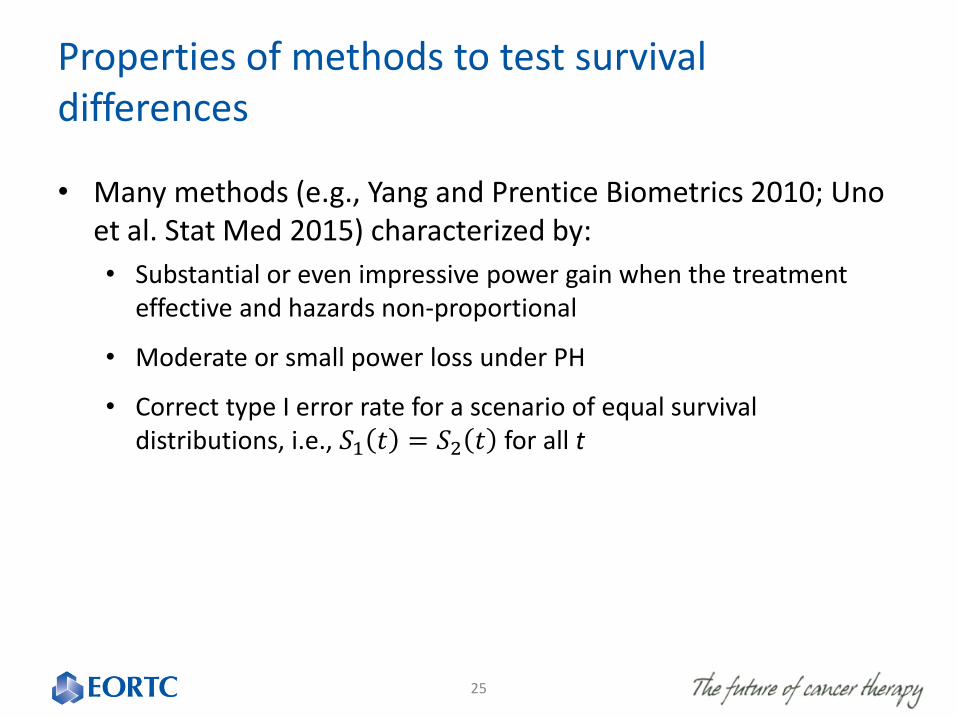
Properties of methods to test survival differences
• Many methods (e.g., Yang and Prentice Biometrics 2010; Uno et al. Stat Med 2015) characterized by:
• Substantial or even impressive power gain when the treatment effective and hazards non-proportional
• Moderate or small power loss under PH
• Correct type I error rate for a scenario of equal survival distributions, i.e., 𝑆1 𝑡 = 𝑆2 𝑡 for all t
25
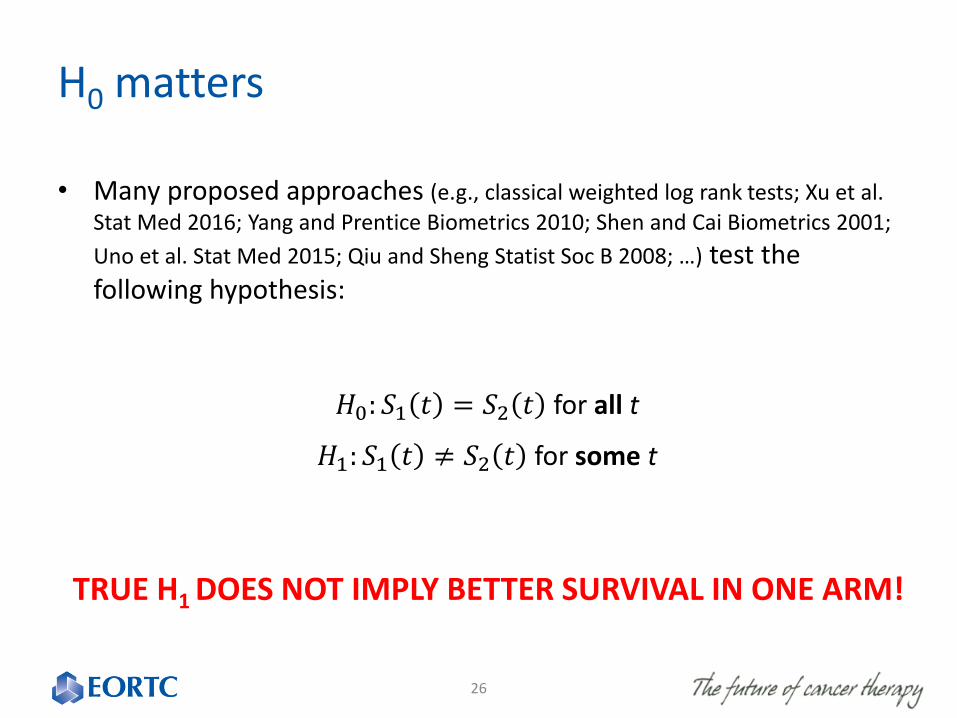
H0 matters
• Many proposed approaches (e.g., classical weighted log rank tests; Xu et al.
Stat Med 2016; Yang and Prentice Biometrics 2010; Shen and Cai Biometrics 2001;
Uno et al. Stat Med 2015; Qiu and Sheng Statist Soc B 2008; …) test the following hypothesis:
26
𝐻0: 𝑆1 𝑡 = 𝑆2 𝑡 for all t
𝐻1: 𝑆1 𝑡 ≠ 𝑆2 𝑡 for some t
TRUE H1 DOES NOT IMPLY BETTER SURVIVAL IN ONE ARM!
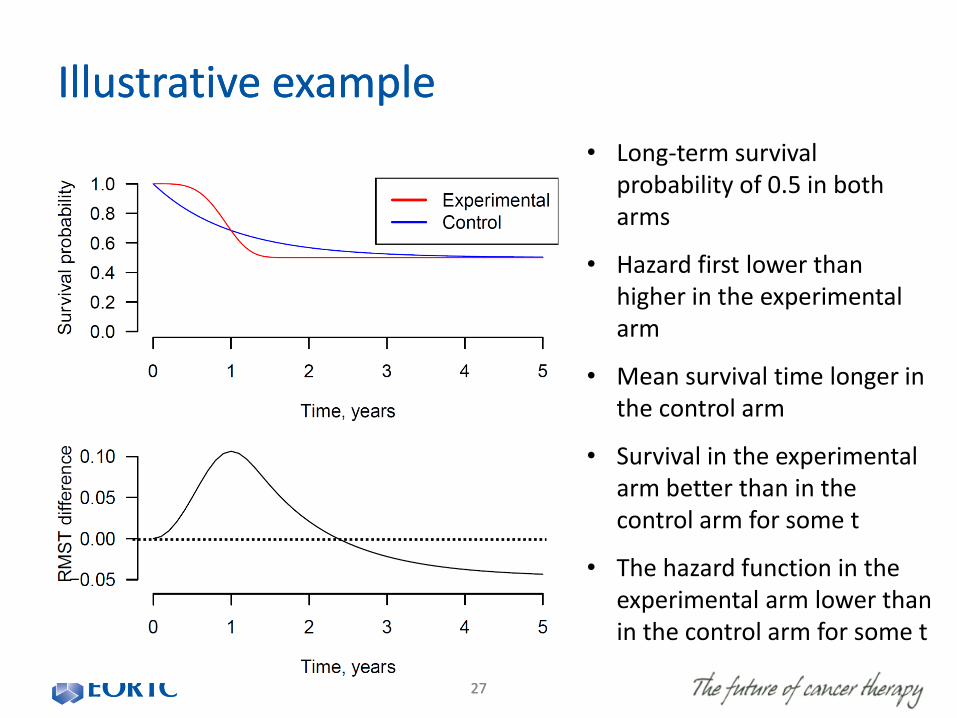
Illustrative example
27
Illustrative example
27
• Long-term survival probability of 0.5 in both arms
• Hazard first lower than higher in the experimental arm
• Mean survival time longer in the control arm
• Survival in the experimental arm better than in the control arm for some t
• The hazard function in the experimental arm lower than in the control arm for some t
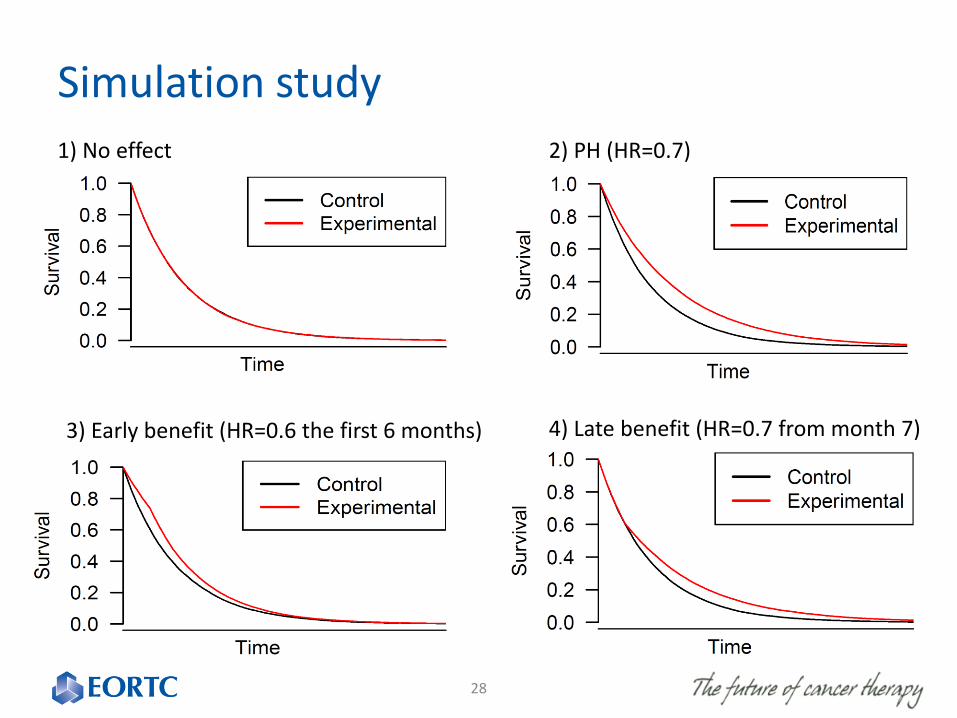
Simulation study
28
1) No effect 2) PH (HR=0.7)
3) Early benefit (HR=0.6 the first 6 months) 4) Late benefit (HR=0.7 from month 7)
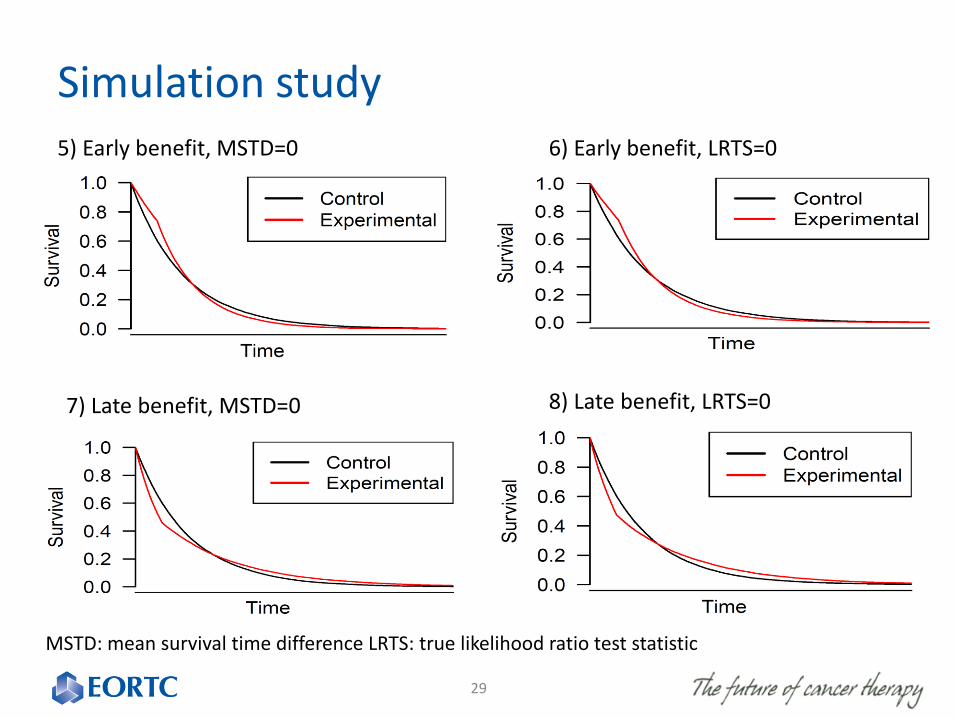
Simulation study
29
5) Early benefit, MSTD=0 6) Early benefit, LRTS=0
7) Late benefit, MSTD=0 8) Late benefit, LRTS=0
MSTD: mean survival time difference LRTS: true likelihood ratio test statistic
Simulation results
30
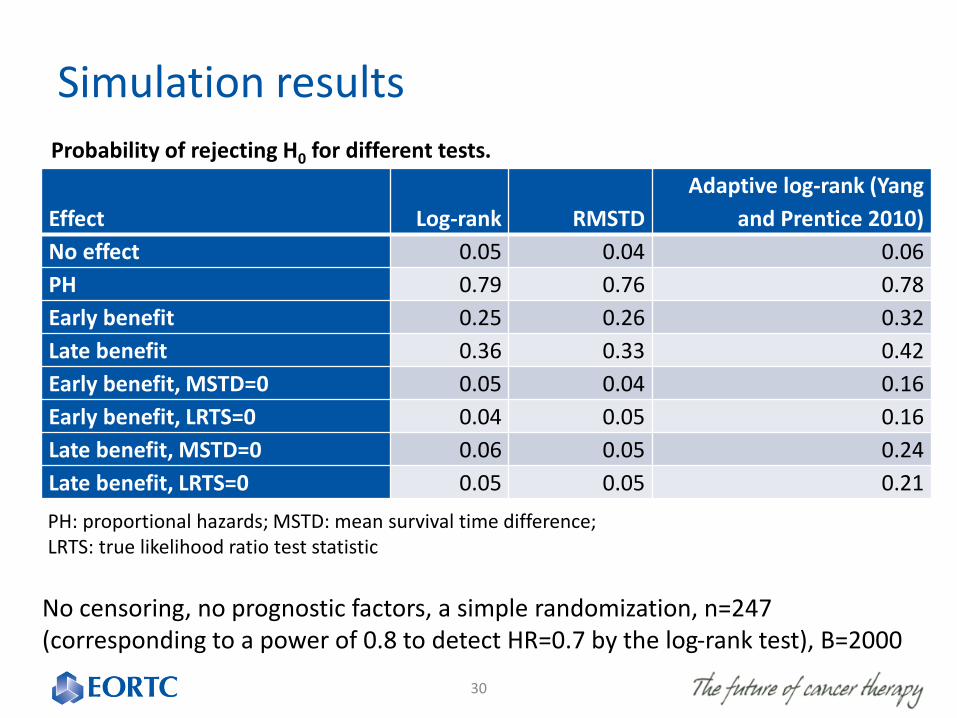
Effect Log-rank RMSTD
Adaptive log-rank (Yang
and Prentice 2010)
No effect 0.05 0.04 0.06
PH 0.79 0.76 0.78
Early benefit 0.25 0.26 0.32
Late benefit 0.36 0.33 0.42
Early benefit, MSTD=0 0.05 0.04 0.16
Early benefit, LRTS=0 0.04 0.05 0.16
Late benefit, MSTD=0 0.06 0.05 0.24
Late benefit, LRTS=0 0.05 0.05 0.21
PH: proportional hazards; MSTD: mean survival time difference;LRTS: true likelihood ratio test statistic
Probability of rejecting H0 for different tests.
No censoring, no prognostic factors, a simple randomization, n=247 (corresponding to a power of 0.8 to detect HR=0.7 by the log-rank test), B=2000
Simulation results
• The adaptively weighted log-rank test frequently rejects H0
when there is no overall survival benefit in terms of the mean survival time or the event rate averaged over the whole follow-up
• A significant power gain related to the use of a test based on RMSTD compared to the log-rank test when the hazards are non-proportional not evident at all for the considered scenario
31
Conclusions – testing procedure choice (1)
• When non-PH
• The interpretation of the HR complicated
• Log-rank test may not be the most powerful test
• The impressive power gain of some approaches comes with a cost of testing a wrong H0 (be careful!)
• For methods based on the correct H0, power gain (if any!) compared to the log-rank test under non-PH may be small
32
Conclusions – testing procedure choice (2)
• Restricted mean survival time difference is an attractive alternative to HR when hazards are likely non-proportional
• Proper control of type I error probability
• Test-estimation coherency
• Simple and meaningful interpretation
• Possibility to condition on stratification factors
• Some power gain for some scenarios
33
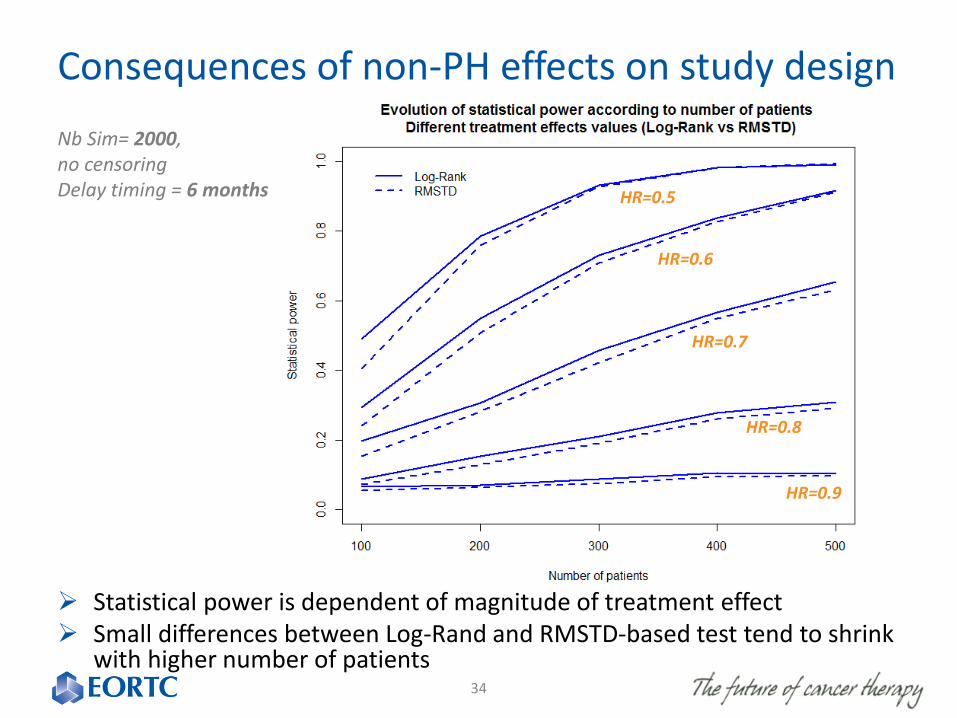
Consequences of non-PH effects on study design
34
HR=0.5
HR=0.6
HR=0.7
HR=0.8
HR=0.9
Nb Sim= 2000, no censoringDelay timing = 6 months
Statistical power is dependent of magnitude of treatment effect Small differences between Log-Rand and RMSTD-based test tend to shrink
with higher number of patients
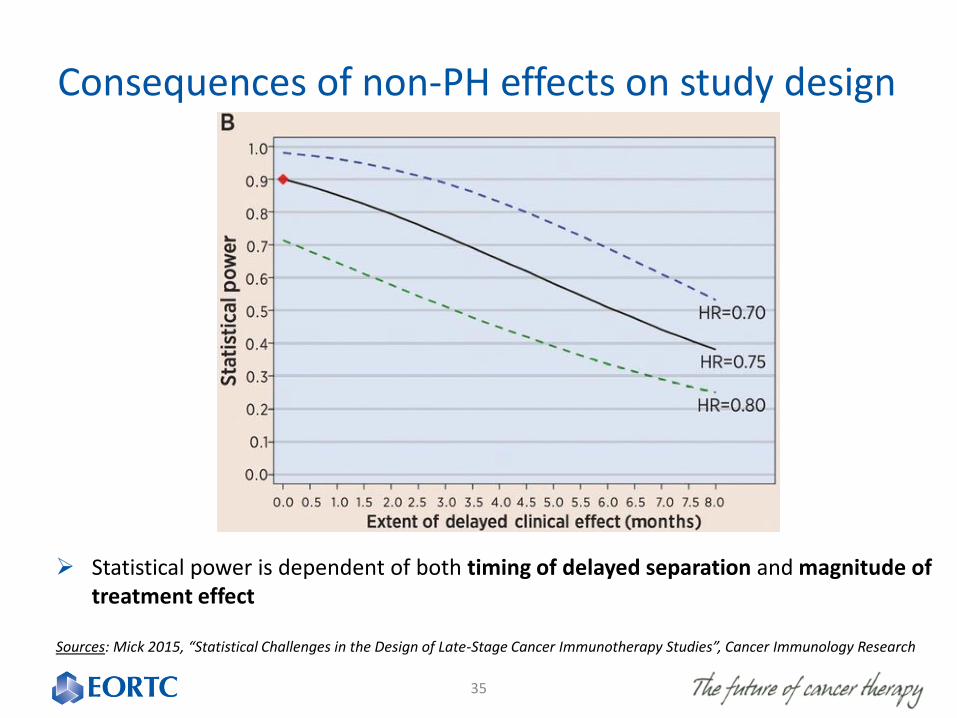
Consequences of non-PH effects on study design
35
Statistical power is dependent of both timing of delayed separation and magnitude of treatment effect
Sources: Mick 2015, “Statistical Challenges in the Design of Late-Stage Cancer Immunotherapy Studies”, Cancer Immunology Research
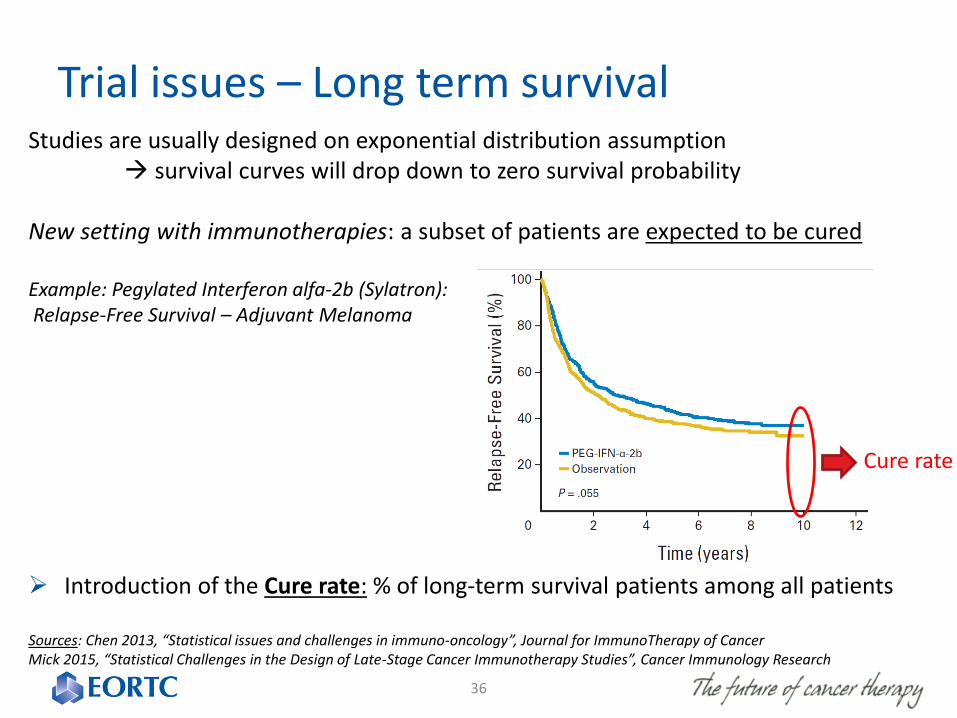
Trial issues – Long term survival
36
Studies are usually designed on exponential distribution assumption survival curves will drop down to zero survival probability
New setting with immunotherapies: a subset of patients are expected to be cured
Example: Pegylated Interferon alfa-2b (Sylatron):Relapse-Free Survival – Adjuvant Melanoma
Introduction of the Cure rate: % of long-term survival patients among all patients
Sources: Chen 2013, “Statistical issues and challenges in immuno-oncology”, Journal for ImmunoTherapy of CancerMick 2015, “Statistical Challenges in the Design of Late-Stage Cancer Immunotherapy Studies”, Cancer Immunology Research
Cure rate
Consequences of long-term survival
37
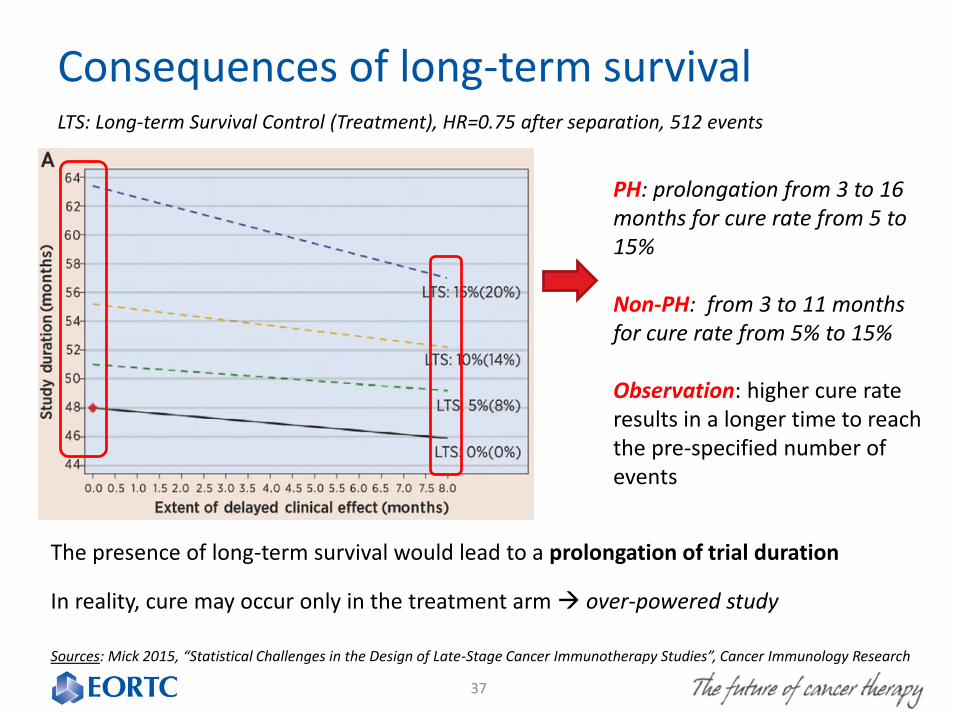
LTS: Long-term Survival Control (Treatment), HR=0.75 after separation, 512 events
The presence of long-term survival would lead to a prolongation of trial duration
In reality, cure may occur only in the treatment arm over-powered study
Sources: Mick 2015, “Statistical Challenges in the Design of Late-Stage Cancer Immunotherapy Studies”, Cancer Immunology Research
PH: prolongation from 3 to 16 months for cure rate from 5 to 15%
Non-PH: from 3 to 11 months for cure rate from 5% to 15%
Observation: higher cure rate results in a longer time to reach the pre-specified number of events
Interim analysis – Impact of non-PH/LT data
38
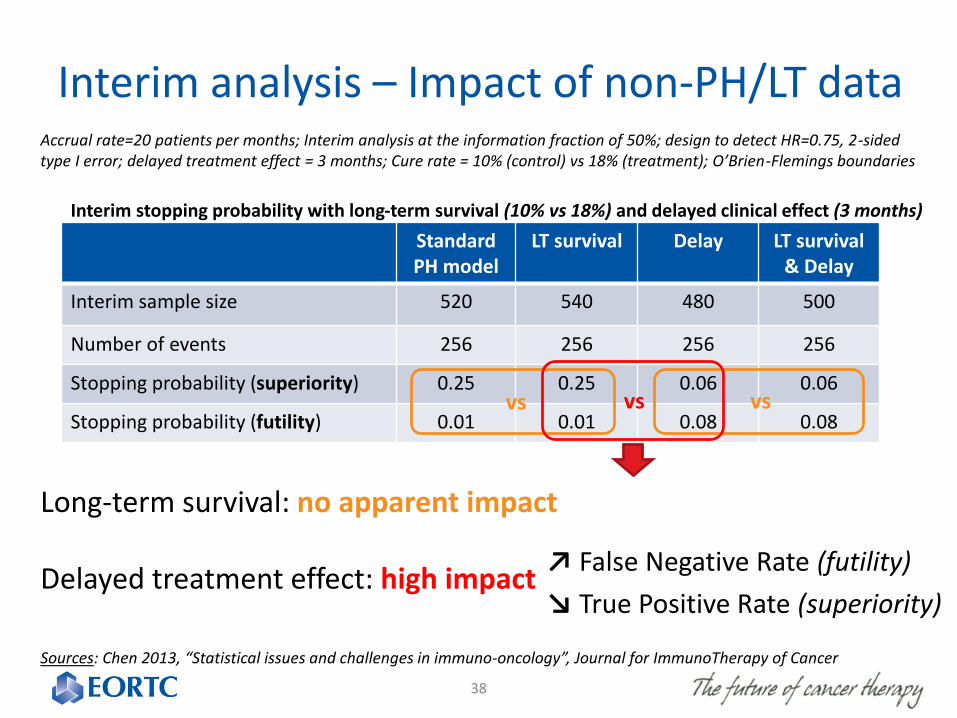
Long-term survival: no apparent impact
Delayed treatment effect: high impact
Sources: Chen 2013, “Statistical issues and challenges in immuno-oncology”, Journal for ImmunoTherapy of Cancer
Accrual rate=20 patients per months; Interim analysis at the information fraction of 50%; design to detect HR=0.75, 2-sided type I error; delayed treatment effect = 3 months; Cure rate = 10% (control) vs 18% (treatment); O’Brien-Flemings boundaries
↗ False Negative Rate (futility)
↘ True Positive Rate (superiority)
StandardPH model
LT survival Delay LT survival & Delay
Interim sample size 520 540 480 500
Number of events 256 256 256 256
Stopping probability (superiority) 0.25 0.25 0.06 0.06
Stopping probability (futility) 0.01 0.01 0.08 0.08vs vsvs
Interim stopping probability with long-term survival (10% vs 18%) and delayed clinical effect (3 months)
Interim analysis - Warning
39
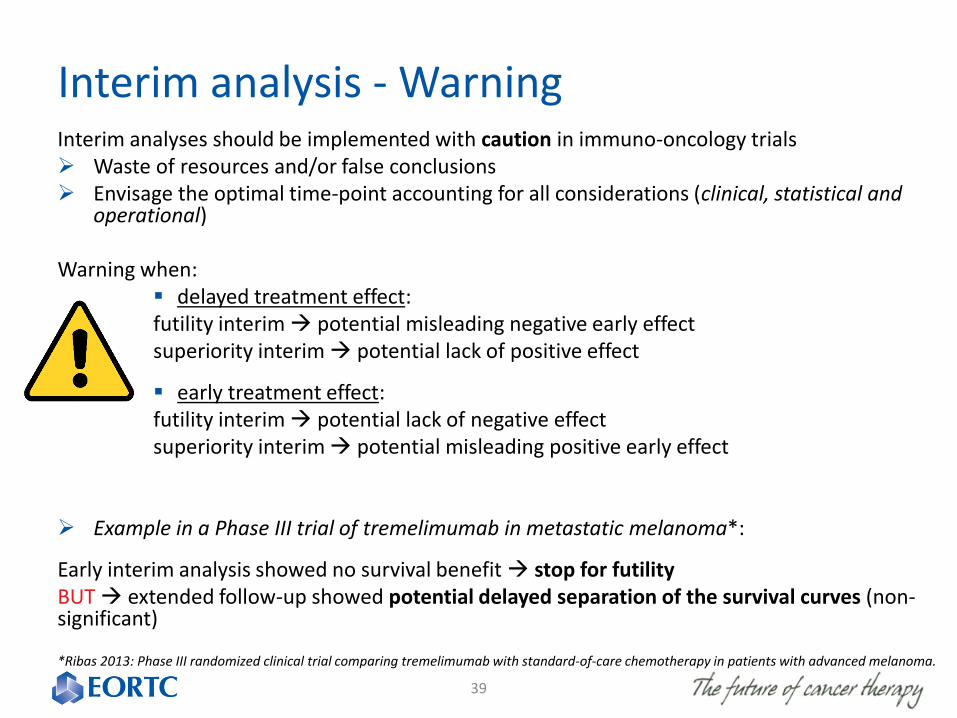
Interim analyses should be implemented with caution in immuno-oncology trials Waste of resources and/or false conclusions Envisage the optimal time-point accounting for all considerations (clinical, statistical and
operational)
Warning when: delayed treatment effect:futility interim potential misleading negative early effectsuperiority interim potential lack of positive effect
early treatment effect:futility interim potential lack of negative effectsuperiority interim potential misleading positive early effect
Example in a Phase III trial of tremelimumab in metastatic melanoma*:
Early interim analysis showed no survival benefit stop for futilityBUT extended follow-up showed potential delayed separation of the survival curves (non-significant)
*Ribas 2013: Phase III randomized clinical trial comparing tremelimumab with standard-of-care chemotherapy in patients with advanced melanoma.
Conclusions – trial design
• Statistical power is dependent of both magnitude and timing of the delayed treatment effect
• Very small differences in power between Log-Rank and RMSTD when modifying the non-PH parameters
• Long-term survival leads to a prolongation of trial duration
• Careful approach of interim analyses (timing, necessity)
• Potential misleading conclusions for:
• Futility interim analysis when delayed treatment effect
• Superiority interim analysis when early treatment effect
40
References
41
Chen 2013, “Statistical issues and challenges in immuno-oncology”, Journal for ImmunoTherapyof Cancer
Hoering 2017, “End points and statistical considerations in immuno-oncology trials: impact on multiple myeloma”, Future Oncol.
Menis 2016, “The European Organization for Research and Treatment of Cancer perspective on designing clinical trials with immune therapeutics”, Annals of Translational Medicine
Mick 2015, “Statistical Challenges in the Design of Late-Stage Cancer Immunotherapy Studies”, Cancer Immunology Research
Royston 2016,“Augmenting the logrank test in the design of clinical trials in which non-proportional hazards of the treatment effect may be anticipated” BMC Medical Research methodology
Seymour 2017, “iRECIST: guidelines for response criteria for use in trials testing immunotherapeutics”, Lancet Oncol
Sit 2016, “Design and analysis of clinical trials in the presence of delayed treatment effect.”, Statistics in Medicine
Xu 2016, “Designing therapeutic cancer vaccine trials with delayed treatment effect” Statistics in Medicine
Yang 2010, “Improved Logrank-Type Tests for Survival Data Using Adaptive Weights”, Biometrics

42