Statistical challenges from the analysis of NGS-Metagenomics
44
Metagenomics Estimation of abundance Repeatability and Comparative Metagenomics Binning/Classification Statistical challenges from the analysis of NGS-Metagenomics experiments Jean-Jacques Daudin & Sébastien Li-Thiao-Té & Emilie Lebarbier UMR AgroParisTech-INRA ANR Project Computational Biology for Metagenomics Experiments (CBME) NGS, 24 mars 2010 J.J. Daudin & S Li-Thiao-Té & E Lebarbier Statistical methods for NGS-Metagenomics Experiments
Transcript of Statistical challenges from the analysis of NGS-Metagenomics

MetagenomicsEstimation of abundance
Repeatability and Comparative MetagenomicsBinning/Classification
Statistical challenges from the analysis ofNGS-Metagenomics experiments
Jean-Jacques Daudin & Sébastien Li-Thiao-Té & EmilieLebarbier
UMR AgroParisTech-INRAANR Project Computational Biology for Metagenomics
Experiments (CBME)
NGS, 24 mars 2010
J.J. Daudin & S Li-Thiao-Té & E Lebarbier Statistical methods for NGS-Metagenomics Experiments

MetagenomicsEstimation of abundance
Repeatability and Comparative MetagenomicsBinning/Classification
Outline
1 Metagenomics
2 Estimation of abundance
3 Repeatability and Comparative Metagenomics
4 Binning/Classification
J.J. Daudin & S Li-Thiao-Té & E Lebarbier Statistical methods for NGS-Metagenomics Experiments

MetagenomicsEstimation of abundance
Repeatability and Comparative MetagenomicsBinning/Classification
Life on Earth (from Wooley et al. PLOS 2010)
5.1030 prokariotic cells: largest reservoir on Earth,350−550.1015g Carbon, 85−130.1015g Nitrogen, 9−14.1015gPhosphorous.
More bacterial cells in one human body (1014) than our owncells (1013)
Bacteria, Archaea and microeukariotes dominate Earth’shabitats
Only a small percentage of microbes can be cultured andsequenced as a sole organism
Species interact between them in their habitat in real life
Metagenomics: obtain genomic information directly frommicrobial communities in their natural habitats
J.J. Daudin & S Li-Thiao-Té & E Lebarbier Statistical methods for NGS-Metagenomics Experiments

MetagenomicsEstimation of abundance
Repeatability and Comparative MetagenomicsBinning/Classification
What is Metagenomics?
Genomic study of unculturedmicroorganisms sampledfrom their habitats
(A) Sampling from habitat(B) filtering particles(C) DNA extraction and lysis(D) cloning and library(E) sequence the clones(F) sequence assembly.
Figure from A Primer on Metagenomics John C. Wooley
et al. Plos Computational Biology 2010
J.J. Daudin & S Li-Thiao-Té & E Lebarbier Statistical methods for NGS-Metagenomics Experiments

MetagenomicsEstimation of abundance
Repeatability and Comparative MetagenomicsBinning/Classification
Applications
Sequence the genome of all the life on earth (soil, sea, air, life)
Discovery of new genes, enzymes, functions → fine chemicals,agrochemicals and pharmaceuticals
Monitoring the impact of pollutants on ecosystems and forcleaning up contaminated environments.
Human Microbiome: understand the changes in the humanmicrobiome that can be correlated with human health
Understand microbes communities, measure biodiversity...
J.J. Daudin & S Li-Thiao-Té & E Lebarbier Statistical methods for NGS-Metagenomics Experiments

MetagenomicsEstimation of abundance
Repeatability and Comparative MetagenomicsBinning/Classification
Bioinformatics challenges
In cultured microbes, the genomic data come from a singleclone, making sequence assembly and annotation tractable.
In metagenomics, the data come from heterogeneousmicrobial communities (10 to 10,000 species), with thesequence data being noisy and partial.
From sampling, to assembly, to gene calling and functionprediction, bioinformatics faces new demands in interpretingvoluminous, noisy, and often partial sequence data.
J.J. Daudin & S Li-Thiao-Té & E Lebarbier Statistical methods for NGS-Metagenomics Experiments

MetagenomicsEstimation of abundance
Repeatability and Comparative MetagenomicsBinning/Classification
Statistical challenges
Normalization of NGS data (see Dudoit et al.)
How many species (genes) ?
Repeatability and Comparative Metagenomics
Clustering/Binning the reads
J.J. Daudin & S Li-Thiao-Té & E Lebarbier Statistical methods for NGS-Metagenomics Experiments

MetagenomicsEstimation of abundance
Repeatability and Comparative MetagenomicsBinning/Classification
From the reads to the dataset: Mapping or Binning ?
Definition of the counted objects (Species, OTU, genes)
Reads give counts. What do we count exactly ?
1 Mapping: alignment to a reference set (reference genome or16S rDNA or 18S rDNA banks). Issues: incomplete, depends onupdates and databases, variable number of repetitions of16/18S rDNA.
2 Binning or clustering using similarities between reads. Issues:needs long reads (100bp), the objects are not well defined.
J.J. Daudin & S Li-Thiao-Té & E Lebarbier Statistical methods for NGS-Metagenomics Experiments

MetagenomicsEstimation of abundance
Repeatability and Comparative MetagenomicsBinning/Classification
Challenge: estimate the number of unseen objects
Data obtained after mapping / binning:Species A B C D E . . .Nb times seen 10 430 10 289 3 . . .
Frequency / Count data:Nb of occurences 0 1 2 3 4 5 . . .Nb of species ? 513 149 65 34 24 . . .
●
●
●
●●
● ●● ●
●●
●●
●●
● ● ● ● ● ●
0 5 10 15 20 25
15
5050
0
Frequency/Count data
rare species −−−−−−−> abundant species
nb o
f obs
erva
tions
● nb of missing species : 1,768
Species Abundance Distribution
J.J. Daudin & S Li-Thiao-Té & E Lebarbier Statistical methods for NGS-Metagenomics Experiments

MetagenomicsEstimation of abundance
Repeatability and Comparative MetagenomicsBinning/Classification
An old question, see J. Bunge(1993) for a review
butterflies (Fisher 1943)
number of words in a language (Efron 1976)
number of coins, cholera epidemic, number of drug users
sampling fish from a lake, insects from a forest
Objectives:
study the relative distribution of species
estimate the biodiversity
plan the number of experiments (sequencing effort)
J.J. Daudin & S Li-Thiao-Té & E Lebarbier Statistical methods for NGS-Metagenomics Experiments

MetagenomicsEstimation of abundance
Repeatability and Comparative MetagenomicsBinning/Classification
An empirical tool: Rarefaction curve
Green: most or all specieshave been sampled
blue: this habitat has notbeen exhaustivelysampled
red: species rich habitat,only a small fraction hasbeen sampled.
Figure from A Primer on Metagenomics John C. Wooley
et al. Plos Computational Biology 2010
J.J. Daudin & S Li-Thiao-Té & E Lebarbier Statistical methods for NGS-Metagenomics Experiments

MetagenomicsEstimation of abundance
Repeatability and Comparative MetagenomicsBinning/Classification
Standard sampling model
C: total number of species.Each species i contributes Xi observed individuals.Xi ∼P (λi )Species Abundance Distribution (SAD): distribution f of X.The SAD can be modelled :
directly, e.g. lognormal, inverse Gaussian, Pareto
via a model for λi . In the usual model, λi are iid samples of Λwith distribution fΛ.
f (x) =∫
e−λλx
x!fΛ(λ)dλ
J.J. Daudin & S Li-Thiao-Té & E Lebarbier Statistical methods for NGS-Metagenomics Experiments

MetagenomicsEstimation of abundance
Repeatability and Comparative MetagenomicsBinning/Classification
Models for the Species Abundance Distribution
fΛ fDirac Poisson
LognormalExponential GeometricGamma Negative Binomial
inverse GaussianPareto
Mixture models,
fΛ(λ,θ) =g∑
j=1π j fΛ j (λ,θ)
P [X = x|θ] = f (x,θ) =g∑
j=1π j f j (x,θ)
where f j (x,θ) =∫
e−λλx
x!f j (λ)dλ
J.J. Daudin & S Li-Thiao-Té & E Lebarbier Statistical methods for NGS-Metagenomics Experiments

MetagenomicsEstimation of abundance
Repeatability and Comparative MetagenomicsBinning/Classification
Truncated observations
Species with no observed individuals do not appear in the dataset
Xi is not observed but rather “Yi = Xi |Xi > 0”
f (y) = f (x)
1− f (0)
J.J. Daudin & S Li-Thiao-Té & E Lebarbier Statistical methods for NGS-Metagenomics Experiments

MetagenomicsEstimation of abundance
Repeatability and Comparative MetagenomicsBinning/Classification
Parametric / frequentist approaches
Algorithm
fit a zero-truncated parametric model to the data,
compute the coverage 1− p0 based on the parameters,
deduce C = n
1− p0
Features:
finite mixture of exponentials, lognormal, inverse Gaussian arepopular
asymptotic covariance matrix is known
Issues:
model selection
actual variance and confidence intervals not explored
J.J. Daudin & S Li-Thiao-Té & E Lebarbier Statistical methods for NGS-Metagenomics Experiments
MetagenomicsEstimation of abundance
Repeatability and Comparative MetagenomicsBinning/Classification
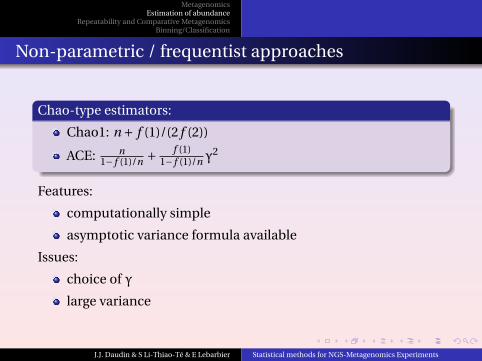
Non-parametric / frequentist approaches
Chao-type estimators:
Chao1: n + f (1)/(2 f (2))
ACE: n1− f (1)/n + f (1)
1− f (1)/nγ2
Features:
computationally simple
asymptotic variance formula available
Issues:
choice of γ
large variance
J.J. Daudin & S Li-Thiao-Té & E Lebarbier Statistical methods for NGS-Metagenomics Experiments

MetagenomicsEstimation of abundance
Repeatability and Comparative MetagenomicsBinning/Classification
Comparison
J.J. Daudin & S Li-Thiao-Té & E Lebarbier Statistical methods for NGS-Metagenomics Experiments

MetagenomicsEstimation of abundance
Repeatability and Comparative MetagenomicsBinning/Classification
Questions
Statistical Questions
Confidence intervals need improvement
Model selection
Robustness:Poorly behaved with respect to outliers.Little work on sensitivity/robustness to model choice.
Modelling covariate information
Definition of the counted objects (Species, OTU, genes)
From which object comes a read ?
Alignment to a reference set (reference genome or 16S rDNA or18S rDNA banks): incomplete, repetition
clustering of OTU using BLAST similarities between reads
J.J. Daudin & S Li-Thiao-Té & E Lebarbier Statistical methods for NGS-Metagenomics Experiments
MetagenomicsEstimation of abundance
Repeatability and Comparative MetagenomicsBinning/Classification
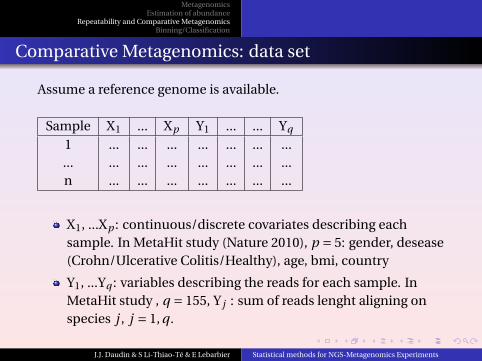
Comparative Metagenomics: data set
Assume a reference genome is available.
Sample X1 ... Xp Y1 ... ... Yq
1 ... ... ... ... ... ... ...... ... ... ... ... ... ... ...n ... ... ... ... ... ... ...
X1, ...Xp : continuous/discrete covariates describing eachsample. In MetaHit study (Nature 2010), p = 5: gender, desease(Crohn/Ulcerative Colitis/Healthy), age, bmi, country
Y1, ...Yq : variables describing the reads for each sample. InMetaHit study , q = 155, Y j : sum of reads lenght aligning onspecies j , j = 1, q .
J.J. Daudin & S Li-Thiao-Té & E Lebarbier Statistical methods for NGS-Metagenomics Experiments

MetagenomicsEstimation of abundance
Repeatability and Comparative MetagenomicsBinning/Classification
Repeatability of samples: high biological variability inmany Metagenomics Experiments
x-axis : species(from 1 to 155).y-axis number ofreads.
Profile of 3 samples with the same covariates in a gut-metagenomicexperiment.
J.J. Daudin & S Li-Thiao-Té & E Lebarbier Statistical methods for NGS-Metagenomics Experiments

MetagenomicsEstimation of abundance
Repeatability and Comparative MetagenomicsBinning/Classification
Repeatability of samples
Consequences of the variability between samples with the samevalues for covariables
Repetitions within treatment are essential
Low power of the tests
The experimental design is crucial for MetagenomicsExperiments with comparative purpose
The statistical model must take this variability into account
J.J. Daudin & S Li-Thiao-Té & E Lebarbier Statistical methods for NGS-Metagenomics Experiments

MetagenomicsEstimation of abundance
Repeatability and Comparative MetagenomicsBinning/Classification
Statistical Models
Ysi j = nb of reads of sample j from condition i , aligned on thespecies s. (i = 1,2, j = 1,ni and s = 1,155 for the gut exp.)
Models or Tests
for each s (excepted 4 and 6), Yi j ∼P (λi j ) and λi j ∼L (µi ,σi )
1 L (µi ,σi ) = δµi standard Poisson regression,
2 L (µi ,σi ) = δµi standard Poisson regression with a scale factor
3 logλi j ∼N (µi ,σ) Poisson regression with random sampleeffect and log-link
4 logYi j =µ+αi +Ei j with Ei j ∼N (0,σ) GLM afterlog-transformation
5 L (µi ,σi ) = Γ(µi ,σi ) ⇔ Yi j ∼ Negative Binomial
6 non-parametric Wilcoxon test for comparing the 2 conditions
J.J. Daudin & S Li-Thiao-Té & E Lebarbier Statistical methods for NGS-Metagenomics Experiments

MetagenomicsEstimation of abundance
Repeatability and Comparative MetagenomicsBinning/Classification
Comparison of Statistical Models
1 Standard Poisson regression (with or without scale factor)Should not be used in Metagenomics experiments: does notproperly integrates the biological variance between samples.This is also true for the Fisher exact test.
2 Poisson regression with random sample effect and log-link andGLM after log-transformation (GLM-Log) give very similarresults, although the former does not converge in few cases.
3 Negative Binomial model gives results different from(GLM-Log). Seem to be less robust to extreme values. Givesmore false positive (White et al. PLOS CB,2009).
4 Wilcoxon test is concordant with GLM-Log. However P-Valuesmay be too high for using multiple-test control (i.e. FDR) withlow repetition numbers. Ties.
J.J. Daudin & S Li-Thiao-Té & E Lebarbier Statistical methods for NGS-Metagenomics Experiments

MetagenomicsEstimation of abundance
Repeatability and Comparative MetagenomicsBinning/Classification
Fit of the models
BN Chi-Square Statistics GLM residuals
x-axis:Fit Statistic for BN model, y-axis:frequency x-axis:GLM Residual, y-axis:frequency
curve: ChiSquare pdf curve: N (0,1) pdf
J.J. Daudin & S Li-Thiao-Té & E Lebarbier Statistical methods for NGS-Metagenomics Experiments

MetagenomicsEstimation of abundance
Repeatability and Comparative MetagenomicsBinning/Classification
Fit of the models(2)
x-axis:PvaluesFitBN, y-axis:frequency x-axis:PvaluesFitGLM, y-axis:frequency
J.J. Daudin & S Li-Thiao-Té & E Lebarbier Statistical methods for NGS-Metagenomics Experiments

MetagenomicsEstimation of abundance
Repeatability and Comparative MetagenomicsBinning/Classification
Comparison of PValues for different methods
x-axis:PValuesGLM, y-axis:PValuesBN x-axis:PValuesGLM, y-axis:PValues Mixed-Poisson
x-axis:PValuesGLM, y-axis:PValuesWilcoxon x-axis:PValuesGLM, y-axis:PValues RobustGLM
J.J. Daudin & S Li-Thiao-Té & E Lebarbier Statistical methods for NGS-Metagenomics Experiments
MetagenomicsEstimation of abundance
Repeatability and Comparative MetagenomicsBinning/Classification
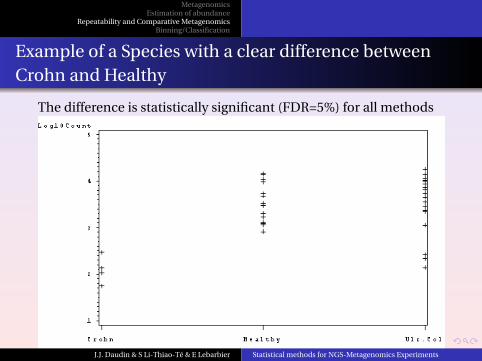
Example of a Species with a clear difference betweenCrohn and Healthy
The difference is statistically significant (FDR=5%) for all methods
J.J. Daudin & S Li-Thiao-Té & E Lebarbier Statistical methods for NGS-Metagenomics Experiments

MetagenomicsEstimation of abundance
Repeatability and Comparative MetagenomicsBinning/Classification
Example of a Species with a less clear difference betweenCrohn and Healthy
The difference is statistically significant (FDR=5%) for BN only
J.J. Daudin & S Li-Thiao-Té & E Lebarbier Statistical methods for NGS-Metagenomics Experiments

MetagenomicsEstimation of abundance
Repeatability and Comparative MetagenomicsBinning/Classification
Comparison of the lists of the different methods(FDR=5%)
J.J. Daudin & S Li-Thiao-Té & E Lebarbier Statistical methods for NGS-Metagenomics Experiments

MetagenomicsEstimation of abundance
Repeatability and Comparative MetagenomicsBinning/Classification
Other methods for comparative metagenomics:Regression
J.J. Daudin & S Li-Thiao-Té & E Lebarbier Statistical methods for NGS-Metagenomics Experiments

MetagenomicsEstimation of abundance
Repeatability and Comparative MetagenomicsBinning/Classification
Other methods for comparative metagenomics: CCA
Regularized Canonical Correlation Analysis (Gianoulis et al. PNAS 2009)
J.J. Daudin & S Li-Thiao-Té & E Lebarbier Statistical methods for NGS-Metagenomics Experiments

MetagenomicsEstimation of abundance
Repeatability and Comparative MetagenomicsBinning/Classification
Criticism against alignment methods
Many (10% to 70%) reads cannot be aligned on any bank
The banks are not reliable and change over time
The results of alignments depends on the bank and the tuning(% identity...)
The results of the the analysis of a metagenomic experimentdepends on external factors...including time!
→ classification of reads in groups (unsupervised classification,binning) based on
k-mer frequency of DNA sequences
Distance based on an alignement score between reads
J.J. Daudin & S Li-Thiao-Té & E Lebarbier Statistical methods for NGS-Metagenomics Experiments

MetagenomicsEstimation of abundance
Repeatability and Comparative MetagenomicsBinning/Classification
General view for long reads > 100bp
Method Similarity Type AuthorsTETRA 4-mers binning Teeling et al. (2004)PhyloPythia k-mers classification McHardy et al. (2007)MEGAN hits BLAST clustering Huson et al. (2007)CARMA Pfam clustering Krause et al. (2008)S-GSOM SOM binning Chan et al. (2008)MG-DOTUR BLAST clustering Schloss/HandelsmanLikelyBin k-mers/MCMC binning Kislyuk et al. (2009)Phymm IMM classification Brady Salzberg (2009)TACOA k-NN s-supervised Diaz et al. (2009)
Table modified from G. Perriere (Univ. Lyon1)
J.J. Daudin & S Li-Thiao-Té & E Lebarbier Statistical methods for NGS-Metagenomics Experiments

MetagenomicsEstimation of abundance
Repeatability and Comparative MetagenomicsBinning/Classification
Methods for short reads < 100 bp
Correspondance Analysis (G. Perriere et al.)
Mixture model for Markov Chain (E. lebarbier et al.)
J.J. Daudin & S Li-Thiao-Té & E Lebarbier Statistical methods for NGS-Metagenomics Experiments
MetagenomicsEstimation of abundance
Repeatability and Comparative MetagenomicsBinning/Classification
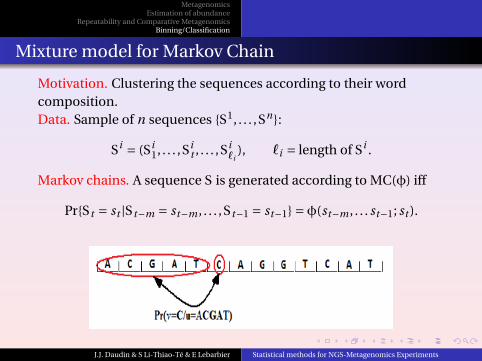
Mixture model for Markov Chain
Motivation. Clustering the sequences according to their wordcomposition.Data. Sample of n sequences {S1, . . . ,Sn}:
Si = (Si1, . . . ,Si
t , . . . ,Si`i
), `i = length of Si .
Markov chains. A sequence S is generated according to MC(φ) iff
Pr{St = st |St−m = st−m , . . . ,St−1 = st−1} =φ(st−m , . . . st−1; st ).
J.J. Daudin & S Li-Thiao-Té & E Lebarbier Statistical methods for NGS-Metagenomics Experiments

MetagenomicsEstimation of abundance
Repeatability and Comparative MetagenomicsBinning/Classification
Mixture model for Markov Chain
m is the order of the Markov chain.
φ(·; ·) are the transition probabilities. They fit the frequenciesof the (m +1)-mers:
φ(at;c) = N(atc)
N(at).
Interpretation. Markov chains of order m account for the sequencecontents in (m +1)-mers, e.g
M0 is fitted to the nucleotide frequencies;
M2 is fitted to the codon frequencies;
M5 is fitted to the di-codon frequencies.
J.J. Daudin & S Li-Thiao-Té & E Lebarbier Statistical methods for NGS-Metagenomics Experiments

MetagenomicsEstimation of abundance
Repeatability and Comparative MetagenomicsBinning/Classification
Mixture model for Markov Chain
Mixture of Markov chains.
The n sequences are spread into K groups:
Zi k = 1 if i ∈ k, 0 otherwise.
Each sequence i belongs to group k (k = 1, . . .K) withprobability πk :
Pr{i ∈ k} = Pr{Zi k = 1} =πk
interpreted as the prior probability to belong to group k.
Provided sequence i belongs to group k, it is generatedaccording to a Markov chain with parameter φk :
(Si |Zi k = 1) ∼ MC(φk )
J.J. Daudin & S Li-Thiao-Té & E Lebarbier Statistical methods for NGS-Metagenomics Experiments

MetagenomicsEstimation of abundance
Repeatability and Comparative MetagenomicsBinning/Classification
Statistical inference for Mixture model for Markov Chain
Each group k is characterized by
πk the proportion of sequences that belong to group k
φk the transitions of the Markov Chain in this group
Mixture models are incomplete data models since we miss thegroup to which each sequence belongs.
E-M algorithm: provides maximum likelihood estimates.
E-step: estimates the probability for each sequence to belongto each group:
τi k = Pr{Zi k = 1|Si } = πk Pr(Si |φk )∑k ′ πk ′ Pr(Si |φk ′)
interpreted as the posterior probability to belong to group k.
J.J. Daudin & S Li-Thiao-Té & E Lebarbier Statistical methods for NGS-Metagenomics Experiments

MetagenomicsEstimation of abundance
Repeatability and Comparative MetagenomicsBinning/Classification
Statistical inference
M-step: estimates the transition probabilities and theproportions
φk (st−m , . . . st−1; st ) = Nk (st−m , . . . st−1st )
Nk (st−m , . . . st−1), πk =
∑ni=1 τ
(h)i k
n
where Nk (g ca) =∑i τi k Nk (g ca).
Classification. The τi k can be used to perform ’maximum aposteriori’ (MAP) classification:
MAPi = argmaxk
τi k .
J.J. Daudin & S Li-Thiao-Té & E Lebarbier Statistical methods for NGS-Metagenomics Experiments

MetagenomicsEstimation of abundance
Repeatability and Comparative MetagenomicsBinning/Classification
Choice of m and K
The order m of the Markov chain and the number of groups K haveto be chosen in some way.
The order m can be fixed according to biologicalconsiderations (see M0, M2, M5).
The number of group K can be chosen by using criterion
BIC(K) = logPr(S|K)− 1
2log(# data)× (# parameters).
J.J. Daudin & S Li-Thiao-Té & E Lebarbier Statistical methods for NGS-Metagenomics Experiments

MetagenomicsEstimation of abundance
Repeatability and Comparative MetagenomicsBinning/Classification
Some partial conclusions(1)
Metagenomics experiments may be classified by the number ofunknown species (genes), US
few US (less than 20%, mine, cheese, gut) → reads aligned on areference genome → focus on comparative metagenomics
many US (10 to 10000, soil, sea)estimation of the number of species is a scientific questionimpossible to build a reference genome → binning or clusteringreads may be usefull
J.J. Daudin & S Li-Thiao-Té & E Lebarbier Statistical methods for NGS-Metagenomics Experiments

MetagenomicsEstimation of abundance
Repeatability and Comparative MetagenomicsBinning/Classification
Some partial conclusions(2)
Comparative Metagenomics: counts of reads may be analyzedusing standard statistical tools after log-transformation,excepted for low counts (but...are low counts reallyinteresting?)
Many species (genes) → FDR, regularized methods.
Biological variability is high → many biological replicates arenecessary.
Experimental design is an issue. No experiment with only onereplicate should be published.
J.J. Daudin & S Li-Thiao-Té & E Lebarbier Statistical methods for NGS-Metagenomics Experiments

MetagenomicsEstimation of abundance
Repeatability and Comparative MetagenomicsBinning/Classification
References
J. C. Wooley, A. Godzik and I. Friedberg (2010) A Primer onMetagenomics, PLoS Computational Biology.
MetaHIT Consortium (2010) A human gut microbial genecatalogue established by metagenomic sequencing, Nature inPress.
Bunge, J. and Fitzpatrick, M.(1993) Estimating the number ofspecies: a review JASA, 88, 421
White, J.R., Nagarajan, N. and Pop, M.(2009) Statisticalmethods for detecting Differentially Abundant features inclinical metagenomic samples PLOS Computational Biology,Vol 5, issue 4
Patrick D Schloss and Jo Handelsman (2008) A statisticaltoolbox for metagenomics: assessing functional diversity inmicrobial communities, BMC Bioinformatics.
J.J. Daudin & S Li-Thiao-Té & E Lebarbier Statistical methods for NGS-Metagenomics Experiments