STATISTICAL BULLETIN - Bank of South...
16
STATISTICAL BULLETIN January 2015 Research & Statistics Department
Transcript of STATISTICAL BULLETIN - Bank of South...

STATISTICAL
BULLETIN January 2015
Research & Statistics Department

2
TABLE OF CONTENT
Page
FOREWORD 3
SUMMARY NOTES 4
TABLES
1. TABLE 1.1.1 Central Bank Balance Sheet- Assets 5
2. TABLE 1.1.2 Central Bank Balance Sheet- Liabilities 6
3. TABLE 1.2.1 Other Depository Corporation Balance Sheet - Assets 7
4. TABLE 1.2.2 Other Depository Corporation Balance Sheet - Liabilities 8
5. TABLE 1.3 Central Bank Survey 9
6. TABLE 1.4 Other Depository Corporation Survey 10
7. TABLE 1.5 Depository Corporation Survey 11
8. TABLE 1.6 Commercial Banks Lending Per Economic Activity 12
9. TABLE 1.7 Commercial Banks Interest Rates 13
10. TABLE 1.8 Exchange Rates 14
11. TABLE 2 Consumer Price Indices 15
12. TABLE 3 Gross Domestic Product 16
3
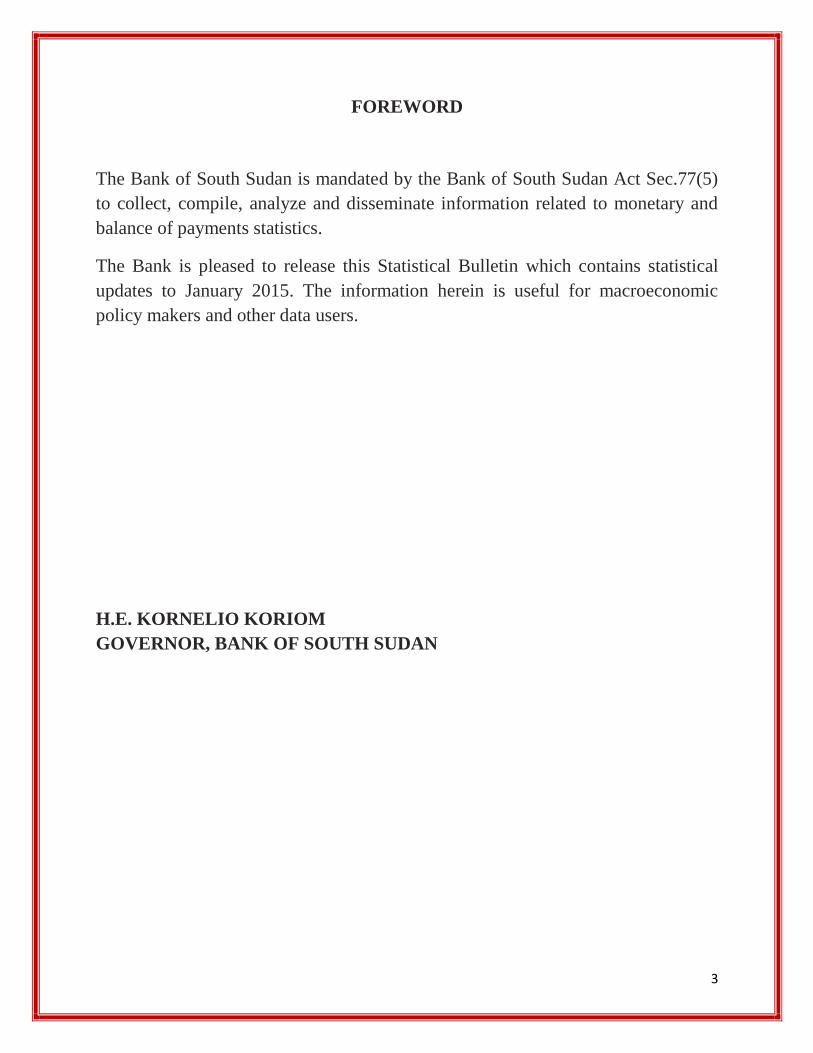
FOREWORD
The Bank of South Sudan is mandated by the Bank of South Sudan Act Sec.77(5)
to collect, compile, analyze and disseminate information related to monetary and
balance of payments statistics.
The Bank is pleased to release this Statistical Bulletin which contains statistical
updates to January 2015. The information herein is useful for macroeconomic
policy makers and other data users.
H.E. KORNELIO KORIOM
GOVERNOR, BANK OF SOUTH SUDAN

4
SUMMARY NOTES
1: DATA COVERAGE
Most of the data in this publication is sourced from the banking system in South Sudan which
comprises of the Bank of South Sudan and 27 commercial banks.
1.1 BANK OF SOUTH SUDAN
Tables 1.1.1 and 1.1.2 are monthly summarized balance sheets of the Bank of South Sudan from
January 2012 to January 2015. The data is still provisional as it awaits finalization of internal
accounts reconciliations.
1.2 OTHER DEPOSITORY CORPORATIONS
The other depository corporations in South Sudan comprises only of commercial banks at the
moment. Tables 1.2.1 and 1.2.2 are series of summarized aggregated monthly balance sheets of
commercial banks. The process involves aggregating monthly balance sheet data of all
commercial banks operating in South Sudan. The number of commercial banks gradually
increased from 8 in January 2012 to 27 in January 2015.
1.3 CENTRAL BANK SURVEY
A central bank survey is a summarized analytical balance sheet of a central bank. It identifies the
main liability of a central bank as the monetary base which the central bank has the ability to
control for purposes of affecting the overall money supply. The monetary base is equated to the
sum of net foreign assets, net credit to government, claims on banks and other assets net of other
liabilities of the central bank.
1.4 OTHER DEPOSITORY CORPORATION SURVEY
Other depository corporation survey is a summarized analytical balance sheet of other depository
corporations (ODCs). It identifies the main liability as deposits which are used for
intermediation. The deposits is equated to the sum of net foreign assets, net credit to government,
claims on central bank and other assets net of other liabilities of commercial banks (ODCs).
1.5. DEPOSITORY CORPORATION SURVEY
Depository corporation survey is a summarized analytical banking system balance sheet. It is
arrived at by aggregating the central bank balance sheet and the aggregated ODCs balance sheet.
The process involves netting out intra system balances. For example, cash held by ODCs in their
tills are liabilities of the central bank and are netted out when compiling the depository
corporation survey.

5
1.1 BANK OF SOUTH SUDAN BALANCE SHEET\1
TABLE 1.1.1: ASSETS (SSP million )
2012
January 5,750 0 0 0 0 7 1,860 7,617
February 5,719 0 0 0 0 7 1,848 7,574
March 5,276 0 0 0 0 7 1,779 7,062
April 5,798 0 0 0 0 7 1,745 7,550
May 4,857 0 0 0 0 7 1,324 6,188
June 4,211 0 0 0 0 7 1,376 5,594
July 3,549 0 0 0 0 7 1,346 4,902
August 3,527 0 0 0 0 7 1,751 5,285
September 3,209 0 0 0 0 7 1,813 5,029
October 2,614 0 0 0 0 7 1,810 4,431
November 2,385 0 0 0 0 7 1,806 4,198
December 3,399 2,368 15 2,383 0 7 29 5,818
2013
January 2,645 2,374 15 2,389 0 7 32 5,073
February 2,009 2,380 15 2,395 0 7 32 4,443
March 1,513 2,386 15 2,401 0 8 40 3,962
April 1,359 3,292 15 3,307 0 9 43 4,718
May 1,094 3,301 15 3,316 0 10 47 4,467
June 880 3,309 15 3,324 0 10 48 4,262
July 1,609 3,318 15 3,333 0 10 53 5,005
August 1,448 3,318 15 3,333 15 10 50 4,855
September 1,600 3,334 0 3,334 12 10 53 5,009
October 1,324 3,343 0 3,343 12 6 57 4,741
November 1,691 3,351 550 3,901 37 6 76 5,711
December 2,442 3,359 1,100 4,459 37 6 118 7,063
2014
January 2,271 3,368 1,650 5,018 51 43 130 7,512
February 1,325 3,375 1,650 5,025 74 42 83 6,548
March 1,156 3,385 1,100 4,485 201 41 110 5,993
April 1,194 3,393 1,650 5,043 201 41 113 6,593
May 1,140 3,497 1,650 5,147 201 41 122 6,651
June 587 3,504 1,650 5,154 201 41 124 6,107
July 517 4,639 1,650 6,289 201 41 120 7,167
August 1,112 4,324 1,650 5,974 201 41 121 7,448
September 1,128 2,064 3,940 6,004 201 40 122 7,495
October 948 2,069 5,040 7,109 201 40 117 8,415
November 1,018 2,074 4,585 6,658 201 40 115 8,033
December 806 2,082 6,042 8,124 29 41 104 9,104
2015
January 382 2,082 6,716 8,798 29 41 103 9,353
\1 Provisional
\2 Valued at BSS Official exchange rate and it comprises foreign currency notes and balances abroad
Source: Bank of South Sudan.
TotalTreasur
y Bills &
Bonds
Overdraf
t to Govt. Total
Other
AssetsEnd of
Foreign
Assets
\2
Claims on Government Claims on
Commerci
al Banks
Claims
on
Other
Sector

6
1.1 BANK OF SOUTH SUDAN BALANCE SHEET\1
TABLE 1.1.2: LIABILITIES (SSP million )
2012
January 1,893 1,972 860 4,725 - 3,893 15 235- 220- 781- 7,617
February 1,841 1,987 976 4,804 - 3,409 15 8 23 661- 7,574
March 1,984 2,083 1,132 5,199 - 2,992 15 31- 16- 1,112- 7,062
April 2,038 2,405 1,403 5,846 - 2,700 15 52- 37- 959- 7,550
May 2,137 2,387 1,374 5,897 1 2,023 15 418- 403- 1,332- 6,188
June 2,214 2,600 1,498 6,311 1 2,033 15 326- 311- 2,441- 5,594
July 2,273 2,694 1,453 6,420 1 1,657 15 280- 265- 2,912- 4,902
August 2,017 2,471 1,095 5,583 1 1,102 15 416- 401- 1,001- 5,285
September 2,047 2,135 1,195 5,376 1 846 15 174- 159- 1,036- 5,029
October 2,090 1,602 1,090 4,781 1 1,089 15 135- 120- 1,321- 4,431
November 1,995 1,597 1,088 4,680 1 984 15 136- 121- 1,347- 4,198
December 2,185 1,696 1,235 5,116 1 1,802 15 11- 4 1,105- 5,818
2013
January 1,961 1,577 516 4,054 1 1,639 15 2 17 637- 5,073
February 1,947 1,486 500 3,933 1 1,106 15 18- 3- 594- 4,443
March 1,974 1,477 508 3,959 1 1,227 15 14- 1 1,226- 3,962
April 2,027 1,564 519 4,110 1 1,455 15 5 20 868- 4,718
May 1,904 1,518 434 3,856 1 1,170 15 26 41 601- 4,467
June 1,827 1,771 434 4,032 1 1,658 15 35 50 1,479- 4,262
July 1,949 1,878 423 4,249 1 1,192 15 47 62 499- 5,005
August 1,857 1,991 554 4,403 1 1,609 15 53 68 1,226- 4,855
September 1,971 2,255 420 4,645 1 1,580 15 83 98 1,315- 5,009
October 1,976 2,224 519 4,720 1 1,501 15 106 121 1,602- 4,741
November 1,979 2,421 397 4,797 1 2,063 15 119 134 1,284- 5,711
December 2,243 2,248 549 5,040 1 2,353 15 125 140 472- 7,063
2014
January 1,998 2,461 435 4,894 1 3,047 15 130 145 575- 7,512
February 2,212 1,871 556 4,639 1 2,710 15 149 164 966- 6,548
March 1,869 2,023 446 4,338 1 1,826 15 181 196 368- 5,993
April 1,664 2,041 584 4,289 1 2,205 15 195 210 113- 6,593
May 1,933 2,346 704 4,983 1 1,405 15 209 224 38 6,651
June 2,336 2,660 528 5,524 1 937 15 233 248 603- 6,107
July 2,269 3,326 435 6,030 1 1,906 15 250 265 1,035- 7,167
August 2,417 2,991 330 5,737 1 1,504 15 247 262 56- 7,448
September 2,448 3,330 303 6,082 1 1,031 15 245 260 122 7,495
October 2,539 3,823 276 6,637 1 1,723 15 316 331 278- 8,415
November 2,617 3,873 310 6,800 1 1,078 15 313 328 175- 8,033
December 2,802 4,232 458 7,492 1 1,041 15 340 355 215 9,104
2015
January 2,673 4,583 288 7,544 1 1,707 15 338 353 252- 9,353
\1 Provisional
\2 Local Currency IMF Quota Component
Source: Bank of South Sudan.
Total
Currency
in
circulation
Other
Sectors
deposits Total Capital Reserves Total
Capital & Reserves End of
Monetary Base
IMF
deposit
s \2
Commercial
banks
deposits
Central
Govt
deposits
Other
liabilities
7
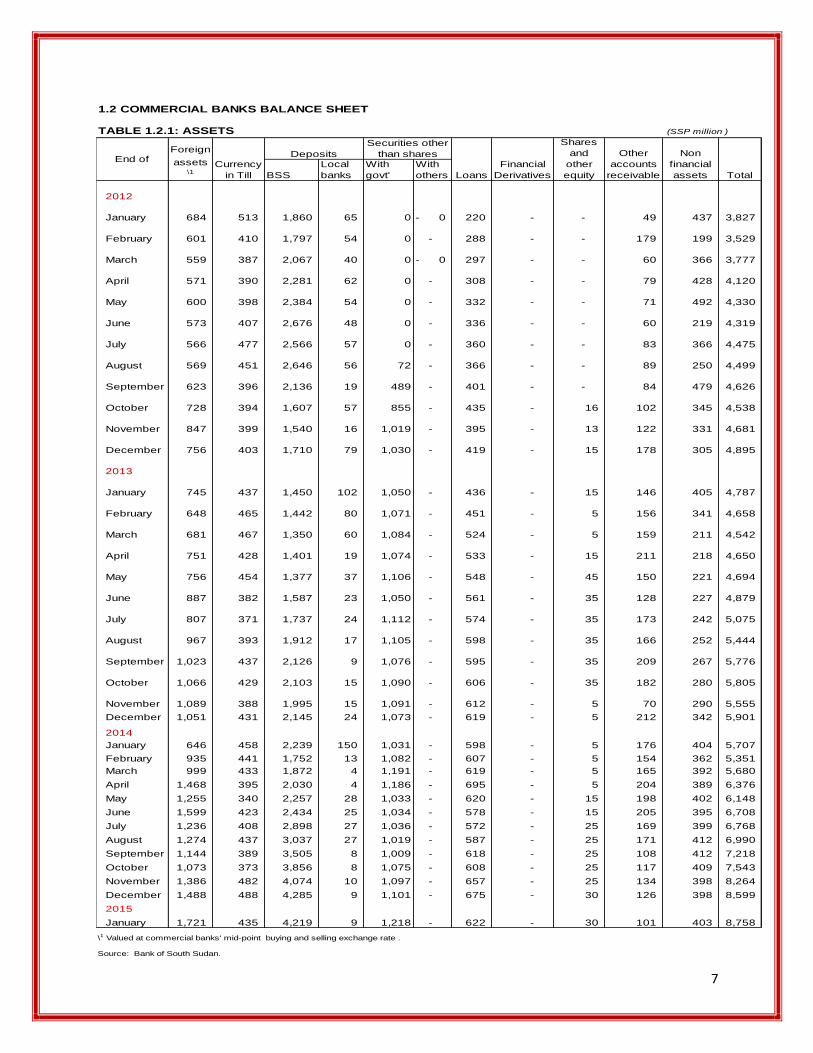
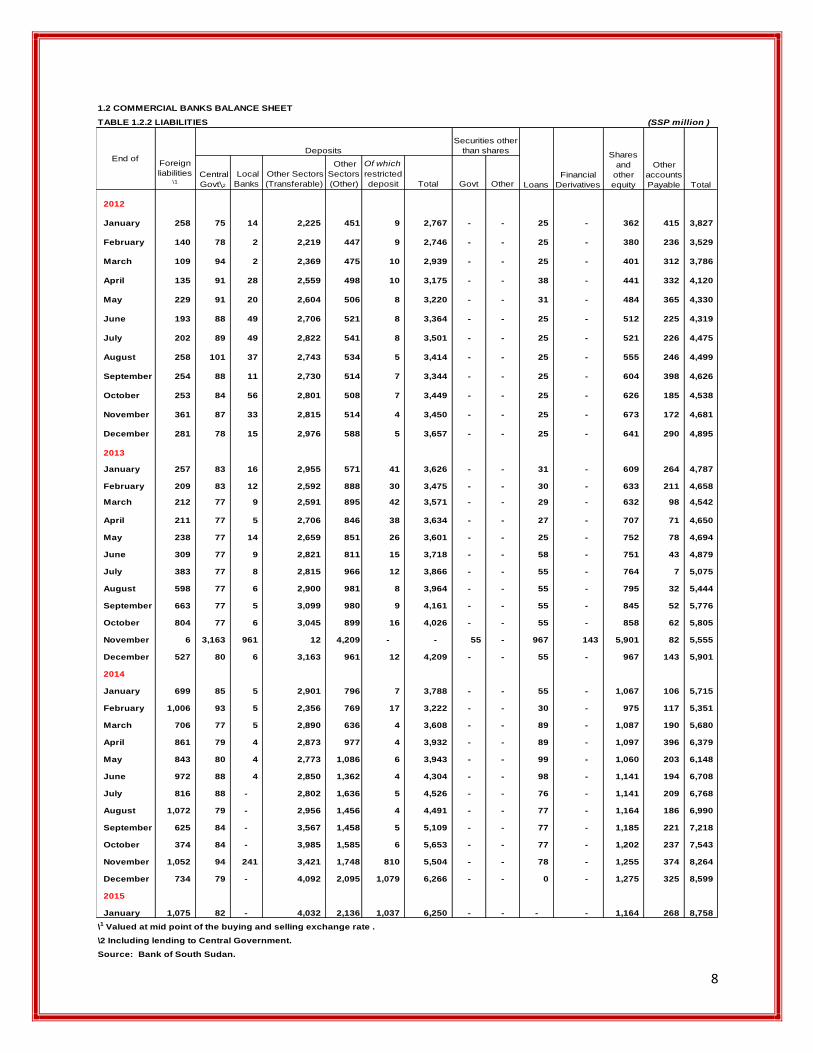
1.2 COMMERCIAL BANKS BALANCE SHEET
TABLE 1.2.1: ASSETS (SSP million )
BSS
Local
banks
With
govt'
With
others
2012
January 684 513 1,860 65 0 0- 220 - - 49 437 3,827
February 601 410 1,797 54 0 - 288 - - 179 199 3,529
March 559 387 2,067 40 0 0- 297 - - 60 366 3,777
April 571 390 2,281 62 0 - 308 - - 79 428 4,120
May 600 398 2,384 54 0 - 332 - - 71 492 4,330
June 573 407 2,676 48 0 - 336 - - 60 219 4,319
July 566 477 2,566 57 0 - 360 - - 83 366 4,475
August 569 451 2,646 56 72 - 366 - - 89 250 4,499
September 623 396 2,136 19 489 - 401 - - 84 479 4,626
October 728 394 1,607 57 855 - 435 - 16 102 345 4,538
November 847 399 1,540 16 1,019 - 395 - 13 122 331 4,681
December 756 403 1,710 79 1,030 - 419 - 15 178 305 4,895
2013
January 745 437 1,450 102 1,050 - 436 - 15 146 405 4,787
February 648 465 1,442 80 1,071 - 451 - 5 156 341 4,658
March 681 467 1,350 60 1,084 - 524 - 5 159 211 4,542
April 751 428 1,401 19 1,074 - 533 - 15 211 218 4,650
May 756 454 1,377 37 1,106 - 548 - 45 150 221 4,694
June 887 382 1,587 23 1,050 - 561 - 35 128 227 4,879
July 807 371 1,737 24 1,112 - 574 - 35 173 242 5,075
August 967 393 1,912 17 1,105 - 598 - 35 166 252 5,444
September 1,023 437 2,126 9 1,076 - 595 - 35 209 267 5,776
October 1,066 429 2,103 15 1,090 - 606 - 35 182 280 5,805
November 1,089 388 1,995 15 1,091 - 612 - 5 70 290 5,555
December 1,051 431 2,145 24 1,073 - 619 - 5 212 342 5,901
2014
January 646 458 2,239 150 1,031 - 598 - 5 176 404 5,707
February 935 441 1,752 13 1,082 - 607 - 5 154 362 5,351
March 999 433 1,872 4 1,191 - 619 - 5 165 392 5,680
April 1,468 395 2,030 4 1,186 - 695 - 5 204 389 6,376
May 1,255 340 2,257 28 1,033 - 620 - 15 198 402 6,148
June 1,599 423 2,434 25 1,034 - 578 - 15 205 395 6,708
July 1,236 408 2,898 27 1,036 - 572 - 25 169 399 6,768
August 1,274 437 3,037 27 1,019 - 587 - 25 171 412 6,990
September 1,144 389 3,505 8 1,009 - 618 - 25 108 412 7,218
October 1,073 373 3,856 8 1,075 - 608 - 25 117 409 7,543
November 1,386 482 4,074 10 1,097 - 657 - 25 134 398 8,264
December 1,488 488 4,285 9 1,101 - 675 - 30 126 398 8,599
2015
January 1,721 435 4,219 9 1,218 - 622 - 30 101 403 8,758
\1 Valued at commercial banks' mid-point buying and selling exchange rate .
Source: Bank of South Sudan.
Loans
Financial
Derivatives
Shares
and
other
equity
Other
accounts
receivable
Non
financial
assets Total
End ofForeign
assets \1
Currency
in Till
Deposits
Securities other
than shares
8
1.2 COMMERCIAL BANKS BALANCE SHEET
TABLE 1.2.2 LIABILITIES (SSP million )
Central
Govt\2
Local
Banks
Other Sectors
(Transferable)
Other
Sectors
(Other)
Of which
restricted
deposit Total Govt Other
2012
January 258 75 14 2,225 451 9 2,767 - - 25 - 362 415 3,827
February 140 78 2 2,219 447 9 2,746 - - 25 - 380 236 3,529
March 109 94 2 2,369 475 10 2,939 - - 25 - 401 312 3,786
April 135 91 28 2,559 498 10 3,175 - - 38 - 441 332 4,120
May 229 91 20 2,604 506 8 3,220 - - 31 - 484 365 4,330
June 193 88 49 2,706 521 8 3,364 - - 25 - 512 225 4,319
July 202 89 49 2,822 541 8 3,501 - - 25 - 521 226 4,475
August 258 101 37 2,743 534 5 3,414 - - 25 - 555 246 4,499
September 254 88 11 2,730 514 7 3,344 - - 25 - 604 398 4,626
October 253 84 56 2,801 508 7 3,449 - - 25 - 626 185 4,538
November 361 87 33 2,815 514 4 3,450 - - 25 - 673 172 4,681
December 281 78 15 2,976 588 5 3,657 - - 25 - 641 290 4,895
2013
January 257 83 16 2,955 571 41 3,626 - - 31 - 609 264 4,787
February 209 83 12 2,592 888 30 3,475 - - 30 - 633 211 4,658
March 212 77 9 2,591 895 42 3,571 - - 29 - 632 98 4,542
April 211 77 5 2,706 846 38 3,634 - - 27 - 707 71 4,650
May 238 77 14 2,659 851 26 3,601 - - 25 - 752 78 4,694
June 309 77 9 2,821 811 15 3,718 - - 58 - 751 43 4,879
July 383 77 8 2,815 966 12 3,866 - - 55 - 764 7 5,075
August 598 77 6 2,900 981 8 3,964 - - 55 - 795 32 5,444
September 663 77 5 3,099 980 9 4,161 - - 55 - 845 52 5,776
October 804 77 6 3,045 899 16 4,026 - - 55 - 858 62 5,805
November 6 3,163 961 12 4,209 - - 55 - 967 143 5,901 82 5,555
December 527 80 6 3,163 961 12 4,209 - - 55 - 967 143 5,901
2014
January 699 85 5 2,901 796 7 3,788 - - 55 - 1,067 106 5,715
February 1,006 93 5 2,356 769 17 3,222 - - 30 - 975 117 5,351
March 706 77 5 2,890 636 4 3,608 - - 89 - 1,087 190 5,680
April 861 79 4 2,873 977 4 3,932 - - 89 - 1,097 396 6,379
May 843 80 4 2,773 1,086 6 3,943 - - 99 - 1,060 203 6,148
June 972 88 4 2,850 1,362 4 4,304 - - 98 - 1,141 194 6,708
July 816 88 - 2,802 1,636 5 4,526 - - 76 - 1,141 209 6,768
August 1,072 79 - 2,956 1,456 4 4,491 - - 77 - 1,164 186 6,990
September 625 84 - 3,567 1,458 5 5,109 - - 77 - 1,185 221 7,218
October 374 84 - 3,985 1,585 6 5,653 - - 77 - 1,202 237 7,543
November 1,052 94 241 3,421 1,748 810 5,504 - - 78 - 1,255 374 8,264
December 734 79 - 4,092 2,095 1,079 6,266 - - 0 - 1,275 325 8,599
2015
January 1,075 82 - 4,032 2,136 1,037 6,250 - - - - 1,164 268 8,758
\1 Valued at mid point of the buying and selling exchange rate .
\2 Including lending to Central Government.
Source: Bank of South Sudan.
Total
Securities other
than shares Deposits
Foreign
liabilities \1
End of
Loans
Financial
Derivatives
Shares
and
other
equity
Other
accounts
Payable

9
TABLE 1.3: CENTRAL BANK SURVEY
(SSP million)
2012
January 5,750 -3,893 0 7 2,861 -1,025 4,725
February 5,719 -3,409 0 7 2,487 -915 4,804
March 5,276 -2,992 0 7 2,907 -77 5,199
April 5,798 -2,700 0 7 2,741 48 5,846
May 4,856 -2,023 0 7 3,058 1,042 5,897
June 4,210 -2,033 0 7 4,128 2,101 6,311
July 3,548 -1,657 0 7 4,522 2,872 6,420
August 3,525 -1,102 0 7 3,153 2,057 5,583
September 3,208 -846 0 7 3,008 2,169 5,376
October 2,612 -1,089 0 7 3,251 2,169 4,781
November 2,384 -984 0 7 3,273 2,297 4,680
December 3,397 581 0 7 1,130 1,719 5,116
2013
January 2,643 750 0 7 653 1,410 4,054
February 2,007 1,289 0 7 629 1,926 3,933
March 1,512 1,174 0 8 1,265 2,447 3,959
April 1,358 1,853 0 9 891 2,752 4,110
May 1,093 2,146 0 10 608 2,763 3,856
June 878 1,667 0 10 1,478 3,154 4,032
July 1,607 2,140 0 10 491 2,642 4,249
August 1,447 1,723 15 10 1,208 2,956 4,403
September 1,598 1,754 12 10 1,271 3,047 4,645
October 1,323 1,841 12 6 1,538 3,397 4,720
November 1,690 1,837 37 6 1,226 3,107 4,797
December 2,441 2,106 37 6 451 2,600 5,040
2014
January 2,270 1,971 51 43 559 2,623 4,894
February 1,323 2,315 74 42 885 3,315 4,639
March 1,154 2,659 201 41 282 3,183 4,338
April 1,193 2,838 201 41 16 3,096 4,289
May 1,138 3,742 201 41 -140 3,845 4,983
June 586 4,217 201 41 479 4,938 5,524
July 516 4,383 201 41 890 5,514 6,030
August 448 4,470 201 41 577 5,289 5,737
September 1,127 4,973 201 40 -259 4,955 6,082
October 947 5,385 201 40 64 5,691 6,637
November 1,017 5,580 201 40 -38 5,783 6,800
December 805 7,084 29 41 -466 6,687 7,492
2015
January 381 7,091 29 41 2 7,163 7,544
\1 Valued at end of period exchange rate
\2 Credit to Government is net of government deposits
Source: Bank of South Sudan
End ofNet Foreign
Assets \1
Net Domestic Assets
Monetary
base Claims on
Government
(Net) \2
Claims on
Commercial
Banks
Claims on
Other
Sectors
Other Items
netTotal

10
TABLE 1.4: OTHER DEPOSITORY CORPORATION SURVEY
(SSP million )
2012
January 426 2,373 -78 220 142 -274 2,240 2,224 442 2,666
February 461 2,207 -78 288 210 -221 2,196 2,219 438 2,657
March 450 2,454 -94 297 203 -274 2,383 2,369 465 2,834
April 436 2,671 -91 308 218 -279 2,610 2,559 487 3,046
May 371 2,782 -91 332 241 -292 2,731 2,604 498 3,102
June 380 3,083 -88 336 248 -493 2,839 2,706 513 3,219
July 364 3,043 -89 360 271 -323 2,991 2,822 533 3,355
August 311 3,097 -29 366 337 -474 2,960 2,743 528 3,271
September 369 2,532 400 401 801 -464 2,869 2,730 507 3,238
October 476 2,001 771 435 1,205 -380 2,826 2,801 501 3,302
November 486 1,938 932 395 1,326 -426 2,839 2,815 509 3,325
December 475 2,113 952 419 1,371 -399 3,085 2,976 583 3,559
2013
January 488 1,887 967 436 1,404 -294 2,997 2,955 530 3,485
February 439 1,907 987 451 1,438 -335 3,010 2,592 857 3,449
March 469 1,817 1,008 524 1,532 -374 2,975 2,591 853 3,444
April 540 1,829 997 533 1,530 -386 2,973 2,706 808 3,513
May 518 1,831 1,029 548 1,577 -442 2,967 2,659 825 3,484
June 578 1,968 973 561 1,533 -462 3,040 2,821 796 3,617
July 423 2,108 1,035 574 1,609 -371 3,346 2,815 954 3,769
August 369 2,305 1,028 598 1,626 -428 3,503 2,900 973 3,873
September 360 2,563 998 595 1,593 -446 3,710 3,099 971 4,070
October 262 2,532 1,012 606 1,618 -485 3,666 3,045 883 3,928
November 722 2,383 1,011 612 1,623 -704 3,302 3,074 949 4,024
December 524 2,576 993 619 1,612 -599 3,588 3,163 949 4,112
2014
January -53 2,697 946 598 1,544 -498 3,743 2,901 789 3,690
February -72 2,193 989 607 1,596 -610 3,180 2,356 752 3,108
March 293 2,305 1,114 619 1,733 -809 3,229 2,890 632 3,522
April 607 2,425 1,106 695 1,802 -989 3,238 2,873 972 3,845
May 412 2,597 953 620 1,573 -729 3,441 2,773 1,080 3,853
June 627 2,857 946 578 1,524 -801 3,580 2,850 1,357 4,207
July 420 3,306 947 572 1,519 -811 4,013 2,802 1,631 4,433
August 202 3,475 940 587 1,527 -796 4,205 2,956 1,451 4,407
September 518 3,895 924 618 1,542 -935 4,502 3,567 1,453 5,020
October 699 4,229 991 608 1,599 -963 4,865 3,985 1,579 5,564
November 333 4,556 1,003 657 1,660 -2,191 4,026 3,421 939 4,359
December 754 4,773 1,023 675 1,698 -2,116 4,355 4,092 1,017 5,109
2015
January 646 4,654 1,136 622 1,758 -1,926 4,485 4,032 1,099 5,131
\1 Valued at end of period exchange rate
\2 Credit to Government net of Government deposits
Source: Bank of South Sudan
Claims
on
Central
Bank
Domestic Credit
Other
Items
Net
Total
End of
Net
Foreign
Assets \1 Claims on
Governmen
t (Net) \2
Claims on
Other
Sector
Total
Deposits in money
Transferable Other Total
Net Domestic Assets

11
TABLE 1.5: DEPOSITORY CORPORATION SURVEY
(SSP million )
Total
2012
January 6,176 -3,971 227 -3,744 2,474 -1,270 1,380 3,085 4,465 442 4,907
February 6,180 -3,486 295 -3,192 2,076 -1,116 1,431 3,195 4,626 438 5,064
March 5,727 -3,085 304 -2,781 2,617 -164 1,597 3,500 5,098 465 5,563
April 6,234 -2,790 315 -2,475 2,337 -138 1,647 3,962 5,609 487 6,097
May 5,227 -2,114 339 -1,775 2,763 987 1,739 3,977 5,716 498 6,214
June 4,589 -2,121 343 -1,778 3,711 1,933 1,807 4,203 6,010 513 6,523
July 3,912 -1,746 367 -1,379 4,072 2,692 1,796 4,275 6,071 533 6,605
August 3,837 -1,131 373 -759 2,854 2,095 1,566 3,838 5,404 528 5,932
September 3,576 -446 408 -38 2,545 2,507 1,651 3,925 5,576 507 6,083
October 3,088 -319 442 123 2,876 2,999 1,695 3,891 5,586 501 6,087
November 2,869 -52 402 350 2,791 3,141 1,597 3,904 5,501 509 6,010
December 3,872 1,533 426 1,959 745 2,705 1,782 4,211 5,993 583 6,576
2013
January 3,132 1,717 443 2,161 233 2,394 1,524 3,471 4,995 530 5,525
February 2,447 2,276 458 2,734 251 2,984 1,482 3,092 4,574 857 5,431
March 1,981 2,182 533 2,715 764 3,478 1,507 3,099 4,606 853 5,459
April 1,898 2,850 541 3,392 342 3,733 1,599 3,224 4,824 808 5,631
May 1,610 3,175 558 3,732 26 3,758 1,450 3,093 4,543 825 5,368
June 1,456 2,639 570 3,210 832 4,041 1,446 3,255 4,701 796 5,497
July 2,031 3,175 584 3,759 -21 3,739 1,578 3,238 4,815 954 5,770
August 1,816 2,752 608 3,360 716 4,076 1,464 3,454 4,919 973 5,891
September 1,958 2,753 605 3,357 708 4,065 1,534 3,519 5,052 971 6,023
October 1,585 2,854 612 3,465 944 4,409 1,547 3,564 5,111 883 5,994
November 2,412 2,849 618 3,466 133 3,599 1,590 3,471 5,061 949 6,011
December 2,964 3,099 625 3,724 -215 3,509 1,812 3,712 5,524 949 6,473
2014
January 2,217 2,917 641 3,558 -110 3,448 1,540 3,336 4,876 789 5,665
February 1,252 3,304 649 3,953 229 4,182 1,770 2,911 4,682 752 5,434
March 1,447 3,773 660 4,433 -476 3,957 1,436 3,336 4,772 632 5,404
April 1,679 3,944 737 4,681 -641 4,040 1,269 3,478 4,747 972 5,719
May 878 4,695 662 5,357 193 5,550 1,593 3,756 5,349 1,080 6,428
June 1,213 5,163 619 5,782 -348 5,435 1,913 3,378 5,290 1,357 6,648
JUly 935 5,330 613 5,943 -149 5,794 1,861 3,237 5,098 1,631 6,729
August 1,313 5,410 628 6,038 -634 5,403 1,979 3,286 5,265 1,451 6,716
September 1,645 5,897 658 6,555 -818 5,737 2,059 3,870 5,929 1,453 7,382
October 1,646 6,376 648 7,024 -665 6,359 2,166 4,260 6,426 1,579 8,005
November 1,350 6,583 698 7,280 -1,827 5,454 2,135 3,731 5,865 939 6,804
December 1,559 8,106 716 8,822 -2,500 6,322 2,313 4,551 6,864 1,017 7,881
2015
January 1,027 8,227 663 8,890 -2,260 6,630 2,238 4,320 6,558 1,099 7,657
\1 Valued at end of period exchange rate
\2 Credit to Government is net of government deposits
Source: Bank of South Sudan
Transferabl
e deposits
Broad Money M2
TotalOther
depositsTotal
Narrow Money M1
Currency
Outside
Banks
End of
Net
Foreign
Assets \1
Net Domestic Assets
Domestic Credit
Other
Items
net
Total Claims on
Government
(Net) \2
Claims on
Other
Sector

12
Table 1.6: Commercial Banks Lending Per Economic Activity (SSP Million)
Agriculture ManufacturingBuilding and
Construction
Real
Estate
Energy
and
Water
Mining
and
quarying
Domestic
Trade,
Restaurants &
Hotel
Foreign
Trade
Transport and
Communication
Financial
Services
Household
ServicesTotal
2012
September 38 10 42 32 3 - 133 38 3 0 105 403
October 5 10 50 37 3 - 130 35 3 0 107 380
November 5 10 51 43 4 - 121 51 5 0 120 410
December 10 16 47 47 4 - 120 68 7 - 113 431
2013
January 4 16 48 51 4 - 118 100 9 0 91 442
February 4 15 50 53 4 - 126 99 11 0 104 467
March 4 13 52 55 32 - 215 46 12 0 108 537
April 4 28 59 56 14 - 225 47 27 0 72 532
May 3 44 66 58 4 - 223 54 26 0 100 578
June 5 47 74 55 37 2 230 63 25 0 105 643
July 7 43 84 55 16 2 230 64 24 0 105 629
August 7 44 87 69 12 5 230 67 25 0 99 646
September 12 44 96 73 8 5 222 66 25 0 93 644
October 12 44 99 69 6 2 234 64 24 0 95 646
November 12 44 101 69 6 1 233 63 23 0 98 652
December 12 43 102 69 17 1 220 81 22 0 96 663
2014
January 11 38 110 - - - 108 85 15 - 31 398
February 12 41 102 66 4 1 164 80 9 0 85 564
March 12 40 104 10 4 3 159 81 20 0 85 519
April 12 49 101 82 16 3 261 110 16 10 85 747
May 13 53 111 78 16 1 198 404 14 0 86 974
June 17 54 118 80 21 1 206 82 13 30 82 703
July 12 52 121 115 24 1 221 310 12 31 88 987
August 8 50 24 121 21 1 293 90 16 0 91 717
September 51 57 27 125 15 1 216 376 19 0 90 979
October 48 54 45 124 18 4 225 106 9 0 91 724
November 9 58 120 121 17 - 169 78 9 9 94 685
December 11 55 131 130 12 - 259 29 14 0 95 736
2015
January 48 55 48 123 24 1 224 90 10 1 91 714
Source: Bank of South Sudan
Loans: Including Loans for nonresident.
Economic Activity
13
2012
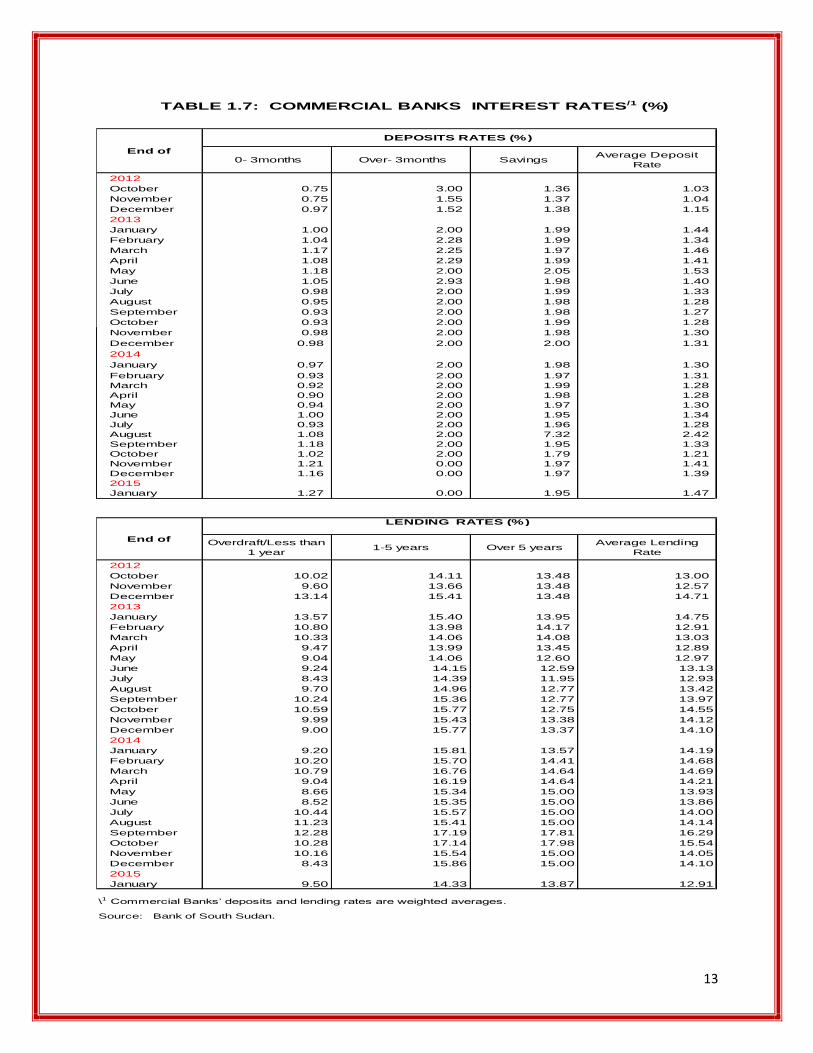
October 0.75 3.00 1.36 1.03
November 0.75 1.55 1.37 1.04
December 0.97 1.52 1.38 1.15
2013
January 1.00 2.00 1.99 1.44
February 1.04 2.28 1.99 1.34
March 1.17 2.25 1.97 1.46
April 1.08 2.29 1.99 1.41
May 1.18 2.00 2.05 1.53
June 1.05 2.93 1.98 1.40
July 0.98 2.00 1.99 1.33
August 0.95 2.00 1.98 1.28
September 0.93 2.00 1.98 1.27
October 0.93 2.00 1.99 1.28
November 0.98 2.00 1.98 1.30
December 0.98 2.00 2.00 1.31
2014
January 0.97 2.00 1.98 1.30
February 0.93 2.00 1.97 1.31
March 0.92 2.00 1.99 1.28
April 0.90 2.00 1.98 1.28
May 0.94 2.00 1.97 1.30
June 1.00 2.00 1.95 1.34
July 0.93 2.00 1.96 1.28
August 1.08 2.00 7.32 2.42
September 1.18 2.00 1.95 1.33
October 1.02 2.00 1.79 1.21
November 1.21 0.00 1.97 1.41
December 1.16 0.00 1.97 1.39
2015
January 1.27 0.00 1.95 1.47
2012
October 10.02 14.11 13.48 13.00
November 9.60 13.66 13.48 12.57
December 13.14 15.41 13.48 14.71
2013
January 13.57 15.40 13.95 14.75
February 10.80 13.98 14.17 12.91
March 10.33 14.06 14.08 13.03
April 9.47 13.99 13.45 12.89
May 9.04 14.06 12.60 12.97
June 9.24 14.15 12.59 13.13
July 8.43 14.39 11.95 12.93
August 9.70 14.96 12.77 13.42
September 10.24 15.36 12.77 13.97
October 10.59 15.77 12.75 14.55
November 9.99 15.43 13.38 14.12
December 9.00 15.77 13.37 14.10
2014
January 9.20 15.81 13.57 14.19
February 10.20 15.70 14.41 14.68
March 10.79 16.76 14.64 14.69
April 9.04 16.19 14.64 14.21
May 8.66 15.34 15.00 13.93
June 8.52 15.35 15.00 13.86
July 10.44 15.57 15.00 14.00
August 11.23 15.41 15.00 14.14
September 12.28 17.19 17.81 16.29
October 10.28 17.14 17.98 15.54
November 10.16 15.54 15.00 14.05
December 8.43 15.86 15.00 14.10
2015
January 9.50 14.33 13.87 12.91
\1 Commercial Banks’ deposits and lending rates are weighted averages.
Source: Bank of South Sudan.
Over 5 yearsAverage Lending
Rate
End of
LENDING RATES (%)
Overdraft/Less than
1 year1-5 years
0- 3months Over- 3months Savings
DEPOSITS RATES (%)
TABLE 1.7: COMMERCIAL BANKS INTEREST RATES/1 (%)
Average Deposit
Rate
End of

14
TABLE 1.8: SOUTH SUDANESE POUND EXCHANGE RATES
Selected Monthly Average exchange rates \1
2012
January 2.950 3.580 3.813 4.575
February 2.950 3.651 3.901 4.660 748.852 26.788
March 2.950 3.913 3.202 4.669 836.962 28.103
April 2.950 4.434 3.887 4.722 847.508 28.180
May 2.950 4.941 3.777 4.591 836.030 28.180
June 2.950 4.942 3.701 4.586 844.598 28.386
July 2.950 5.335 3.631 4.602 838.723 28.517
August 2.950 4.978 3.569 4.634 844.113 28.499
September 2.950 4.444 3.790 4.746 852.234 28.669
October 2.950 4.355 3.826 4.742 872.842 28.853
November 2.950 4.293 3.784 4.709 887.174 29.017
December 2.950 4.244 3.864 4.758 905.569 29.157
2013
January 2.950 4.252 3.915 4.709 909.874 29.432
February 2.950 4.191 3.943 4.474 901.471 29.668
March 2.950 4.057 3.829 4.238 895.025 29.132
April 2.950 3.859 3.846 4.519 873.557 28.584
May 2.950 3.936 3.832 4.521 876.973 28.514
June 2.950 4.220 3.864 4.545 878.776 28.988
July 2.950 4.277 3.910 4.490 880.370 29.570
August 2.950 4.495 3.907 4.575 875.538 29.687
September 2.950 4.404 3.937 4.674 871.569 29.649
October 2.950 4.375 4.027 4.754 859.756 28.950
November 2.950 4.476 4.179 4.983 827.290 28.206
December 2.950 4.671 4.038 4.836 852.540 29.295
2014
January 2.950 4.750 3.998 4.862 839.571 29.181
February 2.950 4.175 4.043 4.922 857.490 29.316
March 2.950 3.975 4.058 4.910 862.630 29.334
April 2.950 3.875 4.074 4.963 854.122 29.444
May 2.950 4.225 4.013 4.933 864.358 29.769
June 2.950 4.450 4.025 5.024 881.224 29.724
July 2.950 4.688 3.952 4.989 890.570 29.745
August 2.950 4.663 3.888 4.892 886.826 29.960
September 2.950 4.688 3.952 4.989 890.570 31.745
October 2.950 5.305 3.719 4.720 913.838 30.291
November 2.950 5.725 3.674 4.638 941.347 30.622
December 2.950 5.875 3.588 4.609 940.707 30.593
2015
January 2.950 6.425 3.344 4.445 971.638 31.076
Pound
SterlingUganda \
2
U.S.A
Dollar
(official)
Euro
\2 Implies currency units per South Sudanese Pounds
Source: Bank of South Sudan
\1 Simple average of buying and selling rates
Kenya \2
U.S.A
Dollar
(parallel)

15
TABLE 2: CONSUMER PRICE INDEX(June 2011=100)
Food and Non-
alcholic
beverages
Alcoholic
beverages and
Tobacco
Clothing and
footwear
Housing, Water,
Electricity, Gas and
other fuel
Furnishings,
household
equipment and
Health TransportCommunicat
ion
Recreation
and cultureEducation
Restaurants
and hotels
Miscellaneous
goods and
services
Total
Weight 71.39 3.12 2.49 2.59 3.52 4.47 2.67 1.40 0.46 1.29 4.02 2.58 100.00
2012
Jan 126.90 217.92 141.09 108.85 172.88 225.44 122.19 89.50 143.78 96.23 141.03 138.97 135.56
Feb 124.06 207.59 133.97 108.57 143.40 204.86 122.40 98.29 146.29 96.23 130.67 138.12 130.77
Mar 125.96 163.17 140.01 114.74 155.46 264.88 121.30 97.30 109.76 96.23 133.86 119.85 133.60
Apr 125.50 218.58 124.11 113.88 149.53 188.02 139.52 93.42 140.38 154.01 125.51 129.50 132.17
May 173.19 284.17 140.93 117.62 206.95 148.77 147.92 107.06 162.91 154.01 159.71 137.16 171.14
June 172.78 327.74 150.59 120.99 203.21 155.16 174.62 100.04 142.03 154.01 171.55 151.71 174.06
Jul 167.82 368.21 164.90 148.85 213.02 129.78 134.50 97.90 136.80 154.01 155.72 149.69 170.26
Aug 165.84 345.34 162.74 194.61 206.99 141.00 134.48 98.73 149.60 154.01 173.81 149.15 170.33
Sep 165.97 311.29 163.99 179.90 207.92 186.85 133.72 102.02 134.83 154.01 165.39 152.30 170.80
Oct 151.01 333.21 163.91 166.68 201.69 165.59 123.57 100.33 141.96 154.01 164.27 158.58 159.14
Nov 186.68 435.27 168.89 150.63 200.71 192.07 150.02 92.70 163.99 154.01 173.32 156.71 189.66
Dec 160.38 443.07 163.63 173.31 200.32 176.75 134.82 82.57 164.63 154.01 160.82 148.51 169.63
2013
Jan 169.69 722.07 160.90 123.70 191.78 170.25 128.84 89.61 131.32 154.01 161.77 167.60 183.35
Feb 142.11 591.56 175.29 129.55 242.38 158.45 133.93 97.11 165.92 154.01 182.22 154.24 162.23
Mar 138.81 357.97 166.16 131.20 181.93 208.52 133.96 96.62 157.39 154.01 176.18 162.32 152.43
Apr 144.10 356.62 166.02 124.41 181.05 145.88 135.20 89.25 151.48 154.01 183.84 160.59 153.33
May 142.97 383.41 151.19 118.73 192.42 195.82 134.81 101.45 164.36 154.01 178.50 154.42 155.32
June 146.05 345.10 155.95 151.06 182.49 127.71 134.30 107.61 170.33 154.01 188.40 168.40 154.74
July 144.04 351.76 166.63 133.87 173.82 133.09 150.43 96.64 148.32 154.25 199.03 171.40 153.96
August 143.92 346.26 172.55 139.19 178.95 143.31 138.19 100.70 148.25 160.61 182.17 165.61 153.61
September 147.42 327.11 159.62 127.73 184.64 238.47 113.99 88.14 172.56 160.61 181.78 161.56 158.51
October 156.25 327.20 167.19 127.30 169.75 156.25 136.19 93.38 166.38 160.61 174.50 156.77 161.01
November 153.51 414.38 179.17 149.55 180.38 145.49 137.44 95.26 188.11 160.61 186.19 156.27 163.16
December 144.14 343.54 188.73 108.51 195.97 169.27 121.10 92.37 177.55 160.61 185.29 165.38 154.72
2014
January 157.79 379.01 171.29 104.76 186.02 215.48 121.10 97.20 184.40 160.61 187.41 160.66 166.83
February 150.92 346.33 155.63 113.73 195.90 140.14 121.14 94.20 181.03 162.90 182.73 161.15 157.52
March 143.00 369.17 158.23 106.15 197.63 151.28 121.14 90.92 175.85 162.90 180.71 167.57 153.02
April 149.00 364.20 172.65 218.40 193.00 135.18 964.18 90.64 160.13 158.71 179.16 174.40 182.03
May 143.47 298.80 156.05 162.52 172.68 132.26 121.22 89.22 168.33 162.90 177.56 170.31 150.72
June 148.68 344.83 143.06 150.66 184.04 130.07 121.06 90.01 182.34 162.90 180.93 166.93 155.67
July 150.26 293.97 152.92 170.41 183.31 151.63 121.30 91.74 178.84 162.90 206.80 167.65 157.98
August 156.29 370.77 147.54 163.55 173.72 242.18 121.18 88.82 178.84 162.90 178.92 167.01 166.90
September 145.82 323.81 149.53 172.19 186.09 245.67 121.18 87.47 193.85 162.90 183.78 165.19 159.02
October 138.54 300.24 152.28 172.59 205.16 216.62 121.42 87.26 201.56 162.90 191.30 164.62 152.86
November 187.18 470.11 201.06 171.84 227.54 216.62 137.78 88.34 204.00 162.90 200.52 173.84 195.94
December 154.13 396.80 220.59 162.68 212.38 231.34 119.20 83.25 206.57 162.90 201.96 176.49 170.01
2015.00
January 149.07 331.16 183.59 143.39 208.00 295.48 121.42 90.99 196.65 162.90 201.41 169.94 165.57
Source: South Sudan National Bureau of Statistics

16
TABLE 3: GROSS DOMESTIC PRODUCT
At Current Prices (SSP M)
2008 2009 2010 2011 2012 2013
Final consum exp, government 4,769 4,362 5,908 9,253 8,223 8,025
Final consum exp, households 10,468 11,051 11,959 18,527 27,231 26,325
Final consum exp, NPISH 394 640 776 388 1,017 4,907
Gross fixed capital formation 4,478 3,857 3,732 5,626 3,687 4,128
Changes in inventories 45 -424 89 0 15 18
Gross Domestic Expenditure 20,154 19,485 22,464 33,795 40,173 43,403
Exports of goods and services 21,472 17,040 22,270 35,201 3,096 6,334
Imports of goods and services 9,703 9,146 10,228 14,747 13,133 14,914
GDP at current prices 31,923 27,379 34,507 54,249 30,135 34,823
At Constant prices (SSP M)
2008 2009 2010 2011 2012 2013
Final consum exp, government 4,920 4,362 5,584 6,521 5,136 4,870
Final consum exp, households 11,039 11,051 11,838 12,452 12,706 12,745
Final consum exp, NPISH 413 640 666 280 708 2,552
Gross fixed capital formation 4,880 3,857 3,633 4,350 1,978 2,147
Changes in inventories 47 -424 88 0 8 8
Gross Domestic Expenditure 21,299 19,485 21,809 23,602 20,536 22,322
Exports of goods and services 15,373 17,040 16,773 16,414 1,333 2,660
Imports of goods and services 10,426 9,146 10,049 10,933 6,628 7,647
GDP at constant prices 26,247 27,379 28,533 29,084 15,241 17,335
Source: South Sudan National Bureau of Statistics