Statistical Background Report - BC Rural Centre · Statistical Background Report Okanagan...
24
Statistical Background Report Okanagan Similkameen Regional District Community Land Trusts & Rural Development Project ADVANCING RURAL DEVELOPMENT This project is made possible with funding from the Real Estate Foundation of British Columbia
Transcript of Statistical Background Report - BC Rural Centre · Statistical Background Report Okanagan...

Statistical Background Report
Okanagan Similkameen Regional District
Community Land Trusts
&
Rural Development Project
ADVANCING RURAL DEVELOPMENT
This project is made possible with funding from the Real Estate Foundation of British Columbia

1 | P a g e
NOTE TO READER This report was written by Gordon Borgstrom, SIBAC’s Executive Director and provides an overview of selected socio-economic statistics and trends for the Okanagan-Similkameen Regional District of the southern interior. The report was prepared to collate and analyze key statistical data relevant to population, demographic, income and housing values and trends – and their implications for housing needs in the region now and in the future. This report is one of several documents created as part of the Community Land Trusts & Rural Development Project created and managed by SIBAC in partnership with the Real Estate Foundation of BC. Additional reports and documents created as part of this project will be made available on SIBAC’s BC Rural Centre website www.bcruralcentre.org SIBAC gratefully acknowledges the financial support of the Real Estate Foundation of BC as a funding partner in this project. SIBAC is a non-profit rural development organization. SIBAC ’s founding members are the nine Regional Districts and six Tribal Councils in the southern interior and the CFDC of Central Interior First Nations. Committed to advancing rural development in the province, SIBAC focusses its activities on three major areas (i) providing a southern interior rural perspective into government consultation processes (ii) encouraging the development of new rural development policies and programs and (iii) developing and leading strategic rural development projects. www.sibacs.com and www.bcruralcentre.org The Real Estate Foundation is a philanthropic organization that helps advance sustainable land use in British Columbia. They provide grants to non-profit organizations working to improve BC communities through responsible and informed land use, conservation and real estate practices. www.refbc.com

2 | P a g e
INTRODUCTION This report examines the communities and unincorporated areas of the Okanagan Similkameen Regional District. The report was prepared to collate and analyze key statistical data relevant to population, demographic, income and housing values and trends – and their implications for housing needs in the region now - and into the future. To create this report a variety of statistical data sets were used that unfortunately all have different geographical boundaries. Therefore, some data is only available for incorporated communities while other data is available for a variety of regional geographies. Due to the traditional under-representation of First Nations in the Census data and other statistical surveys, data for individual First Nations’ reserves in the region are not displayed. However, it should be recognized by the reader that First Nations have some of the youngest and fastest growing components of the rural population in the southern interior.
POPULATION As demonstrated by the Graph in Appendix 1, there have been significant differences in the rates of population growth across the southern interior. Generally however, communities in the Okanagan valley have grown significantly faster than communities in the Kootenay and Boundary regions over the past three decades. Within the Okanagan Similkameen Regional District area, from 1986 to 2014 the highest rates of population growth occurred in Oliver while Princeton saw an actual decline in population:
Community % Population Change from 1986 to 2014
1986 Population
2014 Population
Oliver 123% 2,028 4,516 Osoyoos 59% 3,047 4,834 Keremeos 54% 864 1,331 BC Provincial Average 53% 3,003,621 4,581,978 Summerland 41% 7,994 11,239 Penticton 36% 24,376 33,160 Princeton -9% 3,008 2,749
Population projections in BC are only produced for Local Health Area geographies by BC Stats. As shown in Appendix 2, BC Stats expects only one Local Health Area (LHA) in the southern interior – the Central Okanagan LHA – to exceed provincial average growth rates. It is important to note that BC Stats forecasts predict a continued population decline in several areas of the southern interior – primarily in the Kootenays and Boundary regions. Within the five LHAs in the Okanagan Similkameen Regional District area, BC Stats forecasts that the greatest growth will be in the Penticton LHA and that the Princeton LHA will continue to lose population.

3 | P a g e
Local Health Area % Projected
Population Change from 2017 to 2030
2017 Population Projection
2030 Population Projection
BC Provincial Average 16% 4,807,320 5,577,106 Penticton LHA 12% 43,777 49,000 Keremeos LHA 11% 5,292 5,899 Summerland LHA 7% 11,805 12,586 Southern Okanagan LHA 3% 18,654 19,170 Princeton LHA -7% 4,496 4,197
DEMOGRAPHICS The southern Okanagan has been a popular retirement area for many years, so the region has had an ‘older’ demographic profile than the provincial average for the past few decades. However, due to population projections and the projected continuation of youth and new immigrants preferring to live in the lower mainland and capital regional areas – the continued ‘aging’ of the five Local Health Areas in the Okanagan Similkameen Regional District is quite dramatic as evidenced by the data in the table below:
Local Health Area % 0f Total 2015
Population Over 70
% of Total 2030
Projected Population
Over 70
% of Total 2040
Projected Population
Over 70
Projected Number of Individuals Over 70 in
2040 BC Provincial Average 11.7% 17.6% 19.5% 1,182,234 Penticton LHA 19.9% 25.4% 25.7% 13,445 Keremeos LHA 23.2% 33.5% 34.7% 2,134 Summerland LHA 20.7% 30.8% 31.8% 4,096 Southern Okanagan LHA 26% 37.1% 36.5% 6,896 Princeton LHA 22.3% 38.7% 38% 1,440
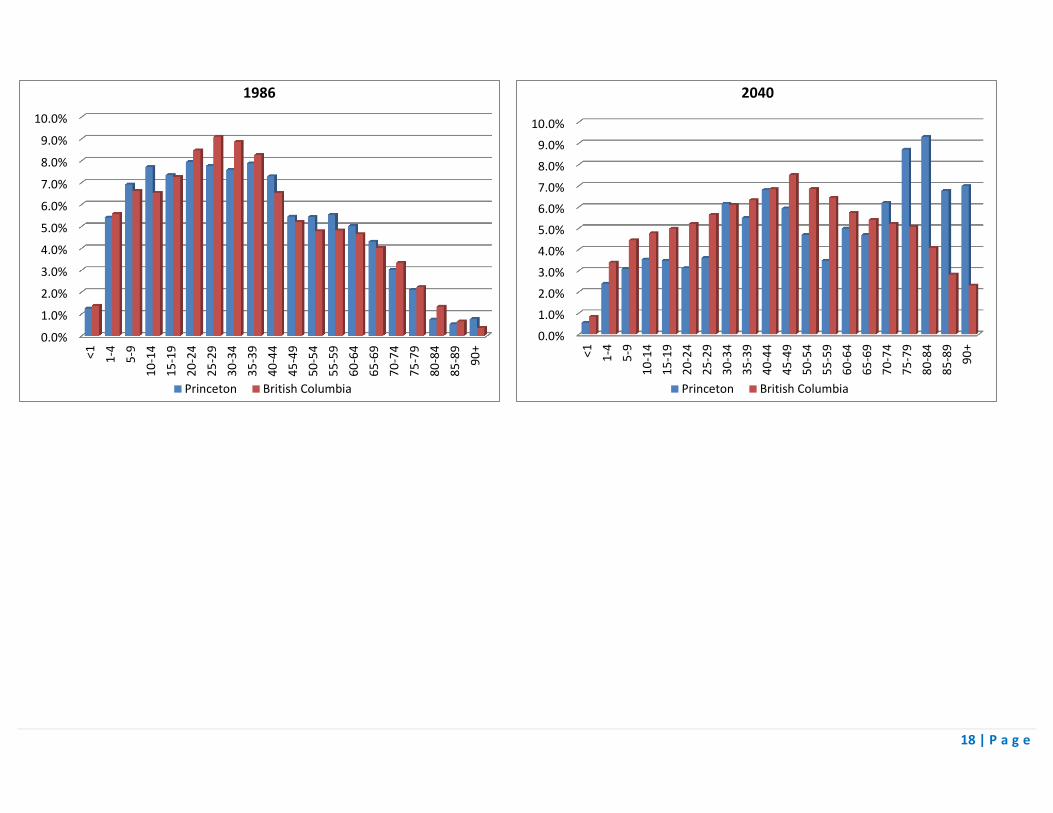
Appendix 3 provides detailed graphs showing the significant demographic changes for these five LHAs from 1986 to 2040. Perhaps the most important factor is the very significant numbers of individuals in the over 70 age categories. It is over the age of 70 that there is typically an increase in the need for additional home and health care supports. By 2030 it is projected that all of the region’s Local Health Areas – with the exception of the Penticton LHA - will have at least 30% of their populations in the over 70 year old categories.

4 | P a g e
INCOME LEVELS To be able to analyze detailed levels of family and individual incomes, SIBAC purchased a special run of Canada Revenue Agency Taxfiler data from Census Canada. The most recent year available was for the 2013 taxation year. Since SIBAC was purchasing a special run of data it was possible to get data down to the various Regional District electoral areas. Appendix 4 provides a summary overview of the taxfiler data. As demonstrated by the following graph and table, there is a very wide range of average and median incomes across the Okanagan Similkameen Regional District. Only Area F of the Regional District has average and median incomes that are both above the provincial average. Several other areas of the regional district – most notably Keremeos, Area B, Area G and Area H - are significantly below provincial averages.
$0
$20,000
$40,000
$60,000
$80,000
$100,000
$120,000
2013 Average Family Total Income 2013 Median Family Total Income

5 | P a g e
2013 Average
Family Total Income 2013 Median
Family Total Income
Provincial Total $72,550 $51,320
OSRD Total $61,580 $44,470 Keremeos $47,560 $36,590
Oliver $53,990 $40,200 Osoyoos $59,270 $44,520
Penticton $59,570 $41,800 Princeton $63,830 $47,170
Summerland $69,770 $52,460 Area B $50,760 $34,730 Area C $56,840 $45,990 Area D $70,820 $53,740 Area E $77,390 $59,770 Area F $105,730 $84,540 Area G $47,440 $37,030 Area H $44,690 $31,920
Appendix 5 provides a table showing the percentages of families by their total household income. Again, as shown by the graphs below, families in most of the subregions of the Okanagan Similkameen Regional District are living on less than the provincial average and on less than $59,999 and $79,999 annually. As shown in Appendix 5, Keremeos, Area B and Area H have percentages of families living on less than $29,999 annual income that is almost double the provincial average.
56%
63%
73%
67% 64% 66%
60% 56%
71%
64%
55%
49%
38%
74% 73%
Total Family Income - Less than $59,999

6 | P a g e
As shown by the graphs in Appendix 6, most areas of the Okanagan Similkameen Regional District are also below the provincial average when considering individual income levels. For example, the graphs below demonstrate that a significant percentage of the region’s seniors live on individual incomes of less than $29,999 annually; and for those under 65 years of age a significant percentage (60-79%) have annual individual incomes of less than $39,999 annually.
68%
75%
85%
79% 78% 77%
71% 69%
81% 78%
69% 64%
48%
86% 83%
Total Family Income - Less than $79,999
57% 61% 59%
71% 65% 65%
80%
62% 59%
62% 58%
46%
39%
80% 78%
Individual Taxfilers 65 and Over - Under $29,999/Year

7 | P a g e
HOUSING & HOUSING VALUES As shown in the table below, due to the high number of seniors living in the region a high percentage of homeowners qualify for the Seniors Home Owners Grant (HOG). In Keremeos and Osoyoos over 64% of homeowners are eligible for the Seniors Homeowner Grant. Indeed, as shown in Appendix 7, the region has some of the highest percentages of Seniors HOGs in the southern interior.
Total # of Properties # of Claimants 65 and over % Provincial Total 960,028 319,336 33.3% Keremeos 521 350 67.2% Oliver 1,642 955 58.2% Osoyoos 1,751 1,124 64.2% Penticton 9,474 4,491 47.4% Princeton 869 448 51.6% Summerland 3,727 1,711 45.9%
Average selling prices for single family housing has increased significantly across the region as shown by sales figures from the Southern Okanagan Real Estate Board:
2000 Average Selling
Price
2015 Average Selling
Price
% Change
Summerland $180,269 $459,651 155% Penticton $155,454 $433,038 179% Kaleden/Okanagan Falls $196,500 $469,408 139% Oliver $144,219 $320,967 123% Osoyoos $165,115 $377,421 129% Keremeos $88,768 $237,008 167% Princeton $105,860 $246,325 133%
58% 63%
67% 72% 69%
59%
72%
63% 58%
63% 58% 57%
48%
79% 76%
Individual Taxfilers UNDER 65 - Under $39,999/Year

8 | P a g e
IMPLICATIONS FOR HOUSING These various trends and changes in population, demographics, income levels and housing values have significant implications for housing – for both younger families and seniors. Younger Families In BC, there has been extensive coverage of the need for increased affordable housing in the greater Vancouver and Victoria regions. While six or seven years ago, the focus was primarily on housing for homeless and government assistance individuals – most recently the discussion has expanded to include the inability of middle income earners and families to be able to purchase homes in these markets. While the media focus has been primarily on the rapidly increasing house values of the lower mainland, the reality is that housing affordability has become an issue in many interior communities as well.
“The price of housing in in Oliver & area is heavily influenced by people who are not dependent on the local economy – retirees and recreational owners. As a consequence, new and resale homes are priced beyond the purchasing ability of most working families.”
Oliver Final Affordable Housing Strategy, CitySpaces Consulting November 2009
What isn’t perhaps fully understood is that increases in house prices have far out-paced increases in household incomes over the past several decades. In most cases, increases in housing prices are almost double the rate of increase in household income. As demonstrated by the data in the following graph, house prices across the Okanagan Similkameen have increased by 510 to 711% while household income has only risen by 132 to 296% over the past 25 years.
238% 270%
233%
296% 243% 241%
213% 249%
206%
286% 243%
191%
132%
549% 551% 528%
711%
566% 556% 537% 542% 550% 571%
510% 525% 548%
Change in Household Incomes Compared to Housing Values
% Change Median Household Income 1985 to 2010 % Change Average Value of Dwelling 1985 to 2010

9 | P a g e
As a result, at least one recent report in the region has identified affordable housing for younger working individuals and families as a priority. “Prospective first-time homebuyers with $60,000 or less annual income have very little opportunity to purchase in Oliver. During the scoping period, there was widespread sentiment that efforts should be taken to facilitate homeownership for this group, making it one of the top priorities for the housing strategy.”
Oliver Final Affordable Housing Strategy, CitySpaces Consulting, November 2009.
At an annual income of $60,000, these are families and individuals that most would not normally consider as “low income” but rather moderate income earners. The cost of a single family home in several Okanagan and Similkameen valley communities is simply beyond moderate income earners. For example, in Penticton in 2013 the average sale price of a single family home was $374,676 and the average annual household income was $59,570. Therefore, even with a $75,000 cash down payment and minimal other debt, a family with an annual income of $59,570 would only qualify for UP to a $209,335 traditional 25 year mortgage – a shortfall of $90,341 (24%) from the average single family home selling price. Most communities in the Okanagan Similkameen region have acknowledged that there is a housing affordability issue for younger workers and families as a majority of families make less than $59,999 annually.
56%
63%
73%
67% 64% 66%
60% 56%
71%
64%
55%
49%
38%
74% 73%
Total Family Income - Less than $59,999
10 | P a g e
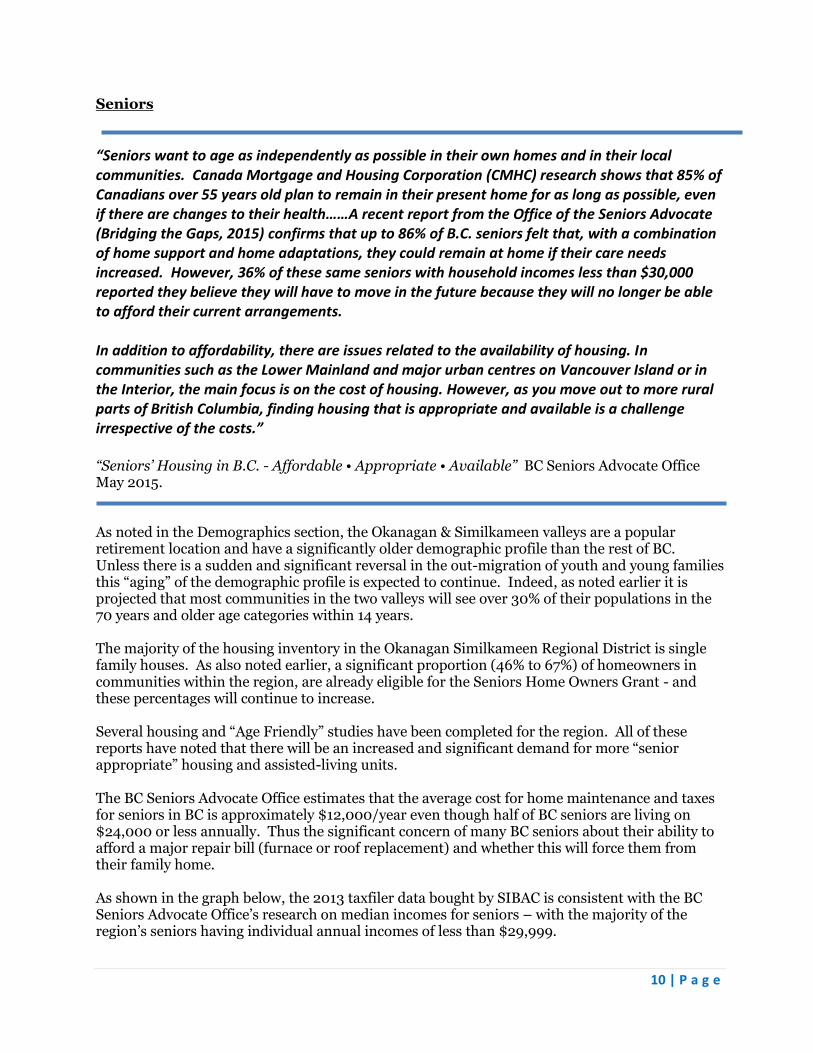
Seniors
“Seniors want to age as independently as possible in their own homes and in their local communities. Canada Mortgage and Housing Corporation (CMHC) research shows that 85% of Canadians over 55 years old plan to remain in their present home for as long as possible, even if there are changes to their health……A recent report from the Office of the Seniors Advocate (Bridging the Gaps, 2015) confirms that up to 86% of B.C. seniors felt that, with a combination of home support and home adaptations, they could remain at home if their care needs increased. However, 36% of these same seniors with household incomes less than $30,000 reported they believe they will have to move in the future because they will no longer be able to afford their current arrangements. In addition to affordability, there are issues related to the availability of housing. In communities such as the Lower Mainland and major urban centres on Vancouver Island or in the Interior, the main focus is on the cost of housing. However, as you move out to more rural parts of British Columbia, finding housing that is appropriate and available is a challenge irrespective of the costs.” “Seniors’ Housing in B.C. - Affordable • Appropriate • Available” BC Seniors Advocate Office May 2015. As noted in the Demographics section, the Okanagan & Similkameen valleys are a popular retirement location and have a significantly older demographic profile than the rest of BC. Unless there is a sudden and significant reversal in the out-migration of youth and young families this “aging” of the demographic profile is expected to continue. Indeed, as noted earlier it is projected that most communities in the two valleys will see over 30% of their populations in the 70 years and older age categories within 14 years. The majority of the housing inventory in the Okanagan Similkameen Regional District is single family houses. As also noted earlier, a significant proportion (46% to 67%) of homeowners in communities within the region, are already eligible for the Seniors Home Owners Grant - and these percentages will continue to increase. Several housing and “Age Friendly” studies have been completed for the region. All of these reports have noted that there will be an increased and significant demand for more “senior appropriate” housing and assisted-living units. The BC Seniors Advocate Office estimates that the average cost for home maintenance and taxes for seniors in BC is approximately $12,000/year even though half of BC seniors are living on $24,000 or less annually. Thus the significant concern of many BC seniors about their ability to afford a major repair bill (furnace or roof replacement) and whether this will force them from their family home. As shown in the graph below, the 2013 taxfiler data bought by SIBAC is consistent with the BC Seniors Advocate Office’s research on median incomes for seniors – with the majority of the region’s seniors having individual annual incomes of less than $29,999.

11 | P a g e
In communities with vibrant housing markets, lower income senior homeowners might be able to arrange “reverse mortgages” or other financial arrangements to raise cash if required for house repairs or home care supports but this might not be as easy for seniors in smaller communities and unincorporated areas. As noted by the BC Seniors Advocate Office, even if a senior wants and can sell their single family home – they will need appropriate housing to move into. When considering the very high number of single family homes in the Regional District that are occupied by seniors it does beg the question – what will the housing market be like in 20 to 30 years when large numbers of baby boomers begin to pass away? Without a continual influx of new retirees or younger people there could be a large number of vacant homes in many rural communities in 20 to 30 years.
57% 61%
59%
71%
65% 65%
80%
62% 59%
62% 58%
46%
39%
80% 78%
Taxfilers 65 and Over - Under $29,999

12 | P a g e
A POTENTIAL NEED & ROLE FOR COMMUNITY LAND TRUSTS? The Regional District of Okanagan Similkameen, like all regions of BC, will require a range of housing models and options to serve the diverse needs of the population. However, as demonstrated by this and previous reports, there is increasing concern regarding housing affordability for young working individuals and families in the Okanagan Similkameen Regional District. There is also increasing concern that if the housing affordability issue is not addressed, it will have increasing economic and employment impacts as the region struggles to attract and maintain the service and health care workers the region’s industries and population need.
“The current demand for workers and the lack of accessible housing in the region has exacerbated the housing need. Accessible housing is more than a social issue: it is one of economic necessity and sustainability”
South Okanagan Regional Growth Strategy, RGS Toolkit, No Date, Page 20 The Community Land Trust (CLT) model is in many ways well suited to serve a target population of working, moderate income earners. The CLT model can accommodate what is termed the “shared equity” model – whereby the CLT homeowner can build-up personal equity over time (through their mortgage payments) but within a legal contract that keeps the CLT home affordable in perpetuity. This shared equity model has several advantages including increased pride and incentive in home maintenance and upkeep; and an ability to finance significant portions of the housing construction costs through individual homeowner mortgages.
“A majority of survey respondents (74%) felt that young adults & families with young children are moving away because housing costs are too high.”… “Near market options should not be affordable only to the first occupant/owner but should be maintained as affordable for future occupants.”
Oliver Final Affordable Housing Strategy, CitySpaces Consulting, November 2009. There are now over 200 community land and housing trusts in the United States with many – like the three CLTs on the San Juan Islands of Washington State – focussed on providing affordable housing for working individuals and families. For more information on the San Juan CLTs please see a project companion report titled “Creating Community: Providing Affordable Housing on the San Juan Islands” that is available on the SIBAC website. Obviously housing CLTs are only one potential model to facilitate the provision of affordable
housing - and various models will be needed to address the variety of housing needs in rural BC.

13 | P a g e
However, CLTs can offer a model that can assist in facilitating the provision of affordable housing
in several ways:
1.) A CLT model can help facilitate the donation of private lands and houses to public
control;
2.) The CLT model can be useful in the provision of affordable housing by removing the cost
of land from housing construction costs;
3.) The CLT model can be an effective model to provide housing for moderate income
earners. In the U.S., housing CLT homebuyers often can cover up to 75% of the housing
construction costs through personal individual mortgages;
4.) Where a housing CLT offers a home purchase option it can help middle income home
buyers build personal equity. In some cases, this may help some CLT homeowners to
ultimately transition into the traditional housing market;
5.) A regional CLT organization might be a model that helps provide additional required
housing development capacity to very small rural communities; and
6.) In the rural BC context perhaps a CLT organizational model could help bridge and
transition over time rural single family home ownership from seniors to younger families.

14 | P a g e
-60% -40% -20% 0% 20% 40% 60% 80% 100% 120% 140%
Oliver
Kelowna
Vernon
Armstrong
Peachland
Enderby
Osoyoos
Keremeos
BC TOTAL
Salmon Arm
Coldstream
Invermere
Lumby
Summerland
Kamloops
Penticton
Lillooet
Chase
Creston
Grand Forks
Castlegar
Cranbrook
Merritt
Nelson
Spallumcheen
Nakusp
Salmo
Slocan
Fruitvale
Logan Lake
Midway
Rossland
Golden
Kimberley
Princeton
Trail
Greenwood
Warfield
Cache Creek
Fernie
Revelstoke
Montrose
Sparwood
New Denver
Ashcroft
Silverton
Elkford
Lytton
Appendix 1 - % Change in Population 1986-2014

15 | P a g e
Appendix 2 – Population Growth Projections by Local Health Area 2017 - 2030
-10% -5% 0% 5% 10% 15% 20% 25%
Central Okanagan
British Columbia
Armstrong - Spallumcheen
Vernon
Penticton
Castlegar
Kamloops
Keremeos
Salmon Arm
Fernie
Enderby
Summerland
Creston
Merritt
Revelstoke
Windermere
Golden
Cranbrook
Nelson
Southern Okanagan
Kimberley
Trail
Lillooet
North Thompson
Grand Forks
Princeton
Arrow Lakes
Kootenay Lake
Kettle Valley
22%
16%
13%
13%
12%
12%
12%
11%
10%
7%
7%
7%
7%
6%
6%
5%
4%
4%
4%
3%
1%
1%
0%
-1%
-3%
-7%
-8%
-8%
-9%

16 | P a g e
Appendix 3 Demographic Changes in the 5 LHAs in Okanagan Similkameen Regional District
0.0%
2.0%
4.0%
6.0%
8.0%
10.0%
<1
1-4
5-9
10
-14
15
-19
20
-24
25
-29
30
-34
35
-39
40
-44
45
-49
50
-54
55
-59
60
-64
65
-69
70
-74
75
-79
80
-84
85
-89
90
+
1986
Summerland British Columbia
0.0%
2.0%
4.0%
6.0%
8.0%
10.0%
<1
1-4
5-9
10
-14
15
-19
20
-24
25
-29
30
-34
35
-39
40
-44
45
-49
50
-54
55
-59
60
-64
65
-69
70
-74
75
-79
80
-84
85
-89
90
+
2040
Summerland British Columbia
0.0%
2.0%
4.0%
6.0%
8.0%
10.0%
<1
1-4
5-9
10
-14
15
-19
20
-24
25
-29
30
-34
35
-39
40
-44
45
-49
50
-54
55
-59
60
-64
65
-69
70
-74
75
-79
80
-84
85
-89
90
+
1986
Penticton British Columbia
0.0%
1.0%
2.0%
3.0%
4.0%
5.0%
6.0%
7.0%
8.0%
<1
1-4
5-9
10
-14
15
-19
20
-24
25
-29
30
-34
35
-39
40
-44
45
-49
50
-54
55
-59
60
-64
65
-69
70
-74
75
-79
80
-84
85
-89
90
+
2040
Penticton British Columbia

17 | P a g e
0.0%
1.0%
2.0%
3.0%
4.0%
5.0%
6.0%
7.0%
8.0%
9.0%
10.0%
<1
1-4
5-9
10
-14
15
-19
20
-24
25
-29
30
-34
35
-39
40
-44
45
-49
50
-54
55
-59
60
-64
65
-69
70
-74
75
-79
80
-84
85
-89
90
+
1986
Southern Okanagan British Columbia
0.0%
1.0%
2.0%
3.0%
4.0%
5.0%
6.0%
7.0%
8.0%
9.0%
<1
1-4
5-9
10
-14
15
-19
20
-24
25
-29
30
-34
35
-39
40
-44
45
-49
50
-54
55
-59
60
-64
65
-69
70
-74
75
-79
80
-84
85
-89
90
+
2040
Southern Okanagan British Columbia
0.0%
2.0%
4.0%
6.0%
8.0%
10.0%
<1
1-4
5-9
10
-14
15
-19
20
-24
25
-29
30
-34
35
-39
40
-44
45
-49
50
-54
55
-59
60
-64
65
-69
70
-74
75
-79
80
-84
85
-89
90
+
1986
Keremeos British Columbia
0.0%
2.0%
4.0%
6.0%
8.0%
10.0%
<1
1-4
5-9
10
-14
15
-19
20
-24
25
-29
30
-34
35
-39
40
-44
45
-49
50
-54
55
-59
60
-64
65
-69
70
-74
75
-79
80
-84
85
-89
90
+
2040
Keremeos British Columbia
18 | P a g e
0.0%
1.0%
2.0%
3.0%
4.0%
5.0%
6.0%
7.0%
8.0%
9.0%
10.0%
<1
1-4
5-9
10
-14
15
-19
20
-24
25
-29
30
-34
35
-39
40
-44
45
-49
50
-54
55
-59
60
-64
65
-69
70
-74
75
-79
80
-84
85
-89
90
+
1986
Princeton British Columbia
0.0%
1.0%
2.0%
3.0%
4.0%
5.0%
6.0%
7.0%
8.0%
9.0%
10.0%
<1
1-4
5-9
10
-14
15
-19
20
-24
25
-29
30
-34
35
-39
40
-44
45
-49
50
-54
55
-59
60
-64
65
-69
70
-74
75
-79
80
-84
85
-89
90
+
2040
Princeton British Columbia

19 | P a g e
Appendix 4 – Taxfiler Data
Area Total Number of Families (including single households)
Total Number of Taxfilers & Dependents
Number of Taxfilers 65 and OVER
% of Taxfilers Over 65
Yrs
Number of Individuals 65 and Over with Old Age Security Payments
Number of Individuals 65 and Over with Net Federal Supplement
(G.I.S.)
% of Individuals with OAS also collecting
the Net Federal Supplement (G.I.S.)
Provincial Total
2,072,170 4,377,850 746,130 700,150 238,970 34%
OSRD Total 41,810 81,820 23,120 28.3% 22,560 8,030 36% Keremeos 1,420 2,770 980 35.4% 960 450 47% Oliver 3,200 6,520 1,680 25.8% 1,630 720 44% Osoyoos 3,660 6,970 2,470 35.4% 2,390 740 31% Penticton 18,270 34,660 8,980 25.9% 8,790 3,170 36% Princeton 2,200 4,240 1,170 27.6% 1,150 510 44% Summerland 5,600 11,640 3,090 26.5% 3,020 930 31% Area B 580 1,210 260 21.5% 250 150 60% Area C 870 1,660 630 38% 630 210 33% Area D 2,900 5,920 1,640 27.7% 1,600 490 31% Area E 840 1,770 430 24.3% 420 100 24% Area F 560 1,380 280 20.3% 270 50 19% Area G 350 660 250 37.9% 240 150 63% Area H 400 710 230 32.4% 220 130 59%

20 | P a g e
Appendix 5
Area % of Families with Income less than $29,999
% of Families with Income less than $49,999
% of Families with Income less than $59,999
% of Families with Income less than $79,999
% of Families with Income less than $119,999
Provincial Total 19% 49% 56% 68% 84%
OSRD Total 33% 55% 63% 75% 89% Keremeos 39% 66% 73% 85% 95% Oliver 37% 59% 67% 79% 92% Osoyoos 32% 56% 64% 78% 91% Penticton 35% 58% 66% 77% 90% Princeton 32% 53% 60% 71% 87% Summerland 27% 48% 56% 69% 85% Area B 43% 65% 71% 81% 93% Area C 28% 55% 64% 78% 92% Area D 26% 47% 55% 69% 86% Area E 23% 40% 49% 64% 82% Area F 16% 32% 38% 48% 68% Area G 37% 66% 74% 86% 94% Area H 45% 68% 73% 83% 95%

21 | P a g e
Appendix 6 – Individual Income Levels – 65 Years and Older
34% 33% 31%
43%
38% 36%
52%
33% 30%
33% 33%
25%
18%
48%
43%
Taxfilers 65 and Over - Under $19,999/year
57% 61% 59%
71% 65% 65%
80%
62% 59%
62% 58%
46% 39%
80% 78%
Taxfilers 65 and Over - Under $29,999/year
71% 76% 74%
84% 78% 80%
96%
76% 74% 77% 73%
62% 57%
92% 91%
Taxfilers 65 and Over - Under $39,999/year
80% 85% 83%
90% 86% 88%
96%
86% 84% 86% 83% 76%
71%
100% 100% Taxfilers 65 and Over - Under $49,999/year

22 | P a g e
Appendix 6 – Individual Income Levels – UNDER 65 Years of Age
35% 37% 39%
47%
39% 38%
47%
36% 33%
36% 33% 35%
28%
50% 51%
Taxfilers UNDER 65 - Under $19,999/year
58% 63%
67% 72%
69%
59%
72%
63% 58%
63% 58% 57%
48%
79% 76%
Taxfilers UNDER 65 - Under $39,999/year
75% 80% 83% 86% 85%
72%
85% 81%
76% 82%
76% 75%
65%
88% 89%
Taxfilers UNDER 65 - Under $59,999/year
86% 89% 91% 93% 92%
83%
92% 91% 87%
91% 86% 87%
78%
94% 94%
Taxfilers UNDER 65 - Under $79,999/year

23 | P a g e
17.0% 17.1%
21.4% 22.2% 22.8% 23.2% 23.5%
25.5% 27.6%
29.7% 30.3%
31.5% 31.7% 32.0% 32.0% 32.4% 32.5% 32.6% 33.0% 33.3%
34.2% 35.5% 36.0% 36.5% 36.6%
37.8% 38.5% 38.7% 39.4%
40.7% 41.2%
42.1% 42.3% 42.3%
43.7% 44.1% 44.2% 44.6%
45.9% 47.4% 47.6% 48.0% 48.2% 48.8%
50.0% 50.6% 51.3% 51.6%
52.7% 53.7% 53.7%
54.7% 55.8% 56.0% 56.0%
58.2% 60.7%
63.4% 64.2%
67.2%
ElkfordWhistler
SparwoodSquamishRossland
FernieSun Peaks
RevelstokeGolden
FruitvaleSlocan
Lake CountryWarfield
InvermereClearwater
KamloopsColdstream
NelsonCanal Flats
Provincial AverageRadium Hot Springs
LumbyWest Kelowna
CranbrookKimberleyCastlegarKelowna
MontroseSalmo
SpallumcheenLillooet
TrailMerrittVernon
KasloArmstrongLogan Lake
Salmon ArmSummerland
PentictonLytton
NakuspSicamous
EnderbyGrand Forks
PeachlandClinton
PrincetonBarriere
New DenverCache Creek
ChaseAshcroftCreston
SilvertonOliver
MidwayGreenwood
OsoyoosKeremeos
Appendix 7
% of Households Claiming 65+
Home Owners Grant - 2014