Statistical and probabilistic analyses of impact pressure...
13
Technical Note Statistical and probabilistic analyses of impact pressure and discharge of debris flow from 139 events during 1961 and 2000 at Jiangjia Ravine, China Y. Hong a , J.P. Wang b , D.Q. Li c , Z.J. Cao c, ⁎, C.W.W. Ng b , P. Cui d a College of Civil Engineering and Architecture, Zhejiang University, Hangzhou, China b Department of Civil and Environmental Engineering, Hong Kong University of Science and Technology, Kowloon, HKSAR, China c State Key Laboratory of Water Resources and Hydropower Engineering Science, School of Water Resources and Hydropower Engineering, Wuhan University, Wuhan, China d Key Laboratory of Mountain Hazards and Earth Surface Process, Institute of Mountain, Hazards and Environment, Chinese Academy of Sciences, Chengdu, China abstract article info Article history: Received 5 September 2014 Received in revised form 30 November 2014 Accepted 26 December 2014 Available online xxxx Keywords: Statistical and probabilistic analyses Gaussian copula approach Debris flow Field data Impact pressure Discharge Debris flows often cause catastrophic damage to communities in the downstream area, by direct impact and deposition. Theoretical predictions of impact pressure and volume of discharge, however, still remain very challenging, mainly due to inadequate understanding of the complex problems and limited field data at the local scale. In this study, the maximum impact pressure (P max ) and total discharge (Q total ) of 139 debris flow events that occurred during 1961 and 2000 in the “debris museum” of China (i.e., the Jiangjia Ravine) are reported and interpreted with statistical tests and probabilistic analyses. Four common probabilistic models (Normal, Lognormal, Weibull and Gamma distributions) are used to simulate the distributions of P max and Q total . The level of fitting of each model is assessed by performing two quantity-based statistic goodness-of-fit tests (Chi-square and Kolmogorov–Smirnov tests). The field data show that during the period from 1961 to 2000, the maximum values of P max and Q total are 744 kPa and 1,751,537 m 3 , respectively. It is suggested by the goodness-of-fit tests that the Weibull distribution is the only model (among the four probabilistic models) that is able to capture the distributions of P max and Q total of both surge and continuous flows. Using the verified Weibull distributions and Gaussian copula approach, univariate and bivariate exceedance probability charts con- sidering P max and Q total are developed. Regression models between P max and Q total are also established. © 2014 Elsevier B.V. All rights reserved. 1. Introduction Catastrophic hazards due to debris flow are frequently encountered in mountainous areas all over the world. Debris flow imposes destruc- tive threats to infrastructures (transportation systems, buildings and lifelines) and inhabitants in the downstream areas, by direct impact and sediment deposition (Ngadisih et al., 2014). China is a country in which debris flows are frequently encountered. According to Kang et al. (2004), approximately 45% of the area of China (10 6 km 2 ) has suf- fered from debris flows. For example, the recent destructive hazard that occurred in Southern China (Zhouqu, in Gansu Province) in 2010 claimed 1467 lives and buried two villages. Despite the hazardous con- sequences of debris flows, many infrastructures still need to be con- structed in mountainous areas, due to scarcity of usable land. In order to protect the infrastructures and people from debris flows, one common solution is to construct either rigid or flexible barriers above the downstream area. Rational design of any barrier system large- ly depends on reasonable estimations of the maximum impact pressure (P max ) and total discharge (Q total ) induced by a debris flow. In addition to their importance in engineering design, P max and Q total are also two key elements to gauge the risk of the debris flow. Currently, it is still challenging to predict P max and Q total (Iverson, 1997; Eidsvig et al., 2014; Gartner et al., 2014), due to limited understanding of the complex behaviour of debris flows (Chang et al., 2011; Hu et al., 2011). In addi- tion, there is a lack of field data of P max and Q total at the local scale (Liang et al., 2012). As a result, the key scope of this study is to present and analyse the statistics of P max and Q total from 139 debris flow events that occurred in the Jiangjia Ravine, China. Statistical analyses on the field data are carried out by simulating the distributions of P max and Q total using four common probabilistic models (Normal, Lognormal, Weibull and Gamma distributions). The level of fitting of each model is assessed by performing two statistical goodness-of-fit tests (Chi-square and Kolmo- gorov–Smirnov tests). Probabilistic models which are not rejected by the goodness-of-fit tests are then used to develop exceedance probability charts, for the estimation of P max and Q total . Not only does this study aim at developing site-specific semi-empirical equations and design charts for local authorities, but it is also intended to shed light on the natural variability of debris flow from a statistical perspective. Engineering Geology xxx (2014) xxx–xxx ⁎ Corresponding author. E-mail address: [email protected] (Z.J. Cao). ENGEO-03943; No of Pages 13 http://dx.doi.org/10.1016/j.enggeo.2014.12.011 0013-7952/© 2014 Elsevier B.V. All rights reserved. Contents lists available at ScienceDirect Engineering Geology journal homepage: www.elsevier.com/locate/enggeo Please cite this article as: Hong, Y., et al., Statistical and probabilistic analyses of impact pressure and discharge of debris flow from 139 events during 1961 and 2000 at Jiangjia Ravine, China, Eng. Geol. (2014), http://dx.doi.org/10.1016/j.enggeo.2014.12.011
Transcript of Statistical and probabilistic analyses of impact pressure...
Engineering Geology xxx (2014) xxx–xxx
ENGEO-03943; No of Pages 13
Contents lists available at ScienceDirect
Engineering Geology
j ourna l homepage: www.e lsev ie r .com/ locate /enggeo
Technical Note
Statistical and probabilistic analyses of impact pressure and discharge of debris flowfrom 139 events during 1961 and 2000 at Jiangjia Ravine, China
Y. Hong a, J.P. Wang b, D.Q. Li c, Z.J. Cao c,⁎, C.W.W. Ng b, P. Cui d
a College of Civil Engineering and Architecture, Zhejiang University, Hangzhou, Chinab Department of Civil and Environmental Engineering, Hong Kong University of Science and Technology, Kowloon, HKSAR, Chinac State Key Laboratory of Water Resources and Hydropower Engineering Science, School of Water Resources and Hydropower Engineering, Wuhan University, Wuhan, Chinad Key Laboratory of Mountain Hazards and Earth Surface Process, Institute of Mountain, Hazards and Environment, Chinese Academy of Sciences, Chengdu, China
⁎ Corresponding author.E-mail address: [email protected] (Z.J. Cao).
http://dx.doi.org/10.1016/j.enggeo.2014.12.0110013-7952/© 2014 Elsevier B.V. All rights reserved.
Please cite this article as: Hong, Y., et al., Staduring 1961 and 2000 at Jiangjia Ravine, Chi
a b s t r a c t
a r t i c l e i n f oArticle history:Received 5 September 2014Received in revised form 30 November 2014Accepted 26 December 2014Available online xxxx
Keywords:Statistical and probabilistic analysesGaussian copula approachDebris flowField dataImpact pressureDischarge
Debris flows often cause catastrophic damage to communities in the downstream area, by direct impact anddeposition. Theoretical predictions of impact pressure and volume of discharge, however, still remain verychallenging, mainly due to inadequate understanding of the complex problems and limited field data at thelocal scale. In this study, the maximum impact pressure (Pmax) and total discharge (Qtotal) of 139 debris flowevents that occurred during 1961 and 2000 in the “debris museum” of China (i.e., the Jiangjia Ravine) arereported and interpreted with statistical tests and probabilistic analyses. Four common probabilistic models(Normal, Lognormal, Weibull and Gamma distributions) are used to simulate the distributions of Pmax and Qtotal.The level of fitting of each model is assessed by performing two quantity-based statistic goodness-of-fit tests(Chi-square and Kolmogorov–Smirnov tests). The field data show that during the period from 1961 to 2000,the maximum values of Pmax and Qtotal are 744 kPa and 1,751,537 m3, respectively. It is suggested by thegoodness-of-fit tests that the Weibull distribution is the only model (among the four probabilistic models) thatis able to capture the distributions of Pmax and Qtotal of both surge and continuous flows. Using the verifiedWeibull distributions and Gaussian copula approach, univariate and bivariate exceedance probability charts con-sidering Pmax and Qtotal are developed. Regression models between Pmax and Qtotal are also established.
© 2014 Elsevier B.V. All rights reserved.
1. Introduction
Catastrophic hazards due to debris flow are frequently encounteredin mountainous areas all over the world. Debris flow imposes destruc-tive threats to infrastructures (transportation systems, buildings andlifelines) and inhabitants in the downstream areas, by direct impactand sediment deposition (Ngadisih et al., 2014). China is a country inwhich debris flows are frequently encountered. According to Kanget al. (2004), approximately 45% of the area of China (106 km2) has suf-fered from debris flows. For example, the recent destructive hazard thatoccurred in Southern China (Zhouqu, in Gansu Province) in 2010claimed 1467 lives and buried two villages. Despite the hazardous con-sequences of debris flows, many infrastructures still need to be con-structed in mountainous areas, due to scarcity of usable land.
In order to protect the infrastructures and people from debris flows,one common solution is to construct either rigid or flexible barriersabove thedownstreamarea. Rational design of any barrier system large-ly depends on reasonable estimations of themaximum impact pressure
tistical and probabilistic analyna, Eng. Geol. (2014), http://d
(Pmax) and total discharge (Qtotal) induced by a debris flow. In additionto their importance in engineering design, Pmax and Qtotal are also twokey elements to gauge the risk of the debris flow. Currently, it is stillchallenging to predict Pmax and Qtotal (Iverson, 1997; Eidsvig et al.,2014; Gartner et al., 2014), due to limited understanding of the complexbehaviour of debris flows (Chang et al., 2011; Hu et al., 2011). In addi-tion, there is a lack of field data of Pmax and Qtotal at the local scale(Liang et al., 2012).
As a result, the key scope of this study is to present and analyse thestatistics of Pmax and Qtotal from 139 debris flow events that occurredin the Jiangjia Ravine, China. Statistical analyses on the field data arecarried out by simulating the distributions of Pmax and Qtotal using fourcommon probabilistic models (Normal, Lognormal, Weibull andGamma distributions). The level of fitting of each model is assessed byperforming two statistical goodness-of-fit tests (Chi-square and Kolmo-gorov–Smirnov tests). Probabilistic models which are not rejected bythe goodness-of-fit tests are then used to develop exceedanceprobability charts, for the estimation of Pmax and Qtotal. Not onlydoes this study aim at developing site-specific semi-empiricalequations and design charts for local authorities, but it is also intendedto shed light on the natural variability of debris flow from a statisticalperspective.
ses of impact pressure and discharge of debris flow from 139 eventsx.doi.org/10.1016/j.enggeo.2014.12.011
Jiangjia Ravine
(a)
Note: each number denotes elevation above sea level (unit: m)(b)
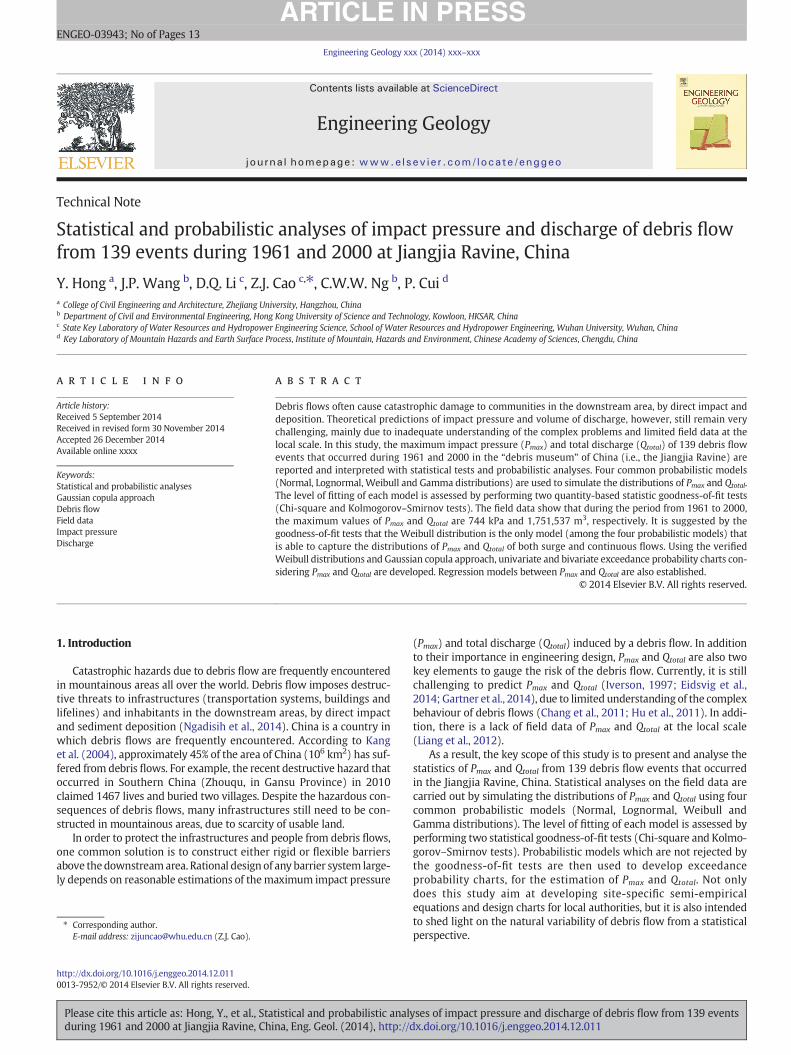
Fig. 1. (a) Spatial distribution of debris flow hazards in China (modified from Liang et al., 2012); (b) Plan view of Jiangjia Ravine (Cui et al., 2005).
2 Y. Hong et al. / Engineering Geology xxx (2014) xxx–xxx
Please cite this article as: Hong, Y., et al., Statistical and probabilistic analyses of impact pressure and discharge of debris flow from 139 eventsduring 1961 and 2000 at Jiangjia Ravine, China, Eng. Geol. (2014), http://dx.doi.org/10.1016/j.enggeo.2014.12.011
3Y. Hong et al. / Engineering Geology xxx (2014) xxx–xxx
2. Field measurement in Jiangjia Ravine, China
2.1. Study area
Debris flows in China are very active in the southwesternmountain-ous regions, particularly in the Dongchuan area of Yunan Province.Within the Dongchuan area, debris flows in the Jiangjia Ravine areinfamous for their high frequency of occurrence (up to 28 times peryear) and great damage to local infrastructures. Accordingly, the ravineis widely regarded as the “debris museum” in China. Fig. 1(a) shows thelocation of the study area (i.e., Jiangjia Ravine in Yunan Province),whichis classified as one of the few high risk regions suffering from debrisflows (Liang et al., 2012). As shown in Fig. 1(b), the Jiangjia Ravine,which has an area of 48.6 km2, is positioned in the Xiaojiang fault,which is characterised as intense tectonism (Cui et al., 2005).
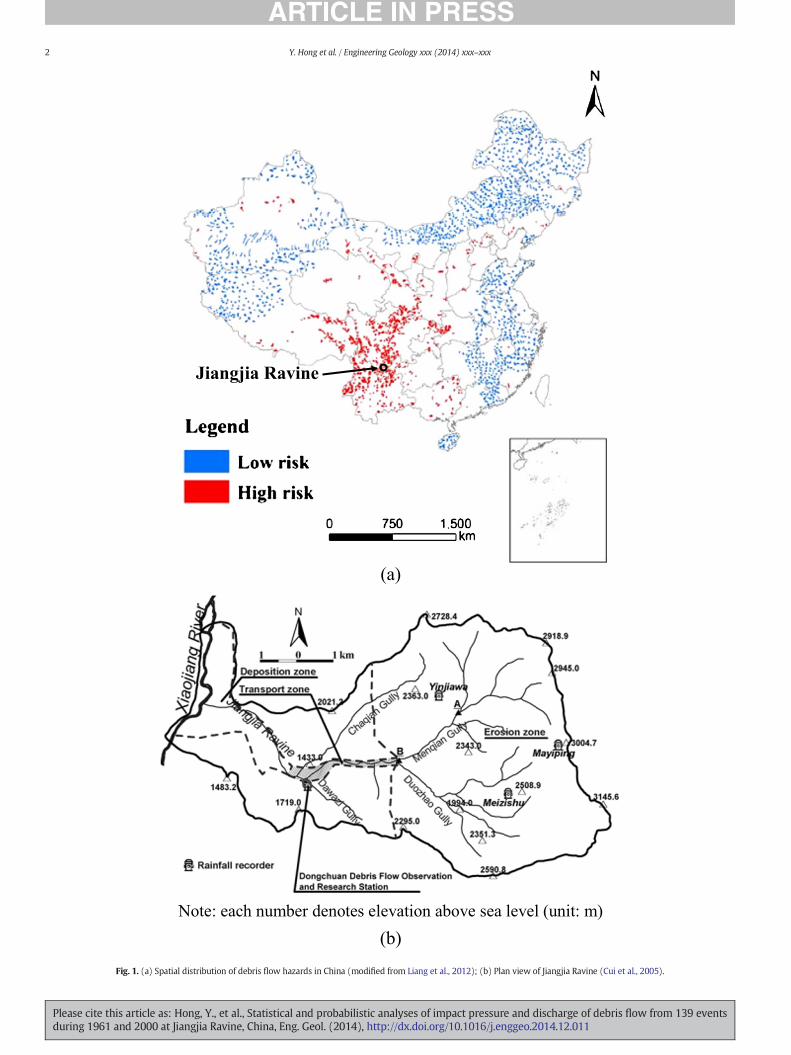
Debris flows in this region mostly occur during rainy seasons (fromJune to September), with more than 80% of the annual rainfall (rangingfrom 700 to 1200mm) in this period (Hu et al., 2011). Triggered by theheavy rainfalls, the exposed materials (i.e., highly fractured rocks, weaksandstone and slate, colluvium and mantle rock) in the Jiangjia Ravinewere eroded and mixed as clastic detritus, forming the main source ofthe debris flow (Zhou and Ng, 2010). Fig. 2 shows the typical particlesize distributions of the debris flow in the study area (Cui et al., 2005;Kang et al., 2006). Previous field studies showed that the bulk densityof the debris flows was in the range from 1600 to 2300 kg/m3, andthat the volumetric solid fraction was up to 85% (Li and Yuan, 1983;Zhang, 1993; Cui et al., 2005).
2.2. Monitoring station and data collection
In view of the uniqueness of the Jiangjia Ravine, a permanent moni-toring station (i.e., Dongchuan Debris Flow Observation and ResearchStation, or DDFORS) was set up near the downstream area of the ravine(N26°14′, E103°08′) in the early 1960s, by the Institute of MountainHazards and Environment Chinese Academy of Science (Cui et al.,2005). This is the only semi-automatic field observation stationinvestigating debris flow in China (Zhou and Ng, 2010).
Themonitoring programmeof the station records the channel width(W), thickness of debris flow (h), density (ρ) of each surge, duration (t)of each surge and front velocity (v). The first two parameters (W and h)were directly measured at the site, while ρ was obtained by laboratorytests on samples taken from each debris flow. To obtain t and v of adebris flow, two monitoring sections along a straight channel were
Fig. 2. Particle-size distribution of the natural debris flows at the Dongchuan Debris flowObservation and Research Station, China (Zhou and Ng, 2010).
Please cite this article as: Hong, Y., et al., Statistical and probabilistic analyduring 1961 and 2000 at Jiangjia Ravine, China, Eng. Geol. (2014), http://d
selected. With a known distance (L) between the two monitoringsections and the measured duration t (by a stopwatch) for the surgefront to pass through L, the mean front velocity v can be calculated(i.e., v = L / t).
Based on the measurements, two key parameters of a debris flow,i.e., impact pressure (P) and volumeof discharge (Q), can be determinedas P= ρv2 (according to hydrodynamics) and Q= LWh. All field data ofdebris flows in the Jiangjia Ravine from 1961 to 2000 are summarisedand reported in three documents by Zhang and Xiong (1997), Kanget al. (2006, 2007). During the forty years, there have been about 247debris flow events, 56% (i.e., 139 events) of which were recorded bythe monitoring station and presented in the three documents.According to the field data, each flow usually consists of dozens ofsurge flows and a few continuous flows. A surge flow is defined as aflow having obvious breaks between two continual surges, or flowswith relatively short duration, while a continuous flow refers to aflow lasting for a relatively long duration and producing a largeamount of discharge (Zhang and Xiong, 1997; Kang et al., 2006,2007). For each debris flow event, only themaximum value of impactpressure (Pmax) and the total amount of the discharge (Qtotal) of thesurge and continuous flows are presented in this study, to representthe worst case scenario. To bemore specific, the database reported inthis study includes a total number of 278 data points for surge flows(139 data for both Qtotal and Pmax) and 236 for continuous flows (118data for both Qtotal and Pmax). All the measured data for surge andcontinuous flows are summarised in Tables A.1 and A.2, respectively(see Appendix A).
3. Statistical analysis
3.1. Probability models
To analyse the observed distribution of the maximum impactpressures (Pmax) and total discharges (Qtotal) under a probabilisticframework, four commonly used probability models (i.e., Normal,Lognormal, Gamma and Weibull distributions) are adopted in thisstudy. It is worth noting that before the probabilistic simulation, therewas no prior knowledge regarding the suitability of each model forpredicting the distributions of Pmax and Qtotal. The parameters for eachmodel were converted from the statistics (i.e., mean and standarddeviation) of Pmax and Qtotal based on the 139 debris flow events in theJiangjia Ravine.
3.2. Statistical goodness-of-fit tests
To quantitatively access whether the four models can satisfactorilysimulate the distributions of Pmax and Qtotal in the Jiangjia Ravine, twoquantity-based statistical goodness-of-fit tests (i.e., Chi-square andKolmogorov–Smirnov tests) are carried out. In the Chi-squaregoodness-of-fit test, the measured data are sorted into k-intervals.Subsequently, the difference between the measured frequencies (ni)and the theoretical frequencies (ei) by a selected probability model
was quantified by calculating χ2 (∑ki−1
ni−eið Þ2ei
), which should
approach the Chi-square distribution (Ang and Tang, 2007; Fentonand Griffiths, 2008). Once the calculated χ2 is less than a critical valuefollowing the Chi-square distribution at a given level of significance(usually 5% in the statistical test), the selected probability model maybe suitable to model the variables (i.e., Pmax and Qtotal in this study)examined, and vice versa. It is well recognised that subjectivity isinvolved in the Chi-square test for selecting a bin size of the histograms,although the influence of the bin size is usually insignificant (Wanget al., 2011, 2014). The Kolmogorov–Smirnov test, in which the subjec-tivity in determining bin size is eliminated, is therefore also performedin this study. In a Kolmogorov–Smirnov test, the maximum differences
ses of impact pressure and discharge of debris flow from 139 eventsx.doi.org/10.1016/j.enggeo.2014.12.011
4 Y. Hong et al. / Engineering Geology xxx (2014) xxx–xxx
(Dn) between the observed and the theoretical cumulative probabilitiesover the entire range are calculated and compared to a critical value,which can be readily determined based on the samples size and thelevel of significance used. Any selected model with a Dn less than thecritical value is considered as acceptable for the simulation, and viceversa. In this study, a level of significance of 5% was adopted in bothChi-square and Kolmogorov–Smirnov tests.
The aforementioned probability analyses and statistical goodness-of-fit tests are performedwith anExcel Spreadsheet,which is developedin-house.
(a)
4. Interpretation of the measured results
4.1. Statistics of the maximum impact pressure and total discharge
Based on the collected data (i.e., Pmax and Qtotal) of the surge andcontinuous flows from the 139 events, statistics such asmean, standarddeviations (SD) and coefficient of variation (COV) can be derived (Angand Tang, 2007; Wang and Cao, 2013; Jiang et al., 2014a, b; Li et al.,2014).With themean and SD, the parameters of the four selected prob-abilistic models can be calculated. Table 1 summarises the statistics ofPmax andQtotal of the 139 debrisflow events, aswell as themodel param-eters calculated with the statistics. It is worth noting that both methodof moments (MM) and maximum likelihood method (MLM) wereattempted to estimate the distributions parameters of Pmax and Qtotal.Similar distributions were resulted, based on the distribution parame-ters obtained from MM and MLM. Considering MM is relatively simpleand intuitive as compared with MLM (Fenton and Griffiths, 2008), alldistribution parameters in this study (see Table 1) are calculatedbased on MM.
It can be seen that the COVs of Pmax of the surge and continuousflows are 0.5 and 0.8, respectively. Comparatively, the data of Qtotal
show a much larger variation, with COV equal to 1.0 and 1.7 for thesurge and continuous flows, respectively. This is probably becausePmax is obtained from one single flow. While each Qtotal is the sum ofdischarge of either surge flows or continuous flows in each debrisflow event. Thus, the former is likely to involve less uncertainty(which results in smaller COV) than the latter. As far as flow type isconcerned, Qtotal and Pmax of the continuous flow exhibit larger naturalvariability (as indicated by COV) than those of the surge flow. Compar-isons between the two types of flows also show that larger Pmax
(maximised at 744 kPa) is induced by surge flows, as compared withthat (maximised at 434 kPa) caused by the continuous flows. Although
Table 1Statistics of the maximum impact pressure and total discharge from 1960 to 2000 inJiangjia Ravine, China.
Parameter Value
Maximum impactpressure Pmax (kPa)
Total discharge QTotal
(m3)
Surgeflow
Continuousflow
Surge flow Continuousflow
Mean 221 114 240,447 161,169Standard deviation (SD) 102 96 248,490 281,331Coefficient of variation 0.5 0.8 1.0 1.7Maximum 744 434 1,260,549 1,751,537Minimum 31 14 166 269Mean, SD of Lognormaldistribution
5.3, 0.4 4.5, 0.7 12.0, 0.9 11.3, 1.2
α, β for Weibull distribution* 2.3,249.4
1.2, 120 1.0,237,000
0.6,107,918
α, β for Gamma distribution* 4.7, 46.8 1.4, 81.5 1.0,256,803
0.3,491,083
*α = shape parameter; β = scale parameter.
Please cite this article as: Hong, Y., et al., Statistical and probabilistic analduring 1961 and 2000 at Jiangjia Ravine, China, Eng. Geol. (2014), http://d
the mean value of Qtotal for the surge flow (240,447 m3) is larger thanthat for the continuous flow (161,169 m3), the maximum value of Qtotal
for the surge flow (1,260,549m3) is smaller than that for the continuousflow (1,751,537 m3).
4.2. Characteristics of the maximum impact pressure
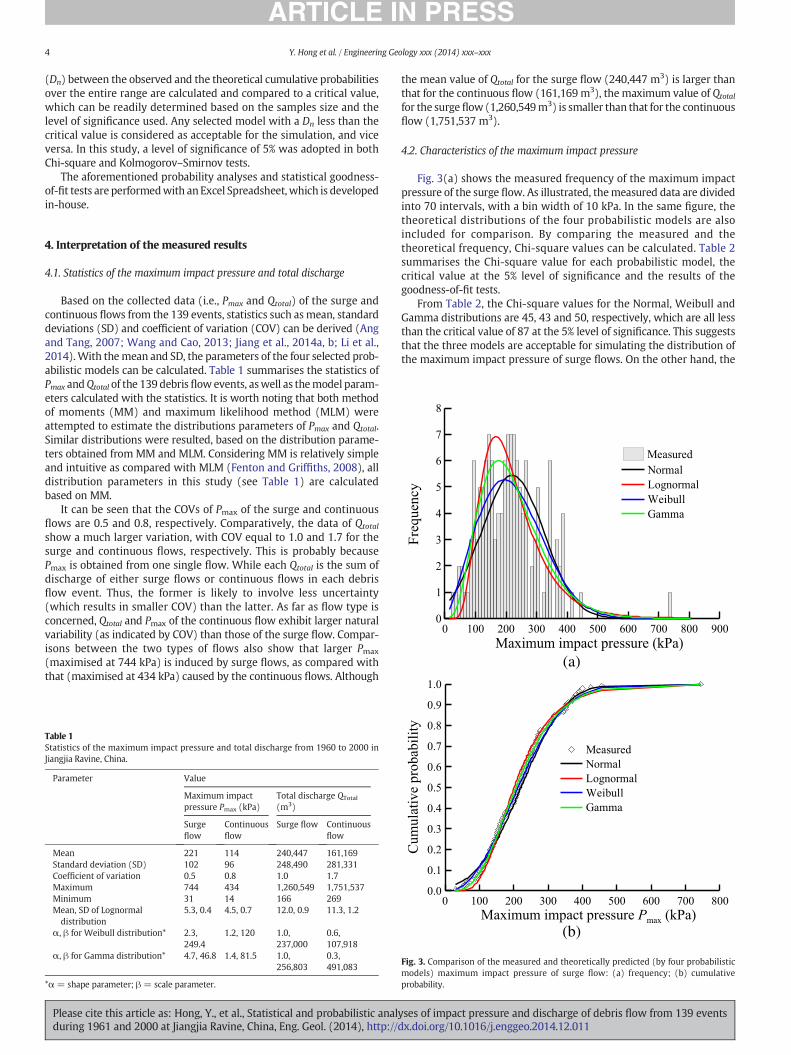
Fig. 3(a) shows the measured frequency of the maximum impactpressure of the surge flow. As illustrated, themeasured data are dividedinto 70 intervals, with a bin width of 10 kPa. In the same figure, thetheoretical distributions of the four probabilistic models are alsoincluded for comparison. By comparing the measured and thetheoretical frequency, Chi-square values can be calculated. Table 2summarises the Chi-square value for each probabilistic model, thecritical value at the 5% level of significance and the results of thegoodness-of-fit tests.
From Table 2, the Chi-square values for the Normal, Weibull andGamma distributions are 45, 43 and 50, respectively, which are all lessthan the critical value of 87 at the 5% level of significance. This suggeststhat the three models are acceptable for simulating the distribution ofthe maximum impact pressure of surge flows. On the other hand, the
(b)
Fig. 3. Comparison of the measured and theoretically predicted (by four probabilisticmodels) maximum impact pressure of surge flow: (a) frequency; (b) cumulativeprobability.
yses of impact pressure and discharge of debris flow from 139 eventsx.doi.org/10.1016/j.enggeo.2014.12.011
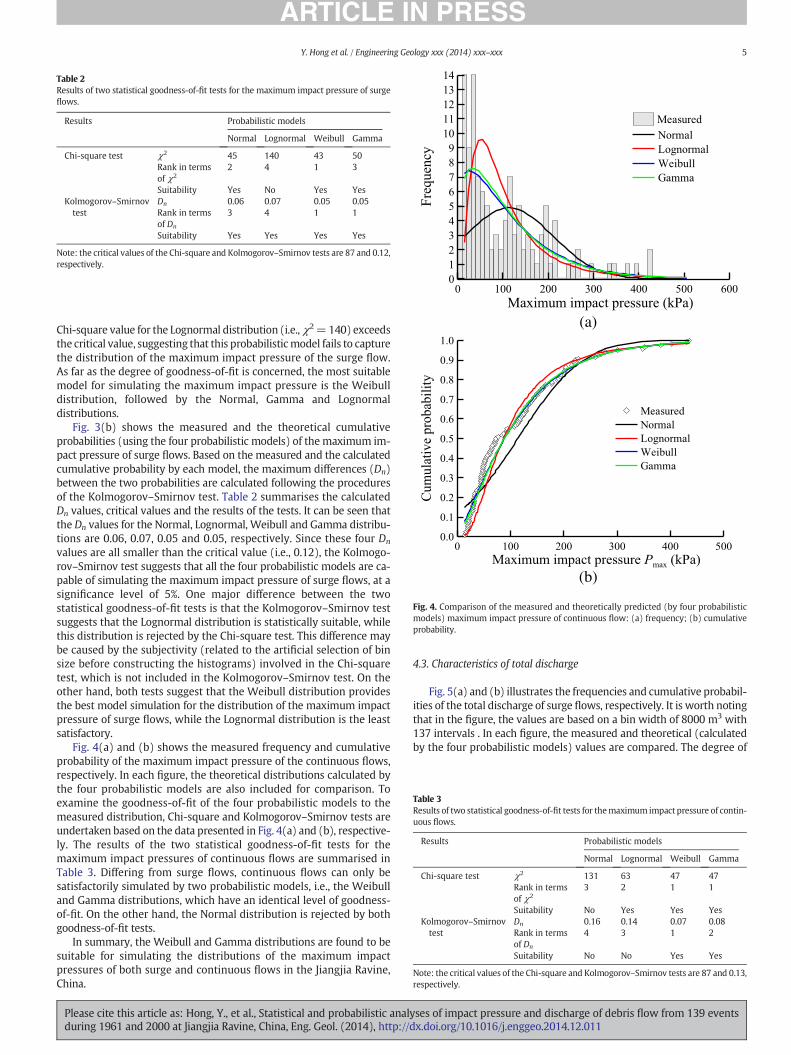
Table 2Results of two statistical goodness-of-fit tests for the maximum impact pressure of surgeflows.
Results Probabilistic models
Normal Lognormal Weibull Gamma
Chi-square test χ2 45 140 43 50Rank in termsof χ2
2 4 1 3
Suitability Yes No Yes YesKolmogorov–Smirnovtest
Dn 0.06 0.07 0.05 0.05Rank in termsof Dn
3 4 1 1
Suitability Yes Yes Yes Yes
Note: the critical values of the Chi-square and Kolmogorov–Smirnov tests are 87 and 0.12,respectively.
(b)
(a)
Fig. 4. Comparison of the measured and theoretically predicted (by four probabilisticmodels) maximum impact pressure of continuous flow: (a) frequency; (b) cumulativeprobability.
Table 3Results of two statistical goodness-of-fit tests for themaximum impact pressure of contin-uous flows.
Results Probabilistic models
Normal Lognormal Weibull Gamma
Chi-square test χ2 131 63 47 47Rank in termsof χ2
3 2 1 1
Suitability No Yes Yes YesKolmogorov–Smirnovtest
Dn 0.16 0.14 0.07 0.08Rank in termsof Dn
4 3 1 2
Suitability No No Yes Yes
Note: the critical values of the Chi-square and Kolmogorov–Smirnov tests are 87 and 0.13,respectively.
5Y. Hong et al. / Engineering Geology xxx (2014) xxx–xxx
Chi-square value for the Lognormal distribution (i.e.,χ2=140) exceedsthe critical value, suggesting that this probabilisticmodel fails to capturethe distribution of the maximum impact pressure of the surge flow.As far as the degree of goodness-of-fit is concerned, the most suitablemodel for simulating the maximum impact pressure is the Weibulldistribution, followed by the Normal, Gamma and Lognormaldistributions.
Fig. 3(b) shows the measured and the theoretical cumulativeprobabilities (using the four probabilistic models) of the maximum im-pact pressure of surge flows. Based on the measured and the calculatedcumulative probability by each model, the maximum differences (Dn)between the two probabilities are calculated following the proceduresof the Kolmogorov–Smirnov test. Table 2 summarises the calculatedDn values, critical values and the results of the tests. It can be seen thatthe Dn values for the Normal, Lognormal, Weibull and Gamma distribu-tions are 0.06, 0.07, 0.05 and 0.05, respectively. Since these four Dn
values are all smaller than the critical value (i.e., 0.12), the Kolmogo-rov–Smirnov test suggests that all the four probabilistic models are ca-pable of simulating the maximum impact pressure of surge flows, at asignificance level of 5%. One major difference between the twostatistical goodness-of-fit tests is that the Kolmogorov–Smirnov testsuggests that the Lognormal distribution is statistically suitable, whilethis distribution is rejected by the Chi-square test. This difference maybe caused by the subjectivity (related to the artificial selection of binsize before constructing the histograms) involved in the Chi-squaretest, which is not included in the Kolmogorov–Smirnov test. On theother hand, both tests suggest that the Weibull distribution providesthe best model simulation for the distribution of the maximum impactpressure of surge flows, while the Lognormal distribution is the leastsatisfactory.
Fig. 4(a) and (b) shows the measured frequency and cumulativeprobability of the maximum impact pressure of the continuous flows,respectively. In each figure, the theoretical distributions calculated bythe four probabilistic models are also included for comparison. Toexamine the goodness-of-fit of the four probabilistic models to themeasured distribution, Chi-square and Kolmogorov–Smirnov tests areundertaken based on the data presented in Fig. 4(a) and (b), respective-ly. The results of the two statistical goodness-of-fit tests for themaximum impact pressures of continuous flows are summarised inTable 3. Differing from surge flows, continuous flows can only besatisfactorily simulated by two probabilistic models, i.e., the Weibulland Gamma distributions, which have an identical level of goodness-of-fit. On the other hand, the Normal distribution is rejected by bothgoodness-of-fit tests.
In summary, the Weibull and Gamma distributions are found to besuitable for simulating the distributions of the maximum impactpressures of both surge and continuous flows in the Jiangjia Ravine,China.
Please cite this article as: Hong, Y., et al., Statistical and probabilistic analyduring 1961 and 2000 at Jiangjia Ravine, China, Eng. Geol. (2014), http://d
4.3. Characteristics of total discharge
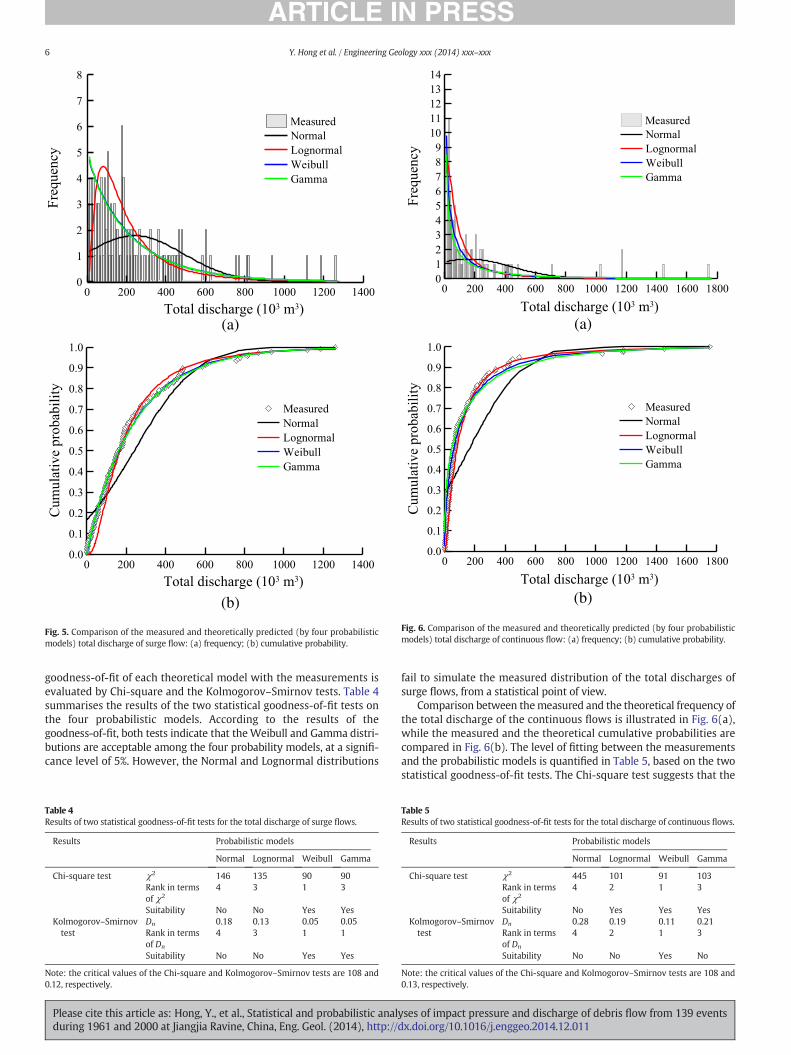
Fig. 5(a) and (b) illustrates the frequencies and cumulative probabil-ities of the total discharge of surge flows, respectively. It is worth notingthat in the figure, the values are based on a bin width of 8000 m3 with137 intervals . In each figure, the measured and theoretical (calculatedby the four probabilistic models) values are compared. The degree of
ses of impact pressure and discharge of debris flow from 139 eventsx.doi.org/10.1016/j.enggeo.2014.12.011
(a)
(b)
Fig. 5. Comparison of the measured and theoretically predicted (by four probabilisticmodels) total discharge of surge flow: (a) frequency; (b) cumulative probability.
(a)
(b)
Fig. 6. Comparison of the measured and theoretically predicted (by four probabilisticmodels) total discharge of continuous flow: (a) frequency; (b) cumulative probability.
6 Y. Hong et al. / Engineering Geology xxx (2014) xxx–xxx
goodness-of-fit of each theoretical model with the measurements isevaluated by Chi-square and the Kolmogorov–Smirnov tests. Table 4summarises the results of the two statistical goodness-of-fit tests onthe four probabilistic models. According to the results of thegoodness-of-fit, both tests indicate that theWeibull and Gamma distri-butions are acceptable among the four probability models, at a signifi-cance level of 5%. However, the Normal and Lognormal distributions
Table 4Results of two statistical goodness-of-fit tests for the total discharge of surge flows.
Results Probabilistic models
Normal Lognormal Weibull Gamma
Chi-square test χ2 146 135 90 90Rank in termsof χ2
4 3 1 3
Suitability No No Yes YesKolmogorov–Smirnovtest
Dn 0.18 0.13 0.05 0.05Rank in termsof Dn
4 3 1 1
Suitability No No Yes Yes
Note: the critical values of the Chi-square and Kolmogorov–Smirnov tests are 108 and0.12, respectively.
Please cite this article as: Hong, Y., et al., Statistical and probabilistic analduring 1961 and 2000 at Jiangjia Ravine, China, Eng. Geol. (2014), http://d
fail to simulate the measured distribution of the total discharges ofsurge flows, from a statistical point of view.
Comparison between themeasured and the theoretical frequency ofthe total discharge of the continuous flows is illustrated in Fig. 6(a),while the measured and the theoretical cumulative probabilities arecompared in Fig. 6(b). The level of fitting between the measurementsand the probabilistic models is quantified in Table 5, based on the twostatistical goodness-of-fit tests. The Chi-square test suggests that the
Table 5Results of two statistical goodness-of-fit tests for the total discharge of continuous flows.
Results Probabilistic models
Normal Lognormal Weibull Gamma
Chi-square test χ2 445 101 91 103Rank in termsof χ2
4 2 1 3
Suitability No Yes Yes YesKolmogorov–Smirnovtest
Dn 0.28 0.19 0.11 0.21Rank in termsof Dn
4 2 1 3
Suitability No No Yes No
Note: the critical values of the Chi-square and Kolmogorov–Smirnov tests are 108 and0.13, respectively.
yses of impact pressure and discharge of debris flow from 139 eventsx.doi.org/10.1016/j.enggeo.2014.12.011
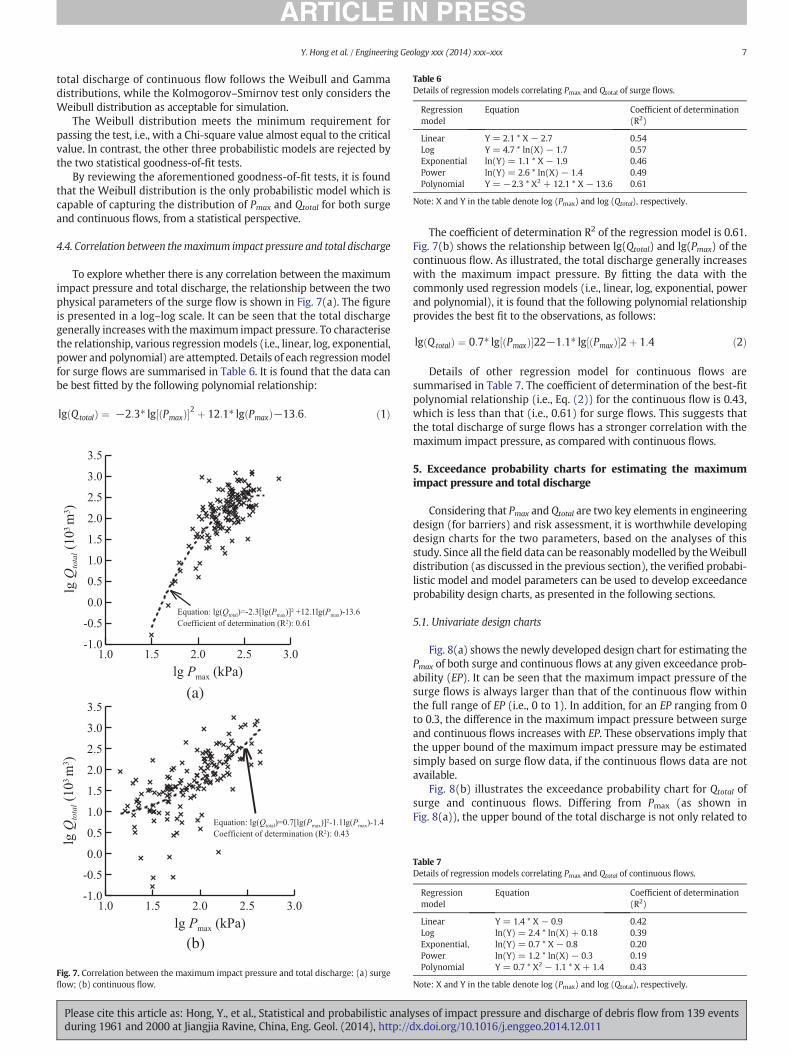
Table 6Details of regression models correlating Pmax and Qtotal of surge flows.
Regressionmodel
Equation Coefficient of determination(R2)
Linear Y = 2.1 * X − 2.7 0.54Log Y = 4.7 * ln(X) − 1.7 0.57Exponential ln(Y) = 1.1 * X − 1.9 0.46Power ln(Y) = 2.6 * ln(X) − 1.4 0.49Polynomial Y = −2.3 * X2 + 12.1 * X − 13.6 0.61
Note: X and Y in the table denote log (Pmax) and log (Qtotal), respectively.
7Y. Hong et al. / Engineering Geology xxx (2014) xxx–xxx
total discharge of continuous flow follows the Weibull and Gammadistributions, while the Kolmogorov–Smirnov test only considers theWeibull distribution as acceptable for simulation.
The Weibull distribution meets the minimum requirement forpassing the test, i.e., with a Chi-square value almost equal to the criticalvalue. In contrast, the other three probabilistic models are rejected bythe two statistical goodness-of-fit tests.
By reviewing the aforementioned goodness-of-fit tests, it is foundthat the Weibull distribution is the only probabilistic model which iscapable of capturing the distribution of Pmax and Qtotal for both surgeand continuous flows, from a statistical perspective.
4.4. Correlation between themaximum impact pressure and total discharge
To explore whether there is any correlation between the maximumimpact pressure and total discharge, the relationship between the twophysical parameters of the surge flow is shown in Fig. 7(a). The figureis presented in a log–log scale. It can be seen that the total dischargegenerally increaseswith themaximum impact pressure. To characterisethe relationship, various regressionmodels (i.e., linear, log, exponential,power and polynomial) are attempted. Details of each regressionmodelfor surge flows are summarised in Table 6. It is found that the data canbe best fitted by the following polynomial relationship:
lg Qtotalð Þ ¼ −2:3� lg Pmaxð Þ½ �2 þ 12:1� lg Pmaxð Þ−13:6: ð1Þ
(a)
(b)
Fig. 7. Correlation between the maximum impact pressure and total discharge: (a) surgeflow; (b) continuous flow.
Please cite this article as: Hong, Y., et al., Statistical and probabilistic analyduring 1961 and 2000 at Jiangjia Ravine, China, Eng. Geol. (2014), http://d
The coefficient of determination R2 of the regression model is 0.61.Fig. 7(b) shows the relationship between lg(Qtotal) and lg(Pmax) of thecontinuous flow. As illustrated, the total discharge generally increaseswith the maximum impact pressure. By fitting the data with thecommonly used regression models (i.e., linear, log, exponential, powerand polynomial), it is found that the following polynomial relationshipprovides the best fit to the observations, as follows:
lg Qtotalð Þ ¼ 0:7� lg Pmaxð Þ½ �22−1:1� lg Pmaxð Þ½ �2þ 1:4 ð2Þ
Details of other regression model for continuous flows aresummarised in Table 7. The coefficient of determination of the best-fitpolynomial relationship (i.e., Eq. (2)) for the continuous flow is 0.43,which is less than that (i.e., 0.61) for surge flows. This suggests thatthe total discharge of surge flows has a stronger correlation with themaximum impact pressure, as compared with continuous flows.
5. Exceedance probability charts for estimating the maximumimpact pressure and total discharge
Considering that Pmax and Qtotal are two key elements in engineeringdesign (for barriers) and risk assessment, it is worthwhile developingdesign charts for the two parameters, based on the analyses of thisstudy. Since all the field data can be reasonablymodelled by theWeibulldistribution (as discussed in the previous section), the verified probabi-listic model and model parameters can be used to develop exceedanceprobability design charts, as presented in the following sections.
5.1. Univariate design charts
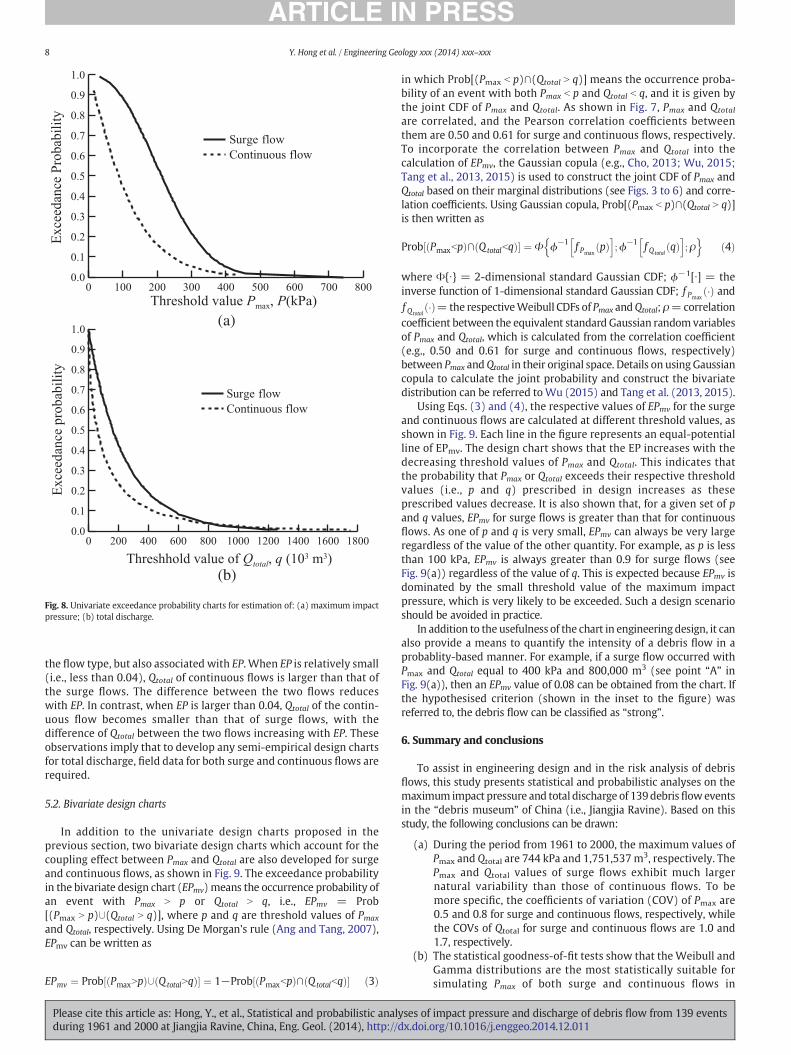
Fig. 8(a) shows the newly developed design chart for estimating thePmax of both surge and continuous flows at any given exceedance prob-ability (EP). It can be seen that the maximum impact pressure of thesurge flows is always larger than that of the continuous flow withinthe full range of EP (i.e., 0 to 1). In addition, for an EP ranging from 0to 0.3, the difference in the maximum impact pressure between surgeand continuous flows increases with EP. These observations imply thatthe upper bound of the maximum impact pressure may be estimatedsimply based on surge flow data, if the continuous flows data are notavailable.
Fig. 8(b) illustrates the exceedance probability chart for Qtotal ofsurge and continuous flows. Differing from Pmax (as shown inFig. 8(a)), the upper bound of the total discharge is not only related to
Table 7Details of regression models correlating Pmax and Qtotal of continuous flows.
Regressionmodel
Equation Coefficient of determination(R2)
Linear Y = 1.4 * X − 0.9 0.42Log ln(Y) = 2.4 * ln(X) + 0.18 0.39Exponential, ln(Y) = 0.7 * X − 0.8 0.20Power ln(Y) = 1.2 * ln(X) − 0.3 0.19Polynomial Y = 0.7 * X2 − 1.1 * X + 1.4 0.43
Note: X and Y in the table denote log (Pmax) and log (Qtotal), respectively.
ses of impact pressure and discharge of debris flow from 139 eventsx.doi.org/10.1016/j.enggeo.2014.12.011
(a)
(b)
Fig. 8. Univariate exceedance probability charts for estimation of: (a) maximum impactpressure; (b) total discharge.
8 Y. Hong et al. / Engineering Geology xxx (2014) xxx–xxx
the flow type, but also associated with EP. When EP is relatively small(i.e., less than 0.04), Qtotal of continuous flows is larger than that ofthe surge flows. The difference between the two flows reduceswith EP. In contrast, when EP is larger than 0.04, Qtotal of the contin-uous flow becomes smaller than that of surge flows, with thedifference of Qtotal between the two flows increasing with EP. Theseobservations imply that to develop any semi-empirical design chartsfor total discharge, field data for both surge and continuous flows arerequired.
5.2. Bivariate design charts
In addition to the univariate design charts proposed in theprevious section, two bivariate design charts which account for thecoupling effect between Pmax and Qtotal are also developed for surgeand continuous flows, as shown in Fig. 9. The exceedance probabilityin the bivariate design chart (EPmv) means the occurrence probability ofan event with Pmax N p or Qtotal N q, i.e., EPmv = Prob[(Pmax N p)∪(Qtotal N q)], where p and q are threshold values of Pmax
and Qtotal, respectively. Using De Morgan's rule (Ang and Tang, 2007),EPmv can be written as
EPmv ¼ Prob PmaxNpð Þ∪ QtotalNqð Þ½ � ¼ 1−Prob Pmaxbpð Þ∩ Qtotalbqð Þ½ � ð3Þ
Please cite this article as: Hong, Y., et al., Statistical and probabilistic analduring 1961 and 2000 at Jiangjia Ravine, China, Eng. Geol. (2014), http://d
in which Prob[(Pmax b p)∩(Qtotal N q)] means the occurrence proba-bility of an event with both Pmax b p and Qtotal b q, and it is given bythe joint CDF of Pmax and Qtotal. As shown in Fig. 7, Pmax and Qtotal
are correlated, and the Pearson correlation coefficients betweenthem are 0.50 and 0.61 for surge and continuous flows, respectively.To incorporate the correlation between Pmax and Qtotal into thecalculation of EPmv, the Gaussian copula (e.g., Cho, 2013; Wu, 2015;Tang et al., 2013, 2015) is used to construct the joint CDF of Pmax andQtotal based on their marginal distributions (see Figs. 3 to 6) and corre-lation coefficients. Using Gaussian copula, Prob[(Pmax b p)∩(Qtotal N q)]is then written as
Prob Pmaxbpð Þ∩ Qtotalbqð Þ½ � ¼ Φ ϕ−1 f Pmaxpð Þ
h i;ϕ−1 f Qtotal
qð Þh i
;ρn o
ð4Þ
where Φ{∙} = 2-dimensional standard Gaussian CDF; ϕ−1[∙] = theinverse function of 1-dimensional standard Gaussian CDF; f Pmax
�ð Þ andf Qtotal
�ð Þ=the respectiveWeibull CDFs of Pmax andQtotal; ρ=correlationcoefficient between the equivalent standard Gaussian random variablesof Pmax and Qtotal, which is calculated from the correlation coefficient(e.g., 0.50 and 0.61 for surge and continuous flows, respectively)between Pmax andQtotal in their original space. Details on using Gaussiancopula to calculate the joint probability and construct the bivariatedistribution can be referred toWu (2015) and Tang et al. (2013, 2015).
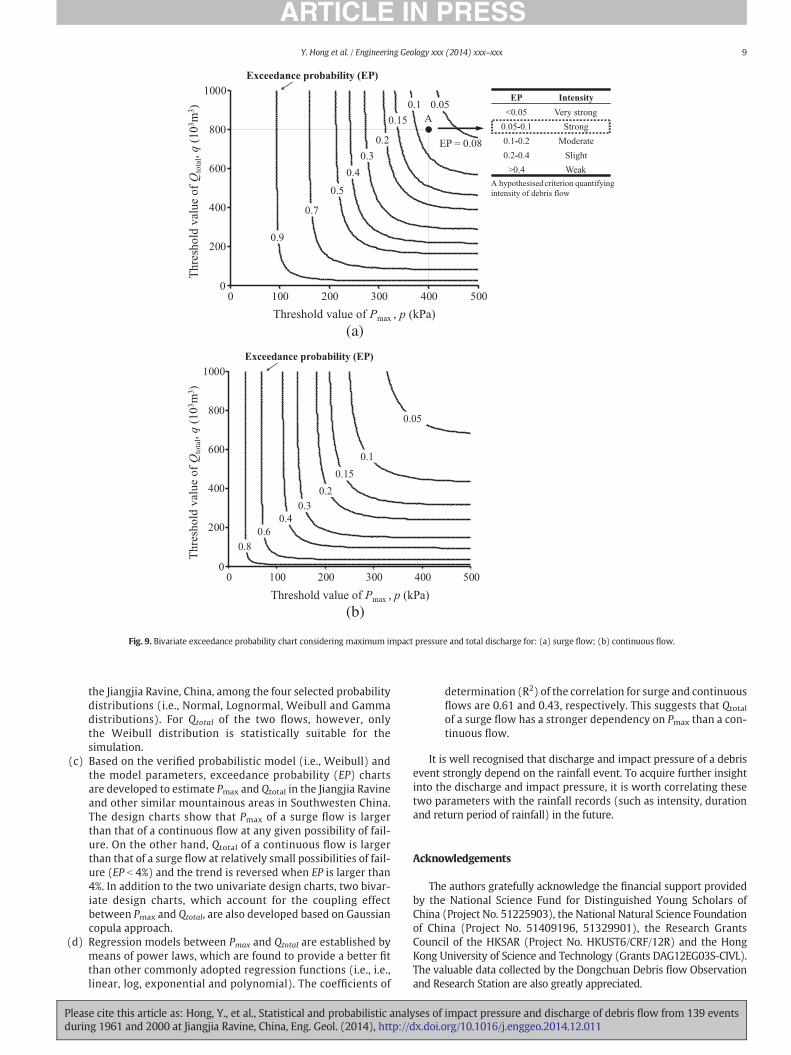
Using Eqs. (3) and (4), the respective values of EPmv for the surgeand continuous flows are calculated at different threshold values, asshown in Fig. 9. Each line in the figure represents an equal-potentialline of EPmv. The design chart shows that the EP increases with thedecreasing threshold values of Pmax and Qtotal. This indicates thatthe probability that Pmax or Qtotal exceeds their respective thresholdvalues (i.e., p and q) prescribed in design increases as theseprescribed values decrease. It is also shown that, for a given set of pand q values, EPmv for surge flows is greater than that for continuousflows. As one of p and q is very small, EPmv can always be very largeregardless of the value of the other quantity. For example, as p is lessthan 100 kPa, EPmv is always greater than 0.9 for surge flows (seeFig. 9(a)) regardless of the value of q. This is expected because EPmv isdominated by the small threshold value of the maximum impactpressure, which is very likely to be exceeded. Such a design scenarioshould be avoided in practice.
In addition to the usefulness of the chart in engineering design, it canalso provide a means to quantify the intensity of a debris flow in aprobablity-based manner. For example, if a surge flow occurred withPmax and Qtotal equal to 400 kPa and 800,000 m3 (see point “A” inFig. 9(a)), then an EPmv value of 0.08 can be obtained from the chart. Ifthe hypothesised criterion (shown in the inset to the figure) wasreferred to, the debris flow can be classified as “strong”.
6. Summary and conclusions
To assist in engineering design and in the risk analysis of debrisflows, this study presents statistical and probabilistic analyses on themaximum impact pressure and total discharge of 139debrisfloweventsin the “debris museum” of China (i.e., Jiangjia Ravine). Based on thisstudy, the following conclusions can be drawn:
(a) During the period from 1961 to 2000, the maximum values ofPmax and Qtotal are 744 kPa and 1,751,537m3, respectively. ThePmax and Qtotal values of surge flows exhibit much largernatural variability than those of continuous flows. To bemore specific, the coefficients of variation (COV) of Pmax are0.5 and 0.8 for surge and continuous flows, respectively, whilethe COVs of Qtotal for surge and continuous flows are 1.0 and1.7, respectively.
(b) The statistical goodness-of-fit tests show that the Weibull andGamma distributions are the most statistically suitable forsimulating Pmax of both surge and continuous flows in
yses of impact pressure and discharge of debris flow from 139 eventsx.doi.org/10.1016/j.enggeo.2014.12.011
(a)
(b)
Fig. 9. Bivariate exceedance probability chart considering maximum impact pressure and total discharge for: (a) surge flow; (b) continuous flow.
9Y. Hong et al. / Engineering Geology xxx (2014) xxx–xxx
the Jiangjia Ravine, China, among the four selected probabilitydistributions (i.e., Normal, Lognormal, Weibull and Gammadistributions). For Qtotal of the two flows, however, onlythe Weibull distribution is statistically suitable for thesimulation.
(c) Based on the verified probabilistic model (i.e., Weibull) andthe model parameters, exceedance probability (EP) chartsare developed to estimate Pmax and Qtotal in the Jiangjia Ravineand other similar mountainous areas in Southwesten China.The design charts show that Pmax of a surge flow is largerthan that of a continuous flow at any given possibility of fail-ure. On the other hand, Qtotal of a continuous flow is largerthan that of a surge flow at relatively small possibilities of fail-ure (EP b 4%) and the trend is reversed when EP is larger than4%. In addition to the two univariate design charts, two bivar-iate design charts, which account for the coupling effectbetween Pmax and Qtotal, are also developed based on Gaussiancopula approach.
(d) Regression models between Pmax and Qtotal are established bymeans of power laws, which are found to provide a better fitthan other commonly adopted regression functions (i.e., i.e.,linear, log, exponential and polynomial). The coefficients of
Please cite this article as: Hong, Y., et al., Statistical and probabilistic analyduring 1961 and 2000 at Jiangjia Ravine, China, Eng. Geol. (2014), http://d
determination (R2) of the correlation for surge and continuousflows are 0.61 and 0.43, respectively. This suggests that Qtotal
of a surge flow has a stronger dependency on Pmax than a con-tinuous flow.
It is well recognised that discharge and impact pressure of a debrisevent strongly depend on the rainfall event. To acquire further insightinto the discharge and impact pressure, it is worth correlating thesetwo parameters with the rainfall records (such as intensity, durationand return period of rainfall) in the future.
Acknowledgements
The authors gratefully acknowledge the financial support providedby the National Science Fund for Distinguished Young Scholars ofChina (Project No. 51225903), the National Natural Science Foundationof China (Project No. 51409196, 51329901), the Research GrantsCouncil of the HKSAR (Project No. HKUST6/CRF/12R) and the HongKong University of Science and Technology (Grants DAG12EG03S-CIVL).The valuable data collected by the Dongchuan Debris flow Observationand Research Station are also greatly appreciated.
ses of impact pressure and discharge of debris flow from 139 eventsx.doi.org/10.1016/j.enggeo.2014.12.011
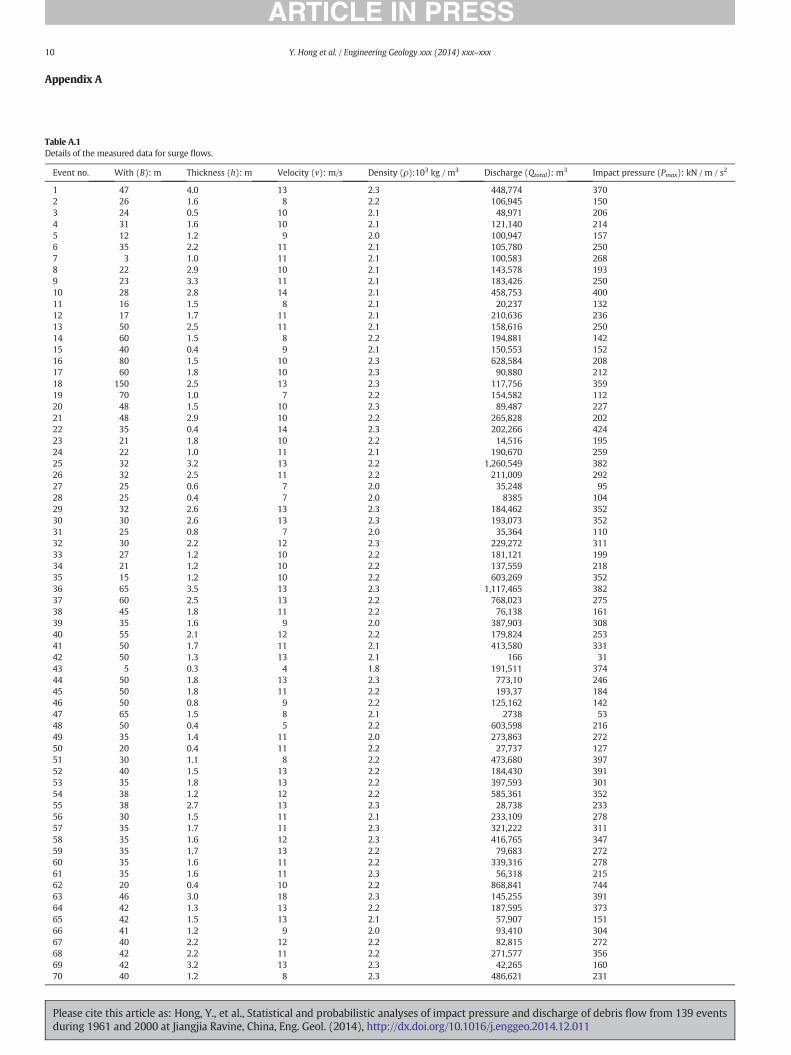
Table A.1Details of the measured data for surge flows.
Event no. With (B): m Thickness (h): m Velocity (v): m/s Density (ρ):103 kg / m3 Discharge (Qtotal): m3 Impact pressure (Pmax): kN / m / s2
1 47 4.0 13 2.3 448,774 3702 26 1.6 8 2.2 106,945 1503 24 0.5 10 2.1 48,971 2064 31 1.6 10 2.1 121,140 2145 12 1.2 9 2.0 100,947 1576 35 2.2 11 2.1 105,780 2507 3 1.0 11 2.1 100,583 2688 22 2.9 10 2.1 143,578 1939 23 3.3 11 2.1 183,426 25010 28 2.8 14 2.1 458,753 40011 16 1.5 8 2.1 20,237 13212 17 1.7 11 2.1 210,636 23613 50 2.5 11 2.1 158,616 25014 60 1.5 8 2.2 194,881 14215 40 0.4 9 2.1 150,553 15216 80 1.5 10 2.3 628,584 20817 60 1.8 10 2.3 90,880 21218 150 2.5 13 2.3 117,756 35919 70 1.0 7 2.2 154,582 11220 48 1.5 10 2.3 89,487 22721 48 2.9 10 2.2 265,828 20222 35 0.4 14 2.3 202,266 42423 21 1.8 10 2.2 14,516 19524 22 1.0 11 2.1 190,670 25925 32 3.2 13 2.2 1,260,549 38226 32 2.5 11 2.2 211,009 29227 25 0.6 7 2.0 35,248 9528 25 0.4 7 2.0 8385 10429 32 2.6 13 2.3 184,462 35230 30 2.6 13 2.3 193,073 35231 25 0.8 7 2.0 35,364 11032 30 2.2 12 2.3 229,272 31133 27 1.2 10 2.2 181,121 19934 21 1.2 10 2.2 137,559 21835 15 1.2 10 2.2 603,269 35236 65 3.5 13 2.3 1,117,465 38237 60 2.5 13 2.2 768,023 27538 45 1.8 11 2.2 76,138 16139 35 1.6 9 2.0 387,903 30840 55 2.1 12 2.2 179,824 25341 50 1.7 11 2.1 413,580 33142 50 1.3 13 2.1 166 3143 5 0.3 4 1.8 191,511 37444 50 1.8 13 2.3 773,10 24645 50 1.8 11 2.2 193,37 18446 50 0.8 9 2.2 125,162 14247 65 1.5 8 2.1 2738 5348 50 0.4 5 2.2 603,598 21649 35 1.4 11 2.0 273,863 27250 20 0.4 11 2.2 27,737 12751 30 1.1 8 2.2 473,680 39752 40 1.5 13 2.2 184,430 39153 35 1.8 13 2.2 397,593 30154 38 1.2 12 2.2 585,361 35255 38 2.7 13 2.3 28,738 23356 30 1.5 11 2.1 233,109 27857 35 1.7 11 2.3 321,222 31158 35 1.6 12 2.3 416,765 34759 35 1.7 13 2.2 79,683 27260 35 1.6 11 2.2 339,316 27861 35 1.6 11 2.3 56,318 21562 20 0.4 10 2.2 868,841 74463 46 3.0 18 2.3 145,255 39164 42 1.3 13 2.2 187,595 37365 42 1.5 13 2.1 57,907 15166 41 1.2 9 2.0 93,410 30467 40 2.2 12 2.2 82,815 27268 42 2.2 11 2.2 271,577 35669 42 3.2 13 2.3 42,265 16070 40 1.2 8 2.3 486,621 231
Appendix A
10 Y. Hong et al. / Engineering Geology xxx (2014) xxx–xxx
Please cite this article as: Hong, Y., et al., Statistical and probabilistic analyses of impact pressure and discharge of debris flow from 139 eventsduring 1961 and 2000 at Jiangjia Ravine, China, Eng. Geol. (2014), http://dx.doi.org/10.1016/j.enggeo.2014.12.011
Table A.1 (continued)
Event no. With (B): m Thickness (h): m Velocity (v): m/s Density (ρ):103 kg / m3 Discharge (Qtotal): m3 Impact pressure (Pmax): kN / m / s2
71 53 2.0 11 2.0 192,281 22972 53 1.8 10 2.3 3903 10173 40 0.5 7 2.1 58,099 18474 53 1.5 10 2.0 477,585 31375 53 1.3 12 2.2 151,496 24476 52 0.8 11 2.2 276,638 22777 54 2.5 10 2.3 367,529 23978 54 1.8 10 2.2 45,606 15579 60 1.0 8 2.3 147,185 20580 60 1.2 10 2.2 99,153 19981 58 0.8 10 2.2 56,782 17482 60 1.0 9 2.1 128,671 24183 61 1.8 10 2.3 777,357 13184 64 0.8 8 2.1 110,689 12485 20 2.0 8 2.2 89,947 21086 20 0.5 11 1.8 362,523 21787 45 1.8 10 2.3 42,128 9888 35 1.0 7 2.0 169,766 16789 40 2.5 9 2.3 216,942 13690 35 1.5 8 2.2 5523 6491 45 1.2 6 1.8 70,992 17492 40 1.5 9 2.1 31,550 34493 40 1.5 13 2.2 6282 9494 20 0.5 7 1.9 831 4895 4 0.5 5 1.9 483,895 45696 30 1.5 14 2.2 53,531 11497 25 1.2 7 2.2 303,849 31798 35 1.5 12 2.2 139,349 22199 22 1.0 10 2.2 106,042 140100 25 1.1 8 2.2 181,683 189101 20 1.2 9 2.2 21,419 79102 13 0.8 6 2.1 55,420 87103 16 0.6 6 2.1 108,647 102104 15 0.6 7 2.2 316,450 265105 18 1.2 11 2.2 3117 57106 15 0.8 5 2.1 161,806 146107 20 1.5 8 2.1 182,389 113108 22 1.8 7 2.1 245,292 210109 25 0.8 10 2.1 288,461 253110 27 1.1 11 2.2 248,371 174111 27 1.5 9 2.2 144,481 146112 24 2.1 8 2.1 34,072 132113 20 0.2 9 1.6 8689 63114 20 0.3 6 1.8 812,654 290115 30 1.8 12 2.1 1,185,056 253116 20 0.9 11 2.1 269,308 161117 30 1.7 8 2.3 441,966 238118 35 3.6 11 2.2 225,411 204119 35 2.4 10 2.1 93,656 110120 27 1.0 7 2.0 177,568 138121 25 1.7 8 2.2 468,046 184122 22 1.1 9 2.2 438,958 232123 28 2.8 10 2.3 485,362 166124 26 1.4 9 2.1 131,409 121125 15 0.4 8 2.1 77,164 165126 23 1.7 9 2.0 80,064 155127 28 2.5 9 2.1 56,650 150128 25 1.8 9 2.1 464,374 222129 25 0.5 10 2.2 936,898 110130 20 0.6 7 2.0 62,004 165131 25 0.7 9 2.0 356,325 233132 40 2.5 11 2.1 365,484 265133 42 1.6 11 2.2 234,768 224134 43 1.3 10 2.2 38,974 126135 20 0.3 8 2.0 818,079 265136 50 2.1 11 2.2 757,953 318137 53 2.8 12 2.3 322,440 227138 45 1.3 11 2.1 121,437 257139 35 1.2 11 2.2 19,097 123
11Y. Hong et al. / Engineering Geology xxx (2014) xxx–xxx
Please cite this article as: Hong, Y., et al., Statistical and probabilistic analyses of impact pressure and discharge of debris flow from 139 eventsduring 1961 and 2000 at Jiangjia Ravine, China, Eng. Geol. (2014), http://dx.doi.org/10.1016/j.enggeo.2014.12.011
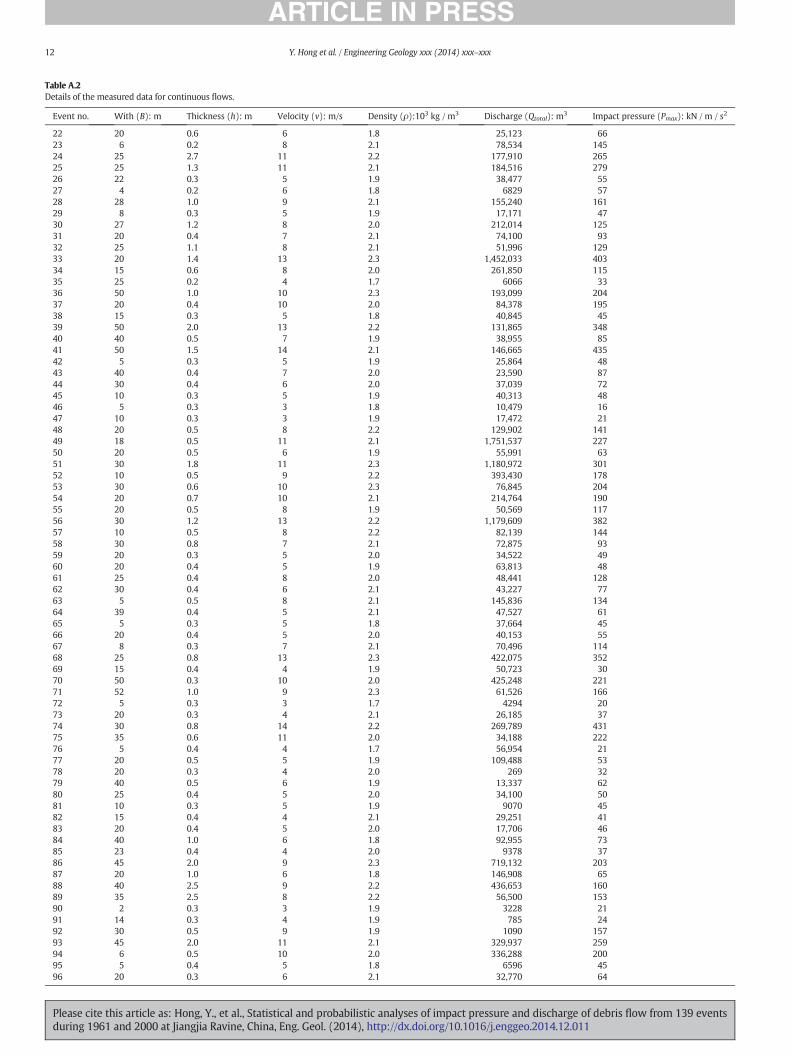
Table A.2Details of the measured data for continuous flows.
Event no. With (B): m Thickness (h): m Velocity (v): m/s Density (ρ):103 kg / m3 Discharge (Qtotal): m3 Impact pressure (Pmax): kN / m / s2
22 20 0.6 6 1.8 25,123 6623 6 0.2 8 2.1 78,534 14524 25 2.7 11 2.2 177,910 26525 25 1.3 11 2.1 184,516 27926 22 0.3 5 1.9 38,477 5527 4 0.2 6 1.8 6829 5728 28 1.0 9 2.1 155,240 16129 8 0.3 5 1.9 17,171 4730 27 1.2 8 2.0 212,014 12531 20 0.4 7 2.1 74,100 9332 25 1.1 8 2.1 51,996 12933 20 1.4 13 2.3 1,452,033 40334 15 0.6 8 2.0 261,850 11535 25 0.2 4 1.7 6066 3336 50 1.0 10 2.3 193,099 20437 20 0.4 10 2.0 84,378 19538 15 0.3 5 1.8 40,845 4539 50 2.0 13 2.2 131,865 34840 40 0.5 7 1.9 38,955 8541 50 1.5 14 2.1 146,665 43542 5 0.3 5 1.9 25,864 4843 40 0.4 7 2.0 23,590 8744 30 0.4 6 2.0 37,039 7245 10 0.3 5 1.9 40,313 4846 5 0.3 3 1.8 10,479 1647 10 0.3 3 1.9 17,472 2148 20 0.5 8 2.2 129,902 14149 18 0.5 11 2.1 1,751,537 22750 20 0.5 6 1.9 55,991 6351 30 1.8 11 2.3 1,180,972 30152 10 0.5 9 2.2 393,430 17853 30 0.6 10 2.3 76,845 20454 20 0.7 10 2.1 214,764 19055 20 0.5 8 1.9 50,569 11756 30 1.2 13 2.2 1,179,609 38257 10 0.5 8 2.2 82,139 14458 30 0.8 7 2.1 72,875 9359 20 0.3 5 2.0 34,522 4960 20 0.4 5 1.9 63,813 4861 25 0.4 8 2.0 48,441 12862 30 0.4 6 2.1 43,227 7763 5 0.5 8 2.1 145,836 13464 39 0.4 5 2.1 47,527 6165 5 0.3 5 1.8 37,664 4566 20 0.4 5 2.0 40,153 5567 8 0.3 7 2.1 70,496 11468 25 0.8 13 2.3 422,075 35269 15 0.4 4 1.9 50,723 3070 50 0.3 10 2.0 425,248 22171 52 1.0 9 2.3 61,526 16672 5 0.3 3 1.7 4294 2073 20 0.3 4 2.1 26,185 3774 30 0.8 14 2.2 269,789 43175 35 0.6 11 2.0 34,188 22276 5 0.4 4 1.7 56,954 2177 20 0.5 5 1.9 109,488 5378 20 0.3 4 2.0 269 3279 40 0.5 6 1.9 13,337 6280 25 0.4 5 2.0 34,100 5081 10 0.3 5 1.9 9070 4582 15 0.4 4 2.1 29,251 4183 20 0.4 5 2.0 17,706 4684 40 1.0 6 1.8 92,955 7385 23 0.4 4 2.0 9378 3786 45 2.0 9 2.3 719,132 20387 20 1.0 6 1.8 146,908 6588 40 2.5 9 2.2 436,653 16089 35 2.5 8 2.2 56,500 15390 2 0.3 3 1.9 3228 2191 14 0.3 4 1.9 785 2492 30 0.5 9 1.9 1090 15793 45 2.0 11 2.1 329,937 25994 6 0.5 10 2.0 336,288 20095 5 0.4 5 1.8 6596 4596 20 0.3 6 2.1 32,770 64
12 Y. Hong et al. / Engineering Geology xxx (2014) xxx–xxx
Please cite this article as: Hong, Y., et al., Statistical and probabilistic analyses of impact pressure and discharge of debris flow from 139 eventsduring 1961 and 2000 at Jiangjia Ravine, China, Eng. Geol. (2014), http://dx.doi.org/10.1016/j.enggeo.2014.12.011
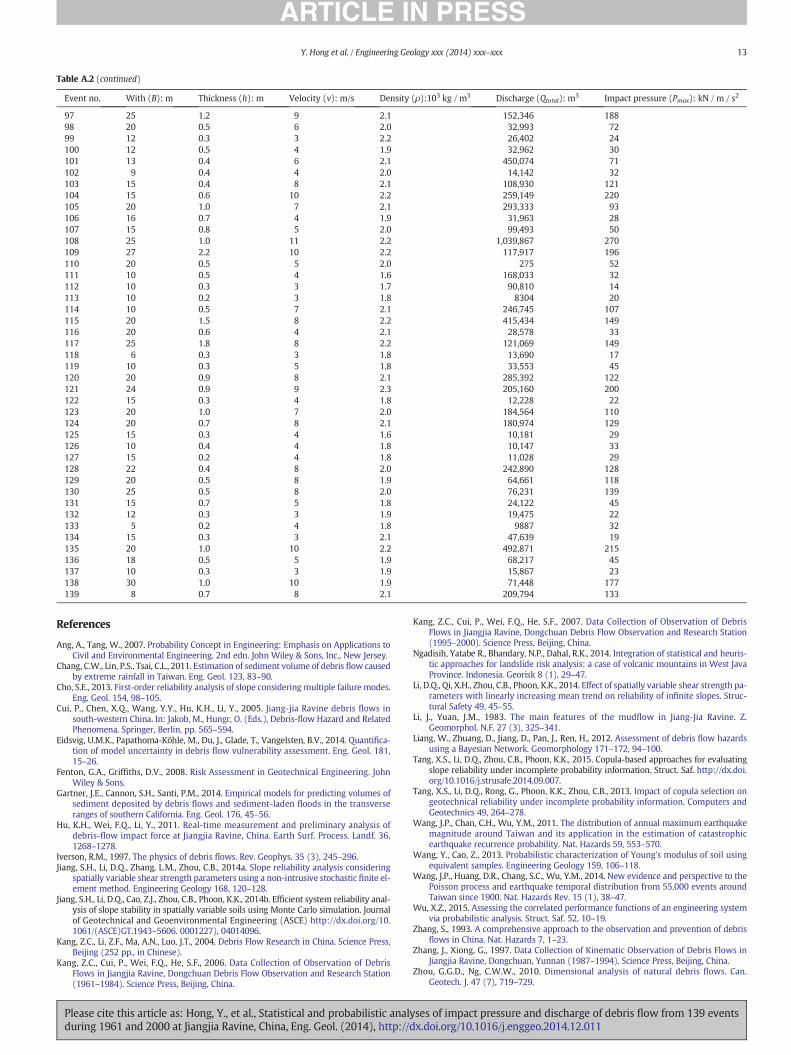
Table A.2 (continued)
Event no. With (B): m Thickness (h): m Velocity (v): m/s Density (ρ):103 kg / m3 Discharge (Qtotal): m3 Impact pressure (Pmax): kN / m / s2
97 25 1.2 9 2.1 152,346 18898 20 0.5 6 2.0 32,993 7299 12 0.3 3 2.2 26,402 24100 12 0.5 4 1.9 32,962 30101 13 0.4 6 2.1 450,074 71102 9 0.4 4 2.0 14,142 32103 15 0.4 8 2.1 108,930 121104 15 0.6 10 2.2 259,149 220105 20 1.0 7 2.1 293,333 93106 16 0.7 4 1.9 31,963 28107 15 0.8 5 2.0 99,493 50108 25 1.0 11 2.2 1,039,867 270109 27 2.2 10 2.2 117,917 196110 20 0.5 5 2.0 275 52111 10 0.5 4 1.6 168,033 32112 10 0.3 3 1.7 90,810 14113 10 0.2 3 1.8 8304 20114 10 0.5 7 2.1 246,745 107115 20 1.5 8 2.2 415,434 149116 20 0.6 4 2.1 28,578 33117 25 1.8 8 2.2 121,069 149118 6 0.3 3 1.8 13,690 17119 10 0.3 5 1.8 33,553 45120 20 0.9 8 2.1 285,392 122121 24 0.9 9 2.3 205,160 200122 15 0.3 4 1.8 12,228 22123 20 1.0 7 2.0 184,564 110124 20 0.7 8 2.1 180,974 129125 15 0.3 4 1.6 10,181 29126 10 0.4 4 1.8 10,147 33127 15 0.2 4 1.8 11,028 29128 22 0.4 8 2.0 242,890 128129 20 0.5 8 1.9 64,661 118130 25 0.5 8 2.0 76,231 139131 15 0.7 5 1.8 24,122 45132 12 0.3 3 1.9 19,475 22133 5 0.2 4 1.8 9887 32134 15 0.3 3 2.1 47,639 19135 20 1.0 10 2.2 492,871 215136 18 0.5 5 1.9 68,217 45137 10 0.3 3 1.9 15,867 23138 30 1.0 10 1.9 71,448 177139 8 0.7 8 2.1 209,794 133
13Y. Hong et al. / Engineering Geology xxx (2014) xxx–xxx
References
Ang, A., Tang, W., 2007. Probability Concept in Engineering: Emphasis on Applications toCivil and Environmental Engineering. 2nd edn. John Wiley & Sons, Inc., New Jersey.
Chang, C.W., Lin, P.S., Tsai, C.L., 2011. Estimation of sediment volume of debris flow causedby extreme rainfall in Taiwan. Eng. Geol. 123, 83–90.
Cho, S.E., 2013. First-order reliability analysis of slope considering multiple failure modes.Eng. Geol. 154, 98–105.
Cui, P., Chen, X.Q., Wang, Y.Y., Hu, K.H., Li, Y., 2005. Jiang-jia Ravine debris flows insouth-western China. In: Jakob, M., Hungr, O. (Eds.), Debris-flow Hazard and RelatedPhenomena. Springer, Berlin, pp. 565–594.
Eidsvig, U.M.K., Papathoma-Köhle, M., Du, J., Glade, T., Vangelsten, B.V., 2014. Quantifica-tion of model uncertainty in debris flow vulnerability assessment. Eng. Geol. 181,15–26.
Fenton, G.A., Griffiths, D.V., 2008. Risk Assessment in Geotechnical Engineering. JohnWiley & Sons.
Gartner, J.E., Cannon, S.H., Santi, P.M., 2014. Empirical models for predicting volumes ofsediment deposited by debris flows and sediment-laden floods in the transverseranges of southern California. Eng. Geol. 176, 45–56.
Hu, K.H., Wei, F.Q., Li, Y., 2011. Real-time measurement and preliminary analysis ofdebris-flow impact force at Jiangjia Ravine, China. Earth Surf. Process. Landf. 36,1268–1278.
Iverson, R.M., 1997. The physics of debris flows. Rev. Geophys. 35 (3), 245–296.Jiang, S.H., Li, D.Q., Zhang, L.M., Zhou, C.B., 2014a. Slope reliability analysis considering
spatially variable shear strength parameters using a non-intrusive stochastic finite el-ement method. Engineering Geology 168, 120–128.
Jiang, S.H., Li, D.Q., Cao, Z.J., Zhou, C.B., Phoon, K.K., 2014b. Efficient system reliability anal-ysis of slope stability in spatially variable soils using Monte Carlo simulation. Journalof Geotechnical and Geoenvironmental Engineering (ASCE) http://dx.doi.org/10.1061/(ASCE)GT.1943–5606. 0001227), 04014096.
Kang, Z.C., Li, Z.F., Ma, A.N., Luo, J.T., 2004. Debris Flow Research in China. Science Press,Beijing (252 pp., in Chinese).
Kang, Z.C., Cui, P., Wei, F.Q., He, S.F., 2006. Data Collection of Observation of DebrisFlows in Jiangjia Ravine, Dongchuan Debris Flow Observation and Research Station(1961–1984). Science Press, Beijing, China.
Please cite this article as: Hong, Y., et al., Statistical and probabilistic analyduring 1961 and 2000 at Jiangjia Ravine, China, Eng. Geol. (2014), http://d
Kang, Z.C., Cui, P., Wei, F.Q., He, S.F., 2007. Data Collection of Observation of DebrisFlows in Jiangjia Ravine, Dongchuan Debris Flow Observation and Research Station(1995–2000). Science Press, Beijing, China.
Ngadisih, Yatabe R., Bhandary, N.P., Dahal, R.K., 2014. Integration of statistical and heuris-tic approaches for landslide risk analysis: a case of volcanic mountains in West JavaProvince. Indonesia. Georisk 8 (1), 29–47.
Li, D.Q., Qi, X.H., Zhou, C.B., Phoon, K.K., 2014. Effect of spatially variable shear strength pa-rameters with linearly increasing mean trend on reliability of infinite slopes. Struc-tural Safety 49, 45–55.
Li, J., Yuan, J.M., 1983. The main features of the mudflow in Jiang‐Jia Ravine. Z.Geomorphol. N.F. 27 (3), 325–341.
Liang, W., Zhuang, D., Jiang, D., Pan, J., Ren, H., 2012. Assessment of debris flow hazardsusing a Bayesian Network. Geomorphology 171–172, 94–100.
Tang, X.S., Li, D.Q., Zhou, C.B., Phoon, K.K., 2015. Copula-based approaches for evaluatingslope reliability under incomplete probability information. Struct. Saf. http://dx.doi.org/10.1016/j.strusafe.2014.09.007.
Tang, X.S., Li, D.Q., Rong, G., Phoon, K.K., Zhou, C.B., 2013. Impact of copula selection ongeotechnical reliability under incomplete probability information. Computers andGeotechnics 49, 264–278.
Wang, J.P., Chan, C.H., Wu, Y.M., 2011. The distribution of annual maximum earthquakemagnitude around Taiwan and its application in the estimation of catastrophicearthquake recurrence probability. Nat. Hazards 59, 553–570.
Wang, Y., Cao, Z., 2013. Probabilistic characterization of Young’s modulus of soil usingequivalent samples. Engineering Geology 159, 106–118.
Wang, J.P., Huang, D.R., Chang, S.C., Wu, Y.M., 2014. New evidence and perspective to thePoisson process and earthquake temporal distribution from 55,000 events aroundTaiwan since 1900. Nat. Hazards Rev. 15 (1), 38–47.
Wu, X.Z., 2015. Assessing the correlated performance functions of an engineering systemvia probabilistic analysis. Struct. Saf. 52, 10–19.
Zhang, S., 1993. A comprehensive approach to the observation and prevention of debrisflows in China. Nat. Hazards 7, 1–23.
Zhang, J., Xiong, G., 1997. Data Collection of Kinematic Observation of Debris Flows inJiangjia Ravine, Dongchuan, Yunnan (1987–1994). Science Press, Beijing, China.
Zhou, G.G.D., Ng, C.W.W., 2010. Dimensional analysis of natural debris flows. Can.Geotech. J. 47 (7), 719–729.
ses of impact pressure and discharge of debris flow from 139 eventsx.doi.org/10.1016/j.enggeo.2014.12.011


![Probabilistic Seismic Hazard Assessment and Geotechnical ... · To perform the final step the software CRISIS2007 [25], is used and several probabilistic seismic hazard analyses are](https://static.fdocuments.in/doc/165x107/5e8849e01425dc3712672b5a/probabilistic-seismic-hazard-assessment-and-geotechnical-to-perform-the-final.jpg)


