
Statistical Analysis of Spark Ignition of Kerosene-Air...
13
Paper # 027IC-0201 Topic: Spark Ignition Fall Technical Meeting of the Western States Section of the Combustion Institute Hosted by the University of California, Riverside, CA Oct 17 & 18, 2011. Statistical Analysis of Spark Ignition of Kerosene-Air Mixtures Sally P. M. Bane 1 , Stephanie A. Coronel 2 , Philipp A. Boettcher 2 , Joseph E. Shepherd 2 1 School of Aeronautics and Astronautics, Purdue University, West Lafayette, Indiana 47907-2045, USA 2 Explosion Dynamic Laboratories, California Institute of Technology, Pasadena, California 91125-0001, USA Abstract Quantifying the risk of accidental ignition of flammable mixtures is extremely important in industry and aviation safety. The concept of minimum ignition energy (MIE), obtained using a capacitive spark discharge ignition source, has traditionally formed the basis for determining the ignition hazard posed by fuels. While extensive tabulations of historical MIE data exist, there has been little work done on ignition of realistic industrial and aviation fuels, such as gasoline or kerosene. In the current work, spark ignition tests are performed in a gaseous kerosene-air mixture with a liquid fuel temperature ranging from 45 ◦ C to 65 ◦ C, and a fixed spark gap of 3.3 mm. Rather than obtaining a single threshold value of MIE, statistical analysis is performed to obtain a distribution for probability of ignition. The results are compared with previous test results in traditional surrogate mixtures used in safety testing and Jet A (aviation kerosene). In addition, an analytic model is applied to predict the vapor pressure for a range of temperatures, pressures and flash points. 1 Introduction Assessing the risk of ignition is very important in industry and aviation. The concept of minimum ignition energy (MIE) has traditionally formed the basis for quantifying ignition hazards of fuels. The standard test method used in MIE testing of a given mixture consists of a capacitive spark discharge as the ignition source. Pioneering work to determine MIE values was performed at the Bureau of Mines in the 1940s by Guest, Blanc, Lewis, and von Elbe [1]. However, in aviation, the actual threat is ignition of aviation kerosene (Jet A), which consists of 100-200 hydrocarbons. Nevertheless, it consists of mainly four compounds: paraffins, cycloparaffins, aromatics and olefins [2]. Nestor [3] performed experiments to determine the flammability limits of Jet A in air at atmo- spheric pressure and pressures corresponding to altitudes of 4572 m and 12192 m. The flammabil- ity limits were presented in terms of the temperature range within which there is sufficient vapor pressure of fuel for ignition. Additionally, Nestor [3] investigated ignition of Jet A spray droplets. Ott [4] also studied flammability of aviation kerosene (JP-8) and the effect of fuel slosh on the flammability limits. Following the crash of Trans World Airlines Flight 800 in 1996, a series of studies were performed by Shepherd et al. [5] and Lee and Shepherd [6] on the flammability and ignition energy of Jet A. The minimum ignition energy of Jet A was found to vary between 100 J for a fuel/air temperature of 25 ◦ C and 40 mJ for a fuel/air temperatue of 55 ◦ C [7]. Despite these previous studies, we still lack a comprehensive database of ignition energy data for use in safety engineering and assessment. 1
Transcript of Statistical Analysis of Spark Ignition of Kerosene-Air...

Paper # 027IC-0201 Topic: Spark Ignition
Fall Technical Meeting of the Western States Section of the Combustion InstituteHosted by the University of California, Riverside, CA
Oct 17 & 18, 2011.
Statistical Analysis of Spark Ignition of Kerosene-Air Mixtures
Sally P. M. Bane1, Stephanie A. Coronel2, Philipp A. Boettcher2, Joseph E. Shepherd2
1School of Aeronautics and Astronautics,Purdue University, West Lafayette, Indiana 47907-2045, USA
2Explosion Dynamic Laboratories,California Institute of Technology, Pasadena, California 91125-0001, USA
AbstractQuantifying the risk of accidental ignition of flammable mixtures is extremely important in industryand aviation safety. The concept of minimum ignition energy (MIE), obtained using a capacitive sparkdischarge ignition source, has traditionally formed the basis for determining the ignition hazard posedby fuels. While extensive tabulations of historical MIE data exist, there has been little work done onignition of realistic industrial and aviation fuels, such as gasoline or kerosene. In the current work, sparkignition tests are performed in a gaseous kerosene-air mixture with a liquid fuel temperature rangingfrom 45◦C to 65◦C, and a fixed spark gap of 3.3 mm. Rather than obtaining a single threshold valueof MIE, statistical analysis is performed to obtain a distribution for probability of ignition. The resultsare compared with previous test results in traditional surrogate mixtures used in safety testing and Jet A(aviation kerosene). In addition, an analytic model is applied to predict the vapor pressure for a rangeof temperatures, pressures and flash points.
1 Introduction
Assessing the risk of ignition is very important in industry and aviation. The concept of minimumignition energy (MIE) has traditionally formed the basis for quantifying ignition hazards of fuels.The standard test method used in MIE testing of a given mixture consists of a capacitive sparkdischarge as the ignition source. Pioneering work to determine MIE values was performed at theBureau of Mines in the 1940s by Guest, Blanc, Lewis, and von Elbe [1]. However, in aviation,the actual threat is ignition of aviation kerosene (Jet A), which consists of 100-200 hydrocarbons.Nevertheless, it consists of mainly four compounds: paraffins, cycloparaffins, aromatics and olefins[2].
Nestor [3] performed experiments to determine the flammability limits of Jet A in air at atmo-spheric pressure and pressures corresponding to altitudes of 4572 m and 12192 m. The flammabil-ity limits were presented in terms of the temperature range within which there is sufficient vaporpressure of fuel for ignition. Additionally, Nestor [3] investigated ignition of Jet A spray droplets.Ott [4] also studied flammability of aviation kerosene (JP-8) and the effect of fuel slosh on theflammability limits. Following the crash of Trans World Airlines Flight 800 in 1996, a series ofstudies were performed by Shepherd et al. [5] and Lee and Shepherd [6] on the flammability andignition energy of Jet A. The minimum ignition energy of Jet A was found to vary between 100 Jfor a fuel/air temperature of 25◦C and 40 mJ for a fuel/air temperatue of 55◦C [7]. Despite theseprevious studies, we still lack a comprehensive database of ignition energy data for use in safetyengineering and assessment.
1

2011 Fall Meeting of WSS/CI – Paper # 027IC-0201 Topic: Spark Ignition
2 Experimental Setup and Results
The experiments are conducted with an experimental setup presented in previous work [7]. The ig-nition experiments were performed in a closed, cylindrical, stainless steel combustion vessel witha volume of approximately 22 L. Two parallel flanges were used to mount the spark gap electrodes,and the other two flanges held windows for visualization. The gas pressure was measured using apiezoresistive pressure transducer with the output displayed using National Instruments LabVIEWsoftware, and an exhaust line was installed to circulate fresh air through the vessel. A variable-speed fan mixer was used to mix the air and kerosene vapor to ensure homogeneous composition.Kerosene has a very low vapor pressure at room temperature, so to increase the fuel vapor concen-tration it must be heated. A heating system was designed with the capability to heat the vessel upto a temperature of 150◦C. Flexible silicone heaters were mounted on the surfaces of the vessel andthe flanges and were divided into four heating zones, each with a separate temperature controller.
Three different methods were used to detect whether or not ignition occurred. First, the pressurerise from the combustion was measured using the pressure transducer. This measurement alsoallowed us to determine the peak pressure rise in the vessel. Second, the temperature rise wasdetected using a K-type thermocouple inside the vessel. The third method used to detect ignitionwas schlieren visualization of the flame propagation recorded using a high-speed camera.
In previous testing with gaseous fuels at room temperature, the vessel was first evacuated and thenfilled using the method of partial pressures. However, with kerosene or other fuels with low vaporpressures, the experimental method is considerably more complicated. First, the fuel mass loading(mass of liquid fuel divided by the vessel volume) must be chosen to determine the desired volumeof fuel. With the vessel at room temperature, the kerosene is then poured into the bottom of thevessel before sealing and heating the vessel. The heating zone at the bottom of the vessel was setto the desired fuel temperature. The other zones were heated to a higher temperature to preventcondensation of the fuel. Once the desired temperature was attained and the fuel vapor and airwere sufficiently mixed, a spark with a predetermined stored energy was initiated inside the vessel.If ignition occurred, air was circulated through the vessel and then the lid was removed so that theinside walls and electrodes could be cleaned. After two successful ignitions, the used kerosenewas removed and fresh kerosene was introduced to keep the fuel vapor concentration as consistentas possible.
Ignition of kerosene-air mixtures at atmospheric pressure and various fuel temperatures was ex-amined. The tests were performed using 1-K kerosene at fuel temperatures of 45◦C, 50◦C, 55◦C,60◦C and 62◦C and at a fuel mass loading of approximately 50 kg/m3. A fixed spark gap of 3.3mm was used and the spark energy was varied by changing the discharge circuit capacitance. Thecapacitance was varied from approximately 11 pF to 68 pF with breakdown voltages between 6.4kV and 11.4 kV, which yielded possible spark energies from approximately 300 µJ to 2.3 mJ.The results are shown in Figure 1 along with the measured flash point and the gray shaded regionwhich represents the temperature at which ignition was not obtained with the capacitor set at itsmaximum. By varying the kerosene liquid temperature, the most sensitive mixture was found to bearound 55◦C. In addition, since sufficient data points were gathered for the 60◦C kerosene-air tests,statistical methods [8] were used to derive a probability distribution, as shown in Figure 2. Theprobability of ignition is shown against the spark energy density, which was obtained by dividingthe spark energy by the spark gap length of 3.3 mm.
2

2011 Fall Meeting of WSS/CI – Paper # 027IC-0201 Topic: Spark Ignition
Figure 1: Spark ignition energy for 1-K kerosene-air mixtures at 45◦C, 50◦C, 55◦C, 60◦C, and 62◦C(approximate location of flammability limits are shaded gray)
Figure 2: Probability distribution for ignition versus spark energy density for the 60◦C kerosene-airmixture
3

2011 Fall Meeting of WSS/CI – Paper # 027IC-0201 Topic: Spark Ignition
Figure 3: Ignition probability distributions for the 5% H2 mixture recommended by the SAE foraviation safety testing and a mixture with 7% H2 [7] compared with the 60◦C kerosene-air mixture
Figure 4: Ignition probability distributions for the hexane-air mixture [7] compared with the 60◦Ckerosene-air mixture
4

2011 Fall Meeting of WSS/CI – Paper # 027IC-0201 Topic: Spark Ignition
The current work was then compared with the probability distributions of previous ignition testsin hydrogen and hexane done by Bane et al [7]. A lean hydrogen test mixture recommended bythe SAE for use in aviation safety testing [9] (5% H2, 12% O2, 83% Ar), as well a mixture with7% H2 and the most sensitive hexane mixture with an equivalence ratio of 1.7, were used in thecomparison. The probability distributions for the hydrogen test mixtures, compared with the 60◦Ckerosene-air mixture, are shown in Figure 3, and the hexane mixture compared with the 60◦Ckerosene-air mixture is shown in Figure 4.
The comparison shows that the kerosene ignition energies of the fuel used in this study are evenmore sensitive than the 5% H2 test mixture in terms of the spark energy density required for igni-tion. Therefore a different test mixture or surrogate fuel must be used for aviation safety testing.
Further testing should be done in this field as there are limited data available on the minimumignition energies for kerosene-based fuels. It is also necessary to examine how a given set ofconditions affects the fuel vapor composition, which we did by implementing an analytic modelfor pressure prediction, as explained below.
3 Analytic Model for Vapor Pressure Prediction
Aviation kerosene fuels are complex mixtures containing hundreds of hydrocarbons in varyingamounts that depend on the refinement process, the crude oil, the time of year and storage con-ditions [5]. In addition, the vapor composition is different from that of the liquid composition,and is highly sensitive to changes in temperature, pressure and fuel mass loading. There are sev-eral methods for characterizing aviation kerosene fuels such as liquid chromatography, distillationcurves, and gas chromatography. Although gas chomatography of each batch of 1-K kerosenefuel used in this study is ideal for finding its vapor composition, it is too expensive and laborious;therefore an alternative is needed to obtain the vapor composition. The fuel vapor compositioncan be found through the liquid fuel composition obtained through the methods mentioned above.Knowing that a kerosene-based fuel consists of hundreds of hydrocarbons, the next step is to modelits liquid composition. Two different approaches were found, one by Woodrow [10] who obtainedthe liquid composition of twelve different kerosene based fuels with varying flash points using agas chomatograph and another by Thomas [11] who obtained distillation curves for Jet A, Jet B,JP-5 and TS-1. Woodrow’s analysis was done by injecting the liquid into a gas chromatograph andusing a flame ionization detector to determine the retention times for compounds grouped by thenumber of carbon atoms [5]. The composition of each fuel was modeled by using sixteen alkanereference standards (CnH2n+2 where n = 5,6,...20). In Thomas’s analysis, the alkane boiling pointswere used as a guide to cut the fuel into a number of “buckets” and all species of the same carbonnumber were placed in the same bucket. Therefore, Thomas’s analysis simplified the approach tofocus on nineteen buckets rather that several hundred buckets. The ASTM D2887 distillation curveis used to determine the weight of each bucket. Two adjustments were introduced by Thomas toaccount for the fact that the compounds in any one bucket are not all alkanes. The first was todecrease the hydrogen content as the carbon number is increased, such that CnH2n+c where
c = 2− 0.25(n− 1) for n = 1, 2, ..., 19. (1)
The second adjustement was made to the “cut temperature” (i.e., the boiling temperature separatingeach bucket in the distillation curve) to better match the predicted vapor pressure to the actual vapor
5

2011 Fall Meeting of WSS/CI – Paper # 027IC-0201 Topic: Spark Ignition
4 6 8 10 12 14 16 18 20 220
5
10
15
20
25
carbon #
% m
ole
fra
ctio
n in
liq
uid
30.6oC
46oC
56oC
59oC
70.6oC
71.1oC
73.9oC
Figure 5: Percent mole fraction of liquid fuel samples [10]
pressure of the fuels analyzed in Thomas’s study [11]. Once the liquid composition is known,Woodrow’s method for modeling the fuel vapor composition can be applied. In this study, datafrom Woodrow are used and applied to the ignition energy results. Woodrow provides the liquidcomposition, shown in Figure 5, for different Jet A fuels formulated to have a range of flash points,shown in Table 1. The flash point is the minium temperature that gives sufficient fuel vapor to forma flammable vapor-air mixture [2]. We can observe that as the flash point is increased, the % molefraction of the lighter hydrocarbons is decreased. Therefore higher temperatures are required tovaporize the heavier hydrocarbons and cause the mixture to be flammable.
Table 1: Flash point for jet fuel samples [10]
Sample Flash Point (◦C)2.5 wt% OH 30.6Base Jet A 45.6
97.5 wt% Btm 55.695 wt% Btm 59.4
92.5 wt% Btm 64.490 wt% Btm 70.6
87.5 wt% Btm 71.185 wt% Btm 73.9
Linear interpolation of Woodrow’s data is done, allowing us to input any flash point (correspondingto a kerosene based fuel) between 30.6◦C and 73.9◦C and obtain its liquid composition. We choseto focus on a flash point temperature of 42◦C since preliminary investigations indicate that this is
6

2011 Fall Meeting of WSS/CI – Paper # 027IC-0201 Topic: Spark Ignition
5 10 15 200
2
4
6
8
10
12
14
16
18
carbon #
% m
ole
fra
ctio
n in
liq
uid
fu
el
Figure 6: Prediction of percent mole fraction of 1-K kerosene corresponding to a flash point of 42◦C
the flash point of the 1-K kerosene used in this study. A prediction of the liquid composition forthe 1-K kerosene is shown in Figure 6. The liquid fuel composition of the 1-K kerosene is nearlysymmetric across C12, however, there are still more light components than heavy ones.
With the predicted liquid composition of the 1-K kerosene known, the saturation vapor pressuresfor each subsection hydrocarbon at each temperature used in the ignition tests (45◦C, 50◦C, 55◦C,60◦C, and 62◦C) are calculated using the following equations [12],
ln(Pvp/Pc) = (1− x)−1[Ax+Bx1.5 + Cx3 +Dx6] (2)
x = 1− T/Tc (3)
ln(Pvp) = A−B/T + ClnT +DPvp/T2 (4)
ln(Pvp) = A−B/[T + C] (5)
where A, B, C and D are taken from Appendix A of Reid et al. [12]. The saturation pressures ofthe n-alkanes with a carbon number of 5, 6, 7, 8, 9 and 10 are calculated using equations 2 and 3,those with carbon numbers of 11, 12, 14, 15 and 16 are calculated using equation 4 and those withcarbon numbers of 13, 17, 18, 19 and 20 are calculated using equation 5. Using Raolt’s Law:
Pi = XiPvp,i for i = 5, 6, ..., 20 (6)
where Xi is the subsection mole fraction of the liquid, the subsection partial pressure of the vapor,Pi, is obtained. The number of moles, ni, in each subsection of the fuel vapor is then found byapplying the ideal gas law:
Pi =niR T
Vv(7)
7

2011 Fall Meeting of WSS/CI – Paper # 027IC-0201 Topic: Spark Ignition
where Vv is the volume of the fuel vapor. The volume of the fuel vapor can be rewritten as thedifference between the volume of the vessel, V, and the volume of the liquid, Vl, as shown in thenext equation.
Vv = V − Vl = V −∑WiNi −
∑Wini
ρ(8)
In equation 8, Wi is the molecular weight of each hydrocarbon in the fuel, Ni is the number of molesof each hydrocarbon and ρ is the liquid fuel density. Raolt’s law does not take into considerationthe mass loading when calculating the partial pressure of each subsection, therefore, the expressionknow as the “headspace equation,” shown in equation 9 from Ioeffe and Vitenberg [13], is applied.
CG =Co
L
K + Vv/Vl. (9)
CG is the concentration in the vapor, CL◦ is the initial concentration in the liquid, and K is thehydrocarbon liquid-vapor distribution coefficient. Equation 9 shows that for a given value of K, asVv/Vl is increased, CG decreases since the number of moles of each hydrocarbon in the liquid fuelthat can be vaporized is decreased. By rearranging the equation, K is found to be:
K =Co
L
CG
− Vv/Vl (10)
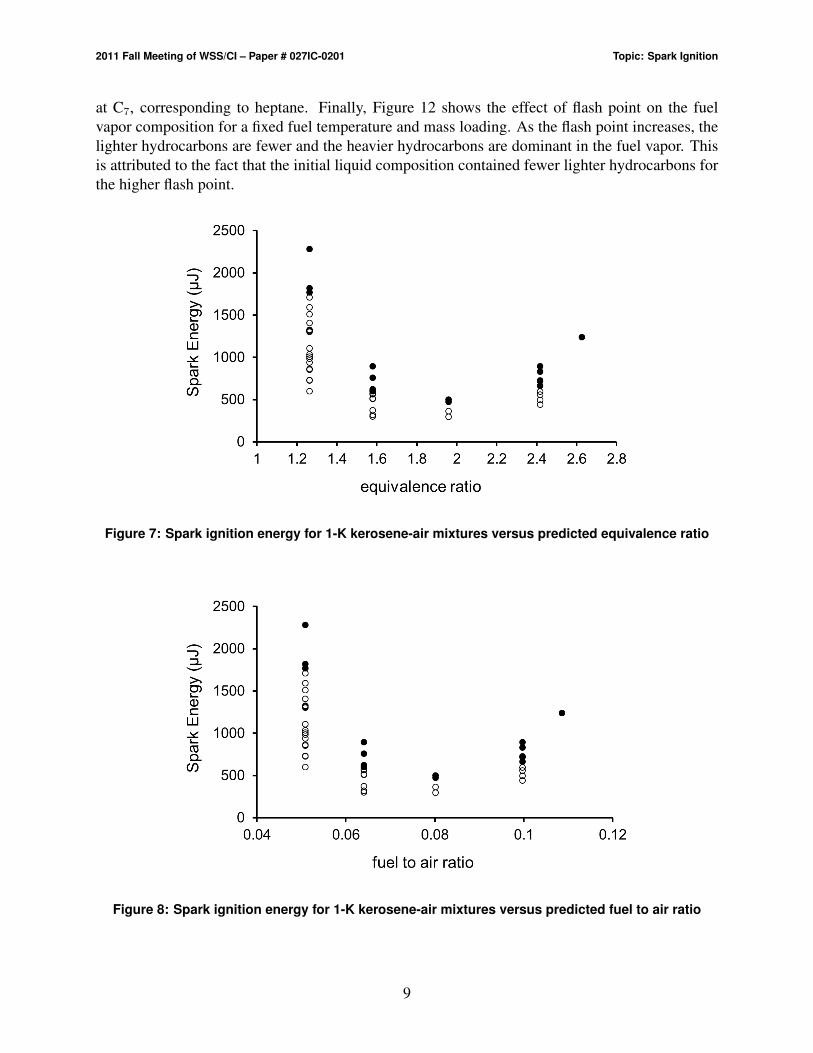
In equation 10, the value of Vv/Vl is 1.2, which corresponds to 45% of a tank filled with liquid fuel.This value is chosen to find K since the partial pressures predicted using Raolt’s law correspond tothe partial pressures of the vapor headspace of the tank volume filled to 45% found by Woodrowusing gas chromatography. A fuel mass loading of 50 kg/m3 was used in the present study, whichcorresponds to Vv/Vl=13.9. By applying equation 9, the concentration in the fuel vapor can befound. Knowing the concentration in the vapor, the fuel to air ratio and equivalence ratio can befound. Taking the ignition energy data of this study, plots can be made of ignition energy versusequivalence ratio, φ, and the fuel-to-air ratio, f:a, as shown in Figures 7 and 8. The figures arepredictions of what φ and f:a will be; however, in the future a more thorough analysis should beperformed that uses the liquid mole fractions of the 1-K kerosene obtained through gas chromatog-raphy or a distillation curve rather than an estimate obtained through linear interpolation. The mostsensitive mixtures occur at an equivalence ratio of 1.96 which corresponds to a fuel-to-air ratio of0.08.
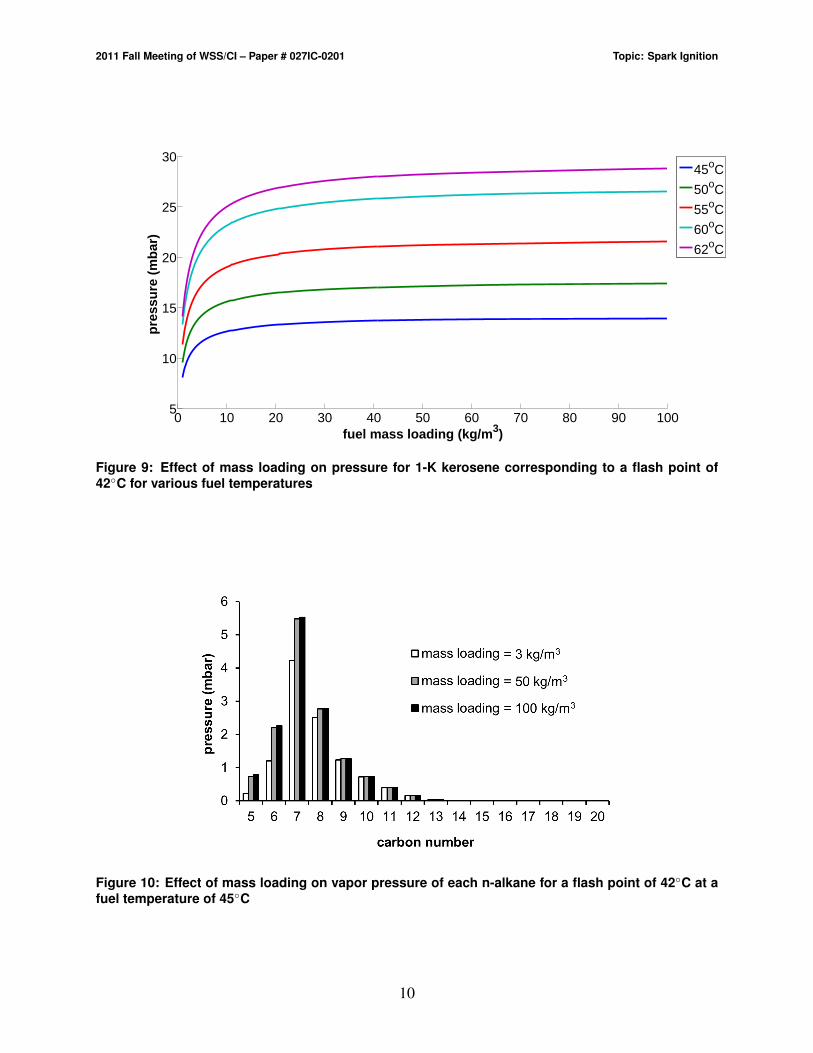
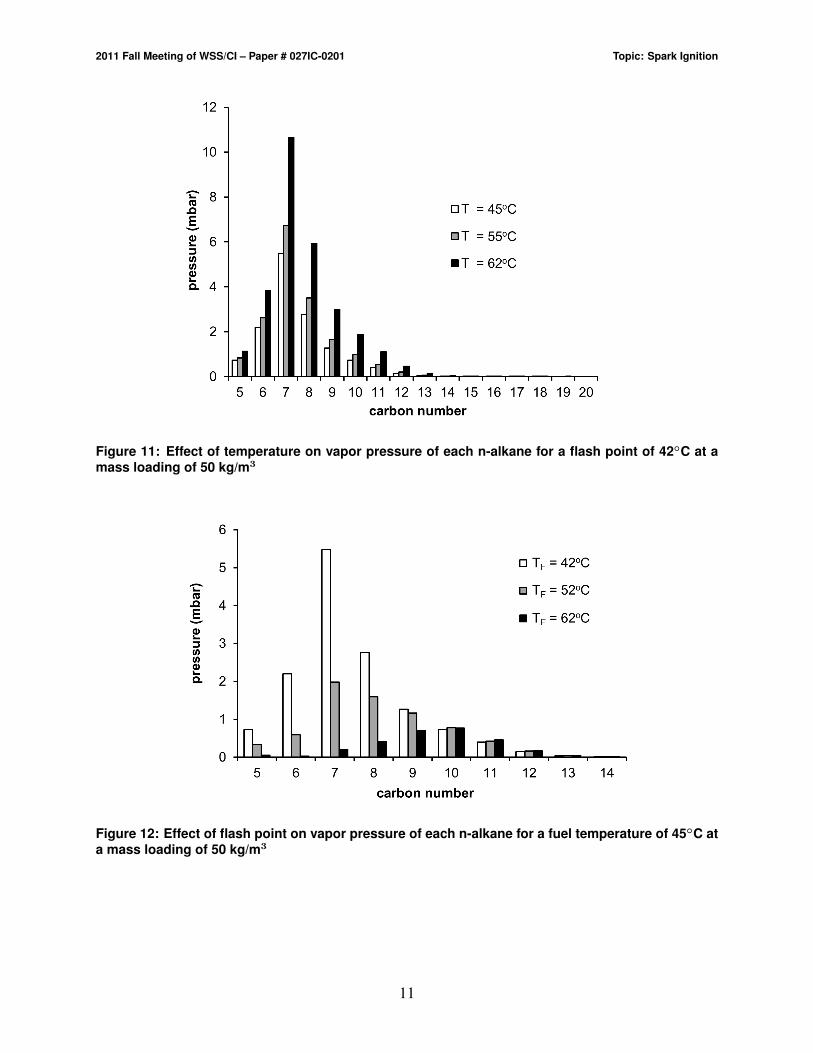
Finally, the effect of mass loading on subsection partial pressure can be predicted in Figure 9.We can see that mass loading only has an effect on pressure for low mass loadings. However, asteady value for pressure is reached as mass loading is increased. As the mass loading increases,thevapor pressure of the lighter hydrocarbons is increased significantly, as shown in Figure 10, and astemperature increases, the vapor pressure of each hydrocarbon is noticeably increased, as shownin Figure 11. For low mass loadings, the lighter hydrocarbons are scarce in the liquid fuel. Asthe mass loading increases, more lighter hydrocarbons are added to the liquid fuel that can beevaporated which is why the vapor pressure for the lighter hydrocarbons has a significant incrase.For example, for heptane we can see an increase in the vapor pressure of 1.25 mbar from 3 kg/m3
to 50 kg/m3 and only a 0.05 mbar increase from 50 kg/m3 to 100 kg/m3. As temperature increases,more of the hydrocarbons will evaporate since the saturation vapor pressure increases, therebyincreasing th partial pressure of the fuel. We can also observe that the fuel vapor blend peaks
8
2011 Fall Meeting of WSS/CI – Paper # 027IC-0201 Topic: Spark Ignition
at C7, corresponding to heptane. Finally, Figure 12 shows the effect of flash point on the fuelvapor composition for a fixed fuel temperature and mass loading. As the flash point increases, thelighter hydrocarbons are fewer and the heavier hydrocarbons are dominant in the fuel vapor. Thisis attributed to the fact that the initial liquid composition contained fewer lighter hydrocarbons forthe higher flash point.
Figure 7: Spark ignition energy for 1-K kerosene-air mixtures versus predicted equivalence ratio
Figure 8: Spark ignition energy for 1-K kerosene-air mixtures versus predicted fuel to air ratio
9
2011 Fall Meeting of WSS/CI – Paper # 027IC-0201 Topic: Spark Ignition
0 10 20 30 40 50 60 70 80 90 1005
10
15
20
25
30
fuel mass loading (kg/m3)
pre
ssu
re (
mb
ar)
45oC
50oC
55oC
60oC
62oC
Figure 9: Effect of mass loading on pressure for 1-K kerosene corresponding to a flash point of42◦C for various fuel temperatures
Figure 10: Effect of mass loading on vapor pressure of each n-alkane for a flash point of 42◦C at afuel temperature of 45◦C
10
2011 Fall Meeting of WSS/CI – Paper # 027IC-0201 Topic: Spark Ignition
Figure 11: Effect of temperature on vapor pressure of each n-alkane for a flash point of 42◦C at amass loading of 50 kg/m3
Figure 12: Effect of flash point on vapor pressure of each n-alkane for a fuel temperature of 45◦C ata mass loading of 50 kg/m3
11

2011 Fall Meeting of WSS/CI – Paper # 027IC-0201 Topic: Spark Ignition
4 Concluding Remarks
Ignition experiments were carried out for a 1-K kerosene-air mixture at different fuel temperaturesand it was determined that the most sensitive mixture was a 55◦C kerosene-air mixture. Com-parisons were made with previous ignition tests in hydrogen and hexane [7], which showed thatthe 55◦C kerosene-air mixture is more sensitive than the most sensitive hexane mixture and thecurrent mixture used by the SAE for use in aviation safety testing [9] (5% H2, 12% O2, 83% Ar).We also introduced a model to obtain a better understanding of the fuel vapor composition givenchanges in flash point, temperature, pressure and fuel mass loading. We have determined that itis possible to model a complex hydrocarbon mixture under a given set of conditions through theuse of Raolt’s law and the “headspace equation” [10]. Knowing the composition of the fuel vaporallows us to better undestand how a kerosene based fuel can be compared with a simple hydro-carbon or a binary mixture. We observed earlier that the fuel blend was dominated by heptane;therefore, in future studies we can determine whether a hydrocarbon such as heptane—which iswell studied—can be used as a surrogate in kerosene fuel studies. Also, a continuing goal of thisstudy is to develop a model for minimum ignition energy prediction given a fuel-air composition,temperature and pressure. The fuel-air composition would be obtained from the analytic model forvapor pressure prediction for a given flash point, temperature, pressure and mass loading. Basedon a review of the applicable literature, models of MIE prediction are functions of, among othervariables,the laminar burning speed and flame temperature, both of which can be obtained throughCantera or Chemkin; therefore it is imperative to use a simple hydrocarbon such as heptane. Fi-nally, further ignition tests are needed to understand the combustion characteristics of a kerosenebased fuel, such as the laminar burning speed, and to see how it compares with those of a simplehydrocarbon.
5 Acknowledgements
The experimental work was carried out in the Explosion Dynamics Laboratory of the CaliforniaInstitute of Technology and was supported by the Boeing Company through a Strategic Researchand Development Relationship Agreement CT-BA-GTA-1.
References
[1] B. Lewis and G. von Elbe. Combustion Flames and Explosions of Gases. Academic Press, NY, 1961.
[2] I. Sochet, J. M. Pascaud, and P. Gillard. J. Phys. IV Fance, 12 (2002) 429–435.
[3] L. Nestor. Investigation of turbine fuel flammability within aircraft fuel tanks. Final report ds-67-7, Naval AirPropulsion Test Center, Philadelphia, PA, 1967.
[4] E. Ott. Effects of fuel slosh and vibration on the flammability hazards of hydrocarbon turbine fuels withinaircraft fuel tanks. Tech. rep. afapl-tr-70-65, Fire Protection Branch of the Fuels and Lubrication Division,Wright-Patterson Air Force Base, Oh, OH, 1970.
[5] J. E. Shepherd, C. Krok, and J. J. Lee. Spark ignition energy measurements in jet a. Galcit report fm97-9,Graduate Aerospace Laboratories, California Institute of Technology, Pasadena, CA, 1999.
[6] J. J. Lee and J. E. Shepherd. Spark ignition measurements in jet a: part ii. Galcit report fm99-7, GraduateAerospace Laboratories, California Institute of Technology, Pasadena, CA, 2000.
12

2011 Fall Meeting of WSS/CI – Paper # 027IC-0201 Topic: Spark Ignition
[7] S. P. M. Bane, J. L. Ziegler, P. A. Boettcher, S. A. Coronel, and J. E. Shepherd. Journal of Loss Prevention inthe Process Industries, (2011) journal. In press.
[8] S. P. M. Bane, J. E. Shepherd, E. Kwon, and A. C. Day. International Journal of Hydrogen Energy, 36 (2010)2344–2350.
[9] ARP. Aerospace recommended practice aircraft lightning test methods. Arp5416, SAE International, 2005.
[10] J. E. Woodrow. The laboratory characterization of arco jet fuel vapor and liquid. Final report for ntsb, Center forEnvironmental Sciences and Engineering, University of Nevada, Reno, NV, 2000.
[11] I. Thomas. Fuel air ratio calculator.
[12] J. M. Prausnitz R. C. Reid and B. E. Poling. The Properties of Gases and Liquids. McGraw-Hill, New York,1987.
[13] B. V. Ioffe and A. G. Vitenberg. Head-Space Analysis and Related methods in Gas Chromatography. John Wiley& Sons, New York, 1984. Traslated from russian by I. A. Mamantov.
13