
Statistical Analysis and Calculation Model of Flexibility ...€¦ · clearer than that of the...
21
Hindawi Publishing Corporation Mathematical Problems in Engineering Volume 2012, Article ID 860760, 20 pages doi:10.1155/2012/860760 Research Article Statistical Analysis and Calculation Model of Flexibility Coefficient of Low- and Medium-Sized Arch Dam Su Huaizhi, 1, 2 You Ting, 2, 3 and Wen Zhiping 4 1 State Key Laboratory of Hydrology-Water Resources and Hydraulic Engineering, Hohai University, No. 1 Xikang Road, Nanjing 210098, China 2 College of Water Conservancy and Hydropower Engineering, Hohai University, No. 1 Xikang Road, Nanjing 210098, China 3 National Engineering Research Center of Water Resources Efficient Utilization and Engineering Safety, No. 1 Xikang Road, Nanjing 210098, China 4 Department of Computer Engineering, Nanjing Institute of Technology, No. 1 Hongjing Avenue, Nanjing 211167, China Correspondence should be addressed to Su Huaizhi, su [email protected] Received 8 June 2012; Accepted 20 July 2012 Academic Editor: Fei Kang Copyright q 2012 Su Huaizhi et al. This is an open access article distributed under the Creative Commons Attribution License, which permits unrestricted use, distribution, and reproduction in any medium, provided the original work is properly cited. The flexibility coefficient is popularly used to implement the macroevaluation of shape, safety, and economy for arch dam. However, the description of flexibility coefficient has not drawn a widely consensus all the time. Based on a large number of relative instance data, the relationship between influencing factor and flexibility coefficient is analyzed by means of partial least-squares regression. The partial least-squares regression equation of flexibility coefficient in certain height range between 30 m and 70 m is established. Regressive precision and equation stability are further investigated. The analytical model of statistical flexibility coefficient is provided. The flexibility coefficient criterion is determined preliminarily to evaluate the shape of low- and medium-sized arch dam. A case study is finally presented to illustrate the potential engineering application. According to the analysis result of partial least-squares regression, it is shown that there is strong relationship between flexibility coefficient and average thickness of dam, thickness-height ratio of crown cantilever, arc height ratio, and dam height, but the effect of rise-span ratio is little relatively. The considered factors in the proposed model are more comprehensive, and the applied scope is clearer than that of the traditional calculation methods. It is more suitable for the analogy analysis in engineering design and the safety evaluation for arch dam. 1. Introduction As a superior type, arch dam has been extensively used in dam construction. But its design and calculation methods are more complex than that of earth dam and gravity dam. There
Transcript of Statistical Analysis and Calculation Model of Flexibility ...€¦ · clearer than that of the...
Hindawi Publishing CorporationMathematical Problems in EngineeringVolume 2012, Article ID 860760, 20 pagesdoi:10.1155/2012/860760
Research ArticleStatistical Analysis and Calculation Model ofFlexibility Coefficient of Low- and Medium-SizedArch Dam
Su Huaizhi,1, 2 You Ting,2, 3 and Wen Zhiping4
1 State Key Laboratory of Hydrology-Water Resources and Hydraulic Engineering, Hohai University,No. 1 Xikang Road, Nanjing 210098, China
2 College of Water Conservancy and Hydropower Engineering, Hohai University, No. 1 Xikang Road,Nanjing 210098, China
3 National Engineering Research Center of Water Resources Efficient Utilization and Engineering Safety,No. 1 Xikang Road, Nanjing 210098, China
4 Department of Computer Engineering, Nanjing Institute of Technology, No. 1 Hongjing Avenue,Nanjing 211167, China
Correspondence should be addressed to Su Huaizhi, su [email protected]
Received 8 June 2012; Accepted 20 July 2012
Academic Editor: Fei Kang
Copyright q 2012 Su Huaizhi et al. This is an open access article distributed under the CreativeCommons Attribution License, which permits unrestricted use, distribution, and reproduction inany medium, provided the original work is properly cited.
The flexibility coefficient is popularly used to implement the macroevaluation of shape, safety,and economy for arch dam. However, the description of flexibility coefficient has not drawn awidely consensus all the time. Based on a large number of relative instance data, the relationshipbetween influencing factor and flexibility coefficient is analyzed by means of partial least-squaresregression. The partial least-squares regression equation of flexibility coefficient in certain heightrange between 30m and 70m is established. Regressive precision and equation stability are furtherinvestigated. The analytical model of statistical flexibility coefficient is provided. The flexibilitycoefficient criterion is determined preliminarily to evaluate the shape of low- and medium-sizedarch dam. A case study is finally presented to illustrate the potential engineering application.According to the analysis result of partial least-squares regression, it is shown that there is strongrelationship between flexibility coefficient and average thickness of dam, thickness-height ratio ofcrown cantilever, arc height ratio, and dam height, but the effect of rise-span ratio is little relatively.The considered factors in the proposed model are more comprehensive, and the applied scope isclearer than that of the traditional calculation methods. It is more suitable for the analogy analysisin engineering design and the safety evaluation for arch dam.
1. Introduction
As a superior type, arch dam has been extensively used in dam construction. But its designand calculation methods are more complex than that of earth dam and gravity dam. There

2 Mathematical Problems in Engineering
are the following problems. First of all, to implement the comparative analysis for differentdesign schemes of arch dam, some shape data are lack of reference. Secondly, it is difficultto estimate the earthwork volume index of dam body which is used to determine the damshape and assess the economy. The problem has an impact on selection of dam site anddetermination of project scale during engineering preplanning. With the help of flexibilitycoefficients, macroevaluation of arch dam’s shape, security, and economy has recentlybecome important research topic in the field of dam.
Lombardi [1], who is a famous dam expert in Swiss, first proposed the “flexibilitycoefficient” concept during researching the Kolnbrein dam heel cracking. The calculationequation of flexibility coefficient C was given as follows. C = A2/VH, where A is thedeveloped area of the arch dam in upstream face, m2; V is the earthwork volume of dam,m3; H is the arch dam height, m. And the above flexibility coefficient was used to assess thearch dam safety. Lombardi considered that in normal conditions, when the value ofC is about15, the arch is safe; in the higher concrete grouting technology and rational construction, thevalue of C can be up to 20. After that, many dam experts began to research the calculationmodels and functions. Many calculation models were built and its application scope got agreat expansion. Lombardi damage line was proposed to distinguish empirically the crackingdamage of the arch dam [2, 3]. The flexibility coefficient was introduced to estimate thereasonability on structure design of arch dam [4], implement the optimization design of archdam shape [5], and assess the arch dam safety [6, 7].
On the whole, the existing definition and calculation method on the flexibilitycoefficient are accuracy and concision. They can embody the flexibility degree of arch damat the horizontal direction. However, there are some questions to analyze and perfect. Forexample, the differences of flexibility coefficient between various canyon shapes are greatwhich also have not some certain roles. In the condition of similar shape and height, alarge difference in flexibility coefficient will affect engineering analogy analysis and archshape design. Sometimes safety degree of the arch dam is unconscionable to reflect throughLombardi damage line building by flexibility coefficient.
Based on above problems in existing research, a large number of statistical data on low-and medium-sized arch dams are collected and implemented the regression analysis. Thepartial least-squares regression method is used to analyze the statistical data of the relatedfactors on flexibility coefficient. The calculation model of flexibility coefficient is built. Thestatistical flexibility coefficient is proposed.
2. Analysis Method of Partial Least-Squares Regression
As a commonly multivariate statistical analysis method, PLSR (partial least-squaresregression) combines the basic functions in multiple linear regression analysis, principalcomponent analysis, and typical correlation analysis. It can be used to solve effectively themulticollinearity between the independent variables. After a partial least-squares regressionanalysis, the regression model between independent variable and dependent variable can benot only obtained but also the correlation between variables can be analyzed. It makes theanalysis more richer and makes the interpretation of the regression model deeper.
(1) Basic Idea
A multiple linear regression model can be described as follows:
Y = XB + ε, (2.1)
Mathematical Problems in Engineering 3
where Y is dependent-variable vector; X is independent variable matrix; B is regressioncoefficient vector; ε is residual vector.
The least-square estimation of regression coefficient vector B is
B =(X′X
)−1X′Y. (2.2)
When multiple correlation is existed in factors belong to X, and X′X is singular matrix orsimilar to singular, the least-square estimation will become invalid.
Partial least-squares regression extracts the principal component t1 and u1 from the Xand Y . t1 and u1 as much as possible carry variability information from their own data table.At the same time, relevance of t1 and u1 reaches to maximum. After extraction, regression iscarried out, respectively, through X to t1 and Y to t1. If the regression equation is accuracy,the algorithm is terminated; otherwise, the second round of extraction is conducted makinguse of the residual information thatX is explained by t1, Y by t1. It is reciprocating until it canreach a satisfactory accuracy.
(2) Simplified Algorithm of Partial Least Squares for Unit-Dependent Variable
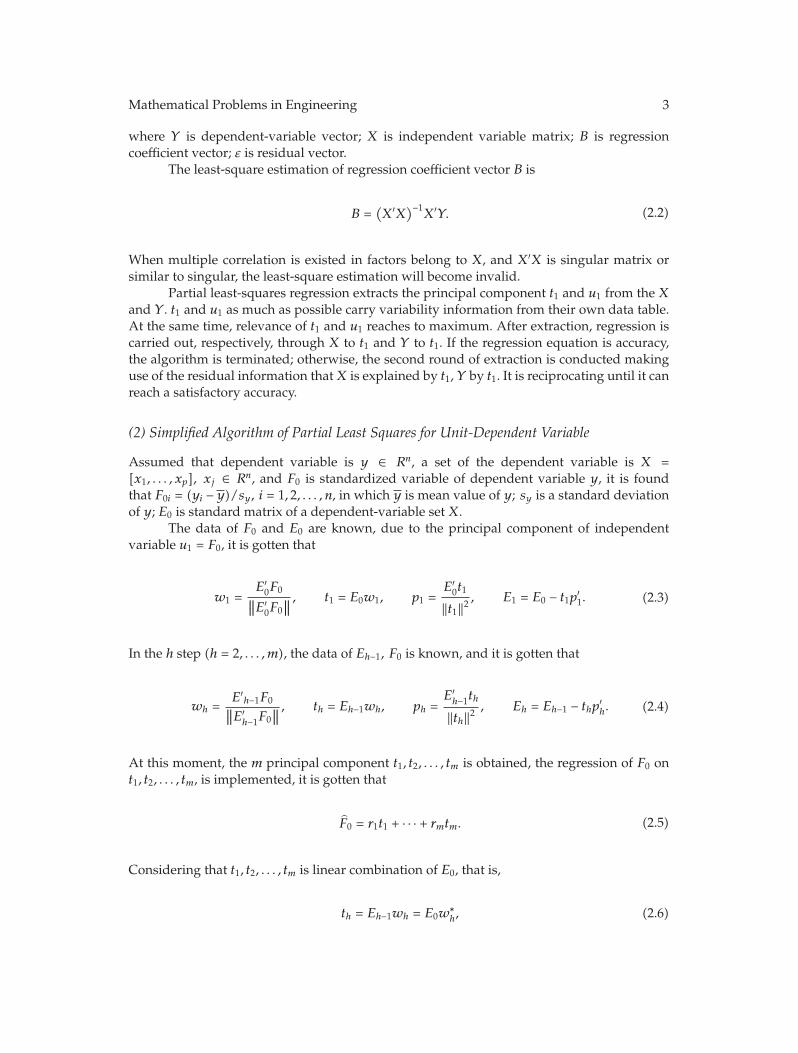
Assumed that dependent variable is y ∈ Rn, a set of the dependent variable is X =[x1, . . . , xp], xj ∈ Rn, and F0 is standardized variable of dependent variable y, it is foundthat F0i = (yi − y)/sy, i = 1, 2, . . . , n, in which y is mean value of y; sy is a standard deviationof y; E0 is standard matrix of a dependent-variable set X.
The data of F0 and E0 are known, due to the principal component of independentvariable u1 = F0, it is gotten that
w1 =E′0F0
∥∥E′0F0
∥∥ , t1 = E0w1, p1 =E′0t1
‖t1‖2, E1 = E0 − t1p
′1. (2.3)
In the h step (h = 2, . . . , m), the data of Eh−1, F0 is known, and it is gotten that
wh =E′
h−1F0∥∥E′h−1F0
∥∥ , th = Eh−1wh, ph =E′h−1th
‖th‖2, Eh = Eh−1 − thp
′h. (2.4)
At this moment, the m principal component t1, t2, . . . , tm is obtained, the regression of F0 ont1, t2, . . . , tm, is implemented, it is gotten that
F0 = r1t1 + · · · + rmtm. (2.5)
Considering that t1, t2, . . . , tm is linear combination of E0, that is,
th = Eh−1wh = E0w∗h, (2.6)

4 Mathematical Problems in Engineering
where w∗h = E0
∏h−1j=1 (I − wjp
′j)wh, so F0 could be written to linear combination style of E0.
That is,
F0 = r1E0w∗1 + · · · + rmE0w
∗m = E0
[m∑
h=1
rhw∗h
]
. (2.7)
Finally, it can be converted to regression equation y for x1, x2, . . . , xp
y = α0 + α1x1 + · · · + αpxp. (2.8)
(3) Cross-Validation (CV)
All the n sample points are divided into two parts adopting the working style similarto sampling test method. The first part is a set of the rest sample points (containing n-isample points) removing a sample point i, and a regression equation is fitted by h principalcomponents and these partial sample points; the second part is a sample point i whichis substituted into regression equation, and a fitted value of regression equation yh(−i) hasgotten. For each i = 1, 2, . . . , n, the above steps are repeated, and the forecasting error squaresum for y PRESSh can be obtained
PRESSh =n∑
i=1
(yi − yh(−i)
)2. (2.9)
Adopting all sample points, regression model is established fetching h principalcomponents. The i sample point is substituted into regression mode, and then a fitted valueof yhi can be obtained. If all of sample points are substituted successively, error square sumSSh for y is defined
SSh =n∑
i=1
(yi − yhi
)2. (2.10)
For the principal component th, CV is defined as
Q2h = 1 − PRESSh
SS(h−1). (2.11)
A great amount of research indicates that when Q2h≥ 0.0975, the contribution of the
principal component th on regression is outstanding, namely, the increase of the principalcomponent th is beneficial; otherwise, it should stop introducing the principal component.
(4) Precision Analysis
In the partial least-squares regression, the principal component th extracted from indepen-dent variable not only represents variability information in X as much as possible but also
Mathematical Problems in Engineering 5
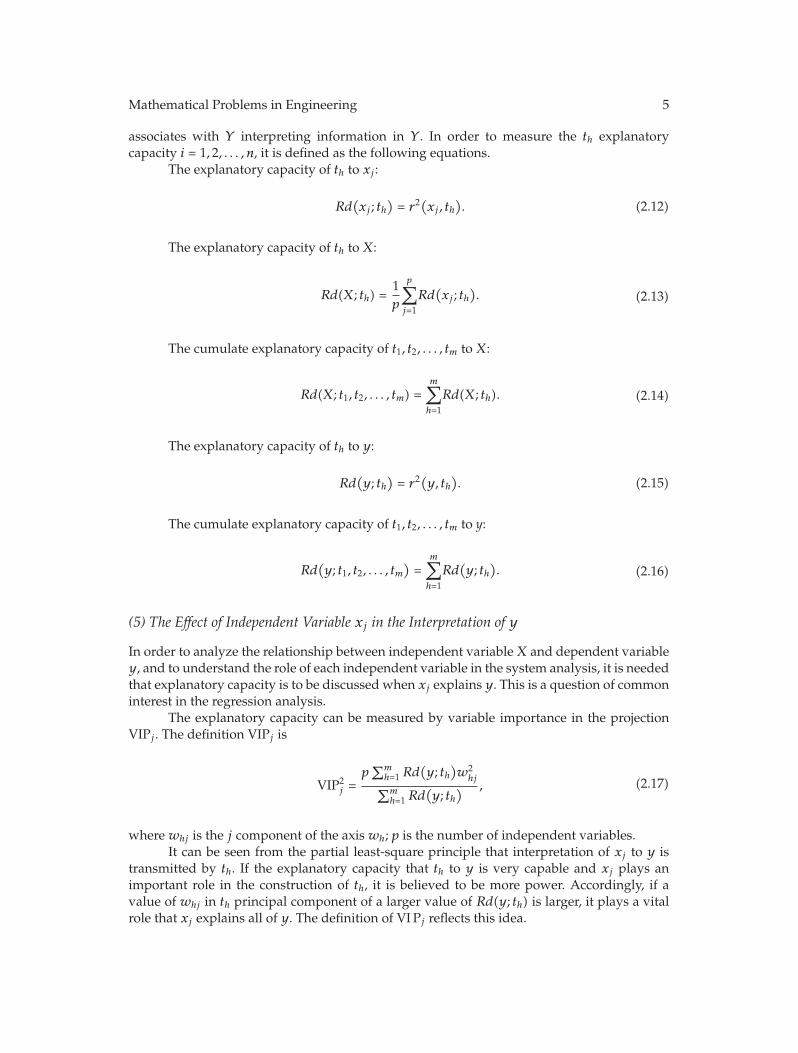
associates with Y interpreting information in Y . In order to measure the th explanatorycapacity i = 1, 2, . . . , n, it is defined as the following equations.
The explanatory capacity of th to xj :
Rd(xj ; th
)= r2
(xj , th
). (2.12)
The explanatory capacity of th to X:
Rd(X; th) =1p
p∑
j=1
Rd(xj ; th
). (2.13)
The cumulate explanatory capacity of t1, t2, . . . , tm to X:
Rd(X; t1, t2, . . . , tm) =m∑
h=1
Rd(X; th). (2.14)
The explanatory capacity of th to y:
Rd(y; th
)= r2
(y, th
). (2.15)
The cumulate explanatory capacity of t1, t2, . . . , tm to y:
Rd(y; t1, t2, . . . , tm
)=
m∑
h=1
Rd(y; th
). (2.16)
(5) The Effect of Independent Variable xj in the Interpretation of y
In order to analyze the relationship between independent variable X and dependent variabley, and to understand the role of each independent variable in the system analysis, it is neededthat explanatory capacity is to be discussed when xj explains y. This is a question of commoninterest in the regression analysis.
The explanatory capacity can be measured by variable importance in the projectionVIPj . The definition VIPj is
VIP2j =
p∑m
h=1 Rd(y; th
)w2
hj∑m
h=1 Rd(y; th
) , (2.17)
where whj is the j component of the axis wh; p is the number of independent variables.It can be seen from the partial least-square principle that interpretation of xj to y is
transmitted by th. If the explanatory capacity that th to y is very capable and xj plays animportant role in the construction of th, it is believed to be more power. Accordingly, if avalue of whj in th principal component of a larger value of Rd(y; th) is larger, it plays a vitalrole that xj explains all of y. The definition of VI Pj reflects this idea.

6 Mathematical Problems in Engineering
In addition, the square sum p of VIPj can also be deduced for all factors. Therefore, ifthe function is similar for p independent variables as interpretation, all of the VIPj are 1. Thegreater the value of VIPj is, the deeper the function of interpretation is.
3. Statistical Calculation Model of Flexibility Coefficient for ArchDam Based on the Project Cases
3.1. Dependent Variable Selection of Flexibility Coefficient and Project Data
According to the definition and existing research results of flexibility coefficient, dependentvariable factor set of flexibility coefficient is selected as follows: X = {x1, x2, . . . , x12} = (damheight, temperature drop, concrete volume of the dam, central plane area, average thicknessof dam, thickness-height ratio of crown cantilever, arc-height ratio, chord length-height ratio,rise-span ratio, Top boom-bottom chord ratio of downstream face (this is also called valleyshape factor), upstream face area of normal water level, dam water thrust of normal waterlevel). The actual project data collected is shown in Figure 1. Data used in this paper arederived from actual dam projects. Data of the actual project cases above have the followingcharacteristics.
(1) Dam height is between 30m–70m.
(2) According to the design code of concrete arch dam (SL282-2003), arch damthickness is divided. The ratio of above arch dams is thin arch dam :medium archdam : thick arch dam = 38% : 61% : 1%.
(3) According to arch ring type, various types of arch dams above in the ratioare parabolic variable-thickness double-curved arch : double-curvature constantthickness arch damwith single-centered arc : others (such as mixture-type arch damand circular variable thickness arch dam with five-centered arc) = 68% : 9% : 23%.
(4) Dams of discharging through crest orifice, which account for 66% of the total, areusually used.
3.2. The PLSR Analysis of Flexibility Coefficient
3.2.1. Establishment of PLSR Equation for Flexibility Coefficient
According to (2.9)–(2.11), the principal component cross-validation of data is
{Q2
1, Q22, Q
23, Q
24, Q
25
}= {0.3581, 0.1965, 0.1496, 0.2161,−0.0802}. (3.1)
According to cross validation principle, when Q2h ≥ 0.0975, the contribution of principal
component tn to regression equation is significant. Then introducing tn and the first fourprincipal components are necessary.

Mathematical Problems in Engineering 7
Table 1: The explanatory capacity of main components to dependent variables and independent variables.
x1 x2 x3 x4 x5 x6 x7t1 0.631 0.223 0.308 0.226 0.400 0.001 0.181t2 0.258 0.029 0.546 0.729 0.248 0.012 0.230t3 0.038 0.004 0.117 0.022 0.303 0.869 0.447t4 0.012 0.165 0.003 0.000 0.005 0.032 0.103
x8 x9 x10 x11 x12 yt1 0.156 0.061 0.190 0.191 0.276 0.488t2 0.230 0.000 0.058 0.767 0.677 0.204t3 0.441 0.003 0.011 0.011 0.000 0.119t4 0.152 0.293 0.138 0.000 0.004 0.066
Through calculating and analyzing, the PLSR equations of standardized data and rawdata are (3.2) and (3.3), respectively,
F0 = − 8.307 × 10⁻²E01 + 2.874 × 10⁻²E02 − 0.168E03 + 0.260E04 − 0.753E05
− 0.507E06 + 0.378E07 + 0.416E08 − 0.186E09 + 0.220E10 + 0.280E11 + 0.178E12,(3.2)
y = 21.770 − 3.610 × 10−2x1 + 0.102x2 − 4.362 × 10−5x3 + 6.664 × 10−4x4 − 1.872x5
− 46.043x6 + 2.186x7 + 2.761x8 − 6.863x9 + 7.548x10 + 7.574 × 10−4x11 + 1.900 × 10−5x12.
(3.3)
Multiple correlation coefficients R and F of raw data PLSR equation are 0.936 and21.384, respectively.
3.2.2. The Precision Analysis
According to (2.12)–(2.16), the explanatory capacity and the accumulative explanatorycapacity of main components to dependent variables and independent variables arecalculated. The results are shown in Tables 1 and 2.
(1) As can be seen from Table 1, explanatory capacity of each component toindependent variables is the capacity that how many variation information canbe used in the analysis process. Sometimes the capacity is little, even nothing.This is mainly because that (1) the PLSR requires the covariance between maincomponents and dependent variables be maximum. However, when it is maximal,explaining capacity of some main components to independent variables is low. (2)The contribution of certain independent variables to somemain components is littleor nothing.
(2) As can be seen from Table 2, the total explaining capacity of dependent variable is87.7% and that of independent variable is 81.7%.
(3) The explaining capacity of t1 to variation information in y is 48.8%, and the linearcorrelation coefficient between them is 0.7. There is a good linear correlation.
Based on the above analysis, the data have relatively good linear trend and the PLSRequation has high precision. They can well reflect the average law between X and y.

8 Mathematical Problems in Engineering
Table 2: The accumulative explanatory capacity of main components to dependent variables andindependent variables.
t1 t2 t3 t4The explanatory capacity on X 0.237 0.315 0.189 0.076The accumulative explanatory capacity on X 0.237 0.552 0.741 0.817The accumulative explanatory capacity on Y 0.488 0.692 0.811 0.877
3.2.3. The Explanatory Role Analysis of Independent Variable to Dependent Variable
According to (2.17), variable importance in the projection VIP can be calculated, and thehistogram can be drawn in Figure 2. From Figure 2, it shows the following.
(1) The VIP values of x5, x6, x7, x8 are greater than 1 and that of x1 is near 1. Fromthe explanatory capability of independent variable xj to dependent variable y, itcan be known that all the VIPj is 1 when the explanatory role of them to y is thesame aiming at p independent variables. When the VIPj value is bigger than 1, thecapability of explaining y is bigger. It can be seen that these five factors (averagethickness of the dam, thickness-height ratio, arc length-height ratio, chord length-height ratio, dam height) are significant in explaining y.
(2) The VIP value of x9 is smallest. It shows that the explanatory capability of x9 to y isweakest.
From the dam structure, clearly, the average dam thickness and dam height have agreat influence on the flexibility; the thickness-height ratio and the arc length-height ratioof crown cantilever, which reflect the thickness of arch dam and valley shape, have a majorimpact on the shape of arch dam, then affect the flexibility coefficient. The ratio of arc andchord of the dam crest is x9, which just reflects the bending degree of horizontal arch of damcrest and has a limited impact on the overall dam.
3.2.4. The Evaluation of Regression Equation Stability
According to the complexity of flexibility coefficient factors and the requirement of sampledata, the method of stability in this paper is that after extracting a certain amount of the date,build the model by remaining data, make a coefficient compared, and judge stability of theequation. The specific implementation is to remove five sample points by three times andbuild the model with the remaining data.
After removing the extracted sample points and judging the main ingredients numberof remaining data, the PLSR model can be made. In order to compare easily, the coefficient,result of regression model of the standardized data, can be used to be compared. Thecalculated specific factors are shown in Table 3. From the table it can be seen that the changeof coefficient is within 5% excepting x1, x2 (dam height factor and temperature drop factor)by means of comparing each sampling factors and original factors. Stability of the wholecoefficient is relatively good.

Mathematical Problems in Engineering 9
80
70
60
50
40
30
200 10 20 30 40 50 60 70 80
15
13
11
9
7
5
Dam code
Dam heightTemperature drop
Tem
pera
ture
dro
p(◦
C)
Dam
hei
ght(
m)
(a)
0 10 20 30 40 50 60 70 80
Dam code
200000
160000
120000
80000
40000
0 0
20000
15000
10000
5000
Concrete volume of the damCentral plane area
Cen
tral
pla
ne a
rea(m
2 )
Con
cret
e vo
lum
e of
the
dam
(m3 )
(b)
0 10 20 30 40 50 60 70 80
Dam code
20
15
10
5
0
0.5
0.4
0.3
0.2
0.1
0
Average thickness of damThickness-height ratio of crown cantilever
Thi
ckne
ss-h
eigh
t rat
ioof
cro
wn
cant
ileve
r
Ave
rage
thic
knes
sof
dam
(m)
(c)
5
4
3
2
1
0
5
4
3
2
1
0
Arc-height ratioChord length-height ratio
Arc
-hei
ght r
atio
Cho
rd le
ngth
-hei
ght
rati
o
0 10 20 30 40 50 60 70 80
Dam code
(d)
Figure 1: Continued.

10 Mathematical Problems in Engineering
0 10 20 30 40 50 60 70 80
Dam code
1.5
1.25
1
0.75
0.5
1
0.8
0.6
0.4
0.2
0
Rise-span ratioValley shape factor
Ris
e-sp
an r
atio
Val
ley
shap
e fa
ctor
(e)
0 10 20 30 40 50 60 70 80
Dam code
10000
8000
6000
4000
2000
0
500000
400000
300000
200000
100000
0
Upstream face area of normal water levelDam water thrust of normal water level
Ups
trea
m fa
ce a
rea
of n
orm
alw
ater
leve
l(m
2 )
Dam
wat
er th
rust
of n
orm
alw
ater
leve
l(t)
(f)
Figure 1: The actual project data of dependent variables for flexibility coefficient.
2.5
2
1.5
1
0.5
0x1 x2 x3 x4 x5 x6 x7 x8 x9 x10 x11 x12
Factor
VIP
Figure 2: Variable importance in the projection.
3.2.5. The Statistical Calculation Model of Flexibility Coefficient
The above regression analysis is implemented to obtain the PLSR equation of flexibilitycoefficient in certain dam height range between 30m and 70m. From stability and regression
Mathematical Problems in Engineering 11
25
20
15
10
5
00 2 4 6 8 10 12 14 16 18
ModerateThinnerThicker
Flex
ibili
ty c
oeffi
cien
tAverage thickness (m)
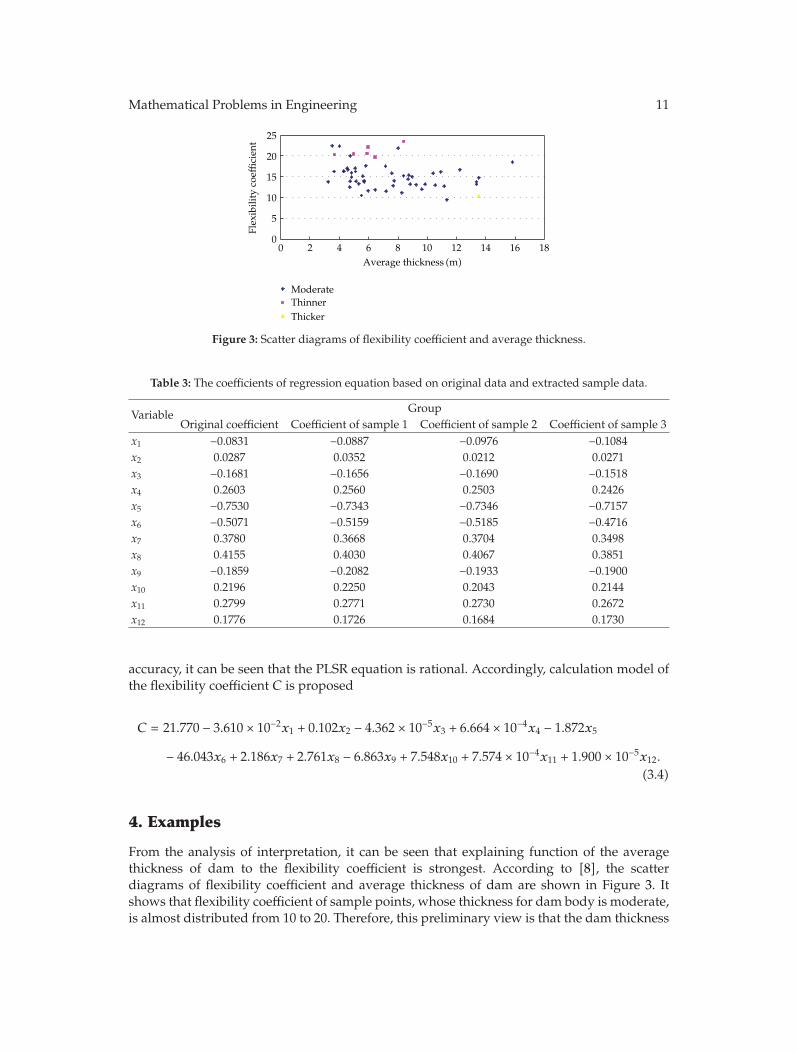
Figure 3: Scatter diagrams of flexibility coefficient and average thickness.
Table 3: The coefficients of regression equation based on original data and extracted sample data.
Variable GroupOriginal coefficient Coefficient of sample 1 Coefficient of sample 2 Coefficient of sample 3
x1 −0.0831 −0.0887 −0.0976 −0.1084x2 0.0287 0.0352 0.0212 0.0271x3 −0.1681 −0.1656 −0.1690 −0.1518x4 0.2603 0.2560 0.2503 0.2426x5 −0.7530 −0.7343 −0.7346 −0.7157x6 −0.5071 −0.5159 −0.5185 −0.4716x7 0.3780 0.3668 0.3704 0.3498x8 0.4155 0.4030 0.4067 0.3851x9 −0.1859 −0.2082 −0.1933 −0.1900x10 0.2196 0.2250 0.2043 0.2144x11 0.2799 0.2771 0.2730 0.2672x12 0.1776 0.1726 0.1684 0.1730
accuracy, it can be seen that the PLSR equation is rational. Accordingly, calculation model ofthe flexibility coefficient C is proposed
C = 21.770 − 3.610 × 10−2x1 + 0.102x2 − 4.362 × 10−5x3 + 6.664 × 10−4x4 − 1.872x5
− 46.043x6 + 2.186x7 + 2.761x8 − 6.863x9 + 7.548x10 + 7.574 × 10−4x11 + 1.900 × 10−5x12.
(3.4)
4. Examples
From the analysis of interpretation, it can be seen that explaining function of the averagethickness of dam to the flexibility coefficient is strongest. According to [8], the scatterdiagrams of flexibility coefficient and average thickness of dam are shown in Figure 3. Itshows that flexibility coefficient of sample points, whose thickness for dam body is moderate,is almost distributed from 10 to 20. Therefore, this preliminary view is that the dam thickness

12 Mathematical Problems in Engineering
Figure 4: Arch dam plan.
Table 4: The calculated results of statistical factors for one arch dam.
x1 x2 x3 x4 x5 x634 12.1 13768 3824.11 3.6 0.206x7 x8 x9 x10 x11 x125.129 3.965 1.336 0.263 3607.94 48453.13
is moderate, whose flexibility coefficient is from 10 to 20. When it is more than 20, the dam isthinner; when less than 20, the dam is thicker.
Based on the above evaluation criteria and the calculation model (3.4), the structuralsafety of an arch dam project is studied. With the help of the stress analysis results of thisarch dam, the feasibility and reliability of the calculation model of flexibility coefficient andits criterion is verified.
4.1. Project Introduction
The arch dam project began in 1974 and basically completed in 1979. The dam is a concretedouble-curvature masonry arch dam, whose total storage capacity is 120.5 ten thousand m3,crest elevation is 121.0m, bottom elevation is 86.0m, the maximum dam height is 35m,thickness of the dam crest is 2m, thickness of the dam bottom is 7m, thickness-height ratiois 0.2, chord length of dam crest is 128.2m, width-height ratio is 3.66, central angle of damcrest is 120◦, and central angle of dam bottom is 60◦. At the corresponding dam height of 4m,setting a horizontal fracture, cutting beam-based, and using bridge-type rubber to stop waterare to be done. The spill way whose net width is 30m is arranged on the dam crest. Curvedform of free jump is used to overflow.
4.2. Safety Evaluation of Arch Dam Structure Based on the ProposedModel and Criteria
The shape calculation of above arch dam is implemented. The results are shown in Table 4.The values of factors in Table 4 are substituted into calculation model of flexibility
coefficient (see (3.4)). The flexibility coefficient of the arch dam is 26.13, larger than 20.Therefore, the dam is deemed to be relatively thin and the structure safety is lower.
4.3. Safety Check for Arch Dam Based on the Calculation Results ofDam Stress
Dam stress is calculated and analyzed to check for the rationality of the above results.
Mathematical Problems in Engineering 13
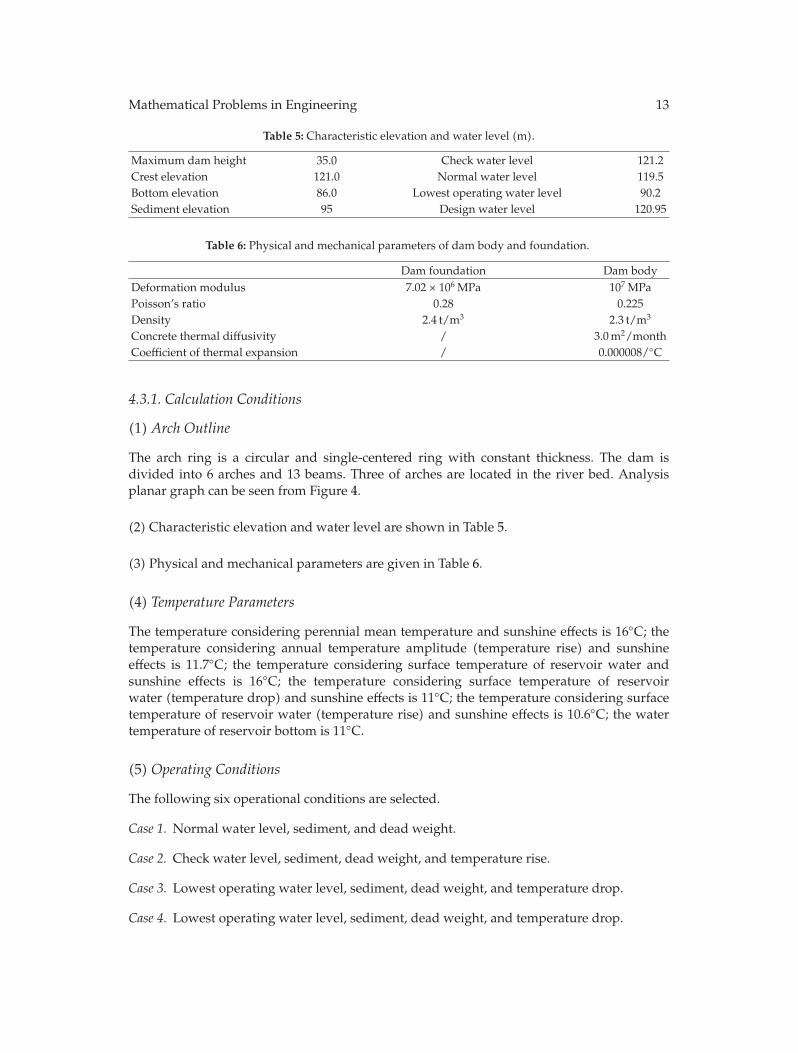
Table 5: Characteristic elevation and water level (m).
Maximum dam height 35.0 Check water level 121.2Crest elevation 121.0 Normal water level 119.5Bottom elevation 86.0 Lowest operating water level 90.2Sediment elevation 95 Design water level 120.95
Table 6: Physical and mechanical parameters of dam body and foundation.
Dam foundation Dam bodyDeformation modulus 7.02 × 10⁶ MPa 107 MPaPoisson’s ratio 0.28 0.225Density 2.4 t/m3 2.3 t/m3
Concrete thermal diffusivity / 3.0m2/monthCoefficient of thermal expansion / 0.000008/◦C
4.3.1. Calculation Conditions
(1) Arch Outline
The arch ring is a circular and single-centered ring with constant thickness. The dam isdivided into 6 arches and 13 beams. Three of arches are located in the river bed. Analysisplanar graph can be seen from Figure 4.
(2) Characteristic elevation and water level are shown in Table 5.
(3) Physical and mechanical parameters are given in Table 6.
(4) Temperature Parameters
The temperature considering perennial mean temperature and sunshine effects is 16◦C; thetemperature considering annual temperature amplitude (temperature rise) and sunshineeffects is 11.7◦C; the temperature considering surface temperature of reservoir water andsunshine effects is 16◦C; the temperature considering surface temperature of reservoirwater (temperature drop) and sunshine effects is 11◦C; the temperature considering surfacetemperature of reservoir water (temperature rise) and sunshine effects is 10.6◦C; the watertemperature of reservoir bottom is 11◦C.
(5) Operating Conditions
The following six operational conditions are selected.
Case 1. Normal water level, sediment, and dead weight.
Case 2. Check water level, sediment, dead weight, and temperature rise.
Case 3. Lowest operating water level, sediment, dead weight, and temperature drop.
Case 4. Lowest operating water level, sediment, dead weight, and temperature drop.

14 Mathematical Problems in Engineering
Case 5. Normal water level, sediment, dead weight, and temperature rise.
Case 6. Design water level, sediment, dead weight, and temperature rise.
4.3.2. Calculation Results
(1) Maximum Dam Surface Stress
Maximum dam surface stress of every condition can be seen in Table 7.
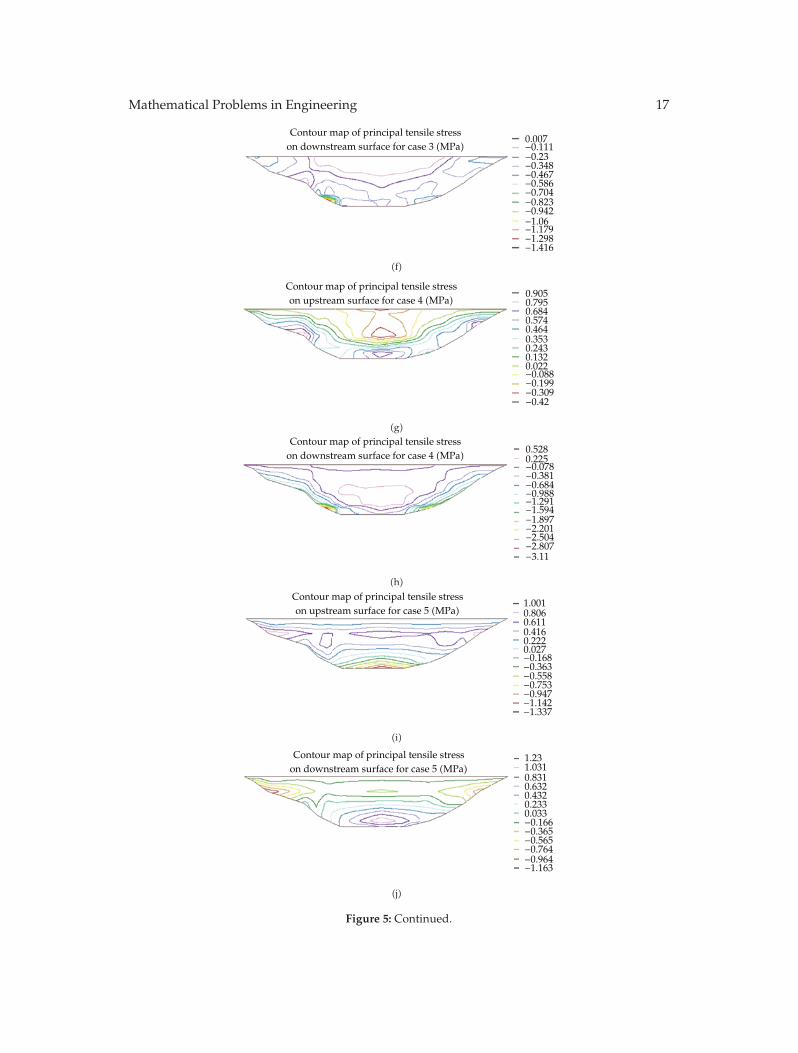
(2) Contour Map of Principal Tensile Stress on the Dam Surface
For low and medium arch dam dominated by tensile stress, contour map of principal tensilestress is only given (see Figure 5).
4.3.3. Stress Analysis
The following can be seen from stress distributions.
(1) For the first, second, and sixth conditions, the upstream tensile stress exceeds theallowed value. The stress value is largest at the first condition, which is at thenormal water level, and is distributed approximately in the whole river bed of theupstream dam bottom. The downstream tensile stresses of three conditions meetthe standard value.
(2) For the third and fourth conditions, the upstream tensile stresses meet the standardvalue. But the downstream tensile stresses at the middle-lower part of the abutmentexceed the standard value. The maximum tensile stress occurred at the fourthcondition, up to 3.11MPa, which is far more than the norms.
(3) For the fifth condition, the upstream tensile stress at the bottom of dam exceedsthe standard value, and the downstream tensile stress at the abutment exceeds thestandard value.
In addition, themaximum radial displacement to the downstream is 17.2mm, to the upstreamis 8.47mm, which is a little high for arch dams whose heights are 30m–35m. That shows thatthe overall stiffness of the arch dam is not high and the ability of deformation resistance isfinite.
From the above analysis, they can be seen that stress distributions of this arch damare not good, and the radial displacement is relatively large. It is reason that there areunreasonable shape design, relatively small average thickness of arch dam, and relativelysmall overall stiffness. They also have been proved from comparisons of arch dams that arethe same height range to the case.
4.4. Results Comparison
From the stress analysis, it can be known that the dam is relatively thin and lower structuresafety keeping in step with the introduced model. In addition, during dam safety evaluation,experts also think that the dam is a little thin and has a limited overload capacity, whichshowed that it is feasible to evaluate arch dam safety with the introduced model once more.

Mathematical Problems in Engineering 15
Table
7:Max
imum
dam
surfacestress
ofev
erycond
ition(M
Pa).
Case
Ups
tream
surface
Dow
nstream
surface
Max
imum
principa
ltens
ilestress
Position
Max
imum
principa
lpressu
restress
Position
Max
imum
principa
lpressu
restress
Position
Max
imum
principa
lpressu
restress
Position
Case1
2.54
7R0C
1.88
3R0C
0.69
3R0C
3.22
7R0C
Case2
1.66
7R0C
2.00
1R-7C
0.74
3R-5C
2.49
7R0C
Case3
0.66
1R-7C
2.24
6R-2C
1.42
6R-2C
1.09
7R0C
Case4
0.42
4R0C
3.70
6R-2C
3.11
6R-2C
1.28
1R-7C
Case5
1.34
7R0C
1.77
1R-7C
1.16
3R-5C
2.19
7R0C
Case6
1.60
7R0C
1.96
1R-7C
0.82
3R-5C
2.44
7R0C

16 Mathematical Problems in Engineering
0.9970.7020.4070.112−0.182−0.477−0.772−1.066−1.361−1.656−1.95−2.245−2.54
Contour map of principal tensile stresson upstream surface for case 1 (MPa)
(a)
1.5371.3511.1650.9790.7930.6070.4210.2350.049−0.137−0.323−0.509−0.695
Contour map of principal tensile stresson downstream surface for case 1 (MPa)
(b)
0.8830.6710.460.2480.036−0.175−0.387−0.599−0.81−1.022−1.233−1.445−1.657
Contour map of principal tensile stresson upstream surface for case 2 (MPa)
(c)
1.2651.0970.930.7630.5960.4290.2610.094−0.073−0.24−0.408−0.575−0.742
Contour map of principal tensile stresson downstream surface for case 2 (MPa)
(d)
0.027−0.03−0.088−0.145−0.203−0.26−0.318−0.375−0.433−0.49−0.548−0.605−0.663
Contour map of principal tensile stresson upstream surface for case 3 (MPa)
(e)
Figure 5: Continued.
Mathematical Problems in Engineering 17
0.007−0.111−0.23−0.348−0.467−0.586−0.704−0.823−0.942−1.06−1.179−1.298−1.416
Contour map of principal tensile stresson downstream surface for case 3 (MPa)
(f)
0.9050.7950.6840.5740.4640.3530.2430.1320.022−0.088−0.199−0.309−0.42
Contour map of principal tensile stresson upstream surface for case 4 (MPa)
(g)
0.5280.225−0.078−0.381−0.684−0.988−1.291−1.594−1.897−2.201−2.504−2.807−3.11
Contour map of principal tensile stresson downstream surface for case 4 (MPa)
(h)
1.0010.8060.6110.4160.2220.027−0.168−0.363−0.558−0.753−0.947−1.142−1.337
Contour map of principal tensile stresson upstream surface for case 5 (MPa)
(i)
1.231.0310.8310.6320.4320.2330.033−0.166−0.365−0.565−0.764−0.964−1.163
Contour map of principal tensile stresson downstream surface for case 5 (MPa)
(j)
Figure 5: Continued.

18 Mathematical Problems in Engineering
0.9540.7410.5290.3160.104−0.109−0.321−0.534−0.746−0.958−1.171−1.383−1.596
Contour map of principal tensile stresson upstream surface for case 6 (MPa)
(k)
1.2581.0850.9110.7380.5650.3910.2180.045−0.129−0.302−0.475−0.649−0.822
Contour map of principal tensile stresson downstream surface for case 6 (MPa)
(l)
Figure 5: Contour map of principal tensile stress on the dam surface.
5. Conclusions
In recent years, flexibility coefficient, which is an objective index, is put forward to deal withproblems, such as much subjective evaluation to the body safety of arch dam and lack ofcriteria of determining shape parameters of shape design. Flexibility coefficient has a uniqueadvantage on the macroevaluation of arch dam shape, safety, and economy. Accordingto large numbers of projects data, statistic rules of flexibility coefficient of arch dam arestudied from the perspective of regression. The regressive equation of flexibility coefficient incertain height range, which is based on partial least-squares method, is established. Further,regressive precision and equation stability is analyzed deeply. And the calculation modelof statistical flexibility coefficient is presented. A case application shows that the model hascertain application value.
(1) After analyzing explanatory capacity of factors to dependent variable, the resultshows that average thickness of dam, thickness-height ratio of crown cantilever,arc-height ratio, and dam height have the higher explanation ability than others.The relation between them should be focused mainly when calculating flexibilitycoefficient.
(2) Compared to traditional methods calculate of flexibility coefficient, the model inthis paper has a comprehensive consideration, such as the valley shape coefficientthat reflects the valley shape, thickness-height ratio that reflects arch dam thicknessand thinness, and temperature-lowering load that has an important influence toarch dam stress, and the force of water and areas of upstream face in normal waterlevel in the dam working. There is a wider application in calculating dam volumeinversely. Traditional models do not distinguish dam height. But the rationalityis worth to be discussed. It is because that the low- and medium-sized and the

Mathematical Problems in Engineering 19
high-sized arch dam have different stress conditions and methods. While statisticalflexibility coefficient presented by this paper has a clear operating range, it is moresuitable to analogy analysis and study on variation of flexibility coefficient.
(3) Because the designing method of arch dam is more complex than gravity dam andearth dam. For specific valley conditions, project quantity can not be estimatedquickly, which bring many difficulties to choose dam site and determine engineerscales during the preliminary planning. Now, we can apply calculation modelintroduced by this paper to select the specific flexibility coefficient. In coupledwith the fitting values of other factors, the volume of dam body is inverselycalculated. Choosing dam site and determine engineer scales preliminarily alsoprovides certain references to shape data estimation.
(4) For the arch dam shape which is designing and optimizing, after calculating shapedata and values of corresponding factors, its flexibility coefficient can be gotten bythe introduced calculation model of flexibility coefficient. Then, considering damvolume and dam safety, its reasonable shape can be chosen based on the flexibilitycoefficient.
(5) The calculation model of statistical flexibility coefficient, which is based on PLSR,not only provides the more reasonable method to ascertain flexibility coefficient butalso accomplishes some study related to principle component regression (PCR) andcanonical correlation analysis (CCR). It can supply the better regressive equationthat contains rich and deep data information. Moreover, it is studied that quadraticterm and cubic term of related factors of flexibility coefficient affect the regressiveequation on the basis of linear analysis. The result shows nonlinear parts ofadded factors have an unapparent influence to improve the precision of regressiveanalysis.
Acknowledgments
This research has been partially supported by National Natural Science Foundation of China(SN: 51179066, 51139001), JiangsuNatural Science Foundation (SN: BK2012036), the Programfor New Century Excellent Talents in University (SN: NCET-10-0359), the Special Fund ofState Key Laboratory of China (SN: 2009586912), the Fundamental Research Funds for theCentral Universities (Grant No. 2012B06614), Jiangsu Province “333 High-Level PersonnelTraining Project” (Grant No. BRA2011179) and the Priority Academic Program Developmentof Jiangsu Higher Education Institutions (PAPD) (SN: YS11001).
References
[1] G. Lombardi, “Koelnbrein dam: an unusual solution for an unusual problem,” InternationalWater Powerand Dam Construction, vol. 43, no. 6, pp. 31–34, 1991.
[2] Q. W. Ren and B. L. Wang, “Discussion on slenderness coefficient of arch dams,” Journal of HohaiUniversity (Natural Sciences), vol. 31, no. 1, pp. 1–4, 2003.
[3] F. W. Xu and B. Tian, “Investigation on flexibility coefficient of arch dam,” Yangtze River, vol. 38, no. 11,pp. 41–42, 2007.
[4] H. L. Rao, “Arch dam configuration parameters statistic analysis,”Design of Hydroelectric Power Station,vol. 20, no. 3, article 22, pp. 1–5, 2004.

20 Mathematical Problems in Engineering
[5] Y. Jiang, X. T. Ding, and C. S. Gu, “Buckling analysis and modification of stress control index for superhigh and thin arc dam body,” Journal of Hohai University (Natural Sciences), vol. 36, no. 1, pp. 54–57,2008.
[6] B. F. Zhu, “Stress level coefficient and safety level coefficient for arch dams,” Dam Engineering, vol. 11,no. 3, pp. 133–142, 2000.
[7] H. Su, Z. Wu, Y. Gu, J. Hu, and Z. Wen, “Game model of safety monitoring for arch dam deformation,”Science in China E, vol. 51, no. 2, pp. 76–81, 2008.
[8] Y. C. Ma and S. C. Lou, “Discussion on flexibility and volume of arch dams,” Dam and Safety, no. 6, pp.1–3, 2005.

Submit your manuscripts athttp://www.hindawi.com
Hindawi Publishing Corporationhttp://www.hindawi.com Volume 2014
MathematicsJournal of
Hindawi Publishing Corporationhttp://www.hindawi.com Volume 2014
Mathematical Problems in Engineering
Hindawi Publishing Corporationhttp://www.hindawi.com
Differential EquationsInternational Journal of
Volume 2014
Applied MathematicsJournal of
Hindawi Publishing Corporationhttp://www.hindawi.com Volume 2014
Probability and StatisticsHindawi Publishing Corporationhttp://www.hindawi.com Volume 2014
Journal of
Hindawi Publishing Corporationhttp://www.hindawi.com Volume 2014
Mathematical PhysicsAdvances in
Complex AnalysisJournal of
Hindawi Publishing Corporationhttp://www.hindawi.com Volume 2014
OptimizationJournal of
Hindawi Publishing Corporationhttp://www.hindawi.com Volume 2014
CombinatoricsHindawi Publishing Corporationhttp://www.hindawi.com Volume 2014
International Journal of
Hindawi Publishing Corporationhttp://www.hindawi.com Volume 2014
Operations ResearchAdvances in
Journal of
Hindawi Publishing Corporationhttp://www.hindawi.com Volume 2014
Function Spaces
Abstract and Applied AnalysisHindawi Publishing Corporationhttp://www.hindawi.com Volume 2014
International Journal of Mathematics and Mathematical Sciences
Hindawi Publishing Corporationhttp://www.hindawi.com Volume 2014
The Scientific World JournalHindawi Publishing Corporation http://www.hindawi.com Volume 2014
Hindawi Publishing Corporationhttp://www.hindawi.com Volume 2014
Algebra
Discrete Dynamics in Nature and Society
Hindawi Publishing Corporationhttp://www.hindawi.com Volume 2014
Hindawi Publishing Corporationhttp://www.hindawi.com Volume 2014
Decision SciencesAdvances in
Discrete MathematicsJournal of
Hindawi Publishing Corporationhttp://www.hindawi.com
Volume 2014
Hindawi Publishing Corporationhttp://www.hindawi.com Volume 2014
Stochastic AnalysisInternational Journal of