STATISTICAL ABSTRACT HARYANA 2010-11
878
GOVERNMENT OF HARYANA PUBLICATION NO. 997 STATISTICAL ABSTRACT HARYANA 2010-11 ISSUED BY : DEPARTMENT OF ECONOMIC AND STATISTICAL ANALYSIS, HARYANA 2012
Transcript of STATISTICAL ABSTRACT HARYANA 2010-11

GOVERNMENT OF HARYANA
PUBLICATION NO. 997
STATISTICAL ABSTRACT HARYANA
2010-11
ISSUED BY :
DEPARTMENT OF ECONOMIC AND STATISTICAL ANALYSIS, HARYANA
2012

FOREWORD
The present State Statistical Abstract of Haryana 2010-11 which contains the latest available data on almost all socio-economic aspects of the State economy, is an annual publication of Department of Economic & Statistical Analysis, Haryana. It is presented every year to the Hon'ble Members of Haryana Vidhan Sabha alongwith other budget documents.
The Department endeavors to include in the publication as much data as possible to meet the demand arising out of the changing economic conditions. I hope that the information contained in this publication will be more beneficial for formulating future development plans and policies. Planners, Administrators, Legislators, Financial Institutions and various research organizations interested in the economy of the State will find this publication extremely useful. For its wider use and utility, it is placed on the Department website also which can be accessed at www.esaharyana.gov.in.
I appreciate the efforts made by Director, Department of Economic & Statistical Analysis, Haryana and his staff who have been able to present exhaustive data through this voluminous publication in time.
HARMOHINDER SINGH CHATTHA CHANDIGARH Finance and Planning Minister, Dated the 14th February, 2012. Haryana.


PREFACE
The present edition of the Statistical Abstract of Haryana is the 45th in the series. It contains comprehensive statistics covering all important socio-economic aspects of the State’s economy such as area, population, agriculture, irrigation, forests, animal husbandry, power, industries, labour, roads, transport, health, education, co-operation, public finance, prices and state income. It is hoped that this publication will serve as a useful reference book for statistical requirement of Planning and Policy making. To facilitate interpretation of the data presented in the publication, the concepts and definitions used in various tables have been briefly explained in the beginning of each section. Footnotes, wherever necessary and sources of the data have been indicated at relevant places.
The ever increasing demand for the Statistical Abstract from government departments, universities, research institutions and research workers is a matter of gratification for its immense usefulness. It is hoped that the modifications now made in the present edition will further enhance the utility of the Abstract. For its wider use and utility, it is placed on the department website also which can be accessed at www.esaharyana.gov.in.
I am thankful to the various Heads of the Departments and the District Statistical Officers for their co-operation in ensuring the timely supply of data.
Thanks are also due to the Controller, Printing and Stationery Department, Haryana, Government Press, Panchkula and his staff for computerising the manuscript and printing this big volume expeditiously.
The acknowledgement is also made of the useful work done by Sh. Bhup Singh Yadav, Deputy Director, Sh. Rajpal Sangwan, Shri Shyam Sunder Sharma, Research Officers, Sh. Satyavir Singh, Smt. Radha Rani, Asstt. Research Officers, Sh. Anil Mahajan and Smt. Sneh Lata, Statistical Assistants, Smt. Anita Tanwar and Smt. Indu Jain, Field Assistants, Smt. Prem Lata, Senior Scale Stenographer under over all supervision and guidance of Sh. Sher Singh, Yadav, Additional Director in the preparation of this Abstract.
Rajender Kumar Panchkula Director Dated the 14th February, 2012 Department of Economic and Statistical Analysis, Haryana.

I UNITS USED IN THIS PUBLICATION
Lakh 1,00,000
Quintal 100 Kilograms
Ton 2,240 lbs. or 1.016 metric tonnes
M. Ton 1,000 Kilograms
Lb. 0.45359 Kg.
Kilogram 1,000 Grams
Kilometre 1,000 Metres
Metre 100 Centimetres
Bale (of Cotton) 170 Kilograms
Abbreviations used in this publication K.W.H. Kilowatt hour
. . Not available
— Negligible or nil
Old series of the Districts New series of the Districts
Hisar Ambala
Rohtak Panchkula (w.e.f. 15-8-1995)
Gurgaon Yamunanagar (w.e.f.1-11-1989)
Karnal Kurukshetra (w.e.f.23-1-1973)
Ambala Kaithal (w.e.f.1-11-1989)
Jind Karnal
Mahendragarh Panipat (w.e.f.1-11-1989)
except (24-7-91 to 31-12-91)
Sonipat (w.e.f. 22-12-1972)
Rohtak
Jhajjar (w.e.f. 15-7-1997)
Faridabad (w.e.f. 2-8-1979)
Gurgaon
Rewari (w.e.f. 1-11-1989)
Mahendragarh
Bhiwani (w.e.f. 22-12-1972)
Jind
Hisar
Fatehabad (w.e.f. 15-7-1997)
Sirsa (w.e.f. 26-8-1975)
Mewat (w.e.f. 4-4-2005)
Palwal (w.e.f. 13-8-2008)

II CONVERSION FACTORS
Area
1 Acre = 0.40468 Hectare 1 Hectare = 2.47109 Acres
1 Square Mile = 2.5900 Sq. Kilometres 1 Square Kilometre = 0.38610 Sq. Mile
1 Square Mile = 640 acres = 259 Hectares 1 Square Kilometre = 100 Hectares
1 Square Yard = 0.84 Sq. Metre 1 Sq. Metre = 1.20 Sq. Yards
Weight
1 Ounce (oz) = 28.3495 grams 1 Gram = 0.0352740 Ounce
or 0.09 Tola
1 Pound = 0.45359 Kilogram 1 Kilogram = 2.20463 Pounds
1 Long ton = 1.01605 Metric tons 1 Metric ton = 0.98420 Long ton
1 Short ton = 0.90718 Metric tons 1 Metric ton = 1.10231 Short ton
1 Long ton = 2,240 Pounds 1 Metric ton = 1,000 Kilograms
1 Short ton = 2,000 Pounds 1 Metric ton = 2,204.63 pounds
1 Maund = 82.2857 pounds 1 Metric ton =26.792 Maunds
(Standard)
1 Maund = 0.037324 Metric ton 1 Hundred Weight = 0.51 Quintal
1 Maund = 0.373 Quintal 1 Seer = 0.933 Kilogram
Yield
1 Bale of Cotton lint (375 lbs.) = 0.170 Metric ton 1 Metric ton = 5.8824 Bales of
Cotton lint
1 Bale of Jute (400 lbs.) = 0.181436 Metric ton 1 Metric ton = 5.5116 Bales of
Jute
Numbers
1 Lakh = 1,00,000 or 0.1 Million 1 Million = 10 lakh
1 Crore = 10,000,000 or 10 Million 1 Million = 0.1 Crore
Length
1 Inch = 25.4 Millimetres 1 Millimetre = 0.04 Inch
1 Yard = 0.9144 Metre 1 Centimetre = 0.3937 Inch CONVERSION FACTORS
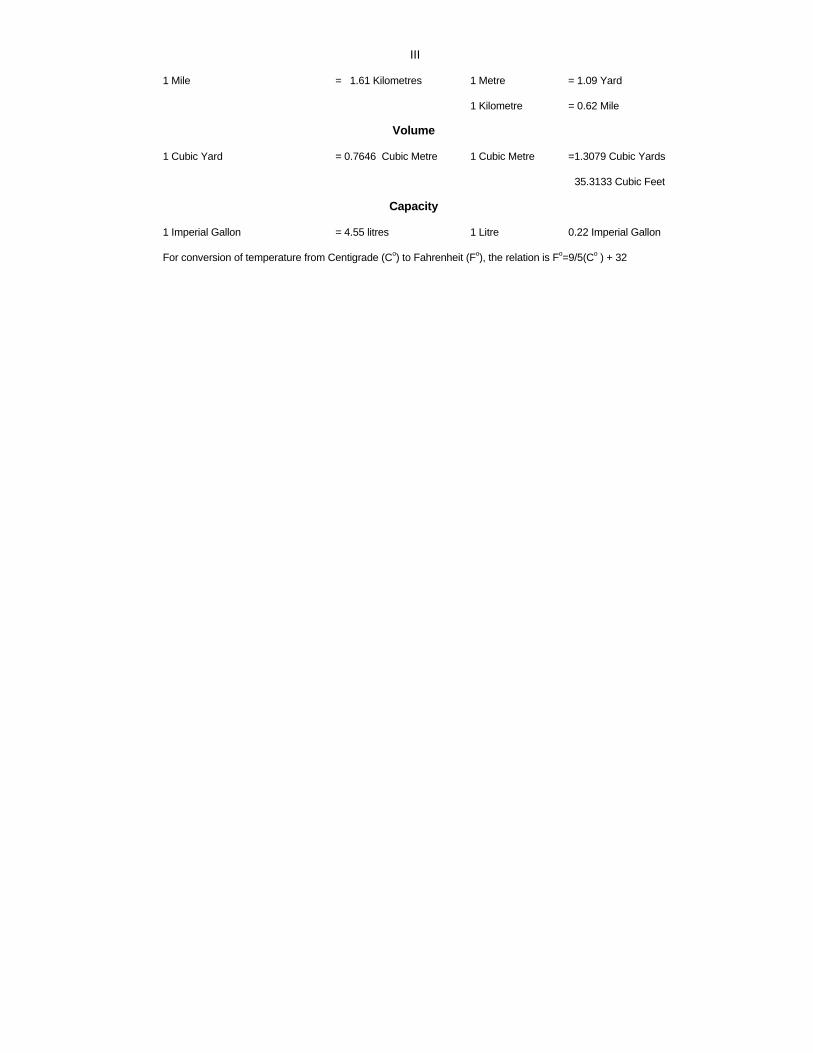
III
1 Mile = 1.61 Kilometres 1 Metre = 1.09 Yard
1 Kilometre = 0.62 Mile
Volume
1 Cubic Yard = 0.7646 Cubic Metre 1 Cubic Metre =1.3079 Cubic Yards
35.3133 Cubic Feet
Capacity
1 Imperial Gallon = 4.55 litres 1 Litre 0.22 Imperial Gallon
For conversion of temperature from Centigrade (Co) to Fahrenheit (Fo), the relation is Fo=9/5(Co ) + 32

IV
ALPHABETICAL LIST OF CONTENTS Sr. No. Contents Section Page
1. Administrative Structure 1 1-182. Agriculture 12 223-2763. Area and Population 3 27-964. Banking 25 535-5405. Basic Statistics 2 19-266. Education 6 119-1587. Electoral Statistics 33 665-6808. Electricity and Power 20 441-4609. Environment Statistics (Climate) 4 97-10410. Excise and Sales Tax 27 569-58011. Fisheries 16 341-34412. Forests 15 331-34013. Gross Fixed Capital Formation in Haryana 11 211-22214. Health and Family Welfare 7 159-17415. Industries 19 387-44016. Irrigation 13 277-29417. Joint Stock Companies 30 627-63418. Labour and Employment 24 517-53419. Livestock, Animal Husbandry and Dairying 14 295-33020. Local Bodies 32 647-66421. Marketing and Storage 22 497-51222. Mining and Quarrying 18 379-38623. Miscellaneous 35 685-79624. Plan of Haryana 29 617-62625. Prices 28 581-61626. Public Finance 26 541-56827. Public Undertakings 31 635-64628. Registration 34 681-68429. Rural Development and Co-operation 17 345-37830. Selected Indicators 36 797-84631. Social Security and Social Defence (Police, Crimes and Sudhar Ghar) 9 181-19432. Social Welfare Services 8 175-18033. State Income of Haryana 10 195-21034. Tourism and Civil Aviation 23 513-51635. Transport 21 461-49636. Vital Statistics 5 105-118

V CONTENTS
Table No. Particulars Page No.PART I—SOCIAL STATISTICS
I ADMINISTRATIVE STRUCTURE 1.1 Governor and Council of Ministers and their Portfolios 5-61.2 State Planning Board, Haryana 71.3 Judges of Punjab and Haryana High Court 8-91.4 Public Service Commission, Haryana 101.5 Haryana Staff Selection Commission 111.6 Universities and their Vice-Chancellors in Haryana 121.7 Commissioners and Deputy Commissioners in Haryana 131.8 Divisions, Sub-Divisions, Districts, Tahsils, Sub-Tahsils and Blocks in Haryana 14-18
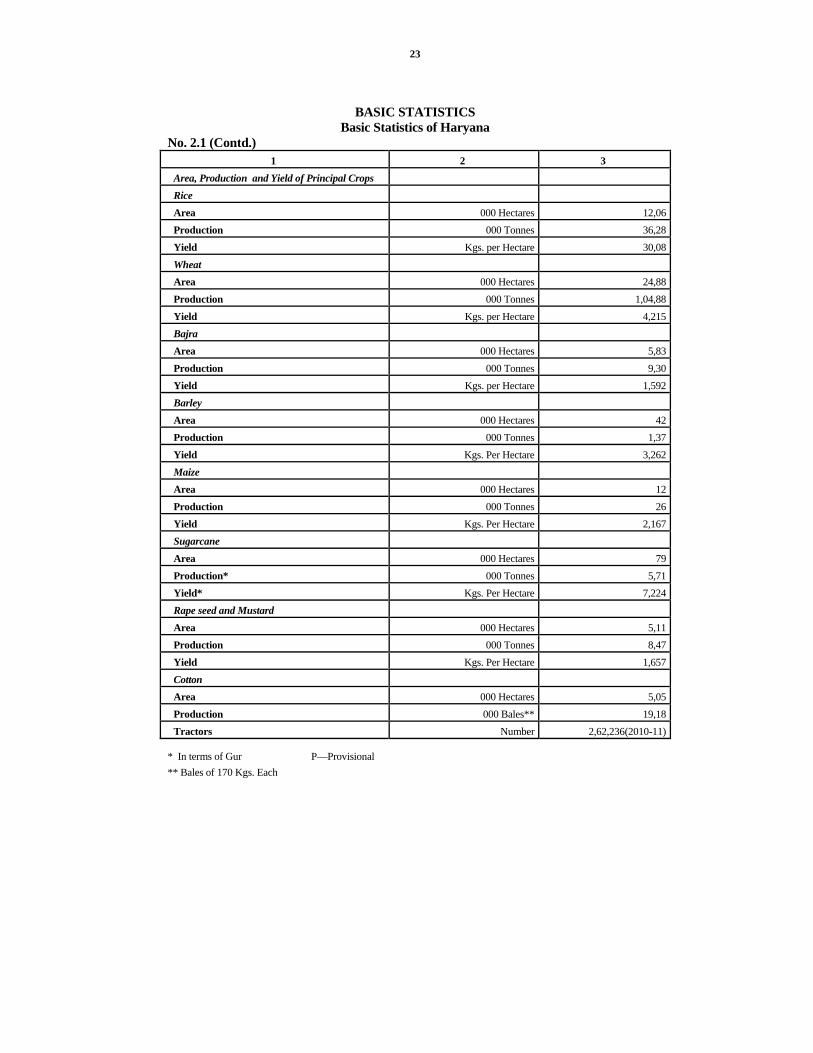
II BASIC STATISTICS 2.1 Basic Statistics of Haryana 21-25
III AREA AND POPULATION 3.1 Area and Population of Haryana: 2011(P) 29-313.2 Growth of Total Population in Haryana:1901-2011(P) 323.3 Increase in population since 2001 by districts 333.4 Number of villages and towns in Haryana in 1991 and 2001 Census 343.5 Area and population by districts : Census 2011(P) 353.6 Rural and Urban Population by Sex -- Districtwise: 2011(P) 363.7 Tahsil-wise Population, No. of Villages and Towns in Haryana : 2011(P) 37-393.8 Blockwise Population and Number of Villages – 2001 40-443.9 Number of Households and persons per household in Haryana : 2001 463.10 Number of uses of Censes houses in Haryana : 2001 47-513.11 Villages classified by various population ranges in Haryana : 2001 52-543.12 Towns classified by various population ranges in Haryana : 2001 55-563.13 Area, population and density in the towns of Haryana : 2001 573.14 Trend in population of towns 58-613.15 Cities/Urban Agglomerations with a Population of 1,00,000 and above — 2001 623.16 Rural and Urban Workers and non-workers by districts : 2001 633.17 Number and percentage distribution of workers (Main + Marginal) by Broad industrial
categories 64
3.18 Working population (Main + Marginal) classified into Broad industrial categories : 2001 65-663.19 Age distribution of Urban and Rural population in Haryana : 2001 67
3.20 Population by Religion in Haryana: 2001 683.21 District-wise distribution of population by Languages : 1991 69
3.22 Scheduled Castes by districts : 2001 70
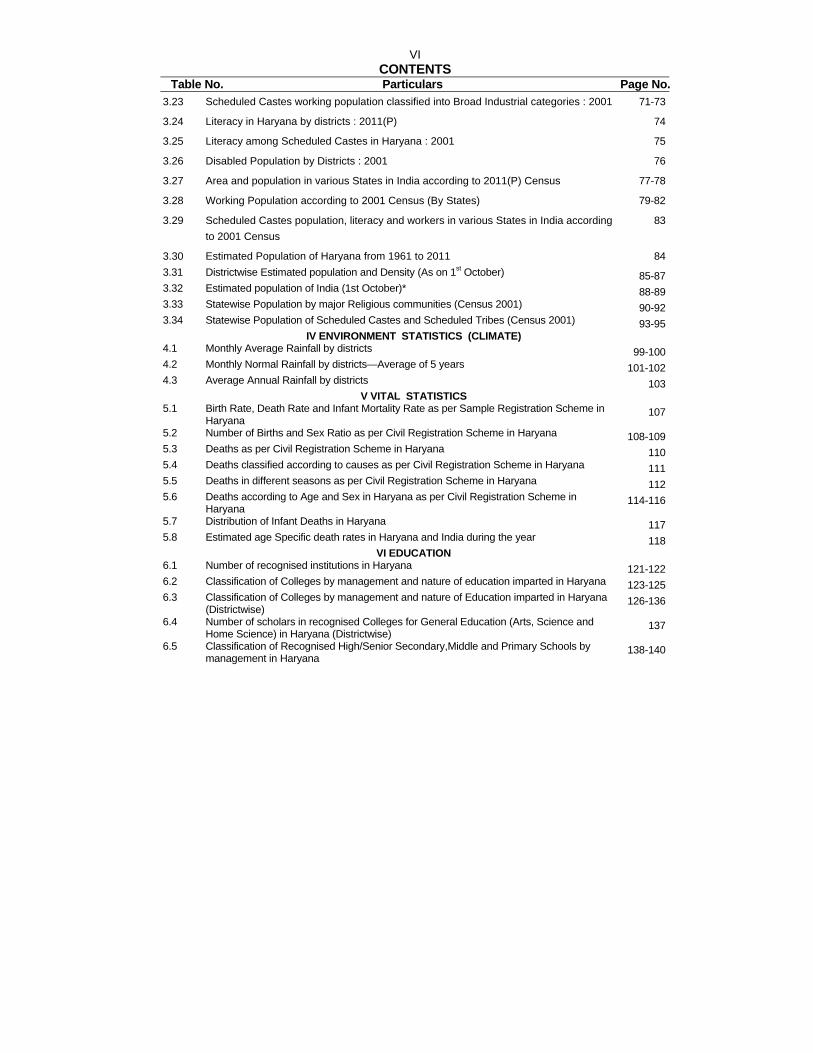
VI CONTENTS
Table No. Particulars Page No.3.23 Scheduled Castes working population classified into Broad Industrial categories : 2001 71-73
3.24 Literacy in Haryana by districts : 2011(P) 74
3.25 Literacy among Scheduled Castes in Haryana : 2001 75
3.26 Disabled Population by Districts : 2001 76
3.27 Area and population in various States in India according to 2011(P) Census 77-78
3.28 Working Population according to 2001 Census (By States) 79-82
3.29 Scheduled Castes population, literacy and workers in various States in India according to 2001 Census
83
3.30 Estimated Population of Haryana from 1961 to 2011 843.31 Districtwise Estimated population and Density (As on 1st October) 85-873.32 Estimated population of India (1st October)* 88-893.33 Statewise Population by major Religious communities (Census 2001) 90-923.34 Statewise Population of Scheduled Castes and Scheduled Tribes (Census 2001) 93-95
IV ENVIRONMENT STATISTICS (CLIMATE) 4.1 Monthly Average Rainfall by districts 99-1004.2 Monthly Normal Rainfall by districts—Average of 5 years 101-1024.3 Average Annual Rainfall by districts 103
V VITAL STATISTICS 5.1 Birth Rate, Death Rate and Infant Mortality Rate as per Sample Registration Scheme in
Haryana 107
5.2 Number of Births and Sex Ratio as per Civil Registration Scheme in Haryana 108-1095.3 Deaths as per Civil Registration Scheme in Haryana 1105.4 Deaths classified according to causes as per Civil Registration Scheme in Haryana 1115.5 Deaths in different seasons as per Civil Registration Scheme in Haryana 1125.6 Deaths according to Age and Sex in Haryana as per Civil Registration Scheme in
Haryana 114-116
5.7 Distribution of Infant Deaths in Haryana 1175.8 Estimated age Specific death rates in Haryana and India during the year 118
VI EDUCATION 6.1 Number of recognised institutions in Haryana 121-1226.2 Classification of Colleges by management and nature of education imparted in Haryana 123-1256.3 Classification of Colleges by management and nature of Education imparted in Haryana
(Districtwise) 126-136
6.4 Number of scholars in recognised Colleges for General Education (Arts, Science and Home Science) in Haryana (Districtwise)
137
6.5 Classification of Recognised High/Senior Secondary,Middle and Primary Schools by management in Haryana
138-140
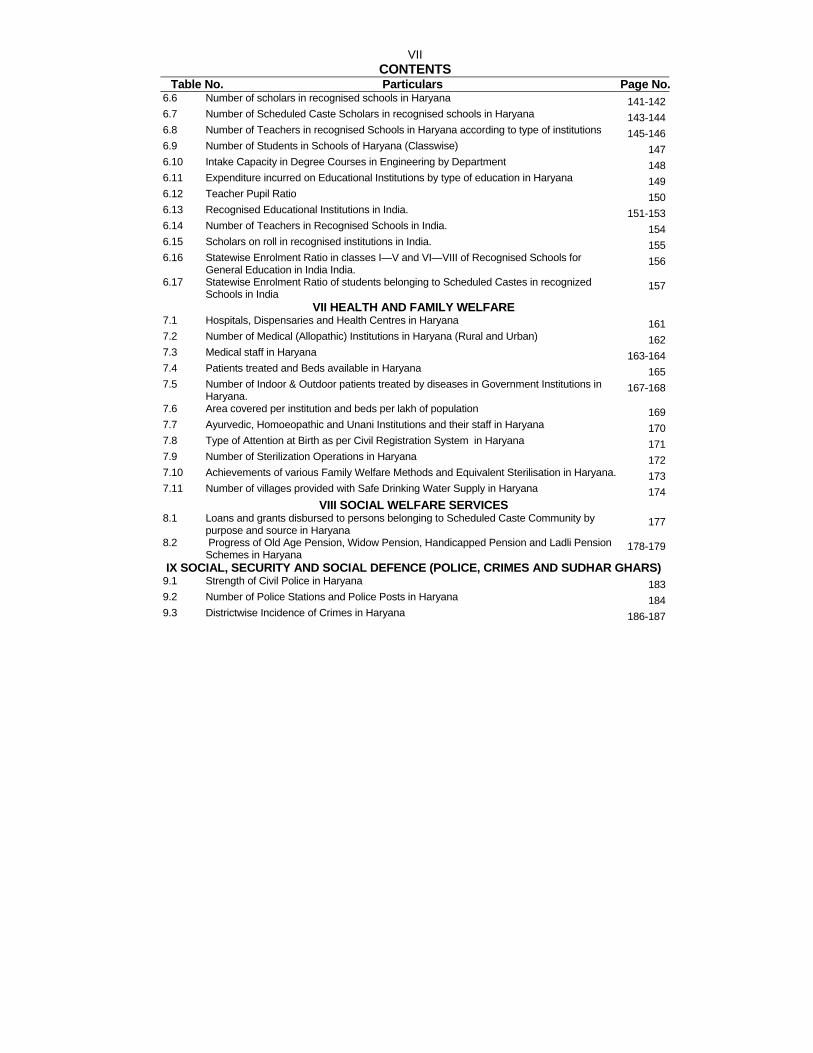
VII CONTENTS
Table No. Particulars Page No.6.6 Number of scholars in recognised schools in Haryana 141-1426.7 Number of Scheduled Caste Scholars in recognised schools in Haryana 143-1446.8 Number of Teachers in recognised Schools in Haryana according to type of institutions 145-1466.9 Number of Students in Schools of Haryana (Classwise) 1476.10 Intake Capacity in Degree Courses in Engineering by Department 1486.11 Expenditure incurred on Educational Institutions by type of education in Haryana 1496.12 Teacher Pupil Ratio 1506.13 Recognised Educational Institutions in India. 151-1536.14 Number of Teachers in Recognised Schools in India. 1546.15 Scholars on roll in recognised institutions in India. 1556.16 Statewise Enrolment Ratio in classes I—V and VI—VIII of Recognised Schools for
General Education in India India. 156
6.17 Statewise Enrolment Ratio of students belonging to Scheduled Castes in recognized Schools in India
157
VII HEALTH AND FAMILY WELFARE 7.1 Hospitals, Dispensaries and Health Centres in Haryana 1617.2 Number of Medical (Allopathic) Institutions in Haryana (Rural and Urban) 1627.3 Medical staff in Haryana 163-1647.4 Patients treated and Beds available in Haryana 1657.5 Number of Indoor & Outdoor patients treated by diseases in Government Institutions in
Haryana. 167-168
7.6 Area covered per institution and beds per lakh of population 1697.7 Ayurvedic, Homoeopathic and Unani Institutions and their staff in Haryana 1707.8 Type of Attention at Birth as per Civil Registration System in Haryana 1717.9 Number of Sterilization Operations in Haryana 1727.10 Achievements of various Family Welfare Methods and Equivalent Sterilisation in Haryana. 1737.11 Number of villages provided with Safe Drinking Water Supply in Haryana 174
VIII SOCIAL WELFARE SERVICES 8.1 Loans and grants disbursed to persons belonging to Scheduled Caste Community by
purpose and source in Haryana 177
8.2 Progress of Old Age Pension, Widow Pension, Handicapped Pension and Ladli Pension Schemes in Haryana
178-179
IX SOCIAL, SECURITY AND SOCIAL DEFENCE (POLICE, CRIMES AND SUDHAR GHARS) 9.1 Strength of Civil Police in Haryana 1839.2 Number of Police Stations and Police Posts in Haryana 1849.3 Districtwise Incidence of Crimes in Haryana 186-187

VIII CONTENTS
Table No. Particulars Page No.9.4 Convicts by Age, Sex and Literacy 188-1899.5 Places of confinement in Haryana 1909.6 Number of Prisoners in Haryana (Classwise) 1919.7 Expenditure incurred on maintaining prisoners in Jails and Subsidiary Jails in Haryana 1929.8 Progress of Jail Industry in Haryana 193
PART II—ECONOMIC STATISTICS X STATE INCOME OF HARYANA
10.1 Movement of Gross and Net State Domestic Product at factor cost at current and constant (2004-05) Prices
199
10.2 Gross State Domestic Product of Haryana by Industry of origin (at current prices) 20010.3 Gross State Domestic Product of Haryana by Industry of origin at constant (2004-2005)
Prices 201
10.4 Net State Domestic Product of Haryana by Industry of Origin (at current prices) 20210.5 Net State Domestic Product of Haryana by Industry of Origin at Constant at (2004-05) 20310.6 Indices of Net State Domestic Product at Factor Cost by Major Sources in Haryana
(2004-05=100) 204
10.7 Percentage change in Gross State Domestic Product over the previous year at (2004-05=100)
205
10.8 Per Capita Income of various States and Indian Union at current prices 207-20810.9 Per Capita Income of various States and Indian Union at constant prices. 209-210
XI GROSS FIXED CAPITAL FORMATION IN HARYANA 11.1 Estimates of Gross Fixed Capital Formation in Haryana by Industry of Use (At Current
Prices) 212-213
11.2 Estimates of Gross Fixed Capital Formation in Haryana by Industry of Use At Constant Prices
214-215
11.3 Estimates of Gross Fixed Capital formation in Haryana by Type of Institutions (At Current Prices)
216-217
11.4 Estimates of Gross Fixed Capital Formation in Haryana by Type of Institutions At Constant Prices
218-219
11.5 Estimates of Gross Fixed Capital Formation in Haryana by Type of Assets (At Current Prices)
220-221
11.6 Estimates of Gross Fixed Capital Formation in Haryana by Type of Assets At Constant Prices
222
XII AGRICULTURE 12.1 Classification of area in Haryana 225-22712.2 Total area and classification of area in India 228-23012.3 Districtwise number and area of Operational Holdings by size in Haryana 231-235

IX CONTENTS
Table No. Particulars Page No.12.4 Number and area of Operational Holdings by Ownership in Haryana. 236-237
12.5 Statewise number and area of Operational Holdings in India. 238
12.6 Area and production of Foodgrains in Haryana. 239
12.7 Area, production and average yield per hectare of principal crops in Haryana 240-248
12.8 Area under high yielding varieties of Foodgrains in Haryana 249
12.9 Area under fruit and vegetables in Haryana. 250-251
12.10 Districtwise percentage distribution of principal crops in Haryana. 252-255
12.11 Various Index Numbers relating to Agriculture in Haryana 256
12.12 Index Numbers of area under Crops in Haryana 257-258
12.13 Index of agricultural production in Haryana 259-260
12.14 Area under principal crops—Comparative position with other States 262-264
12.15 Production of principal crops in India by States. 265-267
12.16 Average yield of Important crops in India by States. 268
12.17 Fertilizer consumption in Haryana (Nutrients) 269
12.18 Consumption of pesticides in Haryana (Technical Grade) 270
12.19 Districtwise consumption of pesticides (Technical Grade) 271
12.20 Agricultural machinery and implements in Haryana 272-273
12.21 Number of tractors in Haryana 274
12.22 Number of villages repartitioned in Haryana 275
12.23 Area repartitioned in Haryana 276XIII IRRIGATION
13.1 Net area irrigated in Haryana 27913.2 Net area under irrigation in India. 280-28113.3 Gross area irrigated in Haryana. 28213.4 Gross area irrigated in Haryana (Cropwise) 284-28613.5 Gross area under Irrigation in India by States (Cropwise). 287-29113.6 Tubewells and pumping sets 29213.7 Principal Results of operation of Irrigation Works in Haryana 29313.8 Gross area irrigated by Canals in Haryana 294
XIV LIVESTOCK, ANIMAL HUSBANDRY AND DAIRYING
14.1 Livestock and Poultry in Haryana. 296-29714.2 Cattle in Haryana. 298-30014.3 Buffaloes in Haryana. 301-30214.4 Horses in Haryana. 30314.5 Ponies in Haryana. 30414.6 Donkeys and Mules in Haryana. 30514.7 Sheep in Haryana. 306
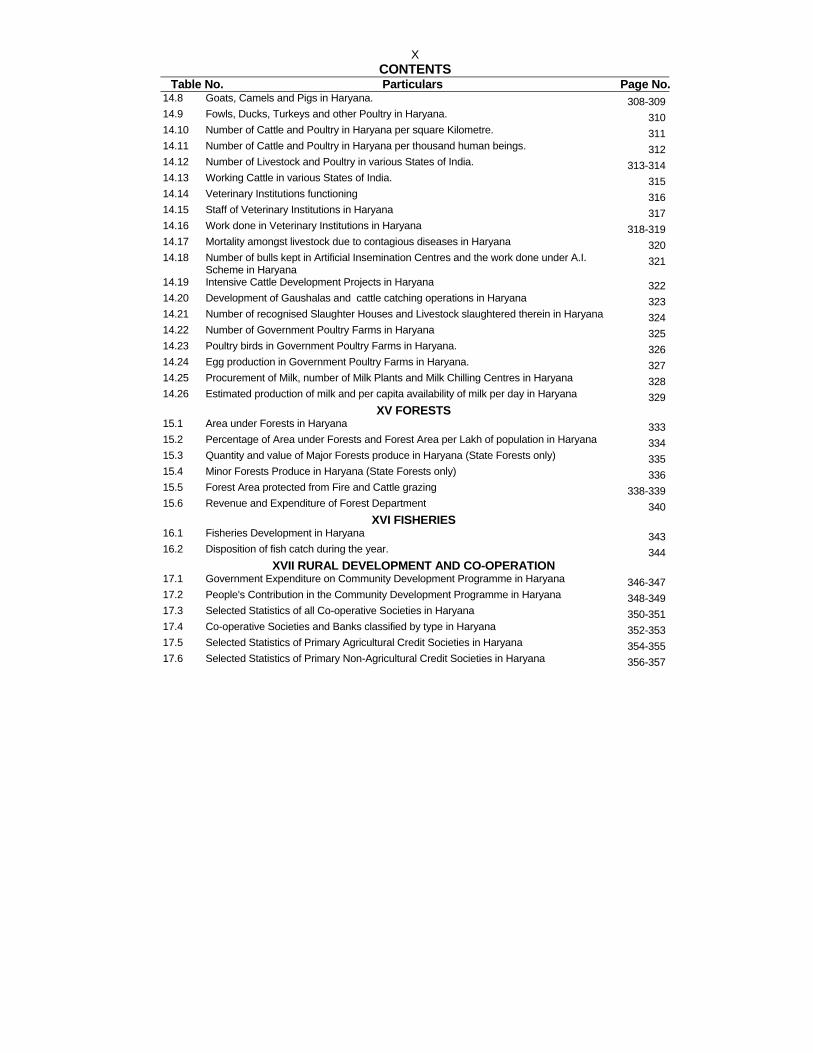
X CONTENTS
Table No. Particulars Page No.14.8 Goats, Camels and Pigs in Haryana. 308-30914.9 Fowls, Ducks, Turkeys and other Poultry in Haryana. 31014.10 Number of Cattle and Poultry in Haryana per square Kilometre. 31114.11 Number of Cattle and Poultry in Haryana per thousand human beings. 31214.12 Number of Livestock and Poultry in various States of India. 313-31414.13 Working Cattle in various States of India. 31514.14 Veterinary Institutions functioning 31614.15 Staff of Veterinary Institutions in Haryana 31714.16 Work done in Veterinary Institutions in Haryana 318-31914.17 Mortality amongst livestock due to contagious diseases in Haryana 32014.18 Number of bulls kept in Artificial Insemination Centres and the work done under A.I.
Scheme in Haryana 321
14.19 Intensive Cattle Development Projects in Haryana 32214.20 Development of Gaushalas and cattle catching operations in Haryana 32314.21 Number of recognised Slaughter Houses and Livestock slaughtered therein in Haryana 32414.22 Number of Government Poultry Farms in Haryana 32514.23 Poultry birds in Government Poultry Farms in Haryana. 32614.24 Egg production in Government Poultry Farms in Haryana. 32714.25 Procurement of Milk, number of Milk Plants and Milk Chilling Centres in Haryana 32814.26 Estimated production of milk and per capita availability of milk per day in Haryana 329
XV FORESTS 15.1 Area under Forests in Haryana 33315.2 Percentage of Area under Forests and Forest Area per Lakh of population in Haryana 33415.3 Quantity and value of Major Forests produce in Haryana (State Forests only) 33515.4 Minor Forests Produce in Haryana (State Forests only) 33615.5 Forest Area protected from Fire and Cattle grazing 338-33915.6 Revenue and Expenditure of Forest Department 340
XVI FISHERIES 16.1 Fisheries Development in Haryana 34316.2 Disposition of fish catch during the year. 344
XVII RURAL DEVELOPMENT AND CO-OPERATION 17.1 Government Expenditure on Community Development Programme in Haryana 346-34717.2 People's Contribution in the Community Development Programme in Haryana 348-34917.3 Selected Statistics of all Co-operative Societies in Haryana 350-35117.4 Co-operative Societies and Banks classified by type in Haryana 352-35317.5 Selected Statistics of Primary Agricultural Credit Societies in Haryana 354-35517.6 Selected Statistics of Primary Non-Agricultural Credit Societies in Haryana 356-357

XI CONTENTS
Table No. Particulars Page No.17.7 Selected Statistics of Primary Land Development Banks in Haryana 358-36117.8 Selected Statistics of Central Co-operative Banks in Haryana 362-36417.9 Selected Statistics of Apex State Marketing Federations in Haryana 365-36617.10 Selected Statistics of Central Consumer Stores in Haryana 367-36817.11 Selected Statistics of Labour and Construction Societies in Haryana 369-37017.12 Selected Statistics of Housing Co-operative Societies in Haryana 371-37217.13 Selected Statistics of Dairy and Milk Supply Co-operative Societies in Haryana 373-37417.14 Selected Statistics of Women Co-operative Societies in Haryana 375-37617.15 Selected Statistics of Industrial Co-operative Societies in Haryana 377-378
XVIII MINING AND QUARRYING 18.1 Production of Minerals in Haryana 380-38318.2 Districtwise production of Minerals in Haryana 384-386
XIX INDUSTRIES 19.1 Number of registered factories and workers employed (districtwise) in Haryana 38919.2 Size and distribution of registered working factories in Haryana 390-39119.3 Size and distribution of registered working Factories (Districtwise) in Haryana 392-39419.4 Number of working factories, industrywise and districtwise as on 31 December, 2009 395-40319.5 Estimated workers employed in working factories, districtwise and industrywise 404-41219.6 Industrial Production in Haryana 413-41619.7 Cotton/Man-made Fibre (Non-SSI) Textile Mills, in Haryana State 41719.8 Index of Industrial Production according to Industrial Classification 419-42019.9 Index of Industrial Production Major Groups. 42119.10 Classification of loans (Amountwise) sanctioned by the Financial Corporation in the State
of Haryana 422-424
19.11 Industrywise Classification of applications received, sanctioned otherwise 425-42819.12 Classification of loans and advances in Haryana (districtwise) 429-43019.13 Production, sale and employment in different Village Industries in Haryana 431-43519.14 Amount of grants and loans disbursed to the various industries in Haryana by Khadi and
Village Industries Board 436-439
19.15 Groupwise Margin Money released under Prime Minister employment Generation Programme (PMEGP) by Khadi & Village Industries Board
440
XX ELECTRICITY AND POWER 20.1 L.T. and 11 K.V. Lines in Haryana 44320.2 Consumption of electricity in Haryana 44420.3 Number of connections in Haryana 44520.4 Number of pending applications for electric connections by uses and period 44620.5 Number of Tubewells energised in Haryana 447

XII CONTENTS
Table No. Particulars Page No.20.6 Units sold and per capita consumption of electricity 44820.7 Installed generation capacity and power availability in Haryana 450-45120.8 Installed Plant capacity, electricity generated and utilised in India (Statewise) 452-45320.9 Statewise Installed plant capacity and energy consumed per square Kilometre and per
thousand Population in India (Statewise) 454-455
20.10 Annual per capita consumption of electricity in India (Statewise) 457-45820.11 Number of villages electrified in various States (2001 Census) 459
XXI TRANSPORT 21.1 Number of different types of Motor Vehicles registered in Haryana districtwise 46321.2 Number of different types of Motor Vehicles on road in Haryana 46421.3 Road accidents in Haryana 46521.4 Number of driving licences in Haryana (districtwise) 46621.5 Progress of Haryana Roadways (Commercial Wing) 468-47121.6 Registered Vehicles in use (Taxed and tax exempted) 472-47721.7 Number of Motor Vehicles in various States of India in relation to area and population. 47821.8 Road length maintained by the Public Works Department in Haryana 47921.9 Road length maintained by the Public Works Department (B & R) and Local Bodies in
Haryana 480-481
21.10 Road length by types maintained by P.W.D. (B.&R.) in Haryana 48221.11 Length of Metalled Roads in Haryana 48321.12 Number of villages connected with Metalled Roads 48421.13 Percentage of villages connected with Metalled Roads 48521.14 Total length of different Highways in India (Statewise) 486-48821.15 Statewise length of different surfaced metalled Road Highways in India 489-49121.16 Road Length per 100 square kilometres of area and per lakh of Population in different
States of India. 492
21.17 Railway route Kilometres. 493-49421.18 Number of wagons loaded with important commodities on broad gauge 495
XXII MARKETING AND STORAGE 22.1 Principal Agricultural Markets in Haryana 499-50022.2 Districtwise number of Markets in Haryana 50122.3 Market arrivals of Agricultural produce in Haryana 502-50422.4 Capacity of State-owned storages in Haryana 505-50622.5 Districtwise capacity of State-owned Warehouses in Haryana 50722.6 Districtwise Number of Cold-storages with capacity in Haryana 50822.7 Procurement of Wheat and Paddy in Haryana 50922.8 Districtwise procurement of Wheat and Paddy by agencies in Haryana 511-512

XIII CONTENTS
Table No. Particulars Page No.XXIII TOURISM AND CIVIL AVIATION
23.1 Number of Tourist spots and Tourists visited by districts in Haryana 51523.2 Number of Flying Clubs, Planes and persons trained in Haryana 516
XXIV LABOUR AND EMPLOYMENT 24.1 Number of shops, commercial establishments, hotels, restaurants and persons employed 51824.2 Average per capita annual money earnings of persons employed in factories in India 519-52024.3 Number of Industrial Disputes in Haryana 52124.4 Industrial disputes resulting in strikes and lock-outs by causes 52224.5 Trade unions under the Trade Union Act, 1926 in Haryana 52324.6 Classification of Trade Unions in Haryana according to membership. 52424.7 Party affiliation of registered Trade Unions in Haryana. 52524.8 Workmen’s Compensation (Compensation paid in lieu of accidents under Workmen’s
compensation Act, 1923 in Haryana 526
24.9 Wages paid to agricultural and skilled labourers (men) in Haryana 527-52824.10 Registration and placings by Employment Exchanges in Haryana 53024.11 Occupational distribution of persons on the Live Register of Employment Exchanges in
Haryana 531
24.12 Employment in the Organised Sector in Haryana 53224.13 Estimated Employment in Private and Public Sector in India (Statewise) 533-534
XXV BANKING 25.1 Banking Development in Haryana 53725.2 Districtwise Deposits and Credits of Scheduled Commercial Banks in Haryana 53825.3 Deposits and Credits of Scheduled Commercial Banks in India. 53925.4 Number of Banking offices in various states per thousand square kilometres of area and
per lakh of population 540
XXVI PUBLIC FINANCE 26.1 Tax Revenue of Haryana Government 543-54426.2 Non-Tax Revenue of Haryana Government 545-54726.3 Developmental Revenue Expenditure of Haryana Government 548-55026.4 Non-Developmental Revenue Expenditure of Haryana Government 551-55226.5 Capital Receipts of Haryana Government 55326.6 Capital Expenditure of Haryana Government 554-55626.7 Public Account of Haryana Government (Receipts) 55726.8 Public Account of Haryana Government (Disbursement) 55826.9 Financial position of Haryana Government 559

XIV CONTENTS
Table No. Particulars Page No.26.10 Budgetary Expenditure of Administrative Departments of Haryana Government—
Purpose Classification 560-561
26.11 Haryana Government Budgetary Expenditure—Economic Classification 562-56326.12 Net Receipts of Small Saving Schemes in Haryana 565-567
XXVII EXCISE AND SALES TAX STATISTICS 27.1 Number of Assessees and Tax realised in Haryana 57127.2 Consumption of Liquor and Opium in Haryana 57227.3 Receipts from Entertainment Tax and Show Tax 57327.4 Entertainment Places 57427.5 Rates of Excise Duty on Liquors, Opium and other drugs in Haryana 577-57827.6 Tax realised in Haryana under Passenger and Goods Tax Act, 1952 and Motor Spirit
Sales Tax Act, 1939 579
XXVIII PRICES 28.1 Harvest Prices in Haryana 58328.2 Weighted Index Numbers of harves (Wholesale) Priceso Agricultural commodities in
Haryana. 584
28.3 Annual Wholesale prices in Haryana Average of weekly quotation from important Mandies
585-586
28.4 All-India Index Numbers of Wholesale Prices by groups—(Base 1952-53=100) 58728.5 All India Index Numbers of Wholesale Prices by group—(Base 1961-62=100) 591-59228.6 All India Index Numbers of Wholesale Prices—(Base 1970-71=100) 59328.7 All India Index numbers of wholesale prices—(Base 1981-82=100) 59428.8 Consumer Price Index Numbers for the Industrial Workers (All India and Selected
Centres)—(Base 1960=100) 597-598
28.9 Consumer Price Index Numbers for the Industrial Workers (All India and Selected Centres)—(Base 1982=100)
599
28.10 All India consumer Price Index Numbers for the Industrial Workers—(Base 1982=100) 60028.11 Consumer Price Index Numbers of working class at Yamunanagar and Faridabad—(Base
1982=100) 601
28.12 Consumer Price Index Numbers of working class in Haryana—(Base 1982=100) 605-60628.13 Index Numbers of wholesale Prices of 20 important Agricultural Commodities in
Haryana—(Base 1980-81=100) 607
28.14 Consumer Price Index Numbers for Agricultural and Rural Labourers in Haryana —(Base 1986-87 = 100)
608
28.15 Consumer Price Indices of selected Commodities for rural Areas in Haryana—(Base 1988-89=100)
609
28.16 Consumer Price Index Numbers for urban non-manual employees—(Base 1960=100) 613-614

XV CONTENTS
Table No. Particulars Page No.28.17 Consumer Price Index Numbers for urban non-manual employees—(Base 1984-85=100) 61528.18 Commoditywise Procurement prices in Haryana 616
XXIX PLAN OF HARYANA 29.1 Outlay and Expenditure under Five Year/Annual Plans 619-62529.2 Funds released under Decentralised Plan and District Plan in Haryana 626
PART—III OTHER STATISTICS XXX JOINT STOCK COMPANIES
30.1 Companies registered in Haryana. 63130.2 Number of Companies (Public and Private Limited) operating in Haryana 63230.3 Distribution of new Joint Stock Companies registered in Haryana according to size,
pattern and industrial classification 633
30.4 Number and paid-up capital of Joint Stock Companies Limited by Shares at work in India 634XXXI PUBLIC UNDERTAKINGS
31.1 Number of Units and Loans advanced by Haryana Financial Corporation to various by Industry
637-640
31.2 Purposewise loans advanced to weaker sections and priority sectors in Haryana by Financial Corporation.
641
31.3 Loans Received and Houses constructed by Housing Board, Haryana 643-64531.4 Statistics relating to selected achievements of Haryana Agro-Industries Corporation 646
XXXII LOCAL BODIES 32.1 Number, Population, Income and Expenditure of Municipal committees/Councils/
Corporations in Haryana (Districtwise) 649
32.2 Population, Income and Expenditure of Municipal Committees/Councils/ Corporations in Haryana (Districtwise)
650-653
32.3 Income of Municipal Committees/Councils/Corporations in Haryana 654-65532.4 Expenditure of Municipal Committees/Councils/Corporations in Haryana 656-65732.5 Number of Gram Panchayats, Panchayat Samities and Zila Parishads by Districts in
Haryana 658-663
XXXIII ELECTORAL STATISTICS 33.1 Number of Electors, Seats (Lok Sabha and Vidhan Sabha) in Haryana 667-66933.2 Names of elected members for Parliament from Haryana Parliamentary Constituencies in
General Elections. 670
33.3 Names of elected members of Haryana Vidhan Sabha in General Elections. 673-67633.4 Number of Electors and Votes Polled in Haryana Vidhan Sabha Elections. 67733.5 Number of votes polled on Haryana during 2009 General Elections to Lok Sabha 67833.6 Number of Lok Sabha and Vidhan Sabha Seats (in India) (Statewise) 679

XVI CONTENTS
Table No. Particulars Page No.XXXIV REGISTRATION
34.1 Number and Description of Registered Documents and value of Property Transferred in Haryana
683-684
XXXV MISCELLANEOUS 35.1 Money Supply with the Public in India 687-68835.2 India's Foreign Exchange reserves 68935.3 India’s Foreign Trade 69035.4 Number of houses completed/allotted by the Housing Board, Haryana according to
economic strata 691
35.5 Post Offices, Telegraph Offices, Telephone Exchanges etc. in Haryana 692-69335.6 Districtwise Employees of Haryana Government 694-69535.7 Classwise Number of Haryana Government Employees as on 31st March 69635.8 Distribution of Haryana Government Employees as on 31st March, 2010 according to
Basic Pay Ranges and Classes 697
35.9 Distribution of Haryana Government Employees as on 31st March, 2010 according to Total Emoluments Ranges and Class
698
35.10 Distribution of Haryana Government Employees as on 31st March, 2010 according to Districts and Classes
699
35.11 Distribution of Haryana Government Employees as on 31st March, 2010 according to Districts and Departments
700-711
35.12 Distribution of Haryana Government Employees as on 31st March, 2010 according to various departments and Classes.
712-717
35.13 Number of Haryana Government Employees (as on 31st March, 2010) belonging to Scheduled Castes, Backward Classes, Ex-Serviceman, Ad-hoc (Sexwise) and Handicapped employees.
718-719
35.14 Religion-wise number of Haryana Government Employees as on 31st March, 2010 72035.15 Distribution of Haryana Government Employees as on 31st March, 2010 according to
different Departments and Sex 723-728
35.16 District and Sexwise distribution of Haryana Government Employees as on 31st March, 2010
729-732
35.17 Wage bill and monthly wage per employee of the Haryana Government Employees 73335.18 Estimated Expenditure on Basic Pay of Haryana Government Employees during the year
2009-10 734
35.19 Estimated Expenditure on Dearness Allowance of Haryana Government Employees during the year 2009-10
735
35.20 No. of Seats in Technical Institutions in Haryana 737-748
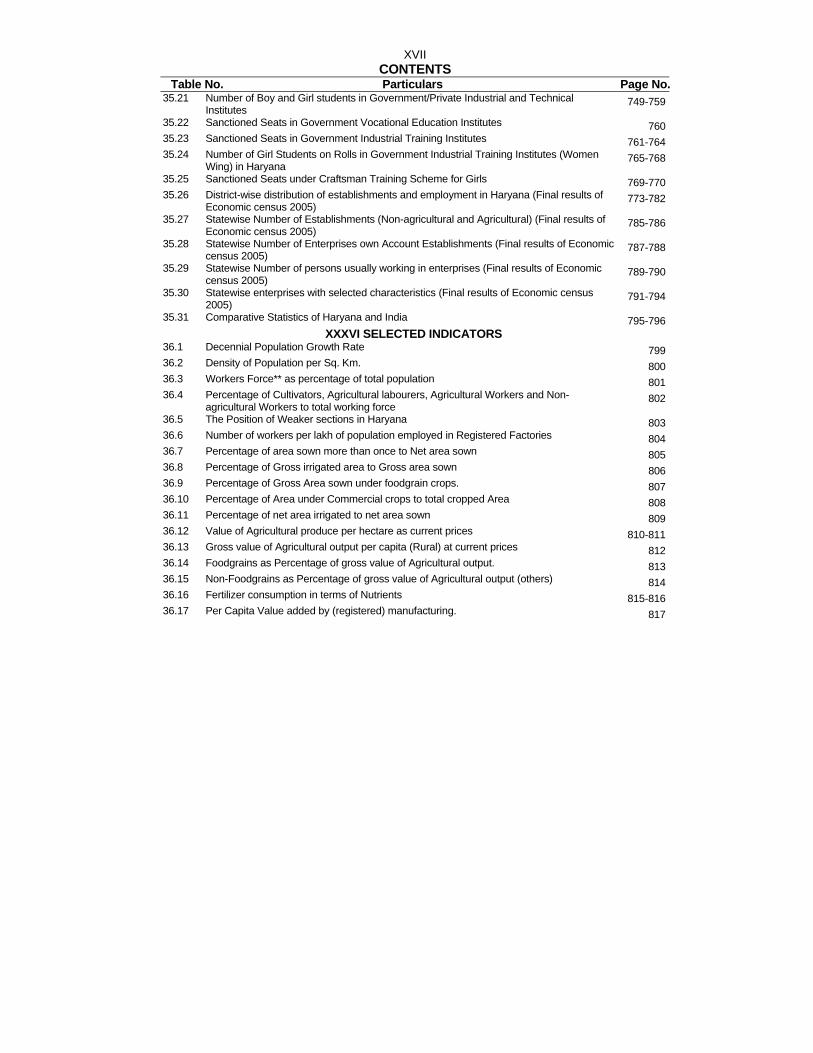
XVII CONTENTS
Table No. Particulars Page No.35.21 Number of Boy and Girl students in Government/Private Industrial and Technical
Institutes 749-759
35.22 Sanctioned Seats in Government Vocational Education Institutes 76035.23 Sanctioned Seats in Government Industrial Training Institutes 761-76435.24 Number of Girl Students on Rolls in Government Industrial Training Institutes (Women
Wing) in Haryana 765-768
35.25 Sanctioned Seats under Craftsman Training Scheme for Girls 769-77035.26 District-wise distribution of establishments and employment in Haryana (Final results of
Economic census 2005) 773-782
35.27 Statewise Number of Establishments (Non-agricultural and Agricultural) (Final results of Economic census 2005)
785-786
35.28 Statewise Number of Enterprises own Account Establishments (Final results of Economic census 2005)
787-788
35.29 Statewise Number of persons usually working in enterprises (Final results of Economic census 2005)
789-790
35.30 Statewise enterprises with selected characteristics (Final results of Economic census 2005)
791-794
35.31 Comparative Statistics of Haryana and India 795-796XXXVI SELECTED INDICATORS
36.1 Decennial Population Growth Rate 79936.2 Density of Population per Sq. Km. 80036.3 Workers Force** as percentage of total population 80136.4 Percentage of Cultivators, Agricultural labourers, Agricultural Workers and Non-
agricultural Workers to total working force 802
36.5 The Position of Weaker sections in Haryana 80336.6 Number of workers per lakh of population employed in Registered Factories 80436.7 Percentage of area sown more than once to Net area sown 80536.8 Percentage of Gross irrigated area to Gross area sown 80636.9 Percentage of Gross Area sown under foodgrain crops. 80736.10 Percentage of Area under Commercial crops to total cropped Area 80836.11 Percentage of net area irrigated to net area sown 80936.12 Value of Agricultural produce per hectare as current prices 810-81136.13 Gross value of Agricultural output per capita (Rural) at current prices 81236.14 Foodgrains as Percentage of gross value of Agricultural output. 81336.15 Non-Foodgrains as Percentage of gross value of Agricultural output (others) 81436.16 Fertilizer consumption in terms of Nutrients 815-81636.17 Per Capita Value added by (registered) manufacturing. 817

XVIII CONTENTS
Table No. Particulars Page No.36.18 Percentage consumption of electric power purposewise 81836.19 Metalled (Surfaced) Road (length in Kms.). 81936.20 Regulated Markets per lakh Hectares of Net area sown 82036.21 Percentage of School-going children 82136.22 Percentage of School-going Children in various age-groups 822-82336.23 Number of pupils per teacher 824-82736.24 Number of Schools per 1,000 School-going children 828-82936.25 Percentage of Literacy 83036.26 Number of seats per lakh of Population for Technical Training 833-83436.27 Number of Hospitals per five lakh of population 83536.28 Number of beds per lakh of Population 83636.29 Number of Family Welfare Centres per lakh of Population 837-83836.30 Percentage of problem villages provided with safe drinking water supply 83936.31 Number of persons per bank 84036.32 Per Capita Deposits of Scheduled Commercial Banks 84136.33 Number of Post Office per lakh of Population 84236.34 Number of Commercial Vehicles per lakh of Population 843-84436.35 Statewise Indicators 845-846
*******

XIX
With best compliments from
CH. BHUPINDER SINGH HOODA Chief Minister, Haryana
With best compliments from
CH. BHUPINDER SINGH HOODA Chief Minister, Haryana
Printed at : Haryana Government Press, Panchkula.

XX

XXI


1
PART - I SOCIAL STATISTICS

2

3
SECTION I ADMINISTRATIVE STRUCTURE OF HARYANA
This section provides details about the Administrative Structure of Haryana.
Table 1.1 shows the Council of Ministers in the State.
Table 1.2 contains the names of Chairman, Deputy Chairman and Members of the State Planning Board, Haryana.
Table 1.3 gives the names of the Judges of Punjab and Haryana High Court.
Table 1.4 shows the names of the Chairman and Members of Haryana Public Service Commission.
Table 1.5 shows the names of the Chairman and Members of Staff Selection Commission.
Table 1.6 presents names of Universities and their Vice-Chancellors.
Table 1.7 shows the names of Commissioners and Deputy Commissioners.
Table 1.8 shows the names of Divisions, Sub-Divisions, Districts, Tahsils, Sub-Tahsils and Blocks.

4
5
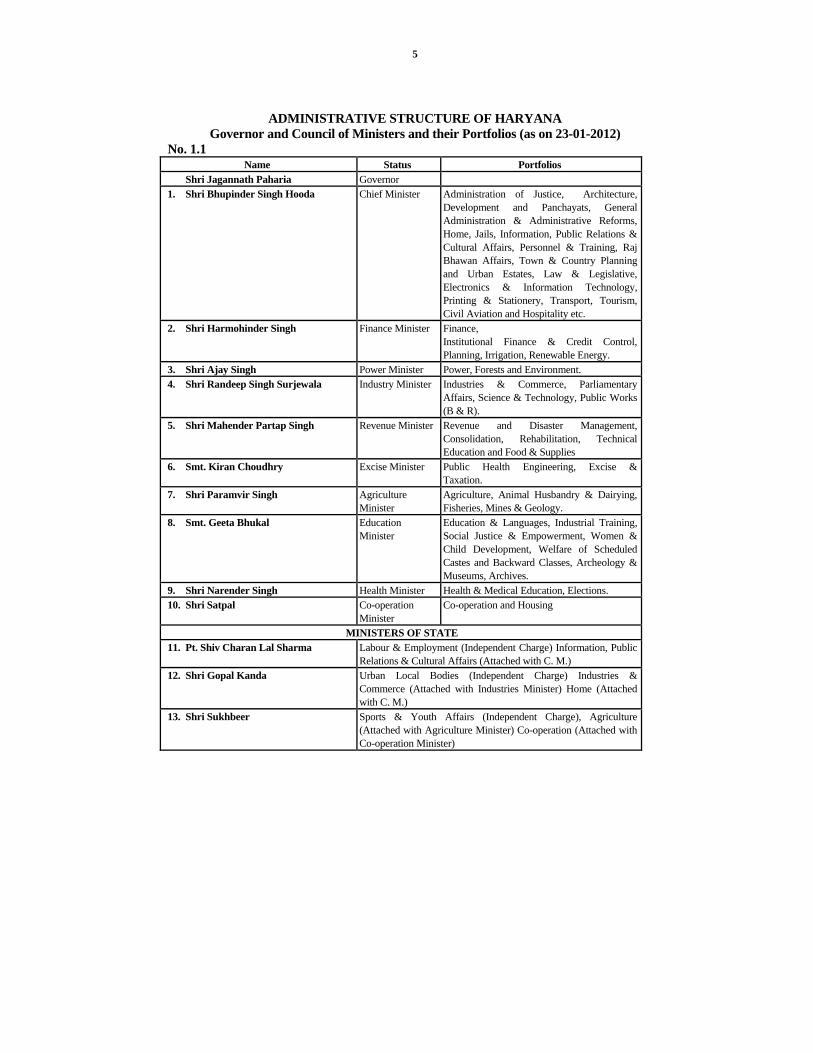
ADMINISTRATIVE STRUCTURE OF HARYANA Governor and Council of Ministers and their Portfolios (as on 23-01-2012)
No. 1.1 Name Status Portfolios
Shri Jagannath Paharia Governor 1. Shri Bhupinder Singh Hooda Chief Minister Administration of Justice, Architecture,
Development and Panchayats, General Administration & Administrative Reforms, Home, Jails, Information, Public Relations & Cultural Affairs, Personnel & Training, Raj Bhawan Affairs, Town & Country Planning and Urban Estates, Law & Legislative, Electronics & Information Technology, Printing & Stationery, Transport, Tourism, Civil Aviation and Hospitality etc.
2. Shri Harmohinder Singh Finance Minister Finance, Institutional Finance & Credit Control, Planning, Irrigation, Renewable Energy.
3. Shri Ajay Singh Power Minister Power, Forests and Environment. 4. Shri Randeep Singh Surjewala Industry Minister Industries & Commerce, Parliamentary
Affairs, Science & Technology, Public Works (B & R).
5. Shri Mahender Partap Singh Revenue Minister Revenue and Disaster Management, Consolidation, Rehabilitation, Technical Education and Food & Supplies
6. Smt. Kiran Choudhry Excise Minister Public Health Engineering, Excise & Taxation.
7. Shri Paramvir Singh Agriculture Minister
Agriculture, Animal Husbandry & Dairying, Fisheries, Mines & Geology.
8. Smt. Geeta Bhukal Education Minister
Education & Languages, Industrial Training, Social Justice & Empowerment, Women & Child Development, Welfare of Scheduled Castes and Backward Classes, Archeology & Museums, Archives.
9. Shri Narender Singh Health Minister Health & Medical Education, Elections. 10. Shri Satpal Co-operation
Minister Co-operation and Housing
MINISTERS OF STATE 11. Pt. Shiv Charan Lal Sharma Labour & Employment (Independent Charge) Information, Public
Relations & Cultural Affairs (Attached with C. M.) 12. Shri Gopal Kanda Urban Local Bodies (Independent Charge) Industries &
Commerce (Attached with Industries Minister) Home (Attached with C. M.)
13. Shri Sukhbeer Sports & Youth Affairs (Independent Charge), Agriculture (Attached with Agriculture Minister) Co-operation (Attached with Co-operation Minister)

6
ADMINISTRATIVE STRUCTURE OF HARYANA Governor and Council of Ministers and their Portfolios
(as on 23-01-2012) No. 1.1 (Concld.)
Name Portfolios
CHIEF PARLIAMENTARY SECRETARY
14. Smt. Anita Yadav Food & Supplies, Women & Child Development
15. Shri Dan Singh Education, Town & Country Planning.
16. Shri Dharambir Agriculture, Development & Panchayats
17. Shri Jaiveer Social Justice and Empowerment, Co-operation.
18. Shri Jaleb Khan Revenue & Disaster Management, Housing, Wakf, Public Health, Engineering, Printing & Stationery
19. Shri Prahlad Singh Gillankhera PWD (B&R), Youth Affairs & Sports, Forest and Environment.
20. Shri Ram Kishan Fouji Health, Medical Education, Administration of Justice, Hospitality, Tourism.
21. Miss. Sharda Rathore Home, Excise & Taxation, Urban Local Bodies
22. Shri Sultan Singh Irrigation, Transport.
23. Shri Ram Kishan Industries & Commerce, Electronics and Information Technology.
24. Shri Vinod Bhayana Power, Jail, Law & Legislative.

7
ADMINISTRATIVE STRUCTURE OF HARYANA State Planning Board, Haryana
No. 1.2 (As on 16-12-2011) Status Name
1 2
Chairman Chief Minister, Haryana
Deputy Chairman Vacant
Official Members 1. Finance Minister, Haryana
2. Chief Secretary to Government, Haryana
3. Principal Secretary/Chief Minister, Haryana
4. Financial Commissioner and Principal Secretary to Government, Haryana, Finance
Department
5. Financial Commissioner and Principal Secretary to Government, Haryana, Planning
Department
6. Financial Commissioner and Principal Secretary to Government, Haryana, Development
and Panchayats Department
7. Financial Commissioner and Principal Secretary to Government, Haryana, Social
Welfare Department
8. Commissioner & Secretary to Govt. Haryana, Industries & Commerce Department
9. Commissioner and Secretary to Government, Haryana, Agriculture Department
10. Director, Department of Economic and Statistical Analysis, Haryana.
Member Secretary Officer-on-Special Duty, State Planning Board, Haryana.
8
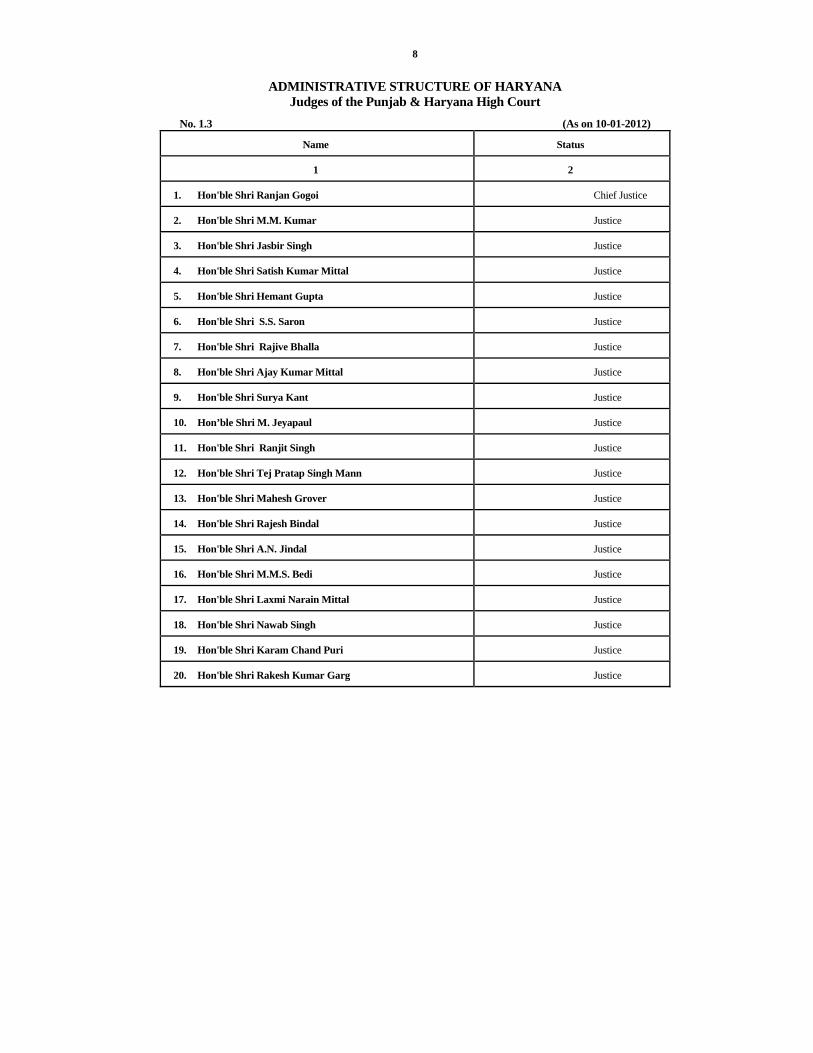
ADMINISTRATIVE STRUCTURE OF HARYANA Judges of the Punjab & Haryana High Court
No. 1.3 (As on 10-01-2012)
Name Status
1 2
1. Hon'ble Shri Ranjan Gogoi Chief Justice
2. Hon'ble Shri M.M. Kumar Justice
3. Hon'ble Shri Jasbir Singh Justice
4. Hon'ble Shri Satish Kumar Mittal Justice
5. Hon'ble Shri Hemant Gupta Justice
6. Hon'ble Shri S.S. Saron Justice
7. Hon'ble Shri Rajive Bhalla Justice
8. Hon'ble Shri Ajay Kumar Mittal Justice
9. Hon'ble Shri Surya Kant Justice
10. Hon’ble Shri M. Jeyapaul Justice
11. Hon'ble Shri Ranjit Singh Justice
12. Hon'ble Shri Tej Pratap Singh Mann Justice
13. Hon'ble Shri Mahesh Grover Justice
14. Hon'ble Shri Rajesh Bindal Justice
15. Hon'ble Shri A.N. Jindal Justice
16. Hon'ble Shri M.M.S. Bedi Justice
17. Hon'ble Shri Laxmi Narain Mittal Justice
18. Hon'ble Shri Nawab Singh Justice
19. Hon'ble Shri Karam Chand Puri Justice
20. Hon'ble Shri Rakesh Kumar Garg Justice

9
ADMINISTRATIVE STRUCTURE OF HARYANA Judges of the Punjab & Haryana High Court
No. 1.3 (As on 10-01-2012)
Name Status
1 2
21. Hon'ble Shri Rakesh Kumar Jain Justice
22. Hon'ble Shri Kanwaljit Singh Ahluwalia Justice
23. Hon'ble Shri Jaswant Singh Justice
24. Hon'ble Smt. Daya Chaudhary Justice
25. Hon'ble Smt. Sabina Justice
26. Hon'ble Shri Jora Singh Justice
27. Hon'ble Shri Rajan Gupta Justice
28. Hon'ble Shri Ajay Tewari Justice
29. Hon'ble Shri. Jitendra Chauhan Justice
30. Hon'ble Shri. Augustine George Masih Justice
31. Hon'ble Smt. Nirmaljit Kaur Justice
32. Hon'ble Shri K. Kannan Justice
33. Hon'ble Shri Alok Singh Justice
34. Hon'ble Shri. Mehinder Singh Sullar Justice
35. Hon'ble Shri Ram Chand Gupta Justice
36. Hon'ble Smt Ritu Bahri Justice
37. Hon’ble Shri Vijender Singh Malik Justice
38. Hon’ble Shri Paramjeet Singh Justice
39. Hon’ble Shri Naresh Kumar Sanghi Justice
40. Hon’ble Shri Rameshwar Singh Malik Justice
41. Hon’ble Shri Rajiv Narain Raina Justice
42. Hon’ble Shri Tejinder Singh Dhindsa Justice
43. Hon’ble Shri Gurmeet Singh Sandhawalia Justice

10
ADMINISTRATIVE STRUCTURE OF HARYANA Public Service Commission, Haryana
No. 1.4 (As on 03-01-2012 Name Status
1 2
1. Lt. Gen. Devender Paul Vats Chairman
2. Shri M.P. Bidlan (I.A.S. Retd.) Member
3. Shri Prem Parkash Pandit Member
4. Shri Jai Singh Sangwan, (H.C.S., Retd.) Member
5. Shri Manbir Singh Bhadana Member
6. Shri I.C. Sangwan (I.A.S.) Secretary
7. Shri Ram Karan Sharma Controller of Examinations

11
ADMINISTRATIVE STRUCTURE OF HARYANA Haryana Staff Selection Commission
No. 1.5 (As on 16-12-2011) Name Status
1 2
1. Shri Vijay Kumar Chairman
2. Smt. Vinay Sharma Member
3. Shri Ashok Jain Member
4. Shri Ram Sharan Bhola Member
5. Shri Lal Singh Yadav Member
6. Shri Lalit Kumar Butana Member
7. Shri P.D. Verma, H.C.S. Secretary

12
ADMINISTRATIVE STRUCTURE OF HARYANA Universities and their Vice-Chancellors in Haryana
No. 1.6 (As on 23-1-2012) Name of the Vice-Chancellor University
1 2
1. Lt. Gen (Dr.) D.D.S. Sandhu Kurukshetra University, Kurukshetra
2. Prof. R.P. Hooda Maharishi Dayanand University, Rohtak
3. Dr. K.S. Khokhar Chaudhary Charan Singh, Haryana Agricultural University, Hisar.
4. Dr. Muni Lal Ranga Guru Jambheshwar University of Science and Technology, Hisar
5. Dr. K. C. Bhardwaj Ch. Devi Lal University, Sirsa
6. Dr. (Mrs.) Pankaj Mittal Bhagatphul Singh Mahila University Khanpur Kalan, Sonipat
7. Sh. H.S. Chahal Deen Bandhu Chhotu Ram University of Science and Technology, Murthal
8. Sh. Mohinder Kumar YMCA University of Science and Technology, Faridabad
9. Dr. S.S. Sangwan Pt. B. D. Sharma University of Health Science, Rohtak

13
ADMINISTRATIVE STRUCTURE OF HARYANA
Commissioners and Deputy Commissioners in Haryana
No. 1.7 (As on 23-01-2012) Name Status Division/District
1 2 3
1. Shri Mahabir Parshad Bansal Commissioner Hisar
i. Shri Amit Kumar Agrawal Deputy Commissioner Hisar
ii. Shri Mohan Lal Kaushik Deputy Commissioner Fatehabad
iii. Shri J. Ganesan Deputy Commissioner Sirsa
iv. Shri Y.S. Khyalia Deputy Commissioner Jind
v. Shri Nitin Kumar Yadav Deputy Commissioner Bhiwani
2. Shri R.P. Gupta Commissioner Ambala
i. Shri Shekhar Vidyarathi Deputy Commissioner Ambala
ii. Shri Ashok Sangwan Deputy Commissioner Yamunanagar
iii. Shri Mandip Singh Brar Deputy Commissioner Kurukshetra
iv. Smt. A. Mona Sreenivas Deputy Commissioner Kaithal
v. Smt. Ashima Brar Deputy Commissioner Panchkula
3. Smt. Suprabha Dahiya Commissioner Rohtak
i. Shri Vikas Gupta Deputy Commissioner Rohtak
ii. Shri Ajit Balaji Joshi Deputy Commissioner Jhajjar
iii. Smt. Neelam Pradeep Kasni Deputy Commissioner Karnal
iv. Shri J.S. Ahlawat Deputy Commissioner Panipat
v. Shri Pankaj Agarwal Deputy Commissioner Sonipat
4. Shri T.K. Sharma Commissioner Gurgaon
i. Shri Phool Chand Meena Deputy Commissioner Gurgaon
ii. Shri Rakesh Gupta Deputy Commissioner Faridabad
iii. Shri C.G. Rajini Kaanthan Deputy Commissioner Rewari
iv. Shri Saket Kumar Deputy Commissioner Mahendragarh
v. Shri Balraj Singh Deputy Commissioner Mewat at Nuh
vi. Shri Vijay Singh Dahiya Deputy Commissioner Palwal

14
ADMINISTRATIVE STRUCTURE OF HARYANA Divisions, Sub-Divisions, Districts, Tahsils, Sub-Tahsils and Blocks in Haryana
No. 1.8 (As on 01-02-2012) S.No. District Sub-Division Tahsil Sub-Tahsil Block
1 2 3 4 5 6 1. Ambala Division
1. Ambala 1. Ambala 1. Ambala 1. Ambala Cantt. 1. Ambala-I 2. Naraingarh 2. Barara 2. Mullana 2. Ambala-II 3. Barara 3. Naraingarh 3. Saha 3. Barara 4. Shezadpur 4. Shehzadpur 5. Naraingarh 6. Saha
2. Panchkula 1. Panchkula 1. Panchkula 1. Barwala 1. Barwala 2. Kalka 2. Kalka 2. Morni 2. Pinjore 3. Raipur Rani 3. Morni 4. Raipur Rani
3. Yamunanagar 1. Jagadhri 1. Jagadhri 1. Radaur 1. Bilaspur 2. Bilaspur 2. Chhachhrauli 2. Sadhaura 2. Chhachhrauli 3. Bilaspur 3. Mustafabad 3. Jagadhri 4. Radaur 5. Sadhaura 6. Mustafabad
4. Kurukshetra 1. Thanesar 1. Thanesar 1. Ladwa 1. Ladwa 2. Pehowa 2. Pehowa 2. Ismailabad 2. Pehowa 3. Shahbad 3. Shahbad 3. Babain 3. Shahbad 4. Thanesar 5. Babain
5. Kaithal 1. Kaithal 1. Kaithal 1. Kalayat 1. Guhla at Cheeka 2. Guhla 2. Guhla 2. Siwan 2. Kaithal 3. Fatehpur Pundri 3. Rajound 3. Pundri 4. Dhand 4. Kalayat 5. Rajound 6. Siwan

15
ADMINISTRATIVE STRUCTURE OF HARYANA Divisions, Sub-Divisions, Districts, Tahsils, Sub-Tahsils and Blocks in Haryana
No. 1.8 (Contd.) (As on 01-02-2012) S.No. District Sub-Division Tahsil Sub-Tahsil Block
1 2 3 4 5 6 2. Rohtak Division
6. Karnal 1. Karnal 1. Karnal 1. Nissing 1. Gharaunda 2. Assandh 2. Assandh 2. Ballah 2. Indri 3. Indri 3. Nilokheri 3. Nigdhu 3. Karnal 4. Indri 4. Nilokheri 5. Gharaunda 5. Nissing at Chirao 6. Assandh
7. Panipat 1. Panipat 1. Panipat 1. Bapauli 1. Panipat 2. Samalkha 2. Samalkha 2. Madlauda 2. Israna 3. Israna 3. Madlauda 4. Samalkha 5. Bapauli
8. Sonipat 1. Sonipat 1. Sonipat 1. Khanpur Kalan 1. Ganaur 2. Gohana 2. Ganaur 2. Kharkhoda 3. Ganaur 3. Gohana 3. Rai 4. Kharkhoda 4. Kharkhoda 4. Sonipat 5. Mundlana 6. Kathura 7. Gohana
9. Rohtak 1. Rohtak 1. Rohtak 1. Kalanaur 1. Kalanaur 2. Meham 2. Meham 2. Lakhan Majra 3. Sampla 3. Meham 4. Rohtak 5. Sampla
10. Jhajjar 1. Jhajjar 1. Jhajjar 1. Salhawas 1. Jhajjar 2. Bahadurgarh 2. Bahadurgarh 2. Bahadurgarh 3. Beri 3. Beri 3. Beri 4. Matanhail 4. Salhawas 5. Matenhail
3. Gurgaon Division 11. Gurgaon 1. North
Gurgaon 1. Gurgaon 1. Farukh Nagar
2. South Gurgaon
2. Pataudi 2. Gurgaon
3. Pataudi 3. Sohna 3. Pataudi 4. Farukh Nagar 4. Sohna. 5. Manesar
16
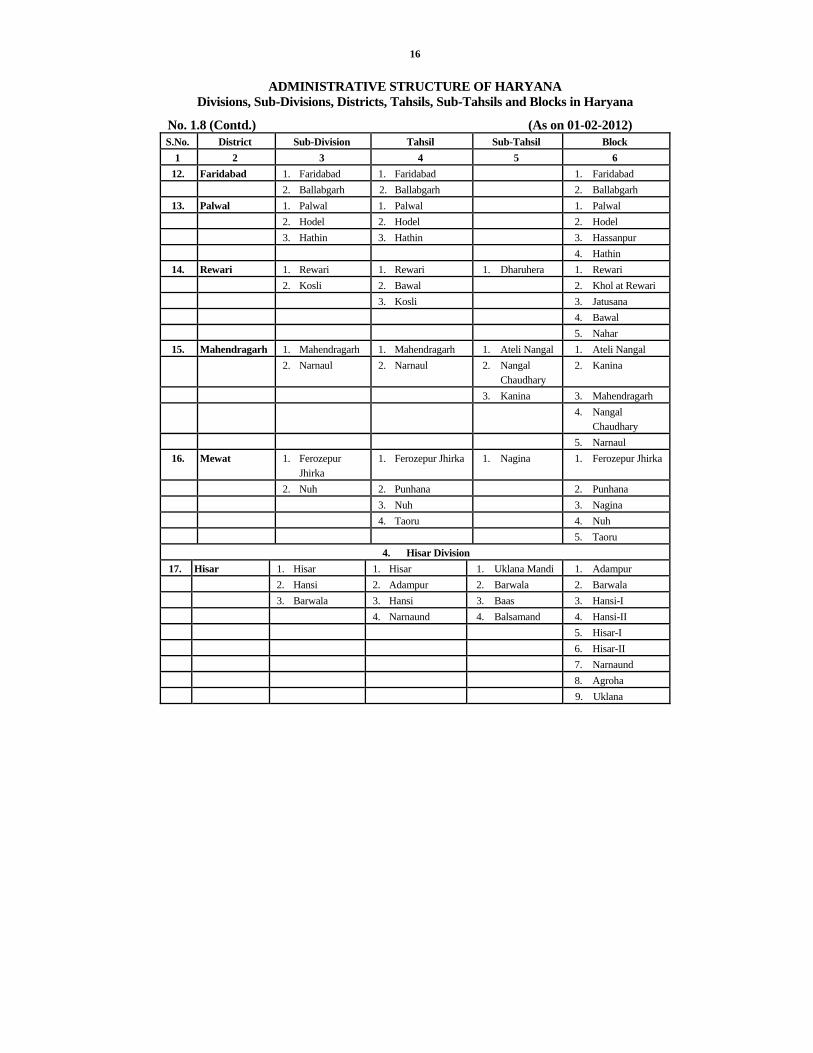
ADMINISTRATIVE STRUCTURE OF HARYANA Divisions, Sub-Divisions, Districts, Tahsils, Sub-Tahsils and Blocks in Haryana
No. 1.8 (Contd.) (As on 01-02-2012) S.No. District Sub-Division Tahsil Sub-Tahsil Block
1 2 3 4 5 6 12. Faridabad 1. Faridabad 1. Faridabad 1. Faridabad
2. Ballabgarh 2. Ballabgarh 2. Ballabgarh 13. Palwal 1. Palwal 1. Palwal 1. Palwal
2. Hodel 2. Hodel 2. Hodel 3. Hathin 3. Hathin 3. Hassanpur 4. Hathin
14. Rewari 1. Rewari 1. Rewari 1. Dharuhera 1. Rewari 2. Kosli 2. Bawal 2. Khol at Rewari 3. Kosli 3. Jatusana 4. Bawal 5. Nahar
15. Mahendragarh 1. Mahendragarh 1. Mahendragarh 1. Ateli Nangal 1. Ateli Nangal 2. Narnaul 2. Narnaul 2. Nangal
Chaudhary 2. Kanina
3. Kanina 3. Mahendragarh 4. Nangal
Chaudhary 5. Narnaul
16. Mewat 1. Ferozepur Jhirka
1. Ferozepur Jhirka 1. Nagina 1. Ferozepur Jhirka
2. Nuh 2. Punhana 2. Punhana 3. Nuh 3. Nagina 4. Taoru 4. Nuh 5. Taoru
4. Hisar Division 17. Hisar 1. Hisar 1. Hisar 1. Uklana Mandi 1. Adampur
2. Hansi 2. Adampur 2. Barwala 2. Barwala 3. Barwala 3. Hansi 3. Baas 3. Hansi-I 4. Narnaund 4. Balsamand 4. Hansi-II 5. Hisar-I 6. Hisar-II 7. Narnaund 8. Agroha 9. Uklana

17
ADMINISTRATIVE STRUCTURE OF HARYANA Divisions, Sub-Divisions, Districts, Tahsils, Sub-Tahsils and Blocks in Haryana
No. 1.8 (Contd.) (As on 01-02-2012)
S.No. District Sub-Division Tahsil Sub-Tahsil Block
1 2 3 4 5 6 18. Fatehabad 1. Fatehabad 1. Fatehabad 1. Bhuna 1. Fatehabad
2. Tohana 2. Tohana 2. Bhattu Kalan 2. Tohana 3. Ratia 3. Ratia 3. Jakhal 3. Ratia 4. Bhattu Kalan 5. Bhuna 6. Jakhal
19. Sirsa 1. Sirsa 1. Sirsa 1. Nathusari Chopta
1. Dabwali
2. Dabwali 2. Dabwali 2. Kalanwali 2. Baragudha 3. Ellenabad 3. Ellenabad 3. Ellenabad 4. Rania 4. Rania 5. Sirsa 6. Odhan 7. Nathusari Chopta
20. Jind 1. Jind 1. Jind 1. Alewa 1. Jind 2. Safidon 2. Safidon 2. Pillu Khera 2. Julana 3. Narwana 3. Narwana 3. Uchana 3. Pillu Khera 4. Julana 4. Safidon 5. Uchana 6. Narwana 7. Alewa
21. Bhiwani 1. Bhiwani 1. Bhiwani 1. Bond Kalan 1. Badhra 2. Tosham 2. Bawani Khera 2. Bahal 2. Bawani Khera 3. Dadri 3. Tosham 3. Bhiwani 4. Loharu 4. Dadri 4. Dadri 5. Siwani 5. Loharu 5. Bond Kalan 6. Siwani 6. Loharu 7. Badhra 7. Tosham 8. Kairu 9. Siwani 10. Bahal

18
ADMINISTRATIVE STRUCTURE OF HARYANA Divisions, Sub-Divisions, Districts, Tahsils, Sub-Tahsils and Blocks in Haryana
No. 1.8 (Concld.) (As on 01-02-2012) Summary
Divisions 4
Districts 21
Sub-Divisions 57
Tahsils 74
Sub-Tahsils 44
Blocks 119

19
SECTION II BASIC STATISTICS OF HARYANA
This section provides basic statistics relating to the Haryana State. These statistics have been collected from various departments.

20

21
BASIC STATISTICS Basic Statistics of Haryana
No. 2.1 1 2 3
1. Area Sq. K.M. 44,212 Divisions Number 4 Districts Number 21 Sub-divisions Number 57 Tahsils Number 74 Sub-tahsils Number 44 Blocks Number 119 Towns (2011 Census) Number 154* Total Villages (2011 Census(P)) Number 6,8412. Population (2011 Census(P))
(i) Total Population Lakh 253.53 Males Lakh 135.05 Females Lakh 118.48(ii) Rural Population Lakh 165.31 Percentage to total Percentage 65.21(iii) Urban Population Lakh 88.22 Percentage to total Percentage 34.79(iv) Density (Total) Per Sq. Km 573 Rural Per Sq. Km 385 Urban Per Sq. Km 6890(v) Literate and Educated
Persons Lakh 169.04
(vi) Literacy Rate@ Percentage 76.64 Male Percentage 85.38 Female Percentage 66.77 Rural Percentage 72.74 Urban Percentage 83.83(vii) Scheduled Castes
(2001 Census) Lakh 40.91
SC Population percentage of Total population
Percentage 19.35
Rural Percentage 21.36 Urban Percentage 14.39
@ Execlusive of children in the age-group of 0-6 years *Including 74 Census Towns P- Provisional

22
BASIC STATISTICS Basic Statistics of Haryana
No. 2.1 (Contd.) 1 2 3
(viii) Literacy Rate of scheduled castes population (2001 Census)
Percentage 55.45
Male Percentage 66.93 Female Percentage 42.26 Rural Percentage 54.13 Urban Percentage 60.19(ix) Decennial Percentage increase (2011 Census)(P) Percentage 19.90 Rural Percentage 10.00 Urban Percentage 44.25(x) Total Workers (Main + Marginal) (2001 Census) No. 8377466 Main Workers No. 6241324 Marginal Workers No. 2136142 Non Workers No. 12767098(xi) 0-6 Age Group Population (2011 Census) (P) No. 3297724 Male No. 1802047 Female No. 1495677 Rural No. 2242901 Urban No. 1054823(xii) State Population as Percentage to total
Population of India Percentage 2.09
(xiii) State area as Percentage to total area of India Percentage 1.343. Climate (2009) Average Rainfall Cms. 44.34. Agriculture 2009-10(P) Net Area Sown 000 Hectares 35,50 Area sown more than once 000 Hectares 28,01 Total Cropped Area 000 Hectares 63,51 Production of crops— Total cereals 000 Tonnes 1,52,48 Total pulses 000 Tonnes 97 Total foodgrains 000 Tonnes 1,53,45 Total oil seeds 000 Tonnes 862
P—Provisional
23
BASIC STATISTICS Basic Statistics of Haryana
No. 2.1 (Contd.) 1 2 3
Area, Production and Yield of Principal Crops Rice Area 000 Hectares 12,06Production 000 Tonnes 36,28Yield Kgs. per Hectare 30,08Wheat Area 000 Hectares 24,88Production 000 Tonnes 1,04,88Yield Kgs. per Hectare 4,215Bajra Area 000 Hectares 5,83Production 000 Tonnes 9,30Yield Kgs. per Hectare 1,592Barley Area 000 Hectares 42Production 000 Tonnes 1,37Yield Kgs. Per Hectare 3,262Maize Area 000 Hectares 12Production 000 Tonnes 26Yield Kgs. Per Hectare 2,167Sugarcane Area 000 Hectares 79Production* 000 Tonnes 5,71Yield* Kgs. Per Hectare 7,224Rape seed and Mustard Area 000 Hectares 5,11Production 000 Tonnes 8,47Yield Kgs. Per Hectare 1,657Cotton Area 000 Hectares 5,05Production 000 Bales** 19,18Tractors Number 2,62,236(2010-11)
* In terms of Gur P—Provisional ** Bales of 170 Kgs. Each

24
BASIC STATISTICS Basic Statistics of Haryana
No. 2.1 (Contd.) 1 2 3
5. Irrigation 2009-10
Net area irrigated by—
Govt. Canals 000 Hectares 12,82
Wells/Tubewells 000 Hectares 17,85
Others 000 Hectares 2
Total 000 Hectares 30,69
Gross area irrigated 000 Hectares 55,45
Tubewells and Pumping sets Number 7,23,457(2010-11)(P)
6. Forests (2010-11)
Area under Forests Sq. K.M. 1,684
7. Animal Husbandry (2010-11)
Veterinary Hospitals Number 942
Veterinary Dispensaries Number 1,809
Area stocked for Fisheries Hectares 17,094
Number of developed Gaushalas Number 283
8. Electricity 2010-11(P)
Power available for sale Million KWH 27,224 (2008-09)
Consumption of Electric Power Lakh KWH 2,40,125
Units sold per capita KWH . .
9. Industries (2010)
Registered working Factories Number 10,513
Estimated Number of workers employed in working Factories
000 Number 7,82
10. Medical and Health (2010-11)
Hospitals, Dispensaries and Health Centres Number 3,242
Ayurvedic, Unani and Homoeopathic Institutions Number 499
Patients treated** Lakh 152.70
Beds available Number 10,006** As on 31st December P—Prvisional

25
BASIC STATISTICS
Basic Statistics of Haryana No. 2.1 (Concld.)
1 2 3
11. Education 2010-11
Universities Number 24
Colleges Number 776
High/Senior Secondary Schools Number 6,771
Middle Schools Number 3,439
Primary Schools (Including Pre-Primary) Number 13,094
Scholars in Recognised Schools Lakh 49.78 (2009-10)
Teachers in Recognised Schools Number 1,43,057 (2009-10)
12. Co-operation (2010-11)
All types of Societies Number 36,592
Membership Lakh 57.53
13. Transport (2010-11)
Fleet strength of Haryana Roadways Number 3,211
Overall Profit per Kilometre Paise (–)730
14. Roads (2010-11)
Metalled Roads (P.W.D.) K.M. 25,426
Villages connected with Pucca Roads Number 6,757
15. Commercial Banks (31-3-2011)
Scheduled Banks Number 2,623
16. Miscellaneous
Post-offices (2009-10) Number 2,653
Telephone Exchanges (2008-09) Number 1,285
Total Employment in Organised Sector (31-3-2011) Lakh 7.13(P)
Police Stations (31-12-2011) Number 271
Seats in Haryana State Assembly Number 90
Seats in Lok Sabha Number 10
27
SECTION III
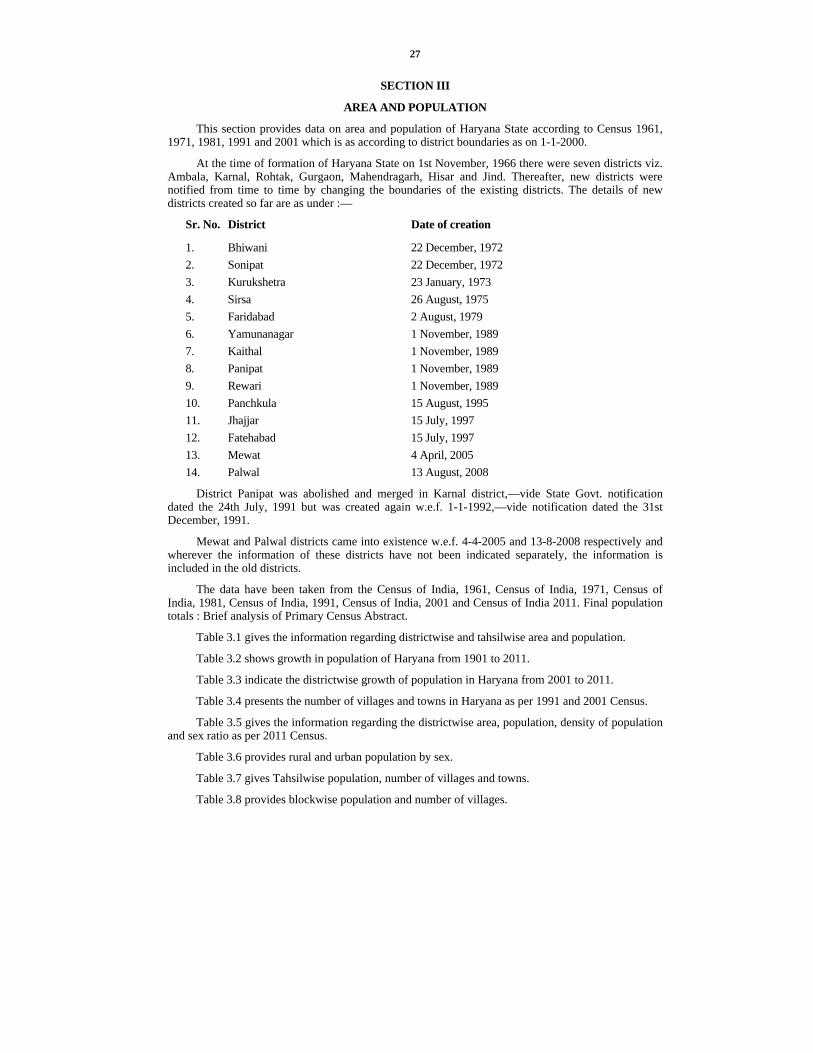
AREA AND POPULATION
This section provides data on area and population of Haryana State according to Census 1961, 1971, 1981, 1991 and 2001 which is as according to district boundaries as on 1-1-2000.
At the time of formation of Haryana State on 1st November, 1966 there were seven districts viz. Ambala, Karnal, Rohtak, Gurgaon, Mahendragarh, Hisar and Jind. Thereafter, new districts were notified from time to time by changing the boundaries of the existing districts. The details of new districts created so far are as under :—
Sr. No. District Date of creation
1. Bhiwani 22 December, 1972 2. Sonipat 22 December, 1972 3. Kurukshetra 23 January, 1973 4. Sirsa 26 August, 1975 5. Faridabad 2 August, 1979 6. Yamunanagar 1 November, 1989 7. Kaithal 1 November, 1989 8. Panipat 1 November, 1989 9. Rewari 1 November, 1989 10. Panchkula 15 August, 1995 11. Jhajjar 15 July, 1997 12. Fatehabad 15 July, 1997 13. Mewat 4 April, 2005 14. Palwal 13 August, 2008
District Panipat was abolished and merged in Karnal district,—vide State Govt. notification dated the 24th July, 1991 but was created again w.e.f. 1-1-1992,—vide notification dated the 31st December, 1991.
Mewat and Palwal districts came into existence w.e.f. 4-4-2005 and 13-8-2008 respectively and wherever the information of these districts have not been indicated separately, the information is included in the old districts.
The data have been taken from the Census of India, 1961, Census of India, 1971, Census of India, 1981, Census of India, 1991, Census of India, 2001 and Census of India 2011. Final population totals : Brief analysis of Primary Census Abstract.
Table 3.1 gives the information regarding districtwise and tahsilwise area and population.
Table 3.2 shows growth in population of Haryana from 1901 to 2011.
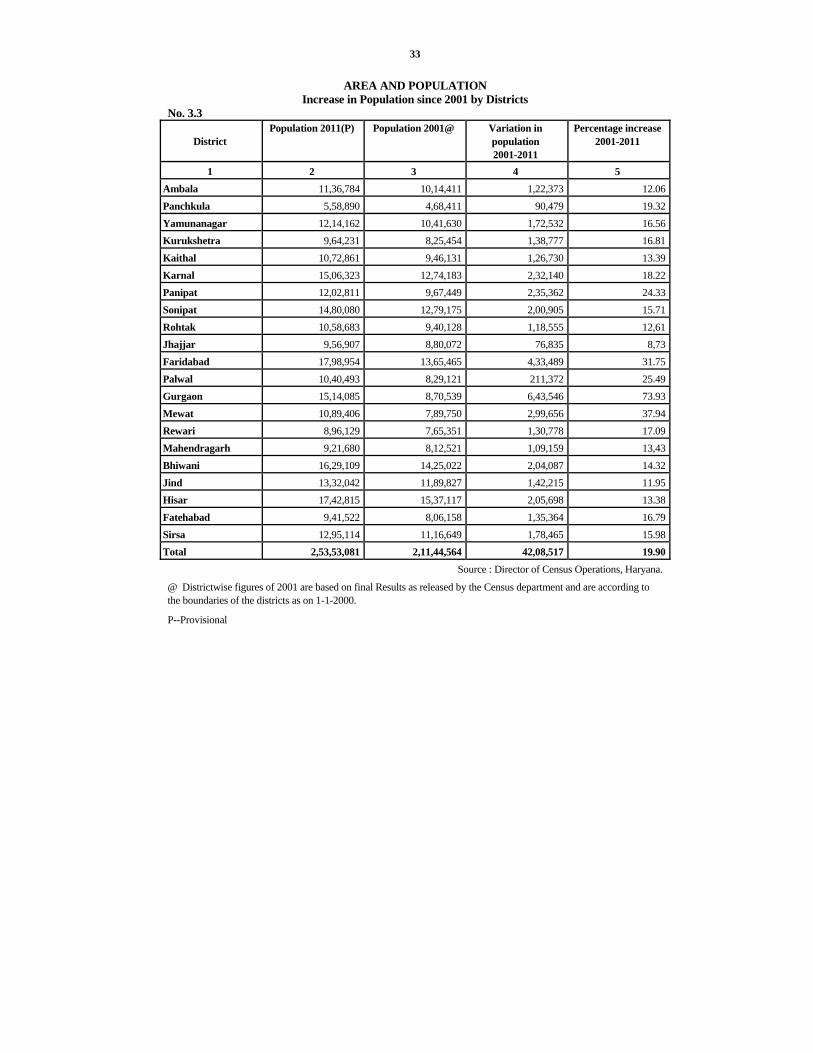
Table 3.3 indicate the districtwise growth of population in Haryana from 2001 to 2011.
Table 3.4 presents the number of villages and towns in Haryana as per 1991 and 2001 Census.
Table 3.5 gives the information regarding the districtwise area, population, density of population and sex ratio as per 2011 Census.
Table 3.6 provides rural and urban population by sex.
Table 3.7 gives Tahsilwise population, number of villages and towns.
Table 3.8 provides blockwise population and number of villages.

28
Table 3.9 presents the districtwise number of rural and urban Households in Haryana.
Table 3.10 shows the districtwise uses of Census Houses—2001
Table 3.11 gives the information regarding classification of villages by various population ranges. Towns classified by various population ranges has been shown in Table 3.12, area, population of towns and density has been shown in table 3.13 and trend in population of towns in Table 3.14. Table 3.15 shows information regarding Cities/Urban agglomerations with a population of one lakh and above.
Table 3.16 gives information regarding districtwise rural and urban workers and nonworkers. Table 3.17 shows the number and percentage, distribution of workers by industrial categories, Information regarding working population classified into Broad industrial categories has been given in Table 3.18.
Tables 3.19, 3.20 and 3.21 depict districtwise distribution of population by age, religion and by languages, respectively.
Table 3.22 gives information regarding Scheduled Castes population. Information regarding working population among Scheduled Castes classified into Broad industrial categories has been given in Table 3.23.
Table 3.24 gives information regarding districtwise number of literates in Haryana.
Table 3.25 gives information regarding districtwise number of scheduled caste literates in Haryana.
Table 3.26 shows the districtwise classification of disabled population by type of disability.
Table 3.27 gives area and population of various States in India according to 2011 Census.
Table 3.28 gives working population of various States in India according to 2001 Census.
Table 3.29 gives information regarding Statewise Scheduled Caste population, literacy among Scheduled Castes and working population of Scheduled Castes according to 2001 Census.
Tables 3.30 and 3.31 give estimated population of Haryana. Statewise estimated Population of India has been given in Table 3.32.
Table 3.33 gives the Statewise information regarding population by major religious communities.
Table 3.34 gives the Statewise information regarding population of Scheduled Castes and Scheduled Tribes.
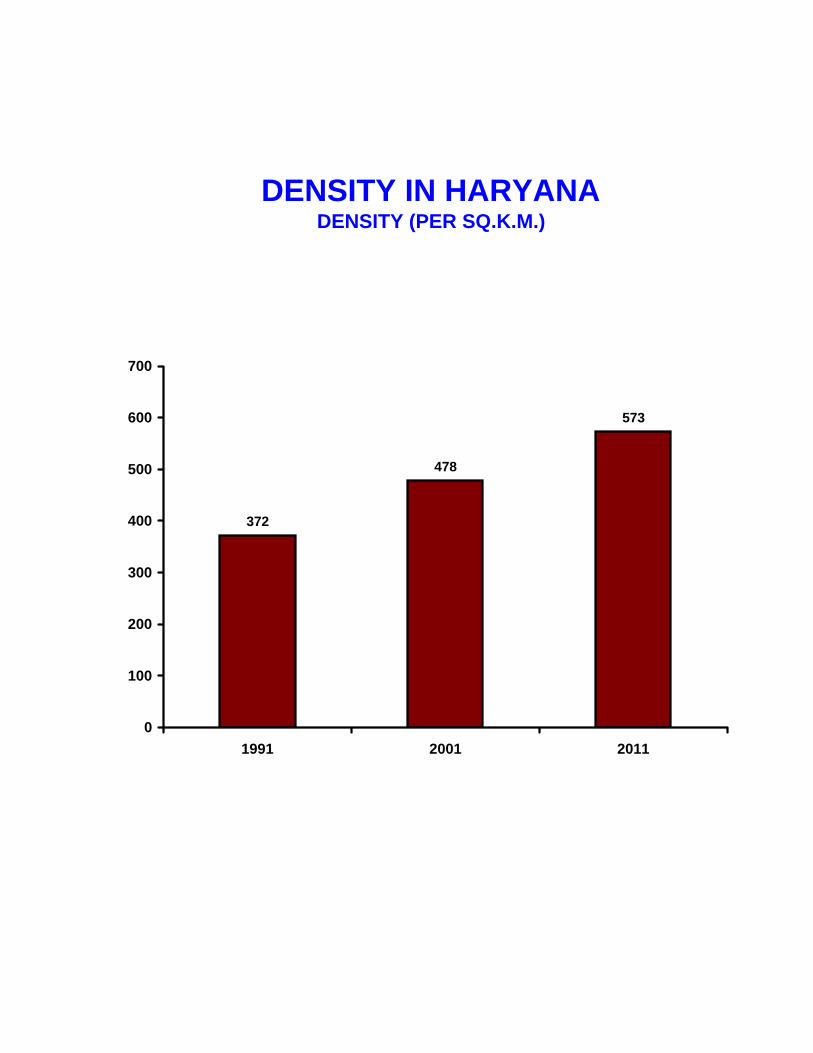
DENSITY IN HARYANA DENSITY (PER SQ.K.M.)
372
478
573
0
100
200
300
400
500
600
700
1991 2001 2011

POPULATION IN HARYANA (In Lakhs)
150.29165.31
61.16
88.22
211.45
253.53
0
50
100
150
200
250
300
2001 2011(P)
Rural Urban Total

29
AREA AND POPULATION Area and Population of Haryana : 2011(P)
No. 3.1 Population (In Number)
District/Tahsil Area (Sq.
Kms.) Rural Urban Total 1 2 3 4 5
1. District Ambala 1,574.00 6,32,243 5,04,541 11,36,784 (i) Naraingarh 477.67 1,97,741 30,968 2,28,709 (ii) Ambala 704.34 2,20,682 4,43,927 6,64,609 (iii) Barara 330.28 2,13,820 29,646 2,43,466
2. District Panchkula 898.00 2,52,231 3,06,659 5,58,890 (i) Kalka 153.98 93,641 73,935 1,67,576 (ii) Panchkula 633.06 1,58,590 2,32,724 3,91,314
3. District Yamunanagar 1,768.00 7,41,370 4,72,792 12,14,162 (i) Jagadhri 1,256.55 4,17,776 4,35,708 8,53,484 (ii) Chhachhrauli 455.58 1,63,648 10.134 1,74,182 (iii) Bilaspur * 1,59,946 26,550 1,86,496
4. District Kurukshetra 1,530.00 6,85,296 2,78,935 9,64,231 (i) Thanesar 891.40 3,94,878 1,83,855 5,78,733 (ii) Pehowa 517.16 2,02,796 52,414 2,55,210 (iii) Shahbad 277.13 87,622 42,666 1,30,288
5. District Kaithal 2,317.00 8,37,171 2,35,690 10,72,861 (i) Guhla 575.06 1,55,948 38,945 1,94,893 (ii) Kaithal 1,695.34 4,78,802 1,63,272 6,42,074 (iii) Fatehpur Pundri * 2,02,421 33,473 2,35,894
6. District Karnal 2,520.00 10,50,293 4,56,030 15,06,323 (i) Karnal 864.09 3,85,486 3,29,767 7,15,253 (ii) Assandh 498.25 2,06,019 26,984 2,33,003 (iii) Nilokheri 399.33 1,63,457 43,916 2,07,373 (iv) Indri 342.43 1,45,004 17,492 1,62,496 (v) Gharaunda 349.90 1,50,327 37,871 1,88,198
7. District Panipat 1,268.00 6,49,866 5,52,945 12,02,811 (i) Panipat 521.10 2,76,308 5,13,195 7,89,503 (ii) Israna 331.41 1,08,223 -- 1,08,223 (iii) Samalkha 449.20 2,65,335 39,750 3,05,085
8. District Sonipat 2,122.00 10,28,393 4,51,687 14,80,080 (i) Ganaur 301.04 1,71,260 35,499 2,06,759 (ii) Sonipat 761.77 4,15,261 3,25,383 7,40,644 (iii) Gohana 802.14 3,06,412 65,757 3,72,169 (iv) Kharkhoda 299.16 1,35,460 25,048 1,60,508
9. District Rohtak 1,745.00 6,13,864 4,44,819 10,58,683 (i) Maham 510.76 1,82,545 20,483 2,03,028 (ii) Rohtak 1,138.06 3,29,009 4,03,960 7,32,969
(iii) Sampla * 1,02,310 20,376 1,22,686AREA AND POPULATION
Area and Population of Haryana : 2011(P)

30
No. 3.1 (Contd.) 1 2 3 4 5
10. District Jhajjar 1,834.00 7,13,933 2,42,974 9,56,907 (i) Jhajjar 1,030.78 2,08,859 49,759 2,58,618 (ii) Bahadurgarh 511.38 2,25,982 1,77,338 4,03,320 (iii) Beri 355.99 1,38,873 15,877 1,54,750 (iv) Matenhail * 1,40,219 -- 1,40,219
11. District Faridabad 74,304 3,69,861 14,29,093 17,98,954 (i) Faridabad 422.25 1,60,157 14,25,058 15,85,215 (ii) Ballabgarh 320.65 2,09,704 4,035 2,13,739
12. District Gurgaon 1,254.00 4,72,085 10,42,000 15,14,085 (i) Pataudi 177.39 78,638 41,342 1,19,980 (ii) Gurgaon 738.82 67,299 9,09,863 9,77,162 (iii) Sohna 336.86 1,11,674 53,839 1,65,513 (iv) Maneser * 93,148 23,455 1,16,603 (v) Farukhnagar * 1,21,326 13,501 1,34,827
13. District Rewari 1,594.00 6,64,718 2,31,411 8,96,129 (i) Bawal 265.45 1,13,304 16,809 1,30,113 (ii) Rewari 990.91 4,33,943 2,04,627 6,38,570 (iii) Kosli 270.18 1,17,471 9,975 1,27,446
14. District Mahendragarh 1,899.00 7,88,705 1,32,975 9,21,680 (i) Mahendragarh 978.80 3,61,925 42,119 4,04,044 (ii) Narnaul 952.61 4,26,780 90,856 5,17,636
15. District Bhiwani 4,778.00 13,06,531 3,22,578 16,29,109 (i) Bawani Khera 361.53 1,06,829 20,257 1,27,086 (ii) Bhiwani 998.56 3,51,866 1,97,662 5,49,528 (iii) Charkhi Dadri 1,370.59 3,28,411 56,022 3,84,433 (iv) Loharu 681.75 1,45,800 13,937 1,59,737 (v) Tosham 744.68 1,74,527 15,560 1,90,087 (vi) Siwani 496.71 81,036 19,140 1,00,176 (vii) Badhra * 1,18,062 -- 1,18,062
16. District Jind 2,702.00 10,28,119 3,03,923 13,32,042 (i) Narwana 1,155.14 4,05,236 78,613 4,83,849 (ii) Jind 791.67 3,09,340 1,66,225 4,75,565 (iii) Safidon 529.91 2,12,784 40,332 2,53,116 (iv) Julana 269.48 1,00,759 18,753 1,19,512
17. District Hisar 3,983.00 11,89,789 5,53,026 17,42,815 (i) Hisar 2,278.82 6,45,118 4,23,683 10,68,801 (ii) Hansi 919.64 2,99,808 86,769 3,86,577 (iii) Narnaund 409.98 1,23,529 17,075 1,40,604 (iv) Adampur 481.96 1,21,334 25,499 1,46,833
AREA AND POPULATION
Area and Population of Haryana : 2011(P) No. 3.1 (Concld.)
1 2 3 4 5

31
18. District Fatehabad 2,538.00 7,62,182 1,79,340 9,41,522 (i) Fatehabad 1,415.68 4,27,822 70,609 4,98,431 (ii) Ratia 510.77 1,42,378 37,154 1,79,532 (iii) Tohana 600.50 1,91,982 71,577 2,63,559
19. District Sirsa 4,277.00 9,74,624 3,20,490 12,95,114 (i) Dabwali 1,057.33 2,16,512 53,401 2,69,913 (ii) Sirsa 2,132.26 5,11,967 2,05,384 7,17,351 (iii) Rania 623.47 1,50,550 25,111 1,75,661 (iv) Ellenabad 436.88 95,595 36,594 1,32,189
20. District Mewat 1500.00 9,65,389 1,24,017 10,89,406 (i) Punhana 290.15 2,55,212 37,377 2,92,589 (ii) Nuh 463.07 2,65,091 22,001 2,87,092 (iii) Taoru 225.19 1,38,144 28,581 1,66,725 (iv) Ferozepur Jhirka 521.05 3,06,942 36,058 3,43,000
21. District Palwal 1,368.00 8,04,830 2,35,663 10,40,493 (i) Palwal 631.94 3,44,709 1,59,762 5,04,471 (ii) Hathin 359.34 2,54,453 14,334 2,68,787 (iii) Hodal 376.75 2,05,668 61,567 2,67,235 Total 44,212.00 1,65,31,493 88,21,588 2,53,53,081
Source : Director of Census Operations, Haryana.
Total area for the State and districts represents ‘Geographical Area’ figures (provisional) supplied by the Surveyor General of India. The area of the tahsils will not tally with the district figures because the former represent total reported area according to the Director of Land Records.
P-Provisional

32
AREA AND POPULATION Growth of Population in Haryana 1901-2011(P)
No. 3.2
Year Population Variation in
population Decennial Percentage
Increase Males Females Sex Ratio
1 2 3 4 5 6 7
1901 46,23,064 — — 24,76,390 21,46,674 867
1911 41,74,677 (–) 4,48,387 (–)9.70 22,74,909 18,99,768 835
1921 42,55,892 81,215 1.95 23,07,985 19,47,907 844
1931 45,59,917 3,04,025 7.14 24,73,228 20,86,689 844
1941 52,72,829 7,12,912 15.63 28,21,783 24,51,046 869
1951 56,73,597 4,00,768 7.60 30,31,612 26,41,985 871
1961 75,90,524 19,16,927 33.79 40,62,787 35,27,737 868
1971 1,00,36,431 24,45,907 32.22 53,77,044 46,59,387 867
1981 1,29,22,119 28,85,688 28.75 69,09,679 60,12,440 870
1991 1,64,63,648 35,41,529 27.41 88,27,474 76,36,174 865
2001 2,11,44,564 46,80,916 28.43 1,13,63,953 97,80,611 861
2011 2,53,53,081 42,08,517 19.90 1,35,05,130 1,18,47,951 877Source : Census of India, 2001, Administrative Atlas.
P-Provisional
33
AREA AND POPULATION Increase in Population since 2001 by Districts
No. 3.3
District Population 2011(P) Population 2001@ Variation in
population 2001-2011
Percentage increase 2001-2011
1 2 3 4 5 Ambala 11,36,784 10,14,411 1,22,373 12.06Panchkula 5,58,890 4,68,411 90,479 19.32Yamunanagar 12,14,162 10,41,630 1,72,532 16.56Kurukshetra 9,64,231 8,25,454 1,38,777 16.81Kaithal 10,72,861 9,46,131 1,26,730 13.39Karnal 15,06,323 12,74,183 2,32,140 18.22Panipat 12,02,811 9,67,449 2,35,362 24.33Sonipat 14,80,080 12,79,175 2,00,905 15.71Rohtak 10,58,683 9,40,128 1,18,555 12,61Jhajjar 9,56,907 8,80,072 76,835 8,73Faridabad 17,98,954 13,65,465 4,33,489 31.75Palwal 10,40,493 8,29,121 211,372 25.49Gurgaon 15,14,085 8,70,539 6,43,546 73.93Mewat 10,89,406 7,89,750 2,99,656 37.94Rewari 8,96,129 7,65,351 1,30,778 17.09Mahendragarh 9,21,680 8,12,521 1,09,159 13,43Bhiwani 16,29,109 14,25,022 2,04,087 14.32Jind 13,32,042 11,89,827 1,42,215 11.95Hisar 17,42,815 15,37,117 2,05,698 13.38Fatehabad 9,41,522 8,06,158 1,35,364 16.79Sirsa 12,95,114 11,16,649 1,78,465 15.98Total 2,53,53,081 2,11,44,564 42,08,517 19.90
Source : Director of Census Operations, Haryana.
@ Districtwise figures of 2001 are based on final Results as released by the Census department and are according to the boundaries of the districts as on 1-1-2000.
P--Provisional

34
AREA AND POPULATION Number of Villages and Towns in Haryana in 1991 and 2001 Census
No. 3.4 Number of Villages Number of Towns
1991 Census 2001 Census District
Inhabited Uninhabited Total Inhabited Uninhabited Total 1991 2001
1 2 3 4 5 6 7 8 9 Ambala 469 15 484 482 11 493 5 6Panchkula 242 12 254 224 12 236 4 4Yamunanagar 627 27 654 613 26 639 10 11Kurukshetra 389 7 396 407 9 416 4 4Kaithal 287 1 288 270 — 270 4 4Karnal 423 17 440 422 12 434 7 7Panipat 174 12 186 179 13 192 2 6Sonipat 338 15 353 323 13 336 4 4Rohtak 136 2 138 146 1 147 4 3Jhajjar 247 14 261 247 13 260 3 5Faridabad (P) 414 25 439 333 13 346 5 5Gurgaon (P) 688 42 730 271 10 281 11 8Mewat (P) — — — 503 28 531 — 5Rewari 402 15 417 397 13 410 3 4Mahendragarh 366 5 371 368 2 370 4 5Bhiwani 433 6 439 437 7 444 6 6Jind 301 4 305 306 1 307 5 5Hisar 266 5 271 272 3 275 5 5Fatehabad 238 1 239 243 — 243 4 4Sirsa 319 4 323 321 4 325 4 5Total 6,759 229 6,988 6,764 191 6,955 94 106
Source : Director of Census Operations, Haryana. P—Provisional

35
AREA AND POPULATION Area and Population by Districts : 2011(P)
No. 3.5 Population (2011)
District Area in Sq. Kilometres
(2001) Males Females Total
Persons per Square
Kilometre
Females per 1,000
Males 1 2 3 4 5 6 7
Ambala 1,574 6,04,044 5,32,740 11,36,784 722 882Panchkula 898 2,98,919 2,59,971 5,58,890 622 870Yamunanagar 1,768 6,46,801 5,67,361 12,14,162 687 877Kurukshetra 1,530 5,10,370 4,53,861 9,64,231 630 889Kaithal 2,317 5,70,595 5,02,266 10,72,861 463 880Karnal 2,520 7,98,840 7,07,483 15,06,323 598 886Panipat 1,268 6,46,324 5,56,487 12,02,811 949 861Sonipat 2,122 7,98,948 6,81,132 14,80,080 697 853Rohtak 1,745 5,66,708 4,91,975 10,58,683 607 868Jhajjar 1,834 5,14,303 4,42,604 9,56,907 522 861Faridabad 743 9,61,532 8,37,422 17,98,954 2,298 871Palwal 1,368 5,53,704 4,86,789 10,40,493 761 879Gurgaon 1,254 8,17,274 6,96,811 15,14,085 1,241 853Mewat 1,500 5,71,480 5,17,926 10,89,406 729 906Rewari 1,594 4,72,254 4,23,875 8,96,129 562 898Mahendragarh 1,899 4,86,553 4,35,127 9,21,680 485 894Bhiwani 4,778 8,64,616 7,64,493 16,29,109 341 884Jind 2,702 7,12,254 6,19,788 13,32,042 493 870Hisar 3,983 9,31,535 8,11,280 17,42,815 438 871Fatehabad 2,538 4,94,834 4,46,688 9,41,522 371 903Sirsa 4,277 6,83,242 6,11,872 12,95,114 303 896Total 2011 44,212 1,35,05,130 1,18,47,951 2,53,53,081 573 877 2001 44,212 1,13,63,953 97,80,611 2,11,44,564 478 861
Source : Director of Census Operations, Haryana. P—Provisional

36
AREA AND POPULATION Rural and Urban Population by Sex in Haryana : 2011(P)
No. 3.6 Population
Rural Urban District
Total Males Females Total Males Females
Rural Population as percentage to
Total Population
1 2 3 4 5 6 7 8 Ambala 6,32,243 3,34,564 2,97,679 5,04,541 2,69,480 2,35,061 55.62Panchkula 2,52,231 1,36,008 1,16,223 3,06,659 1,62,911 1,43,748 45.13Yamunanagar 7,41,370 3,94,010 3,47,360 4,72,792 2,52,791 2,20,001 61.06Kurukshetra 6,85,296 3,60,790 3,24,506 2,78,935 1,49,580 1,29,355 71.07Kaithal 8,37,171 4,45,614 3,91,557 2,35,690 1,24,981 1,10,709 78.03Karnal 10,50,293 5,57,305 4,92,988 4,56,030 2,41,535 2,14,495 69.73Panipat 6,49,866 3,49,674 3,00,192 5,52,945 2,96,650 2,56,295 54.03Sonipat 10,28,393 5,57,103 4,71,290 4,51,687 2,41,845 2,09,842 69.48Rohtak 6,13,864 3,30,788 2,83,076 4,44,819 2,35,920 2,08,899 57.98Jhajjar 7,13,933 3,83,887 3,30,046 2,42,974 1,30,416 1,12,558 74,61Faridabad 3,69,861 1,97,827 1,72,034 14,29,093 7,63,705 6,65,388 20.56Palwal 8,04,830 4,28,516 3,76,314 2,35,663 1,25,188 1,10,475 77.35Gurgaon 4,72,085 2,51,520 2,20,565 10,42,000 5,65,754 4,76,246 31.18Mewat (P) 9,65,389 5,06,297 4,59,092 1,24,017 65,183 58,834 88.62Rewari 6,64,718 3,48,631 3,16,087 2,31,411 1,23,623 1,07,788 74.18Mahendragarh 7,88,705 4,16,217 3,72,488 1,32,975 70,336 62,639 85.57Bhiwani 13,06,531 6,92,944 6,13,587 3,22,578 1,71,672 1,50,906 80.20Jind 10,28,119 5,50,513 4,77,606 3,03,923 1,61,741 1,42,182 77.18Hisar 11,89,789 6,34,149 5,55,640 5,53,026 2,97,386 2,55,640 68.27Fatehabad 7,62,182 4,00,587 3,61,595 1,79,340 94,247 85,093 80.96Sirsa 9,74,624 5,14,092 4,60,532 3,20,490 1,69,150 1,51,340 75.25Total 2011 1,65,31,493 87,91,036 77,40,457 88,21,588 47,14,094 41,07,494 65.21
2001 1,50,29,260 80,52,988 69,76,272 61,15,304 33,10,965 28,04,339 71.08Source : Director of Census Operations, Haryana
P—Provisional

37
AREA AND POPULATION Tahsil-wise Population, No. of Villages and Towns in Haryana : 2011(P)
No. 3.7 Urban Population
Districts/Tehsil Total Males Females
No. of Villages (2001)
No. of Towns (2001)
1 2 3 4 5 6 Ambala Naraingarh 30968 16406 14562 172 1Ambala 443927 237421 206506 229 5Barara 29646 15653 13993 92 —Total 504541 269480 235061 493 6Panchkula Kalka 73935 39518 34417 100 2Panchkula 232724 123393 109331 136 2Total 306659 162911 143748 236 4Yamunanagar Jagadhari 435708 233324 202384 488 10Chhachhrauli 10534 5536 4998 151 1Bilaspur 26550 13931 12619 * *Total 472792 252791 220001 639 11Kurukshetra Shahbad 42666 22960 19706 79 1Pehowa 52414 27633 24781 92 1Thanesar 183855 98987 84868 245 2Total 278935 149580 129355 416 4Kaithal Guhla 38945 20627 18318 100 1Kaithal 163272 86625 76647 170 3Fatehapur Pundri 33473 17729 15744 * *Total 235690 124981 110709 270 4Karnal Nilokheri 43916 23153 20763 76 2Indri 17492 9185 8307 108 1Karnal 329767 174876 154891 141 2Assandh 26984 14321 12663 48 1Gharaunda 37871 20000 17871 61 1Total 456030 241535 214495 434 7Panipat Panipat 513195 275229 237966 74 5Israna — — — 36 —Samalkha 39750 21421 18329 82 1Total 552945 296650 256295 192 6

38
AREA AND POPULATION Tahsil-wise Population, No. of Villages and Towns in Haryana : 2011(P)
No. 3.7 (Contd.) 1 2 3 4 5 6
Sonipat Gohana 65757 34897 30860 83 1Ganaur 35499 18957 16542 63 1Sonipat 325383 174621 150762 145 1Kharkhoda 25048 13370 11678 45 1Total 451687 241845 209842 336 4Rohtak Mahem 20483 10822 9661 31 1Rohtak 403960 214227 189733 116 2Sampla 20376 10871 9505 * *Total 444819 235920 208899 147 3Jhajjar Beri 15877 8515 7362 39 1Bahadurgarh 177338 95541 81797 64 3Jhajjar 49759 26360 23399 157 1Matenhail — — — * *Total 242974 130416 112558 260 5Gurgaon Pataudi 41342 21729 19613 60 2Gurgaon 909863 493003 416860 149 5Sohna 53839 29533 24306 72 1Mansar 23455 14397 9058 * *Farukh Nagar 13501 7092 6409 * *Total 1042000 565754 476246 281 8Mewat Taoru 28581 15193 13388 84 1Nuh 22001 11600 10401 119 1Frozpur Jhirka 36058 18833 17225 146 1Punhana 37377 19557 17820 96 1Total 124017 65183 58834 445 4Rewari Kosli 9975 5255 4720 54 —Rewari 204627 109519 95108 275 3Bawal 16809 8849 7960 81 1Total 231411 123623 107788 410 4Mahendragarh Mahendragarh 42119 22116 20003 149 2Narnaul 90856 48220 42636 221 3Total 132975 70336 62639 370 5Bhiwani Bawani Khera 20257 10790 9467 19 1
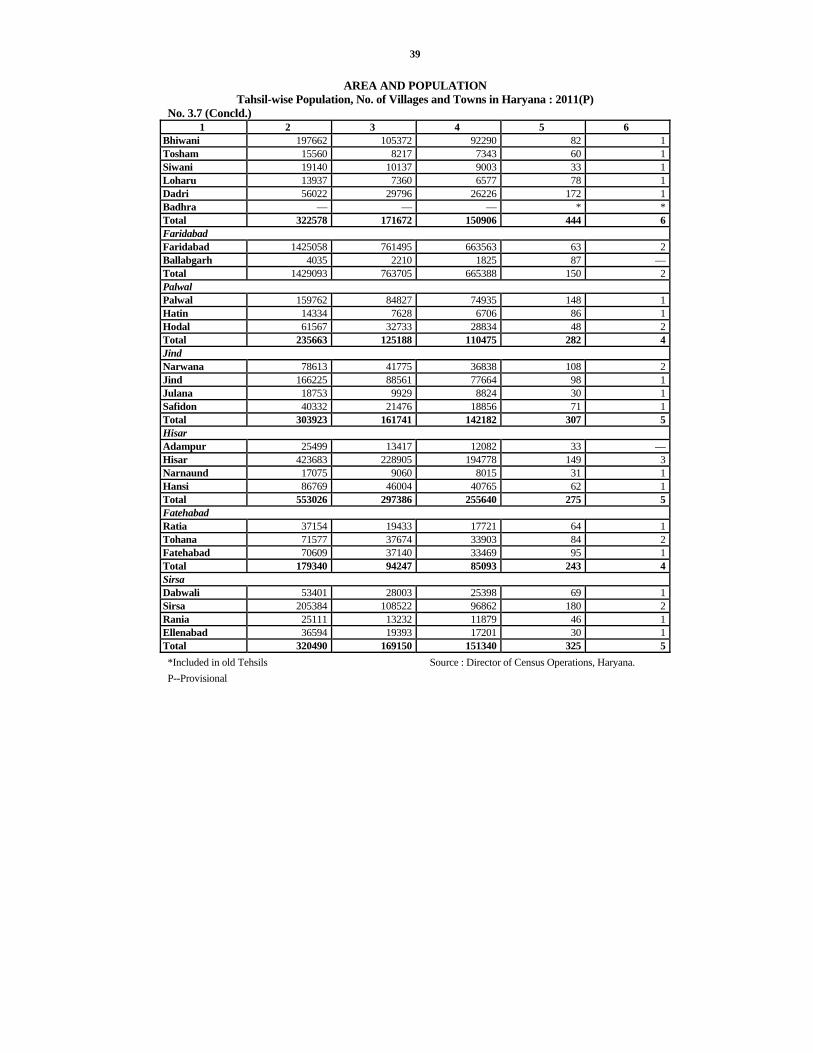
39
AREA AND POPULATION Tahsil-wise Population, No. of Villages and Towns in Haryana : 2011(P)
No. 3.7 (Concld.) 1 2 3 4 5 6
Bhiwani 197662 105372 92290 82 1Tosham 15560 8217 7343 60 1Siwani 19140 10137 9003 33 1Loharu 13937 7360 6577 78 1Dadri 56022 29796 26226 172 1Badhra — — — * *Total 322578 171672 150906 444 6Faridabad Faridabad 1425058 761495 663563 63 2Ballabgarh 4035 2210 1825 87 —Total 1429093 763705 665388 150 2Palwal Palwal 159762 84827 74935 148 1Hatin 14334 7628 6706 86 1Hodal 61567 32733 28834 48 2Total 235663 125188 110475 282 4Jind Narwana 78613 41775 36838 108 2Jind 166225 88561 77664 98 1Julana 18753 9929 8824 30 1Safidon 40332 21476 18856 71 1Total 303923 161741 142182 307 5Hisar Adampur 25499 13417 12082 33 —Hisar 423683 228905 194778 149 3Narnaund 17075 9060 8015 31 1Hansi 86769 46004 40765 62 1Total 553026 297386 255640 275 5Fatehabad Ratia 37154 19433 17721 64 1Tohana 71577 37674 33903 84 2Fatehabad 70609 37140 33469 95 1Total 179340 94247 85093 243 4Sirsa Dabwali 53401 28003 25398 69 1Sirsa 205384 108522 96862 180 2Rania 25111 13232 11879 46 1Ellenabad 36594 19393 17201 30 1Total 320490 169150 151340 325 5*Included in old Tehsils Source : Director of Census Operations, Haryana. P--Provisional

40
AREA AND POPULATION
Block-wise Population and No. of Villages in Haryana : 2001 No. 3.8
Rural Population No. of villages District/Block
Total Males Females Inhabited Un-inhabited Total 1 2 3 4 5 6 7
Ambala Shahzadpur 91022 48560 42462 77 3 80Naraingarh 97360 52155 45205 91 1 92Ambala 246033 131280 114753 176 6 182Barara 222968 117937 105031 138 1 139Total 657383 349932 307451 482 11 493Panchkula Pinjore 132799 75073 57726 115 6 121Barwala 64269 35585 28684 51 5 56Morni 19118 10162 8956 15 — 15Raipur Rani 43830 23822 20008 43 1 44Total 260016 144642 115374 224 12 236Yamunanagar Sadaura 46785 24989 21796 61 2 63Bilaspur 102274 54458 47816 124 3 127Mustafabad 90952 48314 42638 77 2 79Radaur 92602 49622 42980 80 5 85Jagadhari 141786 76877 64909 106 5 111Chhachhrauli 174209 93280 80929 165 9 174Total 648608 347540 301068 613 26 639Kurukshetra Shahbad 151801 81081 70720 107 1 108Pehowa 144576 76907 67669 79 4 83Thanesar 176555 94339 82216 110 3 113Babain 56789 30354 26435 49 — 49Ladwa 80222 43045 37177 62 1 63Total 609943 325726 284217 407 9 416Kaithal Guhla 154623 82372 72251 101 — 101Kaithal 219135 118715 100420 70 — 70Kalayat 103341 56069 47272 28 — 28Rajound 110631 60358 50273 25 — 25Pundri 174919 94114 80805 46 — 46Total 762649 411628 351021 270 — 270
AREA AND POPULATION

41
Block-wise Population and No. of Villages in Haryana : 2001 No. 3.8 (Contd.)
1 2 3 4 5 6 7 Karnal Nilokheri 148398 79523 68875 78 2 80Indri 129797 69314 60483 106 2 108Karnal 178679 96219 82460 79 5 84Nissing 150089 80572 69517 49 — 49Assandh 164055 87498 76557 48 — 48Gharaunda(p) 165323 88764 76559 62 3 65Total 936341 501890 434451 422 12 434Panipat Madlauda 114721 61492 53229 34 1 35Panipat 123876 68835 55041 38 1 39Israna 110561 59672 50889 31 1 32Samalkha 116650 63250 53400 31 3 34Bapoli 103514 56755 46759 44 5 49Gharaunda(p) 6047 3270 2777 1 2 3Total 575369 313274 262095 179 13 192Sonipat Madlauda 105906 57531 48375 29 2 31Kathura 69590 38067 31523 17 — 17Gohana 115874 61580 54294 34 1 35Ganaur 164068 89290 74778 69 3 72Sonipat 191539 104423 87116 70 2 72Rai 167151 92263 74888 60 4 64Kharkhoda 143672 78528 65144 44 1 45Total 957800 521682 436118 323 13 336Rohtak Lakhan Majra 59757 32553 27204 12 1 13Mahem 134102 73063 61039 25 — 25Kalanaur 85720 46078 39642 28 — 28Rohtak 214064 116814 97250 57 — 57Sampla 116881 63536 53345 24 — 24Total 610524 332044 278480 146 1 147Jhajjar Beri 109102 58474 50628 33 3 36Bahadurgarh 222291 121641 100650 59 4 63Jhajjar 178729 96774 81955 74 4 78
AREA AND POPULATION Block-wise Population and No. of Villages in Haryana : 2001
No. 3.8 (Contd.) 1 2 3 4 5 6 7
Sahlawas 66870 35155 31715 34 1 35
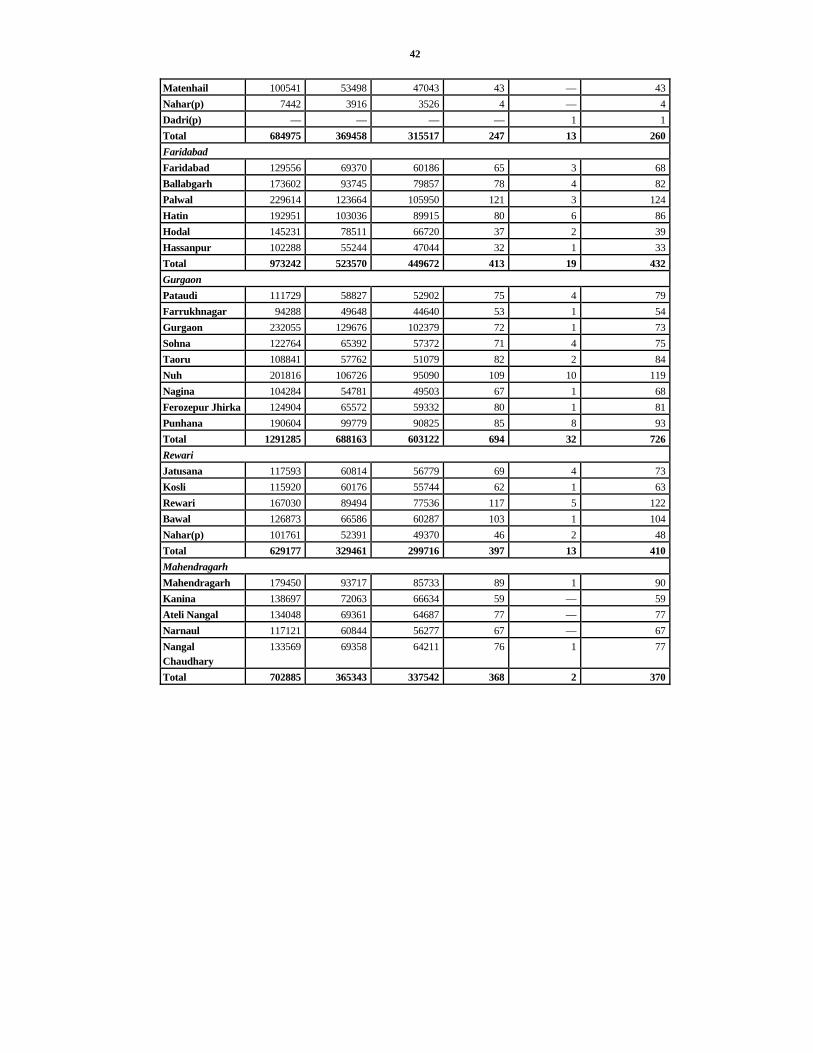
42
Matenhail 100541 53498 47043 43 — 43Nahar(p) 7442 3916 3526 4 — 4Dadri(p) — — — — 1 1Total 684975 369458 315517 247 13 260Faridabad Faridabad 129556 69370 60186 65 3 68Ballabgarh 173602 93745 79857 78 4 82Palwal 229614 123664 105950 121 3 124Hatin 192951 103036 89915 80 6 86Hodal 145231 78511 66720 37 2 39Hassanpur 102288 55244 47044 32 1 33Total 973242 523570 449672 413 19 432Gurgaon Pataudi 111729 58827 52902 75 4 79Farrukhnagar 94288 49648 44640 53 1 54Gurgaon 232055 129676 102379 72 1 73Sohna 122764 65392 57372 71 4 75Taoru 108841 57762 51079 82 2 84Nuh 201816 106726 95090 109 10 119Nagina 104284 54781 49503 67 1 68Ferozepur Jhirka 124904 65572 59332 80 1 81Punhana 190604 99779 90825 85 8 93Total 1291285 688163 603122 694 32 726Rewari Jatusana 117593 60814 56779 69 4 73Kosli 115920 60176 55744 62 1 63Rewari 167030 89494 77536 117 5 122Bawal 126873 66586 60287 103 1 104Nahar(p) 101761 52391 49370 46 2 48Total 629177 329461 299716 397 13 410Mahendragarh Mahendragarh 179450 93717 85733 89 1 90Kanina 138697 72063 66634 59 — 59Ateli Nangal 134048 69361 64687 77 — 77Narnaul 117121 60844 56277 67 — 67Nangal Chaudhary
133569 69358 64211 76 1 77
Total 702885 365343 337542 368 2 370

43
AREA AND POPULATION Block-wise Population and No. of Villages in Haryana : 2001
No. 3.8 (Contd.) 1 2 3 4 5 6 7
Bhiwani Bawani Khera 141875 75668 66207 27 — 27Bhiwani 227843 122072 105771 54 2 56Kairu 68079 36141 31938 31 1 32Tosham 108496 57683 50813 42 1 43Siwani 76046 40167 35879 36 — 36Loharu 126511 66497 60014 78 — 78Badhra 125436 66290 59146 65 1 66Dadri-II 133395 70249 63146 55 — 55Dadri-I 146948 78022 68926 49 2 51Total 1154629 612789 541840 437 7 444Jind Narwana 203948 109100 94848 61 — 61Uchana 165474 89627 75847 47 — 47Alewa 83293 45267 38026 21 1 22Jind 176373 95534 80839 67 — 67Julana 120248 65006 55242 39 — 39Pillu Khera 81508 44173 37335 25 — 25Safidon 117406 63498 53908 46 — 46Total 948250 512205 436045 306 1 307Hisar Adampur 99340 53151 46189 20 — 20Agroha 89679 47836 41843 23 — 23Hisar-II 151410 80924 70486 40 — 40Hisar-I 190221 105298 84923 45 — 45Barwala 138924 74215 64709 38 — 38Narnaund 111605 60262 51343 28 3 31Hansi-I 181246 97540 83706 40 — 40Hansi-II 85114 46052 39062 22 — 22Bhattu Kalan(p) 9288 4940 4348 4 — 4Uklana(p) 82172 44387 37785 12 — 12Total 1138999 614605 524394 272 3 275Fatehabad Ratia 129996 68351 61645 64 — 64Tohana 142674 75520 67154 75 — 75Bhuna 111230 59303 51927 27 — 27
AREA AND POPULATION Block-wise Population and No. of Villages in Haryana : 2001

44
No. 3.8 (Concld.) 1 2 3 4 5 6 7
Fatehabad 172549 91616 80933 48 — 48Bhattu Kalan(p) 90387 48211 42176 23 — 23Uklana (p) 17165 9215 7950 6 — 6Total 664001 352216 311785 243 — 243Sirsa Dabwali 137637 72841 64796 49 — 49Odhan 86386 45807 40579 38 — 38Baragudha 100329 53374 46955 47 — 47Sirsa 137603 73135 64468 50 3 53N.sari Chopta 138810 73890 64920 56 — 56Rania 114931 60854 54077 47 1 48Ellenabad 107488 56919 50569 34 — 34Total 823184 436820 386364 321 4 325
Source : Director of Census Operations, Haryana.

45
NUMBER OF HOUSE HOLDS AND PERSONS PER HOUSEHOLD IN HARYANA

46
AREA AND POPULATION Number of households and persons per household in Haryana: 2001
No. 3.9 No. of Households Persons per Household
District Rural Urban Total Rural Urban Total
1 2 3 4 5 6 7 Ambala 1,14,125 70,194 1,84,319 6 5 6Panchkula 46,179 46,414 92,593 6 4 5Yamunanagar 1,07,918 75,320 1,83,238 6 5 6Kurukshetra 1,02,663 40,287 1,42,950 6 5 6Kaithal 1,30,775 33,483 1,64,258 6 5 6Karnal 1,60,252 63,978 2,24,230 6 5 6Panipat 98,489 75,899 1,74,388 6 5 6Sonipat 1,64,586 58,756 2,23,342 6 5 6Rohtak 1,06,632 60,961 1,67,593 6 5 6Jhajjar 1,20,807 37,268 1,58,075 6 5 6Faridabad (P) 1,18,784 2,43,489 3,62,273 7 5 5Gurgaon (P) 99,560 60,652 1,60,212 6 5 5Mewat (P) 1,31,579 11,243 1,42,822 7 6 7Rewari 1,10,852 24,708 1,35,560 6 6 6Mahendragarh 1,16,570 18,648 1,35,218 6 6 6Bhiwani 1,97,505 49,237 2,46,742 6 5 6Jind 1,61,289 43,653 2,04,942 6 6 6Hisar 1,96,821 75,917 2,72,738 6 5 6Fatehabad 1,15,860 26,157 1,42,017 6 5 6Sirsa 1,40,734 54,075 1,94,809 6 5 6Total 25,41,980 11,70,339 37,12,319 6 5 6P—Provisional Source : Director of Census Operations, Haryana.
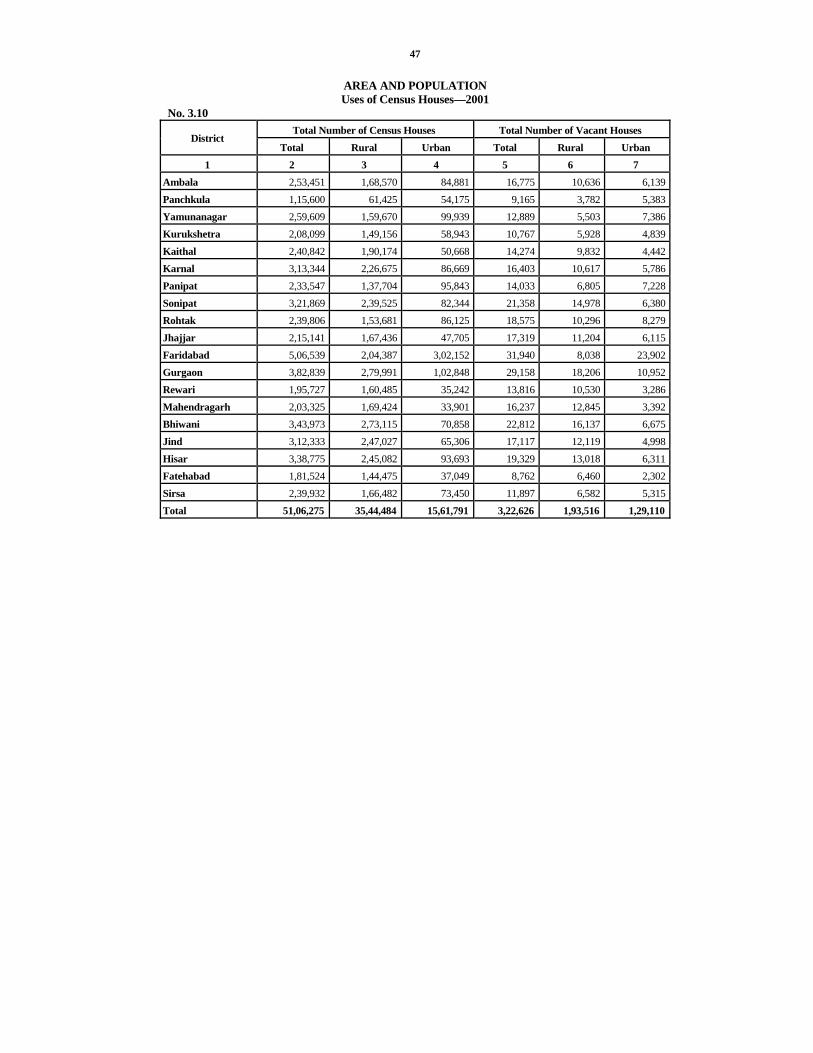
47
AREA AND POPULATION Uses of Census Houses—2001
No. 3.10 Total Number of Census Houses Total Number of Vacant Houses
District Total Rural Urban Total Rural Urban
1 2 3 4 5 6 7 Ambala 2,53,451 1,68,570 84,881 16,775 10,636 6,139Panchkula 1,15,600 61,425 54,175 9,165 3,782 5,383Yamunanagar 2,59,609 1,59,670 99,939 12,889 5,503 7,386Kurukshetra 2,08,099 1,49,156 58,943 10,767 5,928 4,839Kaithal 2,40,842 1,90,174 50,668 14,274 9,832 4,442Karnal 3,13,344 2,26,675 86,669 16,403 10,617 5,786Panipat 2,33,547 1,37,704 95,843 14,033 6,805 7,228Sonipat 3,21,869 2,39,525 82,344 21,358 14,978 6,380Rohtak 2,39,806 1,53,681 86,125 18,575 10,296 8,279Jhajjar 2,15,141 1,67,436 47,705 17,319 11,204 6,115Faridabad 5,06,539 2,04,387 3,02,152 31,940 8,038 23,902Gurgaon 3,82,839 2,79,991 1,02,848 29,158 18,206 10,952Rewari 1,95,727 1,60,485 35,242 13,816 10,530 3,286Mahendragarh 2,03,325 1,69,424 33,901 16,237 12,845 3,392Bhiwani 3,43,973 2,73,115 70,858 22,812 16,137 6,675Jind 3,12,333 2,47,027 65,306 17,117 12,119 4,998Hisar 3,38,775 2,45,082 93,693 19,329 13,018 6,311Fatehabad 1,81,524 1,44,475 37,049 8,762 6,460 2,302Sirsa 2,39,932 1,66,482 73,450 11,897 6,582 5,315Total 51,06,275 35,44,484 15,61,791 3,22,626 1,93,516 1,29,110

48
AREA AND POPULATION Uses of Census Houses—2001
No. 3.10 (Contd.) Occupied Census Houses used as
Total Number of Occupied Census Houses Residence District
Total Rural Urban Total Rural Urban 1 8 9 10 11 12 13
Ambala 2,36,676 1,57,934 78,742 1,57,770 1,00,890 56,880Panchkula 1,06,435 57,643 48,792 78,710 36,963 41,747Yamunanagar 2,46,720 1,54,167 92,553 1,60,620 95,914 64,706Kurukshetra 1,97,332 1,43,228 54,104 1,22,659 87,378 35,281Kaithal 2,26,568 1,80,342 46,226 1,33,741 1,04,025 29,716Karnal 2,96,941 2,16,058 80,883 1,99,167 1,43,988 55,179Panipat 2,19,514 1,30,899 88,615 1,45,236 84,163 61,073Sonipat 3,00,511 2,24,547 75,964 1,87,013 1,33,924 53,089Rohtak 2,21,231 1,43,385 77,846 1,42,451 88,459 53,992Jhajjar 1,97,822 1,56,232 41,590 1,35,040 1,05,235 29,805Faridabad 4,74,599 1,96,349 2,78,250 3,47,513 1,32,842 2,14,671Gurgaon 3,53,681 2,61,785 91,896 2,49,202 1,85,018 64,184Rewari 1,81,911 1,49,955 31,956 1,21,680 1,00,786 20,894Mahendragarh 1,87,088 1,56,579 30,509 1,12,587 95,634 16,953Bhiwani 3,21,161 2,56,978 64,183 2,14,660 1,71,248 43,412Jind 2,95,216 2,34,908 60,308 1,57,583 1,18,411 39,172Hisar 3,19,446 2,32,064 87,382 2,14,252 1,50,672 63,580Fatehabad 1,72,762 1,38,015 34,747 1,18,996 96,943 22,053Sirsa 2,28,035 1,59,900 68,135 1,62,953 1,16,875 46,078Total 47,83,649 33,50,968 14,32,681 31,61,833 21,49,368 10,12,465

49
AREA AND POPULATION Uses of Census Houses—2001
No. 3.10 (Contd.) Occupied Census Houses used as
Residence-cum other use Shop and Office School, College etc District
Total Rural Total Rural Urban Urban Rural Urban Urban 1 14 15 16 17 18 19 20 21 22
Ambala 11,846 8,516 3,330 24,405 11,108 13,297 1,195 937 258Panchkula 4,566 3,350 1,216 7,436 3,929 3,507 523 407 116Yamunanagar 12,081 8,465 3,616 24,881 8,382 16,499 1,146 828 318Kurukshetra 12,620 11,073 1,547 21,110 7,950 13,160 1,119 913 206KaithaL 27,228 25,465 1,763 19,248 9,697 9,551 894 707 187Karnal 12,712 10,466 2,246 29,997 13,762 16,235 1,253 974 279Panipat 13,234 8,815 4,419 20,930 6,363 14,567 706 454 252Sonipat 26,152 23,430 2,722 19,840 6,839 13,001 1,193 875 318Rohtak 16,749 14,787 1,962 20,238 4,848 15,390 801 536 265Jhajjar 7,493 5,818 1,675 10,082 4,583 5,499 805 654 151Faridabad 15,861 6,658 9,203 34,994 7,787 27,207 1,724 836 888Gurgaon 12,175 9,310 2,865 29,551 12,531 17,020 1,652 1,287 365Rewari 8,032 7,066 966 12,250 5,504 6,746 884 752 132Mahendragarh 18,504 17,590 914 13,441 4,908 8,533 1,026 871 155Bhiwani 21,683 19,320 2,363 19,350 8,340 11,010 1,442 1,181 261Jind 43,532 41,060 2,472 21,143 8,343 12,800 1,133 859 274Hisar 38,213 33,984 4,229 20,379 7,251 13,128 1,361 1,039 322Fatehabad 15,043 13,899 1,144 14,617 6,303 8,314 797 643 154Sirsa 19,946 16,691 3,255 18,076 5,708 12,368 1,096 833 263Total 3,37,670 2,85,763 51,907 3,81,968 1,44,136 2,37,832 20,750 15,586 5,164

50
AREA AND POPULATION Uses of Census Houses—2001
No. 3.10 (Contd.) Occupied Census Houses used as
Hotel, Lodge, Guest
Hospital, Dispensary etc
Factory, Workshop Workshed etc.
District
Total Rural Urban Total Rural Urban Total Rural Urban 1 23 24 25 26 27 28 29 30 31
Ambala 326 203 123 666 496 170 2,034 1,065 969Panchkula 163 89 74 268 169 99 947 486 461Yamunanagar 315 161 154 740 413 327 2,675 1,012 1,663Kurukshetra 305 160 145 673 457 216 1,921 1,146 775KaithaL 232 162 70 600 431 169 1,642 988 654Karnal 377 254 123 870 561 309 2,353 1,035 1,318Panipat 284 123 161 861 449 412 4,073 789 3,284Sonipat 329 212 117 725 480 245 1,971 1,158 813Rohtak 277 149 128 463 251 212 1,480 459 1,021Jhajjar 317 249 68 592 475 117 1,281 464 817Faridabad 768 287 481 1,005 424 581 8,229 763 7,466Gurgaon 694 459 235 846 539 307 3,631 1,707 1,924Rewari 310 221 89 581 457 124 1,182 806 376Mahendragarh 530 423 107 595 429 166 1,093 577 516Bhiwani 734 489 245 996 694 302 2,025 982 1,043Jind 466 278 188 793 602 191 1,446 729 717Hisar 448 265 183 734 478 256 1,632 700 932Fatehabad 235 153 82 562 395 167 1,360 678 682Sirsa 274 138 136 911 533 378 1,941 713 1,228Total 7,384 4,475 2,909 13,481 8,733 4,748 42,916 16,257 26,659
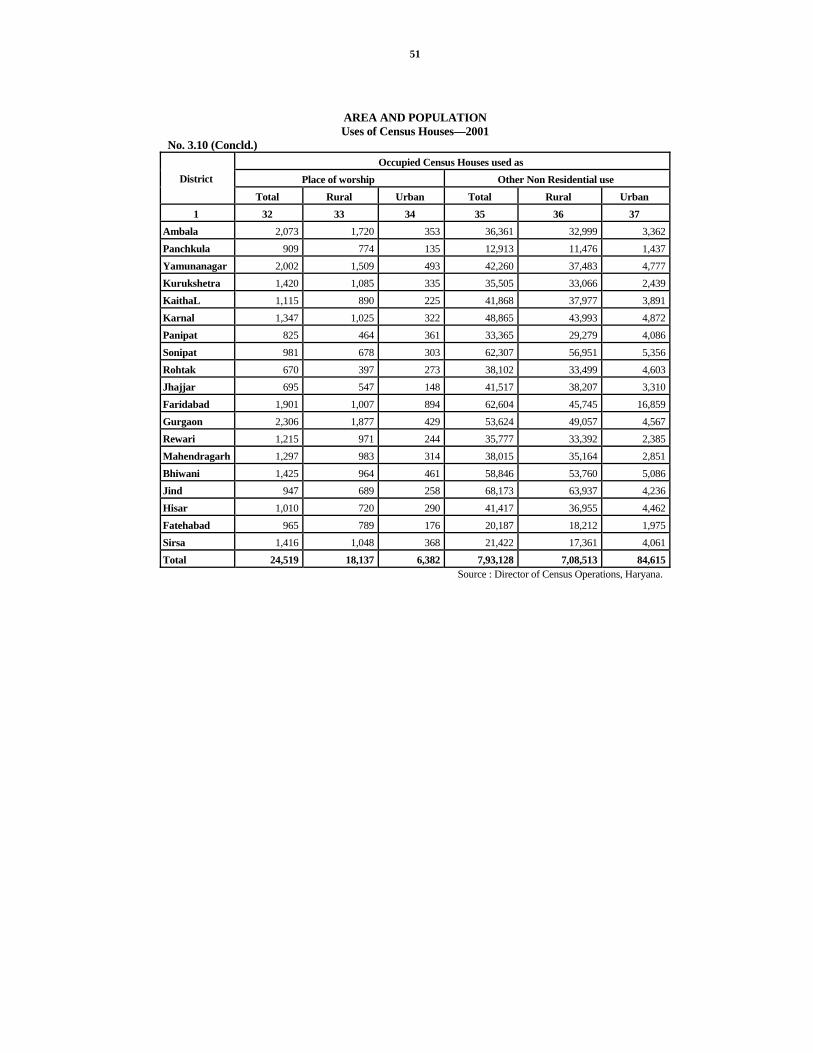
51
AREA AND POPULATION Uses of Census Houses—2001
No. 3.10 (Concld.) Occupied Census Houses used as
Place of worship Other Non Residential use District
Total Rural Urban Total Rural Urban 1 32 33 34 35 36 37
Ambala 2,073 1,720 353 36,361 32,999 3,362Panchkula 909 774 135 12,913 11,476 1,437Yamunanagar 2,002 1,509 493 42,260 37,483 4,777Kurukshetra 1,420 1,085 335 35,505 33,066 2,439KaithaL 1,115 890 225 41,868 37,977 3,891Karnal 1,347 1,025 322 48,865 43,993 4,872Panipat 825 464 361 33,365 29,279 4,086Sonipat 981 678 303 62,307 56,951 5,356Rohtak 670 397 273 38,102 33,499 4,603Jhajjar 695 547 148 41,517 38,207 3,310Faridabad 1,901 1,007 894 62,604 45,745 16,859Gurgaon 2,306 1,877 429 53,624 49,057 4,567Rewari 1,215 971 244 35,777 33,392 2,385Mahendragarh 1,297 983 314 38,015 35,164 2,851Bhiwani 1,425 964 461 58,846 53,760 5,086Jind 947 689 258 68,173 63,937 4,236Hisar 1,010 720 290 41,417 36,955 4,462Fatehabad 965 789 176 20,187 18,212 1,975Sirsa 1,416 1,048 368 21,422 17,361 4,061Total 24,519 18,137 6,382 7,93,128 7,08,513 84,615
Source : Director of Census Operations, Haryana.

52
AREA AND POPULATION Villages Classified by Various Population Ranges : 2001
No. 3.11 Less than 200 200—499
District Total number of
Inhabited Villages Total Rural Population No. Population No. Population
1 2 3 4 5 6 7 Ambala 482 6,57,383 26 2,917 73 27,104Panchkula 224 2,60,016 25 2,935 56 20,298Yamunanagar 613 6,48,608 50 5,109 119 45,055Kurukshetra 407 6,09,943 17 1,634 40 14,345Kaithal 270 7,62,649 9 667 18 6,096Karnal 422 9,36,341 30 2,499 24 8,388Panipat 179 5,75,369 0 0 8 2,904Sonipat 323 9,57,800 7 691 9 3,331Rohtak 146 6,10,524 3 35 5 1,890Jhajjar 247 6,84,975 4 215 9 2,849Faridabad (P) 333 7,80,291 17 1,482 23 8,514Gurgaon (P) 271 5,60,836 14 1,413 18 6,161Mewat (P) 503 9,23,400 25 2,413 62 22,340Rewari 397 6,29,177 14 1,507 34 12,874Mahendragarh 368 7,02,885 4 317 22 8,404Bhiwani 437 11,54,629 4 295 20 7,355Jind 306 9,48,250 3 271 5 1,817Hisar 272 11,38,999 4 213 2 865Fatehabad 243 6,64,001 3 27 22 7,311Sirsa 321 8,23,184 11 1,028 13 3,772Total 6,764 1,50,29,260 270 25,668 582 2,11,673

53
AREA AND POPULATION
Villages Classified by Various Population Ranges : 2001 No. 3.11 (Contd.)
500—999 1,000—1,999 2,000—4,999 District
No. Population No. Population No. Population 1 8 9 10 11 12 13
Ambala 155 1,12,591 145 2,00,861 71 2,17,537Panchkula 54 40,265 54 71,315 29 82,191Yamunanagar 203 1,49,542 166 2,31,231 70 1,86,294Kurukshetra 117 93,546 156 2,23,605 63 1,86,947Kaithal 42 32,554 74 1,06,983 86 2,78,311Karnal 84 64,048 124 1,80,347 121 3,79,718Panipat 17 12,730 42 64,325 76 2,43,035Sonipat 20 14,546 88 1,33,453 156 5,08,500Rohtak 4 3,415 20 30,661 65 2,16,893Jhajjar 17 14,265 80 1,14,396 110 3,50,420Faridabad (P) 52 38,397 111 1,64,272 95 2,84,626Gurgaon (P) 59 44,432 91 1,31,988 71 2,13,468Mewat (P) 105 81,160 168 2,36,625 110 3,25,996Rewari 88 67,609 164 2,34,353 89 2,60,828Mahendragarh 48 39,674 173 2,60,502 112 3,36,127Bhiwani 49 37,596 153 2,33,599 159 4,68,213Jind 20 15,589 82 1,23,428 153 4,89,081Hisar 13 9,229 37 57,331 141 4,66,287Fatehabad 34 26,714 62 90,394 95 3,04,514Sirsa 24 18,442 101 1,51,673 143 4,42,230Total 1,205 9,16,344 2,091 30,41,342 2,015 62,41,216
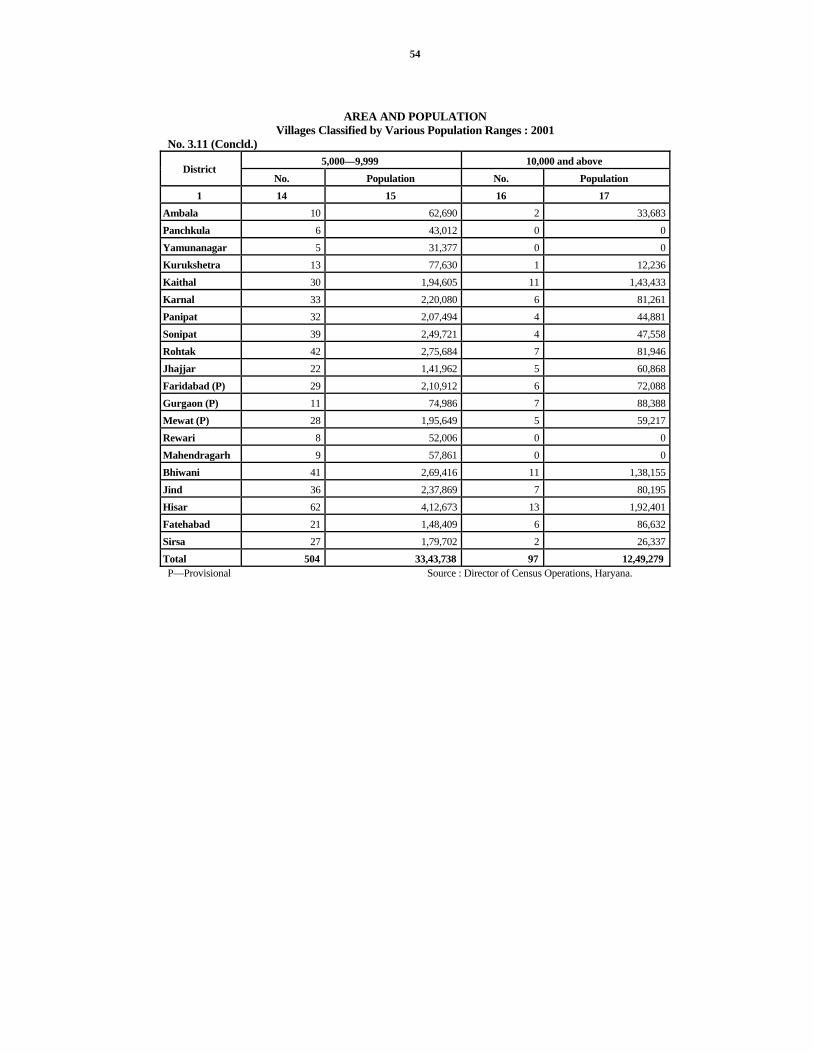
54
AREA AND POPULATION Villages Classified by Various Population Ranges : 2001
No. 3.11 (Concld.) 5,000—9,999 10,000 and above
District No. Population No. Population
1 14 15 16 17 Ambala 10 62,690 2 33,683Panchkula 6 43,012 0 0Yamunanagar 5 31,377 0 0Kurukshetra 13 77,630 1 12,236Kaithal 30 1,94,605 11 1,43,433Karnal 33 2,20,080 6 81,261Panipat 32 2,07,494 4 44,881Sonipat 39 2,49,721 4 47,558Rohtak 42 2,75,684 7 81,946Jhajjar 22 1,41,962 5 60,868Faridabad (P) 29 2,10,912 6 72,088Gurgaon (P) 11 74,986 7 88,388Mewat (P) 28 1,95,649 5 59,217Rewari 8 52,006 0 0Mahendragarh 9 57,861 0 0Bhiwani 41 2,69,416 11 1,38,155Jind 36 2,37,869 7 80,195Hisar 62 4,12,673 13 1,92,401Fatehabad 21 1,48,409 6 86,632Sirsa 27 1,79,702 2 26,337Total 504 33,43,738 97 12,49,279 P—Provisional Source : Director of Census Operations, Haryana.
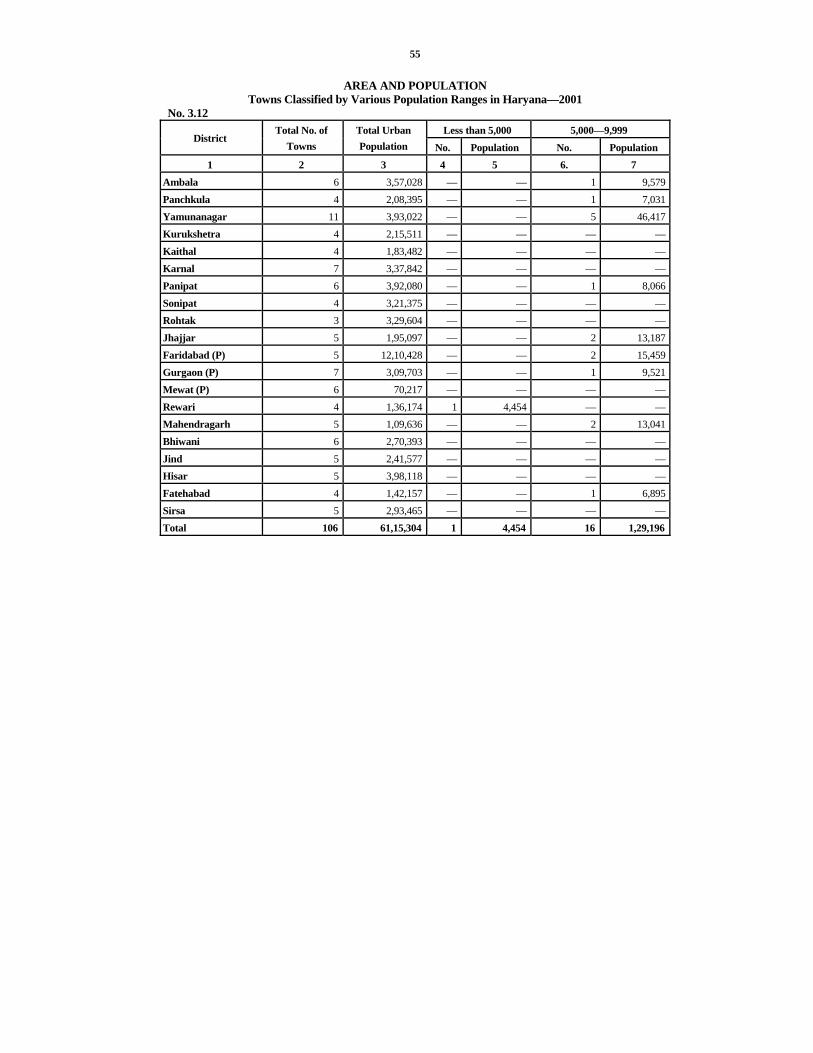
55
AREA AND POPULATION Towns Classified by Various Population Ranges in Haryana—2001
No. 3.12 Less than 5,000 5,000—9,999
District Total No. of
Towns Total Urban Population No. Population No. Population
1 2 3 4 5 6. 7 Ambala 6 3,57,028 — — 1 9,579Panchkula 4 2,08,395 — — 1 7,031Yamunanagar 11 3,93,022 — — 5 46,417Kurukshetra 4 2,15,511 — — — —Kaithal 4 1,83,482 — — — —Karnal 7 3,37,842 — — — —Panipat 6 3,92,080 — — 1 8,066Sonipat 4 3,21,375 — — — —Rohtak 3 3,29,604 — — — —Jhajjar 5 1,95,097 — — 2 13,187Faridabad (P) 5 12,10,428 — — 2 15,459Gurgaon (P) 7 3,09,703 — — 1 9,521Mewat (P) 6 70,217 — — — —Rewari 4 1,36,174 1 4,454 — —Mahendragarh 5 1,09,636 — — 2 13,041Bhiwani 6 2,70,393 — — — —Jind 5 2,41,577 — — — —Hisar 5 3,98,118 — — — —Fatehabad 4 1,42,157 — — 1 6,895Sirsa 5 2,93,465 — — — —Total 106 61,15,304 1 4,454 16 1,29,196

56
AREA AND POPULATION
Towns Classified by Various Population Ranges in Haryana—2001 No. 3.12 (Concld.)
10,000—19,999 20,000—49,999 50,000—99,999 1,00,000 and above District
No. Population No. Population No. Population No. Population 1 8 9 10 11 12 13 14 15
Ambala 1 18,210 1 21,644 1 61,748 2 2,45,847Panchkula — — 2 60,439 — — 1 1,40,925Yamunanagar 4 55,619 — — — — 2 2,90,986Kurukshetra — — 3 93,192 — — 1 1,22,319Kaithal 2 34,069 1 32,128 — — 1 1,17,285Karnal 3 41,526 3 75,080 — — 1 2,21,236Panipat 1 18,815 3 96,300 — — 1 2,68,899Sonipat 1 18,763 2 77,538 — — 1 2,25,074Rohtak 2 35,027 — — — — 1 2,94,577Jhajjar 1 16,162 1 39,002 — — 1 1,26,746Faridabad (P) — — 1 38,309 — — 2 11,56,660Gurgaon (P) 4 71,290 1 27,570 — — 1 2,01,322Mewat (P) 6 70,217 — — — — — —Rewari 2 31,036 — — — — 1 1,00,684Mahendragarh 1 10,195 1 24,323 1 62,077 — —Bhiwani 4 55,967 1 44,895 — — 1 1,69,531Jind 2 27,746 1 27,541 1 50,435 1 1,35,855Hisar 2 26,053 1 33,132 1 75,747 1 2,63,186Fatehabad — — 1 23,826 2 1,11,436 — —Sirsa — — 3 78,919 1 53,811 1 1,60,735Total 36 5,30,695 26 7,93,838 7 4,15,254 20 42,41,867P—Provisional Source : Director of Census Operations, Haryana.

57
AREA AND POPULATION Area, Population and Density in the Towns of Haryana : 2001
No. 3.13 Particulars Area in Sq. Kilometres Population Persons Per Sq. Kilometre
1 2 3 4 A—Towns Faridabad 198.75 10,55,938 5,313 M. Corp. Panipat* 43.81 3,54,148 8,084 Yamunanagar** 44.00 3,06,740 6,971 Rohtak 28.38 2,94.577 10,380 Hisar @ 49.43 2,63,186 5,793 Gurgaon @@ 28.91 2,28,820 7,915 Sonipat 37.69 2,25,074 5,972 Karnal 22.10 2,21,236 10,011 Bhiwani 27.64 1,69,531 6,134 Ambala † 39.69 1,68,316 4,241 Sirsa 26.43 1,60,735 6,082 Panchkula Urban Estate
25.50 1,40,925 5,526
Ambala City 16.94 1,39,279 8,222 Jind 15.30 1,35,855 8,879 Bahadurgarh †† 21.84 1,31,925 6,041 Thanesar 32.63 1,22,319 3,749 Kaithal 43.75 1,17,285 2,681 Rewari 11.78 1,00,684 8,547 Palwal 8.30 1,00,722 12,135 B—Towns Hansi 10.05 75,747 7,537 Narnaul 9.67 62,077 6,419 Fatehabad 10.36 59,917 5,783 Mandi Dabwali 22.33 53,811 2,410 Tohana 13.76 51,519 3,744 Narwana 6.00 50,435 8,406 C—Towns 71—Others 788.45 13,24,503 1,680 A—Cities having population one lakh or more. Source : Director of Census Operations, Haryana.
B—Towns having population 50,000 to 99,999. C—Town having population less than 50,000 ** Includes Jagadhri (M.C.I.) and Sasauli Census Town. @@ Includes Census Town Sukhrali and Gurgaon
(Rural). † Includes Ambala Cantt. (C.B.) †† Includes Sankhol Census Town. * Includes Panipat Taraf Ansar, Panipat Taraf Makhdum Zadgan and Panipat Taraf Rajputan Census Town. @ Includes Chaudry charan singh Haryana Agriculture University and Mini Secretariat ‘Outp Growh’.

58
AREA AND POPULATION Trend in Population of Towns
No. 3.14 Population Class and Name of the City
or Town District
2001 1991 1981 1971 1951 1901 1 2 3 4 5 6 7 8
Class—I Faridabad M. Corp. Faridabad 10,55,938 6,17,717 3,30,864 1,22,817 37,393 9,816Panipat* Panipat 3,54,148 1,91,212 1,37,927 87,981 54,981 26,914Yamunanagar** Yamunanagar 3,06,740 2,19,754 1,60,424 1,15,020 39,627 13,462Rohtak Rohtak 2,94,577 2,16,096 1,66,767 1,24,755 71,902 20,323Hisar@ Hisar 2,63,186 1,81,255 1,37,369 89,437 35,297 17,647Gurgaon@@ Gurgaon 2,28,820 1,35,884 1,00,877 57,151 18,613 4,765Sonipat Sonipat 2,25,074 1,43,922 1,09,369 62,393 30,189 12,990Karnal Karnal 2,21,236 1,76,131 1,32,107 92,784 59,790 23,559Bhiwani Bhiwani 1,69,531 1,21,629 1,01,277 73,086 52,183 35,917Ambala ‡ Ambala 1,68,316 1,39,889 1,21,203 1,02,493 94,043 . .Sirsa Sirsa 1,60,735 1,12,841 89,068 48,808 24,980 15,800Panchkula Urban Estate Panchkula 1,40,925 70,375 11,239 . . . . . .Ambala City Ambala 1,39,279 1,19,338 1,04,565 83,633 57,979 . .Jind Jind 1,35,855 85,315 56,748 38,161 19,449 8,047Bahadurgarh ‡‡ Jhajjar 1,31,925 57,235 37,488 25,812 11,170 5,974Thanesar Kurukshetra 1,22,319 81,255 49,052 29,555 11,273 5,066Kaithal Kaithal 1,17,285 71,142 58,385 45,199 28,422 14,408Palwal Faridabad 1,00,722 59,168 47,328 36,207 13,915 12,830Rewari Rewari 1,00,684 75,342 51,562 43,885 34,082 27,295Class—II Hansi Hisar 75,747 59,653 50,365 41,108 25,837 16,523Narnaul Mahendragarh 62,077 51,976 41,441 31,875 18,180 19,489Fatehabad Fatehabad 59,917 45,500 33,049 22,630 2,968 2,786Mandi Dabwali Sirsa 53,811 36,197 29,071 20,921 10,380 . .Tohana Fatehabad 51,519 34,215 25,487 16,789 7,955 . .Narwana Jind 50,435 38,533 29,242 21,319 10,368 . .Class—III Gohana Sonipat 48,532 32,496 26,188 16,754 8,796 6,567Charkhi Dadri Bhiwani 44,895 32,253 27,315 19,484 8,795 7,009Jhajjar Jhajjar 39,002 27,693 24,247 18,947 10,514 12,227Hodel Faridabad 38,309 25,635 18,740 14,144 8,303 8,142

59
AREA AND POPULATION Trend in Population of Towns
No. 3.14 (Contd.) Population Class and Name of the
City or Town District
2001 1991 1981 1971 1951 1901 1 2 3 4 5 6 7 8
Shahbad Kurukshetra 37,289 31,452 26,308 21,500 17,301 11,009Pehowa Kurukshetra 33,564 21,986 17,279 11,366 . . . .Barwala Hisar 33,132 24,891 17,648 . . . . . .Ellanabad Sirsa 32,795 22,312 . . . . . . 1,624Cheeka Kaithal 32,128 21,089 . . . . . . . .Kalka Panchkula 30,830 27,281 21,359 17,711 14,058 7,045Gharaunda Karnal 30,172 21,147 17,332 13,045 8632 . .Samalkha Panipat 29,866 18,384 13,532 . . . . . .Pinjore Panchkula 29,609 . . . . . . . . . .Ganaur Sonipat 29,006 20,952 16,489 8,399 . . . .Sohna Gurgaon 27,570 16,348 12,667 8,775 5,138 6,024Safidon Jind 27,541 20,056 15,116 12,010 9,426 4,832Kalanwali Sirsa 25,163 19,850 9,643 6,531 2,622 . .Mahendragarh Mahendragarh 24,323 19,610 14,488 11,496 7,961 9,984Ratia Fatehabad 23,826 17,644 13,065 . . . . . .Assandh Karnal 22,707 16,749 13,209 . . . . . .Ladwa Kurukshetra 22,339 19,441 15,119 10,666 6,237 3,518Tarori Karnal 22,201 16,103 12,803 . . . . . .Babiyal Ambala 21,644 12,750 7,342 . . . . . .Rania Sirsa 20,961 . . 16,714 12,464 . . 4,384Class—IV Dharuhera Rewari 18,892 10,848 . . . . . . 3,765Kharkhoda Sonipat 18,763 13,151 . . . . . . . .Naraingarh Ambala 18,210 13,832 9,370 6,880 . . . .Meham Rohtak 18,174 15,083 11,722 10,541 8,536 7,824Ferozepur Jhirkha Gurgaon 17,755 12,413 9,400 7,962 4,444 7,278Bawani Khera Bhiwani 17,424 14,159 11,530 . . . . . .Taoru Gurgaon 17,328 12,534 6,912 . . . . . .Hallymandi Gurgoan 17,081 13,263 10,140 2,252 1,346 . .Kalayat Kaithal 17,051 12,872 10,965 . . . . . .
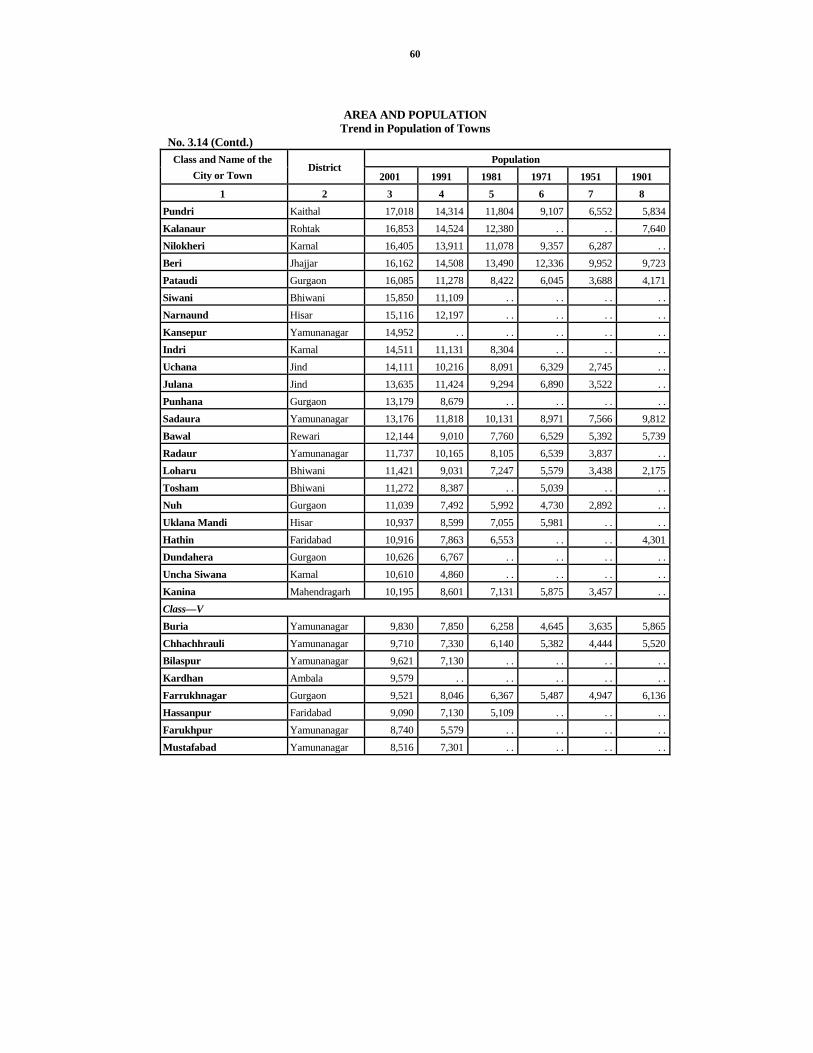
60
AREA AND POPULATION Trend in Population of Towns
No. 3.14 (Contd.) Population Class and Name of the
City or Town District
2001 1991 1981 1971 1951 1901 1 2 3 4 5 6 7 8
Pundri Kaithal 17,018 14,314 11,804 9,107 6,552 5,834Kalanaur Rohtak 16,853 14,524 12,380 . . . . 7,640Nilokheri Karnal 16,405 13,911 11,078 9,357 6,287 . .Beri Jhajjar 16,162 14,508 13,490 12,336 9,952 9,723Pataudi Gurgaon 16,085 11,278 8,422 6,045 3,688 4,171Siwani Bhiwani 15,850 11,109 . . . . . . . .Narnaund Hisar 15,116 12,197 . . . . . . . .Kansepur Yamunanagar 14,952 . . . . . . . . . .Indri Karnal 14,511 11,131 8,304 . . . . . .Uchana Jind 14,111 10,216 8,091 6,329 2,745 . .Julana Jind 13,635 11,424 9,294 6,890 3,522 . .Punhana Gurgaon 13,179 8,679 . . . . . . . .Sadaura Yamunanagar 13,176 11,818 10,131 8,971 7,566 9,812Bawal Rewari 12,144 9,010 7,760 6,529 5,392 5,739Radaur Yamunanagar 11,737 10,165 8,105 6,539 3,837 . .Loharu Bhiwani 11,421 9,031 7,247 5,579 3,438 2,175Tosham Bhiwani 11,272 8,387 . . 5,039 . . . .Nuh Gurgaon 11,039 7,492 5,992 4,730 2,892 . .Uklana Mandi Hisar 10,937 8,599 7,055 5,981 . . . .Hathin Faridabad 10,916 7,863 6,553 . . . . 4,301Dundahera Gurgaon 10,626 6,767 . . . . . . . .Uncha Siwana Karnal 10,610 4,860 . . . . . . . .Kanina Mahendragarh 10,195 8,601 7,131 5,875 3,457 . .Class—V Buria Yamunanagar 9,830 7,850 6,258 4,645 3,635 5,865Chhachhrauli Yamunanagar 9,710 7,330 6,140 5,382 4,444 5,520Bilaspur Yamunanagar 9,621 7,130 . . . . . . . .Kardhan Ambala 9,579 . . . . . . . . . .Farrukhnagar Gurgaon 9,521 8,046 6,367 5,487 4,947 6,136Hassanpur Faridabad 9,090 7,130 5,109 . . . . . .Farukhpur Yamunanagar 8,740 5,579 . . . . . . . .Mustafabad Yamunanagar 8,516 7,301 . . . . . . . .
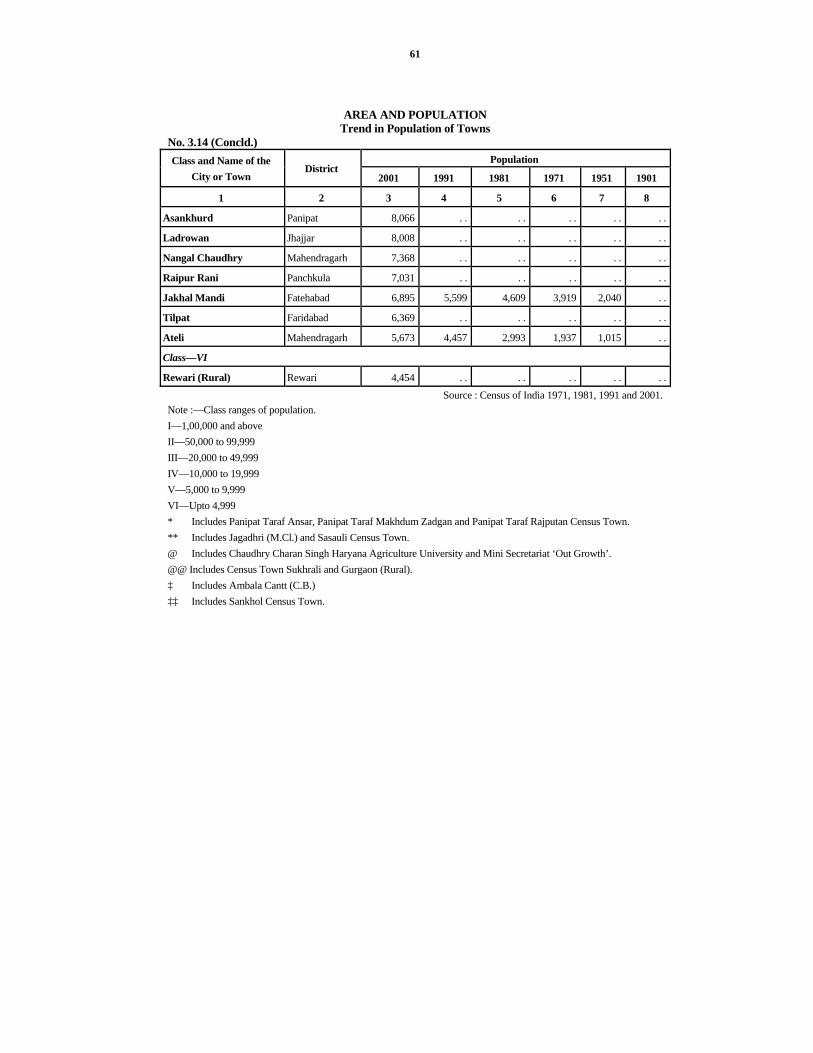
61
AREA AND POPULATION Trend in Population of Towns
No. 3.14 (Concld.) Population Class and Name of the
City or Town District
2001 1991 1981 1971 1951 1901
1 2 3 4 5 6 7 8
Asankhurd Panipat 8,066 . . . . . . . . . .
Ladrowan Jhajjar 8,008 . . . . . . . . . .
Nangal Chaudhry Mahendragarh 7,368 . . . . . . . . . .
Raipur Rani Panchkula 7,031 . . . . . . . . . .
Jakhal Mandi Fatehabad 6,895 5,599 4,609 3,919 2,040 . .
Tilpat Faridabad 6,369 . . . . . . . . . .
Ateli Mahendragarh 5,673 4,457 2,993 1,937 1,015 . .
Class—VI
Rewari (Rural) Rewari 4,454 . . . . . . . . . .
Source : Census of India 1971, 1981, 1991 and 2001. Note :—Class ranges of population. I—1,00,000 and above II—50,000 to 99,999 III—20,000 to 49,999 IV—10,000 to 19,999 V—5,000 to 9,999 VI—Upto 4,999 * Includes Panipat Taraf Ansar, Panipat Taraf Makhdum Zadgan and Panipat Taraf Rajputan Census Town. ** Includes Jagadhri (M.Cl.) and Sasauli Census Town. @ Includes Chaudhry Charan Singh Haryana Agriculture University and Mini Secretariat ‘Out Growth’. @@ Includes Census Town Sukhrali and Gurgaon (Rural). ‡ Includes Ambala Cantt (C.B.) ‡‡ Includes Sankhol Census Town.

62
AREA AND POPULATION Cities/Urban Agglomerations with a Population of 1,00,000 and above—2001
No. 3.15 Population Total Literates Sr. No. Name of city/ Urban
Agglomeration Persons Males Females Persons Males Females Sex
Ratio
1 2 3 4 5 6 7 8 9 1. Faridabad M. Corp. 10,55,93
85,81,069 4,74,869 7,14,578 4,30,274 2,84,304 817
2. Panipat (U.A.)* 3,54,148 1,94,850 1,59,298 2,27,087 1,34,694 92,393 8183. Yamunanagar (U.A.)** 3,06,740 1,66,137 1,40,603 2,21,463 1,25,398 96,065 8464. Rohtak (U.A.) 2,94,577 1,58,287 1,36,290 2,10,470 1,20,081 90,389 8615. Hisar (U.A.)@ 2,63,186 1,43,795 1,19,391 1,82,876 1,08,024 74,852 8306. Gurgaon (U.A.)@@ 2,28,820 1,23,377 1,05,443 1,71,190 97,069 74,121 8557. Sonipat (U.A.) 2,25,074 1,22,480 1,02,594 1,59,583 93,096 66,487 8388. Karnal (U.A.) 2,21,236 1,17,875 1,03,361 1,59,090 88,668 70,422 8779. Bhiwani 1,69,531 91,697 77,834 1,15,309 68,222 47,087 84910. Ambala (U.A.)‡ 1,68,316 92,977 75,339 1,28,980 74,797 54,183 81011. Sirsa 1,60,735 85,993 74,742 1,07,271 61,643 45,628 86912. Panchkula Urban
Estate 1,40,925 75,897 65,028 1,01,590 57,272 44,318 857
13. Ambala (City) 1,39,279 74,016 65,263 1,05,218 57,845 47,373 88214. Jind 1,35,855 73,407 62,448 91,734 54,396 37,338 85115. Bahadurgarh (U.A.)‡‡ 1,31,925 72,873 59,052 91,234 54,786 36,448 81016. Thanesar (U.A.) 1,22,319 66,978 55,341 87,271 50,712 36,559 82617. Kaithal 1,17,285 63,098 54,187 75,156 43,910 31,246 85918. Palwal 1,00,722 53,648 47,074 64,465 38,053 26,412 87719. Rewari 1,00,684 53,935 46,749 73,436 42,488 30,948 867
Source : Director of Census Operations, Haryana. * Includes Panipat Taraf Ansar, Panipat Taraf Makhdum Zadgan and Panipat Taraf Rajputan Census Town. * Includes Jagadhri (M.Cl.) and Sasauli Census Town. @ Includes Chaudhry Charan Singh Haryana Agriculture University and Mini Secretariat ‘Out Growth’. @@ Includes Census Town Sukhrali and Gurgaon (Rural). ‡ Includes Ambala Cantt (C.B.) ‡‡ Includes Sankhol Census Town.

63
AREA AND POPULATION Rural/Urban Workers and Non-Workers by Districts—2001
No. 3.16
Main workers Marginal workers Non-workers District
Rural Urban Total Rural Urban Total Rural Urban Total
Main Workers as percentage
to total population
1 2 3 4 5 6 7 8 9 10 11 Ambala 1,67,439 1,08,209 2,75,648 40,544 8,329 48,873 4,49,400 2,40,490 6,89,890 27.17 Panchkula 84,069 66,284 1,50,353 24,590 3,701 28,291 1,51,357 1,38,410 2,89,767 32.10 Yamunanagar 1,75,699 1,05,029 2,80,728 44,851 10,954 55,805 4,28,058 2,77,039 7,05,097 26.95 Kurukshetra 1,91,629 58,967 2,50,596 52,119 5,677 57,796 3,66,195 1,50,867 5,17,062 30.36 Kaithal 2,20,580 47,547 2,68,127 96,361 7,523 1,03,884 4,45,708 1,28,412 5,74,120 28.34 Karnal 2,59,387 96,079 3,55,466 89,770 10,219 99,989 5,87,184 2,31,544 8,18,728 27.90 Panipat 1,64,343 1,24,670 2,89,013 76,786 17,002 93,788 3,34,240 2,50,408 5,84,648 29.87 Sonipat 2,98,540 84,909 3,83,449 1,28,578 11,004 1,39,582 5,30,682 2,25,462 7,56,144 29.98 Rohtak 1,99,869 88,356 2,88,225 72,625 10,223 82,848 3,38,030 2,31,025 5,69,055 30.66 Jhajjar 2,21,480 54,728 2,76,208 1,02,650 9,857 1,12,507 3,60,845 1,30,512 4,91,357 31.38 Faridabad (P) 2,17,763 3,40,291 5,58,054 1,02,516 34,872 1,37,388 4,60,012 8,35,265 12,95,277 28.03 Gurgaon (P) 1,76,671 92,927 2,69,598 46,555 7,352 53,907 3,37,610 2,09,424 5,47,034 30.97 Mewat (P) 2,29,067 17,588 2,46,655 1,45,567 4,251 1,49,818 5,48,766 48,378 5,97,144 24.82 Rewari 1,69,550 35,305 2,04,855 1,23,032 5,735 1,28,767 3,36,595 95,134 4,31,729 26.77 Mahendragarh 1,75,851 28,853 2,04,704 1,41,801 5,359 1,47,160 3,85,233 75,424 4,60,657 25.19 Bhiwani 3,54,627 70,583 4,25,210 1,72,508 11,602 1,84,110 6,27,494 1,88,208 8,15,702 29.84 Jind 3,06,963 65,086 3,72,049 1,41,398 8,499 1,49,897 4,99,889 1,67,992 6,67,881 31.27 Hisar 4,00,228 1,16,589 5,16,817 1,35,302 13,453 1,48,755 6,03,469 2,68,076 8,71,545 33.62 Fatehabad 2,23,971 37,652 2,61,623 94,810 6,542 1,01,352 3,45,220 97,963 4,43,183 32.45 Sirsa 2,81,514 82,432 3,63,946 99,984 11,641 1,11,625 4,41,686 1,99,392 6,41,078 32.59 Total 2001 45,19,240 17,22,084 62,41,324 19,32,347 2,03,795 21,36,142 85,77,673 41,89,425 1,27,67,098 29.52
1991 35,80,049 11,38,677 47,18,726 3,75,089 9,655 3,84,744 84,53,766 29,06,412 1,13,60,178 28.66 P—Provisional Source : Director of Census Operations, Haryana.

64
AREA AND POPULATION Number and Percentage Distribution of Workers (Main + Marginal)
by Broad Industrial Categories No. 3.17
2001 Numbers Percentage to Total Categories
Persons Males Females Persons Males Females 1 2 3 4 5 6 7
Cultivators 30,18,014 18,55,547 11,62,467 36.03 32.47 43.67Agricultural Labourers 12,78,821 7,17,133 5,61,688 15.26 12.55 21.10Workers in Household Industries 2,14,755 1,32,069 82,686 2.56 2.31 3.11Other Workers 38,65,876 30,10,777 8,55,099 46.15 52.67 32.12Total Workers (Main + Marginal)
83,77,466 57,15,526 26,61,940 100.00 100.00 100.00
Source : Director of Census Operations, Haryana.
Note : The main workers is one who has worked for 183 days or more in a year in one or more than one economic activity. A person who has worked for less than 183 days in a year is considered a marginal worker.
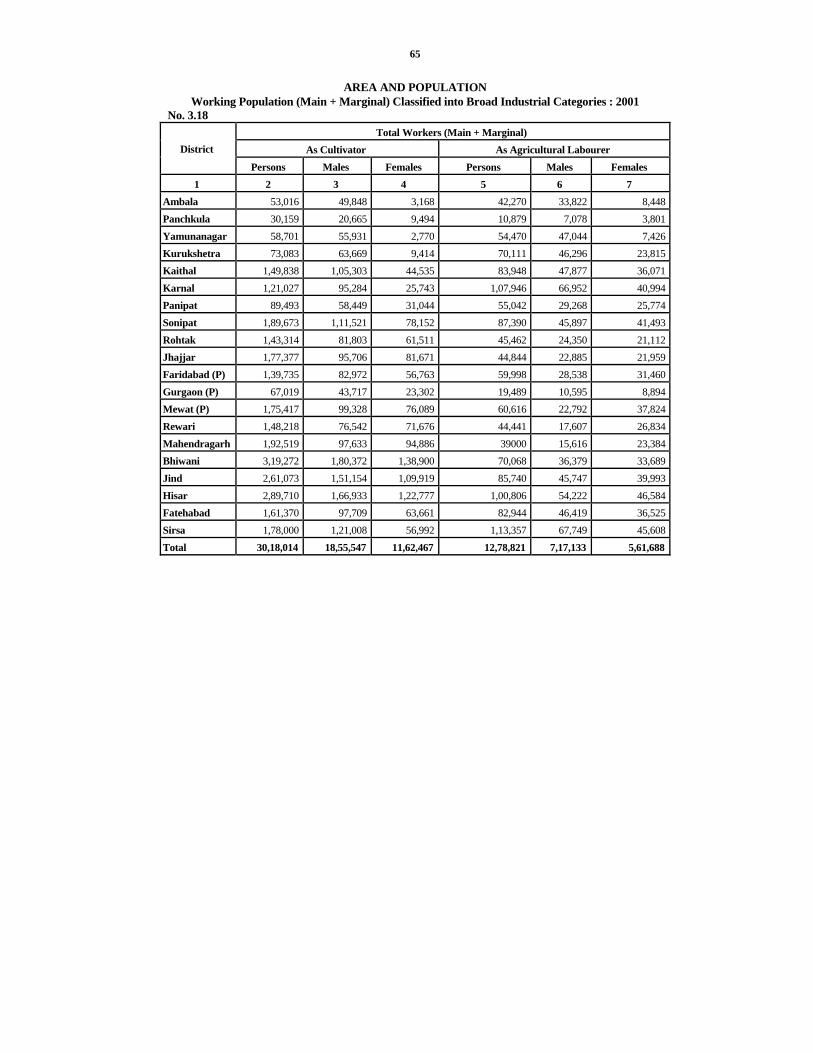
65
AREA AND POPULATION Working Population (Main + Marginal) Classified into Broad Industrial Categories : 2001
No. 3.18 Total Workers (Main + Marginal)
As Cultivator As Agricultural Labourer District
Persons Males Females Persons Males Females 1 2 3 4 5 6 7
Ambala 53,016 49,848 3,168 42,270 33,822 8,448Panchkula 30,159 20,665 9,494 10,879 7,078 3,801Yamunanagar 58,701 55,931 2,770 54,470 47,044 7,426Kurukshetra 73,083 63,669 9,414 70,111 46,296 23,815Kaithal 1,49,838 1,05,303 44,535 83,948 47,877 36,071Karnal 1,21,027 95,284 25,743 1,07,946 66,952 40,994Panipat 89,493 58,449 31,044 55,042 29,268 25,774Sonipat 1,89,673 1,11,521 78,152 87,390 45,897 41,493Rohtak 1,43,314 81,803 61,511 45,462 24,350 21,112Jhajjar 1,77,377 95,706 81,671 44,844 22,885 21,959Faridabad (P) 1,39,735 82,972 56,763 59,998 28,538 31,460Gurgaon (P) 67,019 43,717 23,302 19,489 10,595 8,894Mewat (P) 1,75,417 99,328 76,089 60,616 22,792 37,824Rewari 1,48,218 76,542 71,676 44,441 17,607 26,834Mahendragarh 1,92,519 97,633 94,886 39000 15,616 23,384Bhiwani 3,19,272 1,80,372 1,38,900 70,068 36,379 33,689Jind 2,61,073 1,51,154 1,09,919 85,740 45,747 39,993Hisar 2,89,710 1,66,933 1,22,777 1,00,806 54,222 46,584Fatehabad 1,61,370 97,709 63,661 82,944 46,419 36,525Sirsa 1,78,000 1,21,008 56,992 1,13,357 67,749 45,608Total 30,18,014 18,55,547 11,62,467 12,78,821 7,17,133 5,61,688

66
AREA AND POPULATION Working Population (Main + Marginal) Classified into Broad Industrial Categories : 2001
No. 3.18 (Concld.) Total Workers (Main + Marginal)
In Household Industry Other Workers Total Workers (Main + Marginal) District Persons Males Females Persons Males Females Persons Males Females
1 8 9 10 11 12 13 14 15 16 Ambala 10,764 8,040 2,724 2,18,471 1,84,922 33,549 3,24,521 2,76,632 47,889 Panchkula 5,631 3,505 2,126 1,31,975 1,08,875 23,100 1,78,644 1,40,123 38,521 Yamunanagar 10,831 7,091 3,740 2,12,531 1,70,223 42,308 3,36,533 2,80,289 56,244 Kurukshetra 6,407 3,919 2,488 1,58,791 1,12,526 46,265 3,08,392 2,26,410 81,982 Kaithal 6,662 3,987 2,675 1,31,563 1,02,512 29,051 3,72,011 2,59,679 1,12,332 Karnal 13,426 7,980 5,446 2,13,056 1,72,698 40,358 4,55,455 3,42,914 1,12,541 Panipat 17,695 10,268 7,427 2,20,571 1,71,871 48,700 3,82,801 2,69,856 1,12,945 Sonipat 11,772 7,480 4,292 2,34,196 1,80,552 53,644 5,23,031 3,45,450 1,77,581 Rohtak 9,733 6,078 3,655 1,72,564 1,38,865 33,699 3,71,073 2,51,096 1,19,977 Jhajjar 7,743 4,401 3,342 1,58,751 1,21,817 36,934 3,88,715 2,44,809 1,43,906 Faridabad (P) 22,137 14,980 7,157 4,73,572 3,99,519 74,053 6,95,442 5,26,009 1,69,433 Gurgaon (P) 11,283 6,002 5,281 2,25,714 1,74,537 51,177 3,23,505 2,34,851 88,654 Mewat (P) 7,417 4,312 3,105 1,53,023 1,04,363 48,660 3,96,473 2,30,795 1,65,678 Rewari 8,675 5,323 3,352 1,32,288 1,00,928 31,360 3,33,622 2,00,400 1,33,222 Mahendragarh 7,889 5,013 2,876 1,12,456 85,039 27,417 3,51,864 2,03,301 1,48,563 Bhiwani 12,587 7,643 4,944 2,07,393 1,48,993 58,400 6,09,320 3,73,387 2,35,933 Jind 8,704 5,520 3,184 1,66,429 1,28,721 37,708 5,21,946 3,31,142 1,90,804 Hisar 15,778 9,392 6,386 2,59,278 2,00,271 59,007 6,65,572 4,30,818 2,34,754 Fatehabad 8,842 4,777 4,065 1,09,819 83,954 25,865 3,62,975 2,32,859 1,30,116 Sirsa 10,779 6,358 4,421 1,73,435 1,19,591 53,844 4,75,571 3,14,706 1,60,865 Total 2,14,755 1,32,069 82,686 38,65,876 30,10,777 8,55,099 83,77,466 57,15,526 26,61,940 P—Provisional Source : Director of Census Operations, Haryana.

67
AREA AND POPULATION
Age distribution of Rural and Urban Population in Haryana—2001 No. 3.19
Total Population Rural Urban Age Group
Total Males Females Total Males Females Total Males Females 1 2 3 4 5 6 7 8 9 10
2001 All Ages 2,11,44,564 1,13,63,953 97,80,611 1,50,29,260 80,52,988 69,76,272 61,15,304 33,10,965 28,04,339 0—4 22,73,739 12,51,155 10,22,584 16,95,476 9,30,854 7,64,622 5,78,263 3,20,301 2,57,962 5—9 26,22,965 14,29,636 11,93,329 19,35,409 10,50,913 8,84,496 6,87,556 3,78,723 3,08,833 10—14 26,83,276 14,36,447 12,46,829 19,55,460 10,42,131 9,13,329 7,27,816 3,94,316 3,33,500 15—19 22,56,559 12,71,643 9,84,916 15,96,808 9,03,241 6,93,567 6,59,751 3,68,402 2,91,349 20—24 19,57,303 10,75,114 8,82,189 13,59,024 7,46,568 6,12,456 5,98,279 3,28,546 2,69,733 25—29 17,33,146 9,11,893 8,21,253 12,03,142 6,32,007 5,71,135 5,30,004 2,79,886 2,50,118 30—34 15,11,037 7,71,117 7,39,920 10,44,343 5,29,149 5,15,194 4,66,694 2,41,968 2,24,726 35—39 14,01,762 7,30,882 6,70,880 9,47,267 4,94,058 4,53,209 4,54,495 2,36,824 2,17,671 40—44 11,07,196 6,00,693 5,06,503 7,36,335 3,95,603 3,40,732 3,70,861 2,05,090 1,65,771 45—49 8,64,937 4,69,917 3,95,020 5,75,558 3,07,604 2,67,954 2,89,379 1,62,313 1,27,066 50—54 6,31,108 3,51,341 2,79,767 4,29,554 2,35,531 1,94,023 2,01,554 1,15,810 85,744 55—59 4,36,948 2,23,135 2,13,813 3,01,459 1,51,400 1,50,059 1,35,489 71,735 63,754 60—64 4,89,742 2,29,532 2,60,210 3,62,364 1,67,243 1,95,121 1,27,378 62,289 65,089 65—69 4,40,663 2,14,964 2,25,699 3,33,094 1,63,329 1,69,765 1,07,569 51,635 55,934 70—74 3,21,755 1,73,911 1,47,844 2,44,178 1,33,938 1,10,240 77,577 39,973 37,604 75—79 1,48,044 79,391 68,653 1,11,360 60,432 50,928 36,684 18,959 17,725 80— 1,83,885 97,585 86,300 1,40,819 76,508 64,311 43,066 21,077 21,989 Age not stated
80,499 45,597 34,902 57,610 32,479 25,131 22,889 13,118 9,771
0—6 33,35,537 18,33,655 15,01,882 24,82,148 13,61,694 11,20,454 8,53,389 4,71,961 3,81,428 7 and above 1,78,09,027 95,30,298 82,78,729 1,25,47,112 66,91,294 58,55,818 52,61,915 28,39,004 24,22,911
Source : Director of Census Operations, Haryana.

68
AREA AND POPULATION Population by Religion in Haryana—2001
No. 3.20 District Hindus Sikhs Muslims Chirstians Buddhists Jains Other
Religions Religions not stated
Total
1 2 3 4 5 6 7 8 9 10 Ambala 8,56,193 1,32,463 17,263 2,885 226 5,234 57 90 10,14,411 Panchkula 4,10,120 36,194 18,297 1,982 159 1,547 58 54 4,68,411 Yamunanagar 8,49,255 83,524 1,04,073 2,539 79 1,793 265 102 10,41,630 Kurukshetra 6,75,381 1,35,545 12,028 1,456 289 622 40 93 8,25,454 Kaithal 8,48,765 88,700 6,777 1,120 152 394 45 178 9,46,131 Karnal 11,25,279 1,23,160 22,614 1,083 224 1,620 85 118 12,74,183 Panipat 8,73,593 27,437 59,696 1,017 645 4,852 46 163 9,67,449 Sonipat 12,34,225 4,988 31,954 469 708 6,729 2 100 12,79,175 Rohtak 9,24,541 5,079 5,665 203 605 3,959 15 61 9,40,128 Jhajjar 8,69,258 1,281 8,311 113 139 836 5 129 8,80,072 Faridabad 18,96,698 36,005 2,47,293 6,976 1,725 5,560 141 188 21,94,586 Gurgaon 10,26,542 6,672 6,17,918 3,258 838 4,792 65 204 16,60,289 Rewari 7,58,328 1,668 3,194 312 120 1,633 25 71 7,65,351 Mahendragarh 8,05,991 2,026 3,434 34 58 825 58 95 8,12,521 Bhiwani 14,07,363 2,542 12,740 254 321 1,733 6 63 14,25,022 Jind 11,34,539 29,159 20,618 200 76 5,136 33 66 11,89,827 Hisar 14,97,776 14,617 17,431 1,168 296 5,540 61 228 15,37,117 Fatehabad 6,60,331 1,36,660 6,554 468 174 1,704 89 178 8,06,158 Sirsa 8,01,747 3,02,942 7,056 1,648 306 2,658 159 133 11,16,649 Total 1,86,55,925 11,70,662 12,22,916 27,185 7,140 57,167 1,255 2,314 2,11,44,564
Source : Director of Census Operations, Haryana

69
AREA AND POPULATION Districtwise Distribution of Population by Languages—1991
No. 3.21 District Hindi Punjabi Urdu Other Total
1 2 3 4 5 6 Ambala 9,81,455 1,22,109 2,155 11,159 11,16,878Yamunanagar 7,23,555 76,569 20,427 1,329 8,21,880Kurukshetra 5,20,457 1,19,590 384 1,512 6,41,943Kaithal 7,31,410 88,743 163 369 8,20,685Karnal 7,91,093 87,505 3,938 3,261 8,85,797Panipat 7,60,153 65,237 6,646 1,465 8,33,501Sonipat 7,44,793 7,829 1,207 1,037 7,54,866Rohtak 17,88,093 18,720 432 1,361 18,08,606Faridabad 13,75,267 47,050 36,296 18,627 14,77,240Gurgaon 9,44,152 9,172 1,89,311 3,455 11,46,090Rewari 6,19,661 2,890 132 618 6,23,301Mahendragarh 6,79,459 2,121 64 225 6,81,869Bhiwani 11,34,607 4,517 55 539 11,39,718Jind 9,30,449 32,148 77 430 9,63,104Hisar 16,67,460 1,73,981 313 2,880 18,44,634Sirsa 5,90,345 3,12,044 220 927 9,03,536Total 1,49,82,409 11,70,225 2,61,820 49,194 1,64,63,648Percentage 91.00 7.11 1.59 0.30 100.00
Source :—Director of Census Operations, Haryana. Note :—Figures according to 2001 Census are not available.
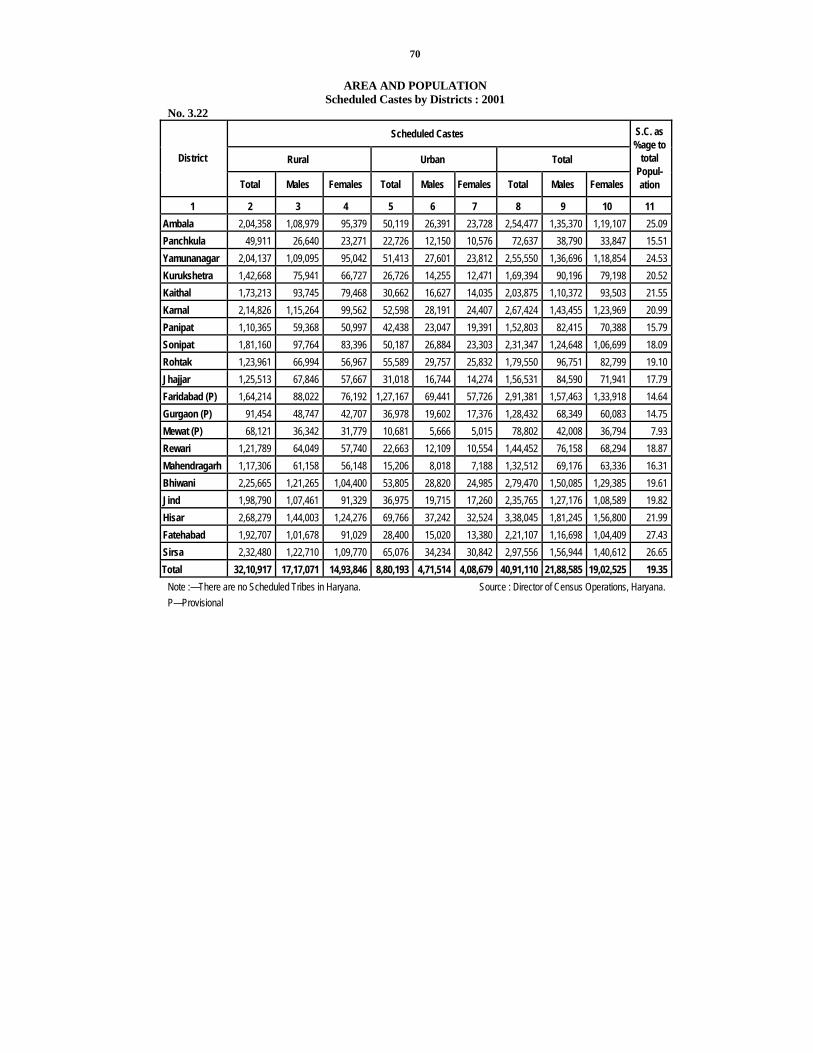
70
AREA AND POPULATION Scheduled Castes by Districts : 2001
No. 3.22
Scheduled Castes
Rural Urban Total District
Total Males Females Total Males Females Total Males Females
S.C. as %age to
total Popul-ation
1 2 3 4 5 6 7 8 9 10 11 Ambala 2,04,358 1,08,979 95,379 50,119 26,391 23,728 2,54,477 1,35,370 1,19,107 25.09 Panchkula 49,911 26,640 23,271 22,726 12,150 10,576 72,637 38,790 33,847 15.51 Yamunanagar 2,04,137 1,09,095 95,042 51,413 27,601 23,812 2,55,550 1,36,696 1,18,854 24.53 Kurukshetra 1,42,668 75,941 66,727 26,726 14,255 12,471 1,69,394 90,196 79,198 20.52 Kaithal 1,73,213 93,745 79,468 30,662 16,627 14,035 2,03,875 1,10,372 93,503 21.55 Karnal 2,14,826 1,15,264 99,562 52,598 28,191 24,407 2,67,424 1,43,455 1,23,969 20.99 Panipat 1,10,365 59,368 50,997 42,438 23,047 19,391 1,52,803 82,415 70,388 15.79 Sonipat 1,81,160 97,764 83,396 50,187 26,884 23,303 2,31,347 1,24,648 1,06,699 18.09 Rohtak 1,23,961 66,994 56,967 55,589 29,757 25,832 1,79,550 96,751 82,799 19.10 Jhajjar 1,25,513 67,846 57,667 31,018 16,744 14,274 1,56,531 84,590 71,941 17.79 Faridabad (P) 1,64,214 88,022 76,192 1,27,167 69,441 57,726 2,91,381 1,57,463 1,33,918 14.64 Gurgaon (P) 91,454 48,747 42,707 36,978 19,602 17,376 1,28,432 68,349 60,083 14.75 Mewat (P) 68,121 36,342 31,779 10,681 5,666 5,015 78,802 42,008 36,794 7.93 Rewari 1,21,789 64,049 57,740 22,663 12,109 10,554 1,44,452 76,158 68,294 18.87 Mahendragarh 1,17,306 61,158 56,148 15,206 8,018 7,188 1,32,512 69,176 63,336 16.31 Bhiwani 2,25,665 1,21,265 1,04,400 53,805 28,820 24,985 2,79,470 1,50,085 1,29,385 19.61 Jind 1,98,790 1,07,461 91,329 36,975 19,715 17,260 2,35,765 1,27,176 1,08,589 19.82 Hisar 2,68,279 1,44,003 1,24,276 69,766 37,242 32,524 3,38,045 1,81,245 1,56,800 21.99 Fatehabad 1,92,707 1,01,678 91,029 28,400 15,020 13,380 2,21,107 1,16,698 1,04,409 27.43 Sirsa 2,32,480 1,22,710 1,09,770 65,076 34,234 30,842 2,97,556 1,56,944 1,40,612 26.65 Total 32,10,917 17,17,071 14,93,846 8,80,193 4,71,514 4,08,679 40,91,110 21,88,585 19,02,525 19.35
Note :—There are no Scheduled Tribes in Haryana. Source : Director of Census Operations, Haryana. P—Provisional

71
AREA AND POPULATION Scheduled Castes Working Population Classified into
Broad Industrial Categories : 2001 No. 3.23
Total workers As Cultivator As Agricultural Labourer District
Persons Males Females Persons Males Females 1 2 3 4 5 6 7
Ambala 2,565 2,395 170 14,043 12,954 1,089Panchkula 1,190 864 326 1,957 1,634 323Yamunanagar 3,138 2,970 168 19,900 18,542 1,358Kurukshetra 2,374 2,123 251 20,133 16,567 3,566Kaithal 2,822 2,293 529 25,244 20,760 4,484Karnal 4,299 3,601 698 25,684 20,868 4,816Panipat 1,683 1,348 335 9,659 7,119 2,540Sonipat 2,062 1,599 463 18,422 12,972 5,450Rohtak 1,697 1,173 524 13,925 9,704 4,221Jhajjar 1,809 1,160 649 10,341 7,268 3,073Faridabad 4,437 3,285 1,152 11,608 7,794 3,814Gurgaon 2,180 1,571 609 4,242 3,043 1,199Rewari 1,964 1,466 498 5,145 3,696 1,449Mahendragarh 2,267 1,615 652 3,719 2,630 1,089Bhiwani 14,377 9,919 4,458 17,776 12,531 5,245Jind 4,604 3,227 1,377 24,974 18,784 6,190Hisar 16,859 11,393 5,466 36,477 25,303 11,174Fatehabad 10,955 7,783 3,172 29,527 21,646 7,881Sirsa 12,536 9,164 3,372 41,518 31,655 9,863Total 93,818 68,949 24,869 3,34,294 2,55,470 78,824
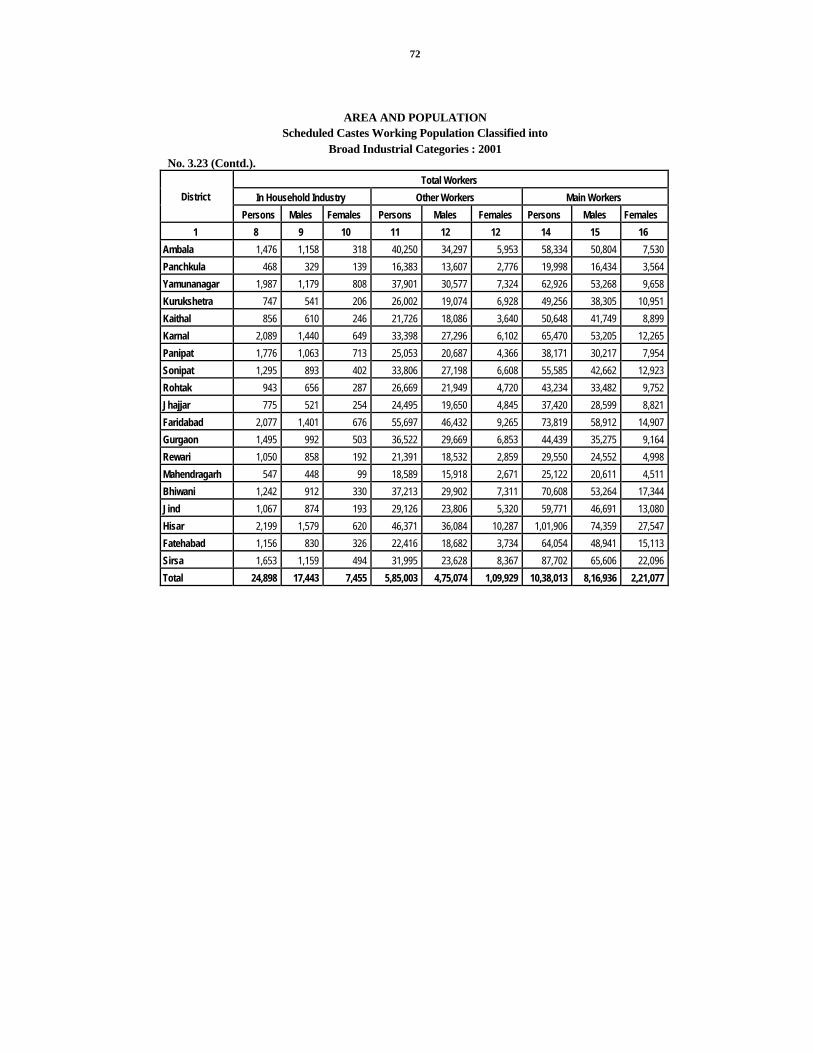
72
AREA AND POPULATION Scheduled Castes Working Population Classified into
Broad Industrial Categories : 2001 No. 3.23 (Contd.).
Total Workers In Household Industry Other Workers Main Workers District
Persons Males Females Persons Males Females Persons Males Females 1 8 9 10 11 12 12 14 15 16
Ambala 1,476 1,158 318 40,250 34,297 5,953 58,334 50,804 7,530 Panchkula 468 329 139 16,383 13,607 2,776 19,998 16,434 3,564 Yamunanagar 1,987 1,179 808 37,901 30,577 7,324 62,926 53,268 9,658 Kurukshetra 747 541 206 26,002 19,074 6,928 49,256 38,305 10,951 Kaithal 856 610 246 21,726 18,086 3,640 50,648 41,749 8,899 Karnal 2,089 1,440 649 33,398 27,296 6,102 65,470 53,205 12,265 Panipat 1,776 1,063 713 25,053 20,687 4,366 38,171 30,217 7,954 Sonipat 1,295 893 402 33,806 27,198 6,608 55,585 42,662 12,923 Rohtak 943 656 287 26,669 21,949 4,720 43,234 33,482 9,752 Jhajjar 775 521 254 24,495 19,650 4,845 37,420 28,599 8,821 Faridabad 2,077 1,401 676 55,697 46,432 9,265 73,819 58,912 14,907 Gurgaon 1,495 992 503 36,522 29,669 6,853 44,439 35,275 9,164 Rewari 1,050 858 192 21,391 18,532 2,859 29,550 24,552 4,998 Mahendragarh 547 448 99 18,589 15,918 2,671 25,122 20,611 4,511 Bhiwani 1,242 912 330 37,213 29,902 7,311 70,608 53,264 17,344 Jind 1,067 874 193 29,126 23,806 5,320 59,771 46,691 13,080 Hisar 2,199 1,579 620 46,371 36,084 10,287 1,01,906 74,359 27,547 Fatehabad 1,156 830 326 22,416 18,682 3,734 64,054 48,941 15,113 Sirsa 1,653 1,159 494 31,995 23,628 8,367 87,702 65,606 22,096 Total 24,898 17,443 7,455 5,85,003 4,75,074 1,09,929 10,38,013 8,16,936 2,21,077

73
AREA ANDPOPULATION Scheduled Castes Working Population Classified into Broad Industrial Categories : 2001
No. 3.23 (Concld.). Total workers
Marginal workers Non-workers District
Persons Males Females Persons Males Females 1 17 18 19 20 21 22
Ambala 21,559 14,440 7,119 1,74,584 70,126 1,04,458Panchkula 5,926 3,189 2,737 46,713 19,167 27,546Yamunanagar 21,708 13,096 8,612 1,70,916 70,332 1,00,584Kurukshetra 18,160 6,877 11,283 1,01,978 45,014 56,964Kaithal 32,123 12,847 19,276 1,21,104 55,776 65,328Karnal 34,223 16,141 18,082 1,67,731 74,109 93,622Panipat 22,503 9,444 13,059 92,129 42,754 49,375Sonipat 33,918 16,253 17,665 1,41,844 65,733 76,111Rohtak 22,314 11,410 10,904 1,14,002 51,859 62,143Jhajjar 26,290 13,019 13,271 92,821 42,972 49,849Faridabad 36,434 17,726 18,708 2,00,490 91,179 1,09,311Gurgaon 22,339 10,269 12,070 1,21,094 54,459 66,635Rewari 26,734 10,787 15,947 88,168 40,819 47,349Mahendragarh 25,659 11,016 14,643 81,731 37,549 44,182Bhiwani 41,027 17,974 23,053 1,67,835 78,847 88,988Jind 38,681 16,072 22,609 1,37,313 64,413 72,900Hisar 40,473 15,988 24,485 1,95,666 90,898 1,04,768Fatehabad 33,334 12,206 21,128 1,23,719 55,551 68,168Sirsa 40,320 15,521 24,799 1,69,534 75,817 93,717Total 5,43,725 2,44,275 2,99,450 25,09,372 11,27,374 13,81,998
Source : Director of Census Operations, Haryana.
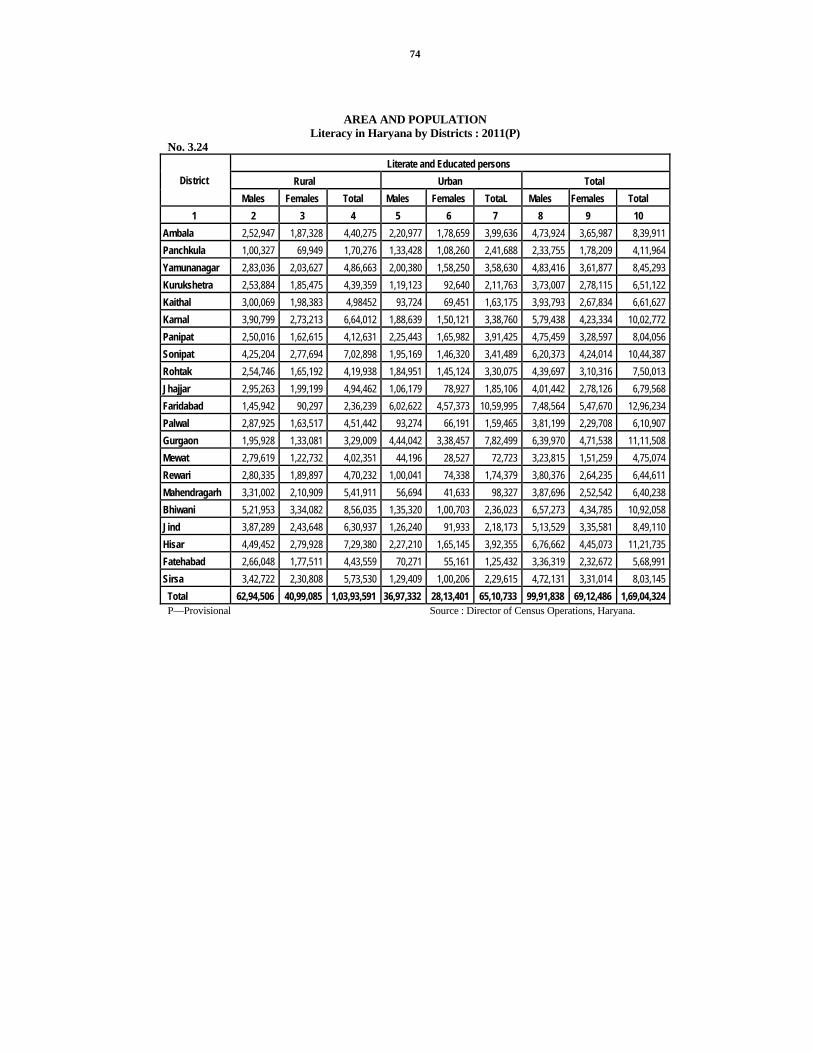
74
AREA AND POPULATION Literacy in Haryana by Districts : 2011(P)
No. 3.24 Literate and Educated persons
Rural Urban Total District Males Females Total Males Females TotaL Males Females Total
1 2 3 4 5 6 7 8 9 10 Ambala 2,52,947 1,87,328 4,40,275 2,20,977 1,78,659 3,99,636 4,73,924 3,65,987 8,39,911 Panchkula 1,00,327 69,949 1,70,276 1,33,428 1,08,260 2,41,688 2,33,755 1,78,209 4,11,964 Yamunanagar 2,83,036 2,03,627 4,86,663 2,00,380 1,58,250 3,58,630 4,83,416 3,61,877 8,45,293 Kurukshetra 2,53,884 1,85,475 4,39,359 1,19,123 92,640 2,11,763 3,73,007 2,78,115 6,51,122 Kaithal 3,00,069 1,98,383 4,98452 93,724 69,451 1,63,175 3,93,793 2,67,834 6,61,627 Karnal 3,90,799 2,73,213 6,64,012 1,88,639 1,50,121 3,38,760 5,79,438 4,23,334 10,02,772 Panipat 2,50,016 1,62,615 4,12,631 2,25,443 1,65,982 3,91,425 4,75,459 3,28,597 8,04,056 Sonipat 4,25,204 2,77,694 7,02,898 1,95,169 1,46,320 3,41,489 6,20,373 4,24,014 10,44,387 Rohtak 2,54,746 1,65,192 4,19,938 1,84,951 1,45,124 3,30,075 4,39,697 3,10,316 7,50,013 Jhajjar 2,95,263 1,99,199 4,94,462 1,06,179 78,927 1,85,106 4,01,442 2,78,126 6,79,568 Faridabad 1,45,942 90,297 2,36,239 6,02,622 4,57,373 10,59,995 7,48,564 5,47,670 12,96,234 Palwal 2,87,925 1,63,517 4,51,442 93,274 66,191 1,59,465 3,81,199 2,29,708 6,10,907 Gurgaon 1,95,928 1,33,081 3,29,009 4,44,042 3,38,457 7,82,499 6,39,970 4,71,538 11,11,508 Mewat 2,79,619 1,22,732 4,02,351 44,196 28,527 72,723 3,23,815 1,51,259 4,75,074 Rewari 2,80,335 1,89,897 4,70,232 1,00,041 74,338 1,74,379 3,80,376 2,64,235 6,44,611 Mahendragarh 3,31,002 2,10,909 5,41,911 56,694 41,633 98,327 3,87,696 2,52,542 6,40,238 Bhiwani 5,21,953 3,34,082 8,56,035 1,35,320 1,00,703 2,36,023 6,57,273 4,34,785 10,92,058 Jind 3,87,289 2,43,648 6,30,937 1,26,240 91,933 2,18,173 5,13,529 3,35,581 8,49,110 Hisar 4,49,452 2,79,928 7,29,380 2,27,210 1,65,145 3,92,355 6,76,662 4,45,073 11,21,735 Fatehabad 2,66,048 1,77,511 4,43,559 70,271 55,161 1,25,432 3,36,319 2,32,672 5,68,991 Sirsa 3,42,722 2,30,808 5,73,530 1,29,409 1,00,206 2,29,615 4,72,131 3,31,014 8,03,145 Total 62,94,506 40,99,085 1,03,93,591 36,97,332 28,13,401 65,10,733 99,91,838 69,12,486 1,69,04,324 P—Provisional Source : Director of Census Operations, Haryana.
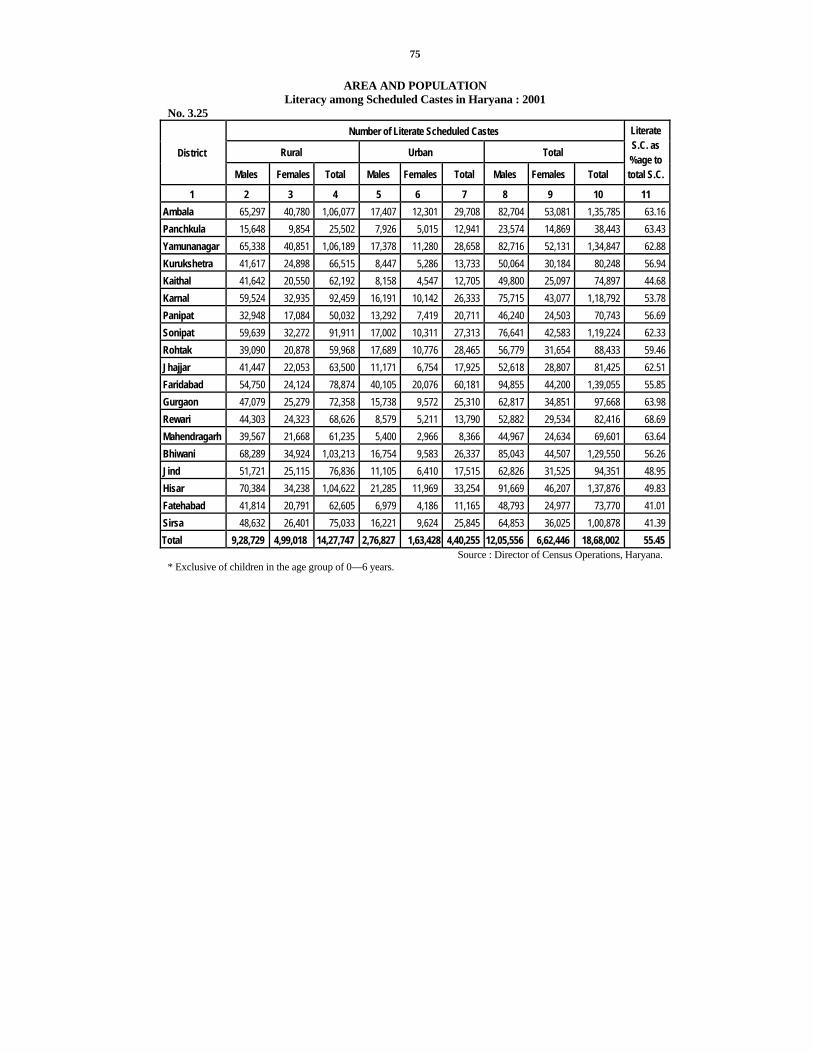
75
AREA AND POPULATION Literacy among Scheduled Castes in Haryana : 2001
No. 3.25 Number of Literate Scheduled Castes
Rural Urban Total District
Males Females Total Males Females Total Males Females Total
Literate S.C. as %age to total S.C.
1 2 3 4 5 6 7 8 9 10 11 Ambala 65,297 40,780 1,06,077 17,407 12,301 29,708 82,704 53,081 1,35,785 63.16 Panchkula 15,648 9,854 25,502 7,926 5,015 12,941 23,574 14,869 38,443 63.43 Yamunanagar 65,338 40,851 1,06,189 17,378 11,280 28,658 82,716 52,131 1,34,847 62.88 Kurukshetra 41,617 24,898 66,515 8,447 5,286 13,733 50,064 30,184 80,248 56.94 Kaithal 41,642 20,550 62,192 8,158 4,547 12,705 49,800 25,097 74,897 44.68 Karnal 59,524 32,935 92,459 16,191 10,142 26,333 75,715 43,077 1,18,792 53.78 Panipat 32,948 17,084 50,032 13,292 7,419 20,711 46,240 24,503 70,743 56.69 Sonipat 59,639 32,272 91,911 17,002 10,311 27,313 76,641 42,583 1,19,224 62.33 Rohtak 39,090 20,878 59,968 17,689 10,776 28,465 56,779 31,654 88,433 59.46 Jhajjar 41,447 22,053 63,500 11,171 6,754 17,925 52,618 28,807 81,425 62.51 Faridabad 54,750 24,124 78,874 40,105 20,076 60,181 94,855 44,200 1,39,055 55.85 Gurgaon 47,079 25,279 72,358 15,738 9,572 25,310 62,817 34,851 97,668 63.98 Rewari 44,303 24,323 68,626 8,579 5,211 13,790 52,882 29,534 82,416 68.69 Mahendragarh 39,567 21,668 61,235 5,400 2,966 8,366 44,967 24,634 69,601 63.64 Bhiwani 68,289 34,924 1,03,213 16,754 9,583 26,337 85,043 44,507 1,29,550 56.26 Jind 51,721 25,115 76,836 11,105 6,410 17,515 62,826 31,525 94,351 48.95 Hisar 70,384 34,238 1,04,622 21,285 11,969 33,254 91,669 46,207 1,37,876 49.83 Fatehabad 41,814 20,791 62,605 6,979 4,186 11,165 48,793 24,977 73,770 41.01 Sirsa 48,632 26,401 75,033 16,221 9,624 25,845 64,853 36,025 1,00,878 41.39 Total 9,28,729 4,99,018 14,27,747 2,76,827 1,63,428 4,40,255 12,05,556 6,62,446 18,68,002 55.45
Source : Director of Census Operations, Haryana. * Exclusive of children in the age group of 0—6 years.

76
AREA AND POPULATION Disabled Population by District : 2001
No. 3.26 District In seeing In speech In Hearing In Movement Mental Total
1 2 3 4 5 6 7 Ambala 8,293 1,319 987 6,783 2,998 20,380Panchkula 4,618 646 522 2,705 1,249 9,740Yamunanagar 9,667 1,346 1,259 7,066 3,235 22,573Kurukshetra 9,135 1,005 989 6,757 2,545 20,431Kaithal 7,025 1,233 1,388 8,609 2,167 20,422Karnal 11,109 1,431 1,550 10,102 3,219 27,411Panipat 8,145 1,038 957 6,314 2,147 18,601Sonipat 16,210 1,580 1,506 8,773 2,880 30,949Rohtak 5,532 1,020 1,055 6,074 2,183 15,864Jhajjar 5,997 966 1,290 6,001 1,856 16,110Faridabad 17,272 1,988 2,232 12,198 3,794 37,484Gurgaon 12,087 1,875 2,243 10,541 2,998 29,744Rewari 6,334 828 1,120 5,190 1,736 15,208Mahendragarh 7,669 1,037 1,604 6,867 1,735 18,912Bhiwani 10,650 1,742 2,255 9,978 3,239 27,864Jind 15,205 1,425 1,683 10,019 2,775 31,107Hisar 13,608 1,777 2,107 11,123 3,689 32,304Fatehabad 13,939 1,093 1,277 7,161 2,154 25,624Sirsa 18,863 1,571 1,658 9,224 2,996 34,312Total 2,01,358 24,920 27,682 1,51,485 49,595 4,55,040
Source : Director of Census Operations, Haryana.

77
AREA AND POPULATION Area and Population in Various States in India according to 2011(P) Census
No. 3.27 Percentage of
Literacy State Area in sq.
Km. Populatiion
Percentage increase
2001-2011
Females per 1,000
Males
Persons per Sq.
Kilometre Male Female 1 2 3 4 5 6 7 8
India 32,87,240 1,21,01,93,422 17.65 940 383 82.14 65.46Andhra Pradesh 2,75,045 8,46,65,533 11.09 992 308 75.76 59.74Arunachal Pradesh
83,743 13,82,611 25.92 920 17 73.69 59.57
Assam 78,438 3,11,69,272 16.93 954 397 78.81 67.27Bihar 94,163 10,38,04,637 25.07 916 1,102 73.39 53.33Chhatisgarh 1,35,191 2,55,40,196 22.59 991 189 81.45 60.59Goa 3,702 14,57,723 8.17 968 394 92.81 81.84Gujarat 1,96,024 6,03,83,628 19.17 918 308 87.23 70.73Haryana 44,212 2,53,53,081 19.90 877 573 85.38 66.77Himachal Pradesh 55,673 68,56,509 12.81 974 123 90.83 76.60Jammu & Kashmir
2,22,236 1,25,48,926 23.71 883 124 78.26 58.01
Jharkhand 79,714 3,29,66,238 22.34 947 414 78.45 56.21Karnataka 1,91,791 6,11,30,704 15.67 968 319 82.85 68.13Kerala 38,863 3,33,87,677 4.86 1084 859 96.02 91.98Madhya Pradesh 3,08,245 7,25,97,565 20.30 930 236 80.43 60.02Maharashtra 3,07,713 11,23,72,972 15.99 925 365 89.82 75.48Manipur* 22,327 27,21,756 25.61 987 122 86.49 73.17Meghalaya 22,429 29,64,007 27.82 986 132 77.17 73.78Mizoram 21,081 10,91,014 22.78 975 52 93.72 89.40Nagaland 16,579 19,80,602 (–)0.47 931 119 83.29 76.69Orissa 1,55,707 4,19,47,358 13.97 978 269 82.40 64.36Punjab 50,362 2,77,04,236 13.73 893 550 81.48 71.34Rajasthan 3,42,239 6,86,21,012 21.44 926 201 80.51 52.66Sikkim 7,096 6,07,688 12.36 889 86 87.29 76.43Tamil Nadu 1,30,058 7,21,38,958 15.60 995 555 86.81 73.86Tripura 10,486 36,71,032 14.75 961 350 92.18 83.15Uttar Pradesh 2,40,928 19,95,81,477 20.09 908 828 79.24 59.26Uttrakhand 53,483 1,01,16,752 19.17 963 189 88.33 70.70West Bengal 88,752 9,13,47,736 13.97 947 1029 82.67 71.16

78
AREA AND POPULATION Area and Population in Various States in India according to 2011 Census
No. 3.27 ( Concld.) Percentage of Literacy
State Area in Sq. Km.
Populatiion Percentage increase
2001-2011
Females per 1,000
Males
Persons per Sq.
Kilometre Male Female
1 2 3 4 5 6 7 8 Andaman & Nicobar Island’s
8,249 3,79,944 6.68 878 46 90.11 81.84
Chandigarh 114 10,54,686 17.10 818 9252 90.54 81.38Dadra & Nagar Haveli 491 342853 55.50 775 698 86.46 65.93Daman & Diu 112 2,42,911 53.54 618 2,169 91.48 79.59Delhi 1,483 1,67,53,235 20.96 866 11,297 91.03 80.93Lakshadweep 32 64,429 6.23 946 2,013 96.11 88.25Puducherry 479 12,44,464 27.72 1038 25.98 92.12 81.22
Source :—Director of Census Operations, Haryana.
* Excluding the population of Mao Marum, Paomata and Purul subdivisions of senapati district.
R—Revised.
P--Provisional

79
AREA AND POPULATION Working Population according to 2001 census (By States)
No. 3.28
Serial No. India/State/Union
Territory Persons (i) Males (ii)
Females (iii)
Total Population
Main Workers Percentage of main Workers to total
Population 1991* 2001 1 2 3 4 5 6 7 India (i) 1,02,86,10,328 31,30,04,983 34.10(R) 30.43 (ii) 53,21,56,772 24,01,47,813 50.93(R) 45.13 (iii) 49,64,53,556 7,28,57,170 15.93(R) 14.67
States— 1. Andhra Pradesh (i) 7,62,10,007 2,90,40,873 42.77 38.11 (ii) 3,85,27,413 1,94,55,492 55.13 50.50 (iii) 3,76,82,594 95,85,381 30.05 25.44
2. Arunachal Pradesh (i) 10,97,968 4,15,007 45.22 37.80 (ii) 5,79,941 2,67,384 53.52 46.10 (iii) 5,18,027 1,47,623 35.56 28.50
3. Assam (i) 2,66,55,528 71,14,097 31.19 26.69 (ii) 1,37,77,037 58,49,032 48.38 42.45 (iii) 1,28,78,491 12,65,065 12.57 9.82
4. Bihar (i) 8,29,98,509 2,10,52,875 29.66 25.37 (ii) 4,32,43,795 1,75,11,018 47.59 40.49 (iii) 3,97,54,714 35,41,857 9.97 8.91
5. Chhatisgarh (i) 2,08,33,803 70,54,595 ** 33.86 (ii) 1,04,74,218 47,42,935 ** 45.28 (iii) 1,03,59,585 23,11,660 ** 22.31
6. Goa (i) 13,47,668 4,25,305 32.79 31.56 (ii) 6,87,248 3,26,993 48.28 47.58 (iii) 6,60,420 98,312 16.77 14.89
7. Gujarat (i) 5,06,71,017 1,70,25,074 34.12 33.60 (ii) 2,63,85,577 1,34,80,566 53.17 51.09 (iii) 2,42,85,440 35,44,508 13.73 14.60
8. Haryana (i) 2,11,44,564 62,41,324 28.66 29.52 (ii) 1,13,63,953 49,33,004 48.26 43.41 (iii) 97,80,611 13,08,320 6.01 13.38
9. Himachal Pradesh (i) 60,77,900 19,63,882 34.41 32.31 (ii) 30,87,940 13,33,361 49.08 43.18 (iii) 29,89,960 6,30,521 19.36 21.09
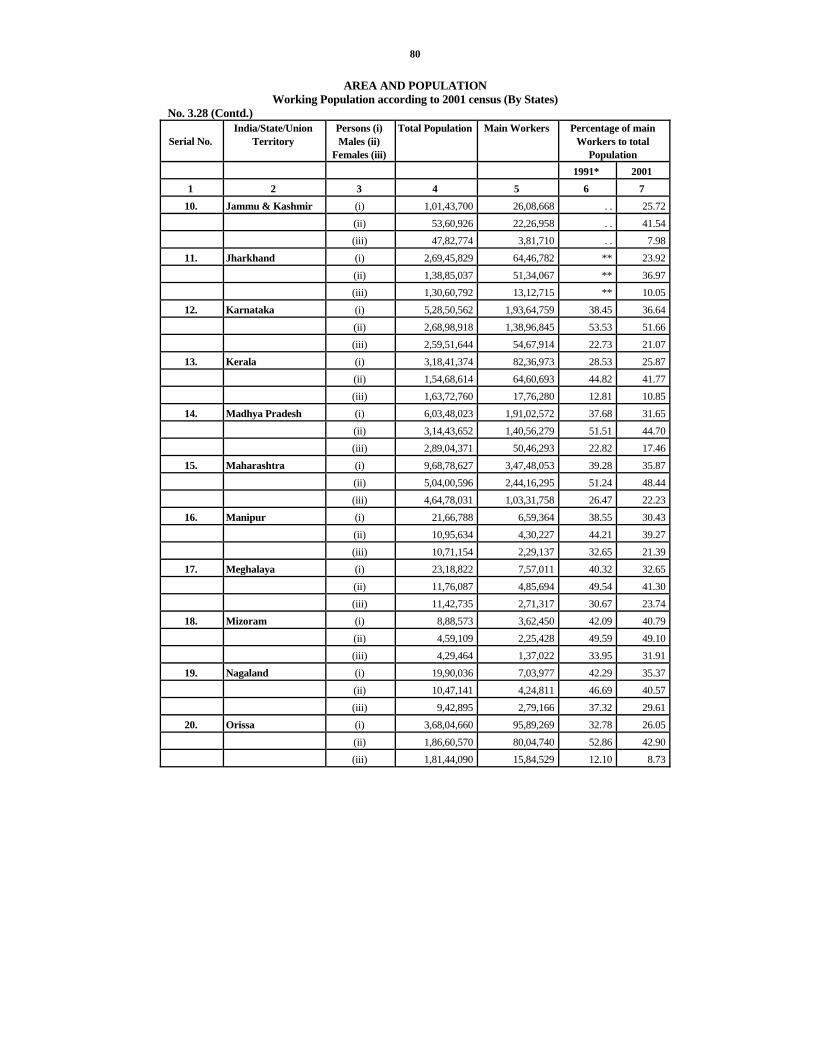
80
AREA AND POPULATION Working Population according to 2001 census (By States)
No. 3.28 (Contd.)
Serial No. India/State/Union
Territory Persons (i) Males (ii)
Females (iii)
Total Population Main Workers Percentage of main Workers to total
Population 1991* 2001 1 2 3 4 5 6 7
10. Jammu & Kashmir (i) 1,01,43,700 26,08,668 . . 25.72 (ii) 53,60,926 22,26,958 . . 41.54 (iii) 47,82,774 3,81,710 . . 7.98
11. Jharkhand (i) 2,69,45,829 64,46,782 ** 23.92 (ii) 1,38,85,037 51,34,067 ** 36.97 (iii) 1,30,60,792 13,12,715 ** 10.05
12. Karnataka (i) 5,28,50,562 1,93,64,759 38.45 36.64 (ii) 2,68,98,918 1,38,96,845 53.53 51.66 (iii) 2,59,51,644 54,67,914 22.73 21.07
13. Kerala (i) 3,18,41,374 82,36,973 28.53 25.87 (ii) 1,54,68,614 64,60,693 44.82 41.77 (iii) 1,63,72,760 17,76,280 12.81 10.85
14. Madhya Pradesh (i) 6,03,48,023 1,91,02,572 37.68 31.65 (ii) 3,14,43,652 1,40,56,279 51.51 44.70 (iii) 2,89,04,371 50,46,293 22.82 17.46
15. Maharashtra (i) 9,68,78,627 3,47,48,053 39.28 35.87 (ii) 5,04,00,596 2,44,16,295 51.24 48.44 (iii) 4,64,78,031 1,03,31,758 26.47 22.23
16. Manipur (i) 21,66,788 6,59,364 38.55 30.43 (ii) 10,95,634 4,30,227 44.21 39.27 (iii) 10,71,154 2,29,137 32.65 21.39
17. Meghalaya (i) 23,18,822 7,57,011 40.32 32.65 (ii) 11,76,087 4,85,694 49.54 41.30 (iii) 11,42,735 2,71,317 30.67 23.74
18. Mizoram (i) 8,88,573 3,62,450 42.09 40.79 (ii) 4,59,109 2,25,428 49.59 49.10 (iii) 4,29,464 1,37,022 33.95 31.91
19. Nagaland (i) 19,90,036 7,03,977 42.29 35.37 (ii) 10,47,141 4,24,811 46.69 40.57 (iii) 9,42,895 2,79,166 37.32 29.61
20. Orissa (i) 3,68,04,660 95,89,269 32.78 26.05 (ii) 1,86,60,570 80,04,740 52.86 42.90 (iii) 1,81,44,090 15,84,529 12.10 8.73

81
AREA AND POPULATION Working Population according to 2001 census (By States)
No. 3.28 (Contd.)
Serial No. India/State/Union
Territory Persons (i) Males (ii)
Females (iii)
Total Population
Main Workers
Percentage of main Workers to total
Population 1991* 2001 1 2 3 4 5 6 7
21. Punjab (i) 2,43,58,999 78,35,732 30.07 32.17 (ii) 1,29,85,045 64,26,028 54.12 49.49 (iii) 1,13,73,954 14,09,704 2.79 12.39
22. Rajasthan (i) 5,65,07,188 1,74,36,888 31.62 30.86 (ii) 2,94,20,011 1,28,41,318 48.53 43.65 (iii) 2,70,87,177 45,95,570 13.04 16.96
23. Sikkim (i) 5,40,851 2,12,904 40.45 39.36 (ii) 2,88,484 1,46,541 50.82 50.80 (iii) 2,52,367 66.363 28.63 26.29
24. Tamil Nadu (i) 6,24,05,679 2,37,57,783 40.81 38.07 (ii) 3,14,00,909 1,63,03,310 56.10 51.92 (iii) 3,10,04,770 74,54,473 25.13 24.04
25. Tripura (i) 31,99,203 9,12,292 29.09 28.52 (ii) 16,42,225 7,42,054 46.99 45.18 (iii) 15,56,978 1,70,238 10.14 10.93
26. Uttar Pradesh (i) 16,61,97,921 3,93,37,649 29.73 23.67 (ii) 8,75,65,369 3,43,38,260 49.31 39.21 (iii) 7,86,32,552 49,99,389 7.45 6.36
27. Uttrakhand (i) 84,89,349 23,22,347 ** 27.36 (ii) 43,25,924 16,39,242 ** 37.89 (iii) 41,63,425 6,83,105 ** 16.41
28. West Bengal (i) 8,01,76,197 2,30,23,583 30.23 28.72 (ii) 4,14,65,985 1,94,94,971 50.66 47.01 (iii) 3,87,10,212 35,28,612 7.96 9.11
Union Territories — 1. Andaman & Nicobar
Island’s (i) 3,56,152 1,13,607 32.35 31.90
(ii) 1,92,972 97,349 52.25 50.45 (iii) 1,63,180 16,258 8.03 9.96
2. Chandigarh (i) 9,00,635 3,28,989 34.83 36.53 (ii) 5,06,938 2,77,050 54.24 54.65 (iii) 3,93,697 51,939 10.28 13.19
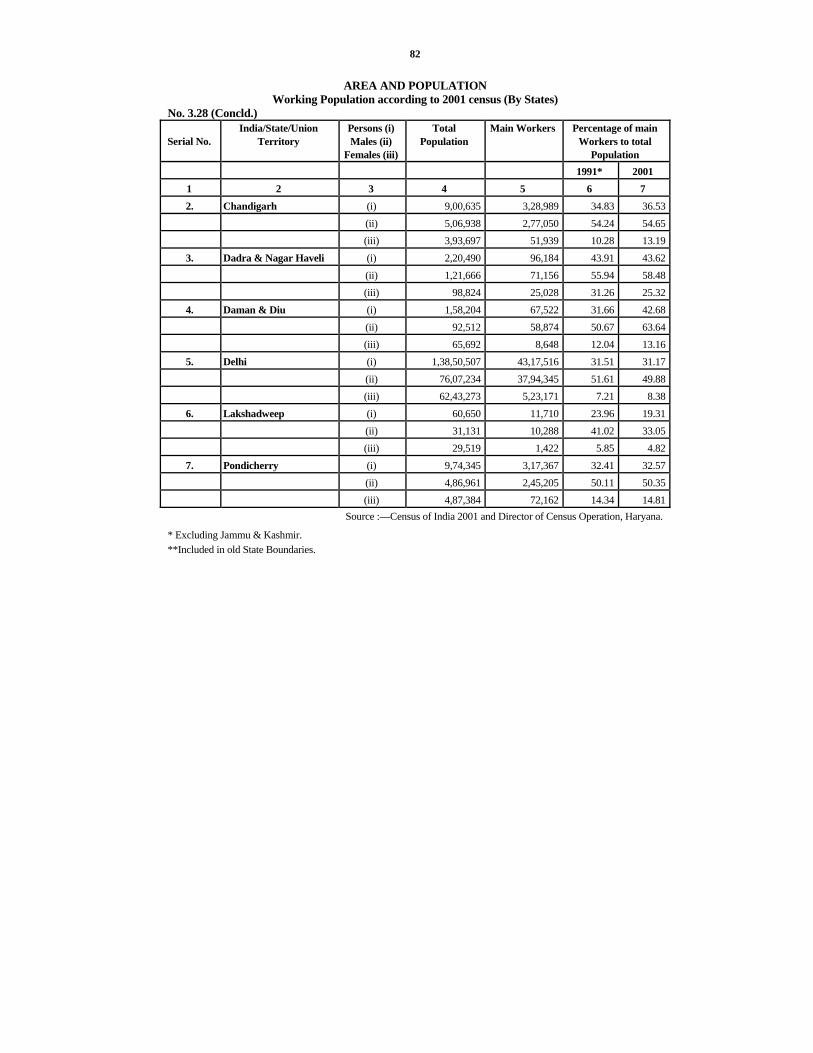
82
AREA AND POPULATION Working Population according to 2001 census (By States)
No. 3.28 (Concld.)
Serial No. India/State/Union
Territory Persons (i) Males (ii)
Females (iii)
Total Population
Main Workers Percentage of main Workers to total
Population 1991* 2001 1 2 3 4 5 6 7 2. Chandigarh (i) 9,00,635 3,28,989 34.83 36.53 (ii) 5,06,938 2,77,050 54.24 54.65 (iii) 3,93,697 51,939 10.28 13.19
3. Dadra & Nagar Haveli (i) 2,20,490 96,184 43.91 43.62 (ii) 1,21,666 71,156 55.94 58.48 (iii) 98,824 25,028 31.26 25.32
4. Daman & Diu (i) 1,58,204 67,522 31.66 42.68 (ii) 92,512 58,874 50.67 63.64 (iii) 65,692 8,648 12.04 13.16
5. Delhi (i) 1,38,50,507 43,17,516 31.51 31.17 (ii) 76,07,234 37,94,345 51.61 49.88 (iii) 62,43,273 5,23,171 7.21 8.38
6. Lakshadweep (i) 60,650 11,710 23.96 19.31 (ii) 31,131 10,288 41.02 33.05 (iii) 29,519 1,422 5.85 4.82
7. Pondicherry (i) 9,74,345 3,17,367 32.41 32.57 (ii) 4,86,961 2,45,205 50.11 50.35 (iii) 4,87,384 72,162 14.34 14.81
Source :—Census of India 2001 and Director of Census Operation, Haryana.
* Excluding Jammu & Kashmir. **Included in old State Boundaries.
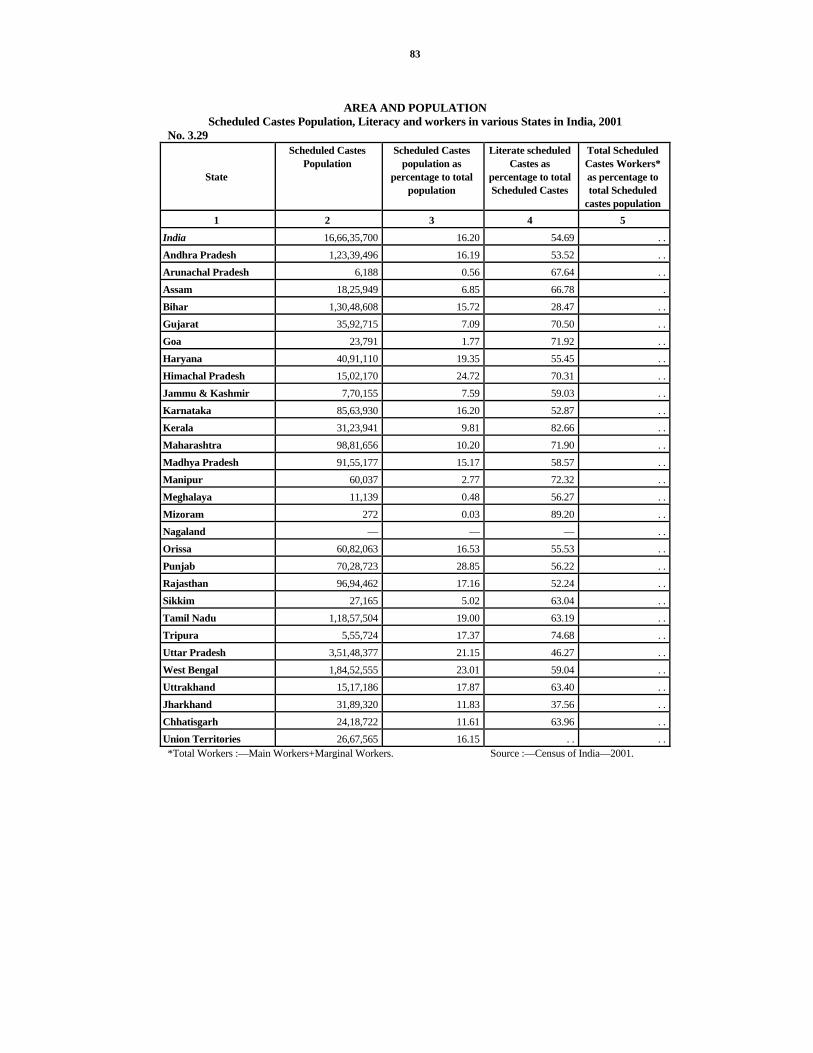
83
AREA AND POPULATION
Scheduled Castes Population, Literacy and workers in various States in India, 2001 No. 3.29
State
Scheduled Castes Population
Scheduled Castes population as
percentage to total population
Literate scheduled Castes as
percentage to total Scheduled Castes
Total Scheduled Castes Workers* as percentage to total Scheduled
castes population 1 2 3 4 5
India 16,66,35,700 16.20 54.69 . .Andhra Pradesh 1,23,39,496 16.19 53.52 . .Arunachal Pradesh 6,188 0.56 67.64 . .Assam 18,25,949 6.85 66.78 . Bihar 1,30,48,608 15.72 28.47 . .Gujarat 35,92,715 7.09 70.50 . .Goa 23,791 1.77 71.92 . .Haryana 40,91,110 19.35 55.45 . .Himachal Pradesh 15,02,170 24.72 70.31 . .Jammu & Kashmir 7,70,155 7.59 59.03 . .Karnataka 85,63,930 16.20 52.87 . .Kerala 31,23,941 9.81 82.66 . .Maharashtra 98,81,656 10.20 71.90 . .Madhya Pradesh 91,55,177 15.17 58.57 . .Manipur 60,037 2.77 72.32 . .Meghalaya 11,139 0.48 56.27 . .Mizoram 272 0.03 89.20 . .Nagaland — — — . .Orissa 60,82,063 16.53 55.53 . .Punjab 70,28,723 28.85 56.22 . .Rajasthan 96,94,462 17.16 52.24 . .Sikkim 27,165 5.02 63.04 . .Tamil Nadu 1,18,57,504 19.00 63.19 . .Tripura 5,55,724 17.37 74.68 . .Uttar Pradesh 3,51,48,377 21.15 46.27 . .West Bengal 1,84,52,555 23.01 59.04 . .Uttrakhand 15,17,186 17.87 63.40 . .Jharkhand 31,89,320 11.83 37.56 . .Chhatisgarh 24,18,722 11.61 63.96 . .Union Territories 26,67,565 16.15 . . . .*Total Workers :—Main Workers+Marginal Workers. Source :—Census of India—2001.

84
AREA AND POPULATION Estimated Population of Haryana
No. 3.30 (Population in 00)
Year First October
Year First October
Year First October
Year First October
Year First October**
1 2 3 4 5 6 7 8 9 10 1961-(Census)
75,905 1971 (Census)
1,00,364@ 1981 (Census)
1,29,226@@ 1991 (Census)
1,64,636* 2001 (Census)
2,11,446†
1961 77,149 1971 1,01,664 1981 1,31,065 1991 1.66.980 2001 2,14,670 1962 79,316 1972 1,04,291 1982 1,34,278 1992 1,71,110 2002 2,18,370 1963 81,545 1973 1,06,983 1983 1,37,569 1993 1,75,350 2003 2,22 730 1964 83,835 1974 1,09,744 1984 1,40,942 1994 1,79,730 2004 2,27,070 1965 86,190 1975 1,12,577 1985 1,44,397 1995 1,84,240 2005 2,31,400 1966 88,611 1976 1,15,482 1986 1,47,936 1996 1,88,890 2006 2,35,690 1967 91,102 1977 1,18,463 1987 1,51,562 1997 1,93,700 2007 2,39,970 1968 93,661 1978 1,21,521 1988 1,55,278 1998 1,98,670 2008 2,44,250 1969 96,292 1979 1,24,657 1989 1,59,084 1999 2,03,820 2009 2,48,490 1970 98,997 1980 1,27,875 1990 1,62,984 2000 2,09,140 2010 2,52,700
2011 2,56,860 @As on 1st April, 1971 Source :—Department of Economic and Statistical Analysis, Haryana. (Census 1971) @@As on 1st March, 1981 (Census 1981) *As on 1st March, 1991 (Census 1991) **Information have been supplied by Central Statistical Organisation Government of India. Note :— These annual estimates of population have been worked out on the basis of geometric rate of relevant inter-
Census periods. † As on 1st March, 2001 (Census 2001).

85
AREA AND POPULATION Estimated Population of Haryana (As on Ist October)
No. 3.31 (Populaion in 000) Census 2001 2001-02 2002-03 2003-04
District Population Density Population Density Population Density Population Density
1 2 3 4 5 6 7 8 9 Ambala 1,014 644 1,032 656 1,050 667 1,071 680Panchkula 468 522 483 538 491 547 501 558Yamunanagar 1,042 589 996 563 1,013 573 1,033 584Kurukshetra 826 540 841 550 856 559 873 571Kaithal 946 408 960 414 977 422 996 430Karnal 1,274 506 1,294 513 1,316 522 1,342 533Panipat 968 763 988 779 1,005 793 1,025 808Sonipat 1,279 603 1,297 611 1,319 622 1,345 634Rohtak 940 539 955 547 971 556 990 567Jhajjar 880 480 901 491 917 500 935 510Faridabad 2,195 1,020 2,252 1,047 2,291 1,065 2,337 1,086Gurgaon 1,660 612 1,699 626 1,728 637 1,763 650Rewari 765 480 777 487 790 496 806 506Mahendragarh 813 428 825 434 839 442 856 451Bhiwani 1,425 298 1,447 303 1,472 308 1,501 314Jind 1,190 440 1,208 447 1,229 455 1,254 464Hisar 1,537 386 1,563 392 1,590 399 1,622 407Fatehabad 806 318 819 323 833 328 850 335Sirsa 1,117 261 1,130 264 1,150 269 1,173 274Total 21,145 478 21,467 486 21,837 494 22,273 504

86
AREA AND POPULATION
Estimated Population of Haryana (As on Ist October) No. 3.31 (Populaion in 000)
2004-05 2005-06 2006-07 2007-08 District
Population Density Population Density Population Density Population Density
1 10 11 12 13 14 15 16 17
Ambala 1,092 694 1,113 707 1,134 720 1,155 734Panchkula 511 569 521 580 531 591 541 602Yamunanagar 1,053 596 1,073 607 1,093 618 1,113 630Kurukshetra 890 582 907 593 924 604 941 615Kaithal 1,015 438 1,034 446 1,053 454 1,072 463Karnal 1,368 543 1,394 553 1,420 563 1,446 574Panipat 1,045 824 1,065 840 1,085 856 1,105 871Sonipat 1,371 646 1,397 658 1,423 671 1,449 683Rohtak 1,009 578 1,028 589 1,047 600 1,066 611Jhajjar 953 520 971 529 989 539 1,007 549Faridabad 2,383 1,108 2,428 1,129 2,473 1,150 2,518 1,171Gurgaon 1,797 662 1,831 675 1,865 687 1,899 700Rewari 822 516 838 526 853 535 868 545Mahendragarh 873 460 890 469 906 477 922 486Bhiwani 1,530 320 1,559 326 1,588 332 1,617 338Jind 1,278 473 1,302 482 1,326 491 1,350 500Hisar 1,654 415 1,686 423 1,717 431 1,748 439Fatehabad 867 342 884 348 900 355 916 361Sirsa 1,196 280 1,219 285 1,242 290 1,264 296Total 22,707 514 23,140 523 23,569 533 23,997 543
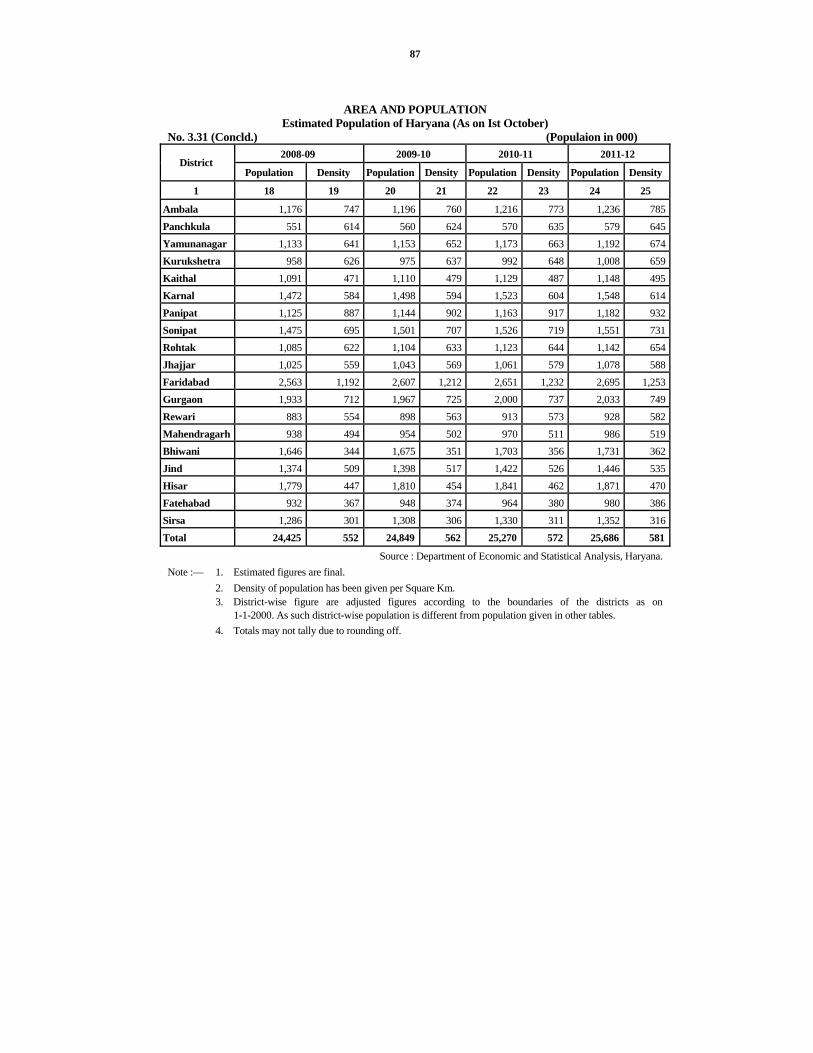
87
AREA AND POPULATION Estimated Population of Haryana (As on Ist October)
No. 3.31 (Concld.) (Populaion in 000)
2008-09 2009-10 2010-11 2011-12 District
Population Density Population Density Population Density Population Density
1 18 19 20 21 22 23 24 25
Ambala 1,176 747 1,196 760 1,216 773 1,236 785Panchkula 551 614 560 624 570 635 579 645Yamunanagar 1,133 641 1,153 652 1,173 663 1,192 674Kurukshetra 958 626 975 637 992 648 1,008 659Kaithal 1,091 471 1,110 479 1,129 487 1,148 495Karnal 1,472 584 1,498 594 1,523 604 1,548 614Panipat 1,125 887 1,144 902 1,163 917 1,182 932Sonipat 1,475 695 1,501 707 1,526 719 1,551 731Rohtak 1,085 622 1,104 633 1,123 644 1,142 654Jhajjar 1,025 559 1,043 569 1,061 579 1,078 588Faridabad 2,563 1,192 2,607 1,212 2,651 1,232 2,695 1,253Gurgaon 1,933 712 1,967 725 2,000 737 2,033 749Rewari 883 554 898 563 913 573 928 582Mahendragarh 938 494 954 502 970 511 986 519Bhiwani 1,646 344 1,675 351 1,703 356 1,731 362Jind 1,374 509 1,398 517 1,422 526 1,446 535Hisar 1,779 447 1,810 454 1,841 462 1,871 470Fatehabad 932 367 948 374 964 380 980 386Sirsa 1,286 301 1,308 306 1,330 311 1,352 316Total 24,425 552 24,849 562 25,270 572 25,686 581
Source : Department of Economic and Statistical Analysis, Haryana. Note :— 1. Estimated figures are final. 2. Density of population has been given per Square Km. 3. District-wise figure are adjusted figures according to the boundaries of the districts as on
1-1-2000. As such district-wise population is different from population given in other tables. 4. Totals may not tally due to rounding off.

88
AREA AND POPULATION Estimated Population of India (1st October)*
No. 3.32 (Population in 000) State/Union Territory 2001 2002 2003 2004 2005
1 2 3 4 5 6Andhra Pradesh 76,542 77,710 78,616 79,502 80,369Arunachal Pradesh 1,110 1,121 1,135 1,149 1,163Assam 26,873 27,317 27,719 28,114 28,506Bihar 84,385 85,568 87,131 88,662 90,162Chhattisgarh 20,969 21,412 21,764 22,111 22,455Goa 1,360 1,357 1,389 1,429 1,474Gujarat 51,349 52,079 52,944 53,798 54,642Haryana 21,467 21,837 22,273 22,707 23,140Himachal Pradesh 6,131 6,203 6,279 6,354 6,426Jammu & Kashmir 10,291 10,395 10,556 10,717 10,877Jharkhand 27,271 27,737 28,206 28,664 29,116Karnataka 53,321 53,969 54,654 55,327 55,992Kerala 31,972 32,303 32,591 32,875 33,154Madhya Pradesh 61,055 62,312 63,521 64,720 65,910Maharashtra 97,926 99,371 1,00,966 1,02,566 1,04,160Manipur 2,180 2,212 2,240 2,268 2,296Meghalaya 2,353 2,367 2,397 2,427 2,457Mizoram 900 907 919 930 942Nagaland 2,052 2,031 2,057 2,083 2,109Orissa 37,079 37,503 37,921 38,329 38,728Punjab 24,625 24,899 25,243 25,586 25,925Rajasthan 57,370 58,350 59,512 60,670 61,818Sikkim 552 552 559 566 573Tamil Nadu 62,742 63,332 63,883 64,416 64,933Tripura 3,206 3,265 3,307 3,349 3,390Uttar Pradesh 1,68,451 1,71,532 1,74,956 1,78,406 1,81,868Uttrakhand 8,578 8,720 8,866 9,013 9,160West Bengal 80,729 81,928 82,935 83,902 84,842Andaman & Nicobar Islands 359 372 385 399 413Chandigarh 921 935 977 1,026 1,080Dadra & Nagar Haveli 228 223 233 246 260Daman & Diu 164 178 190 201 212Delhi 14,150 14,526 14,952 15,386 15,831Lakshadweep 61 66 68 70 71Pondicherry 980 973 1,000 1,037 1,079India 10,39,701 10,55,563 10,72,344 10,89,007 11,05,535
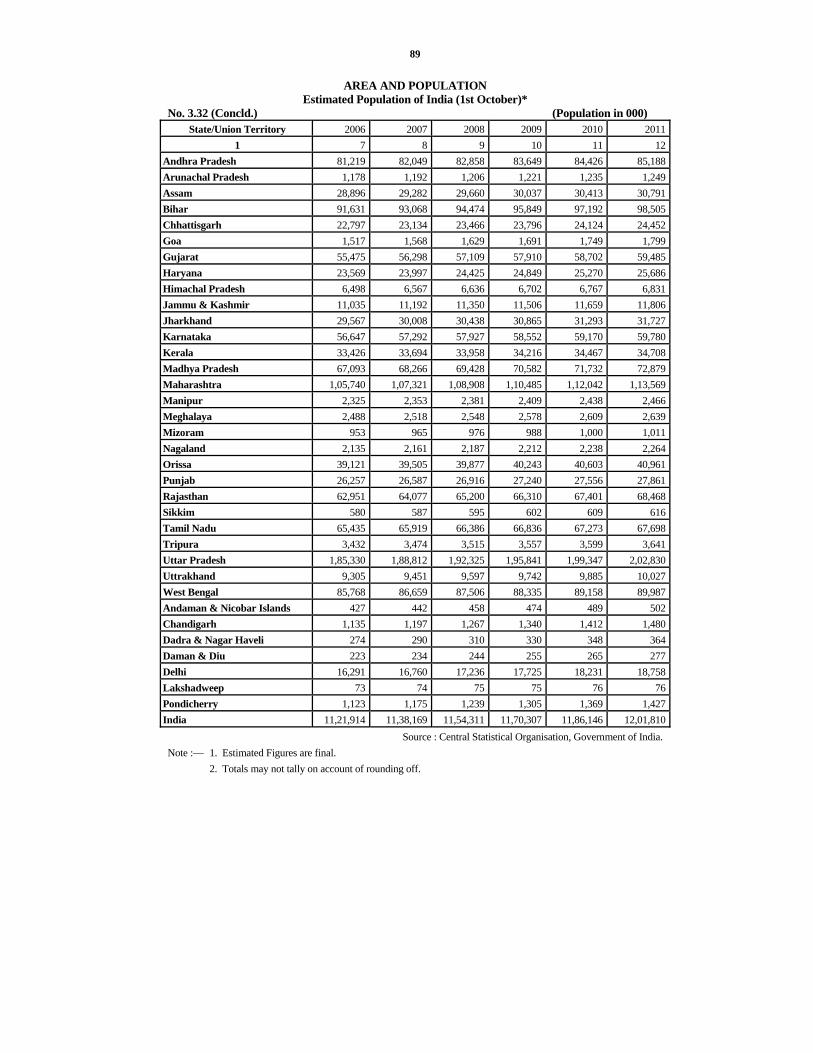
89
AREA AND POPULATION Estimated Population of India (1st October)*
No. 3.32 (Concld.) (Population in 000) State/Union Territory 2006 2007 2008 2009 2010 2011
1 7 8 9 10 11 12Andhra Pradesh 81,219 82,049 82,858 83,649 84,426 85,188Arunachal Pradesh 1,178 1,192 1,206 1,221 1,235 1,249Assam 28,896 29,282 29,660 30,037 30,413 30,791Bihar 91,631 93,068 94,474 95,849 97,192 98,505Chhattisgarh 22,797 23,134 23,466 23,796 24,124 24,452Goa 1,517 1,568 1,629 1,691 1,749 1,799Gujarat 55,475 56,298 57,109 57,910 58,702 59,485Haryana 23,569 23,997 24,425 24,849 25,270 25,686Himachal Pradesh 6,498 6,567 6,636 6,702 6,767 6,831Jammu & Kashmir 11,035 11,192 11,350 11,506 11,659 11,806Jharkhand 29,567 30,008 30,438 30,865 31,293 31,727Karnataka 56,647 57,292 57,927 58,552 59,170 59,780Kerala 33,426 33,694 33,958 34,216 34,467 34,708Madhya Pradesh 67,093 68,266 69,428 70,582 71,732 72,879Maharashtra 1,05,740 1,07,321 1,08,908 1,10,485 1,12,042 1,13,569Manipur 2,325 2,353 2,381 2,409 2,438 2,466Meghalaya 2,488 2,518 2,548 2,578 2,609 2,639Mizoram 953 965 976 988 1,000 1,011Nagaland 2,135 2,161 2,187 2,212 2,238 2,264Orissa 39,121 39,505 39,877 40,243 40,603 40,961Punjab 26,257 26,587 26,916 27,240 27,556 27,861Rajasthan 62,951 64,077 65,200 66,310 67,401 68,468Sikkim 580 587 595 602 609 616Tamil Nadu 65,435 65,919 66,386 66,836 67,273 67,698Tripura 3,432 3,474 3,515 3,557 3,599 3,641Uttar Pradesh 1,85,330 1,88,812 1,92,325 1,95,841 1,99,347 2,02,830Uttrakhand 9,305 9,451 9,597 9,742 9,885 10,027West Bengal 85,768 86,659 87,506 88,335 89,158 89,987Andaman & Nicobar Islands 427 442 458 474 489 502Chandigarh 1,135 1,197 1,267 1,340 1,412 1,480Dadra & Nagar Haveli 274 290 310 330 348 364Daman & Diu 223 234 244 255 265 277Delhi 16,291 16,760 17,236 17,725 18,231 18,758Lakshadweep 73 74 75 75 76 76Pondicherry 1,123 1,175 1,239 1,305 1,369 1,427India 11,21,914 11,38,169 11,54,311 11,70,307 11,86,146 12,01,810
Source : Central Statistical Organisation, Government of India. Note :— 1. Estimated Figures are final. 2. Totals may not tally on account of rounding off.
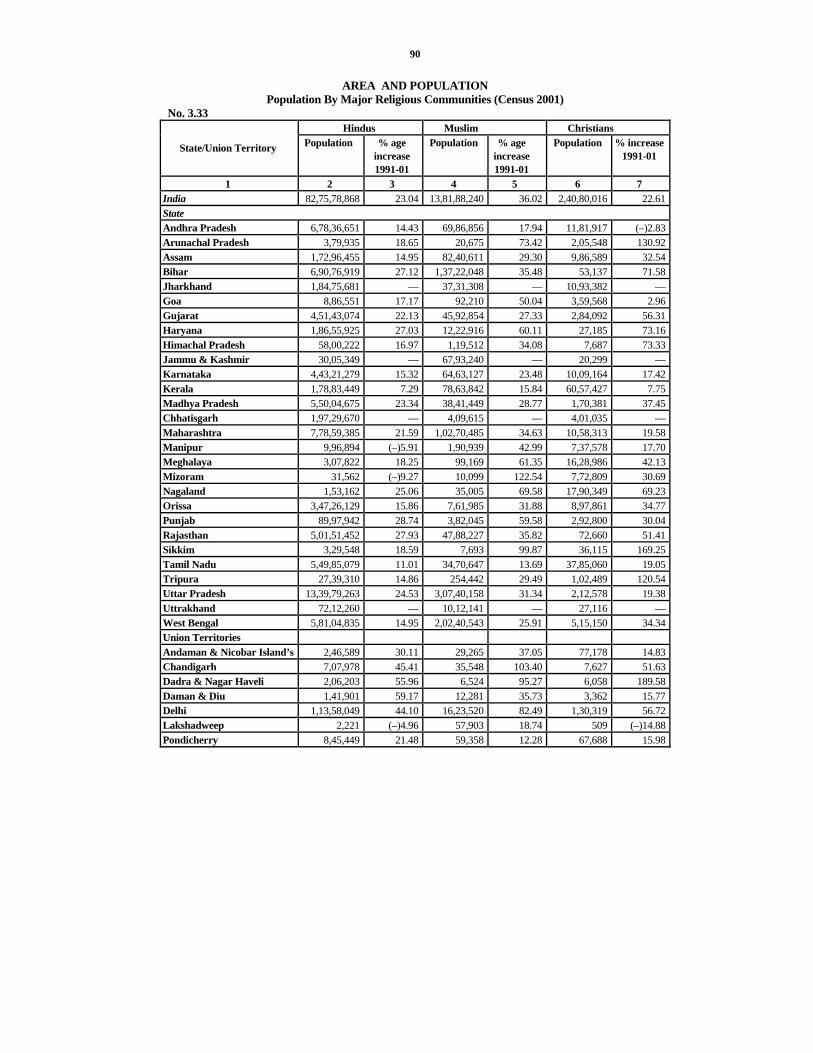
90
AREA AND POPULATION Population By Major Religious Communities (Census 2001)
No. 3.33 Hindus Muslim Christians
State/Union Territory Population % age increase 1991-01
Population % age increase 1991-01
Population % increase 1991-01
1 2 3 4 5 6 7 India 82,75,78,868 23.04 13,81,88,240 36.02 2,40,80,016 22.61State Andhra Pradesh 6,78,36,651 14.43 69,86,856 17.94 11,81,917 (–)2.83Arunachal Pradesh 3,79,935 18.65 20,675 73.42 2,05,548 130.92Assam 1,72,96,455 14.95 82,40,611 29.30 9,86,589 32.54Bihar 6,90,76,919 27.12 1,37,22,048 35.48 53,137 71.58Jharkhand 1,84,75,681 — 37,31,308 — 10,93,382 —Goa 8,86,551 17.17 92,210 50.04 3,59,568 2.96Gujarat 4,51,43,074 22.13 45,92,854 27.33 2,84,092 56.31Haryana 1,86,55,925 27.03 12,22,916 60.11 27,185 73.16Himachal Pradesh 58,00,222 16.97 1,19,512 34.08 7,687 73.33Jammu & Kashmir 30,05,349 — 67,93,240 — 20,299 —Karnataka 4,43,21,279 15.32 64,63,127 23.48 10,09,164 17.42Kerala 1,78,83,449 7.29 78,63,842 15.84 60,57,427 7.75Madhya Pradesh 5,50,04,675 23.34 38,41,449 28.77 1,70,381 37.45Chhatisgarh 1,97,29,670 — 4,09,615 — 4,01,035 —Maharashtra 7,78,59,385 21.59 1,02,70,485 34.63 10,58,313 19.58Manipur 9,96,894 (–)5.91 1,90,939 42.99 7,37,578 17.70Meghalaya 3,07,822 18.25 99,169 61.35 16,28,986 42.13Mizoram 31,562 (–)9.27 10,099 122.54 7,72,809 30.69Nagaland 1,53,162 25.06 35,005 69.58 17,90,349 69.23Orissa 3,47,26,129 15.86 7,61,985 31.88 8,97,861 34.77Punjab 89,97,942 28.74 3,82,045 59.58 2,92,800 30.04Rajasthan 5,01,51,452 27.93 47,88,227 35.82 72,660 51.41Sikkim 3,29,548 18.59 7,693 99.87 36,115 169.25Tamil Nadu 5,49,85,079 11.01 34,70,647 13.69 37,85,060 19.05Tripura 27,39,310 14.86 254,442 29.49 1,02,489 120.54Uttar Pradesh 13,39,79,263 24.53 3,07,40,158 31.34 2,12,578 19.38Uttrakhand 72,12,260 — 10,12,141 — 27,116 —West Bengal 5,81,04,835 14.95 2,02,40,543 25.91 5,15,150 34.34Union Territories Andaman & Nicobar Island’s 2,46,589 30.11 29,265 37.05 77,178 14.83Chandigarh 7,07,978 45.41 35,548 103.40 7,627 51.63Dadra & Nagar Haveli 2,06,203 55.96 6,524 95.27 6,058 189.58Daman & Diu 1,41,901 59.17 12,281 35.73 3,362 15.77Delhi 1,13,58,049 44.10 16,23,520 82.49 1,30,319 56.72Lakshadweep 2,221 (–)4.96 57,903 18.74 509 (–)14.88Pondicherry 8,45,449 21.48 59,358 12.28 67,688 15.98

91
AREA AND POPULATION Population By Major Religious Communities (Census 2001)
No. 3.33 (Contd.) Sikhs Budhists Jains
State/Union Territory Population % age increase 1991-01
Population % age increase 1991-01
Population % age increase 1991-01
1 8 9 10 11 12 13 India 1,92,15,730 18.18 79,55,207 24.54 42,25,053 26.02State Andhra Pradesh 30,998 41.48 32,037 44.62 41,846 57.53Arunachal Pradesh 1,865 54.77 1,43,028 28.42 216 237.50Assam 22,519 36.54 51,029 (–)20.28 23,957 16.04Bihar 20,780 66.85 18,818 807.77 16,085 41.94Jharkhand 83,358 — 5,940 — 16,301 —Goa 970 (–)10.76 649 170.42 820 68.38Gujarat 45,587 37.96 17,829 53.50 5,25,305 6.91Haryana 11,70,662 22.35 7,140 246.94 57,167 61.96Himachal Pradesh 72,355 39.01 75,859 18.38 1,408 16.75Jammu & Kashmir 2,07,154 — 1,13,787 — 2,518 —Karnataka 15,326 51.73 3,93,300 438.68 4,12,659 26.54Kerala 2,762 24.19 2,027 808.97 4,528 24.36Madhya Pradesh 1,50,772 36.44 2,09,322 24.58 5,45,446 21.99Chhatisgarh 69,621 — 65,267 — 56,103 —Maharashtra 2,15,337 33.60 58,38,710 15..83 13,01,843 34.79Manipur 1,653 27.06 1,926 170.89 1,461 9.27Meghalaya 3,110 19.07 4,703 60.29 772 73.48Mizoram 326 9.03 70,494 30.49 179 4375.00Nagaland 1,152 57.38 1,356 133.39 2,093 74.13Orissa 17,492 1.13 9,863 7.76 9,154 45.26Punjab 1,45,92,387 14.29 41,487 66.41 39,276 89.16Rajasthan 8,18,420 26.07 10,335 131.36 650,493 15.58Sikkim 1,176 213.60 1,52,042 37.76 183 357.50Tamil Nadu 9,545 75.17 5,393 153.43 83,359 24.60Tripura 1,182 59.73 98,922 (–)22.87 477 58.47Uttar Pradesh 6,78,059 35.88 3,02,031 44.80 2,07,111 23.00Uttrakhand 2,12,025 — 12,434 — 9,249 —West Bengal 66,391 19.86 2,43,364 19.54 55,223 60.74Union Territories Andaman & Nicobar Island’s 1,587 17.56 421 30.75 23 35.29Chandigarh 1,45,175 11.43 1,332 90.56 2,592 69.30Dadra & Nagar Haveli 123 515.00 457 128.50 864 63.33Daman & Diu 145 43.56 126 306.45 268 26.42Delhi 5,55,602 21.93 23,705 70.47 1,55,122 63.85Lakshadweep 6 600.00 1 0.0 — —Pondicherry 108 272.41 73 87.18 952 102.55
AREA AND POPULATION
Population By Major Religious Communities (Census 2001) No. 3.33 (Concld.)
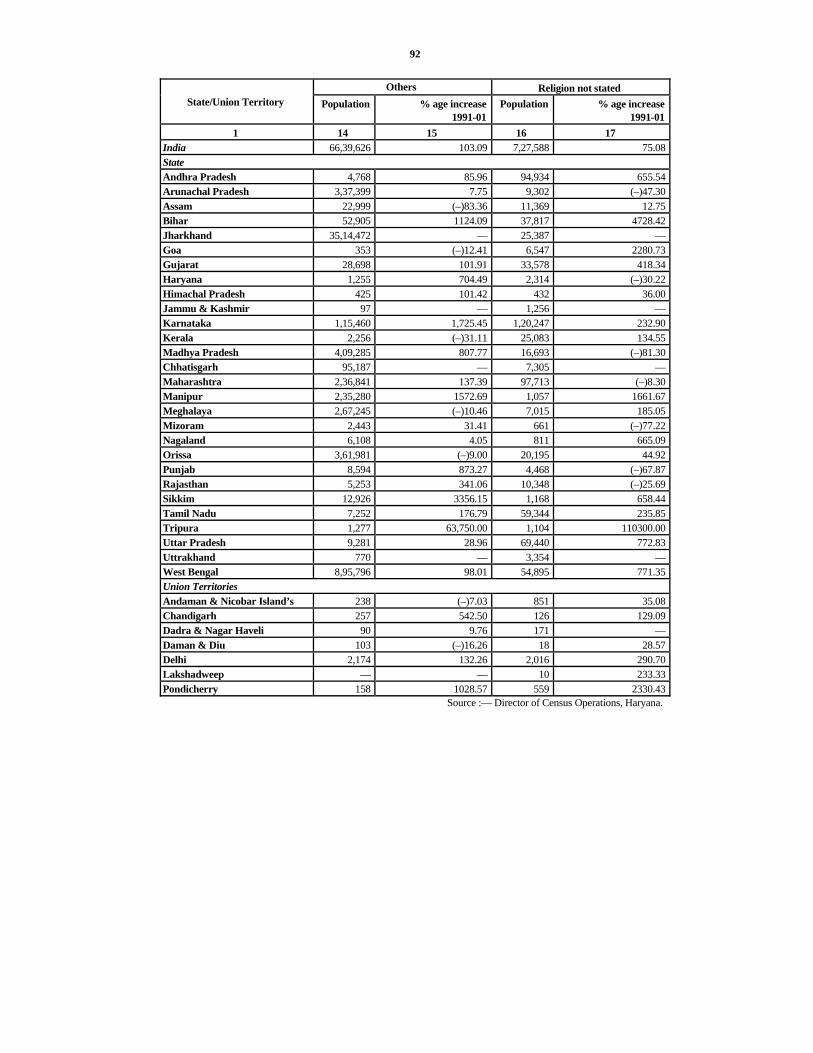
92
Others Religion not stated State/Union Territory Population % age increase
1991-01 Population % age increase
1991-011 14 15 16 17
India 66,39,626 103.09 7,27,588 75.08State Andhra Pradesh 4,768 85.96 94,934 655.54Arunachal Pradesh 3,37,399 7.75 9,302 (–)47.30Assam 22,999 (–)83.36 11,369 12.75Bihar 52,905 1124.09 37,817 4728.42Jharkhand 35,14,472 — 25,387 —Goa 353 (–)12.41 6,547 2280.73Gujarat 28,698 101.91 33,578 418.34Haryana 1,255 704.49 2,314 (–)30.22Himachal Pradesh 425 101.42 432 36.00Jammu & Kashmir 97 — 1,256 —Karnataka 1,15,460 1,725.45 1,20,247 232.90Kerala 2,256 (–)31.11 25,083 134.55Madhya Pradesh 4,09,285 807.77 16,693 (–)81.30Chhatisgarh 95,187 — 7,305 —Maharashtra 2,36,841 137.39 97,713 (–)8.30Manipur 2,35,280 1572.69 1,057 1661.67Meghalaya 2,67,245 (–)10.46 7,015 185.05Mizoram 2,443 31.41 661 (–)77.22Nagaland 6,108 4.05 811 665.09Orissa 3,61,981 (–)9.00 20,195 44.92Punjab 8,594 873.27 4,468 (–)67.87Rajasthan 5,253 341.06 10,348 (–)25.69Sikkim 12,926 3356.15 1,168 658.44Tamil Nadu 7,252 176.79 59,344 235.85Tripura 1,277 63,750.00 1,104 110300.00Uttar Pradesh 9,281 28.96 69,440 772.83Uttrakhand 770 — 3,354 —West Bengal 8,95,796 98.01 54,895 771.35Union Territories Andaman & Nicobar Island’s 238 (–)7.03 851 35.08Chandigarh 257 542.50 126 129.09Dadra & Nagar Haveli 90 9.76 171 —Daman & Diu 103 (–)16.26 18 28.57Delhi 2,174 132.26 2,016 290.70Lakshadweep — — 10 233.33Pondicherry 158 1028.57 559 2330.43
Source :— Director of Census Operations, Haryana.

93
AREA AND POPULATION Population of Scheduled Castes and Scheduled Tribes (Census 2001)
No. 3.34 Scheduled Castes
State/Union Territory Male Female Persons Rural Urban Percentage to
population of State/Union Territory
1 2 3 4 5 6 7India(1) (2) 8,60,88,760 8,05,46,940 16,66,35,700 13,30,10,878 3,36,24,822 16.20State Andhra Pradesh 62,28,011 61,11,485 1,23,39,496 1,02,19,409 21,20,087 16.19Arunachal Pradesh 3,590 2,598 6,188 3,062 3,126 0.56Assam 9,43,674 8,82,275 18,25,949 15,53,691 2,72,258 6.85Bihar 67,84,676 62,63,932 1,30,48,608 1,21,78,555 8,70,053 15.72Jharkhand 16,40,583 15,48,737 31,89,320 25,88,094 6,01,226 11.83Goa 12,047 11,744 23,791 10,720 13,071 1.77Gujarat 18,66,283 17,26,432 35,92,715 21,80,441 14,12,274 7.09Haryana 21,88,585 19,02,525 40,91,110 32,10,917 8,80,193 19.35Himachal Pradesh 7,63,333 7,38,837 15,02,170 14,03,050 99,120 24.72Jammu & Kashmir (2) 4,03,256 3,66,899 7,70,155 6,36,016 1,34,139 7.59Karnataka 43,39,745 42,24,185 85,63,930 64,17,243 21,46,687 16.20Kerala 15,25,114 15,98,827 31,23,941 25,53,725 5,70,216 9.81Madhya Pradesh 48,04,881 43,50,296 91,55,177 69,14,726 22,40,451 15.17Chhatisgarh 12,13,194 12,05,528 24,18,722 18,99,055 5,19,667 11.61Maharashtra 50,63,062 48,18,594 98,81,656 60,93,829 37,87,827 10.20Manipur 29,934 30,103 60,037 20,802 39,235 2.77Meghalaya 5,920 5,219 11,139 7,065 4,074 0.48Mizoram 212 60 272 65 207 0.03Nagaland Nil Nil Nil Nil Nil —Orissa 30,73,278 30,08,785 60,82,063 53,78,788 7,03,275 16.53Punjab 37,14,350 33,14,373 70,28,723 53,18,254 17,10,469 28.85Rajasthan 50,67,679 46,26,783 96,94,462 77,39,926 19,54,536 17.16Sikkim 13,807 13,358 27,165 23,872 3,293 5.02Tamil Nadu 59,32,925 59,24,579 1,18,57,504 83,08,890 35,48,614 19.00Tripura 2,83,186 2,72,538 5,55,724 4,55,623 1,00,101 17.37Uttar Pradesh 1,85,02,838 1,66,45,539 3,51,48,377 3,08,16,596 43,31,781 21.15Uttarakhand 7,80,772 7,36,414 15,17,186 12,56,122 2,61,064 17.87West Bengal 94,69,659 89,82,896 1,84,52,555 1,55,24,925 29,27,630 23.01Union Territory Andaman & Nicobar Island’s
Nil Nil Nil Nil Nil —
Chandigarh 86,187 71,410 1,57,597 14,740 1,42,857 17.50Dadra & Nagar Haveli 2,159 1,945 4,104 2,834 1,270 1.86Delhi 12,65,182 10,78,073 23,43,255 1,88,378 21,54,877 16.92Daman & Diu 2,498 2,340 4,838 2,920 1,918 3.06Lakshadweep Nil Nil Nil Nil Nil —Pondicherry 78,140 79,631 1,57,771 88,545 69,226 16.19

94
AREA AND POPULATION Population of Scheduled Castes and Scheduled Tribes (Census 2001)
No. 3.34 (Contd.) Scheduled Tribes
State/Union Territory
Male Female Persons Rural Urban Percentage to
population of
State/U.T.
Percentage of SC &ST
to population
of State/U.T.
1 8 9 10 11 12 13 14 India(1) (2) 4,26,40,829 4,16,85,411 8,43,26,240 7,73,38,597 69,87,643 8.20 24.40State Andhra Pradesh 25,48,295 24,75,809 50,24,104 46,46,923 3,77,181 6.59 22.78Arunachal Pradesh 3,52,017 3,53,141 7,05,158 6,06,278 98,880 64.22 64.78Assam 16,78,117 16,30,453 33,08,570 31,54,546 1,54,024 12.41 19.26Bihar 3,93,114 3,65,237 7,58,351 7,17,702 40,649 0,91 16.63Jharkhand 35,65,960 35,21,108 70,87,068 65,00,014 5,87,054 26.30 38.13Goa 299 267 566 190 376 0.04 1.81Gujarat 37,90,117 36,91,043 74,81,160 68,66,637 6,14,523 14.76 21.85Haryana Nil Nil Nil Nil Nil Nil 19.35Himachal Pradesh 1,22,549 1,22038 2,44,587 2,37,060 7,527 4.02 28.74Jammu & Kashmir (2) 5,78,949 5,27,030 11,05,979 10,54,488 51,491 10.90 18.49Karnataka 17,56,238 17,07,748 34,63,986 29,34,530 5,29,456 6.55 22.75Kerala 1,80,169 1,84,020 3,64,189 3,50,019 14,170 1.14 10.95Madhya Pradesh 61,95,240 60,38,234 1,22,33,474 1,14,46,448 7,87,026 20.27 35.44Chhatisgarh 32,87,334 33,29,262 66,16,596 62,64,835 3,51,761 31.76 43.37Maharashtra 43,47,754 42,29,522 85,77,276 74,86,537 10,90,739 8.85 19.05Manipur 3,74,319 3,66,822 7,41,141 7,05,912 35,229 34.20 36.97Meghalaya 9,96,567 9,96,295 19,92,862 16,82,670 3,10,192 85.94 86.42Mizoram 4,22,963 4,16,347 8,39,310 4,30,883 4,08,427 94.46 94.49Nagaland 9,13,203 8,60,823 17,74,026 15,44,022 2,30,004 89.14 89.14Orissa 40,66,783 40,78,298 81,45,081 76,98,358 4,46,723 22.13 38.66Punjab Nil Nil Nil Nil Nil — 28.85Rajasthan 36,50,982 34,46,724 70,97,706 67,17,830 3,79,876 12.56 29.72Sikkim 56,940 54,465 1,11,405 1,01,909 9,496 20.60 25.62Tamil Nadu 3,28,917 3,22,404 6,51,321 5,51,143 1,00,178 1.04 20.04Tripura 5,04,320 4,89,106 9,93,426 9,67,997 25,429 31.05 48.42Uttar Pradesh 55,834 52,129 1,07,963 95,828 12,135 0.06 21.21Uttarakhand 1,31,334 1,24,795 2,56,129 2,40,209 15,920 3.02 20.89West Bengal 22,23,924 21,82,870 44,06,794 41,36,366 2,70,428 5.50 28.51
AREA AND POPULATION Population of Scheduled Castes and Scheduled Tribes (Census 2001)
No. 3.34 (Concld.) Scheduled Tribes
State/Union Territory Male Female Persons Rural Urban Percentage to
Percentage of SC &ST to

95
population of
State/U.T.
population of State/U.T.
1 8 9 10 11 12 13 14
Union Territory
Andaman & Nicobar Island’s
15,127 14,342 29,469 28,456 1,013 8.27 8.27
Chandigarh Nil Nil Nil Nil Nil — 17.50
Dadra & Nagar Haveli 67,663 69,562 1,37,225 1,27,410 9,815 62.23 64.09
Delhi Nil Nil Nil Nil Nil — 16.92
Daman & Diu 7,190 6,80713,997
11,188 2,809 8.84 11.90
Lakshadweep 28,611 28,710 57,321 32,209 25,112 94.51 94.51
Pondicherry Nil Nil Nil Nil Nil — 16.19Source : Census of India, 1991, (Series I, Paper I)
Notes :— (1) No castes were scheduled by the president of India for Nagaland, Andaman and Nikobar islands and lakshadweep.
(2) No Tribes were scheduled by President of India for Haryana, Jammu & Kashmir, Punjab, Chandigarh, Delhi & Pondicherry.

97
SECTION IV ENVIRONMENT STATISTICS (CLIMATE)
Meteorological data given in this section relate to average rainfall—districtwise.
The figures in this section have been obtained from the Director of Land Records, Haryana.
Table 4.1 gives districtwise monthly average rainfall figures for 2009.
Table 4.2 shows districtwise monthly normal rainfall figures—average of 5 years (2005-2009).
Table 4.3 gives the districtwise average annual rainfall.

98

99
ENVIRONMENT STATISTICS (CLIMATE) Monthly Average Rainfall by Districts : 2009
No. 4.1 (Millimetres) Monthly Rainfall
District January February March April May 1 2 3 4 5 6
Ambala 6.0 18.0 5.5 18.5 12.5Panchkula 2.0 46.2 0.0 6.0 8.0Yamunanagar 2.0 11.0 3.5 23.5 22.0Kurukshetra 4.0 5.5 2.0 15.5 1.0Kaithal 5.3 5.3 7.3 22.0 2.7Karnal 16.5 4.5 1.0 16.0 2.0Panipat 3.0 10.0 1.0 18.0 9.0Sonipat 0.0 19.0 13.0 30.5 27.0Rohtak 0.0 0.0 3.0 46.0 7.0Jhajjar 1.2 NR 6.0 3.8 3.2Faridabad 0.0 2.5 2.0 1.5 8.5Palwal 0.0 0.0 0.0 0.0 8.5Gurgaon 0.0 0.0 3.0 3.5 7.8Mewat 0.0 0.0 1.0 1.8 9.8Rewari 0.0 0.0 1.2 1.5 0.3Mahendragarh 3.0 1.5 14.5 1.0 7.5Bhiwani 1.0 4.4 4.6 8.2 5.4Jind 9.7 6.3 11.7 25.7 0.7Hisar 7.0 6.0 3.5 11.0 8.5Fatehabad 6.0 7.5 1.0 4.5 0.0Sirsa 5.5 6.0 8.0 10.0 0.0

100
ENVIRONMENT STATISTICS (CLIMATE) Monthly Average Rainfall by Districts : 2009
No. 4.1 (Concld.) (Millimetres)
Monthly Rainfall Annual
2008 District June July August September October November December Total
1 7 8 9 10 11 12 13 14 Ambala 26.5 182.5 147.5 331.5 21.0 0.0 0.0 769.5Panchkula 9.0 213.0 139.0 238.0 25.0 5.0 0.0 691.2Yamunanagar 14.0 266.5 249.0 342.0 4.5 0.0 0.0 938.0Kurukshetra 22.0 62.0 38.5 119.5 20.5 0.0 0.0 290.5Kaithal 0.7 116.3 10.0 61.3 3.0 0.0 0.0 233.9Karnal 14.5 161.0 31.5 280.5 0.0 0.0 0.0 527.5Panipat 18.0 208.0 103.0 180.0 0.0 0.0 0.0 550.0Sonipat 10.0 165.0 57.5 364.5 0.0 0.0 0.0 686.5Rohtak 13.0 123.0 32.5 152.5 0.0 0.0 0.0 377.0Jhajjar 14.0 105.4 97.8 221.2 0.0 0.0 0.0 452.6Faridabad 6.5 159.5 76.0 187.0 0.0 0.0 0.0 443.5Palwal 10.0 26.8 115.2 138.8 7.0 14.0 0.7 321.0Gurgaon 10.3 97.5 118.2 270.8 0.0 14.8 0.0 525.9Mewat 36.8 92.0 163.7 197.5 0.0 5.2 0.0 507.8Rewari 30.0 104.9 76.0 132.8 0.0 0.0 0.0 346.7Mahendragarh 96.9 76.4 130.8 59.5 0.0 2.6 0.0 393.7Bhiwani 26.4 48.4 52.8 96.4 0.0 0.0 0.0 247.6Jind 23.3 177.3 36.0 251.7 0.0 0.0 0.0 542.4Hisar 12.0 52.8 13.0 73.0 0.0 0.0 0.0 186.8Fatehabad 4.0 94.5 14.0 82.5 0.0 0.0 0.0 214.0Sirsa 12.5 6.5 3.5 20.5 0.0 0.0 0.0 72.5
Source : Director of Land Records, Haryana.

101
ENVIRONMENT STATISTICS (CLIMATE) Monthly Normal Rainfall by Districts Average of 5 years (2005-2009)
No. 4.2 (Millimetres) Monthly
District January February March April May
1 2 3 4 5 6 Ambala 16.3 68.2 59.5 12.2 35.2Panchkula 14.5 96.0 94.1 8.0 35.3Yamunanagar 19.9 54.7 42.1 22.6 26.6Kurukshetra 7.2 43.3 26.8 11.2 10.0Kaithal 8.0 57.5 30.7 15.6 28.3Karnal 18.8 36.3 23.3 9.0 31.8Panipat 7.3 22.5 27.7 8.0 13.8Sonipat 13.0 36.0 27.7 21.2 49.0Rohtak 3.0 32.0 24.1 35.6 24.2Jhajjar 1.8 43.7 28.0 8.0 29.1Faridabad 4.7 27.2 20.3 8.0 27.4Palwal 0.0 0.0 0.0 0.0 8.5Gurgaon 0.0 61.4 31.1 2.5 32.6Mewat 0.0 81.6 12.3 2.2 38.6Rewari 1.5 58.1 22.2 2.8 25.8Mahendragarh 7.6 37.1 21.5 8.7 23.9Bhiwani 3.2 31.6 24.5 7.8 25.5Jind 10.9 42.4 37.8 17.8 38.0Hisar 8.3 21.3 20.4 7.4 16.0Fatehabad 9.8 28.7 22.5 10.7 19.2Sirsa 6.6 26.1 30.1 8.8 11.0

102
ENVIRONMENT STATISTICS (CLIMATE) Monthly Normal Rainfall by Districts Average of 5 years (2005-2009)
No. 4.2 (Concld.) (Millimetres) Monthly Annual
District June July August September October November December Total
1 7 8 9 10 11 12 13 14 Ambala 139.9 275.4 212.0 145.5 18.0 3.0 3.7 988.9Panchkula 77.4 284.4 225.8 132.2 21.5 5.0 5.0 998.8Yamunanagar 235.0 264.8 146.5 138.8 12.1 3.2 7.5 973.8Kurukshetra 55.9 60.5 55.4 74.0 6.0 0.0 2.0 352.3Kaithal 81.6 107.3 46.0 119.8 3.0 4.0 0.3 502.3Karnal 47.4 104.8 62.0 131.9 7.5 5.0 0.0 477.8Panipat 60.4 146.3 74.4 144.2 0.0 7.0 0.0 511.6Sonipat 62.3 159.4 98.2 166.6 0.0 28.0 1.0 662.4Rohtak 60.6 123.2 71.9 121.9 0.0 6.5 17.0 520.0Jhajjar 74.8 136.0 92.2 128.9 0.0 0.0 0.0 542.5Faridabad 41.9 156.4 112.4 93.4 0.0 2.2 0.4 494.3Palwal 10.0 26.8 115.2 138.8 7.0 14.0 0.7 321.0Gurgaon 49.5 107.8 91.9 114.4 2.5 8.5 3.2 505.4Mewat 69.1 108.0 110.5 134.5 0.0 5.2 0.0 562.7Rewari 71.5 172.3 74.5 112.6 4.3 4.3 1.8 551.7Mahendragarh 172.7 108.7 68.9 98.0 18.6 2.5 3.7 571.9Bhiwani 56.2 88.8 77.0 71.2 1.6 2.9 1.8 392.1Jind 84.8 165.5 67.0 155.3 3.3 4.6 2.6 630.0Hisar 47.1 63.4 35.7 60.9 0.0 3.6 2.5 286.6Fatehabad 51.6 82.6 40.7 83.4 1.5 1.5 3.0 355.2Sirsa 50.2 41.0 22.9 31.2 4.7 1.6 2.7 236.9
Source : Director of Land Records, Haryana.
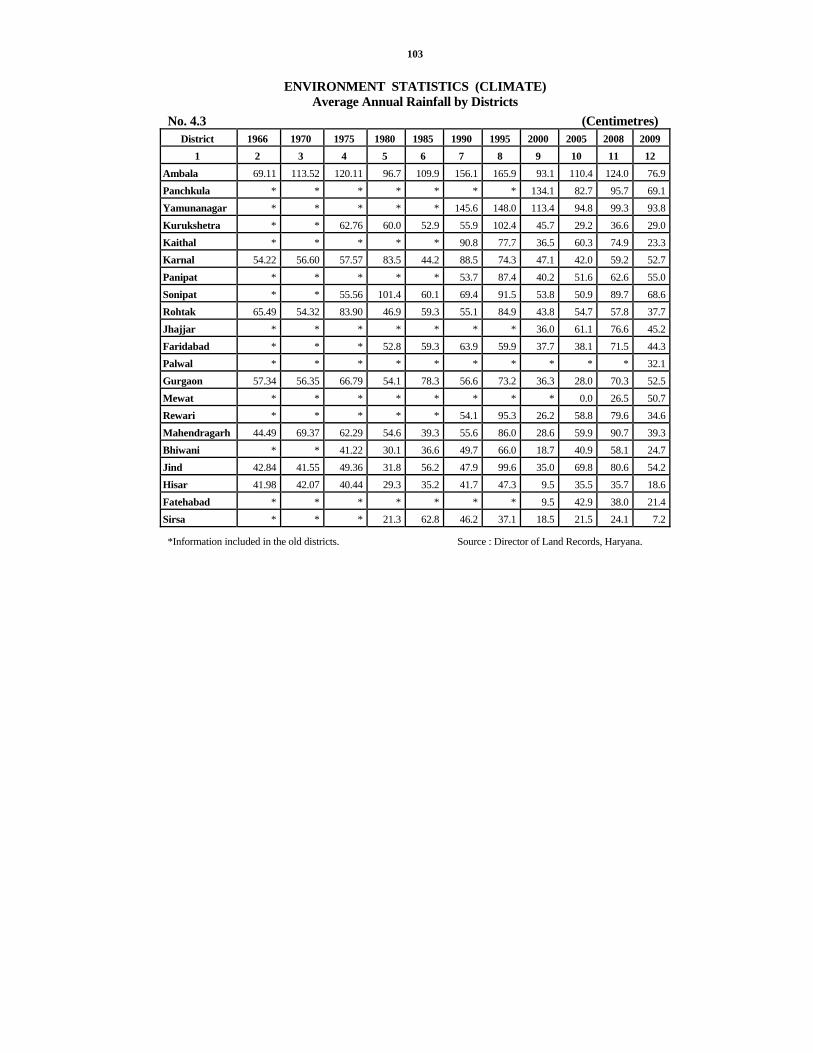
103
ENVIRONMENT STATISTICS (CLIMATE) Average Annual Rainfall by Districts
No. 4.3 (Centimetres) District 1966 1970 1975 1980 1985 1990 1995 2000 2005 2008 2009
1 2 3 4 5 6 7 8 9 10 11 12 Ambala 69.11 113.52 120.11 96.7 109.9 156.1 165.9 93.1 110.4 124.0 76.9Panchkula * * * * * * * 134.1 82.7 95.7 69.1Yamunanagar * * * * * 145.6 148.0 113.4 94.8 99.3 93.8Kurukshetra * * 62.76 60.0 52.9 55.9 102.4 45.7 29.2 36.6 29.0Kaithal * * * * * 90.8 77.7 36.5 60.3 74.9 23.3Karnal 54.22 56.60 57.57 83.5 44.2 88.5 74.3 47.1 42.0 59.2 52.7Panipat * * * * * 53.7 87.4 40.2 51.6 62.6 55.0Sonipat * * 55.56 101.4 60.1 69.4 91.5 53.8 50.9 89.7 68.6Rohtak 65.49 54.32 83.90 46.9 59.3 55.1 84.9 43.8 54.7 57.8 37.7Jhajjar * * * * * * * 36.0 61.1 76.6 45.2Faridabad * * * 52.8 59.3 63.9 59.9 37.7 38.1 71.5 44.3Palwal * * * * * * * * * * 32.1Gurgaon 57.34 56.35 66.79 54.1 78.3 56.6 73.2 36.3 28.0 70.3 52.5Mewat * * * * * * * * 0.0 26.5 50.7Rewari * * * * * 54.1 95.3 26.2 58.8 79.6 34.6Mahendragarh 44.49 69.37 62.29 54.6 39.3 55.6 86.0 28.6 59.9 90.7 39.3Bhiwani * * 41.22 30.1 36.6 49.7 66.0 18.7 40.9 58.1 24.7Jind 42.84 41.55 49.36 31.8 56.2 47.9 99.6 35.0 69.8 80.6 54.2Hisar 41.98 42.07 40.44 29.3 35.2 41.7 47.3 9.5 35.5 35.7 18.6Fatehabad * * * * * * * 9.5 42.9 38.0 21.4Sirsa * * * 21.3 62.8 46.2 37.1 18.5 21.5 24.1 7.2
*Information included in the old districts. Source : Director of Land Records, Haryana.

105
SECTION V VITAL STATISTICS
Vital Statistics—Registration of Births and Deaths is compulsory in Haryana State under Civil Registration Scheme and is governed by Registration of Births and Deaths Act, 1969 enacted by Government of India which was enforced in Haryana in 1970. In addition, information on birth and death rates is also collected under Sample Registration Scheme. The data collected under Sample Registration Scheme is more reliable because there is under-coverage in the Civil Registration Scheme.
The information in Table 5.1 is according to the Sample Registration Scheme whereas the data in Tables 5.2 to 5.7 on birth and death rates is according to the Civil Registration Scheme.
The Table 5.8 explains the estimated age specific death rate for Haryana and India.

106

BIRTHS AND DEATHS IN HARYANA SAMPLE REGISTRATION SCHEME
(Per Thousand)37
.2
35.7
31.9
29.9
26.9
26.3
25.1
24.3
23.4
22.7
38.0
5.76.
6
6.7
6.67.
1
7.58.18.4
9.1
11.212
.3
0.0
5.0
10.0
15.0
20.0
25.0
30.0
35.0
40.0
1975 1980 1985 1990 1995 2000 2003 2004 2005 2008 2009
Birth Death
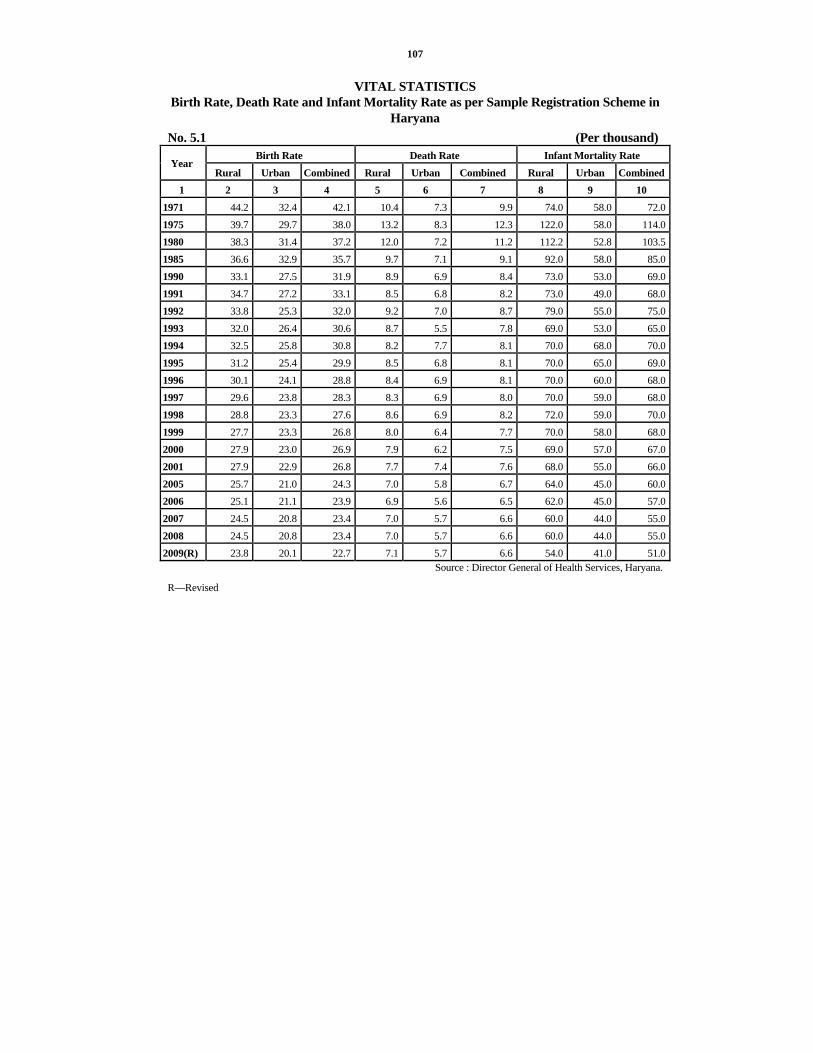
107
VITAL STATISTICS Birth Rate, Death Rate and Infant Mortality Rate as per Sample Registration Scheme in
Haryana No. 5.1 (Per thousand)
Birth Rate Death Rate Infant Mortality Rate Year
Rural Urban Combined Rural Urban Combined Rural Urban Combined1 2 3 4 5 6 7 8 9 10
1971 44.2 32.4 42.1 10.4 7.3 9.9 74.0 58.0 72.01975 39.7 29.7 38.0 13.2 8.3 12.3 122.0 58.0 114.01980 38.3 31.4 37.2 12.0 7.2 11.2 112.2 52.8 103.51985 36.6 32.9 35.7 9.7 7.1 9.1 92.0 58.0 85.01990 33.1 27.5 31.9 8.9 6.9 8.4 73.0 53.0 69.01991 34.7 27.2 33.1 8.5 6.8 8.2 73.0 49.0 68.01992 33.8 25.3 32.0 9.2 7.0 8.7 79.0 55.0 75.01993 32.0 26.4 30.6 8.7 5.5 7.8 69.0 53.0 65.01994 32.5 25.8 30.8 8.2 7.7 8.1 70.0 68.0 70.01995 31.2 25.4 29.9 8.5 6.8 8.1 70.0 65.0 69.01996 30.1 24.1 28.8 8.4 6.9 8.1 70.0 60.0 68.01997 29.6 23.8 28.3 8.3 6.9 8.0 70.0 59.0 68.01998 28.8 23.3 27.6 8.6 6.9 8.2 72.0 59.0 70.01999 27.7 23.3 26.8 8.0 6.4 7.7 70.0 58.0 68.02000 27.9 23.0 26.9 7.9 6.2 7.5 69.0 57.0 67.02001 27.9 22.9 26.8 7.7 7.4 7.6 68.0 55.0 66.02005 25.7 21.0 24.3 7.0 5.8 6.7 64.0 45.0 60.02006 25.1 21.1 23.9 6.9 5.6 6.5 62.0 45.0 57.02007 24.5 20.8 23.4 7.0 5.7 6.6 60.0 44.0 55.02008 24.5 20.8 23.4 7.0 5.7 6.6 60.0 44.0 55.02009(R) 23.8 20.1 22.7 7.1 5.7 6.6 54.0 41.0 51.0
Source : Director General of Health Services, Haryana.
R—Revised

108
VITAL STATISTICS
Number of Births and Sex Ratio as per Civil Registration Scheme in Haryana No. 5.2
Number of Births Total Year/District
Persons Males Females 1 2 3 4
1966 2,88,017 1,58,149 1,29,8681970 2,95,723 1,62,169 1,33,5541975 3,06,264 1,68,566 1,37,6981980 3,17,271 1,77,519 1,39,7521985 3,14,930 1,82,832 1,32,0981990 3,40,200 1,99,187 1,41,0131995 3,84,584 2,06,464 1,78,1202000 4,26,161 2,37,824 1,88,3372005 4,71,968 2,58,299 2,13,6692008 5,36,521 2,89,435 2,47,0862009 5,38,910 2,90,867 2,48,0432010 5,44,620 2,96,328 2,48,292Ambala 21431 11930 9501Panchkula 13241 7073 6168Yamunanagar 22924 12549 10375Kurukshetra 21349 12095 9254Kaithal 22382 12242 10140Karnal 32102 17650 14452Panipat 27025 14494 12531Sonipat 29062 16127 12935Rohtak 26971 14953 12018Jhajjar 14549 8062 6487Faridabad 39255 21027 18228Palwal 27627 14576 13051Gurgaon 32084 17430 14654Mewat 31675 16659 15016Rewari 19702 11150 8552Mahendragarh 16761 9454 7307Bhiwani 31315 17050 14265Jind 25798 13798 12000Hisar 39331 21205 18126Fatehabad 23151 12461 10690Sirsa 26885 14343 12542

109
VITAL STATISTICS Number of Births and Sex Ratio as per Civil Registration Scheme in Haryana
No. 5.2 (Concld.) Number of Births
Rural Urban Sex Ratio of Births (Males
per 100 Females) Year/District Persons Males Females Persons Males Females Total Rural Urban
1 5 6 7 8 9 10 11 12 13 1966 2,43,460 1,33,913 1,09,547 44,557 24,236 20,321 122 122 1191970 2,50,375 1,37,513 1,12,862 45,348 24,656 20,692 121 122 1191975 2,48,415 1,37,075 1,11,340 57,849 31,491 26,358 122 123 1191980 2,43,868 1,38,073 1,05,795 73,403 39,446 33,957 127 131 1161985 2,28,089 1,35,452 92,637 86,841 47,380 39,461 138 146 1201990 2,31,281 1,38,649 92,632 1,08,919 60,538 48,381 141 150 1251995 2,57,286 1,38,739 1,18,547 1,27,298 67,725 59,573 116 117 1142000 2,72,624 1,51,749 1,20,875 1,53,537 86,075 67,462 126 126 1282005 2,49,875 1,34,977 1,14,898 2,22,093 1,23,322 98,771 121 117 1252008 2,50,169 1,32,902 1,17,267 2,86,352 1,56,533 1,29,819 117 113 1212009 2,40,560 1,28,064 1,12,496 2,98,350 1,62,803 1,35,547 117 114 1202010 2,29,348 1,23,078 1,06,270 3,15,272 1,73,250 1,42,022 119 116 122Ambala 6503 3600 2903 14928 8330 6598 126 124 126Panchkula 2538 1345 1193 10703 5728 4975 115 113 115Yamunanagar 9296 4975 4321 13628 7574 6054 121 115 125Kurukshetra 6899 3825 3064 14450 8260 6190 131 125 133Kaithal 9834 5325 4509 12548 6917 5631 121 118 123Karnal 11197 6157 5040 20905 11493 9412 122 122 122Panipat 11528 6102 5426 15497 8392 7105 116 112 118Sonipat 11229 6137 5092 17833 9990 7843 125 121 127Rohtak 5146 2796 2350 21825 12157 9668 124 119 126Jhajjar 6436 3492 2944 8113 4570 3543 124 119 129Faridabad 7981 4198 3783 31274 16829 14445 115 111 117Palwal 16351 8477 7874 11276 6099 5177 112 108 118Gurgaon 12488 6695 5793 19596 10735 8861 119 116 121Mewat 25884 13609 12275 5791 3050 2741 111 111 111Rewari 7801 4410 3391 11901 6740 5161 130 130 131Mahendragarh 6895 3838 3057 9866 5616 4250 129 126 132Bhiwani 17883 9588 8295 13432 7462 5970 120 116 125Jind 11830 6254 5576 13968 7544 6424 115 112 117Hisar 17513 9391 8122 21818 11814 10004 117 116 118Fatehabad 11850 6422 5428 11301 6039 5262 117 118 115Sirsa 12266 6432 5834 14619 7911 6708 114 110 118
Source : Director General of Health Services, Haryana.

110
VITAL STATISTICS Deaths as per Civil Registration Scheme in Haryana
No. 5.3 Number of Deaths
Total Rural Urban Year/District Persons Males Females Persons Males Females Persons Males Females
1 2 3 4 5 6 7 8 9 10 1966 79,612 43,713 35,899 69,702 38,190 31,512 9,910 5,523 4,3871970 74,983 41,424 33,559 65,111 35,543 29,568 9,872 5,881 3,9911975 84,108 46,774 37,334 68,593 37,356 31,237 15,515 9,418 6,0971980 86,274 49,908 36,366 68,155 38,660 29,495 18,119 11,248 6,8711985 80,417 48,130 32,287 60,301 35,519 24,782 20,116 12,611 7,5051990 83,831 51,080 32,751 60,410 36,443 23,967 23,421 14,637 8,7841995 1,00,605 61,335 39,270 74,747 44,992 29,755 25,858 16,343 9,5152000 1,12,285 71,707 40,578 81,640 51,297 30,343 30,645 20,410 10,2352005 1,12,478 79,084 33,394 74,760 51,948 22,812 37,718 27,136 10,5822008 1,43,929 92,470 51,459 93,715 58,826 34,889 50,214 33,644 16,5702009 141681 91453 50228 90784 57286 33498 50897 34167 167302010 147113 94704 52609 93681 59015 34666 53432 35689 17743Ambala 7604 4620 2984 4367 2591 1776 3237 2029 1208Panchkula 3096 1956 1140 1447 935 512 1649 1021 628Yamunanagar 7475 4617 2858 4507 2744 1763 2968 1873 1095Kurukshetra 5577 3497 2080 3637 2244 1393 1940 1253 687Kaithal 6405 4236 2169 4955 3257 1698 1450 979 471Karnal 9219 5863 3556 5786 3639 2147 3433 2224 1209Panipat 5741 3816 1925 3663 2424 1239 2078 1392 686Sonipat 8663 5767 2896 5645 3621 2024 3018 2146 872Rohtak 12088 8136 3952 3500 2270 1230 8588 5866 2722Jhajjar 5360 3498 1862 4067 2608 1459 1293 890 403Faridabad 7593 4928 2665 1798 1066 732 5795 3862 1933Palwal 5223 3259 1964 4004 2410 1594 1219 849 370Gurgaon 7485 4962 2523 4932 3231 1701 2553 1731 822Mewat 3568 2240 1328 3274 2041 1233 294 199 95Rewari 5268 3354 1914 3985 2480 1505 1283 874 409Mahendragarh 5445 3415 2030 4658 2913 1745 787 502 285Bhiwani 8830 5684 3146 6841 4314 2527 1989 1370 619Jind 7917 5036 2881 6244 3871 2373 1673 1165 508Hisar 11912 7848 4064 7097 4611 2486 4815 3237 1578Fatehabad 5257 3338 1919 4142 2594 1548 1115 744 371Sirsa 7387 4634 2753 5132 3151 1981 2255 1483 772
Source : Director General of Health Services, Haryana.

111
VITAL STATISTICS Deaths Classified according to causes as per Civil Registration Scheme in Haryana
No. 5.4
Year/District Cholera Small-Pox Fever Dysentry and
Diarrhoea Respiratory
diseases Injuries All Other
causes Total
1 2 3 4 5 6 7 8 9 1966 33 175 58,753 1,058 8,077 1,112 10,404 79,6121970 — 329 49,052 595 11,115 1,334 12,558 74,9831975 — — 43,395 1,071 13,674 2,459 23,509 84,1081980 — — 50,004 1,004 7,798 2,041 25,427 86,2741985 — — 24,684 883 8,822 3,014 43,014 80,4171990 — — 355 734 5,723 2,759 74,260 83,8311995 1 — 559 1,528 9,948 7,290 81,279 1,00,6052000 1 — 1,419 846 7,940 4,299 97,780 1,12,2852005 — — 436 1,148 8,625 5,941 96,328 1,12,4782006 — — 422 1,527 9,465 6,474 1,05,613 1,23,501Ambala — — 12 51 380 302 5,591 6,336Panchkula — — 4 22 153 142 2,437 2,758Yamunanagar — — 7 106 545 266 5,119 6,043Kurukshetra — — 8 37 187 286 4,109 4,627Kaithal — — 13 43 193 160 4,613 5,022Karnal — — 15 72 360 386 6,618 7,451Panipat — — 4 42 394 322 3,894 4,656Sonipat — — 12 106 546 441 6,665 7,770Rohtak — — 42 104 1,594 874 7,950 10,564Jhajjar — — 12 64 404 253 4,086 4,819Faridabad — — 60 107 678 552 7,912 9,309Gurgaon — — 23 40 267 335 4,273 4,938Mewat — — 120 168 331 188 3,808 4,615Rewari — — 18 109 272 278 3,486 4,163Mahendragarh — — 24 66 686 292 3,701 4,769Bhiwani — — 17 111 597 314 7,121 8,160Jind — — 2 115 479 289 5,952 6,837Hisar — — 7 74 800 454 8,708 10,043Fatehabad — — 11 46 229 142 4,072 4,500Sirsa — — 11 44 370 198 5,498 6,121
Source : Director General of Health Services, Haryana.
Note: — From the year 1987 onwards, fever includes Typhoid, Measles, Malaria and Influenza as per the revised proforma of the Govt. of India. The Simple fever has been included under the column ‘‘All other causes.’’

112
VITAL STATISTICS Deaths in Different Seasons as per Civil Registration Scheme in Haryana
No. 5.5 Rural Urban
Year/District Spring Summer Autumn Winter Spring Summer Autumn Winter
Total Deaths
1 2 3 4 5 6 7 8 9 10 1966 15,144 18,607 17,644 18,307 2,146 2,419 2,609 2,736 79,6121970 14,159 17,105 14,839 19,008 2,175 2,454 2,404 2,839 74,9831975 13,159 17,331 20,386 17,717 3,052 3,784 4,676 4,003 84,1081980 13,782 15,462 20,974 17,042 4,455 4,704 5,292 4,563 86,2741985 13,767 15,670 15,783 15,081 4,799 5,376 5,083 4,858 80,4171990 11,982 16,490 15,822 16,116 5,250 6,148 5,869 6,154 83,8311995 14,194 19,352 20,997 20,204 5,429 7,125 6,592 6,712 1,00,6052000 20,157 21,627 18,353 21,503 7,376 8,106 7,129 8,034 1,12,2852005 17,217 19,812 18,550 19,181 8,460 9,717 9,449 10,092 1,12,4782008 21,992 22,312 24,240 25,171 12,130 11,845 12,526 13,713 1,43,9292009 20479 23269 22372 24664 11652 12903 12251 14091 1416812010 22016 22894 22859 25912 12780 12555 13174 14923 147113Ambala 1052 1027 1058 1230 790 754 769 924 7604Panchkula 350 340 359 398 398 376 390 485 3096Yamunanagar 1054 1005 1136 1312 740 665 728 835 7475Kurukshetra 892 837 872 1036 464 475 505 496 5577Kaithal 1176 1212 1257 1310 335 348 373 394 6405Karnal 1321 1396 1422 1647 824 786 820 1003 9219Panipat 839 846 932 1046 519 431 495 633 5741Sonipat 1337 1362 1399 1547 769 646 726 877 8663Rohtak 844 830 810 1016 2000 2032 2264 2292 12088Jhajjar 951 1066 919 1131 306 285 324 378 5360Faridabad 408 418 450 522 1339 1371 1451 1634 7593Palwal 863 981 1085 1075 280 272 319 348 5223Gurgaon 1122 1199 1243 1368 619 594 631 709 7485Mewat 659 784 965 866 57 71 86 80 3568Rewari 886 1070 933 1096 308 316 327 332 5268Mahendragarh 1157 1202 1084 1215 185 212 184 206 5445Bhiwani 1699 1751 1542 1849 485 511 462 531 8830Jind 1539 1546 1461 1698 414 417 393 449 7917Hisar 1663 1809 1666 1959 1141 1178 1143 1353 11912Fatehabad 996 1018 1005 1123 289 242 253 331 5257Sirsa 1208 1195 1261 1468 518 573 531 633 7387
Source : Director General of Health Services, Haryana.

113
DEATHS ACCORDING TO AGE AND SEX AS PER CIVIL REGISTRATION SCHEME IN HARYANA

114
VITAL STATISTICS Deaths according to Age and Sex as per Civil Registration Scheme in Haryana
No. 5.6 Under one year 1—4 years 5—9 years 10—14 years
Year/District Males Females Males Females Males Females Males Females
1 2 3 4 5 6 7 8 9 1966 8,892 7,592 8,813 8,786 2,271 1,773 1,221 9731970 7,786 6,655 6,390 6,254 1,862 1,487 1,201 9801975 8,400 6,773 5,711 6,175 2,160 1,726 1,276 1,0581980 7,064 5,040 4,087 4,002 2,042 1,561 1,538 1,1701985 5,056 3,160 3,289 3,089 1,378 1,019 1,041 8161990 3,717 2,690 2,313 2,112 975 872 761 5801995 2,503 2,428 2,159 2,117 1,037 891 979 7942000 2,421 1,868 1,555 1,631 897 692 884 7632005 2,704 1,421 1,255 982 1,077 606 953 5372006 2,522 1,552 1,247 1,306 865 712 815 537Ambala 83 94 39 32 23 34 24 21Panchkula 30 26 19 15 18 9 13 15Yamunanagar 144 85 50 76 46 25 28 12Kurukshetra 66 107 27 52 36 24 16 25Kaithal 71 42 57 40 36 26 33 14Karnal 202 75 50 63 22 46 64 37Panipat 32 35 20 27 19 24 20 18Sonipat 100 57 62 52 50 49 85 44Rohtak 380 144 103 77 81 34 95 37Jhajjar 45 31 38 33 31 24 9 6Faridabad 130 69 105 86 82 35 62 29Gurgaon 47 35 46 35 27 23 13 15Mewat 176 212 170 300 64 103 52 82Rewari 50 27 21 34 27 10 27 8Mahendragarh 84 66 53 40 48 47 31 14Bhiwani 208 112 81 89 58 73 38 37Jind 121 83 78 80 65 51 50 35Hisar 369 121 111 64 72 20 85 40Fatehabad 84 71 32 50 32 31 39 25Sirsa 100 60 85 61 28 24 31 23

115
VITAL STATISTICS Deaths according to Age and Sex as per Civil Registration Scheme in Haryana
No. 5.6 (Contd.) Year/District 15—19 years 20—29 years 30—39 years 40—49 years
Males Females Males Females Males Females Males Females 1 10 11 12 13 14 15 16 17
1966 1,000 964 1,617 1,793 1,559 1,605 1,996 1,612 1970 1,004 990 1,745 1,923 1,496 1,602 2,020 1,601 1975 1,078 962 2,117 2,490 1,741 1,951 2,363 1,836 1980 1,326 1,149 2,974 3,124 2,287 2,045 2,814 2,036 1985 1,412 999 3,459 3,162 2,715 2,004 3,015 1,833 1990 1,714 1,040 4,534 3,218 3,562 1,832 3,721 1,663 1995 1,522 1,003 5,088 3,365 5,011 2,326 5,244 2,026 2000 1,758 1,065 5,763 3,204 6,435 2,506 7,698 2,460 2005 2,611 1,149 4,600 1,883 7,764 2,751 8,999 2,501 2006 1,351 722 5,072 2,024 6,258 1,939 9,732 2,724 Ambala 42 23 213 80 261 103 336 168 Panchkula 20 11 86 49 102 52 230 72 Yamunanagar 31 50 177 97 202 96 380 144 Kurukshetra 52 18 198 87 214 89 317 129 Kaithal 51 29 183 81 275 93 463 133 Karnal 69 34 303 118 383 73 639 133 Panipat 41 27 200 68 241 59 413 102 Sonipat 108 48 283 108 367 102 552 149 Rohtak 183 108 677 328 719 250 1,018 226 Jhajjar 59 44 192 55 254 65 390 73 Faridabad 103 39 436 139 527 127 811 258 Gurgaon 58 9 257 51 246 62 377 74 Mewat 27 39 81 95 118 80 241 103 Rewari 39 13 150 39 228 34 294 87 Mahendragarh 46 36 134 65 202 71 292 86 Bhiwani 109 49 289 147 436 122 562 170 Jind 77 33 318 104 369 140 606 156 Hisar 119 41 498 136 597 112 958 181 Fatehabad 48 40 180 68 219 88 366 116 Sirsa 69 31 217 109 298 121 487 164
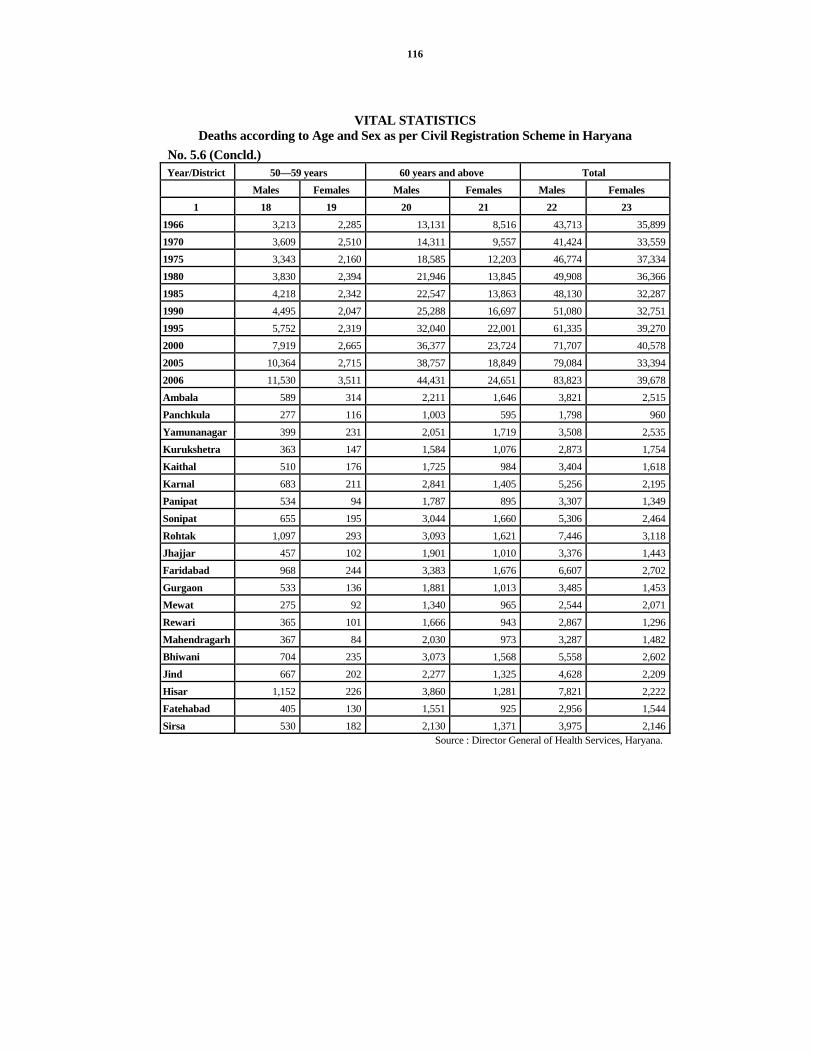
116
VITAL STATISTICS Deaths according to Age and Sex as per Civil Registration Scheme in Haryana
No. 5.6 (Concld.) Year/District 50—59 years 60 years and above Total
Males Females Males Females Males Females 1 18 19 20 21 22 23
1966 3,213 2,285 13,131 8,516 43,713 35,8991970 3,609 2,510 14,311 9,557 41,424 33,5591975 3,343 2,160 18,585 12,203 46,774 37,3341980 3,830 2,394 21,946 13,845 49,908 36,3661985 4,218 2,342 22,547 13,863 48,130 32,2871990 4,495 2,047 25,288 16,697 51,080 32,7511995 5,752 2,319 32,040 22,001 61,335 39,2702000 7,919 2,665 36,377 23,724 71,707 40,5782005 10,364 2,715 38,757 18,849 79,084 33,3942006 11,530 3,511 44,431 24,651 83,823 39,678Ambala 589 314 2,211 1,646 3,821 2,515Panchkula 277 116 1,003 595 1,798 960Yamunanagar 399 231 2,051 1,719 3,508 2,535Kurukshetra 363 147 1,584 1,076 2,873 1,754Kaithal 510 176 1,725 984 3,404 1,618Karnal 683 211 2,841 1,405 5,256 2,195Panipat 534 94 1,787 895 3,307 1,349Sonipat 655 195 3,044 1,660 5,306 2,464Rohtak 1,097 293 3,093 1,621 7,446 3,118Jhajjar 457 102 1,901 1,010 3,376 1,443Faridabad 968 244 3,383 1,676 6,607 2,702Gurgaon 533 136 1,881 1,013 3,485 1,453Mewat 275 92 1,340 965 2,544 2,071Rewari 365 101 1,666 943 2,867 1,296Mahendragarh 367 84 2,030 973 3,287 1,482Bhiwani 704 235 3,073 1,568 5,558 2,602Jind 667 202 2,277 1,325 4,628 2,209Hisar 1,152 226 3,860 1,281 7,821 2,222Fatehabad 405 130 1,551 925 2,956 1,544Sirsa 530 182 2,130 1,371 3,975 2,146
Source : Director General of Health Services, Haryana.

117
VITAL STATISTICS Distribution of Infant Deaths in Haryana
No. 5.7
Under one week Over one week but not exceeding one
month
Over one month but not exceeding six
months
Over six months but not exceeding one year Year/District
Total death under one year Total Percentage
to Col. 2 Total Percentage
to Col.2 Total Percentage to Col. 2
Total Percentage to Col. 2
1 2 3 4 5 6 7 8 9 10 1966 16,484 2,999 18.2 3,357 20.4 5,403 32.8 4,725 28.6 1970 14,441 2,555 17.7 3,132 21.7 4,704 32.6 4,050 28.0 1975 15,173 2,647 17.4 3,615 23.8 5,377 35.5 3,534 23.3 1980 12,104 2,182 18.0 2,487 20.6 4,842 40.0 2,593 21.4 1985 8,216 1,388 16.9 1,480 18.0 3,706 45.1 1,642 20.0 1990 6,407 1,355 21.2 1,833 28.6 1,789 27.9 1,430 22.3 1995 4,931 819 16.6 768 15.6 2,387 48.4 957 19.4 2000 4,289 1,023 23.8 519 12.1 2,066 48.2 681 15.9 2005 4,125 1,336 32.4 455 11.0 1,746 42.3 588 14.3 2006 4,074 1,933 47.4 407 10.0 1,272 31.2 462 11.3 Ambala 177 95 53.7 16 9.0 51 28.8 15 8.5 Panchkula 56 29 51.8 10 17.9 8 14.3 9 16.1 Yamunanagar 229 94 41.0 19 8.3 92 40.2 24 10.5 Kurukshetra 173 76 43.9 17 9.8 62 35.8 18 10.4 Kaithal 113 47 41.6 11 9.7 42 37.2 13 11.5 Karnal 277 100 36.1 29 10.5 123 44.4 25 9.0 Panipat 67 15 22.4 — — 33 49.3 19 28.4 Sonipat 157 59 37.6 21 13.4 56 35.7 21 13.4 Rohtak 524 306 58.4 62 11.8 121 23.1 35 6.7 Jhajjar 76 37 48.7 — — 29 38.2 10 13.2 Faridabad 199 108 54.3 16 8.0 49 24.6 26 13.1 Gurgaon 82 33 40.2 18 22.0 23 28.0 8 9.8 Mewat 388 129 33.2 26 6.7 165 42.5 68 17.5 Rewari 77 42 54.5 4 5.2 23 29.9 8 10.4 Mahendragarh 150 71 47.3 15 10.0 35 23.3 29 19.3 Bhiwani 320 199 62.2 22 6.9 83 25.9 16 5.0 Jind 204 120 58.8 22 10.8 46 22.5 16 7.8 Hisar 490 246 50.2 51 10.4 135 27.6 58 11.8 Fatehabad 155 60 38.7 16 10.3 51 32.9 28 18.1 Sirsa 160 67 41.9 32 20.0 45 28.1 16 10.0
Source :—Director General of Health Services, Haryana.
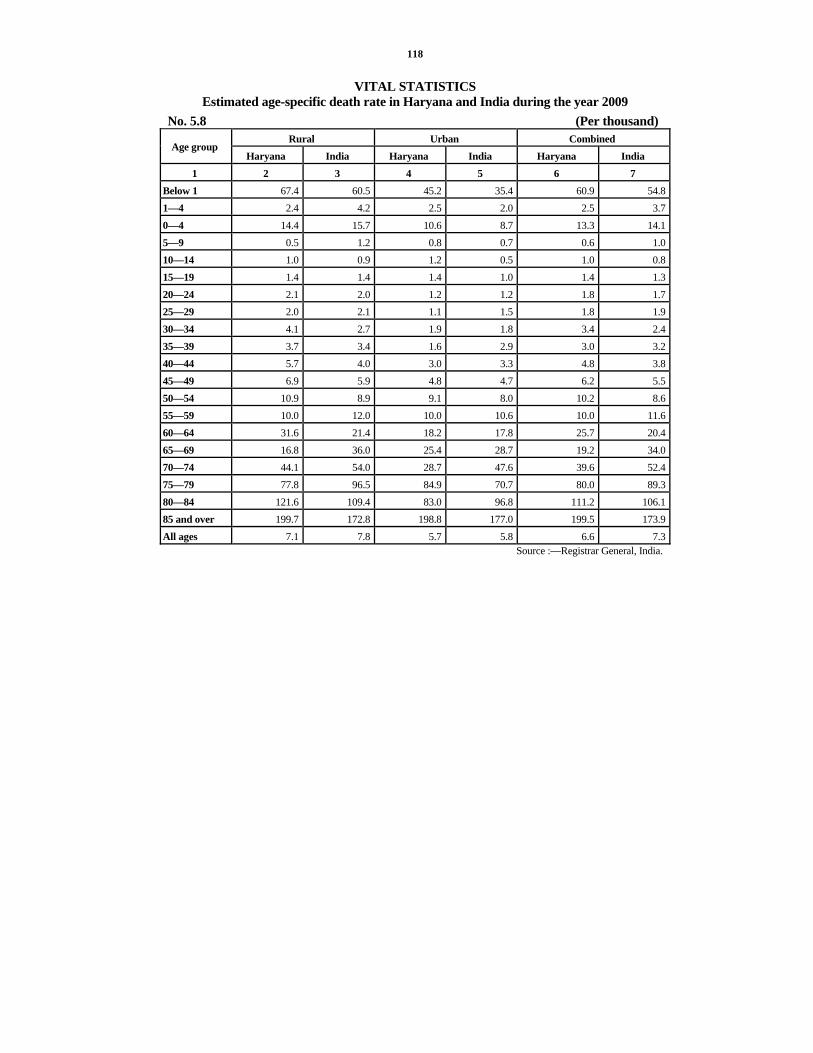
118
VITAL STATISTICS Estimated age-specific death rate in Haryana and India during the year 2009
No. 5.8 (Per thousand) Rural Urban Combined
Age group Haryana India Haryana India Haryana India
1 2 3 4 5 6 7 Below 1 67.4 60.5 45.2 35.4 60.9 54.81—4 2.4 4.2 2.5 2.0 2.5 3.70—4 14.4 15.7 10.6 8.7 13.3 14.15—9 0.5 1.2 0.8 0.7 0.6 1.010—14 1.0 0.9 1.2 0.5 1.0 0.815—19 1.4 1.4 1.4 1.0 1.4 1.320—24 2.1 2.0 1.2 1.2 1.8 1.725—29 2.0 2.1 1.1 1.5 1.8 1.930—34 4.1 2.7 1.9 1.8 3.4 2.435—39 3.7 3.4 1.6 2.9 3.0 3.240—44 5.7 4.0 3.0 3.3 4.8 3.845—49 6.9 5.9 4.8 4.7 6.2 5.550—54 10.9 8.9 9.1 8.0 10.2 8.655—59 10.0 12.0 10.0 10.6 10.0 11.660—64 31.6 21.4 18.2 17.8 25.7 20.465—69 16.8 36.0 25.4 28.7 19.2 34.070—74 44.1 54.0 28.7 47.6 39.6 52.475—79 77.8 96.5 84.9 70.7 80.0 89.380—84 121.6 109.4 83.0 96.8 111.2 106.185 and over 199.7 172.8 198.8 177.0 199.5 173.9All ages 7.1 7.8 5.7 5.8 6.6 7.3
Source :—Registrar General, India.

119
SECTION VI EDUCATION
This section presents data on education in the Haryana State. The information contained in this chapter has been taken from the Director of Higher/Secondary/Primary Education, Haryana and from the Ministry of Human Resource Development (Deptt. of Education), Government of India.
Table 6.1 shows number of recognised institutions in Haryana.
Table 6.2 shows the classification of colleges by management and nature of education imparted therein in Haryana.
Table 6.3 shows the districtwise classification of colleges in Haryana.
Table 6.4 shows the number of scholars in recognised colleges in Haryana.
Table 6.5 gives the classification of recognised schools in Haryana.
Table 6.6 shows the number of students in recognised schools for general education according to qualifications in Haryana.
Table 6.7 shows the number of Scheduled Castes Students in recognised Schools of Haryana (classwise).
Table 6.8 shows the number of teachers in Schools of Haryana (institutionwise).
Table 6.9 gives the number of students in schools of Haryana (classwise).
Table 6.10 gives the intake capacity in Degree courses in Engineering by Departmentwise.
Table 6.11 depicts the expenditure incurred on educational institutions by type of education in Haryana.
Table 6.12 shows the districtwise and year wise teacher-pupil ratio in Haryana.
Table 6.13 to 6.15 give the number of recognised institutions, teachers and scholars in India (Statewise).
Table 6.16 and 6.17 depict the Enrolment ratio for general education and Scheduled Castes Students in recognised schools in India (Statewise).

120

121
EDUCATION Number of Recognised Institutions in Haryana
No. 6.1 Type of Institutions 1966-67 1970-71 1975-76 1980-81
1 2 3 4 5
Universities 1 1 3 3
Arts and Science College 40 65 98 98
College for Physical Education — — 1 1
Teachers Training Colleges 5 12 19 20
High/Senior Secondary Schools 597 975 1,129 1,473
Middle/Senior Basic Schools 735 760 758 881
Primary/Junior Basic Schools 4,447 4,204 5,149 4,934
Pre-Primary Schools 2 3 7 27
Schools for Physical Education — — 1 —
Teachers Training Schools 10 12 10 1
Schools for Handicapped 5 5 5 5

122
EDUCATION Number of Recognised Institutions in Haryana
No. 6.1 (Concld.) Type of Institutions 1985-86 1990-91 1995-96 2000-01 2005-06 2009-10 2010-11
1 6 7 8 9 10 11 12
Universities 3 3 4 4 5 23 24
Arts and Science College 110 120 130 150 168 187 190
College for Physical
Education
1 1 1 1 1 1 1
Teachers Training Colleges 18 18 18 20 36 446 472
High/Senior Secondary
Schools
1,946 2,356 2,998 4,138 5,317 6,749 6,771
Middle/Senior Basic Schools 1,121 1,399 1,499 1,887 2,168 3,439 3,439
Primary/Junior Basic Schools 5,078 5,109 5,474 11,013 12,152 13,108 13,073
Pre-Primary Schools 27 27 27 27 27 21 21
Schools for Physical
Education
— — — — — — —
Teachers Training Schools — — 17 17 17 17 17
Schools for Handicapped 5 6 6 6 6 6 6R—Revised. Source :- Director of Secondary/Middle/Primary Education, Haryana. * Excluding Primary & Pre Primary schools attach with Middle, High, Sr. Secondary Schools.

123
EDUCATION Classification of Colleges by Management and Nature of Education imparted
in Haryana No. 6.2
Total Type of Education
imparted 66-67 75-76 80-81 85-86 90-91 95-96 2000-01
2005-06
2009-10
2010-11
1 2 3 4 5 6 7 8 9 10 11 1. Arts and Science—
(i.) General 31 76 75 83 89 89 102 108 119 120(ii.) For Women 9 22 23 27 31 41 48 60 68 70
2. Medicine— (i.) General 1 6 4 4 4 5 7 7 24 24(ii.) For Women — — 1 1 1 1 1 2 3 --
3. Education— (i.) General 5 16 15 15 15 15 16 33 417 440(ii.) For Women — 3 5 3 3 3 4 3 29 32
4. Law* — 1 —* —* —* —* 1 1 10 115. Engineering 1 1 1 1 2 4 25 44 52 526. Agriculture 2 2 2 2 2 2 3 3 7 77. Commerce — — — — — — — — — 18. Physical
Training — 1 1 1 1 1 1 1 — 1
9. Oriental Studies@
— — 15 15 15 15 15 15 13 13
10. Veterinary Science@@
1 2 2 2 2 2 2 2 — 2
11. Technology 1 1 1 1 1 1 1 1 2 212. Dairy Science 1 1 1 1 1 1 1 1 1 113. Architecture — — — — — — — — — —14. Home Science** — 1 — — — — — — — —15. Rural Institute — — — — — — — — — —16. Co-operative
Training Institute
— — — — 1 1 1 1 — —
Total 52 133 146 156 168 181 228 282 745 776General 43 108 117 125 133 136 175 217 645 674For Women 9 25 29 31 35 45 53 65 100 102*Law College, Kurukshetra has been made law Department of Kurukshetra University. **Since 1977-78 Home Science College has been included in Arts and Science Colleges. @ The information of the institutions of oriental studies is being collected since 1978-79. @@ Includes Animal Science College.

124
EDUCATION Classification of Colleges by Management and Nature of Education imparted
in Haryana No. 6.2 (Contd.)
Managed by Government Type of Education imparted 66-67 75-76 80-81 85-86 90-91 95-96 2000-01 2005-06 2009-10 2010-11
1 12 13 14 15 16 17 18 19 20 21
1. Arts and Science—
(i.) General 8 12 23 32 39 39 48 49 60 60
(ii.) For Women 2 1 1 1 2 3 7 11 15 16
2. Medicine—
(i.) General 1 1 1 1 1 2 2 2 2 2
(ii.) For Women
— — — — — — — — — —
3. Education—
(i.) General 1 1 1 1 1 1 2 2 2 2
(ii.) For Women
— — — — — — — — — —
4. Law* — — — — — — — — — —
5. Engineering 1 — — 1 1 4 3 6 10 10
6. Agriculture — — — — — — — — 1 1
7. Commerce — — — — — — — — — —
8. Physical Training
— — — — — — — — — —
9. Oriental Studies@
— — 1 — — — 1 1 — —
10. Veterinary Science@@
— — — — — — — — — —
11. Technology — — — — — — — — 1 1
12. Dairy Science 1 1 1 1 1 1 1 1 1 1
13. Architecture — — — — — — — — — —
14. Home Science** — — — — — — — — — —
15. Rural Institute — — — — — — — — — —
16. Co-operative Training Institute
— — — — — 1 1 1 — —
Total 14 16 28 37 45 51 65 73 92 93
General 12 15 27 36 43 48 58 62 77 77
For Women 2 1 1 1 2 3 7 11 15 16

125
EDUCATION Classification of Colleges by Management and Nature of Education imparted
in Haryana No. 6.2 (Concld.)
Aided Un-Aided Type of Education
imparted 66-67
75-76
80-81
85-86
90-91
95-96
2000-01
2005-06
2009-10
2010-11
2000-01
2005-06
2009-10
2010-11
1 22 23 24 25 26 27 28 29 30 31 32 33 34 35 1. Arts and Science—
(i.) General 23 64 52 51 50 50 47 48 48 48 7 11 11 12(ii.) For
Women 7 21 22 26 29 38 33 33 34 34 8 16 19 20
2. Medicine— (i.) General — 5 3 3 3 3 5 5 1 1 — — 21 21(ii.) For
Women — — 1 1 1 1 1 1 1 1 — 1 2 2
3. Education— (i.) General 4 15 14 14 14 14 13 15 12 12 1 16 357 426(ii.) For
Women — 3 5 3 3 3 3 — 2 2 1 3 25 30
4. Law* — 1 — — — — — — — -- 1 1 10 115. Engineering — 1 1 1 1 — 1 2 4 4 21 36 38 386. Agriculture 2 2 2 2 2 2 3 3 — -- — — 6 67. Commerce — — — — — — — — — -- — — — 18. Physical
Training — 1 1 1 1 1 1 1 — -- — — — 1
9. Oriental Studies@
— — 14 14 15 15 14 14 2 2 — — 11 11
10. Veterinary Science@@
1 2 2 2 2 2 2 2 — -- — — — --
11. Technology 1 1 1 1 1 1 1 1 1 1 — — — --12. Dairy Science — — — — — — — — — -- — — — --13. Architecture — — — — — — — — — -- — — — --14. Home
Science** — 1 — — — — — — — -- — — — --
15. Rural Institute — — — — — — — — — -- — — — --16. Co-operative
Training Institute
— — — — 1 — — — — -- — — — --
Total 38 117 118 119 123 130 124 125 153 105 39 84 500 579General 31 93 90 89 90 88 87 91 68 68 30 64 454 527For Women 7 24 28 30 33 42 37 34 39 37 9 20 46 52
Source :—Higher Education Commissioner, Haryana. Note :—Some colleges have been made Un-Aided from 1999-2000.
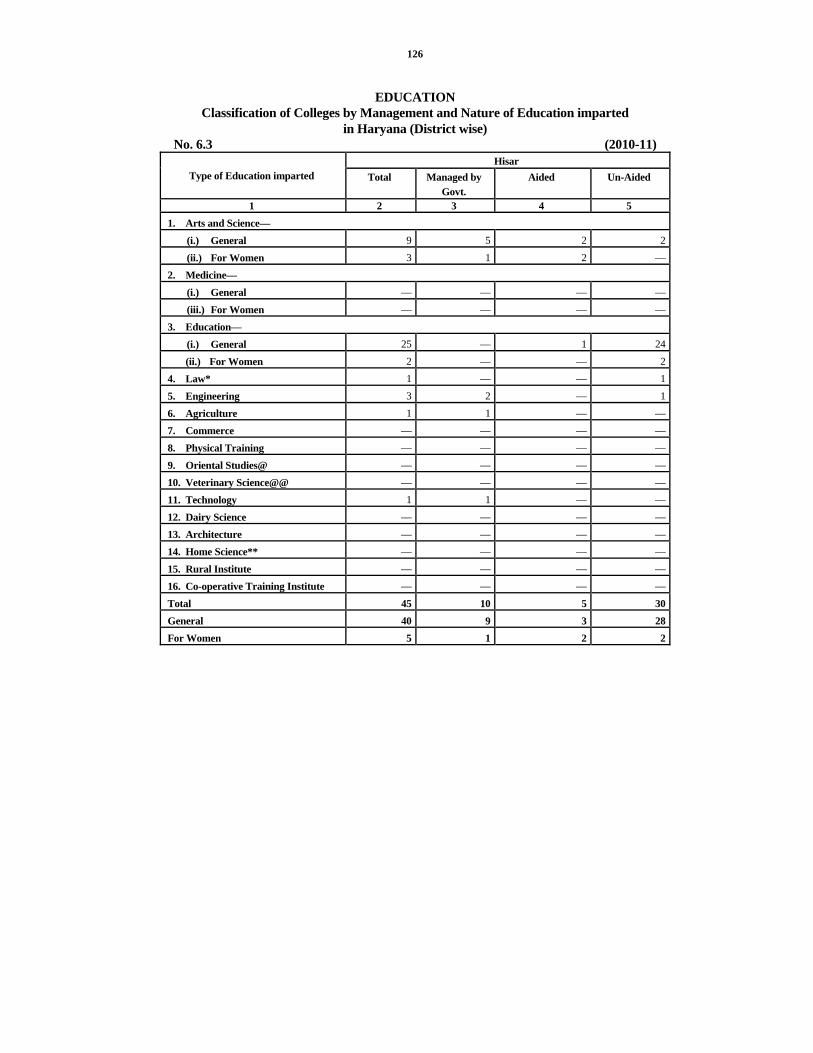
126
EDUCATION
Classification of Colleges by Management and Nature of Education imparted in Haryana (District wise)
No. 6.3 (2010-11) Hisar
Type of Education imparted Total Managed by Govt.
Aided Un-Aided
1 2 3 4 5 1. Arts and Science—
(i.) General 9 5 2 2
(ii.) For Women 3 1 2 —
2. Medicine— (i.) General — — — —
(iii.) For Women — — — —
3. Education— (i.) General 25 — 1 24
(ii.) For Women 2 — — 2
4. Law* 1 — — 1
5. Engineering 3 2 — 1
6. Agriculture 1 1 — —
7. Commerce — — — —
8. Physical Training — — — —
9. Oriental Studies@ — — — —
10. Veterinary Science@@ — — — —
11. Technology 1 1 — —
12. Dairy Science — — — —
13. Architecture — — — —
14. Home Science** — — — —
15. Rural Institute — — — —
16. Co-operative Training Institute — — — —
Total 45 10 5 30 General 40 9 3 28 For Women 5 1 2 2

127
EDUCATION Classification of Colleges by Management and Nature of Education imparted
in Haryana (District wise) No. 6.3 (Contd.) (2010-11)
Bhiwani Gurgaon Faridabad
Total Managed by govt.
Aided Un-Aided
Total Managed by govt.
Aided Un-Aided
Total Managed by govt.
Aided Un-Aided
Type of Education imparted
6 7 8 9 10 11 12 13 14 15 16 17 1. Arts and Science—
(i.) General 9 5 3 1 8 4 2 2 5 2 3 —
(ii.) For Women
4 1 3 — 1 1 — — 4 1 2 1
2. Medicine— (i.) General — — — — — — — — — — — —
(ii.) For Women
— — — — 1 — — 1 — — — —
3. Education— (i.) General 29 1 2 26 39 — 1 38 25 — — 25 (ii.) For
Women 3 — — 3 2 — — 2 4 — — 4
4. Law* — — — — — — — — 2 — — 2 5. Engineering 3 — — 3 — — — — 2 1 1 —
6. Agriculture — — — — — — — — — — — —
7. Commerce — — — — — — — — — — — —
8. Physical Training
— — — — — — — — — — — —
9. Oriental Studies@
— — — — 4 — — 4 8 — 1 7
10. Veterinary Science@@
— — — — — — — — — — — —
11. Technology 1 — 1 — — — — — — — — —
12. Dairy Science — — — — — — — — — — — —
13. Architecture — — — — — — — — — — — —
14. Home Science**
— — — — — — — — — — — —
15. Rural Institute
— — — — — — — — — — — —
16. Co-operative Training Institute
— — — — — — — — — — — —
Total 49 7 9 33 55 5 3 47 50 4 7 39General 42 6 6 30 51 5 3 44 42 3 5 34 For Women 7 1 3 3 3 — — 3 8 1 2 5

128
EDUCATION Classification of Colleges by Management and Nature of Education imparted
in Haryana (District wise) No. 6.3 (Contd.) (2010-11)
Jind Total Managed by govt. Aided Un-Aided Type of Education imparted
18 19 20 21 1. Arts and Science—
(i.) General 7 4 1 2
(ii.) For Women 4 1 2 1
2. Medicine— (i.) General 21 — — 21
(ii.) For Women 1 — — 1
3. Education— (i.) General 19 — — 19
(ii.) For Women 3 — — 3
4. Law* — — — —
5. Engineering — — — —
6. Agriculture — — — —
7. Commerce — — — 1
8. Physical Training — — — —
9. Oriental Studies@ — — — —
10. Veterinary Science@@ — — — —
11. Technology — — — —
12. Dairy Science — — — —
13. Architecture — — — —
14. Home Science** — — — —
15. Rural Institute — — — —
16. Co-operative Training Institute — — — —
Total 55 5 3 47 General 47 4 1 42 For Women 8 1 2 5
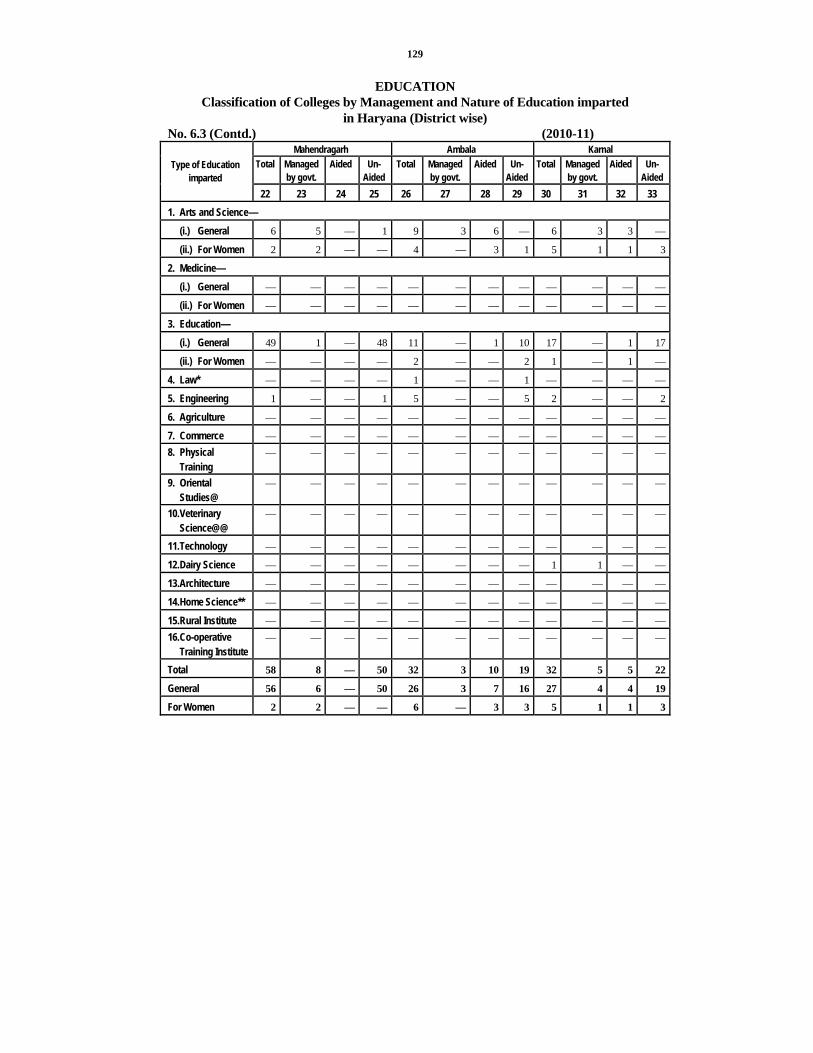
129
EDUCATION Classification of Colleges by Management and Nature of Education imparted
in Haryana (District wise) No. 6.3 (Contd.) (2010-11)
Mahendragarh Ambala Karnal Total Managed
by govt. Aided Un-
Aided Total Managed
by govt. Aided Un-
Aided Total Managed
by govt. Aided Un-
Aided Type of Education
imparted 22 23 24 25 26 27 28 29 30 31 32 33
1. Arts and Science— (i.) General 6 5 — 1 9 3 6 — 6 3 3 —
(ii.) For Women 2 2 — — 4 — 3 1 5 1 1 3
2. Medicine— (i.) General — — — — — — — — — — — —
(ii.) For Women — — — — — — — — — — — —
3. Education— (i.) General 49 1 — 48 11 — 1 10 17 — 1 17
(ii.) For Women — — — — 2 — — 2 1 — 1 —
4. Law* — — — — 1 — — 1 — — — —
5. Engineering 1 — — 1 5 — — 5 2 — — 2
6. Agriculture — — — — — — — — — — — —
7. Commerce — — — — — — — — — — — —
8. Physical Training
— — — — — — — — — — — —
9. Oriental Studies@
— — — — — — — — — — — —
10. Veterinary Science@@
— — — — — — — — — — — —
11. Technology — — — — — — — — — — — —
12. Dairy Science — — — — — — — — 1 1 — —
13. Architecture — — — — — — — — — — — —
14. Home Science** — — — — — — — — — — — —
15. Rural Institute — — — — — — — — — — — —
16. Co-operative Training Institute
— — — — — — — — — — — —
Total 58 8 — 50 32 3 10 19 32 5 5 22
General 56 6 — 50 26 3 7 16 27 4 4 19
For Women 2 2 — — 6 — 3 3 5 1 1 3

130
EDUCATION Classification of Colleges by Management and Nature of Education imparted
in Haryana (District wise) No. 6.3 (Contd.) (2010-11)
Kurukshetra Total Managed by govt. Aided Un-Aided Type of Education imparted
34 35 36 37 1. Arts and Science—
(i.) General 5 — 4 1
(ii.) For Women 4 — 2 2
2. Medicine— (i.) General 1 1 — —
(ii.) For Women — — — —
3. Education— (i.) General 20 — — 20
(ii.) For Women 1 — — 1
4. Law* — — — —
5. Engineering 6 2 — 4
6. Agriculture — — — —
7. Commerce — — — —
8. Physical Training — — — —
9. Oriental Studies@ — — — —
10. Veterinary Science@@ — — — —
11. Technology — — — —
12. Dairy Science — — — —
13. Architecture — — — —
14. Home Science** — — — —
15. Rural Institute — — — —
16. Co-operative Training Institute
— — — —
Total 37 3 6 28 General 32 3 4 25 For Women 5 — 2 3

131
EDUCATION Classification of Colleges by Management and Nature of Education imparted
in Haryana (District wise) No. 6.3 (Contd.) (2010-11)
Rohtak Sonipat Sirsa Type of Education imparted Total Managed
by govt. Aided Un-
Aided Total Managed
by govt. Aided Un-
Aided Total Managed
by govt. Aided Un-
Aided 1 38 39 40 41 42 43 44 45 46 47 48 49
1. Arts and Science— (i.) General 9 2 5 2 3 1 2 — 7 3 1 3(ii.) For Women 5 3 2 — 6 1 4 1 5 — 2 3
2. Medicine— (i.) General 1 1 — — — — — — — — — —(ii.) For Women — — — — 1 — 1 — — — — —
3. Education— (i.) General 43 — 3 40 35 — 2 33 11 — — 11(ii.) For Women 3 — — 3 2 — — 2 2 — 1 1
4. Law* 2 — — 2 1 — — 1 1 — — 15. Engineering 7 1 — 6 7 3 — 4 2 1 — 16. Agriculture — — — — — — — — — — — —7. Commerce — — — — — — — — — — — —8. Physical Training — — — — — — — — — — — —9. Oriental
Studies@ — — — — — — — — — — — —
10. Veterinary Science@@
— — — — — — — — — — — —
11. Technology — — — — — — — — — — — —12. Dairy Science — — — — — — — — — — — —13. Architecture — — — — — — — — — — — —14. Home Science** — — — — — — — — — — — —15. Rural Institute — — — — — — — — — — — —16. Co-operative
Training Institute — — — — — — — — — — — —
Total 70 7 10 53 55 5 9 41 28 4 4 20General 62 4 8 50 46 4 4 38 21 4 1 16For Women 8 3 2 3 9 1 5 3 7 — 3 4

132
EDUCATION Classification of Colleges by Management and Nature of Education imparted
in Haryana (District wise) No. 6.3 (Contd.) (2010-11)
Panipat Type of Education imparted Total Managed by govt. Aided Un-Aided
1 50 51 52 53 1. Arts and Science—
(i.) General 7 3 4 —
(ii.) For Women 3 — 1 2
2. Medicine— (i.) General — — — —
(ii.) For Women — — — —
3. Education— (i.) General 18 — — 18
(ii.) For Women — — — —
4. Law* 1 — — 1
5. Engineering 4 — — 4
6. Agriculture — — — —
7. Commerce — — — —
8. Physical Training — — — —
9. Oriental Studies@ — — — —
10. Veterinary Science@@ — — — —
11. Technology — — — —
12. Dairy Science — — — —
13. Architecture — — — —
14. Home Science** — — — —
15. Rural Institute — — — —
16. Co-operative Training Institute
— — — —
Total 33 3 5 25 General 30 3 4 23 For Women 3 — 1 2

133
EDUCATION Classification of Colleges by Management and Nature of Education imparted
in Haryana (District wise) No. 6.3 (Contd.) (2010-11)
Rewari Kaithal Yamunanagar Type of Education imparted Total Managed
by Govt. Aided Un-
Aided Total Managed
by Govt. Aided Un-
Aided Total Managed
by Govt. Aided Un-
Aided 1 54 55 56 57 58 59 60 61 62 63 64 65
1. Arts and Science— (i.) General 5 3 2 — 6 1 4 1 6 1 5 — (ii.) For
Women 4 2 2 — 5 — 3 2 4 — 3 1
2. Medicine— (i.) General — — — — — — — — — — — — (ii.) For
Women — — — — — — — — — — — —
3. Education— (i.) General 20 — 2 18 15 — — 15 16 — — 16 (ii.) For
Women — — — — — — — — 4 — — 4
4. Law* 1 — — 1 1 — — — — — — — 5. Engineering 1 — — 1 1 — — 1 2 — — 2 6. Agriculture — — — — 1 — — 1 5 — — 5 7. Commerce — — — — — — — — — — — — 8. Physical
Training — — — — — — — — — — — —
9. Oriental Studies@
— — — — — — — — — — — —
10. Veterinary Science@@
— — — — — — — — — — — —
11. Technology — — — — — — — — — — — — 12. Dairy Science — — — — — — — — — — — — 13. Architecture — — — — — — — — — — — — 14. Home
Science** — — — — — — — — — — — —
15. Rural Institute — — — — — — — — — — — — 16. Co-operative
Training Institute
— — — — — — — — — — — —
Total 31 5 6 20 28 1 7 20 37 1 8 28 General 27 3 4 20 23 1 4 18 29 1 5 23 For Women 4 2 2 — 5 — 3 2 8 — 3 5
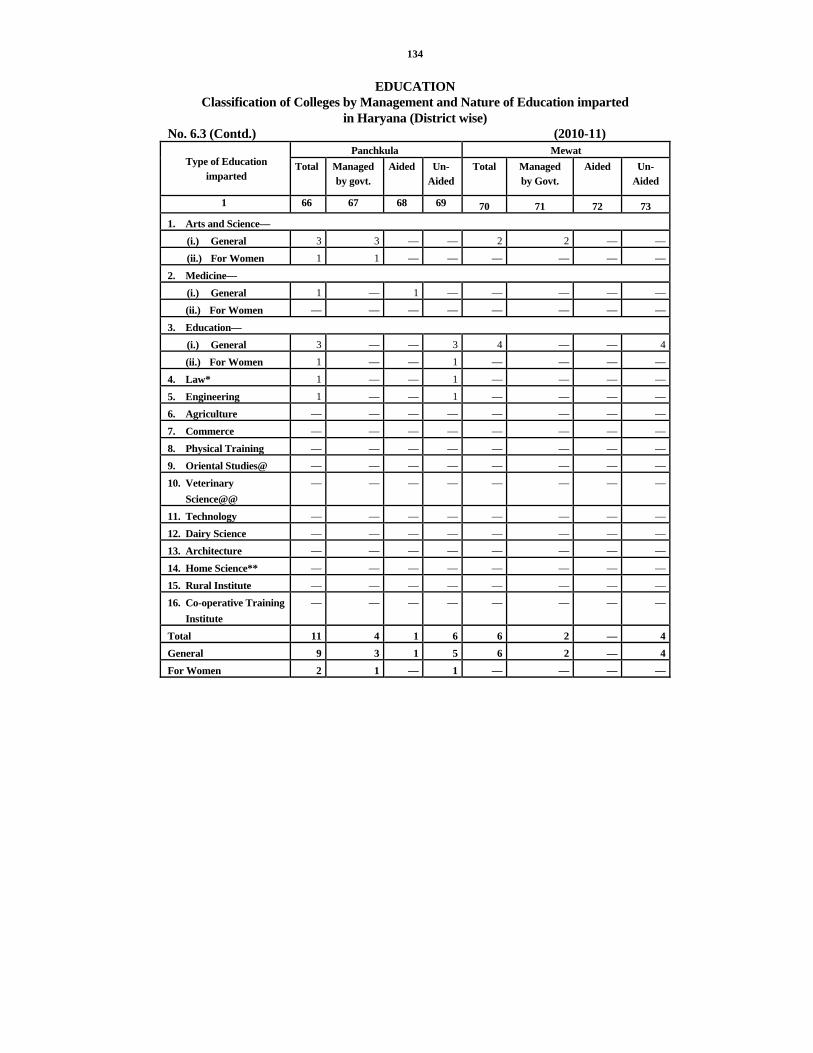
134
EDUCATION Classification of Colleges by Management and Nature of Education imparted
in Haryana (District wise) No. 6.3 (Contd.) (2010-11)
Panchkula Mewat Type of Education
imparted Total Managed
by govt. Aided Un-
Aided Total Managed
by Govt. Aided Un-
Aided
1 66 67 68 69 70 71 72 73 1. Arts and Science—
(i.) General 3 3 — — 2 2 — —
(ii.) For Women 1 1 — — — — — —
2. Medicine— (i.) General 1 — 1 — — — — —
(ii.) For Women — — — — — — — —
3. Education— (i.) General 3 — — 3 4 — — 4
(ii.) For Women 1 — — 1 — — — —
4. Law* 1 — — 1 — — — —
5. Engineering 1 — — 1 — — — —
6. Agriculture — — — — — — — —
7. Commerce — — — — — — — —
8. Physical Training — — — — — — — —
9. Oriental Studies@ — — — — — — — —
10. Veterinary Science@@
— — — — — — — —
11. Technology — — — — — — — —
12. Dairy Science — — — — — — — —
13. Architecture — — — — — — — —
14. Home Science** — — — — — — — —
15. Rural Institute — — — — — — — —
16. Co-operative Training Institute
— — — — — — — —
Total 11 4 1 6 6 2 — 4General 9 3 1 5 6 2 — 4For Women 2 1 — 1 — — — —

135
EDUCATION Classification of Colleges by Management and Nature of Education imparted
in Haryana (District wise) No. 6.3 (Contd.) (2010-11)
Jhajjar Fatehabad Type of Education
imparted Total Managed by Govt.
Aided Un-Aided
Total Managed by Govt.
Aided Un-Aided
1 74 75 76 77 78 79 80 81
1. Arts and Science— (i.) General 6 6 — — 4 3 1 —
(ii.) For Women 3 — 2 1 2 1 — 1
2. Medicine— (i.) General — — — — — — — —
(ii.) For Women — — — — — — — —
3. Education— (i.) General 28 — — 28 13 — — 13
(ii.) For Women 1 — — 1 — — — —
4. Law* — — — — — — — —
5. Engineering 4 — 3 1 1 — — 1
6. Agriculture — — — — — — — —
7. Commerce — — — — — — — —
8. Physical Training — — — — — — — —
9. Oriental Studies@ 1 — 1 — — — — —
10. Veterinary Science@@
— — — — — — — —
11. Technology — — — — — — — —
12. Dairy Science — — — — — — — —
13. Architecture — — — — — — — —
14. Home Science** — — — — — — — —
15. Rural Institute — — — — — — — —
16. Co-operative Training Institute
— — — — — — — —
Total 43 6 6 31 20 4 1 15General 39 6 4 29 18 3 1 14For Women 4 — 2 2 2 1 — 1

136
EDUCATION Classification of Colleges by Management and Nature of Education imparted
in Haryana (District wise) No. 6.3 (Concld.) (2010-11)
Palwal State Total Type of Education
imparted Total Managed by Govt.
Aided Un-Aided
Total Managed by Govt.
Aided Un-Aided
1 82 83 84 85 86 87 88 89
1. Arts and Science—
(i.) General 2 1 — 1 120 60 48 12
(ii.) For Women — — — 1 70 16 34 20
2. Medicine—
(i.) General — — — — 24 2 1 21
(ii.) For Women — — — — 3 — 1 2
3. Education—
(i.) General — — — — 440 2 12 426
(ii.) For Women — — — — 32 — 2 30
4. Law* — — — — 11 — — 11
5. Engineering — — — — 52 10 4 38
6. Agriculture — — — — 7 1 — 6
7. Commerce — — — — 1 — — 1
8. Physical Training — — — — 1 — — 1
9. Oriental Studies@ — — — — 13 — 2 11
10. Veterinary Science@@ — — — — — — — —
11. Technology — — — — 2 1 1 —
12. Dairy Science — — — — 1 1 — —
13. Architecture — — — — — — — —
14. Home Science** — — — — — — — —
15. Rural Institute — — — — — — — —
16. Co-operative Training Institute
— — — — — — — —
Total 2 — — 2 777 93 105 579
General 2 1 — 1 672 77 68 527
For Women 1 — — 1 105 16 37 52 @@Includes Animal Science College. Source :—Higher Education Commissioner, Haryana. * Law College of Kurukshetra has now been made Law Department of Kurukshetra University. **Home Science College is included in Arts and Science College. @The information of the institutions of oriental studies is being collected since 1978-79.

137
EDUCATION Number of Scholars in Recognised Colleges for General Education
(Arts, Science and Home Science) in Haryana (Districtwise) No. 6.4
Total Scholars (Including scheduled castes) Scheduled Castes Scholars Year/District
Total Boys Girls Total Boys Girls
1 2 3 4 5 6 7
1966-67 27,332 21,603 5,729 1,307 1,257 50
1970-71 58,444 46,708 11,736 2,231 2,070 161
1975-76 72,882 56,018 16,864 3,517 3,396 121
1980-81 75,863 53,544 22,319 4,213 3,999 214
1985-86 105,965 71,753 34,212 7,045 6,527 518
1990-91 138,405 91,226 47,179 9,875 8,806 1,069
1995-96 120,845 68,676 52,169 6,990 5,661 1,329
2000-01 196,537 111,797 84,740 14,339 10,717 3,622
2005-06 192,701 96,238 96,463 18,074 10,863 7,211
2009-10 250,325 117,183 133,142 35,392 19,845 15,547
2010-11 241,926 107,580 134,346 29,105 13,755 15,350
Ambala 16,310 6,910 9,400 2,752 1,336 1,416
Panchkula 4,853 2,400 2,453 821 408 413
Yamunanagar 15,313 5,287 10,026 1,970 810 1,160
Kurukshetra 5,991 2,132 3,859 379 189 190
Kaithal 6,942 4,159 2,783 1,071 564 507
Karnal 9,843 4,984 4,859 1,295 830 465
Panipat 12,456 5,770 6,686 561 338 223
Sonipat 12,107 2,333 9,774 2,036 536 1,500
Rohtak 19,855 7,956 11,899 911 529 382
Jhajjar 7,807 3,047 4,760 1,290 623 667
Faridabad 17,468 8,529 8,939 1,739 1,044 695
Palwal 4,294 2,557 1,737 107 65 42
Gurgaon 14,913 6,875 8,038 1,407 416 991
Mewat 1,896 1,559 337 135 113 22
Rewari 8,306 2,640 5,666 1,956 912 1,044
Mahendragarh 9,929 3,438 6,491 1,690 580 1,110
Bhiwani 20,931 10,842 10,089 2,934 910 2,024
Jind 11,470 4,909 6,561 1,651 1,233 418
Hisar 20,630 11,172 9,458 2,750 1,472 1,278
Fatehabad 7,366 3,770 3,596 1,079 604 475
Sirsa 13,246 6,311 6,935 571 243 328 Source :—Higher Education Commissioner, Haryana.
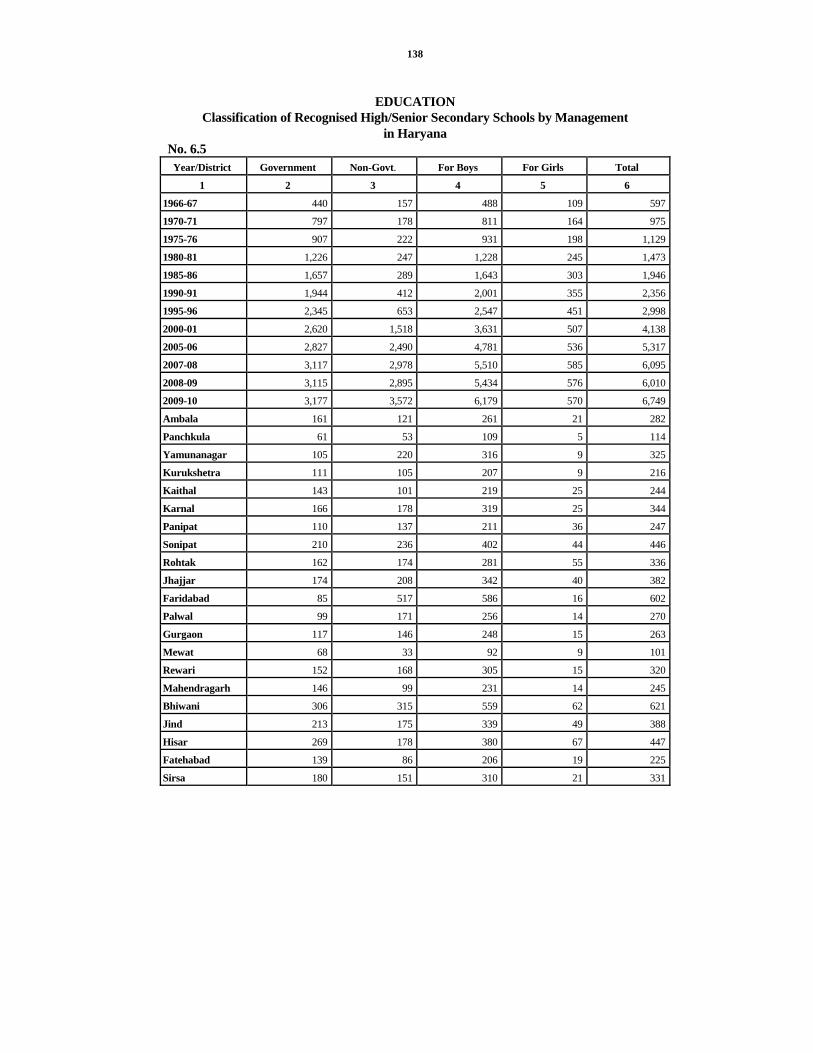
138
EDUCATION
Classification of Recognised High/Senior Secondary Schools by Management in Haryana
No. 6.5 Year/District Government Non-Govt. For Boys For Girls Total
1 2 3 4 5 6
1966-67 440 157 488 109 597
1970-71 797 178 811 164 975
1975-76 907 222 931 198 1,129
1980-81 1,226 247 1,228 245 1,473
1985-86 1,657 289 1,643 303 1,946
1990-91 1,944 412 2,001 355 2,356
1995-96 2,345 653 2,547 451 2,998
2000-01 2,620 1,518 3,631 507 4,138
2005-06 2,827 2,490 4,781 536 5,317
2007-08 3,117 2,978 5,510 585 6,095
2008-09 3,115 2,895 5,434 576 6,010
2009-10 3,177 3,572 6,179 570 6,749
Ambala 161 121 261 21 282
Panchkula 61 53 109 5 114
Yamunanagar 105 220 316 9 325
Kurukshetra 111 105 207 9 216
Kaithal 143 101 219 25 244
Karnal 166 178 319 25 344
Panipat 110 137 211 36 247
Sonipat 210 236 402 44 446
Rohtak 162 174 281 55 336
Jhajjar 174 208 342 40 382
Faridabad 85 517 586 16 602
Palwal 99 171 256 14 270
Gurgaon 117 146 248 15 263
Mewat 68 33 92 9 101
Rewari 152 168 305 15 320
Mahendragarh 146 99 231 14 245
Bhiwani 306 315 559 62 621
Jind 213 175 339 49 388
Hisar 269 178 380 67 447
Fatehabad 139 86 206 19 225
Sirsa 180 151 310 21 331

139
EDUCATION
Classification of Recognised Middle Schools by Management in Haryana No. 6.5 (Contd.)
Year/District Government Non-Govt. For Boys For Girls Total
1 2 3 4 5 6
1966-67 704 31 629 106 735
1970-71 730 30 661 99 760
1975-76 742 16 673 85 758
1980-81 848 33 805 76 881
1985-86 1,062 59 990 131 1,121
1990-91 1,249 150 1,231 168 1,399
1995-96 1,194 305 1,327 172 1,499
2000-01 1,211 676 1,706 181 1,887
2005-06 1,425 743 1,962 206 2,168
2007-08 1,969 1,227 2,981 215 3,196
2008-09 2,261 1,206 3,205 262 3,467
2009-10 2,205 1,234 3,207 232 3,439
Ambala 139 65 198 6 204
Panchkula 72 23 94 1 95
Yamunanagar 194 62 253 3 256
Kurukshetra 178 29 195 12 207
Kaithal 70 66 124 12 136
Karnal 101 65 160 6 166
Panipat 61 15 70 6 76
Sonipat 80 73 146 7 153
Rohtak 34 65 93 6 99
Jhajjar 56 53 101 8 109
Faridabad 48 233 275 6 281
Palwal 123 48 160 11 171
Gurgaon 77 109 176 10 186
Mewat 195 32 212 15 227
Rewari 97 29 119 7 126
Mahendragarh 126 26 145 7 152
Bhiwani 150 77 206 21 227
Jind 101 31 106 26 132
Hisar 97 80 150 27 177
Fatehabad 79 34 103 10 113
Sirsa 127 19 121 25 146

140
EDUCATION Classification of Recognised Primary (Including pre-Primary/Balwari)
Schools by Management in Haryana No. 6.5 (Concld.)
Year/District Government Non- Government For Boys For Girls Total 1 2 3 4 5 6
1966-67 4,344 105 4,192 257 4,4491970-71 4,106 101 4,071 136 4,2071975-76 5,075 81 4,892 264 5,1561980-81 4,896 65 4,738 223 4,9611985-86 5,018 87 4,557 548 5,1051990-91 4,969 167 4,398 738 5,1361995-96 5,321 180 4,451 1,050 5,5012000-01 8,650 2,390 9,381 1,659 11,0402004-05 8,737 3,090 10,216 1,611 11,8272005-06 8,964 3,215 10,598 1,581 12,1792007-08 4,897 1,412 5,679 630 6,3092008-09 9,322 3,751 11,506 1,567 13,0732009-10 9,300 3,829 11,658 1,471 13,129Ambala 542 208 696 54 750Panchkula 278 2 248 27 275Yamunanagar 621 334 941 14 955Kurukshetra 519 42 523 38 561Kaithal 386 172 487 71 558Karnal 492 313 783 22 805Panipat 252 144 350 46 396Sonipat 457 339 700 96 796Rohtak 243 21 191 73 264Jhajjar 347 267 530 84 614Faridabad 256 544 765 35 800Palwal 386 312 640 58 698Gurgaon 394 205 530 69 599Mewat 512 39 471 80 551Rewari 444 97 505 36 541Mahendragarh 532 7 444 95 539Bhiwani 689 412 970 131 1,101Jind 468 32 360 140 500Hisar 533 222 621 139 760Fatehabad 387 81 421 47 468Sirsa 562 36 482 116 598
Source :—Director of Secondary/Middle/Primary Education, Haryana. * Excluding Primary & Pre Primary schools attached with Middle, High, Sr. Secondary Schools.

141
EDUCATION Number of Scholars in Recognised Schools in Haryana
No. 6.6 High/Senior Secondary/Navodya Schools Middle Schools
Year/District Total Boys Girls Total Boys Girls
1 2 3 4 5 6 7
1966-67 3,76,080 2,86,475 89,605 2,50,673 1,83,043 67,630
1970-71 6,03,396 4,52,939 1,50,457 2,45,137 1,76,703 68,434
1975-76 7,64,756 5,62,387 2,02,369 2,57,983 1,83,591 74,392
1980-81 10,10,236 7,18,831 2,91,405 2,96,027 2,05,067 90,960
1985-86 13,38,511 9,06,663 4,31,848 3,81,174 2,34,611 1,46,563
1990-91 15,52,643 9,94,286 5,58,357 5,47,105 3,07,877 2,39,228
1995-96 18,19,148 10,95,605 7,23,543 4,82,388 2,63,019 2,19,369
2000-01 15,76,571 9,20,408 6,56,163 1,94,823 1,05,820 89,003
2005-06 17,46,133 9,83,203 7,62,930 2,86,409 1,46,767 1,39,642
2007-08 23,06,181 12,62,825 10,43,356 6,91,258 3,71,186 3,20,072
2008-09 29,23,542 15,16,088 14,07,454 6,29,292 3,23,379 3,05,913
2009-10 24,05,479 13,04,299 11,01,180 8,77,767 4,77,595 4,00,172
Ambala 1,07,672 54,662 53,010 36,739 18,865 17,874
Panchkula 70,370 39,118 31,252 20,165 11,110 9,055
Yamunanagar 75,866 41,254 34,612 64,093 38,560 25,523
Kurukshetra 83,261 46,039 37,222 24,009 12,389 11,620
Kaithal 1,01,961 57,983 43,978 14,948 7,026 7,922
Karnal 1,61,927 85,786 76,141 66,510 35,453 31.057
Panipat 75,077 41,701 33,376 37,728 19,706 18,022
Sonipat 1,91,152 1,08,150 83,002 45,734 25,846 19,898
Rohtak 56,465 27,697 28,768 47,350 23,429 23,921
Jhajjar 1,7,890 61,434 56,456 23,232 11,747 11,485
Faridabad 1,42,487 64,958 77,529 84,242 41,789 42,453
Palwal 1,18,785 69,054 49,731 45,050 23,140 21,910
Gurgaon 74,274 39,472 34,802 38,293 20,111 18,182
Mewat 27,155 19,012 8,143 22,945 15,533 7,412
Rewari 1,04,530 55,725 48,805 11,988 6,160 5,828
Mahendragarh 1,13,659 62,312 51,347 20,639 10,275 10,364
Bhiwani 2,21,586 1,22,412 99,174 1,04,315 67,996 36,319
Jind 1,91,981 1,05,389 86,592 51,617 25,902 25,715
Hisar 1,41,460 74,985 66,475 87,505 44,676 42,829
Fatehabad 1,24,935 71,712 53,223 19,127 12,329 6,798
Sirsa 1,02,986 55,444 47,542 11,538 5,553 5,985EDUCATION
Number of Scholars in Recognised Schools in Haryana

142
No. 6.6 (Concld.) Primary/pre-primary Schools Grand Total
Year/District Total Boys Girls Total Boys Girls
1 8 9 10 11 12 13 1966-67 5,34,764 3,93,761 1,41,003 11,61,517 8,63,279 2,98,2381970-71 5,36,257 3,86,909 1,49,348 13,84,790 10,16,551 3,68,2391975-76 6,59,121 4,47,692 2,11,429 16,81,860 11,93,670 4,88,1901980-81 5,98,032 3,88,175 2,09,857 19,04,295 13,12,073 5,92,2221985-86 6,94,290 3,99,432 2,94,858 24,13,975 15,40,706 8,73,2691990-91 7,84,637 4,18,887 3,65,750 28,84,385 17,21,050 11,63,3351995-96 8,26,720 4,05,372 4,21,348 31,28,256 17,63,996 13,64,2602000-01 20,19,795 10,64,811 9,54,984 37,91,189 20,91,039 17,00,1502005-06 21,19,221 11,32,795 9,86,426 41,51,763 22,62,765 18,88,9982007-08 16,10,721 8,56,703 7,54,018 46,08,160 24,90,714 21,17,4462008-09 10,66,076 524,060 5,42,016 46,18,910 23,63,527 22,55,3832009-10 16,94,900 870,889 8,24,011 49,78,146 26,52,783 2,325,363Ambala 61,095 30,777 30,318 2,05,506 1,04,304 1,01,202Panchkula 19,042 10,482 8,560 1,09,577 60,710 48,867Yamunanagar 1,10.219 58,438 51,781 2,50,178 1,38,252 1,11,926Kurukshetra 54,506 28,400 26,106 1,61,776 86,828 74,948Kaithal 1,07,172 56,123 51,049 2,24,081 1,21,132 1,02,949Karnal 39,887 21,173 18,714 2,68,324 1,42,412 1,25,912Panipat 63,331 32,454 30,877 1,76,136 93,861 82,275Sonipat 64,890 32,646 32,244 3,01,776 1,66,642 1,35,134Rohtak 1,12,716 54,695 58,021 2,16,531 1,05,821 1,10,710Jhajjar 21,468 11,263 10,205 1,62,590 84,444 78,146Faridabad 2,04,768 1,02,446 1,02,322 4,31,497 2,09,193 2,22,304Palwal 63,265 28,124 35,141 2,27,100 1,20,318 1,06,782Gurgaon 1,04,698 53,878 50,820 2,17,265 1,13,461 1,03,804Mewat 1,43,294 80,404 62,890 1,93,394 1,14,949 78,445Rewari 43,352 21,737 21,615 1,59,870 83,622 76,248Mahendragarh 8,865 4,306 4,559 1,43,163 76,893 66,270Bhiwani 98,197 40,357 57,840 4,24,098 2,30,765 1,93,333Jind 42,575 22,764 19,811 2,86,173 1,54,055 1,32,118Hisar 1,53,812 78,009 75,803 3,82,777 1,97,760 1,85,107Fatehabad 75,694 49,719 25,975 2,19,756 1,33,760 85,996Sirsa 1,02,054 52,694 49,360 2,16,578 1,13,691 1,02,887
Source :—Director of Secondary/Middle/Primary Education, Haryana.

143
EDUCATION Number of Scheduled Castes Scholars in Recognised Schools in Haryana
No. 6.7 High/Senior Secondary/Navodya Schools Middle Schools
Year/District Total Boys Girls Total Boys Girls
1 2 3 4 5 6 7
1966-67 30,617 27,360 3,257 22,899 19,247 3,652
1970-71 57,532 50,818 6,714 26,636 22,640 3,996
1975-76 69,359 61,676 7,683 29,069 24,402 4,667
1980-81 1,21,030 99,318 21,712 41,678 32,244 9,434
1985-86 1,98,255 1,44,884 53,371 70,099 43,754 26,345
1990-91 2,50,373 1,66,079 84,294 1,12,606 63,359 49,247
1995-96 3,32,142 2,07,564 1,24,578 1,01,328 53,892 47,436
2000-01 2,48,180 1,50,351 97,829 41,640 23,176 18,464
2005-06 2,99,371 1,73,389 1,25,982 63,241 32,647 30,594
2007-08 4,89,431 2,66,677 2,22,754 1,60,904 85,673 75,231
2008-09 7,15,039 3,80,007 3,35,032 1,61,036 83,573 74,963
2009-10 5,57,433 3,00,608 2,56,825 2,19,469 1,14,220 1,05,249
Ambala 35,874 18,259 17,615 13,628 6,993 6,635
Panchkula 13,336 7,034 6,302 5,121 2,787 2,334
Yamunanagar 20,067 10,505 9,562 18,180 9,405 8,775
Kurukshetra 12,594 6,937 5,657 6,196 3,133 3,063
Kaithal 27,393 15,519 11,874 4,025 1,962 2,063
Karnal 49,871 25,692 24,179 20,160 10,552 9,608
Panipat 27,022 15,349 11,673 12,987 7,301 5,686
Sonipat 47,714 25,821 21,893 11,912 6,034 5,878
Rohtak 8,602 4,397 4,205 9,899 4,990 4,909
Jhajjar 29,730 14,842 14,888 5,827 3,079 2,748
Faridabad 17,746 8,597 9,149 17,960 8,508 9,452
Palwal 23,901 14,478 9,423 11,070 6,150 4,920
Gurgaon 15,926 8,528 7,398 8,625 4,548 4,077
Mewat 4,579 2,065 1,514 3,103 1,654 1,449
Rewari 19,775 10,144 9,631 2,007 1,112 895
Mahendragarh 25,765 13,372 12,393 7,516 3,687 3,829
Bhiwani 45,561 25,267 20,294 12,484 6,366 6,118
Jind 49,233 26,752 22,481 14,948 7,676 7,272
Hisar 21,152 11,553 9,599 21,165 10,884 10,281
Fatehabad 36,067 20,870 15,197 8,046 5,200 2,846
Sirsa 26,525 14,627 11,898 4,610 2,199 2,411

144
EDUCATION Number of Scheduled Castes Scholars in Recognised Schools in Haryana
No. 6.7 (Concld.) Primary/pre-primary Schools Grand Total
Year/District Total Boys Girls Total Boys Girls
1 8 9 10 11 12 13 1966-67 62,249 53,853 8,396 1,15,765 1,00,460 15,3051970-71 64,909 54,294 10,615 1,49,077 1,27,752 21,3251975-76 91,728 71,906 19,822 1,90,156 1,57,984 32,1721980-81 1,09,554 76,042 33,512 2,72,262 2,07,604 64,6581985-86 1,63,438 91,627 71,811 4,31,792 2,80,265 1,51,5271990-91 2,11,060 1,11,335 99,725 5,74,039 3,40,773 2,33,2661995-96 2,39,820 1,16,436 1,23,384 6,73,290 3,77,892 2,95,3982000-01 5,39,665 2,82,129 2,57,536 8,29,485 4,55,656 3,73,8292005-06 6,17,756 3,24,051 2,93,705 9,80,368 5,30,087 4,50,2812007-08 4,69,485 2,43,639 2,25,846 11,19,820 5,95,989 5,23,8312008-09 142,712 72,080 70,632 1,018,787 535,660 483,1272009-10 472,123 243,803 228,320 1,249,025 658,631 590,394Ambala 31,778 16,523 15,255 81,280 41,775 39,505Panchkula 8,085 4,375 3,710 26,542 14,196 12,346Yamunanagar 36,610 19,265 17,345 74,857 39,175 35,682Kurukshetra 20,203 10,450 9,753 38,993 20,520 18,473Kaithal 37,524 9,952 17,572 68,942 37,433 31,509Karnal 7,364 4,619 2,745 77,395 40,863 36,532Panipat 24,007 13,001 11,006 64,016 35,651 28,365Sonipat 11,504 5,643 5,861 71,130 37,498 33,632Rohtak 24,328 12,426 11,902 42,829 21,813 21,016Jhajjar 4,491 2,328 2,163 40,048 20,249 19,799Faridabad 40,905 21,026 19,879 76,611 38,131 38,480Palwal 12,343 5,535 6,808 47,314 26,163 21,151Gurgaon 28,448 14,850 13,598 52,999 27,926 25,073Mewat 11,833 5,989 5,844 18,515 9,708 8,807Rewari 14,638 7,585 7,053 36,420 18,841 17,579Mahendragarh 4,734 2,338 2,396 38,015 19,397 18,618Bhiwani 17,182 8,659 8,523 75,227 40,292 34,935Jind 12,335 7,057 5,278 76,516 41,485 35,031Hisar 45,349 23,399 21,950 87,666 45,836 41,830Fatehabad 27,446 13,087 14,359 71,559 39,157 32,402Sirsa 51,016 25,696 25,320 82,151 42,522 39,629
Source :—Director of Secondary/Middle/Primary Education, Haryana.

145
EDUCATION Number of Teachers in Recognised Schools in Haryana according to type
of Institutions No. 6.8
High/Senior Secondary/Multipurpose Middle/Senior Basic Schools Year/District
Male Female Total Male Female Total
1 2 3 4 5 6 7
1970-71* 14,298 5,083 19,381 5,718 2,240 7,958
1975-76* 16,261 7,122 23,383 5,843 2,464 8,307
1980-81* 21,889 9,810 31,699 5,882 2,851 8,733
1985-86 25,980 14,963 40,943 6,621 4,126 10,747
1990-91 27,463 17,685 45,148 7,382 4,797 12,179
1995-96 32,670 23,893 56,563 8,057 5,026 13,083
2000-01 33,234 24,245 57,479 5,562 2,834 8,396
2005-06 39,097 29,088 68,185 6,539 4,636 11,175
2007-08 45,921 39,991 85,912 9,873 8,641 18,514
2008-09 50,643 45,852 96,495 12,195 8,670 20,865
2009-10 49,506 41,900 91,406 11,258 8,870 20,128
Ambala 1,655 1,602 3,257 550 682 1,232
Panchkula 557 2,028 2,585 157 470 627
Yamunanagar 3,040 3,676 6,716 666 639 1,305
Kurukshetra 1,606 1,552 3,158 353 253 606
Kaithal 1,786 1,025 2,811 673 353 1,026
Karnal 1,914 2,283 4,197 514 438 952
Panipat 2,117 1,702 3,819 748 517 1,265
Sonipat 3,647 3,257 6,904 658 734 1,392
Rohtak 1,755 2,423 4,178 166 283 449
Jhajjar 2,273 2,627 4,900 444 497 941
Faridabad 1,635 1,723 3,358 512 784 1,296
Palwal 1,934 976 2,910 483 207 690
Gurgaon 2,368 2,412 4,780 506 441 947
Mewat 796 290 1,086 358 81 439
Rewari 2,702 1,962 4,664 445 357 802
Mahendragarh 3,327 1,376 4,703 648 189 837
Bhiwani 5,171 2,902 8,073 1,437 838 2,275
Jind 3,442 2,528 5,970 702 281 983
Hisar 3,975 2,765 6,740 561 424 985
Fatehabad 1,731 1,281 3,012 394 227 621
Sirsa 2,075 1,510 3,585 283 175 458

146
EDUCATION Number of Teachers in Recognised Schools in Haryana according to type
of Institutions No. 6.8 (Concld.)
Primary/Junior Basic/Pre-primary and Balwari Schools
Grand Total Year/District
Male Female Total Male Female Total 1 8 9 10 11 12 13
1970-71* 9,634 3,444 13,078 29,650 10,767 40,4171975-76* 11,707 5,184 16,891 33,811 14,770 48,5811980-81* 10,493 4,587 15,080 38,264 17,248 55,5121985-86 9,582 5,995 15,577 42,183 25,084 67,2671990-91 12,118 8,050 20,168 46,963 30,532 77,4951995-96 9,543 8,398 17,941 50,270 37,317 87,5872000-01 24,058 24,405 48,463 62,854 51,484 1,14,3382005-06 25,381 25,240 50,621 71,017 58,964 1,29,9812007-08 15,277 14,847 30,124 71,071 63,479 1,34,5502008-09 16,945 18,989 35,934 79,783 73,511 153,2942009-10 16,291 15,232 31,523 77.055 66,002 1,43,057Ambala 785 1,017 1,802 2,990 3,301 6,291Panchkula 187 418 605 901 2,916 3,817Yamunanagar 509 512 1,021 4,215 4,827 9,042Kurukshetra 545 550 1,095 2,504 2,355 4,859Kaithal 1,388 940 2,328 3,847 2,318 6,165Karnal 625 618 1,243 3,053 3,339 6,392Panipat 646 670 1,316 3,511 2,889 6,400Sonipat 660 1,128 1,788 4,965 5,119 10,084Rohtak 476 1,242 1,718 2,397 3,948 6,345Jhajjar 211 318 529 2,928 3,442 6,370Faridabad 971 1,322 2,293 3,118 3,829 6,947Palwal 770 330 1,100 3,187 1,513 4,700Gurgaon 634 686 1,320 3,508 3,539 7,047Mewat 1,594 174 1,768 2,748 545 3,293Rewari 772 619 1,391 3,919 2,938 6,857Mahendragarh 541 159 700 4,516 1,724 6,240Bhiwani 716 625 1,341 7,324 4,365 11,689Jind 783 323 1,106 4,927 3,132 8,059Hisar 1,697 2,059 3,756 6,233 5,248 11,481Fatehabad 400 371 771 2,525 1,879 4,404Sirsa 1,381 1,151 2,532 3,739 2,836 6,575
Source :—Director of Secondary/Middle/Primary Education, Haryana. *Teachers of pre-Primary Schools not included.

147
EDUCATION
Number of Students in Schools of Haryana (Classwise) No. 6.9
Classes I to V* Classes VI to VIII Classes IX to XII Year/District
Boys Girls Total Boys Girls Total Boys Girls Total 1 2 3 4 5 6 7 8 9 10
1970-71 6,10,764 2,48,228 8,58,992 2,62,392 73,292 3,35,684 1,30,164 36,788 1,66,952@ 1975-76** 7,51,761 3,52,291 11,04,052 2,90,118 92,094 3,82,212 1,51,828 43,807 1,95,635@ 1980-81 8,22,640 4,22,847 12,45,487 3,51,514 1,25,778 4,77,292 1,35,398 41,443 1,76,841 1985-86 9,47,888 6,27,665 15,75,553 4,08,991 1,78,566 5,87,557 1,81,537 65,420 2,46,957 1990-91 8,99,520 7,15,098 16,14,618 4,58,477 2,67,948 7,26,425 2,70,041 1,27,411 3,97,452 1995-96 10,25,420 8,70,477 18,95,897 4,77,060 3,40,709 8,17,769 2,57,780 1,49,627 4,07,407 2000-01 10,63,730 9,54,125 20,17,855 5,33,181 4,18,313 9,51,494 4,93,172 3,26,727 8,19,899 2005-06 10,66,744 9,30,747 19,97,491 6,33,189 5,26,647 11,59,836 4,96,781 3,76,025 8,72,806 2007-08 11,85,645 10,48,075 22,33,720 6,32,088 5,31,555 11,63,643 5,97,825 4,74,286 10,72,111 2008-09 10,90,237 10,32,150 21,22,387 5,84,956 5,74,351 11,59,307 6,06,874 5,70,757 11,77,631 2009-10 11,83,564 10,29,893 22,13,457 6,40,266 5,49,797 11,90,073 6,94,962 6,09,535 13,04,497 Ambala 36,226 34,966 71,192 35,705 34,672 70,377 28,888 28,248 57,136 Panchkula 27,056 21,389 48,445 16,359 12,613 28,972 12,518 10,836 23,354 Yamunanagar 49,118 44,616 93,734 38,640 25,575 64,215 41,174 34,570 75,744 Kurukshetra 39,060 34,581 73,641 24,120 20,460 44,580 22,333 18,716 41,049 Kaithal 54,232 49,390 1,03,622 32,672 27,802 60,474 32,337 24,098 56,435 Karnal 68,156 60,706 1,28,862 36,706 32,850 69,556 34,634 29,780 64,414 Panipat 45,927 15,778 61,705 22,065 8,694 30,759 22,893 14,053 36,946 Sonipat 73,106 60,366 1,33,472 39,643 32,999 72,642 46,400 36,175 82,575 Rohtak 52,765 56,221 1,08,986 23,429 23,921 47,350 27,698 28,768 56,466 Jhajjar 21,920 21,928 43,848 10,603 11,305 21,908 17,092 18,870 35,962 Faridabad 99,028 96,079 1,95,107 41,299 42,326 84,625 64,499 77,366 1,41,865 Palwal 73,190 65,749 1,38,939 26,,019 23,899 49,918 21,119 17,154 38,273 Gurgaon 51,546 46,636 98,182 32,316 30,426 62,742 50,248 47,038 97,286 Mewat 67,771 61,657 1,29,428 16,912 8,284 25,196 15,498 6,117 21,615 Rewari 36,820 32,693 69,513 20,377 18,709 39,086 26,424 24,846 51,270 Mahendragarh 29,834 25,045 54,879 20,800 19,411 40,211 23,737 20,148 43,885 Bhiwani 83,286 72,067 1,55,353 47,683 41,588 89,271 50,571 41,475 92,046 Jind 70,777 62,822 1,33,599 40,591 34,603 75,194 38,377 30,567 68,944 Hisar 77,957 76,022 1,53,979 46,956 44,955 91,911 68,433 60,134 1,28,567 Fatehabad 72,807 41,586 1,14,393 33,075 23,588 56,663 23,880 18,402 42,282 Sirsa 52,982 49,596 1,02,578 34,296 31,117 65,413 26,209 22,174 48,383 @ Class IX to XI. Source :—Director of Secondary/Middle/Primary Education Haryana. * Students of Pre-Primary Schools have not been included. ** Includes 37 boys and 2 girls studying in attached Primary Classes in J.B.T. School, Khunga Kothi.
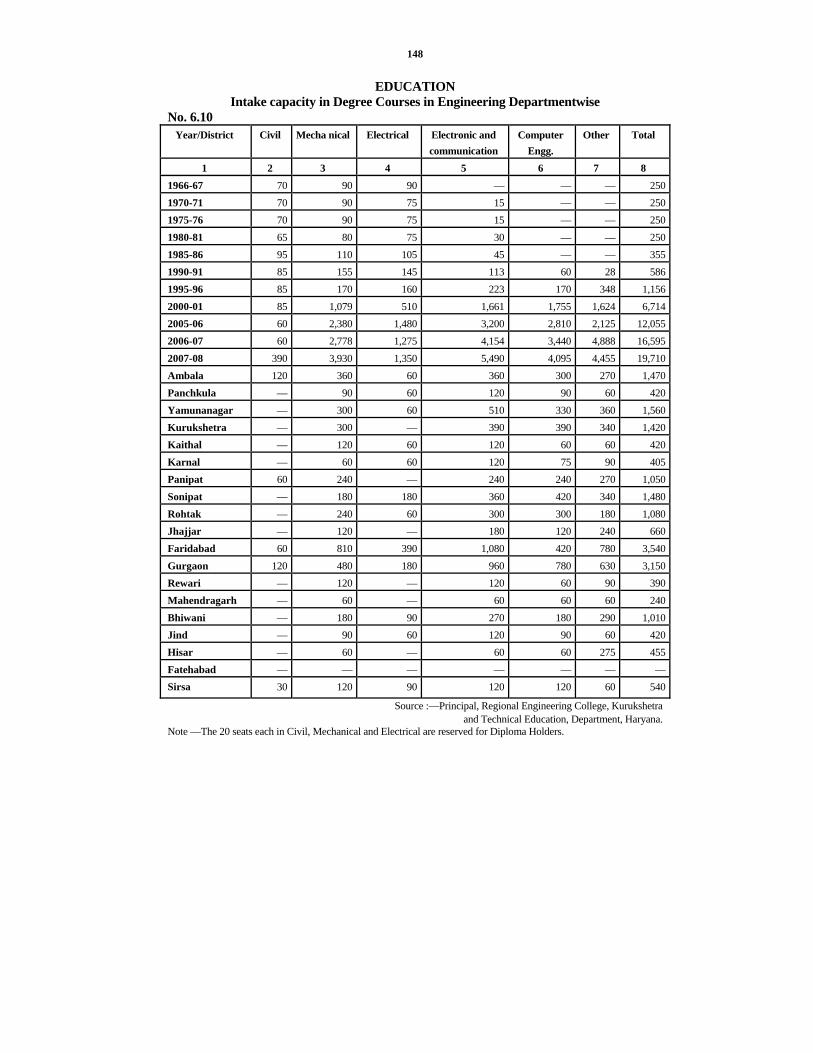
148
EDUCATION Intake capacity in Degree Courses in Engineering Departmentwise
No. 6.10 Year/District Civil Mecha nical Electrical Electronic and
communication Computer
Engg. Other Total
1 2 3 4 5 6 7 8 1966-67 70 90 90 — — — 2501970-71 70 90 75 15 — — 2501975-76 70 90 75 15 — — 2501980-81 65 80 75 30 — — 2501985-86 95 110 105 45 — — 3551990-91 85 155 145 113 60 28 5861995-96 85 170 160 223 170 348 1,1562000-01 85 1,079 510 1,661 1,755 1,624 6,7142005-06 60 2,380 1,480 3,200 2,810 2,125 12,0552006-07 60 2,778 1,275 4,154 3,440 4,888 16,5952007-08 390 3,930 1,350 5,490 4,095 4,455 19,710Ambala 120 360 60 360 300 270 1,470Panchkula — 90 60 120 90 60 420Yamunanagar — 300 60 510 330 360 1,560Kurukshetra — 300 — 390 390 340 1,420Kaithal — 120 60 120 60 60 420Karnal — 60 60 120 75 90 405Panipat 60 240 — 240 240 270 1,050Sonipat — 180 180 360 420 340 1,480Rohtak — 240 60 300 300 180 1,080Jhajjar — 120 — 180 120 240 660Faridabad 60 810 390 1,080 420 780 3,540Gurgaon 120 480 180 960 780 630 3,150Rewari — 120 — 120 60 90 390Mahendragarh — 60 — 60 60 60 240Bhiwani — 180 90 270 180 290 1,010Jind — 90 60 120 90 60 420Hisar — 60 — 60 60 275 455Fatehabad — — — — — — —Sirsa 30 120 90 120 120 60 540
Source :—Principal, Regional Engineering College, Kurukshetra and Technical Education, Department, Haryana.
Note —The 20 seats each in Civil, Mechanical and Electrical are reserved for Diploma Holders.
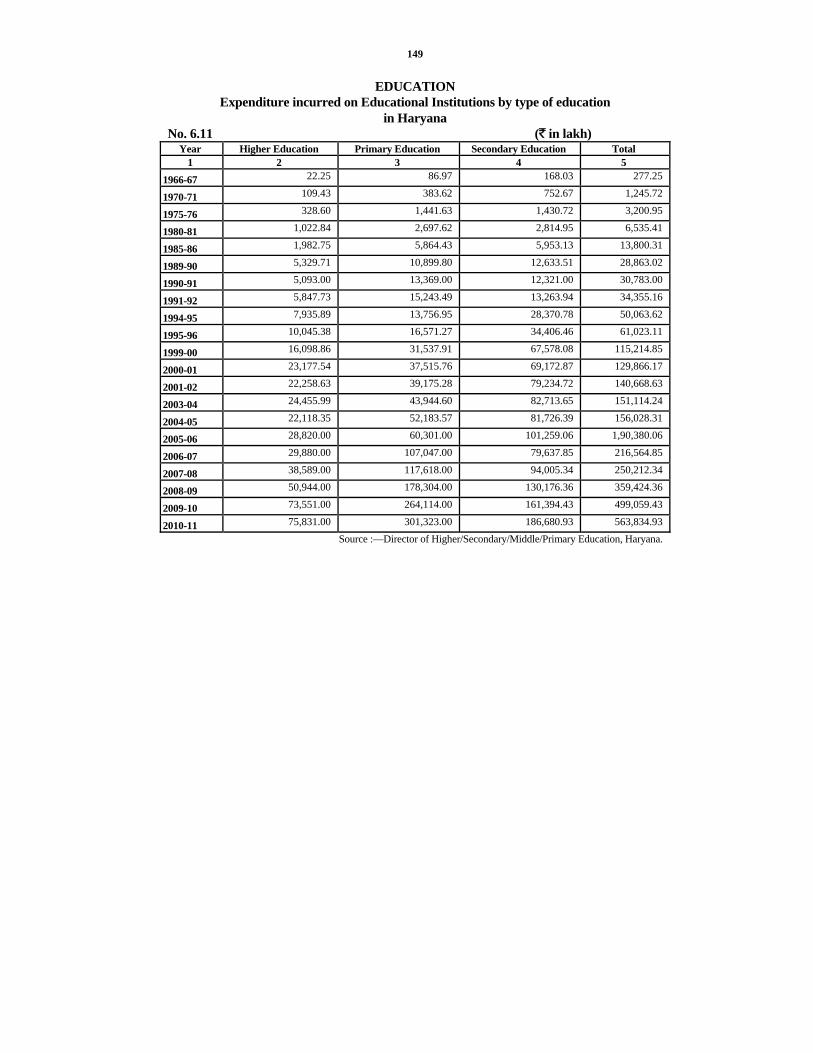
149
EDUCATION Expenditure incurred on Educational Institutions by type of education
in Haryana No. 6.11 (` in lakh)
Year Higher Education Primary Education Secondary Education Total 1 2 3 4 5
1966-67 22.25 86.97 168.03 277.25
1970-71 109.43 383.62 752.67 1,245.72
1975-76 328.60 1,441.63 1,430.72 3,200.95
1980-81 1,022.84 2,697.62 2,814.95 6,535.41
1985-86 1,982.75 5,864.43 5,953.13 13,800.31
1989-90 5,329.71 10,899.80 12,633.51 28,863.02
1990-91 5,093.00 13,369.00 12,321.00 30,783.00
1991-92 5,847.73 15,243.49 13,263.94 34,355.16
1994-95 7,935.89 13,756.95 28,370.78 50,063.62
1995-96 10,045.38 16,571.27 34,406.46 61,023.11
1999-00 16,098.86 31,537.91 67,578.08 115,214.85
2000-01 23,177.54 37,515.76 69,172.87 129,866.17
2001-02 22,258.63 39,175.28 79,234.72 140,668.63
2003-04 24,455.99 43,944.60 82,713.65 151,114.24
2004-05 22,118.35 52,183.57 81,726.39 156,028.31
2005-06 28,820.00 60,301.00 101,259.06 1,90,380.06
2006-07 29,880.00 107,047.00 79,637.85 216,564.85
2007-08 38,589.00 117,618.00 94,005.34 250,212.34
2008-09 50,944.00 178,304.00 130,176.36 359,424.36
2009-10 73,551.00 264,114.00 161,394.43 499,059.43
2010-11 75,831.00 301,323.00 186,680.93 563,834.93 Source :—Director of Higher/Secondary/Middle/Primary Education, Haryana.

150
EDUCATION Teacher Pupil Ratio
No. 6.12 Year/District Primary Middle High Senior Secondary
1 2 3 4 5
1966-67 43 30 — 18
1970-71 43 30 — 17
1975-76 39 32 — 21
1980-81 41 32 — 17
1985-86 46 33 — 17
1990-91 46 36 20 46
1995-96 47 35 18 15
2000-01 42 32 22 21
2005-06 42 26 26 26
2008-09 30 15 33 29
2009-10 34 44 27 26
Ambala 34 30 29 35
Panchkula 32 32 30 26
Yamunanagar 108 49 15 9
Kurukshetra 50 40 23 28
Kaithal 46 15 31 41
Karnal 32 70 52 31
Panipat 48 30 20 19
Sonipat 36 33 30 26
Rohtak 66 105 36 8
Jhajjar 41 25 22 25
Faridabad 89 65 25 59
Palwal 58 65 46 36
Gurgaon 79 40 23 12
Mewat 81 62 29 21
Rewari 31 15 21 23
Mahendragarh 13 25 23 25
Bhiwani 73 46 26 29
Jind 39 53 29 36
Hisar 41 89 24 21
Fatehabad 98 31 47 37
Sirsa 40 25 22 35Source :—Director of Secondary/Middle/Primary Education, Haryana.

151
EDUCATION Recognised Educational Institutions in India during 2009-10 by type and Status
No. 6.13 (As on 30th September, 2009)
State/Union Territories
University** Board of Intermediate/
Secondary Education
Colleges for Arts, Science
and Commerce
Technology and Engineer ing Colleges
Medical Colleges*
1 2 3 4 5 6 Andhra Pradesh 31 3 1970 698 415 Arunachal Pradesh 2 0 17 3 1 Assam 8 3 337 9 7 Bihar 20 3 817 10 37Chhattisgarh 9 4 365 131 42Delhi 19 3 89 15 8 Goa 1 1 22 2 2 Gujarat 26 1 577 29 114 Haryana 12 1 238 154 50 Himachal Pradesh 7 1 377 14 23 Jammu & Kashmir 10 1 92 4 15 Karnataka 29 2 369 174 423 Kerala 11 2 192 98 125 Madhya Pradesh 21 2 896 208 102Jharkhand 8 1 110 4 12 Maharashtra 42 1 2,074 312 141 Manipur 1 2 59 3 1 Meghalaya 2 1 88 2 3 Mizoram 1 1 23 0 2 Nagaland 1 1 45 0 0 Orissa 15 2 634 82 69 Punjab 14 1 234 82 37 Rajasthan 24 3 1,135 96 54 Sikkim 3 0 5 2 3 Tamil Nadu 43 1 589 440 198 Tripura 3 1 16 2 4 Uttar Pradesh 36 1 2,361 212 104Uttarakhand 12 1 107 14 20 West Bengal 20 4 434 73 51Union Territories 5 0 49 21 11Total 436 48 14,321 2,894 2,074**Also includes Institutions deemed as Universities and institutions of national importance. *Including Allop/Ayur/Homeo/Unani/Nurs./Pharm etc.

152
EDUCATION
Recognised Educational Institutions in India during 2009-10 by type and Status No. 6.13 (Contd.) (As on 30th September, 2009)
State/Union Territories Teacher Training
Colleges Polytechnics,
Technical, Industrial, Arts & Crafts Schools
Teacher Training Schools
(2006-07)
Pre-Primary Schools
1 7 8 9 10
Andhra Pradesh 615 213 25 0
Arunachal Pradesh 1 3 0 1,688
Assam 40 10 1 0
Bihar 33 17 57 1
Chhattisgarh 4 15 7 1,346
Delhi 2 79 38 50
Goa 0 4 14 0
Gujarat 254 104 491 0
Haryana 447 32 18 17
Himachal Pradesh 82 26 12 14
Jammu & Kashmir 147 0 14 0
Karnataka 0 273 733 0
Kerala 21 59 210 0
Madhya Pradesh 102 49 25 0
Jharkhand 9 19 28 95
Maharashtra 471 227 395 56,145
Manipur 5 3 1 1
Meghalaya 4 3 13 711
Mizoram 2 2 8 0
Nagaland 3 0 1 0
Orissa 14 24 63 0
Punjab 48 89 26 0
Rajasthan 111 71 48 8
Sikkim 2 2 1 1,170
Tamil Nadu 645 363 82 5,959
Tripura 1 1 4 0
Uttar Pradesh 128 163 70 0
Uttarakhand 24 0 13 0
West Bengal 103 57 138 0
Union Territories 39 6 36 617
Total 3,357 1,914 2,572 67,822

153
EDUCATION Recognised Educational Institutions in India during 2009-10 by type and Status
No. 6.13 (Concld.) (As on 30th September, 2009)
State/Union Territories
Primary Schools
Middle Schools High Schools Higher Secondary Schools (Old and New pattern), Intermediate and Junior
Colleges 1 11 12 13 14
Andhra Pradesh 65,932 15,381 18,163 4,364Arunachal Pradesh 1,841 871 190 117Assam 31,202 14,133 5,562 855Bihar 43,445 20,696 2,399 1,837Chhattisgarh 35,344 15,147 2,104 2,544Delhi 2,586 583 474 1,350Goa 1,252 444 376 82Gujarat 17,779 24,366 5,791 3,508Haryana 13,073 3,439 3,493 3,278Himachal Pradesh 11,301 4,921 1,413 1,674Jammu & Kashmir 15,446 8,877 2,216 889Karnataka 26,254 32,041 12,453 3,644Kerala 6,796 3,062 3,388 2,380Madhya Pradesh 97,800 39,227 6,352 5,161Jharkhand 19,818 9,996 1,429 225Maharashtra 49,101 27,271 19,711 967Manipur 2,579 792 704 120Meghalaya 6,618 2,259 676 124Mizoram 1,782 1,313 521 95Nagaland 1,662 465 337 69Orissa 52,972 22,209 7,799 1,144Punjab 16,954 9,110 2,741 2,380Rajasthan 49,538 38,889 12,460 6,675Sikkim 749 244 126 59Tamil Nadu 27,037 9,966 3,030 3,518Tripura 2,379 1,139 454 316Uttar Pradesh 1,32,403 51,948 7,889 8,547Uttarakhand 15,644 4,296 1,087 1,352West Bengal 73,100 4,296 65 9,391Union Territories 775 364 323 252Total 8,23,162 3,67,745 1,23,726 66,917
Source :—Ministry of Human Resources Development (Deptt. of Education), Government of India.

154
EDUCATION Number of Teachers in Recognised Schools in India during 2009-10*—Statewise
No. 6.14 State/Union Territories Primary Schools Middle Schools High/Higher Secondary
Schools/Jr. College New scheme (10+2)
1 2 3 4 Andhra Pradesh 1,69,159 90,077 2,34,048 Arunachal Pradesh 6,363 5,792 5,453 Assam 86,676 81,637 77,857 Bihar 1,41,298 1,24,342 57,430Jharkhand 1,07,481 53,995 40,509Delhi 28,166 7,297 74,771 Goa 3,904 2,515 4,567 Gujarat 44,946 1,99,385 86,775 Haryana 31,574 20,128 91,406 Himachal Pradesh 30,336 34,389 25,726 Jammu & Kashmir 59,376 45,151 43,859 Karnataka 59,457 2,23,272 1,36,125 Kerala 40,069 44,136 1,24,491 Madhya Pradesh 2,92,062 1,42,395 1,15,301Chhattisgarh 50,537 53,800 13,235 Maharashtra 1,99,415 2,05,769 2,98,012 Manipur 7,667 8,597 11,756 Meghalaya 14,745 9,407 6,181 Mizoram 8,477 7,564 5,077 Nagaland 7,956 5,804 9,022 Orissa 1,36,064 54,707 89,270 Punjab 55,858 50,031 65,955 Rajasthan 1,13,639 2,19,555 1,78,607 Sikkim 7,845 2,229 2,075 Tamil Nadu 1,24,657 67,612 1,20,648 Tripura 7,936 9,522 18,498 Uttar Pradesh 3,54,976 98,072 2,02,692Uttarakhand 46,345 19,829 41,365 West Bengal 2,36,720 21,679 1,40,654Union Territories 6,710 3,897 17,707Total 24,80,414 19,12,585 23,39,072
Source :—Ministry of Human Resource Development (Deptt. of Education), Government of India. *As on 30th September, 2009.

155
EDUCATION Scholars on Roll in Recognised Educational Institutions in India
during 2009-10*—Statewise No. 6.15
State/Union Territories
Classes I—V Classes VI—VIII
High School (IX—X)
Inter/Higher Secondary
(New and old pattern) Pre-
University (Two years
and one year courses)
Teacher Training Schools Level
(2006-07)
Technical and
Industrial Schools
(2006-07)
Higher Education
1 2 3 4 5 6 7 8 Andhra Pradesh 71,37,291 36,18,763 21,71,400 14,73,913 5,977 1,11,585 16,53,708Arunachal Pradesh 2,16,845 78,549 34,511 20,861 0 368 25,329Assam 29,22,714 13,74,217 6,56,482 1,75,108 167 4,620 3,27,331Bihar 1,39,07,798 41,26,665 16,82,207 7,21,569 295 14,968 13,00,094Jharkhand 54,64,268 13,49,723 4,19,115 94,947 581 14,864 3,64,459Delhi 16,99,939 9,97,280 5,17,064 3,89,293 11,530 11,912 10,35,122Goa 1,27,281 67,187 36,976 27,488 195 3,072 52,844Gujarat 65,82,139 28,90,766 13,59,732 8,13,753 19,591 87,126 10,70,283Haryana 21,86,379 11,90,063 6,74,132 6,29,365 2,174 14,905 5,93,895Himachal Pradesh 6,23,198 4,12,919 2,23,225 1,77,824 260 6,629 1,86,813Jammu & Kashmir 12,74,874 6,55,432 3,21,009 2,18,258 3,045 4,332 2,77,623Karnataka 54,60,043 29,45,159 16,29,891 9,87,645 39,982 59,916 12,60,038Kerala 24,25,078 16,53,026 10,35,137 5,38,237 18,759 60,121 4,35,885Madhya Pradesh 1,17,80,132 47,83,703 19,66,651 12,11,034 2,490 22,398 12,39,756Chattisgarh 32,34,910 13,36,956 5,37,011 3,02,996 917 5,688 5,65,157Maharashtra 1,03,64,831 55,17,029 30,52,614 23,56,976 25,664 97,184 27,37,264Manipur 3,71,659 1,46,559 80,596 32,133 76 540 49,181Meghalaya 4,72,653 1,50,568 55,791 13,164 486 942 55,394Mizoram 1,41,663 60,888 30,421 17,249 3,329 294 35,631Nagaland 2,19,804 90,226 32,000 20,634 75 404 42,727Orissa 44,93,299 20,20,896 9,08,956 3,79,.236 3,192 23,988 5,36,374Punjab 25,03,839 13,32,040 5,59,183 4,58,558 2,231 19,067 3,48,418Rajasthan 87,98,956 39,28,043 17,58,944 10,54,687 4,604 13,340 7,67,656Sikkim 81,172 33,175 12,589 8,416 143 140 19,237Tamil Nadu 62,00,456 37,35,168 18,76,194 11,68,438 4,666 87,003 13,85,251Tripura 4,44,516 2,19,303 1,06,841 40,739 682 416 52,786Uttar Pradesh 2,50,73,905 95,00,226 64,56,556 30,12,332 9,660 51,928 25,36,357Uttarakhand 11,00,139 6,26,216 3,43,080 2,34,309 18,550 7,680 4,34,203West Bengal 1,00,66,104 44,07,822 19,65,622 10,15,344 16,171 12,920 12,49,659Union Territories 2,93,958 1,72,435 94,589 72,848 2,518 3,980 1,02,265Total 13,56,69,843 5,94,21,002 3,05,98,519 1,76,67,344 1,98,010 7,42,330 2,07,40,740
Source :—Ministry of Human Resources Development (Deptt. of Education), Government of India. As on 30th Septemeber, 2009.

156
EDUCATION Enrolment Ratio in Classes I—V and VI—VIII of Recognised Schools for General
Education in India during 2009-10* (Statewise) No. 6.16
Classes I—V (6—11 years) Classes VI—VIII (11—14 years) State
Boys Girls Total Boys Girls Total 1 2 3 4 5 6 7
Andhra Pradesh 98.02 98.29 98.16 77.92 77.37 77.65Arunachal Pradesh 169.99 163.42 166.77 106.14 96.21 101.20Assam 91.67 94.15 92.89 67.32 70.32 68.80Bihar 125.71 109.20 117.83 60.84 49.70 55.46Jharkhand 157.46 158.21 157.83 71.22 49.71 60.65Delhi 119.86 122.54 121.10 110.82 106.95 109.01Goa 93.44 91.67 92.59 81.18 77.11 79.24Gujarat 119.95 120.97 120.42 90.52 82.01 86.51Haryana 88.56 92.00 90.10 77.34 80.64 78.86Himachal Pradesh 107.71 107.67 107.69 114.62 112.08 113.41Jammu & Kashmir 110.34 112.60 111.41 95.34 90.87 93.20Karnataka 105.39 104.00 104.71 90.92 87.69 89.34Kerala 93.42 93.88 93.65 107.13 102.35 104.77Madhya Pradesh 149.34 150.03 149.67 106.08 97.42 101.87Chhatisgarh 126.32 120.52 123.46 87.16 81.08 84.15Maharashtra 104.90 102.30 103.66 91.54 86.93 89.32Manipur 189.66 182.26 186.01 107.21 99.19 103.25Meghalaya 169.95 174.09 172.01 80.45 91.44 85.92Mizoram 173.95 162.20 168.15 100.83 94.98 97.93Nagaland 99.63 98.89 99.27 59.13 60.70 59.89Orissa 118.42 119.28 118.84 85.39 82.01 83.74Punjab 108.56 107.50 108.09 93.59 89.73 91.84Rajasthan 119.10 115.05 117.19 95.05 72.75 84.36Sikkim 157.91 152.75 155.34 70.89 86.59 78.64Tamil Nadu 114.33 115.29 114.79 114.30 112.09 113.22Tripura 146.81 143.72 145.29 93.33 93.14 93.24Uttar Pradesh 106.59 114.70 110.42 74.29 65.88 70.25Uttarakhand 108.79 111.77 110.12 101.04 107.93 104.33West Bengal 124.79 126.42 125.59 80.27 87.00 83.59U.T’s. 82.77 85.67 84.05 77.95 78.87 78.29All India 115.55 115.39 115.47 84.53 78.30 81.52*As on 30th September, 2009. Source :— Ministry of Human Resources Development
(Deptt. of Education), Government of India.

157
EDUCATION Enrolment ratio of Students belonging to Scheduled Castes in recognized Schools
in India during 2009-10* (Statewise) No. 6.17
Classes I—V (6—11 years) Classes VI—VIII (11—14 Years) State
Boys Girls Total Boys Girls Total 1 2 3 4 5 6 7
Andhra Pradesh 104.62 106.28 105.44 78.80 80.61 79.68Arunachal Pradesh 0.00 0.00 0.00 0.00 0.00 0.00Assam 132.85 134.33 133.58 101.20 99.27 100.24Bihar 129.62 103.83 117.41 55.34 40.59 48.43Jharkhand 188.07 183.57 185.87 60.05 45.11 52.84Delhi 66.67 63.74 65.30 55.06 61.03 57.89Goa 68.82 74.31 71.51 60.70 64.68 62.58Gujarat 110.00 123.05 116.07 86.91 80.52 83.91Haryana 138.41 149.35 143.39 120.49 123.47 121.86Himachal Pradesh 114.44 116.12 115.25 119.81 118.87 119.35Jammu & Kashmir 118.34 116.28 117.37 96.45 95.68 96.08Karnataka 110.88 109.13 110.02 93.46 89.30 91.44Kerala 103.52 101.29 102.42 118.04 110.14 114.13Madhya Pradesh 164.52 168.59 166.45 120.20 112.18 116.40Chhatisgarh 142.98 138.26 140.67 102.52 90.62 96.67Maharashtra 138.09 136.98 137.56 119.12 115.44 117.35Manipur 189.69 177.66 183.80 146.56 132.18 139.41Meghalaya 408.14 492.54 447.93 287.47 245.23 265.66Mizoram 10,375.00 2,766.67 4,668,75 4,766.67 2,525.00 3,485.71Nagaland — — — — — —Orissa 130.19 131.81 130.98 97.57 94.47 96.06Punjab 128.47 131.59 129.90 102.35 105.08 103.61Rajasthan 129.18 124.83 127.15 95.42 73.80 85.24Sikkim 221.80 207.84 214.83 73.67 89.80 81.84Tamil Nadu 131.35 131.80 131.57 134.85 131.25 133.09Tripura 157.95 155.40 156.69 108.34 111.67 109.99Uttar Pradesh 117.71 129.46 123.25 73.05 72.15 76.62Uttarakhand 143.82 152.58 148.03 122.12 129.52 125.65West Bengal 138.25 137.81 138.03 93.48 95.60 94.52U.T’s. 86.26 82.52 84.00 84.40 96.48 89.69All India 127.81 128.72 128.25 90.51 86.59 88.63*As on 30th September, 2009. Source :— Ministry of Human Resources Development
(Deptt. of Education), Government of India.
159
SECTION VII HEALTH AND FAMILY WELFARE
Tables 7.1 to 7.6 present data regarding hospitals, dispensaries, patients treated and staff employed.
Table 7.7 gives information relating to Ayurvedic, Unani & Homoeopathic Institutions and staff working in them.
Table 7.8 Type of Attention at Births per Civil Registration System.
Tables 7.9 and 7.10 give the number of sterilisation operations in Haryana.
Table 7.11 shows the number of villages provided with safe drinking water facilities in Haryana.

160
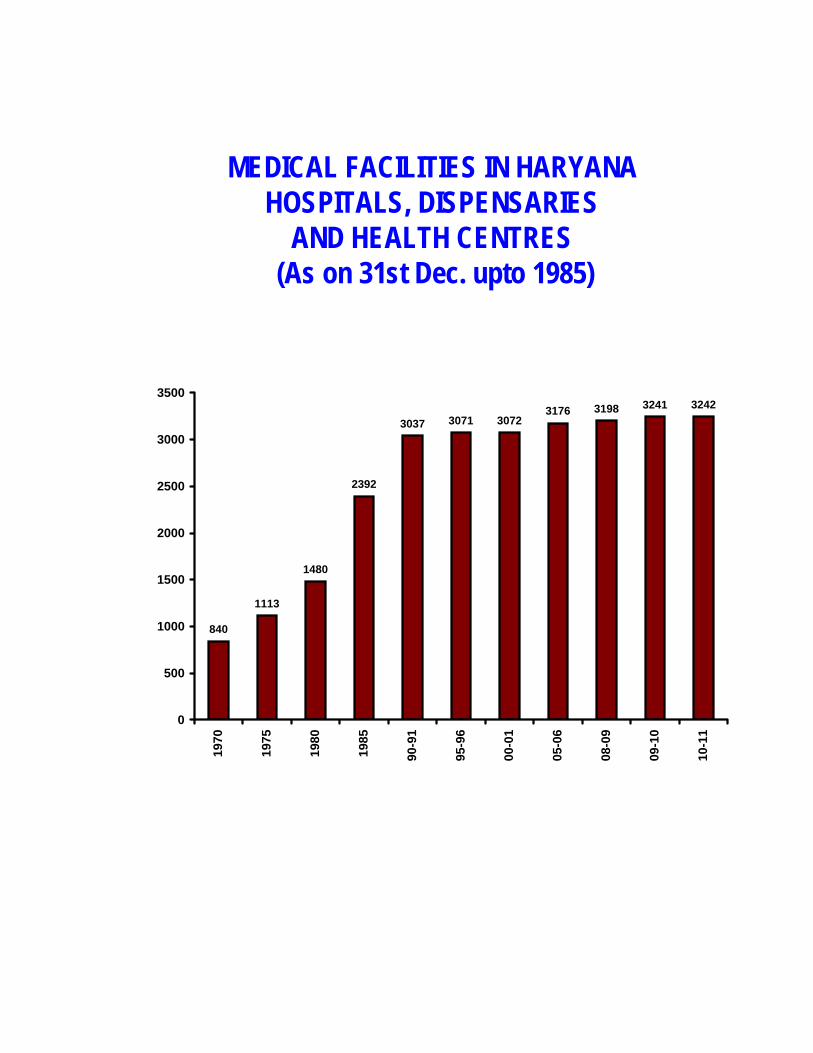
MEDICAL FACILITIES IN HARYANA HOSPITALS, DISPENSARIES
AND HEALTH CENTRES (As on 31st Dec. upto 1985)
840
1113
1480
2392
3037 3071 30723176 3198 3241 3242
0
500
1000
1500
2000
2500
3000
3500
1970
1975
1980
1985
90-9
1
95-9
6
00-0
1
05-0
6
08-0
9
09-1
0
10-1
1
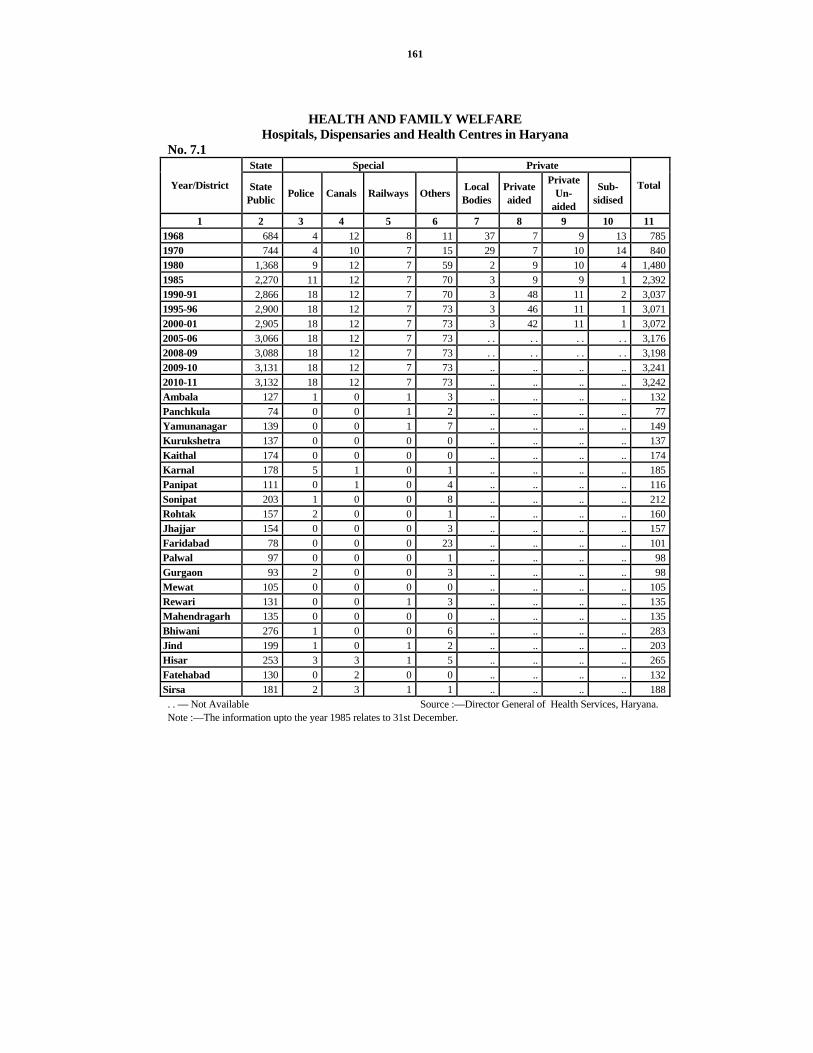
161
HEALTH AND FAMILY WELFARE Hospitals, Dispensaries and Health Centres in Haryana
No. 7.1 State Special Private
Year/District State Public Police Canals Railways Others Local
Bodies Private aided
Private Un-
aided
Sub-sidised
Total
1 2 3 4 5 6 7 8 9 10 11 1968 684 4 12 8 11 37 7 9 13 7851970 744 4 10 7 15 29 7 10 14 8401980 1,368 9 12 7 59 2 9 10 4 1,4801985 2,270 11 12 7 70 3 9 9 1 2,3921990-91 2,866 18 12 7 70 3 48 11 2 3,0371995-96 2,900 18 12 7 73 3 46 11 1 3,0712000-01 2,905 18 12 7 73 3 42 11 1 3,0722005-06 3,066 18 12 7 73 . . . . . . . . 3,1762008-09 3,088 18 12 7 73 . . . . . . . . 3,1982009-10 3,131 18 12 7 73 .. .. .. .. 3,2412010-11 3,132 18 12 7 73 .. .. .. .. 3,242Ambala 127 1 0 1 3 .. .. .. .. 132Panchkula 74 0 0 1 2 .. .. .. .. 77Yamunanagar 139 0 0 1 7 .. .. .. .. 149Kurukshetra 137 0 0 0 0 .. .. .. .. 137Kaithal 174 0 0 0 0 .. .. .. .. 174Karnal 178 5 1 0 1 .. .. .. .. 185Panipat 111 0 1 0 4 .. .. .. .. 116Sonipat 203 1 0 0 8 .. .. .. .. 212Rohtak 157 2 0 0 1 .. .. .. .. 160Jhajjar 154 0 0 0 3 .. .. .. .. 157Faridabad 78 0 0 0 23 .. .. .. .. 101Palwal 97 0 0 0 1 .. .. .. .. 98Gurgaon 93 2 0 0 3 .. .. .. .. 98Mewat 105 0 0 0 0 .. .. .. .. 105Rewari 131 0 0 1 3 .. .. .. .. 135Mahendragarh 135 0 0 0 0 .. .. .. .. 135Bhiwani 276 1 0 0 6 .. .. .. .. 283Jind 199 1 0 1 2 .. .. .. .. 203Hisar 253 3 3 1 5 .. .. .. .. 265Fatehabad 130 0 2 0 0 .. .. .. .. 132Sirsa 181 2 3 1 1 .. .. .. .. 188. . — Not Available Source :—Director General of Health Services, Haryana. Note :—The information upto the year 1985 relates to 31st December.

162
HEALTH AND FAMILY WELFARE
Number of Medical (Allopathic) Institutions in Haryana—Rural and Urban No. 7.2
Rural Urban Year/District
Hospitals PHC’s Dispensaries CHC’s Sub-centers Total Hospitals PHC’s Dispensaries CHC’s Total
1 2 3 4 5 6 7 8 9 10 11 12 1968 3 73 70 — 510 656 58 16 55 — 129 1970 6 71 98 — 534 709 64 18 49 — 131 1980 6 71 149 — 1,060 1,286 78 18 98 — 194 1985 8 164 120 — 1,894 2,186 77 20 106 3 206 1990-91 8 348 39 15 2,293 2,703 71 46 191 26 334 1995-96 8 351 40 26 2,299 2,724 71 47 192 37 347 2000-01 7 361 35 32 2,299 2,734 71 41 194 32 338 2005-06 6 363 31 43 2,433 2,876 54 46 162 38 300 2008-09 6 383 31 54 2,433 2,907 62 37 162 30 291 2009-10 6 393 31 55 2,465 2,950 63 36 162 30 291 2010-11 6 393 31 56 2,465 2,951 63 36 162 30 291 Ambala 0 17 0 3 100 120 5 0 7 0 12 Panchkula 0 7 0 1 51 59 2 2 13 1 18 Yamunanagar 0 14 2 2 111 129 4 4 10 2 20 Kurukshetra 0 18 0 1 107 126 1 3 4 3 11 Kaithal 0 20 1 3 144 168 1 2 1 2 6 Karnal 0 22 5 2 141 170 2 3 7 3 15 Panipat 0 15 1 1 90 107 2 1 5 1 9 Sonipat 0 27 4 4 161 196 2 2 10 2 16 Rohtak 1 21 1 6 113 142 7 0 11 0 18 Jhajjar 1 22 0 4 123 150 2 0 5 0 7 Faridabad 0 10 1 1 57 69 4 0 28 0 32 Palwal 0 13 0 2 78 93 1 1 2 1 5 Gurgaon 0 12 0 1 71 84 6 0 8 0 14 Mewat 1 10 1 1 84 97 0 3 3 2 8 Rewari 0 15 2 4 107 128 3 1 2 1 7 Mahendragarh 0 20 0 2 103 125 1 3 3 3 10 Bhiwani 1 38 5 5 214 263 7 1 11 1 20 Jind 0 25 1 4 158 188 3 2 8 2 15 Hisar 1 32 3 5 200 241 6 3 12 3 24 Fatehabad 0 14 1 2 106 123 2 2 4 1 9 Sirsa 1 21 3 2 146 173 2 3 8 2 15 PHC’s—Primary Health Centres. CHC’s—Community Health Centres. Source :—Director General of Health Services, Haryana. Note :—The information upto the year 1985 relates to 31st December.

163
HEALTH AND FAMILY WELFARE Medical Staff in Haryana*
No. 7.3 (As on 31st December)
Year/District Medical Officers Class I &
II (Excluding Teaching Staff)
Nurses/Matron Sister
Incharge
Midwives/ ANMS
Nurses Orderly
Technicians/Lab. Asstt.
1 2 3 4 5 6
1966 464 269 438 44 64
1970 440 420 454 231 226
1980 916 801 655 613 182
1985 1,225 1,171 1,326 390 278
1990 1,395 1,448 2,470 — 424
1995 1,519 1,156 2,380 — 487
2000 1,610 1,442 2,274 — 527
2005 1,839 1,266 2,100 — 527
2009 1,205 448 1,756 934 333
2010(P) 1,538 485 2,275 1,221 459
Ambala 64 57 108 80 25
Panchkula 138 1 45 88 33
Yamunanagar 95 35 92 62 36
Kurukshetra 58 74 95 — 24
Kaithal 53 12 118 47 27
Karnal 95 2 103 113 46
Panipat 62 8 96 50 21
Sonipat 101 1 169 109 28
Rohtak 80 6 12 76 15
Jhajjar 72 79 129 — 26
Faridabad 42 1 53 17 3
Palwal — — — — —
Gurgaon 69 20 83 81 18
Mewat 48 2 113 49 17
Rewari 32 1 8 12 3
Mahendragarh 56 1 117 37 4
Bhiwani 145 8 392 167 27
Jind 46 68 165 — 33
Hisar 121 1 155 154 47
Fatehabad 78 78 104 — 15
Sirsa 83 30 118 79 11

164
HEALTH AND FAMILY WELFARE Medical Staff in Haryana*
No. 7.3 (Concld.) (As on 31st December)
Year/ District
Dispensars/ Pharmacists
Ministerial Staff
Dais/Nurse Dais
Other Class IV Staff
including Sweepers
Others Total
1 7 8 9 10 11 12 1966 309 172 — 1,552 — 3,3121970 320 230 223 1,844 — 4,3881980 615 348 218 2,179 309 6,8361985 732 699 470 3,007 937 10,2351990 850 973 98 3,730 1,335 12,7231995 815 873 15 4,235 2,240 13,7202000 853 1,001 30 4,412 2,010 14,1592005 781 958 37 4,494 1,482 13,4842009 546 625 — 2,575 1,425 9,8472010(P) 736 881 10 3,564 1,768 12,937Ambala 40 55 0 276 65 770Panchkula 42 33 0 150 134 664Yamunanagar 50 39 0 193 60 662Kurukshetra 32 23 0 113 87 506Kaithal 33 27 2 126 0 445Karnal 47 49 0 260 0 715Panipat 26 18 0 96 6 383Sonipat 44 58 0 235 0 745Rohtak 42 51 0 180 180 642Jhajjar 38 38 0 115 264 761Faridabad 20 62 0 176 0 374Palwal — — — — — —Gurgaon 30 64 0 218 0 583Mewat 13 50 0 34 123 449Rewari 6 2 0 20 0 84Mahendragarh 30 28 0 162 597 1,032Bhiwani 64 78 0 348 0 1,229Jind 45 77 8 234 221 897Hisar 72 67 0 360 7 984Fatehabad 32 24 0 130 24 485Sirsa 30 38 0 138 0 527
Source :—Director General of Health Services, Haryana *Staff under the Family Welfare Clinics is not included. P-Provisional

165
HEALTH AND FAMILY WELFARE Patients treated and Beds available in Haryana
No. 7.4 (As on 31st December) Year/District Patients treated Beds
Indoor Outdoor Total Males Females Total
1 2 3 4 5 6 7
1966 1,16,418 29,06,348 30,22,766 2,501 2,083 4,584
1970 1,52,146 34,75,216 36,27,362 3,184 2,872 6,056
1980 2,54,518 96,07,909 98,62,427 4,728 4,020 8,748
1985 3,42,771 59,94,664 63,37,435 5,123 4,352 9,475
1990-91 3,50,070 79,58,662 83,08,732 5,562 5,069 10,631
1995-96 3,46,141 74,41,132 77,87,273 5,855 5,473 11,328
2000-01 3,74,099 93,27,164 97,01,263 5,632 5,246 10,878
2008-09 5,40,211 1,19,07,674 1,24,47,885 5,231 4,755 9,986
2009-10 5,40,211 1,19,07,674 1,24,47,885 5,241 4,765 10,0062010-11 7,52,305 1,45,17,238 1,52,69,543 5,241 4,765 10,006Ambala 36,057 6,17,679 6,53,736 277 253 530Panchkula 34,999 6,97,719 7,32,718 159 147 306Yamunanagar 31,131 7,36,935 7,68,066 224 198 422Kurukshetra 24,368 5,13,830 5,38,198 157 153 310Kaithal 21,885 5,99,132 6,21,017 156 144 300Karnal 46,467 8,15,924 8,62,391 242 232 474Panipat 19,156 4,23,169 4,42,325 151 142 293Sonipat 31,339 9,04,623 9,35,962 185 209 394Rohtak 1,17,674 18,16,896 19,34,570 958 730 1,688Jhajjar 17,417 4,91,497 5,08,914 163 175 338Faridabad 53,141 7,77,015 8,30,156 314 284 598Palwal 17,427 2,88,517 3,05,944 115 109 224Gurgaon 35,081 7,42,740 7,77,821 222 215 437Mewat 18,835 3,44,669 3,63,504 85 93 178Rewari 26,641 5,00,928 5,27,569 167 171 338Mahendragarh 30,897 5,05,815 5,36,712 156 166 322Bhiwani 53,133 8,63,548 9,16,681 533 412 945Jind 33,798 8,37,722 8,71,520 249 247 496Hisar 45,262 10,73,632 11,18,894 425 354 779Fatehabad 33,818 4,89,606 5,23,424 127 139 266Sirsa 23,779 4,75,642 4,99,421 176 192 368
Source :—Director General of Health Services, Haryana.
Note :— Information relating to beds for the years 1990-91 onwards relates to 31st March. However, patients treated are as on 31st December.
166
NUMBER OF INDOOR AND OUTDOOR PATIENTS TREATED BY DISEASES IN GOVERNMENT
INSTITUTIONS IN HARYANA
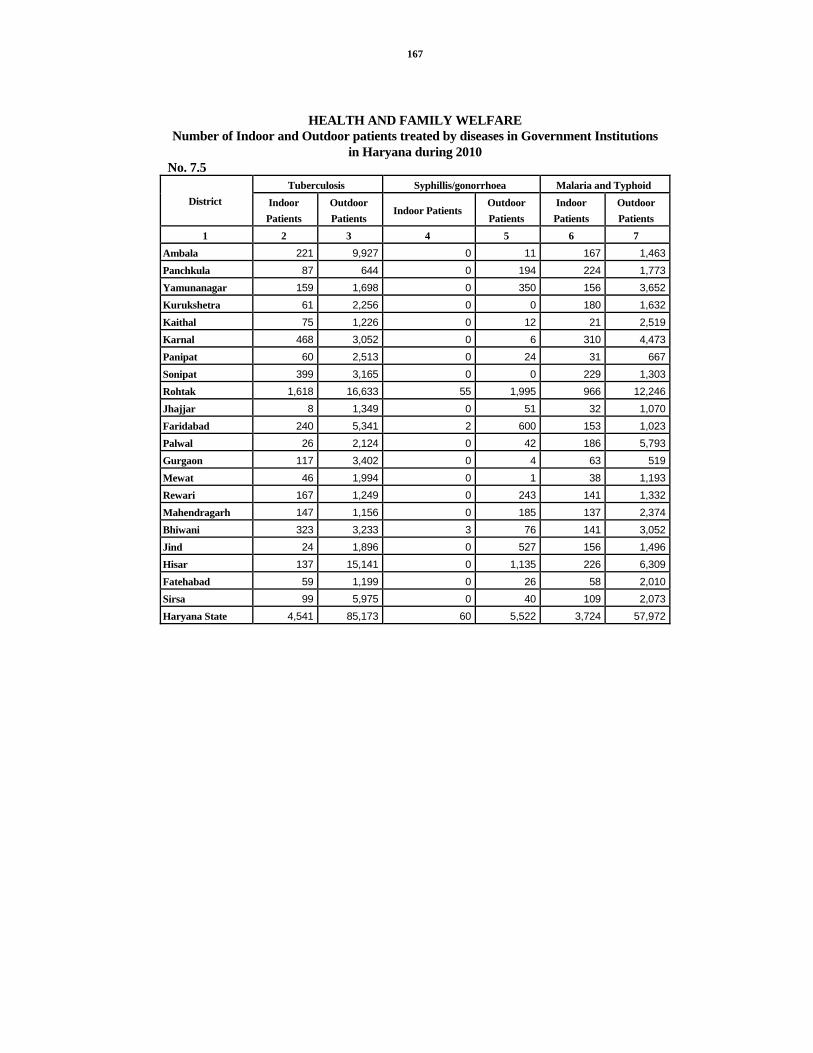
167
HEALTH AND FAMILY WELFARE Number of Indoor and Outdoor patients treated by diseases in Government Institutions
in Haryana during 2010 No. 7.5
Tuberculosis Syphillis/gonorrhoea Malaria and Typhoid District Indoor
Patients Outdoor Patients
Indoor Patients Outdoor Patients
Indoor Patients
Outdoor Patients
1 2 3 4 5 6 7 Ambala 221 9,927 0 11 167 1,463Panchkula 87 644 0 194 224 1,773Yamunanagar 159 1,698 0 350 156 3,652Kurukshetra 61 2,256 0 0 180 1,632Kaithal 75 1,226 0 12 21 2,519Karnal 468 3,052 0 6 310 4,473Panipat 60 2,513 0 24 31 667Sonipat 399 3,165 0 0 229 1,303Rohtak 1,618 16,633 55 1,995 966 12,246Jhajjar 8 1,349 0 51 32 1,070Faridabad 240 5,341 2 600 153 1,023Palwal 26 2,124 0 42 186 5,793Gurgaon 117 3,402 0 4 63 519Mewat 46 1,994 0 1 38 1,193Rewari 167 1,249 0 243 141 1,332Mahendragarh 147 1,156 0 185 137 2,374Bhiwani 323 3,233 3 76 141 3,052Jind 24 1,896 0 527 156 1,496Hisar 137 15,141 0 1,135 226 6,309Fatehabad 59 1,199 0 26 58 2,010Sirsa 99 5,975 0 40 109 2,073Haryana State 4,541 85,173 60 5,522 3,724 57,972
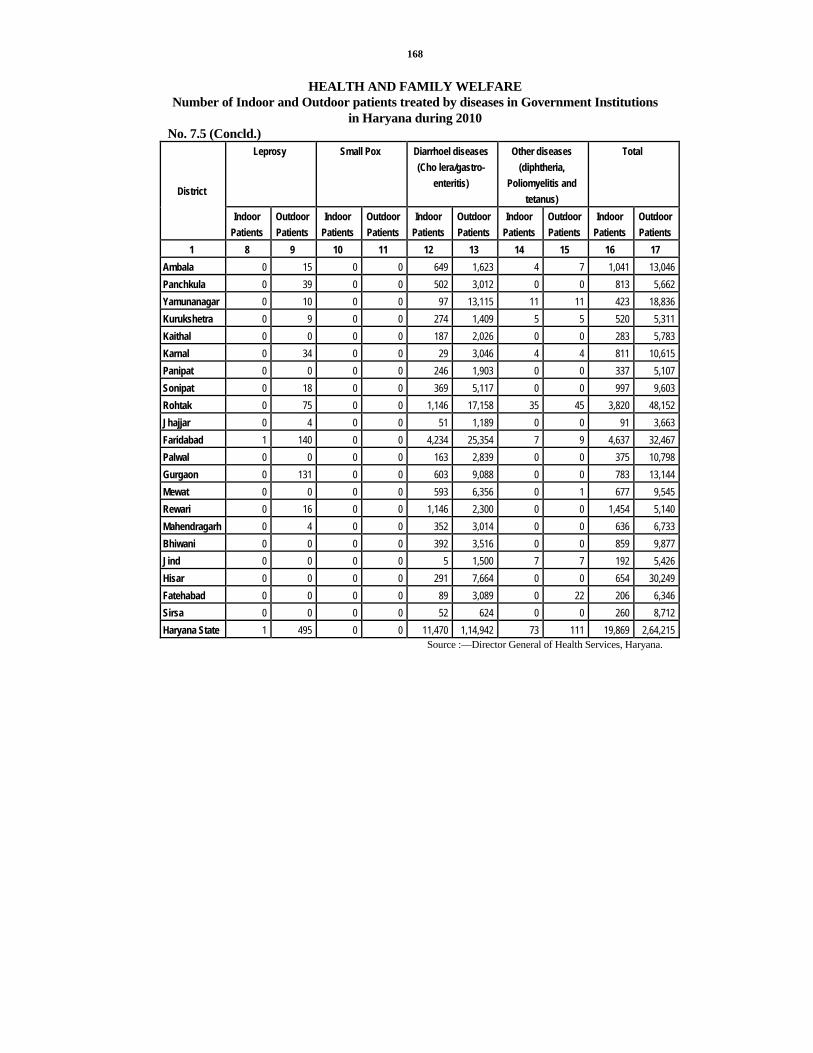
168
HEALTH AND FAMILY WELFARE Number of Indoor and Outdoor patients treated by diseases in Government Institutions
in Haryana during 2010 No. 7.5 (Concld.)
Leprosy Small Pox Diarrhoel diseases (Cho lera/gastro-
enteritis)
Other diseases (diphtheria,
Poliomyelitis and tetanus)
Total
District
Indoor Patients
Outdoor Patients
Indoor Patients
Outdoor Patients
Indoor Patients
Outdoor Patients
Indoor Patients
Outdoor Patients
Indoor Patients
Outdoor Patients
1 8 9 10 11 12 13 14 15 16 17 Ambala 0 15 0 0 649 1,623 4 7 1,041 13,046 Panchkula 0 39 0 0 502 3,012 0 0 813 5,662 Yamunanagar 0 10 0 0 97 13,115 11 11 423 18,836 Kurukshetra 0 9 0 0 274 1,409 5 5 520 5,311 Kaithal 0 0 0 0 187 2,026 0 0 283 5,783 Karnal 0 34 0 0 29 3,046 4 4 811 10,615 Panipat 0 0 0 0 246 1,903 0 0 337 5,107 Sonipat 0 18 0 0 369 5,117 0 0 997 9,603 Rohtak 0 75 0 0 1,146 17,158 35 45 3,820 48,152 Jhajjar 0 4 0 0 51 1,189 0 0 91 3,663 Faridabad 1 140 0 0 4,234 25,354 7 9 4,637 32,467 Palwal 0 0 0 0 163 2,839 0 0 375 10,798 Gurgaon 0 131 0 0 603 9,088 0 0 783 13,144 Mewat 0 0 0 0 593 6,356 0 1 677 9,545 Rewari 0 16 0 0 1,146 2,300 0 0 1,454 5,140 Mahendragarh 0 4 0 0 352 3,014 0 0 636 6,733 Bhiwani 0 0 0 0 392 3,516 0 0 859 9,877 Jind 0 0 0 0 5 1,500 7 7 192 5,426 Hisar 0 0 0 0 291 7,664 0 0 654 30,249 Fatehabad 0 0 0 0 89 3,089 0 22 206 6,346 Sirsa 0 0 0 0 52 624 0 0 260 8,712 Haryana State 1 495 0 0 11,470 1,14,942 73 111 19,869 2,64,215
Source :—Director General of Health Services, Haryana.

169
HEALTH AND FAMILY WELFARE Area Covered per Institution and Beds per lakh of Population
No. 7.6 Year/District Area covered per
institution in square kilometers
Institutions per 1,00,000 population*
Beds per 1,00,000 population*
1 2 3 4 1968 56 8 571970 53 8 641980 30 10 691985 18 16 691990-91 15 19 651995-96 14 17 622000-01 14 15 522005-06 14 14 412008-09 14 13 412009-10 14 13 402010-11 (P) 14 13 40Ambala 12 11 44Panchkula 12 14 54Yamunanagar 12 13 36Kurukshet ra 11 14 31Kaithal 13 15 27Karnal 14 12 31Panipat 11 10 25Sonipat 10 14 26Rohtak 11 14 150Jhajjar 12 15 32Faridabad 7 6 37Palwal 14 10 23Gurgaon 13 9 40Mewat 14 11 19Rewari 12 15 37Mahendragarh 14 14 33Bhiwani 17 17 55Jind 13 14 35Hisar 15 14 42Fatehabad 19 14 28Sirsa 23 14 28
Source :—Director General of Health Services, Haryana. *Based on estimated population. Note : —Information prior to the year 1990-91 relates to 31st December.
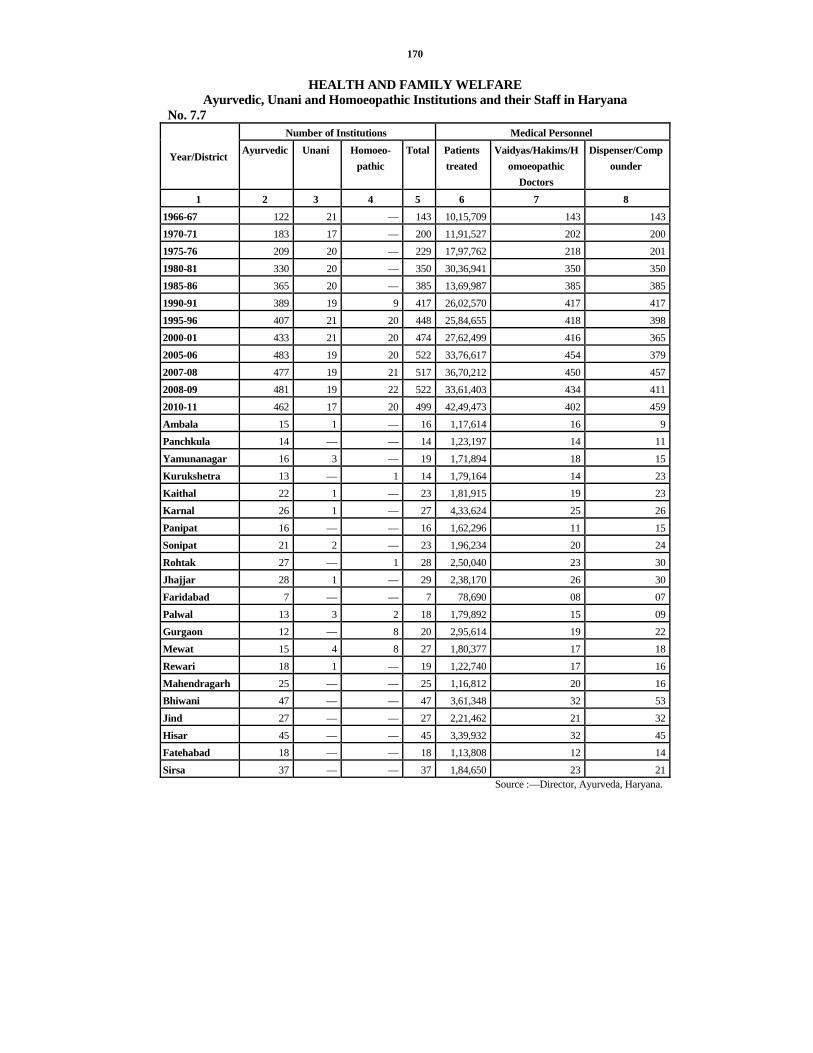
170
HEALTH AND FAMILY WELFARE Ayurvedic, Unani and Homoeopathic Institutions and their Staff in Haryana
No. 7.7 Number of Institutions Medical Personnel
Year/District Ayurvedic Unani Homoeo-pathic
Total Patients treated
Vaidyas/Hakims/Homoeopathic
Doctors
Dispenser/Compounder
1 2 3 4 5 6 7 8 1966-67 122 21 — 143 10,15,709 143 1431970-71 183 17 — 200 11,91,527 202 2001975-76 209 20 — 229 17,97,762 218 2011980-81 330 20 — 350 30,36,941 350 3501985-86 365 20 — 385 13,69,987 385 3851990-91 389 19 9 417 26,02,570 417 4171995-96 407 21 20 448 25,84,655 418 398 2000-01 433 21 20 474 27,62,499 416 3652005-06 483 19 20 522 33,76,617 454 3792007-08 477 19 21 517 36,70,212 450 4572008-09 481 19 22 522 33,61,403 434 411 2010-11 462 17 20 499 42,49,473 402 459 Ambala 15 1 — 16 1,17,614 16 9Panchkula 14 — — 14 1,23,197 14 11 Yamunanagar 16 3 — 19 1,71,894 18 15 Kurukshetra 13 — 1 14 1,79,164 14 23 Kaithal 22 1 — 23 1,81,915 19 23 Karnal 26 1 — 27 4,33,624 25 26 Panipat 16 — — 16 1,62,296 11 15 Sonipat 21 2 — 23 1,96,234 20 24 Rohtak 27 — 1 28 2,50,040 23 30Jhajjar 28 1 — 29 2,38,170 26 30 Faridabad 7 — — 7 78,690 08 07 Palwal 13 3 2 18 1,79,892 15 09 Gurgaon 12 — 8 20 2,95,614 19 22Mewat 15 4 8 27 1,80,377 17 18 Rewari 18 1 — 19 1,22,740 17 16 Mahendragarh 25 — — 25 1,16,812 20 16Bhiwani 47 — — 47 3,61,348 32 53 Jind 27 — — 27 2,21,462 21 32 Hisar 45 — — 45 3,39,932 32 45Fatehabad 18 — — 18 1,13,808 12 14 Sirsa 37 — — 37 1,84,650 23 21
Source :—Director, Ayurveda, Haryana.

171
HEALTH AND FAMILY WELFARE Type of Attention at Birth as per Civil Registration System
No. 7.8 Year/District Govt.
Institution Private
Institution Dr./Nurse/
T. Dai Traditional
Birth Attendent Relatives or
other Total
1 2 3 4 5 6 7 2005 63,052 1,41,345 2,18,805 40,619 8,144 4,71,9682006 83,133 1,66,464 2,14,609 36,865 7,899 5,08,9702007 96,948 1,78,273 1,93,404 33,712 9,636 5,11,9732008 1,19,884 1,97,890 1,77,349 31,718 9,680 5,36,5212009 1,64,388 1,96,864 1,40,156 30,292 7,210 53,8102010 2,05,086 1,97,282 1,10,788 24,709 6,755 5,44,620 Ambala 8,821 9,708 2,060 678 164 21,431Panchkula 10,008 2,764 407 40 22 13,241 Yamunanagar 6,758 9,057 5,955 1,149 5 22,924 Kurukshetra 6,537 12,122 2,496 193 1 21,349 Kaithal 9,533 8,639 3,756 388 66 22,382 Karnal 15,038 11,836 1,496 3,584 148 32,102Panipat 6,841 11,361 7,339 1,167 317 27,025Sonipat 9,114 9,754 8,689 1,303 202 29,062Rohtak 14,640 7,306 2,900 1,901 224 26,971Jhajjar 4,425 4,031 5,157 895 41 14,549Faridabad 13,589 17,817 5,259 520 2,070 39,255Palwal 7,458 5,884 10 ,017 2,884 1,384 27,627Gurgaon 10,178 17,857 2,852 1,011 186 32,084Mewat 7,114 2,207 19,250 2,786 318 31,675Rewari 8,089 10,343 989 234 47 19,702Mahendragarh 9,768 3,999 2,366 534 94 16,761Bhiwani 9,323 13,515 7,372 1,038 67 31,315Jind 14,439 7,279 3,059 620 401 25,798Hisar 11,887 16,440 7,619 2,476 909 39,331Fatehabad 8,717 7,361 6,359 712 2 23,151Sirsa 12,809 8,002 5,391 596 87 26,885
Source :—Director General of Health Services, Haryana.
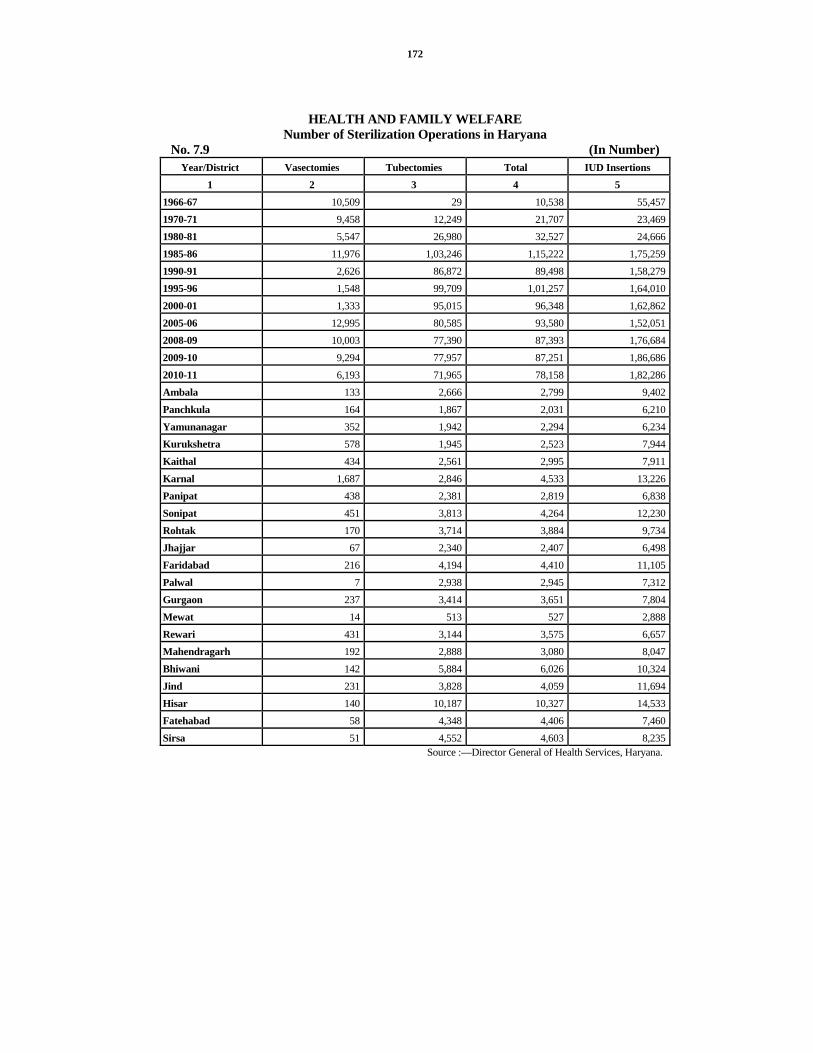
172
HEALTH AND FAMILY WELFARE Number of Sterilization Operations in Haryana
No. 7.9 (In Number) Year/District Vasectomies Tubectomies Total IUD Insertions
1 2 3 4 5 1966-67 10,509 29 10,538 55,4571970-71 9,458 12,249 21,707 23,4691980-81 5,547 26,980 32,527 24,6661985-86 11,976 1,03,246 1,15,222 1,75,2591990-91 2,626 86,872 89,498 1,58,2791995-96 1,548 99,709 1,01,257 1,64,0102000-01 1,333 95,015 96,348 1,62,8622005-06 12,995 80,585 93,580 1,52,0512008-09 10,003 77,390 87,393 1,76,6842009-10 9,294 77,957 87,251 1,86,6862010-11 6,193 71,965 78,158 1,82,286Ambala 133 2,666 2,799 9,402Panchkula 164 1,867 2,031 6,210Yamunanagar 352 1,942 2,294 6,234Kurukshetra 578 1,945 2,523 7,944Kaithal 434 2,561 2,995 7,911Karnal 1,687 2,846 4,533 13,226Panipat 438 2,381 2,819 6,838Sonipat 451 3,813 4,264 12,230Rohtak 170 3,714 3,884 9,734Jhajjar 67 2,340 2,407 6,498Faridabad 216 4,194 4,410 11,105Palwal 7 2,938 2,945 7,312Gurgaon 237 3,414 3,651 7,804Mewat 14 513 527 2,888Rewari 431 3,144 3,575 6,657Mahendragarh 192 2,888 3,080 8,047Bhiwani 142 5,884 6,026 10,324Jind 231 3,828 4,059 11,694Hisar 140 10,187 10,327 14,533Fatehabad 58 4,348 4,406 7,460Sirsa 51 4,552 4,603 8,235
Source :—Director General of Health Services, Haryana.

173
HEALTH AND FAMILY WELFARE Achievements of various Family Welfare. Methods and Equivalent Sterilisation in
Haryana for the year 2010-11 No.7.10
Achievements of various F.W. Methods and Equivalent Sterilisation
District Sterilisation
IUD Insertion
Conventional Contraceptives
Users
Oral Pills Users
Total Equivalent Sterilisation
1 2 3 4 5 6 7 2010-11 78,158 1,82,286 2,10,469 67,907 5,38,820 1,58,161Ambala 2,799 9,402 14,083 3,809 30,093 7,139Panchkula 2,031 6,210 13,278 2,226 23,745 5,086Yamunanagar 2,294 6,234 7,516 4,055 20,099 5,240Kurukshetra 2,523 7,944 8,856 1,513 20,836 5,831Kaithal 2,995 7,911 6,268 2,603 19,777 6,269Karnal 4,533 13,226 8,332 3,532 29,623 9,797Panipat 2,819 6,838 8,050 2,111 19,818 5,780Sonipat 4,264 12,230 24,437 4,678 45,609 10,218Rohtak 3,884 9,734 7,824 2,976 24,418 7,894Jhajjar 2,407 6,498 7,534 2,182 18,621 5,234Faridabad 4,410 11,105 12,214 4,676 32,405 9,310Palwal 2,945 7,312 4,218 1,334 15,809 5,765Gurgaon 3,651 7,804 6,984 4,017 22,456 7,087Mewat 527 2,888 5,415 1,683 10,513 1,978Rewari 3,575 6,657 7,927 2,440 20,599 6,506Mahendragarh 3,080 8,047 11,200 2,828 25,155 6,699Bhiwani 6,026 10,324 9,362 5,905 31,617 10,644Jind 4,059 11,694 15,525 4,728 36,006 9,345Hisar 10,327 14,533 13,094 3,691 41,645 16,309Fatehabad 4,406 7,460 11,006 3,595 26,467 7,904Sirsa 4,603 8,235 7,346 3,325 23,509 8,126
Source :—Director General of Health Services, Haryana. *Note.: Infomation of District Palwal is included in District Faridabad.

174
PUBLIC HEALTH Number of Villages covered under safe Drinking Water Supply Scheme in Haryana*
No. 7.11 District No. of villages surveyed as on
31-12-2004 having water supply below 40 L.P.C.D.
No. of villages provided by water supply upto 40
L.P.C.D. upto 2007-08
Balance Villages as on 1-4-08
1 2 3 4 Ambala 42 42 0Panchkula — — —Yamunanagar 227 206 21Kurukshetra 26 26 —Kaithal 206 156 50Karnal 43 42 1Panipat 25 25 —Sonipat 109 52 57Rohtak 64 62 2Jhajjar 112 42 70Faridabad 124 110 14Gurgaon 528 346 139Mewat — 43 —Rewari 133 77 56Mahendragarh 190 161 29Bhiwani 50 18 32Jind 75 64 11Hisar 9 7 2Fatehabad — — —Sirsa 8 4 4Total 1,971 1,483 488
Source :—Engineer-in-Chief, Public Works Department (Public Health), Haryana.
Note : — *All the villages in Haryana have been provided with safe drinking water facilities by 31-3-92. L.P.C.D. :— Litre per Capita Daily.
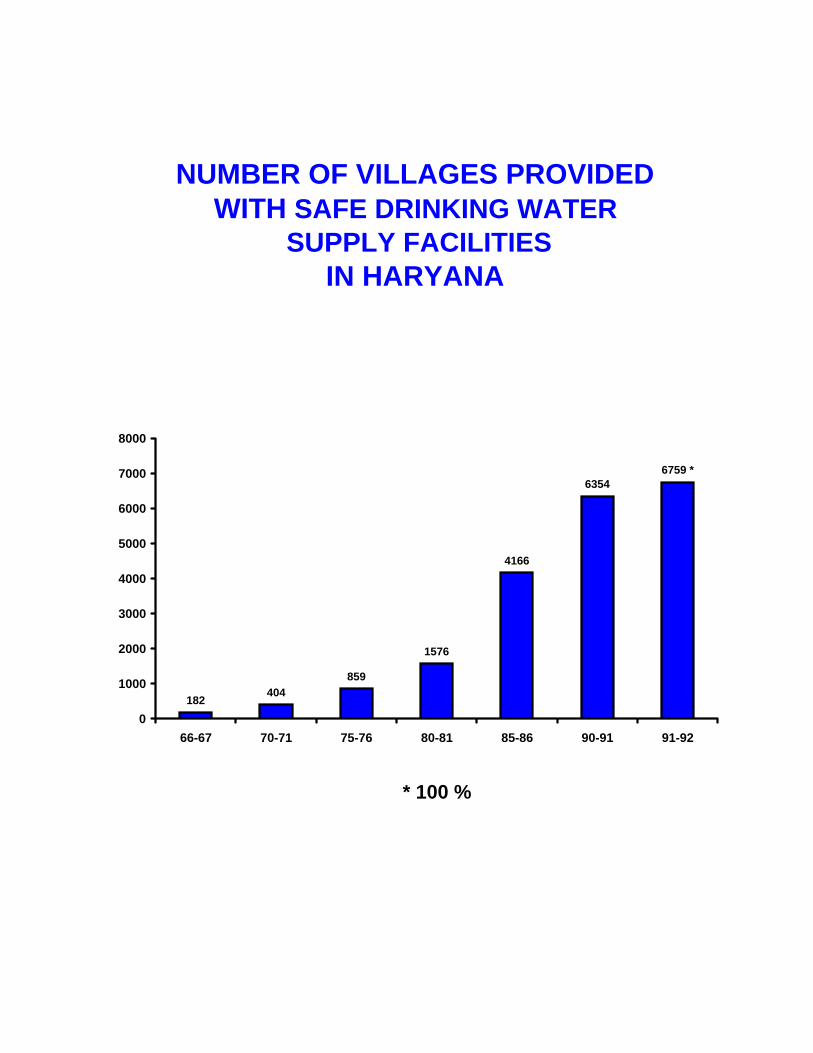
NUMBER OF VILLAGES PROVIDED WITH SAFE DRINKING WATER
SUPPLY FACILITIESIN HARYANA
182404
859
1576
4166
63546759 *
0
1000
2000
3000
4000
5000
6000
7000
8000
66-67 70-71 75-76 80-81 85-86 90-91 91-92
* 100 %
175
SECTION VIII SOCIAL WELFARE SERVICES
This section includes information relating to Loans and Grants disbursed to persons belonging to Harijan Community as well as progress of various pension schemes in Haryana.
Table 8.1 gives information relating to Loans and Grants (purposewise and sourcewise) disbursed to persons belonging to Harijan Community in Haryana.
Table 8.2 gives information relating to Progress of Old Age Pension, Widow Pension, Handicapped Pension and Ladli Pension Schemes in Haryana.

176

177
SOCIAL WELFARE SERVICES Loans and Grants disbursed to persons belonging to Scheduled Caste
Community by purpose and source in Haryana : 2010-11 No. 8.1 (` in. Lakh) Source/Purpose No. of
Beneficiaries Assisted
Direct Loan Bank Loan Subsidy Margin Money
Total
1 2 3 4 5 6 7 Purchase of land — — — — — —Purchase of Agricultural implements
— — — — — —
Other Agricultural purposes
5,786 — 1,429.60 368.74 4.75 1,803.09
Industrial purposes
783 — 257.55 73.39 37.38 368.32
Purchase of vehicles
2 4.65 0.05 0.15 — 4.85
Others (i) Trade and
Business 5,047 — 1,528.41 478.85 223.65 2,230.91
(ii) Self Employment
33 32.36 6.21 2.32 0.87 41.76
Total 11,651 37.01 3,221.82 923.45 266.65 4448.93
Source : Haryana Scheduled Castes Finance and Development Corporation.

178
SOCIAL WELFARE SERVICES Progress of Old Age Pension, Widow Pension, Handicapped Pension and Ladli
Pension Schemes in Haryana No. 8.2
Old Age Pension Widow Pension
Year/District No. of Beneficiaries
Amount Disbursed
(` Lakh)
No. of Beneficiaries
Amount Disbursed (` Lakh)
1 2 3 4 5 1980-81 11,361 48.30 542 2 1985-86 29,558 190.46 7,704 35.42 1990-91 8,31,000 8,465.35 1,39,109 719.32 1995-96 7,41,290 8,014 1,98,892 1,784.42 2000-01 9,63,849 22,134.84 2,96,107 6,708.38 2005-06 9,40,368 37,419.96 3,75,029 14,237.62 2007-08 9,95,028 36,667.50 4,23,122 17,396.91 2008-09 11,25,372 40,822.28 4,44,874 18,334.29 2009-10 12,50,349 90,279.28 4,71,856 40,349.13 2010-11 13,86,207 89,914.77 5,06,704 43,572.92 Ambala 62,126 4,179.42 21,316 1,803.11 Panchkula 18,714 1,235.02 6,723 567.05 Yamunanagar 74,552 4,497.52 22,924 1,941.22 Kurukshetra 59,338 3,809.55 22,509 1,902.43 Kaithal 73,541 4,681.41 28,104 2,444.08 Karnal 84,605 5,152.69 35,917 3,012.66 Panipat 51,890 3,298.52 22,926 1,939.08 Sonipat 84,278 5,703.29 31,572 2,719.93 Rohtak 67,917 4,708.35 22,422 1,950.31 Jhajjar 63,268 4,351.45 18,530 1,641.18 Faridabad 35,342 2,232.69 23,917 2,061.40 Palwal 55,234 3,301.51 18,050 1,496.81 Gurgaon 38,880 2,603.77 16,848 1,426.83 Mewat 55,581 3,418.81 15,158 1,310.44 Rewari 57,146 3,705.04 15,224 1,327.51 Mahendragarh 61,754 4,125.90 17,052 1,446.29 Bhiwani 1,01,293 6,657.40 37,698 3,264.31 Jind 87,954 5,677.89 32,281 2,795.23 Hisar 94,480 6,446.84 43,478 3,789.15 Fatehabad 69,501 4,423.54 24,127 2,105.57 Sirsa 88,813 5,704.16 29,928 2,628.33

179
SOCIAL WELFARE SERVICES Progress of Old Age Pension, Widow Pension, Handicapped Pension and Ladli
Pension Schemes in Haryana No. 8.2 (Concld.)
Handicapped Pension Ladli Pension
Year/District No. of Beneficiaries
Amount Disbursed (` Lakh)
No. of Beneficiaries
Amount Disbursed (` Lakh)
1 6 7 8 9 1980-81 — — — —1985-86 5,972 32.40 — —1990-91 33,508 167.97 — —1995-96 39,190 395.68 — —2000-01 60,247 1,323.17 — —2005-06 98,461 3,590.08 — —2007-08 1,18,789 5,424.55 14,688 492.262008-09 1,26,257 5,821.16 21,225 1,022.472009-10 1,31,687 9576.14 24,174 1329.522010-11 1,34,200 9,209.96 24,800 1,424.99Ambala 6,084 420.56 1,343 75.89Panchkula 1,344 89.28 333 18.75Yamunanagar 7,302 476.28 1,611 91.50Kurukshetra 7,562 491.95 1,135 63.74Kaithal 5,694 376.52 973 58.67Karnal 9,804 668.81 1,952 112.53Panipat 5,056 342.72 1,044 59.97Sonipat 9,732 704.15 1,225 64.91Rohtak 6,538 438.27 1,685 97.34Jhajjar 5,873 420.59 1,283 76.38Faridabad 4,581 326.97 513 28.62Palwal 4,338 296.93 418 25.20Gurgaon 2,813 182.33 246 12.65Mewat 3,765 245.08 129 6.45Rewari 3,739 256.74 1,301 76.75Mahendragarh 3,901 281.57 1,068 56.34Bhiwani 10,321 730.88 3,106 182.94Jind 7,023 466.19 1,145 66.30Hisar 10,486 731.65 1,795 103.72Fatehabad 8,770 602.19 1,239 72.44Sirsa 9,474 660.30 1,256 73.90
Source :—Director, Social Justice & Empowerment Department, Haryana.

181
SECTION IX SOCIAL SECURITY AND SOCIAL DEFENCE
(POLICE, CRIMES AND SUDHARGHAR)
This section contains information relating to police, crimes and administration of Prisons. The data given in this section have been collected from the Director-General of Police, Haryana and Director-General of Prisons, Haryana.
Table 9.1 shows the information relating to the sanctioned strength of Haryana Police whereas table 9.2 shows the information relating to the number of Police Stations and Police Posts (districtwise).
Table 9.3 gives the information of incidence of Crimes in Haryana.
Table 9.4 shows the number of convicts by age, sex and literacy.
Tables 9.5 to 9.8 show the number of places of confinements, number of prisoners, expenditure on maintenance of prisoners in Jails and value of goods produced in Jail Industry in Haryana.

182

183
SOCIAL SECURITY AND SOCIAL DEFENCE (POLICE, CRIMES AND SUDHARGHAR)
Sanctioned Strength of Police Force in Haryana No. 9.1
(As on 31st December) Particulars 1966 1970 1980 1990 1995 2000 @ 2005 @@ 2010 2011
1 2 3 4 5 6 7 8 9 10 Sanctioned Strength of Police Force 1. Director-General, Addl.
Director General, Inspector-General and Dy. Inspector-General
3 3 10 16 24 30 33 46 48
2. Assistant Inspector-General
3 3 4 3 3 3 3 4 4
3. Superintendents, Addl. Supdts. , Asstt. Supdts. & Dy. Supdts
32 38 110 164 186 193 222 274 283
4. Inspectors, Sub- Inspectors & Asstt. Sub-Inspectors
676 709 1,738 3,029 3,249 3,795 5,230 7,151 7,220
5. Head Constables including Mounted Head Constables
956 905 4,102 7,084 7,465 8,007 6,623 9,036 9,084
6. Mounted Constables and Foot Constables
5,715 5,740 12,267 18,741 20,994 25,195 30,612 40,094 40,167
Total 7,385 7,398 18,231 29,037 31,921 37,223 42,723 56,605 56,806 Source : Director-General of Police, Haryana.
@ As on 22-9-2000 @@ As on 1-9-2005

184
SOCIAL SECURITY AND SOCIAL DEFENCE (POLICE, CRIMES AND SUDHARGHAR)
Number of Police Stations and Police Posts in Haryana No. 9.2
(As on 31st December) Year/District Police Station Police Post Total
1 2 3 4 1966 100 29 1291970 105 65 1701980 122 116 2381990 156 214 3701995 173 237 4102000* 205 312 5172005 206 378 5842010 260 325 5852011 271 323 594Ambala 15 17 32Panchkula 9 13 22Yamunanagar 14 10 24Kurukshetra 10 10 20Kaithal 12 9 21Karnal 13 19 32Panipat 9 16 25Sonipat 15 17 32Rohtak 11 18 29Jhajjar 7 13 20 Faridabad 19 34 53Palwal 8 10 18Gurgaon 28 13 41Mewat 6 7 13Rewari 13 13 26Mahendragarh 8 11 19Bhiwani 13 16 29Jind 12 12 24Hisar 11 22 33Fatehabad 9 12 21 Sirsa 13 15 28Railway Police, Haryana 16 16 32
Source : Director-General of Police, Haryana. * As on 30th September

185
INCIDENCE OF CRIMES IN HARYANA (DISTRICTWISE)

186
SOCIAL SECURITY AND SOCIAL DEFENCE (POLICE, CRIMES AND SUDHARGHAR)
Incidence of Crimes in Haryana (Districtwise) No. 9.3 (contd.)
Year/District Murder Dacoity Burglary theft Ordinary theft 1 2 3 4 5
1966 183 6 1,273 2,320*1970 192 8 1,709 2,579*1980 369 19 2,800 2,969*1990 543 31 2,323 4,345*1995 701 70 3,013 4,536*2000 773 104 3,395 6,237*2005 782 88 3,400 8,6492009 950 153 4,065 12,8342010 1005 146 4,448 16,234Ambala 35 4 288 652Panchkula 20 4 147 323Yamunanagar 28 6 160 478Kurukshetra 34 2 235 724Kaithal 31 6 160 304Karnal 49 5 266 836Panipat 32 7 176 859Sonipat 81 9 215 984Rohtak 72 7 276 855Jhajjar 51 7 186 527 Faridabad 69 9 277 1,671Mewat 26 13 63 407Gurgaon 84 5 491 3,116Rewari 29 24 163 533Mahendragarh 31 9 121 339Bhiwani 61 7 264 523Jind 53 -- 248 560Hisar 91 5 320 829 Fatehabad 27 1 119 241Sirsa 45 3 190 383Palwal 34 11 82 617GRP 22 2 1 473* Including cattle theft.

187
SOCIAL SECURITY AND SOCIAL DEFENCE (POLICE, CRIMES AND SUDHARGHAR
Incidence of Crimes in Haryana (Districtwise) No. 9.3 (Concld.) Year/District Robbery Kidnapping Roiting or
unlawful assembly
Culpable homicide
Coining Miscellaeous Total cognizaable
Crimes 1 6 7 8 9 10 11 12
1966 19 134 82 98 — 16,633 20,7481970 23 145 107 65 1 14,106 18,9351980 64 198 224 57 1 26,538 33,2391990 120 209 436 104 4 20,366 28,4811995 266 431 541 94 64 23,365 33,0812000 423 466 889 60 18 26,417 38,7822005 391 493 900 53 31 27,903 42,6902009 684 912 1,175 75 39 35,370 56,2572010 732 971 1,415 60 28 34,130 59,169Ambala 18 33 3 1 2 1,812 2,848Panchkula 7 16 2 1 1 804 1,325Yamunanagar 20 42 1 2 -- 1,283 2,020Kurukshetra 22 34 -- 2 5 1,479 2,537Kaithal 19 27 -- 2 1 1,119 1,669Karnal 24 33 53 2 1 2,189 3,458Panipat 41 64 91 9 -- 1,539 2,818Sonipat 62 75 3 3 1 2,042 3,475Rohtak 34 32 59 6 1 1,735 3,077Jhajjar 37 44 69 5 -- 1,211 2,137Faridabad 20 103 178 5 -- 2,603 4,935Mewat 17 36 130 2 1 1,214 1,909Gurgaon 118 65 94 2 1 2,762 6,738Rewari 63 33 40 -- -- 1,466 2,351Mahendragarh 26 40 112 3 -- 1,154 1,835Bhiwani 43 52 171 1 1 1,748 2,871Jind 43 35 116 4 1 1,375 2,435Hisar 51 84 78 1 5 2,357 3,821Fatehabad 9 33 14 2 3 936 1,385Sirsa 14 47 28 1 1 1,295 2,007Palwal 26 40 151 6 -- 1,352 2,319GRP 18 3 22 -- 3 655 1,199
Source : Director-General of Police, Haryana.

188
SOCIAL SECURITY AND SOCIAL DEFENCE
(POLICE, CRIMES AND SUDHARGHAR) Convicts by Age, Sex and Literacy in Haryana
No. 9.4 Age of convicts
Total Convicts imprisoned during the year Under 22 years 22 to 40 years Year/District
Males Females Total Males Females Males Females 1 2 3 4 5 6 7 8
1967 4,198 41 4,239 724 — 2,660 411970 4,689 29 4,718 716 8 3,149 191980 3,364 14 3,378 650 2 2,157 101990-91 2,726 52 2,778 537 6 1,538 231995-96 2,156 55 2,211 176 2 1,238 242000-01 2,630 89 2,719 69 2 1,568 712005-06 5,661 216 5,877 303 12 3,567 1092009-10 5,792 270 6,062 416 9 3,251 1292010-11 6,049 286 6,335 461 2 3,698 148Ambala 496 18 514 16 — 390 12Panchkula — — — — — — —Yamunanagar 218 14 232 — — 100 7Kurukshetra 176 — 176 20 — 100 —Kaithal 46 — 46 8 — 22 —Karnal 1,317 67 1,384 174 — 852 32Panipat — — — — — — —Sonipat 260 — 260 30 — 121 —Rohtak 233 15 248 — — 125 2Jhajjar — — — — — — —Faridabad 538 36 574 — -- 368 16Palwal — — — — — — —Gurgaon 716 23 739 96 2 432 9Rewari 44 — 44 10 — 20 —Mahendragarh 266 13 279 9 — 176 10Bhiwani 368 1 369 8 — 195 —Jind 233 — 233 15 — 180 —Hisar 785 99 884 75 — 440 60Fatehabad — — — — — — —Sirsa 353 — 353 — — 177 —*Figures relate to period 1-11-1966 to 31-12-1967. Note : 1. Information for 1990-91 and onwards relates to financial year.
2. Data of Panchkula, Jhajjar and Fatehabad distts. are included in Ambala, Rohtak & Hisar distts. respectively.

189
SOCIAL SECURITY AND SOCIAL DEFENCE (POLICE, CRIMES AND SUDHARGHAR)
Convicts by Age, Sex and Literacy in Haryana No. 9.4 (Concld.)
Age of convicts Education among convicts
41 to 60 years Above 60 years Literate Illiterate Year/District
Males Females Males Females Males Females Males Females
1 9 10 11 12 13 14 15 16
1967* 588 — 226 — 1,988 12 2,210 29
1970 639 2 185 — 1,911 10 2,778 19
1980 484 2 73 — 1,614 3 1,750 11
1990-91 492 17 159 6 1,713 4 1,013 48
1995-96 499 25 243 4 1,296 9 860 46
2000-01 782 14 211 2 1,559 75 1,071 14
2005-06 1,401 80 390 15 4,053 91 1,608 125
2009-10 1,739 90 386 42 4,399 141 1,393 129
2010-11 1,593 110 297 26 3,900 136 2,149 150
Ambala 79 5 11 1 378 12 118 6
Panchkula — — — — — — — —
Yamunanagar 100 7 18 — 153 5 65 9
Kurukshetra 26 — 30 — 150 — 26 —
Kaithal 10 — 6 — 36 — 10 —
Karnal 233 28 58 7 256 39 1,061 28
Panipat — — — — — — — —
Sonipat 100 — 9 — 210 — 50 —
Rohtak 92 8 16 5 186 9 47 6
Jhajjar — — — — — — — —
Faridabad 150 20 20 — 438 20 100 —
Palwal — — — — — — — 16
Gurgaon 136 11 52 1 541 12 175 —
Rewari 10 — 4 — 38 — 6 11
Mahendragarh 73 2 8 1 224 3 42 —
Bhiwani 147 — 18 1 288 — 80 10
Jind 30 — 8 — 136 — 97 1
Hisar 250 29 20 10 615 36 170 63
Fatehabad — — — — — — — —
Sirsa 157 — 19 — 251 — 102 —Source : Director-General of Prisons, Haryana.

190
SOCIAL SECURITY AND SOCIAL DEFENCE (POLICE, CRIMES AND SUDHARGHAR)
Places of Confinement in Haryana No. 9.5
(As on 31st December) Places of confinement
Year/District Central Sudharghar
District Sudharghar
Subordinate Sudharghar
Judicial lock-ups Total
1 2 3 4 5 6 1966 2 3 8 5 181970 1 5 12 2 201980 1 6 10 2 191990-91 2 9 8 — 191995-96 2 10 7 — 192000-01 2 11 5 — 182005-06 2 13 4 — 192009-10 2 15 1 — 182010-11 2 16 -- -- 18Ambala 1 — — — 1Panchkula — — — — —Yamunanagar — 1 — — 1Kurukshetra — 1 — — 1Kaithal — 1 — — 1Karnal — 1 — — 1Panipat — 1 — — 1Sonipat — 1 — — 1Rohtak — 1 — — 1Jhajjar — — — — —Faridabad — 1 — — 1Palwal — 1 — — 1Gurgaon — 1 — — 1Rewari — 1 — — 1Mahendragarh — 1 — — 1Bhiwani — 1 — — 1Jind — 1 — — 1Hisar 1 1 — — 2Fatehabad — — — — —Sirsa — 1 — — 1
Source : Director-General of Prisons, Haryana. Note: 1. Information for 1990-91 and onwards relates to financial year. 2. Data of Panchkula, Jhajjar and Fatehabad distts. are included in Ambala, Rohtak & Hisar distts.
respectively.

191
SOCIAL SECURITY AND SOCIAL DEFENCE (POLICE, CRIMES AND SUDHARGHAR) Number of Prisoners (Classwise) in Haryana
No. 9.6 Particulars 1966 1970 1980 1990-91 2000-01 2005-06 2009-10 2010-11
1 2 3 4 5 6 7 8 9
At the beginning of the year—
i. Convicted 3,534 1,756 1,433 1,481 3,006 1,982 5,441 5,251
ii. Under trial 2,076 964 1,144 2,105 6,166 9,399 8,705 7,961
iii. Civil 7 6 1 2 2 63 6 16
Admitted during the year—
i. Convicted 14,450 7,500 5,964 5,643 7,537 6,928 6,062 4,484
ii. Under trial 14,760 17,595 23,110 37,900 60,905 61,417 55,585 40,116
iii. Civil 60 608 301 1,380 2,169 360 155 140
Discharged during the year—
i. Convicted 14,106 7,389 6,183 5,484 7,824 6,645 6,252 3,408
ii. Under trial 15,214 17,596 23,109 37,771 60,181 60,635 56,329 40,283
iii. Civil 55 605 287 1,358 2,159 360 145 148
Remaining at the end of the year—
i. Convicted 3,878 1,867 1,214 1,640 2,719 2,265 5,251 6,327
ii. Under trial 1,622 963 1,145 2,234 6,890 10,181 7,961 7,794
iii. Civil 12 9 15 24 12 63 16 8Source : Director-General of Prisons, Haryana.
Note:— (i) This table includes prisoners in Sudharghars, Sub-Sudharghars and Judicial lock-ups in Haryana.. (ii) Information for 1990-91 and onwards relates to financial year.

192
SOCIAL SECURITY AND SOCIAL DEFENCE (POLICE, CRIMES AND SUDHARGHAR)
Expenditure on Maintenance of Prisoners in Jails/Subsidiary Jails in Haryana* No. 9.7
Particulars 1966 1970 1980 1990-91 2000-01 2005-06 2009-10 2010-11
1 2 3 4 5 6 7 8 9
I. Daily average number of Prisoners
2,707 2,804 2,474 3,295 8,360 21,958 13,470 14,178
Expenditure (000 `)
i. Establishment 5,61 14,10 44,85 2,05,81 6,76,99 18,99,86 44,70,65 53,87,82
I. Diet 6,73 11,80 24,52 1,10,92 5,22,25 8,94,96 16,20,68 13,75,90
II. Others 6,28 6,62 20,12 62,69 2,89,03 4,77,99 6,35,44 15,64,68
Total 18,62 32,52 89,49 3,79,42 14,88,27 32,72,81 67,26,77 83,28,40
III. Cost per prisoner per year (`)
688 1,160 3,617 11,515 17,802 14,905 49,938 58,741
Source : Director-General of Prisons, Haryana. * Excluding cost of building of new Jails, additions and repairs. Note:—Information for 1990-91 and onwards relates to financial year.

193
SOCIAL SECURITY AND SOCIAL DEFENCE (POLICE, CRIMES AND SUDHARGHAR)
Progress of Jail Industry in Haryana No. 9.8
Value of goods produced (`) Item 1966 1970 1980 1990-91 2000-01 2005-06 2009-10 2010-11
1 2 3 4 5 6 7 8 9 Carpentry 2,92,469 6,81,781 7,35,280 5,19,302 2,45,819 3,02,113 9,82,634 5,01,715Textile 8,681 1,95,746 3,17,582 15,41,223 7,15,578 22,54,918 1,42,033 1,66,083Leather 4,999 9,723 11,078 59,240 61,855 — — —Durries 42,941 67,295 21,563 17,258 2,100 30,647 1,18,580 76,199Tailoring 8,551 53,397 82,547 1,82,539 13,20,165 6,29,900 11,36,669 6,61,193Munj 29,431 53,181 29,863 — — — — —Chicks 11,563 18,205 29,845 13,250 — — — —Oil & Oil Cake 35,467 80,955 2,991 — — — — —Tents 6,08,772 1,86,510 14,51,182 30,71,052 51,90,005 20,80,501 5,86,226 11,28,344Blankets 1,70,597 49,891 — — — — — 30,264Smithy 12,663 46,201 2,36,522 4,04,079 2,30,918 1,73,541 3,29,477 7,177Niwar & Tapes 36,792 48,618 2,15,850 4,81,458 7,18,706 3,34,249 1,83,389 1,20,532Tags & Laces — 3,686 — 2,290 — — — —Tat — — — — — — 61,200 —Chalks 3,360 3,582 — — — 2,27,400 — —Embroidery — — — — — — — —Phenyle 9,600 54,378 92,000 2,20,095 6,48,975 5,11,089 5,24,275 7,25,434Soap 9,641 ** 92,010 — — — 5,95,018 3,25,267Poultry 38,316 41,856 1,02,176 — — — — —Dyeing — — — 61,789 93,257 77,235 2,25,153 —Printing Press — — — — 1,48,637 3,72,614 3,15,625 1,00,401 Barbed Wire — — — — 2,61,900 38,988 — —Canning of Chairs — — — — 1,38,724 46,375 8,866 4,139Atta Chakki — — — — 2,90,550 18,22,202 13,22,503 1,86,564Pipe chairs and charpoy
— — — — — 21,523 2,23,223 64,830
Socks — — — — 5,966 — 12,987 —Miscellaneous 38,546 1,09,900 1,26,325 6,48,265 7,62,852 3,69,571 83,713 1,25,103Total 13,62,389 17,04,905 35,46,814 72,21,840 1,08,36,007 92,92,866 68,51,571 42,23,245
Source : Director-General of Prisons, Haryana. ** Included under Phenyle. Note : Information for 1990-91 and onwards relates to financial year.

195
PART - II ECONOMIC STATISTICS

196

197
SECTION X STATE INCOME OF HARYANA
State Income refers to the aggregate of factor incomes originating within the boundary of the State. For estimating the State Income, the entire economic activity has been classified into thirteen sectors, viz., Agriculture and Animal Husbandry, Forestry, Fishing, Mining and Quarrying, Registered Manufacturing and Unregistered Manufacturing, Construction, Electricity, Gas and Water-Supply, Transport, Storage and Communication, Trade, Hotels and Restaurants, Banking and Insurance, Real Estate and Ownership of Dwellings, Public Administration and Other Services.
The total State Income of a year divided by the population of that year gives per capita income which is an index of the level of living of the people.
These estimates are revised and are based on data available at the moment and are subject to revision necessitated by the availability of additional information and change in methodology.
The figures of per capita income have been arrived at on the basis of population data supplied by Registrar General of India.
The first table (10.1) in this section shows the comparison of movement of Gross and Net State Domestic product at factor cost at current and constant (2004-05) prices.
Tables 10.2 and 10.3 show the sectoral distribution of the Gross State Domestic Product at current and constant (2004-05) prices respectively.
Tables 10.4 and 10.5 show the sectoral distribution of the Net State Domestic Product at current and constant (2004-05) prices respectively.
Table 10.6 shows the indices (2004-05=100) of Net State Domestic Product at factor cost by major sources.
Table 10.7 depicts the percentage change in Gross State Domestic Product over the previous year.
Tables 10.8 and 10.9 show per capita income at current and constant prices of various States in the country.

198

199
STATE INCOME Movement of Gross and Net State Domestic Product at Factor cost at Current
and Constant (2004-05) Prices No. 10.1
Item 2004-05 2005-06 2006-07 2007-08 2008-09 2009-10 (P)
2010-11 (Q)
1 2 3 4 5 6 7 8 1. At Current prices
i. Gross State Domestic Product (` in crore) 95795.12 108886.70 128739.51 151607.24 182501.87 222030.58 264148.69
ii. Net State Domestic Product (` in crore)
86222.28 97905.30 116110.72 136595.26 164616.02 200678.08 239255.55
iii. Per Capita Gross State Domestic Product (In `) 42187 47056 54622 63178 74719 89352 104531
iv. Per Capita Net State Domestic Product (In `) 37972 42310 49264 56922 67397 80759 94680
2. At 2004-05Prices i. Gross State Domestic
Product (` in crore) 95795.12 104609.68 116348.49 126191.52 136540.05 151562.96 166095.37
ii. Net State Domestic Product (` in crore)
86222.28 94013.35 104704.64 112916.68 121650.49 136381.71 149650.55
iii. Per Capita Gross State Domestic Product (In `) 42187 45207 49365 52586 55902 60994 65728
iv. Per Capita Net State Domestic Product (In `) 37972 40628 44425 47055 49806 54884 59221
3. Index Numbers with 2004-05 as base
A. At current Prices i. Gross State Domestic
Product 100.0 113.67 134.39 158.26 190.51 231.78 275.74
ii. Net State Domestic Product 100.0 113.55 134.66 158.42 190.92 232.75 277.49
iii. Per Capita Gross State Domestic Product 100.0 111.54 129.48 149.75 177.11 211.80 247.78
iv. Per Capita Net State Domestic Product 100.0 111.43 129.74 149.91 177.49 212.68 249.34
B. At 2004-05 Prices i. Gross State Domestic
Product 100.0 109.20 121.46 131.73 142.53 158.22 173.39
ii. Net State Domestic Product 100.0 109.04 121.44 130.96 141.09 158.17 173.56
iii. Per Capita Gross State Domestic Product 100.0 107.16 117.01 124.65 132.51 144.58 155.80
iv. Per Capita Net State Domestic Product 100.0 107.00 116.99 123.92 131.17 144.54 155.96
Q—Quick Estimates Source :—Department of Economic and Statistical Analysis, Haryana. P—Provisional Estimates
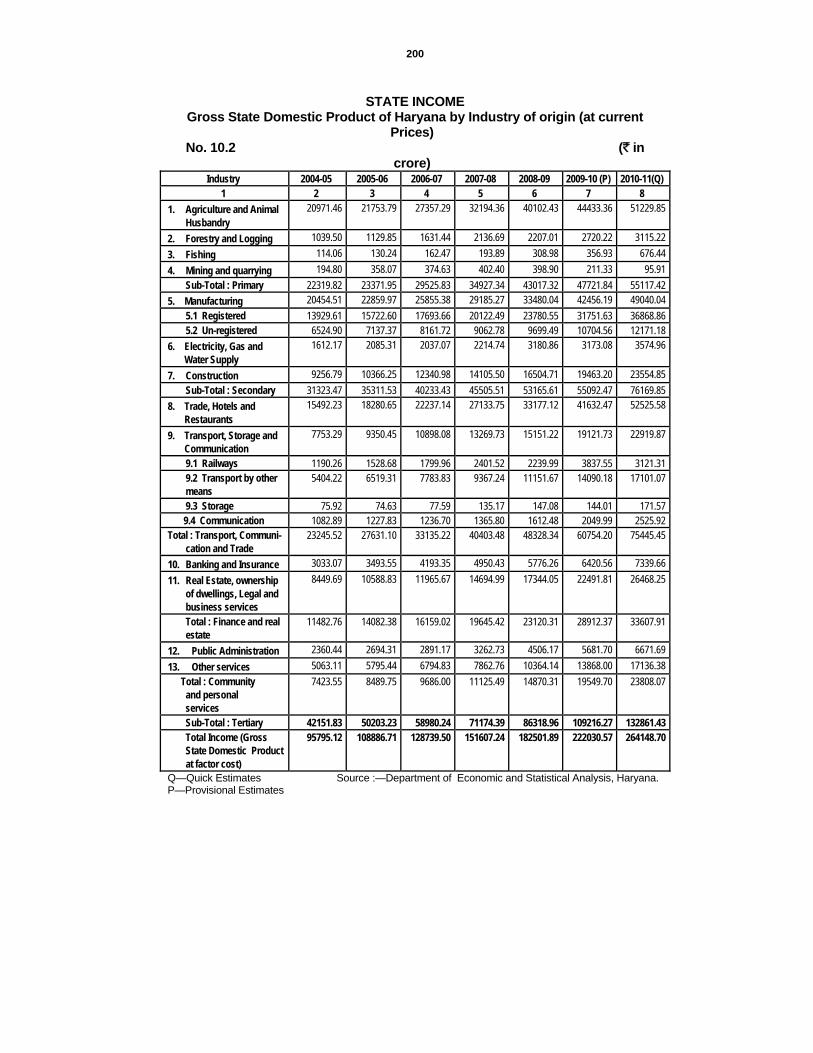
200
STATE INCOME
Gross State Domestic Product of Haryana by Industry of origin (at current Prices)
No. 10.2 (` in crore)
Industry 2004-05 2005-06 2006-07 2007-08 2008-09 2009-10 (P) 2010-11(Q) 1 2 3 4 5 6 7 8
1. Agriculture and Animal Husbandry
20971.46 21753.79 27357.29 32194.36 40102.43 44433.36 51229.85
2. Forestry and Logging 1039.50 1129.85 1631.44 2136.69 2207.01 2720.22 3115.22 3. Fishing 114.06 130.24 162.47 193.89 308.98 356.93 676.44 4. Mining and quarrying 194.80 358.07 374.63 402.40 398.90 211.33 95.91
Sub-Total : Primary 22319.82 23371.95 29525.83 34927.34 43017.32 47721.84 55117.42 5. Manufacturing 20454.51 22859.97 25855.38 29185.27 33480.04 42456.19 49040.04
5.1 Registered 13929.61 15722.60 17693.66 20122.49 23780.55 31751.63 36868.86 5.2 Un-registered 6524.90 7137.37 8161.72 9062.78 9699.49 10704.56 12171.18
6. Electricity, Gas and Water Supply
1612.17 2085.31 2037.07 2214.74 3180.86 3173.08 3574.96
7. Construction 9256.79 10366.25 12340.98 14105.50 16504.71 19463.20 23554.85 Sub-Total : Secondary 31323.47 35311.53 40233.43 45505.51 53165.61 55092.47 76169.85
8. Trade, Hotels and Restaurants
15492.23 18280.65 22237.14 27133.75 33177.12 41632.47 52525.58
9. Transport, Storage and Communication
7753.29 9350.45 10898.08 13269.73 15151.22 19121.73 22919.87
9.1 Railways 1190.26 1528.68 1799.96 2401.52 2239.99 3837.55 3121.31 9.2 Transport by other means
5404.22 6519.31 7783.83 9367.24 11151.67 14090.18 17101.07
9.3 Storage 75.92 74.63 77.59 135.17 147.08 144.01 171.57 9.4 Communication 1082.89 1227.83 1236.70 1365.80 1612.48 2049.99 2525.92 Total : Transport, Communi-
cation and Trade 23245.52 27631.10 33135.22 40403.48 48328.34 60754.20 75445.45
10. Banking and Insurance 3033.07 3493.55 4193.35 4950.43 5776.26 6420.56 7339.66 11. Real Estate, ownership
of dwellings, Legal and business services
8449.69 10588.83 11965.67 14694.99 17344.05 22491.81 26468.25
Total : Finance and real estate
11482.76 14082.38 16159.02 19645.42 23120.31 28912.37 33607.91
12. Public Administration 2360.44 2694.31 2891.17 3262.73 4506.17 5681.70 6671.69 13. Other services 5063.11 5795.44 6794.83 7862.76 10364.14 13868.00 17136.38
Total : Community and personal services
7423.55 8489.75 9686.00 11125.49 14870.31 19549.70 23808.07
Sub-Total : Tertiary 42151.83 50203.23 58980.24 71174.39 86318.96 109216.27 132861.43 Total Income (Gross State Domestic Product at factor cost)
95795.12 108886.71 128739.50 151607.24 182501.89 222030.57 264148.70
Q—Quick Estimates Source :—Department of Economic and Statistical Analysis, Haryana. P—Provisional Estimates
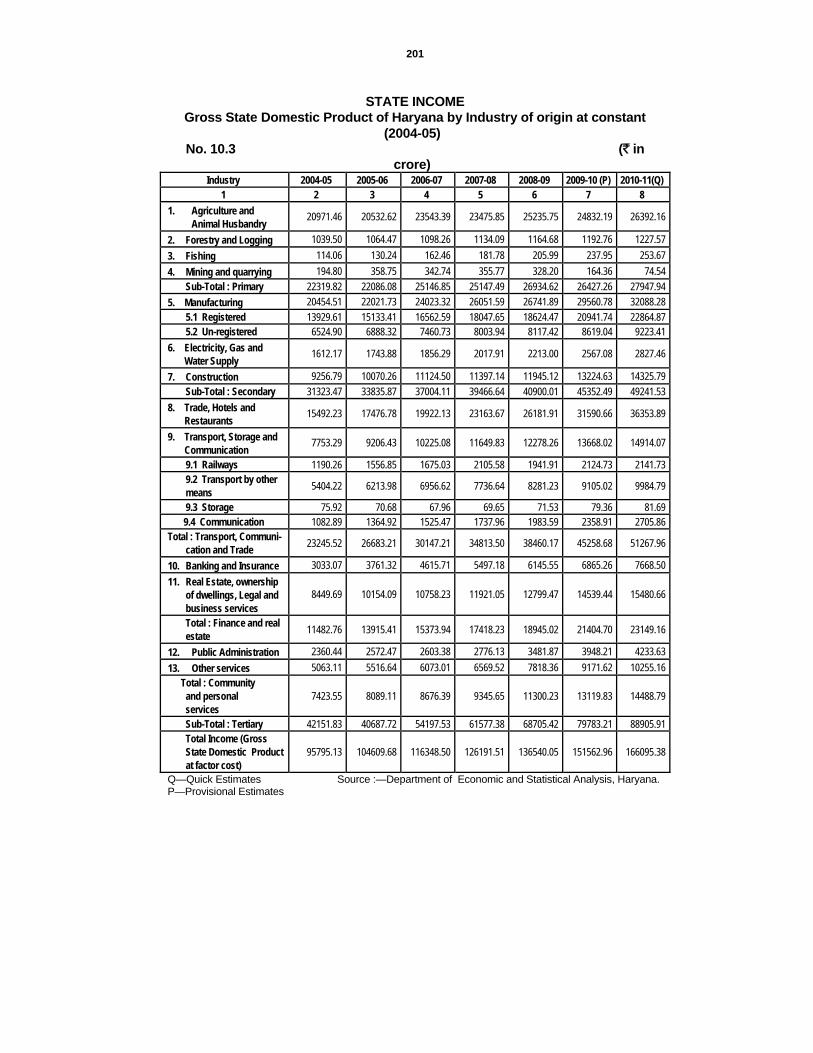
201
STATE INCOME
Gross State Domestic Product of Haryana by Industry of origin at constant (2004-05)
No. 10.3 (` in crore)
Industry 2004-05 2005-06 2006-07 2007-08 2008-09 2009-10 (P) 2010-11(Q) 1 2 3 4 5 6 7 8
1. Agriculture and Animal Husbandry 20971.46 20532.62 23543.39 23475.85 25235.75 24832.19 26392.16
2. Forestry and Logging 1039.50 1064.47 1098.26 1134.09 1164.68 1192.76 1227.57 3. Fishing 114.06 130.24 162.46 181.78 205.99 237.95 253.67 4. Mining and quarrying 194.80 358.75 342.74 355.77 328.20 164.36 74.54
Sub-Total : Primary 22319.82 22086.08 25146.85 25147.49 26934.62 26427.26 27947.94 5. Manufacturing 20454.51 22021.73 24023.32 26051.59 26741.89 29560.78 32088.28
5.1 Registered 13929.61 15133.41 16562.59 18047.65 18624.47 20941.74 22864.87 5.2 Un-registered 6524.90 6888.32 7460.73 8003.94 8117.42 8619.04 9223.41
6. Electricity, Gas and Water Supply 1612.17 1743.88 1856.29 2017.91 2213.00 2567.08 2827.46
7. Construction 9256.79 10070.26 11124.50 11397.14 11945.12 13224.63 14325.79 Sub-Total : Secondary 31323.47 33835.87 37004.11 39466.64 40900.01 45352.49 49241.53
8. Trade, Hotels and Restaurants 15492.23 17476.78 19922.13 23163.67 26181.91 31590.66 36353.89
9. Transport, Storage and Communication 7753.29 9206.43 10225.08 11649.83 12278.26 13668.02 14914.07
9.1 Railways 1190.26 1556.85 1675.03 2105.58 1941.91 2124.73 2141.73 9.2 Transport by other means 5404.22 6213.98 6956.62 7736.64 8281.23 9105.02 9984.79
9.3 Storage 75.92 70.68 67.96 69.65 71.53 79.36 81.69 9.4 Communication 1082.89 1364.92 1525.47 1737.96 1983.59 2358.91 2705.86 Total : Transport, Communi-
cation and Trade 23245.52 26683.21 30147.21 34813.50 38460.17 45258.68 51267.96
10. Banking and Insurance 3033.07 3761.32 4615.71 5497.18 6145.55 6865.26 7668.50 11. Real Estate, ownership
of dwellings, Legal and business services
8449.69 10154.09 10758.23 11921.05 12799.47 14539.44 15480.66
Total : Finance and real estate 11482.76 13915.41 15373.94 17418.23 18945.02 21404.70 23149.16
12. Public Administration 2360.44 2572.47 2603.38 2776.13 3481.87 3948.21 4233.63 13. Other services 5063.11 5516.64 6073.01 6569.52 7818.36 9171.62 10255.16
Total : Community and personal services
7423.55 8089.11 8676.39 9345.65 11300.23 13119.83 14488.79
Sub-Total : Tertiary 42151.83 40687.72 54197.53 61577.38 68705.42 79783.21 88905.91 Total Income (Gross State Domestic Product at factor cost)
95795.13 104609.68 116348.50 126191.51 136540.05 151562.96 166095.38
Q—Quick Estimates Source :—Department of Economic and Statistical Analysis, Haryana. P—Provisional Estimates

202
STATE INCOME Net State Domestic Product of Haryana by Industry of origin
(at current Prices) No. 10.4 (` in
crore) Industry 2004-05 2005-06 2006-07 2007-08 2008-09 2009-10 (P) 2010-11(Q)
1 2 3 4 5 6 7 8 1. Agriculture and
Animal Husbandry 19844.88 20511.30 25944.83 30536.86 38168.07 42105.06 48545.40
2. Forestry and Logging 1025.94 1113.99 1611.55 2119.04 2176.32 2687.58 3077.84 3. Fishing 99.70 114.38 142.15 168.01 265.59 310.78 588.98 4. Mining and quarrying 161.20 291.65 304.02 326.38 318.12 168.53 76.49
Sub-Total : Primary 21131.72 22031.32 28002.55 33150.29 40928.10 45271.95 52288.70 5. Manufacturing 16282.05 18284.74 20465.27 22545.31 25723.58 33295.42 38453.67
5.1 Registered 11022.27 12567.81 13914.87 15206.02 17977.01 24693.24 28672.91 5.2 Un-registered 5259.78 5716.93 6550.40 7339.29 7746.57 8602.18 9780.76
6. Electricity, Gas and Water Supply 922.16 1163.31 1110.44 1201.65 1688.19 1744.24 1965.16
7. Construction 8837.06 9893.37 11750.68 13405.41 15679.06 18534.81 22431.29 Sub-Total : Secondary 26041.27 29341.42 33326.39 37152.37 43090.83 53574.47 62850.12
8. Trade, Hotels and Restaurants 15152.40 17885.62 21770.20 26566.96 32432.87 40733.21 51391.03
9. Transport, Storage and Communication 6749.01 8088.72 9485.11 11669.01 13389.14 16752.17 20140.17
9.1 Railways 828.10 1026.34 1231.66 1759.76 1528.42 1936.06 2129.67 9.2 Transport by other means 4942.52 5969.08 7142.13 8646.46 10406.25 12977.05 15750.09
9.3 Storage 72.71 70.78 73.09 130.10 142.03 137.57 163.90 9.4 Communication 905.68 1022.52 1038.23 1132.69 1312.44 1701.49 2096.51 Total : Transport, Communi-
cation and Trade 21901.41 25974.34 31255.31 38235.97 45822.01 57485.38 71531.20
10. Banking and Insurance 2979.88 3431.25 4120.56 4867.80 5684.68 6310.77 7017.57 11. Real Estate, ownership
of dwellings, Legal and business services
7408.88 9413.72 10602.84 13088.60 15396.82 19930.00 23453.51
Total : Finance and real estate 10388.76 12844.97 14723.40 17956.40 21081.50 26240.77 30471.08
12. Public Administration 1904.43 2176.47 2329.31 2617.44 3775.94 4860.19 5747.49 13. Other services 4854.69 5536.79 6473.75 7482.79 9917.66 13245.33 16366.96
Total : Community and personal services
6759.12 7713.26 8803.06 10100.23 13693.60 18105.52 22114.45
Sub-Total : Tertiary 39049.29 46532.57 54781.77 66292.60 80597.11 101831.67 124116.73 Total Income (Gross State Domestic Product at factor cost)
86222.28 97905.31 116110.71 136595.26 164616.04 200678.09 239255.55
Q—Quick Estimates Source :—Department of Economic and Statistical Analysis, Haryana. P—Provisional Estimates

203
STATE INCOME Net State Domestic Product of Haryana by Industry of origin at constant
(2004-05) No. 10.5 (` in
crore) Industry 2004-05 2005-06 2006-07 2007-08 2008-09 2009-10 (P) 2010-11(Q)
1 2 3 4 5 6 7 8 1. Agriculture and
Animal Husbandry 19844.88 19340.33 22267.84 22058.10 23701.61 23406.82 24877.25
2. Forestry and Logging 1025.94 1049.23 1080.37 1119.17 1140.85 1174.28 1208.54 3. Fishing 99.70 114.88 143.30 158.57 169.89 206.33 219.95 4. Mining and quarrying 161.20 294.97 277.96 288.71 260.89 130.65 59.25
Sub-Total : Primary 21131.72 20799.41 23769.47 23624.55 25273.24 24918.08 26364.99 5. Manufacturing 16282.05 17608.01 19007.76 20056.45 20068.44 23084.41 25053.98
5.1 Registered 11022.27 12080.96 13023.38 13576.44 13604.95 16160.74 17644.82 5.2 Un-registered 5259.78 5527.05 5984.38 6480.01 6463.49 6923.67 7409.16
6. Electricity, Gas and Water Supply 922.16 860.12 1009.42 1125.44 964.98 1336.42 1471.98
7. Construction 8837.06 9612.75 10571.20 10759.47 11230.85 12546.20 13590.87 Sub-Total : Secondary 26041.27 28080.88 30588.38 31941.36 32264.27 36967.03 40116.83
8. Trade, Hotels and Restaurants 15152.40 17094.82 19495.56 22674.73 25587.29 30901.98 35561.38
9. Transport, Storage and Communication 6749.01 7979.22 8902.94 10219.59 10806.93 11953.68 13073.03
9.1 Railways 828.10 1064.73 1145.70 1548.46 1377.36 1507.07 1519.13 9.2 Transport by other means 4942.52 5679.25 6349.69 7074.06 7631.48 8331.10 9136.08
9.3 Storage 72.71 66.98 63.90 65.34 67.58 75.05 77.25 9.4 Communication 905.68 1168.26 1343.65 1531.71 1730.50 2040.46 2340.57 Total : Transport, Communi-
cation and Trade 21901.41 25074.04 28398.50 32894.32 36394.22 42855.66 48634.41
10. Banking and Insurance 2979.88 3701.23 4547.94 5422.56 6066.89 6762.97 7554.23 11. Real Estate, ownership
of dwellings, Legal and business services
7408.88 9016.79 9534.41 10589.24 11320.64 12864.50 13697.29
Total : Finance and real estate 10388.76 12718.02 14082.35 16011.80 17387.53 19627.47 21251.52
12. Public Administration 1904.43 2074.01 2089.07 2211.42 2884.82 3271.09 3507.56 13. Other services 4854.69 5266.99 5776.88 6233.22 7446.41 8742.39 9775.22
Total : Community and personal services
6759.12 7341.00 7865.95 8444.64 10331.23 12013.48 13282.78
Sub-Total : Tertiary 39049.29 45133.06 50346.80 57350.76 64112.98 74496.61 83168.71 Total Income (Gross State Domestic Product at factor cost)
86222.28 94013.35 104704.65 112916.67 121650.49 136381.72 149650.53
Q—Quick Estimates Source :—Department of Economic and Statistical Analysis, Haryana. P—Provisional Estimates
STATE INCOME

204
Indices of Net State Domestic Product at Factor cost by Major sources in Haryana (2004-05=100)
No. 10.6 Year
Particulars 2004-05 2005-06 2006-07 2007-08 2008-09 2009-10 (P)
2010-11 (Q)
1 2 3 4 5 6 7 8 Net State Domestic Product (Index) —
(i) At Current Prices 100.0 113.5 134.7 158.4 190.9 232.7 277.5(ii) At 2004-05 Prices 100.0 109.0 121.4 131.0 141.1 158.2 173.6
(A) Primary Sector (i) At Current Prices 100.0 104.3 132.5 156.9 193.7 214.2 247.4(ii) At 2004-05Prices 100.0 98.4 112.5 111.8 119.6 117.9 124.8
(B) Secondary Sector (i) At Current Prices 100.0 112.7 128.0 142.7 165.5 205.7 241.3(ii) At 2004-05 Prices 100.0 107.8 117.5 122.7 123.9 142.0 154.1
(C) Transport, Communication and Trade
(i) At Current Prices 100.0 118.6 142.7 174.6 209.2 262.5 326.6(ii) At 2004-05 Prices 100.0 114.5 129.7 150.2 166.2 195.7 222.1
(D) Finance and Real Estate (i) At Current Prices 100.0 123.6 141.7 172.8 202.9 252.6 293.3(ii) At 2004-05 Prices 100.0 122.4 135.6 154.1 167.4 188.9 204.6
(E) Community and Personal Services
(i) At Current Prices 100.0 114.1 130.2 149.4 202.6 267.9 327.2(ii) At 2004-05 Prices 100.0 108.6 116.4 124.9 152.8 177.7 196.5
Per Capita Net State Domestic Product
(i) At Current Prices 100.0 111.4 129.7 149.9 177.5 212.7 249.3(ii) At 2004-05 Prices 100.0 107.0 117.0 123.9 131.2 144.5 156.0
Q—Quick Estimates Source :—Department of Economic and Statistical Analysis, Haryana. P—Provisional Estimates

205
STATE INCOME Percentage change in Gross State Domestic Product over the previous year
(At 2004-05 Prices) No. 10.7
Year Sector 2005-06 2006-07 2007-08 2008-09 2009-10(P) 2010-11(Q)
1 2 3 4 5 6 7 HARYANA STATE
(i) Primary (-)1.0 13.9 0.0 7.1 (-)1.9 5.8(ii) Secondary 8.0 9.4 6.7 3.6 10.9 8.6(iii) Transport,
Communication and Trade
14.8 13.0 15.5 10.5 17.7 13.3
(iv) Finance and Real Estate
21.2 10.5 13.3 8.8 13.0 8.1
(v) Community and Personal Services
9.0 7.3 7.7 20.9 16.1 10.4
Total Gross State Domestic Product
9.2 11.2 8.5 8.2 11.0 9.6
INDIA (i) Primary 4.6 4.6 5.5 0.4 1.7 6.8(ii) Secondary 10.7 12.7 10.3 4.7 8.6 7.4(iii) Transport,
Communication and Trade
12.0 11.6 10.9 7.5 10.3 11.1
(iv) Finance and Real Estate
12.6 14.0 12.0 12.0 9.4 10.4
(v) Community and Personal Services
7.1 2.8 6.9 12.5 12.0 4.5
Total Gross Domestic Product
9.5 9.6 9.3 6.7 8.4 8.4
Source :—Department of Economic and Statistical Analysis, P—Provisional Estimates Haryana and Central Statistical Organisation. Q—Quick Estimates
206
PER CAPITA INCOME OF VARIOUS STATES

207
STATE INCOME Per Capita Income of various States and Indian Union
(At Current Prices) No. 10.8 (`)
State 2004-05 2005-06 2006-07 1 2 3 4
Andhra Pradesh 25321 28539 33135Arunachal Pradesh 27719 29473 31840Assam 16782 18396 19737Bihar 7914 8341 10249Chhattisgarh 18559 20117 24800Goa 76426 85299 94512Gujarat 32021 37780 43395Haryana 37972 42310 49264Himachal Pradesh 32564 35850 38931Jammu & Kashmir 21314 22813 24443Jharkhand 18510 18326 19789Karnataka 26804 31166 35969Kerala 31871 36276 40419Madhya Pradesh 15442 16631 19028Maharashtra 35915 41624 49568Manipur 18640 20395 21419Meghalaya 24086 26284 30952Mizoram 24662 26698 28764Nagaland 30271 33792 36568Orissa 17380 18618 21980Punjab 33103 36142 41740Rajasthan 18565 20275 24055Sikkim 26693 30256 32203Tamil Nadu 30062 35243 42288Tripura 24394 26668 29081Uttar Pradesh 12950 14222 15998Uttarakhand 24726 29423 35111West Bengal 22649 24720 27823All India 24143 27131 31206P—Provisional Estimates . .—Not Available Q—Quick Estimates
STATE INCOME

208
Per Capita Income of various States and Indian Union (At Current Prices)
No. 10.8 (Concld.) (`) State 2007-08 2008-09 2009-10(P) 2010-11(Q)
1 5 6 7 8 Andhra Pradesh 39727 45007 51025 60458Arunachal Pradesh 36697 43445 51405 . .Assam 21290 24099 27464 30569Bihar 11589 14629 16715 20069Chhattisgarh 29385 34360 38059 44097Goa 107311 119273 132719 . .Gujarat 50016 55140 63961 . .Haryana 56922 67397 80759 94680Himachal Pradesh 42076 46019 50365 58493Jammu & Kashmir 26285 28332 30582 33056Jharkhand 24789 25046 27132 29786Karnataka 42345 47604 52097 59763Kerala 45700 53046 60264 69627Madhya Pradesh 20935 23757 27250 . .Maharashtra 57218 64238 74027 83471Manipur 23093 24773 27332 29684Meghalaya 34229 40628 45006 50483Mizoram 32488 38582 45982 . .Nagaland 39985 45353 . . . .Orissa 27560 30121 33226 36923Punjab 49195 54633 60746 67473Rajasthan 26882 30592 34042 39967Sikkim 36452 46989 68731 81159Tamil Nadu 47606 54140 63547 72993Tripura 31111 33350 35799 38493Uttar Pradesh 17786 20342 23395 26051Uttarakhand 42619 50674 59584 68292West Bengal 31567 35513 41219 . .All India 35825 40775 46117 53331
Source :—State Statistical Bureaus and Central Statistical Organisation.

209
STATE INCOME
Per Capita Income of various States and Indian Union (At Constant 2004-05 prices)
No. 10.9 (`) State 2004-05 2005-06 2006-07
1 2 3 4 Andhra Pradesh 25321 27486 30114Arunachal Pradesh 27719 28117 29248Assam 16782 17050 17579Bihar 7914 7798 9128Chhattisgarh 18559 18530 21580Goa 76426 80531 85592Gujarat 32021 36102 38568Haryana 37972 40628 44425Himachal Pradesh 32564 34741 36813Jammu & Kashmir 21314 22198 23197Jharkhand 18510 17406 17427Karnataka 26804 29231 31968Kerala 31871 34837 37284Madhya Pradesh 15442 15927 17073Maharashtra 35915 40947 46158Manipur 18640 19479 19431Meghalaya 24086 25642 27242Mizoram 24662 25826 26308Nagaland 30271 33072 35074Orissa 17380 17964 20009Punjab 33103 33960 36918Rajasthan 18565 19445 21342Sikkim 26693 29011 30296Tamil Nadu 30062 34126 39166Tripura 24394 25688 27558Uttar Pradesh 12950 13443 14232Uttarakhand 24726 27702 30720West Bengal 22649 23808 25400All India 24143 26015 28067P—Provisional Estimates Q—Quick Estimates

210
STATE INCOME Per Capita Income of various States and Indian Union
(At Constant 2004-05 Prices) No. 10.9 (Concld.)
(`) State 2007-08 2008-09 2009-10(P) 2010-11 (Q)
1 5 6 7 8 Andhra Pradesh 33239 34716 36345 39340
Arunachal Pradesh 32268 34826 38678 . .
Assam 18089 18922 20193 21406
Bihar 9658 10985 11799 13303
Chhattisgarh 22929 23926 25835 28296
Goa 86487 90801 98807 . .
Gujarat 42498 44861 49030 . .
Haryana 47055 49806 54884 59221
Himachal Pradesh 38418 39242 40690 43318
Jammu & Kashmir 24261 25421 26739 28150
Jharkhand 20996 19867 20646 21734
Karnataka 35512 37177 37609 40204
Kerala 40288 42433 45908 49873
Madhya Pradesh 17572 18540 19736 . .
Maharashtra 50532 53640 57458 62729
Manipur 20106 21169 22359 23298
Meghalaya 27764 30963 33235 35932
Mizoram 28467 31921 35323 . .
Nagaland 37317 38921 . . . .
Orissa 21554 22465 24098 24356
Punjab 39314 40839 43199 45362
Rajasthan 21922 23101 23653 25616
Sikkim 31725 35398 44186 47655
Tamil Nadu 41314 42939 46692 51928
Tripura 29022 31156 33503 35732
Uttar Pradesh 14866 15613 16411 17418
Uttarakhand 35437 38624 42486 45665
West Bengal 27094 27928 30065 . .
All India 30332 31754 33843 35993Source :—State Statistical Bureaus and Central Statistical Organisation.

211
SECTION XI GROSS FIXED CAPITAL FORMATION IN HARYANA
Gross fixed capital formation in Haryana consists of additions to the assets of producers of tangible reproductible goods which have an expected life time use of one year or more. The main object of these estimates is to assess the pace of development brought out as a result of investment both in public and private sectors. These estimates also provide insight as to the quantum of expenditure that has been made for the creation of capital assets during the year. For estimating the gross fixed capital formation, the entire economic activity has been classified into thirteen sectors, viz. Agriculture, Forestry, Fishing, Mining and Quarrying, Registered Manufacturing and Un-Registered Manufacturing, Construction, Electricity, Gas and Water Supply, Transport, Storage and Communication, Trade, Hotels and Restaurants, Banking and Insurance, Real Estate and Ownership of Dwellings (Residential part only) Public Administration and Other Services.
These estimates are based on data available at the moment and are subject to revision necessitated by the availability of additional information and change in methodology.
Table 11.1 and 11.2 show the Gross Fixed Capital Formation in Haryana by Industry of Use at current and constant (2004-2005) prices respectively.
Table 11.3 and 11.4 show the Gross Fixed Capital Formation in Haryana by Type of Institutions at current and constant (2004-2005) prices respectively.
Table 11.5 and 11.6 show the Gross Fixed Capital Formation in Haryana by Type of Assets at current and constant (2004-2005) prices respectively.

212
Gross Fixed Capital Formation Estimates of Gross Fixed Capital Formation in Haryana by Industry of Use
(At Current Prices) No. 11.1 (Rs. in crore)
Industry 2004-05(R) 2005-06(R) 2006-07(R) 2007-08(R) 1 2 3 4 5
1. Agriculture 1130.61 1300.66 1668.91 2467.16 (7.8) (7.8) (8.2) (9.3)2. Forestry 171.60 67.84 67.76 73.16 (1.2) (0.4) (0.3) (0.3)3. Fishing 3.91 7.74 5.22 7.91 (0.0) (0.0) (0.0) (0.0)4. Mining and Quarrying 47.85 49.44 51.12 54.33 (0.3) (0.3) (0.3) (0.2)5. Manufacturing 6528.50 7449.55 8898.80 11371.09
(45.0) (44.8) (43.9) (43.0)5.1 Registered 3663.94 4315.72 5309.51 7386.495.2 Un-registered 2864.56 3133.83 3589.29 3984.60
6. Electricity, Gas and Water Supply 1166.90 1580.02 2456.83 3068.75 (8.0) (9.5) (12.1) (11.6)7. Construction 355.14 374.30 400.8 682.72 (2.4) (2.2) (2.0) (2.6)8. Trade, Hotels and Restaurants 86.21 92.95 96.62 129.08
(0.6) (0.6) (0.5) (0.5)8.1 Trade 49.70 53.49 54.36 85.568.2 Hotels and Restaurants 36.51 39.46 42.26 43.52
9. Transport, Storage and Communication 873.61 1234.45 1407.09 1936.22 (6.0) (7.4) (7.0) (7.3)
9.1 Railways 49.12 315.20 338.21 751.659.2 Transport by other means 299.88 277.94 409.04 418.359.3 Storage 5.60 5.03 9.35 12.549.4 Communication 519.01 636.28 650.49 753.68
10. Banking and Insurance 189.23 160.06 171.40 247.42 (1.3) (1.0) (0.8) (0.9)11. Real Estate, Ownership of Dwellings, and
Business Services (only Residential Building Part)
2435.16 2590.89 2933.13 3386.59
(16.8) (15.6) (14.5) (12.8)12. Public Administration 1347.51 1514.65 1840.14 2658.85
(9.3) (9.1) (9.1) (10.0)13. Other Services 183.38 208.31 267.22 380.14
(1.3) (1.3) (1.3) (1.5)Total 14519.61 16630.86 20264.32 26463.42
(100.0) (100.0) (100.0) (100.0) Note— Figures in brackets are percentages to total. P— Provisional. R—Revised.

213
Gross Fixed Capital Formation Estimates of Gross Fixed Capital Formation in Haryana by Industry of Use
(At Current Prices) No. 11.1 (Concld.) (Rs. in crore)
Industry 2008-09(P) 2009-10(P) 1 6 7
1. Agriculture 2912.31 3649.61 (9.1) (9.6)2. Forestry 92.24 70.22 (0.3) (0.2)3. Fishing 9.82 9.66 (0.0) (0.0)4. Mining and Quarrying 54.53 18.79 (0.2) (0.0)5. Manufacturing 12998.34 16257.01
(40.8) (42.9)5.1 Registered 8733.01 11559.135.2 Un-registered 4265.33 4697.88
6. Electricity, Gas and Water Supply 4506.95 4376.14 (14.1) (11.6)7. Construction 704.73 1008.81 (2.2) (2.7)8. Trade, Hotels and Restaurants 373.24 397.83
(1.2) (1.1)8.1 Trade 316.39 343.058.2 Hotels and Restaurants 56.85 54.78
9. Transport, Storage and Communication 2036.90 2472.41 (6.4) (6.5)
9.1 Railways 653.18 840.659.2 Transport by other means 504.22 417.889.3 Storage 5.98 80.929.4 Communication 873.52 1132.96
10. Banking and Insurance 273.64 308.94 (0.9) (0.8)11. Real Estate, Ownership of Dwellings, and Business Services (only
Residential Building Part) 3895.67 4251.64
(12.2) (11.2)12. Public Administration 3556.15 4425.83
(11.1) (11.7)13. Other Services 467.42 623.20
(1.5) (1.7)Total 31881.94 37870.09
(100.0) (100.0)Source :—Department of Economic and Statistical Analysis, Haryana.

214
Gross Fixed Capital Formation Estimates of Gross Fixed Capital Formation in Haryana by Industry of Use
At Constant (2004-2005) Prices No. 11.2 (Rs. in crore)
Industry 2004-05(R) 2005-06(R) 2006-07(R) 1 2 3 4
1. Agriculture 1130.61 1242.93 1527.54 (7.8) (7.7) (8.3)2. Forestry 171.60 65.94 62.12 (1.2) (0.4) (0.3)3. Fishing 3.91 7.52 4.79 (0.0) (0.0) (0.0)4. Mining and Quarrying 47.85 48.32 46.44 (0.3) (0.3) (0.3)5. Manufacturing 6528.50 7225.33 8067.16
(45.0) (44.8) (43.8)5.1 Registered 3663.94 4174.77 4818.545.2 Un-registered 2864.56 3050.56 3248.62
6. Electricity, Gas and Water Supply 1166.90 1531.53 2250.64 (8.0) (9.5) (12.2)7. Construction 355.14 366.01 367.01 (2.4) (2.3) (2.1)8. Trade, Hotels and Restaurants 86.21 90.63 89.05
(0.6) (0.6) (0.5)8.1 Trade 49.70 52.09 50.958.2 Hotels and Restaurants 36.51 38.54 38.10
9. Transport, Storage and Communication 873.61 1197.48 1294.67 (6.0) (7.4) (7.0)
9.1 Railways 49.12 306.11 305.779.2 Transport by other means 299.88 270.63 387.939.3 Storage 5.60 4.90 7.979.4 Communication 519.01 615.84 593.00
10. Banking and Insurance 189.23 155.49 155.94 (1.3) (1.0) (0.8)11. Real Estate, Ownership of Dwellings, and Business
Services (only Residential Building Part) 2435.16 2523.81 2644.92
(16.8) (15.6) (14.3)12. Public Administration 1347.51 1470.69 1686.23
(9.3) (9.1) (9.1)13. Other Services 183.38 202.76 242.58
(1.3) (1.3) (1.3)Total 14519.61 16128.44 18439.09
(100.0) (100.0) (100.0)Note— Figures in brackets are percentages to total. P— Provisional R—Revised

215
Gross Fixed Capital Formation Estimates of Gross Fixed Capital Formation in Haryana by Industry of Use
At Constant (2004-2005) Prices No. 11.2 (Concld.) (Rs. in crore)
Industry 2007-08(R) 2008-09(P) 2009-10(P) 1 5 6 7
1. Agriculture 2033.21 2139.72 2400.25 (9.1) (8.6) (8.4)2. Forestry 60.05 68.14 49.10 (0.3) (0.3) (0.2)3. Fishing 6.51 7.34 6.96 (0.0) (0.0) (0.0)4. Mining and Quarrying 44.67 40.40 14.53 (0.2) (0.2) (0.1)5. Manufacturing 9703.55 10269.93 13033.45
(43.5) (41.4) (45.9)5.1 Registered 6389.81 7004.19 9539.715.2 Un-registered 3313.74 3265.74 3493.74
6. Electricity, Gas and Water Supply 2638.67 3750.53 3120.14 (11.8) (15.1) (11.0)7. Construction 560.42 521.02 705.87 (2.5) (2.2) (2.4)8. Trade, Hotels and Restaurants 114.64 286.06 298.54
(0.5) (1.1) (1.0)8.1 Trade 79.18 244.22 259.558.2 Hotels and Restaurants 35.46 41.84 38.99
9. Transport, Storage and Communication 1670.31 1648.89 1953.05 (7.5) (6.6) (6.9)
9.1 Railways 631.31 512.40 643.079.2 Transport by other means 385.62 439.89 354.219.3 Storage 10.29 4.63 59.219.4 Communication 646.09 691.97 896.56
10. Banking and Insurance 214.48 202.34 246.12 (1.0) (0.8) (0.9)11. Real Estate, Ownership of Dwellings, and Business
Services (only Residential Building Part) 2747.66 2863.50 2984.68
(12.3) (11.5) (10.5)12. Public Administration 2198.27 2682.36 3142.09
(9.9) (10.8) (11.1)13. Other Services 312.18 348.41 453.14
(1.4) (1.4) (1.6)Total 22304.62 24828.64 28407.92
(100.0) (100.0) (100.00)Source :—Department of Economic and Statistical Analysis, Haryana.
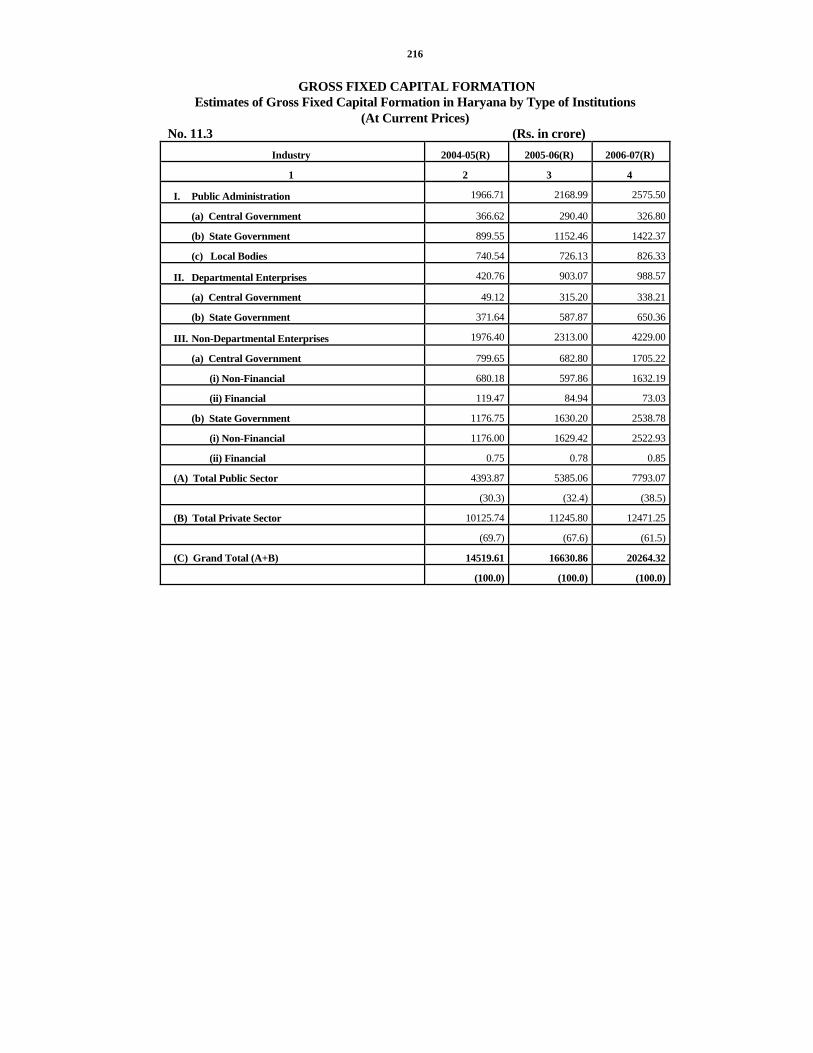
216
GROSS FIXED CAPITAL FORMATION Estimates of Gross Fixed Capital Formation in Haryana by Type of Institutions
(At Current Prices) No. 11.3 (Rs. in crore)
Industry 2004-05(R) 2005-06(R) 2006-07(R)
1 2 3 4
I. Public Administration 1966.71 2168.99 2575.50
(a) Central Government 366.62 290.40 326.80
(b) State Government 899.55 1152.46 1422.37
(c) Local Bodies 740.54 726.13 826.33
II. Departmental Enterprises 420.76 903.07 988.57
(a) Central Government 49.12 315.20 338.21
(b) State Government 371.64 587.87 650.36
III. Non-Departmental Enterprises 1976.40 2313.00 4229.00
(a) Central Government 799.65 682.80 1705.22
(i) Non-Financial 680.18 597.86 1632.19
(ii) Financial 119.47 84.94 73.03
(b) State Government 1176.75 1630.20 2538.78
(i) Non-Financial 1176.00 1629.42 2522.93
(ii) Financial 0.75 0.78 0.85
(A) Total Public Sector 4393.87 5385.06 7793.07
(30.3) (32.4) (38.5)
(B) Total Private Sector 10125.74 11245.80 12471.25
(69.7) (67.6) (61.5)
(C) Grand Total (A+B) 14519.61 16630.86 20264.32
(100.0) (100.0) (100.0)

217
GROSS FIXED CAPITAL FORMATION Estimates of Gross Fixed Capital Formation in Haryana by Type of Institutions
(At Current Prices) No. 11.3 (Concld.) (Rs. in crore)
Industry 2007-08 2008-09 (P) 2009-10 (P) 1 5 6 7
IV. Public Administration 3930.11 4952.79 6244.94
(a) Central Government 752.39 1085.70 1397.30(b) State Government 1960.32 2557.18 2954.81(c) Local Bodies 1217.40 1309.91 1892.83
V. Departmental Enterprises 1767.24 1647.97 1715.70
(a) Central Government 751.65 653.18 840.65(b) State Government 1015.59 994.79 875.05
VI. Non-Departmental Enterprises 4694.75 8129.75 6603.51
(a) Central Government 1492.25 3232.51 1839.12(i) Non-Financial 1381.42 3199.57 1694.06(ii) Financial 110.83 32.94 145.06
(b) State Government 3202.50 4897.24 4764.39(i) Non-Financial 3196.86 4896.80 4764.25(ii) Financial 5.64 0.44 0.14
(A) Total Public Sector 10392.10 14730.51 14564.15 (39.3) (46.2) (38.5)(B) Total Private Sector 16071.32 17151.43 23305.94 (60.7) (53.8) (61.5)(C) Grand Total (A+B) 26463.42 31881.94 37870.09
(100.0) (100.0) (100.0)Source :—Department of Economic and Statistical Analysis, Haryana.
Note — Figures in brackets are percentages to total. P— Provisional R—Revised

218
Gross Fixed Capital Formation Estimates of Gross Fixed Capital Formation in Haryana by Type of Institutions
At Constant (2004-2005) prices No. 11.4 (Rs. in crore)
Institutions 2004-05(R) 2005-06(R) 2006-07(R)
1 2 3 4
I. Public Administration 1996.71 2095.52 2359.34
(a) Central Government 366.62 282.01 295.03
(b) State Government 889.55 1115.08 1309.90
(c) Local Bodies 740.54 698.43 754.31
II. Departmental Enterprises 420.76 867.75 904.06
(a) Central Government 49.12 306.11 305.77
(b) State Government 371.64 561.44 598.29
III. Non-Departmental Enterprises 1976.40 2240.94 3860.01
(a) Central Government 799.65 660.49 1548.81
(i) Non-Financial 680.18 578.27 1482.44
(ii) Financial 119.47 82.22 66.37
(b) State Government 1176.75 1580.45 2311.20
(i) Non-Financial 1176.00 1579.69 2310.42
(ii) Financial 0.75 0.76 0.78
(A) Total Public Sector 4393.87 5204.01 7123.31
(30.3) (32.3) (38.6)
(B) Total Private Sector 10125.74 10924.43 11315.78
(69.7) (67.7) (61.4)
(C) Grand Total (A+B) 14519.61 16128.44 18439.09
(100.0) (100.0) (100.0)
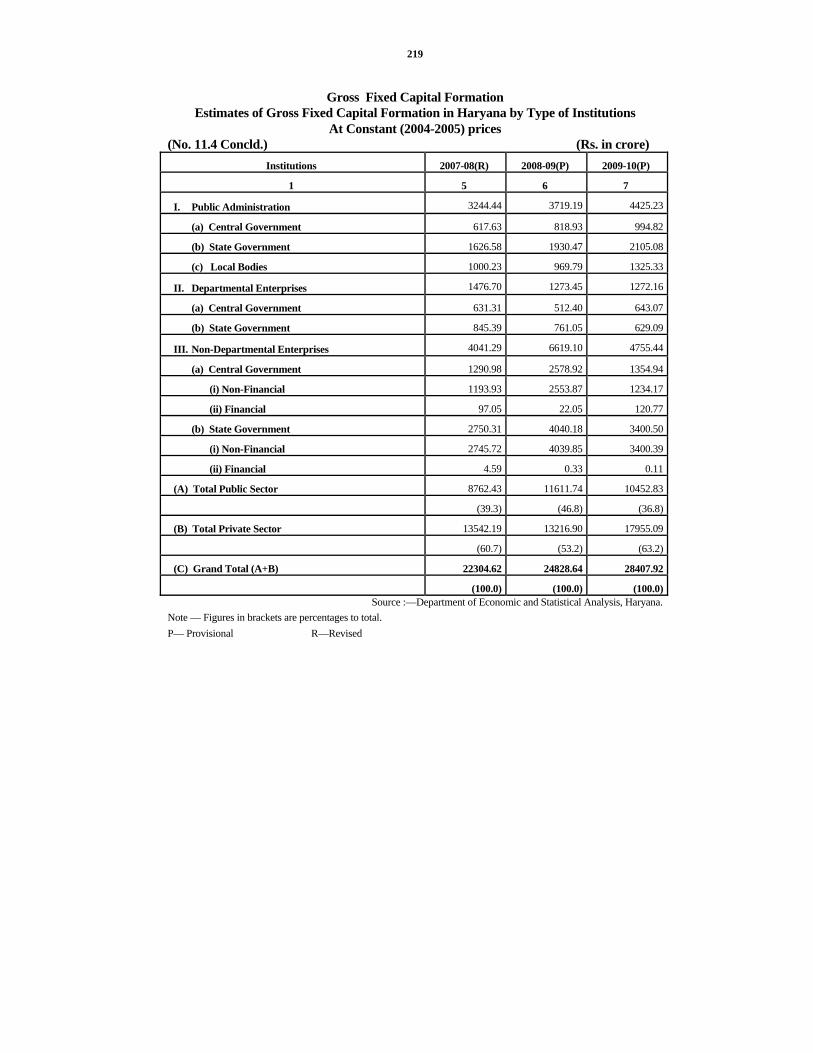
219
Gross Fixed Capital Formation
Estimates of Gross Fixed Capital Formation in Haryana by Type of Institutions At Constant (2004-2005) prices
(No. 11.4 Concld.) (Rs. in crore) Institutions 2007-08(R) 2008-09(P) 2009-10(P)
1 5 6 7
I. Public Administration 3244.44 3719.19 4425.23
(a) Central Government 617.63 818.93 994.82
(b) State Government 1626.58 1930.47 2105.08
(c) Local Bodies 1000.23 969.79 1325.33
II. Departmental Enterprises 1476.70 1273.45 1272.16
(a) Central Government 631.31 512.40 643.07
(b) State Government 845.39 761.05 629.09
III. Non-Departmental Enterprises 4041.29 6619.10 4755.44
(a) Central Government 1290.98 2578.92 1354.94
(i) Non-Financial 1193.93 2553.87 1234.17
(ii) Financial 97.05 22.05 120.77
(b) State Government 2750.31 4040.18 3400.50
(i) Non-Financial 2745.72 4039.85 3400.39
(ii) Financial 4.59 0.33 0.11
(A) Total Public Sector 8762.43 11611.74 10452.83
(39.3) (46.8) (36.8)
(B) Total Private Sector 13542.19 13216.90 17955.09
(60.7) (53.2) (63.2)
(C) Grand Total (A+B) 22304.62 24828.64 28407.92
(100.0) (100.0) (100.0)Source :—Department of Economic and Statistical Analysis, Haryana.
Note — Figures in brackets are percentages to total. P— Provisional R—Revised

220
Gross Fixed Capital Formation Estimates of Gross Fixed Capital Formation in Haryana by Type of Assets
(At Current Prices) No. 11.5 (Rs. in crore)
Assets 2004-05(R) 2005-06(R) 2006-07(R)
1 2 3 4
1. Buildings 5789.79 6877.29 7560.20
(39.9) (41.4) (37.3)
2. Roads and Bridges 522.67 449.95 384.59
(3.6) (2.7) (1.9)
3. Other Construction 2251.65 1693.18 4452.56
(15.5) (10.2) (22.0)
4. Plant and Machinery 5383.15 7136.46 7231.63
(37.1) (42.9) (35.7)
5. Transport Equipment 572.35 473.98 635.34
(3.9) (2.8) (3.1)
Total Gross Fixed 14519.61 16630.86 20264.32
Capital Formation (100.0) (100.0) (100.0)

221
Gross Fixed Capital Formation Estimates of Gross Fixed Capital Formation in Haryana by Type of Assets
(At Current Prices) No. 11.5 (Concld.) (Rs. in crore)
Assets 2007-08(R) 2008-09(P) 2009-10(P)
5 6 7
1. Buildings 9285.97 13414.71 12960.91
(35.1) (42.1) (34.2)
2. Roads and Bridges 496.04 829.27 1297.33
(1.9) (2.6) (3.4)
3. Other Construction 4489.08 4409.04 8605.91
(17.0) (13.8) (22.7)
4. Plant and Machinery 11451.68 12493.82 14265.49
(43.2) (39.2) (37.7)
5. Transport Equipment 740.65 735.10 740.45
(2.8) (2.3) (2.0)
Total Gross Fixed 26463.42 31881.94 37870.09
Capital Formation (100.0) (100.0) (100.00)
Source :—Department of Economic and Statistical Analysis, Haryana. Note — Figures in brackets are percentages to total. P— Provisional R—Revised

222
Gross Fixed Capital Formation Estimates of Gross Fixed Capital Formation in Haryana by Type of Assets
At Constant (2004-2005) Prices No. 11.6 (Rs. in crore)
Assets 2004-05(R) 2005-06(R) 2006-07(R) 2007-08(R) 2008-09(P) 2009-10(P) 1 2 3 4 5 6 7
Buildings 5789.79 6705.04 6819.89 7545.68 9822.73 8949.83
(39.9) (41.5) (37.0) (33.8) (39.6) (31.5)
Roads and Bridges 522.67 433.06 364.21 426.14 640.36 904.69
(3.6) (2.7) (2.0) (1.9) (2.6) (3.2)
Other Construction 2251.65 1639.75 4070.39 3660.51 3233.04 5949.36
(15.5) (10.2) (22.0) (16.4) (13.0) (21.0)
Plant and Machinery 5383.15 6888.89 6579.51 9981.51 10483.69 11970.08
(37.1) (42.7) (35.7) (44.8) (42.2) (42.1)
Transport Equipment 572.35 461.70 605.09 690.78 648.82 633.96
(3.9) (2.9) (3.3) (3.1) (2.6) (2.2)
Total Gross Fixed 14519.61 16128.44 18439.09 22304.62 24828.64 28407.92Capital Formation (100.0) (100.0) (100.0) (100.0) (100.0) (100.0)
Source :—Department of Economic and Statistical Analysis, Haryana. Note — Figures in brackets are percentages to total. P— Provisional R —Revised

223
SECTION XII AGRICULTURE
Agriculture statistics regarding classification of area and production of principal crops and yield per hectare of major crops for some years from 1966-67 to 2009-10 for the State as a whole and districtwise data only for the year 2009-10 have been presented in this section. It also contains information in respect of land revenue assessment, area under high yielding varieties, area under fruits and vegetables, consumption of fertilizers, agricultural machinery and implements including tractors and consolidation operations, etc. The information has been collected from Deputy Commissioners, Director of Land Records and Director of Agriculture, Haryana and the data relates to agricultural year (1st July to 30th June.)
Area according to Village papers—It is based on the returns of area prepared by village staff for revenue purposes in the districts.
Area under forests—This includes actually forested area on the lands classed or administered as forest under any legal enactment dealing with forests whether state owned or private. Besides, the forest area along roads, railways and canals have also been included. The area under forests given in this section will not tally with that of the Forest Department shown in section XV, owing to the fact that certain lands though not wooded are taken as forest by the Forest Department whereas these are not treated as such by the revenue authorities.
Land not available for cultivation—This includes absolutely barren and unculturable land like mountains, deserts, etc. which cannot be brought under plough except at exhorbitant cost, land covered by buildings, roads and railways and water or otherwise appropriated for non-agricultural purposes.
Other uncultivated land excluding fallow lands—This denotes land available for cultivation, either not taken up for cultivation or abandoned later on for one reason or the other and includes culturable waste, permanent pastures and other grazing lands and lands under miscellaneous trees, crops and groves.
Fallow land—It denotes cultivable land which after abandonment remains uncultivated over a long period called ‘old fallows’ and those kept uncultivated during the current year are called ’current fallows’.
Net area sown—It is the net area sown under crops, the areas sown more than once during the year being counted only once.
Total Cropped area—It includes total area covered with crops during the year. In case, different crops are raised on the same land during the year, the same area is counted more than once.
Table 12.1 gives classification of area of Haryana by land use.
Table 12.2 shows comparative position of various States in regard to area and its classification.
Table 12.3 shows sizewise number and area of operational holdings in Haryana.
Table 12.4 shows number and area of holdings by ownership and by size group in Haryana.
Table 12.5 shows Statewise number and area of operational holdings in India.
Table 12.6 shows area and production of foodgrains.
Table12.7 presents data regarding area, production and average yield of principal crops in the State. Production and yield figures are based on crop cutting experiments.
224
Table 12.8 shows area under high yielding varieties of foodgrains in Haryana.
Table 12.9 shows area under fruits and vegetables (districtwise).
Table 12.10 shows the percentage distribution of area and production of principal crops, districtwise.
Table 12.11 shows various index numbers related to agriculture in Haryana.
Table 12.12 presents index numbers of area under crops in Haryana.
Table 12.13 gives index of agricultural production in Haryana.
Tables 12.14 and 12.15 show comparative position of various States in regard to the area and production of principal crops.
Table 12.16 shows average yield of important crops in India.
Table 12.17 shows the consumption of fertilizers (Nutrients) in Haryana.
Table 12.18 shows consumption of pesticides in Haryana.
Table 12.19 shows the districtwise consumption of pesticides (Technical Grade).
Table 12.20 shows the number of agricultural machinery and implements according to Live-stock Census, 2007.
Table 12.21 gives information regarding number of tractors in Haryana.
Tables 12.22 and 12.23 show districtwise number of villages and area repartitioned in Haryana.

225
AGRICULTURE Classification of Area in Haryana State
No. 12.1 (Thousand hectares) Land not available for Cultivation
Year/District Total area according to village
papers
Forests Land put to non-agricultural uses
Barren and unculturable
land
Total (4+5)
1 2 3 4 5 6 1966-67 4,399 91 257 232 4891970-71 4,802 99 309 181 4901975-76 4,404 104 374 99 4731980-81 4,405 132 369 65 4341985-86 4,391 166 236 156 3921990-91 4,378 169 320 97 4171995-96 4,398 110 400 94 4942000-01 4,402 115 368 102 4702005-06 4372 44 424 95 5192008-09 4,371 39 470 103 5732009-10(P) 4,371 40 470 104 574Ambala 154 1 17 3 20Panchkula 57 2 18 3 21Yamunanagar 172 15 26 5 31Kurukshetra 168 1 15 1 16Kaithal 228 2 22 1 23Karnal 246 1 15 13 28Panipat 130 3 18 — 18Sonipat 213 1 44 8 52Rohtak 167 @ 4 4 8Jhajjar 191 — 6 4 10Faridabad 72 @ 32 2 34Palwal 136 1 13 5 18Gurgaon 120 3 31 @ 31Mewat 148 — 21 9 30Rewari 151 2 13 4 17Mahendragarh 194 2 22 13 35Bhiwani 466 2 27 21 48Jind 278 1 40 — 40Hisar 404 1 43 6 49Fatehabad 249 1 22 2 24Sirsa 427 1 21 @ 22@ Below 500 hectares. P— Figures are provisional.

226
AGRICULTURE Classification of Area in Haryana State
No. 12.1 (Contd.) (Thousand hectares) Other uncultivated land excluding Fallow Land
Year/District Permanent pastures and other grazing
lands
Land under misc. tree crops and groves not included in net area
sown
Culturable but barren land
Total (7+8+9)
1 7 8 9 10 1966-67 46 4 87 1371970-71 54 3 41 981975-76 44 @ 34 781980-81 30 @ 30 601985-86 28 1 23 521990-91 23 4 21 481995-96 24 4 23 512000-01 34 7 18 592005-06 25 12 31 682008-09 31 13 29 732009-10(P 28 13 29 70Ambala 1 @ @ 1Panchkula @ 6 2 8Yamunanagar 2 — @ 2Kurukshetra 1 @ @ 1Kaithal @ — — @Karnal 9 1 1 11Panipat 5 — 1 6Sonipat 2 5 1 8Rohtak 3 — 11 14Jhajjar — — 9 9Faridabad @ — — @Palwal 1 — — 1Gurgaon 1 @ — 1Mewat @ — — @Rewari 1 — 4 5Mahendragarh 1 — — 1Bhiwani — — — —Jind — @ — @Hisar — — — —Fatehabad — — — —Sirsa — — — —

227
AGRICULTURE Classification of Area in Haryana State
No. 12.1 (Concld.) (Thousand hectares) Fallow Land
Year/District Fallow lands other than
current fallows
Current fallows
Total (11+12)
Net area sown
Culturable are
(8+9+13+14)
Area sown more
than once
Total cropped area
(14+16)
1 11 12 13 14 15 16 17 1966-67 — 259 259 3,423 3,819 1,176 4,599 1970-71 — 150 150 3,565 3,813 1,392 4,957 1975-76 — 125 125 3,624 3,827 1,827 5,451 1980-81 — 177 177 3,602 3,839 1,860 5,462 1985-86 — 168 168 3,613 3,833 1,988 5,601 1990-91 @ 169 169 3,575 3,792 2,344 5,919 1995-96 @ 156 156 3,586 3,793 2,388 5,974 2000-01 @ 232 232 3,526 3,817 2,589 6,115 2005-06 6 169 175 3,566 3,809 2,943 6,509 2008-09 5 105 110 3,576 3,759 2,924 6,500 2009-10(P) 5 133 138 3,550 3,756 2,801 6,351 Ambala — @ @ 132 133 75 207 Panchkula — 2 2 24 34 15 39 Yamunanagar — @ @ 125 127 91 216 Kurukshetra @ @ @ 150 151 132 283 Kaithal — — — 202 202 178 380 Karnal — 9 9 197 217 192 389 Panipat @ 7 7 95 108 94 189 Sonipat — — — 153 161 144 297 Rohtak — 5 5 140 159 84 224 Jhajjar 4 5 9 163 181 68 232 Faridabad — 1 1 37 38 32 68 Palwal — 12 12 104 117 86 190 Gurgaon — @ @ 84 85 33 117 Mewat — 10 10 107 117 66 173 Rewari — 1 1 126 132 65 192 Mahendragarh — 5 5 151 157 117 268 Bhiwani — 45 45 371 416 343 714 Jind — — — 238 238 229 467 Hisar — 22 22 332 354 274 606 Fatehabad 1 — 1 224 225 191 415 Sirsa — 9 9 395 404 291 686
Source : Director of Land Records, Haryana. Note :—Totals may not tally due to rounding off the figures.
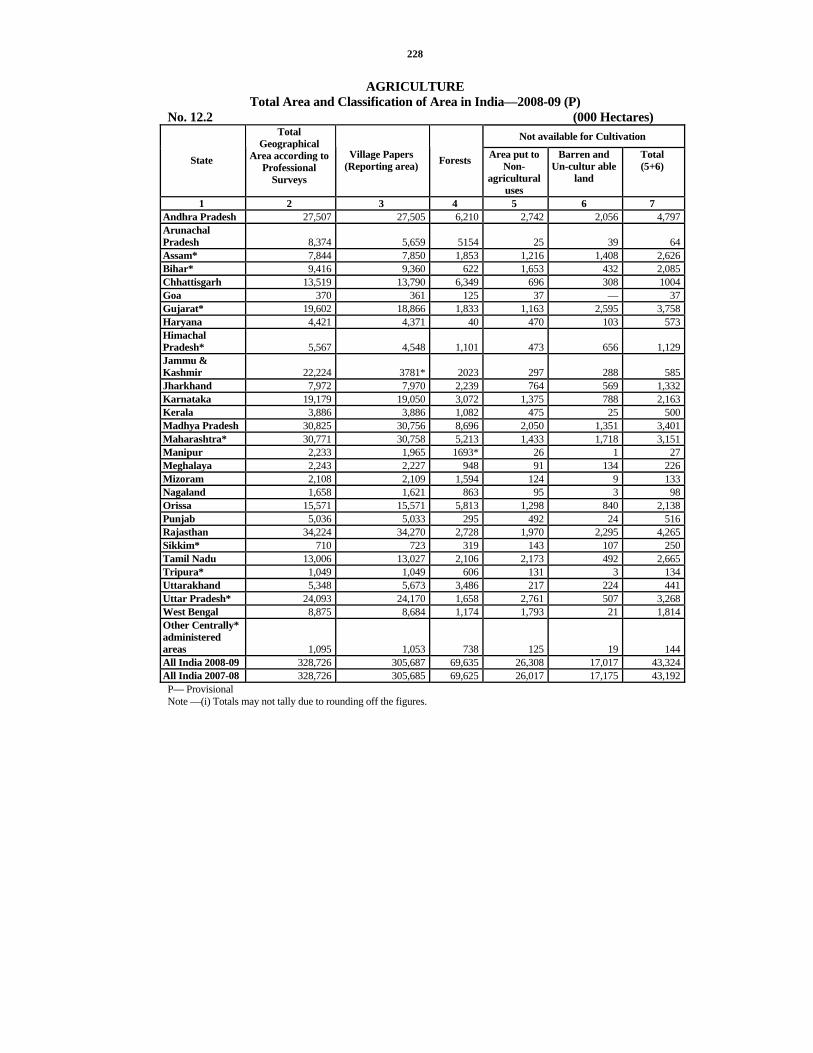
228
AGRICULTURE Total Area and Classification of Area in India—2008-09 (P)
No. 12.2 (000 Hectares) Not available for Cultivation
State
Total Geographical
Area according to Professional
Surveys
Village Papers (Reporting area) Forests Area put to
Non-agricultural
uses
Barren and Un-cultur able
land
Total (5+6)
1 2 3 4 5 6 7 Andhra Pradesh 27,507 27,505 6,210 2,742 2,056 4,797Arunachal Pradesh 8,374 5,659 5154 25 39 64Assam* 7,844 7,850 1,853 1,216 1,408 2,626Bihar* 9,416 9,360 622 1,653 432 2,085Chhattisgarh 13,519 13,790 6,349 696 308 1004Goa 370 361 125 37 — 37Gujarat* 19,602 18,866 1,833 1,163 2,595 3,758Haryana 4,421 4,371 40 470 103 573Himachal Pradesh* 5,567 4,548 1,101 473 656 1,129Jammu & Kashmir 22,224 3781* 2023 297 288 585Jharkhand 7,972 7,970 2,239 764 569 1,332Karnataka 19,179 19,050 3,072 1,375 788 2,163Kerala 3,886 3,886 1,082 475 25 500Madhya Pradesh 30,825 30,756 8,696 2,050 1,351 3,401Maharashtra* 30,771 30,758 5,213 1,433 1,718 3,151Manipur 2,233 1,965 1693* 26 1 27Meghalaya 2,243 2,227 948 91 134 226Mizoram 2,108 2,109 1,594 124 9 133Nagaland 1,658 1,621 863 95 3 98Orissa 15,571 15,571 5,813 1,298 840 2,138Punjab 5,036 5,033 295 492 24 516Rajasthan 34,224 34,270 2,728 1,970 2,295 4,265Sikkim* 710 723 319 143 107 250Tamil Nadu 13,006 13,027 2,106 2,173 492 2,665Tripura* 1,049 1,049 606 131 3 134Uttarakhand 5,348 5,673 3,486 217 224 441Uttar Pradesh* 24,093 24,170 1,658 2,761 507 3,268West Bengal 8,875 8,684 1,174 1,793 21 1,814Other Centrally* administered areas 1,095 1,053 738 125 19 144All India 2008-09 328,726 305,687 69,635 26,308 17,017 43,324All India 2007-08 328,726 305,685 69,625 26,017 17,175 43,192P— Provisional Note —(i) Totals may not tally due to rounding off the figures.

229
AGRICULTURE Total Area and Classification of Area in India—2008-09 (P)
No. 12.2 (Contd.) (000 Hectares) Other uncultivated land excluding Fallow land
State Permanent
pastures and other grazing
lands
Land under miscellaneous trees,
crops and groves
Culturable waste land
Total (8+9+10)
Fallow land Current fallows
1 8 9 10 11 12 13 Andhra Pradesh 569 299 650 1,517 1,488 2,624Arunachal Pradesh 19 37 65 120 70 40Assam* 160 196 77 432 59 126Bihar* 16 241 46 303 119 569Chhattisgarh 855 1 347 1,203 258 265Goa 1 1 53 54 9 9Gujarat* 853 4 1,976 2,832 19 623Haryana 30 12 29 72 5 105Himachal Pradesh* 1,496 65 138 1,699 15 64Jammu & Kashmir 128 67 150 346 23 65Jharkhand 110 93 336 539 962 1,394Karnataka 923 290 413 1,626 516 1,500Kerala — 6 96 102 46 68Madhya Pradesh 1,337 19 1,160 2,516 621 582Maharashtra* 1,246 248 917 2,412 1,187 1,370Manipur* 1 6 1 8 — —Meghalaya — 160 393 553 157 59Mizoram 5 46 5 56 171 60Nagaland — 121 60 181 89 73Orissa 494 342 375 1,211 229 576Punjab 7 5 3 15 — 37Rajasthan 1,699 18 4,336 6,052 2,108 1,565Sikkim* 4 5 2 12 30 5Tamil Nadu 110 259 333 702 1,498 1,013Tripura* — 27 1 28 1 1Uttarakhand 199 384 303 886 71 35Uttar Pradesh* 65 374 440 879 540 1,408West Bengal 7 55 32 94 22 287Other Centrally* administered areas 6 20 26 55 14 18All India 2008-09 10,343 3,402 12,762 26,507 10,316 14,541All India 2007-08 10,363 3,423 13,066 26,507 10,353 14,759

230
AGRICULTURE Total Area and Classification of Area in India—2008-09 (P)
No. 12.2 (Concld.) (000 Hectares)
State Fallow Land Total (12+13)
Net area Sown
Culturable area (Col.
9+10+14+15)
Area sown more than once
Total cropped area (15+17)
1 14 15 16 17 18 Andhra Pradesh 4,111 10,868 15,928 2,962 13,830 Arunachal Pradesh 110 211 422 65 276 Assam* 186 2,753 3,211 1,231 3,984 Bihar* 688 5,662 6,637 2,134 7,797 Chhattisgarh 523 4,710 5,581 973 5,683 Goa 9 135 197 31 166 Gujarat* 642 9,801 12,422 1,770 11,571 Haryana 111 3,576 3,728 2,908 6,484 Himachal Pradesh* 78 541 822 395 936 Jammu & Kashmir 88 739 1,044 398 1,137 Jharkhand 2,355 1,504 4,289 185 1,689 Karnataka 2,016 10,174 12,892 2,195 12,368 Kerala 114 2,089 2,305 606 2,695 Madhya Pradesh 1,202 14,941 17,322 5,716 20,657 Maharashtra* 2,556 17,426 21,148 4,682 22,108* Manipur* — 236 243 — 236 Meghalaya 215 284 1,053 53 337 Mizoram 231 95 377 — 95 Nagaland 163 316 659 86 402 Orissa 805 5,604 7,126 3,467 9,071 Punjab 37 4,169 4,215 3,743 7,912 Rajasthan 3,673 17,551 25,578 5,220 22,771 Sikkim* 35 107 150 10 118 Tamil Nadu 2,511 5,043 8,146 781 5,824 Tripura* 2 280 310 15 295 Uttarakhand 106 754 1,547 435 1,188 Uttar Pradesh* 1,948 16,417 19,179 9,123 25,540 West Bengal 309 5,294 5,689 4,507 9,802 Other Centrally administered areas* 32 85 165 46 131 All India 2008-09 24,857 141,364 182,385 53,739 195,104 All India 2007-08 25,112 140,904 182,505 54,252 195,156
Source : Economic and Statistical Adviser, Ministry of Agriculture, Govt. of India. P—Porvisional, (i) Totals may not tally due to rounding off the figures. * The figures are taken from latest forestry statistics publication, agriculture census are estimated based on latest available year data received from the states/UTs respectively.
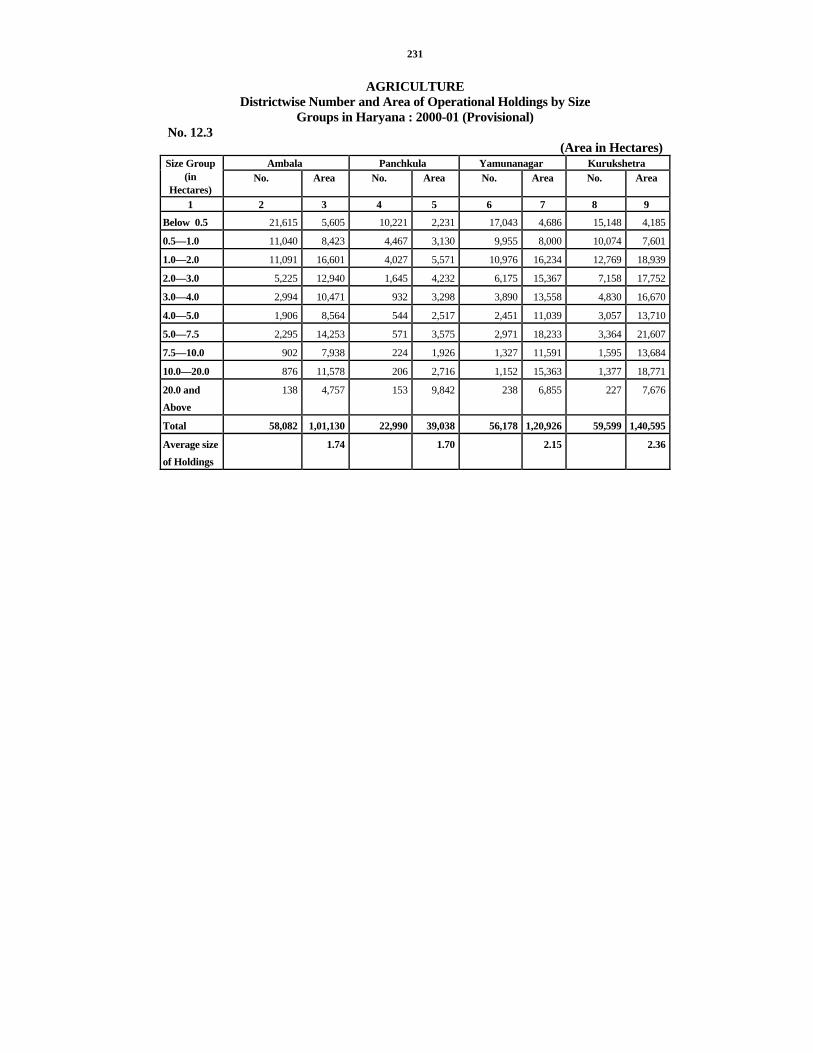
231
AGRICULTURE Districtwise Number and Area of Operational Holdings by Size
Groups in Haryana : 2000-01 (Provisional) No. 12.3
(Area in Hectares) Ambala Panchkula Yamunanagar Kurukshetra Size Group
(in Hectares)
No. Area No. Area No. Area No. Area
1 2 3 4 5 6 7 8 9
Below 0.5 21,615 5,605 10,221 2,231 17,043 4,686 15,148 4,185
0.5—1.0 11,040 8,423 4,467 3,130 9,955 8,000 10,074 7,601
1.0—2.0 11,091 16,601 4,027 5,571 10,976 16,234 12,769 18,939
2.0—3.0 5,225 12,940 1,645 4,232 6,175 15,367 7,158 17,752
3.0—4.0 2,994 10,471 932 3,298 3,890 13,558 4,830 16,670
4.0—5.0 1,906 8,564 544 2,517 2,451 11,039 3,057 13,710
5.0—7.5 2,295 14,253 571 3,575 2,971 18,233 3,364 21,607
7.5—10.0 902 7,938 224 1,926 1,327 11,591 1,595 13,684
10.0—20.0 876 11,578 206 2,716 1,152 15,363 1,377 18,771
20.0 and Above
138 4,757 153 9,842 238 6,855 227 7,676
Total 58,082 1,01,130 22,990 39,038 56,178 1,20,926 59,599 1,40,595
Average size of Holdings
1.74 1.70 2.15 2.36

232
AGRICULTURE Districtwise Number and Area of Operational Holdings by Size
Groups in Haryana : 2000-01 (Provisional) No. 12.3 (Contd.)
(Area in Hectares) Kaithal Karnal Panipat Sonipat Rohtak Size Group
(in Hectares) No. Area No. Area No. Area No. Area No. Area 1 10 11 12 13 14 15 16 17 18 19
Below 0.5 13,513 4,212 36,805 7,895 29,694 7,388 42,942 14,005 15,569 4,322
0.5—1.0 10,231 7,966 16,650 12,492 13,340 9,618 21,170 15,280 11,071 8,594
1.0—2.0 12,929 18,879 19,550 28,970 11,992 16,778 15,783 21,478 12,740 18,025
2.0—3.0 8,059 18,289 10,177 24,924 5,695 13,407 9,910 22,603 7,594 16,791
3.0—4.0 5,662 18,283 6,406 22,380 3,090 10,718 6,492 22,276 4,435 14,827
4.0—5.0 3,624 15,456 4,005 18,025 2,020 8,835 4,184 18,050 3,060 13,127
5.0—7.5 5,001 27,678 4,888 29,425 2,094 12,912 4,117 23,962 3,866 21,935
7.5—10.0 2,794 22,447 2,235 19,247 725 6,450 1,924 16,407 1,841 14,866
10.0—20.0 3,024 35,299 2,084 28,068 743 9,562 1,324 14,739 1,615 19,882
20.0 and Above 1,160 30,755 935 28,823 153 6,481 167 4,112 322 9,617
Total 65,997 1,99,264 1,03,735 2,20,249 69,546 1,02,149 1,08,013 1,72,912 62,113 1,41,986
Average size of Holdings
3.02 2.12 1.47 1.60 2.29

233
AGRICULTURE Districtwise Number and Area of Operational Holdings by Size
Groups in Haryana : 2000-01 (Provisional) No. 12.3 (Contd.)
(Area in Hectares) Jhajjar Faridabad Gurgaon Rewari Size Group
(in Hectares) No. Area No. Area No. Area No. Area 1 20 21 22 23 24 25 26 27
Below 0.5 19,894 4,495 36,349 9,467 35,595 9,129 17,866 4,339
0.5—1.0 10,511 8,217 19,697 14,341 22,102 17,436 10,991 8,173
1.0—2.0 11,210 16,652 18,862 27,243 22,324 30,637 11,650 16,331
2.0—3.0 6,014 15,120 8,917 22,429 10,575 25,415 6,116 14,319
3.0—4.0 3,947 14,562 5,239 18,284 5,724 19,627 4,212 13,667
4.0—5.0 2,669 12,112 3,096 13,944 3,531 16,027 2,612 11,006
5.0—7.5 2,961 17,810 3,468 20,850 4,333 `26,273 3,188 19,117
7.5—10.0 1,525 13,063 1,278 11,034 1,857 14,925 1,391 11,602
10.0—20.0 1,125 14,831 979 12,120 1,610 22,434 1,227 16,473
20.0 and Above
219 7,494 152 5,954 259 8,703 221 6,653
Total 60,075 1,24,356 98,037 1,55,666 1,07,910 1,90,606 59,474 1,21,680
Average size of Holdings
2.07 1.59 1.77 2.05

234
AGRICULTURE
Districtwise Number and Area of Operational Holdings by Size Groups in Haryana : 2000-01 (Provisional)
No. 12.3 (Contd.) (Area in Hectares)
Mahendragarh Bhiwani Jind Hisar Size Group (in Hectares) No. Area No. Area No. Area No. Area
1 28 29 30 31 32 33 34 35
Below 0.5 23,586 5,689 22,249 6,082 20,492 5,878 23,604 6,202
0.5—1.0 12,887 10,150 16,819 12,619 14,557 10,922 20,010 14,635
1.0—2.0 15,608 20,131 23,515 33,568 18,302 26,986 25,481 36,724
2.0—3.0 7,502 17,939 14,158 34,307 10,791 26,309 15,531 37,085
3.0—4.0 4,496 15,585 9,597 32,719 6,857 23,853 10,572 35,555
4.0—5.0 2,878 13,181 6,707 30,594 4,824 21,867 7,027 30,684
5.0—7.5 3,606 22,357 9,245 56,606 5,849 36,308 9,637 57,771
7.5—10.0 2,004 16,680 4,861 41,568 3,367 28,948 4,766 39,967
10.0—20.0 1,540 19,534 5,935 76,264 3,501 46,622 4,973 66,919
20.0 and Above 269 8,128 1,362 37,520 785 19,946 961 36,995
Total 74,376 1,49,374 1,14,448 3,61,847 89,325 2,47,639 1,22,562 3,62,537
Average size of Holdings
2.01 3.16 2.77 2.96

235
AGRICULTURE Districtwise Number and Area of Operational Holdings by Size
Groups in Haryana : 2000-01 (Provisional) No. 12.3 (Concld.)
(Area in Hectares) Sirsa Fatehabad Total Size Group (in Hectares)
No. Area No. Area No. Area 1 36 37 38 39 40 41
Below 0.5 19,990 5,506 15,921 4,516 4,38,096 1,15,832
0.5—1.0 17,569 13,232 12,776 9,882 2,65,917 2,00,711
1.0—2.0 16,820 25,171 18,473 26,940 2,94,102 4,21,858
2.0—3.0 15,935 38,699 11,265 27,029 1,68,442 4,04,956
3.0—4.0 12,500 42,581 7,604 27,085 1,09,479 3,75,999
4.0—5.0 8,798 38,715 4,970 22,308 71,963 3,19,761
5.0—7.5 10,386 64,368 5,930 36,511 87,770 5,31,551
7.5—10.0 4,991 43,562 2,623 22,788 42,230 3,58,693
10.0—20.0 4,937 70,328 2,141 28,523 40,369 5,30,026
20.0 and Above 1,323 40,635 362 9,550 9,406 2,90,496
Total 1,13,249 3,82,797 82,065 2,15,132 15,27,774 35,49,883
Average size of Holdings 3.38 2.62 2.32
Source : Agriculture Census, 2000-2001.

236
AGRICULTURE Number and Area of Holdings by Ownership and by Size
Group in Haryana : 2000-2001* (All Holdings) No. 12.4
(Area in Hectares) Individual Holdings Joint Holdings Institutional
Holdings Total Holdings Size Group (in Hectares)
No. Area No. Area No. Area No. Area 1 2 3 4 5 6 7 8 9
Below 0.5 1,93,808 48,886 2,41,618 66,234 2,670 712 4,38,096 1,15,832
0.5—1.0 1,10,155 82,865 1,54,182 1,16,633 1,580 1,213 2,65,917 2,00,711
1.0—2.0 1,14,820 1,66,822 1,77,488 2,52,362 1,794 2,674 2,94,102 4,21,858
2.0—3.0 60,116 1,45,828 1,07,124 2,56,118 1,202 3,010 1,68,442 4,04,956
3.0—4.0 36,645 1,26,408 72,015 2,46,690 819 2,901 1,09,479 3,75,999
4.0—5.0 21,626 96,588 49,638 2,19,999 699 3,174 71,963 3,19,761
5.0—7.5 20,932 1,26,647 65,764 3,98,209 1,074 6,695 87,770 5,31,551
7.5—10.0 6,804 58,778 34,518 2,92,066 908 7,849 42,230 3,58,693
10.0—20.0 3,656 47,177 34,885 4,55,722 1,828 27,127 40,369 5,30,026
20.0 and Above
460 13,378 7,406 1,99,170 1,540 77,948 9,406 2,90,496
Total 5,69,022 9,13,377 9,44,638 25,03,203 14,114 1,33,303 15,27,774 35,49,883
Source : Agriculture Census, 2000-01. * Provisional

237
AGRICULTURE Number and Area of Holdings by Ownership and by Size
Group in Haryana : 2000-2001* (Belonging to Scheduled Castes only) No. 12.4 (a)
(Area in Hectares) Individual Holdings Joint Holdings Institutional
Holdings Total Holdings Size Group (in Hectares)
No. Area No. Area No. Area No. Area 1 2 3 4 5 6 7 8 9
Below 0.5 5,010 1,255 3,112 968 — — 8,122 2,223
0.5—1.0 3,285 2,497 2,790 2,170 — — 6,075 4,667
1.0—2.0 3,400 5,042 2,833 4,186 — — 6,233 9,228
2.0—3.0 1,388 3,379 1,426 3,569 — — 2,814 6,948
3.0—4.0 658 2,278 822 2,909 — — 1,480 5,187
4.0—5.0 321 1,461 494 2,267 — — 815 3,728
5.0—7.5 227 1,394 457 2,779 — — 684 4,173
7.5—10.0 61 515 202 1,748 — — 263 2,263
10.0—20.0 20 239 203 2,589 — — 223 2,828
20.0 and Above 0 0 20 565 — — 20 565
Total 14,370 18,060 12,359 23,750 — — 26,729 41,810
Source : Agriculture Census, 2000-2001. * Provisional
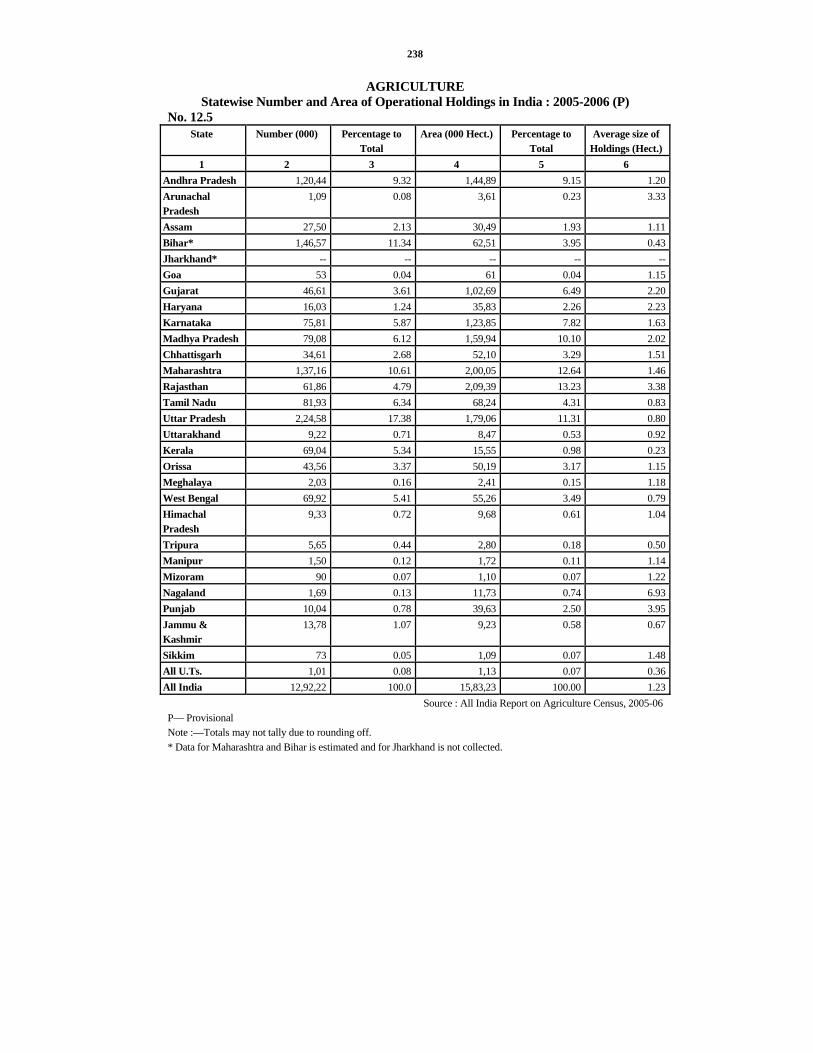
238
AGRICULTURE Statewise Number and Area of Operational Holdings in India : 2005-2006 (P)
No. 12.5 State Number (000) Percentage to
Total Area (000 Hect.) Percentage to
Total Average size of
Holdings (Hect.) 1 2 3 4 5 6
Andhra Pradesh 1,20,44 9.32 1,44,89 9.15 1.20Arunachal Pradesh
1,09 0.08 3,61 0.23 3.33
Assam 27,50 2.13 30,49 1.93 1.11Bihar* 1,46,57 11.34 62,51 3.95 0.43Jharkhand* -- -- -- -- --Goa 53 0.04 61 0.04 1.15Gujarat 46,61 3.61 1,02,69 6.49 2.20Haryana 16,03 1.24 35,83 2.26 2.23Karnataka 75,81 5.87 1,23,85 7.82 1.63Madhya Pradesh 79,08 6.12 1,59,94 10.10 2.02Chhattisgarh 34,61 2.68 52,10 3.29 1.51Maharashtra 1,37,16 10.61 2,00,05 12.64 1.46Rajasthan 61,86 4.79 2,09,39 13.23 3.38Tamil Nadu 81,93 6.34 68,24 4.31 0.83Uttar Pradesh 2,24,58 17.38 1,79,06 11.31 0.80Uttarakhand 9,22 0.71 8,47 0.53 0.92Kerala 69,04 5.34 15,55 0.98 0.23Orissa 43,56 3.37 50,19 3.17 1.15Meghalaya 2,03 0.16 2,41 0.15 1.18West Bengal 69,92 5.41 55,26 3.49 0.79Himachal Pradesh
9,33 0.72 9,68 0.61 1.04
Tripura 5,65 0.44 2,80 0.18 0.50Manipur 1,50 0.12 1,72 0.11 1.14Mizoram 90 0.07 1,10 0.07 1.22Nagaland 1,69 0.13 11,73 0.74 6.93Punjab 10,04 0.78 39,63 2.50 3.95Jammu & Kashmir
13,78 1.07 9,23 0.58 0.67
Sikkim 73 0.05 1,09 0.07 1.48All U.Ts. 1,01 0.08 1,13 0.07 0.36All India 12,92,22 100.0 15,83,23 100.00 1.23
Source : All India Report on Agriculture Census, 2005-06 P— Provisional Note :—Totals may not tally due to rounding off. * Data for Maharashtra and Bihar is estimated and for Jharkhand is not collected.
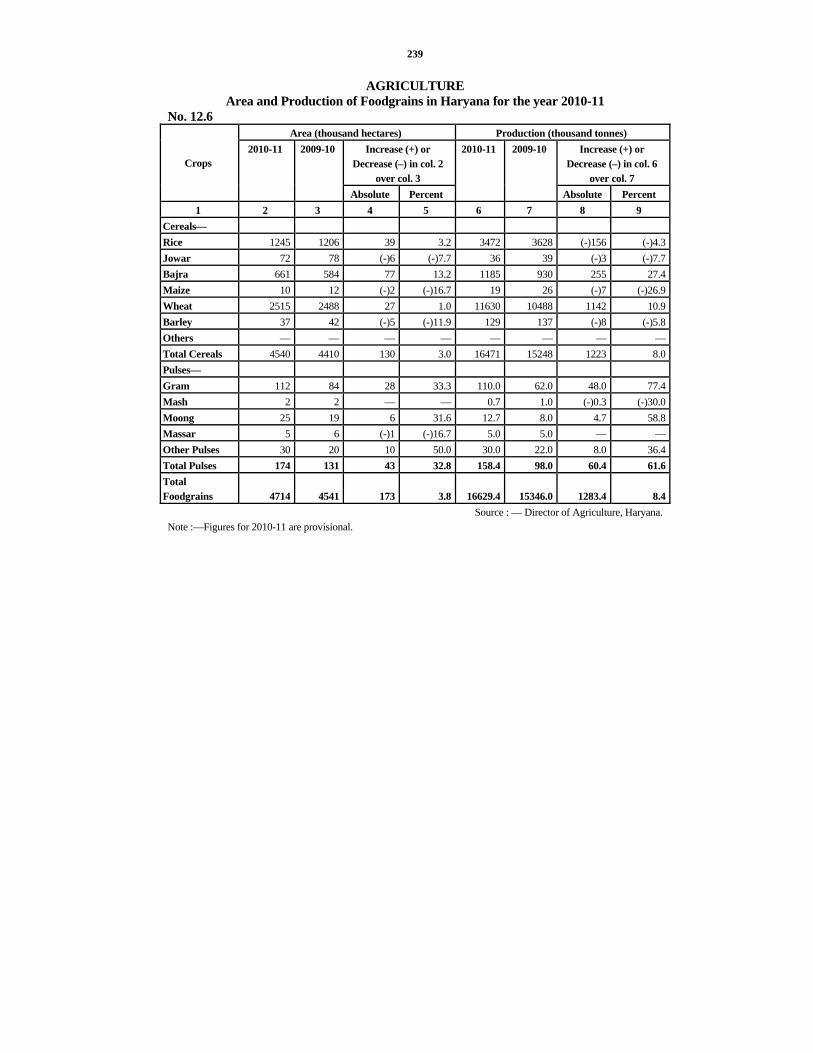
239
AGRICULTURE Area and Production of Foodgrains in Haryana for the year 2010-11
No. 12.6 Area (thousand hectares) Production (thousand tonnes)
Increase (+) or Decrease (–) in col. 2
over col. 3
Increase (+) or Decrease (–) in col. 6
over col. 7 Crops
2010-11 2009-10
Absolute Percent
2010-11 2009-10
Absolute Percent 1 2 3 4 5 6 7 8 9
Cereals— Rice 1245 1206 39 3.2 3472 3628 (-)156 (-)4.3Jowar 72 78 (-)6 (-)7.7 36 39 (-)3 (-)7.7Bajra 661 584 77 13.2 1185 930 255 27.4Maize 10 12 (-)2 (-)16.7 19 26 (-)7 (-)26.9Wheat 2515 2488 27 1.0 11630 10488 1142 10.9Barley 37 42 (-)5 (-)11.9 129 137 (-)8 (-)5.8Others — — — — — — — —Total Cereals 4540 4410 130 3.0 16471 15248 1223 8.0Pulses— Gram 112 84 28 33.3 110.0 62.0 48.0 77.4Mash 2 2 — — 0.7 1.0 (-)0.3 (-)30.0Moong 25 19 6 31.6 12.7 8.0 4.7 58.8Massar 5 6 (-)1 (-)16.7 5.0 5.0 — —Other Pulses 30 20 10 50.0 30.0 22.0 8.0 36.4Total Pulses 174 131 43 32.8 158.4 98.0 60.4 61.6Total Foodgrains 4714 4541 173 3.8 16629.4 15346.0 1283.4 8.4
Source : — Director of Agriculture, Haryana. Note :—Figures for 2010-11 are provisional.

240
AGRICULTURE Area, Production and Average Yield per hectare of Important Crops in Haryana (Area in 000 hectares, Production in 000 Tonnes and Yield in Kgs. per hectare)
No. 12.7 Foodgrains (Cereals)
Rice Jowar Year/District
A P Y A P Y 1 2 3 4 5 6 7
1966-67 192.0 223 1,161 270.0 49 1811970-71 269.2 460 1,697 207.3 57 2771975-76 303.5 625 2,063 162.7 35 2161980-81 483.9 1,259 2,606 136.9 48 3541985-86 584.0 1,633 2,797 115.6 28 2441990-91 661.2 1,834 2,775 129.4 65 4971995-96 830.0 1,847 2,225 126.1 26 2382000-01 1,054.3 2,695 2,557 109.4 23 2082005-06 1,046.6 3194 3,051 89.2 26 2722008-09 1,211.2 3,299 2,724 86.6 44 5002009-10* 1,206.4 3,628 3,008 77.7 39 500Ambala 82.3 306 3,727 — — —Panchkula 8.4 23 2,864 — — —Yamunanagar 73.5 267 3,607 — — —Kurukshetra 118.0 453 3,843 — — —Kaithal 158.3 462 2,925 — — —Karnal 171.5 521 3,029 — — —Panipat 77.0 205 2,657 — — —Sonipat 90.2 219 2,433 10.4 5 500Rohtak 35.1 50 1,415 21.0 10 500Jhajjar 26.0 47 1,804 18.7 9 500Faridabad 9.6 24 2,358 1.9 1 500Palwal 30.7 85 2,752 7.5 4 500Gurgaon 4.4 14 2,726 1.1 1 500Mewat 6.0 18 3,008 9.8 5 500Rewari 2.1 5 2,726 0.5 — —Mahendragarh — — — — — —Bhiwani 19.0 44 2,322 6.8 4 500Jind 108.3 296 2,745 — — —Hisar 43.2 94 2,189 — — —Fatehabad 81.4 291 3,587 — — —Sirsa 61.4 204 3,344 — — —

241
AGRICULTURE Area, Production and Average Yield per hectare of Important Crops in Haryana (Area in 000 hectares, Production in 000 Tonnes and Yield in Kgs. per hectare)
No. 12.7 (Contd.) Foodgrains (Cereals)
Bajra Maize Wheat Barley Year/District
A P Y A P Y A P Y A P Y 1 8 9 10 11 12 13 14 15 16 17 18 19
1966-67 893.0 373 418 87.0 86 988 743.0 1,059 1,425 182.0 239 1,3131970-71 879.6 826 939 114.4 130 1,142 1,129.3 2,342 2,074 108.6 124 1,1501975-76 1,005.6 608 605 138.7 171 1,230 1,226.0 2,428 1,980 177.1 221 1,2581980-81 870.3 474 544 71.3 81 1,134 1,479.0 3,490 2,360 124.5 181 1,4511985-86 649.5 315 487 54.9 64 1,252 1,701.3 5,260 3,094 87.7 160 1,8021990-91 608.6 526 864 34.8 49 1,414 1,850.1 6,436 3,479 50.5 107 2,0921995-96 575.2 409 711 26.0 48 1,827 1,972.1 7291 3,697 40.6 100 2,5072000-01 608.3 656 1,079 15.4 34 2,267 2,354.8 9,669 4,106 44.1 118 2,6822005-06 631.7 706 1,117 17.5 36 2,118 2,302.7 8,853 3,844 28.2 79 2,8212008-09 612.9 1,087 1,773 11.8 25 2,154 2,461.4 11,360 4,614 53.0 185 3,4912009-10* 583.8 930 1,592 12.2 26 2,167 2,487.7 10,488 4,215 42.1 137 3,262Ambala 0.4 — — 2.0 5 2,695 86.9 346 3,980 — — —Panchkula 0.7 2 1,593 6.2 13 2,144 15.7 38 2,394 — — —Yamunanagar 1.2 2 1,593 1.2 2 2,192 85.8 355 4,131 — — —Kurukshetra — — — 0.1 — — 114.2 526 4,610 — — —Kaithal 10.9 20 1,814 — — — 171.7 772 4,488 — — —Karnal 1.2 2 2,051 0.3 2 2,167 171.4 773 4,518 — — —Panipat 0.6 — — — — — 86.7 387 4,451 — — —Sonipat 12.5 27 2,231 1.2 2 2,167 141.4 610 4,323 0.2 — —Rohtak 20.0 31 1,567 1.0 2 2,167 103.7 422 4,058 1.4 3 2,964Jhajjar 31.0 61 1,984 0.1 — — 101.1 417 4,113 2.6 8 4,108Faridabad 3.7 6 1,421 — — 33.9 136 3,997 0.3 — 3,445Palwal 6.7 13 1,888 — — — 98.6 409 4,127 1.0 3 3,281Gurgaon 34.2 63 1,855 — — — 51.6 227 4,367 1.7 8 3,823Mewat 25.6 44 1,683 — — — 73.7 301 4,061 0.9 2 2,024Rewari 58.6 97 1,645 — — — 48.6 220 4,485 1.7 7 3,348Mahendragarh 103.0 183 1,779 — — — 40.7 159 3,873 0.7 2 2,182Bhiwani 172.1 181 1,055 0.1 — — 156.6 561 3,594 10.7 35 3,144Jind 44.9 79 1,757 — — — 215.2 934 4,344 0.9 3 2,956Hisar 45.7 92 1,997 — — — 225.2 931 4,139 7.0 22 3,090Fatehabad 7.8 21 2,590 — — — 185.8 842 4,526 3.7 14 3,462Sirsa 3.0 6 1,924 @ — — 279.2 1,122 4,022 9.3 30 3,369

242
AGRICULTURE Area, Production and Average Yield per hectare of Important Crops in Haryana (Area in 000 hectares, Production in 000 Tonnes and Yield in Kgs. per hectare)
No. 12.7 (Contd.) Foodgrains (Cereals)
Other Cereals Total Cereals Year/District A P Y A P Y
1 20 21 22 23 24 25 1966-67 3.0 @ . . 2,370.0 2,029 . .1970-71 0.4 @ . . 2,708.8 3,939 . .1975-76 3.7 @ . . 3,017.3 4,088 . .1980-81 1.8 @ . . 3,167.7 5,533 . .1985-86 4.1 — . . 3,197.1 7,460 . .1990-91 2.7 — . . 3,337.3 9,017 . .1995-96 0.7 — . . 3,570.7 9,721 . .2000-01 0.2 — . . 4,186.5 13,195 . .2005-06 0.2 — . . 4,116.1 12,894 . .2008-09 — — . . 4,436.9 16,000 . .2009-10* — — .. 4,410.0 15,248 . .Ambala — — .. 171.5 657 . .Panchkula — — .. 31.1 76 . .Yamunanagar — — .. 161.8 626 . .Kurukshetra — — .. 232.3 979 . .Kaithal — — .. 341.0 1,254 . .Karnal — — .. 344.6 1,298 . .Panipat — — .. 164.3 592 . .Sonipat — — .. 255.9 863 . .Rohtak — — .. 182.3 518 . .Jhajjar — — .. 179.3 542 . .Faridabad — — .. 49.2 167 . .Palwal — — .. 144.5 514 . .Gurgaon — — .. 93.1 313 . .Mewat — — .. 116.0 370 . .Rewari — — .. 111.5 329 . .Mahendragarh — — .. 144.4 344 . .Bhiwani — — .. 365.3 825 . .Jind — — .. 369.2 1,312 . .Hisar — — .. 321.2 1,139 . .Fatehabad — — .. 278.7 1,168 . .Sirsa — — .. 352.8 1,362 . .
AGRICULTURE

243
Area, Production and Average Yield per hectare of Important Crops in Haryana (Area in 000 hectares, Production in 000 Tonnes and Yield in Kgs. per hectare)
No. 12.7 (Contd.) (Foodgrains Pulses)
Gram Mash Moong Massar Year/District A P Y A P Y A P Y A P Y
1 26 27 28 29 30 31 32 33 34 35 36 37 1966-67 1,062.0 531.0 500 7.9 2.8 353 13.6 4.7 343 35.1 12.4 3551970-71 1,063.2 789.0 742 8.9 3.7 415 22.5 9.4 411 26.8 10.8 4031975-76 1,106.2 907.0 820 8.5 5.1 597 17.2 12.1 703 25.6 11.9 4631980-81 721.9 455.0 629 12.5 7.6 606 4.1 2.9 713 27.4 13.1 4781985-86 760.9 625.0 821 5.8 3.8 692 4.2 3.1 727 26.1 13.8 5291990-91 649.3 469.0 722 3.4 1.3 376 10.7 5.8 483 18.3 10.8 5871995-96 376.7 381.0 1,010 2.3 1.1 474 7.0 3.1 444 10.4 7.2 6922000-01 124.5 80.0 640 1.5 0.3 148 5.3 1.2 226 6.5 5.2 7982005-06 129.8 72.0 554 2.5 0.9 370 17.9 7.7 431 5.2 3.9 7412008-09 123.6 129.0 1,040 2.6 1.0 376 14.5 6.5 453 4.9 3.6 7282009-10* 84.1 62.0 735 3.0 1.1 371 14.9 6.6 400 4.7 3.6 761Ambala — — — 1.1 0.3 300 — — — 0.9 0.7 801Panchkula 0.4 — — 0.5 0.2 303 — — — 0.5 0.4 841Yamunanagar 0.1 — — 0.9 0.4 457 — — — 1.1 0.9 908Kurukshetra 0.1 — — 0.2 0.1 400 0.3 0.1 500 0.2 0.3 1,300Kaithal 0.1 — — — — — — — 500 0.1 0.2 1,300Karnal 0.1 — — 0.3 0.1 496 — — 450 0.3 0.3 1,021Panipat — — — — — 600 — — — — 0.1 1,100Sonipat — — — — — — 0.1 0.1 450 — — 1,100Rohtak 1.0 1.0 1,110 — — — — — 450 — — —Jhajjar 0.6 1.0 1,005 — — — — — 200 — — —Faridabad — — — — — — — — 550 — — —Palwal — — — — — 375 0.1 — 1000 — — 800Gurgaon — — — — — — — — 500 — — —Mewat 0.7 1.0 848 — — — — — 200 1.6 0.7 451Rewari 0.1 — — — — — — — 300 — — —Mahendragarh 3.3 2.0 412 — — — 0.2 0.1 524 — — —Bhiwani 58.1 42.0 729 — — — 2.6 1.1 425 — — —Jind 0.2 — — — — — — — 503 — — 1,200Hisar 10.6 7.0 613 — — 250 10.0 4.3 429 — — 1,300Fatehabad 0.7 1.0 1,296 — — — 0.7 0.4 400 — — —Sirsa 8.0 7.0 905 — — — 0.9 0.5 500 — — 800

244
AGRICULTURE Area, Production and Average Yield per hectare of Important Crops in Haryana (Area in 000 hectares, Production in 000 Tonnes and Yield in Kgs. per hectare)
No. 12.7 (Contd.) Foodgrains (Pulses)
Other Pulses Total Pulses Year/District
A P Y A P Y 1 38 39 40 41 42 43
1966-67 31.0 12.0 . . 1,150.0 563.0 . .1970-71 37.5 18.9 . . 1,158.9 832.0 . .1975-76 36.4 15.9 . . 1,193.9 952.0 . .1980-81 28.9 23.9 . . 794.8 502.5 . .1985-86 49.3 40.9 . . 846.3 686.6 . .1990-91 60.3 54.8 . . 742.0 541.7 . .1995-96 53.4 58.3 . . 449.8 450.7 . .2000-01 19.2 13.1 . . 157.0 99.8 . .2005-06 39.9 27.3 . . 195.3 111.8 . .2008-09 38.5 37.5 . . 184.1 177.6 . .2009-10* 24.9 24.0 . . 131.6 97.3 . .Ambala — — . . 2.0 1.0 . .Panchkula 0.3 0.2 . . 1.7 0.8 . .Yamunanagar 0.1 — . . 2.2 1.3 . .Kurukshetra 0.1 0.2 . . 0.9 0.7 . .Kaithal 0.3 0.3 . . 0.5 0.5 . .Karnal 0.5 0.4 . . 1.2 0.8 . .Panipat 0.6 0.6 . . 0.6 0.7 . .Sonipat 4.3 4.5 . . 4.4 4.6 . .Rohtak 5.9 6.8 . . 6.9 7.8 . .Jhajjar 4.7 5.2 . . 5.3 6.2 . .Faridabad 0.9 0.6 . . 0.9 0.6 . .Palwal 1.0 1.1 . . 1.1 1.1 . .Gurgaon 0.5 0.5 . . 0.5 0.5 . .Mewat — — . . 2.3 1.7 . .Rewari 0.5 0.4 . . 0.6 0.4 . .Mahendragarh 0.3 0.3 . . 3.8 2.4 . .Bhiwani 2.6 1.5 . . 63.3 44.6 . .Jind 1.1 1.1 . . 1.3 1.1 . .Hisar 0.6 0.2 . . 21.2 11.5 . .Fatehabad 0.3 0.1 . . 1.7 1.5 . .Sirsa 0.3 — . . 9.2 7.5 . .
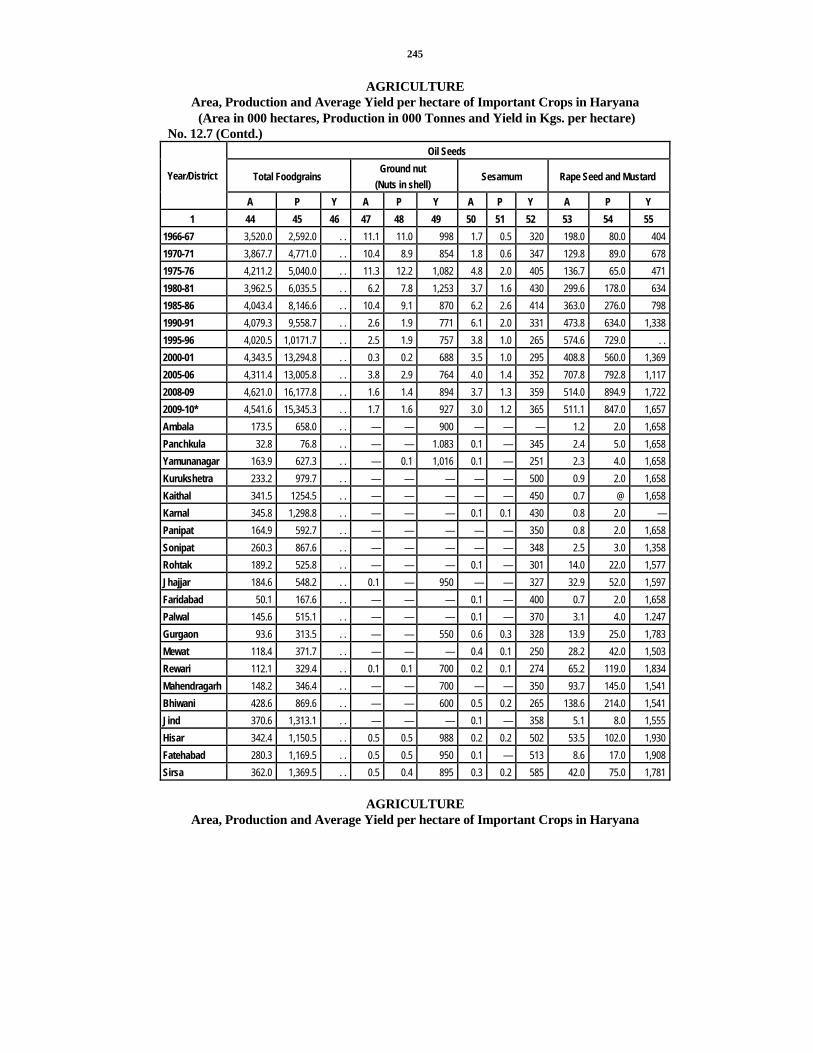
245
AGRICULTURE Area, Production and Average Yield per hectare of Important Crops in Haryana (Area in 000 hectares, Production in 000 Tonnes and Yield in Kgs. per hectare)
No. 12.7 (Contd.) Oil Seeds
Total Foodgrains Ground nut
(Nuts in shell) Sesamum Rape Seed and Mustard Year/District
A P Y A P Y A P Y A P Y 1 44 45 46 47 48 49 50 51 52 53 54 55
1966-67 3,520.0 2,592.0 . . 11.1 11.0 998 1.7 0.5 320 198.0 80.0 404 1970-71 3,867.7 4,771.0 . . 10.4 8.9 854 1.8 0.6 347 129.8 89.0 678 1975-76 4,211.2 5,040.0 . . 11.3 12.2 1,082 4.8 2.0 405 136.7 65.0 471 1980-81 3,962.5 6,035.5 . . 6.2 7.8 1,253 3.7 1.6 430 299.6 178.0 634 1985-86 4,043.4 8,146.6 . . 10.4 9.1 870 6.2 2.6 414 363.0 276.0 798 1990-91 4,079.3 9,558.7 . . 2.6 1.9 771 6.1 2.0 331 473.8 634.0 1,338 1995-96 4,020.5 1,0171.7 . . 2.5 1.9 757 3.8 1.0 265 574.6 729.0 . . 2000-01 4,343.5 13,294.8 . . 0.3 0.2 688 3.5 1.0 295 408.8 560.0 1,369 2005-06 4,311.4 13,005.8 . . 3.8 2.9 764 4.0 1.4 352 707.8 792.8 1,117 2008-09 4,621.0 16,177.8 . . 1.6 1.4 894 3.7 1.3 359 514.0 894.9 1,722 2009-10* 4,541.6 15,345.3 . . 1.7 1.6 927 3.0 1.2 365 511.1 847.0 1,657 Ambala 173.5 658.0 . . — — 900 — — — 1.2 2.0 1,658 Panchkula 32.8 76.8 . . — — 1.083 0.1 — 345 2.4 5.0 1,658 Yamunanagar 163.9 627.3 . . — 0.1 1,016 0.1 — 251 2.3 4.0 1,658 Kurukshetra 233.2 979.7 . . — — — — — 500 0.9 2.0 1,658 Kaithal 341.5 1254.5 . . — — — — — 450 0.7 @ 1,658 Karnal 345.8 1,298.8 . . — — — 0.1 0.1 430 0.8 2.0 — Panipat 164.9 592.7 . . — — — — — 350 0.8 2.0 1,658 Sonipat 260.3 867.6 . . — — — — — 348 2.5 3.0 1,358 Rohtak 189.2 525.8 . . — — — 0.1 — 301 14.0 22.0 1,577 Jhajjar 184.6 548.2 . . 0.1 — 950 — — 327 32.9 52.0 1,597 Faridabad 50.1 167.6 . . — — — 0.1 — 400 0.7 2.0 1,658 Palwal 145.6 515.1 . . — — — 0.1 — 370 3.1 4.0 1.247 Gurgaon 93.6 313.5 . . — — 550 0.6 0.3 328 13.9 25.0 1,783 Mewat 118.4 371.7 . . — — — 0.4 0.1 250 28.2 42.0 1,503 Rewari 112.1 329.4 . . 0.1 0.1 700 0.2 0.1 274 65.2 119.0 1,834 Mahendragarh 148.2 346.4 . . — — 700 — — 350 93.7 145.0 1,541 Bhiwani 428.6 869.6 . . — — 600 0.5 0.2 265 138.6 214.0 1,541 Jind 370.6 1,313.1 . . — — — 0.1 — 358 5.1 8.0 1,555 Hisar 342.4 1,150.5 . . 0.5 0.5 988 0.2 0.2 502 53.5 102.0 1,930 Fatehabad 280.3 1,169.5 . . 0.5 0.5 950 0.1 — 513 8.6 17.0 1,908 Sirsa 362.0 1,369.5 . . 0.5 0.4 895 0.3 0.2 585 42.0 75.0 1,781
AGRICULTURE
Area, Production and Average Yield per hectare of Important Crops in Haryana

246
(Area in 000 hectares, Production in 000 Tonnes and Yield in Kgs. per hectare) No. 12.7 (Contd.)
Oil Seeds Linseed Other Oilseeds Year/District
A P Y A P Y 1 56 57 58 59 60 61
1966-67 0.6 0.2 . . 0.6 0.3 . .1970-71 0.5 0.3 . . 0.1 . . . .1975-76 0.4 0.2 . . 0.3 . . . .1980-81 0.4 0.1 . . 1.3 . . . .1985-86 0.3 0.1 487 0.2 . . . .1990-91 0.1 0.1 808 5.9 . . . .1995-96 @ — — 30.5 51.2 . .2000-01 @ — — 1.4 1.6 . .2005-06 @ — — 20.2 25.0 . .2008-09 — — — 8.3 13.9 . .2009-10* — — — 7.2 12.2 . .Ambala 0.4 0.7 . .Panchkula — — — — — . .Yamunanagar 0.7 1.0 . .Kurukshetra — — — 5.1 9.4 . .Kaithal — — . .Karnal — — — — — . .Panipat — — . .Sonipat — — — — — . .Rohtak — — . .Jhajjar — — — — — . .Faridabad — — . .Palwal — — . .Gurgaon — — — — — . .Mewat — — . .Rewari — — — — — . .Mahendragarh — — . .Bhiwani — — — — — . .Jind — — . .Hisar — — — 0.1 0.1 . .Fatehabad 0.1 0.1 . .Sirsa — — — 0.8 0.9 . .

247
AGRICULTURE Area, Production and Average Yield per hectare of Important Crops in Haryana (Area in 000 hectares, Production in 000 Tonnes and Yield in Kgs. per hectare)
No. 12.7 (Contd.) Oil Seeds Cotton lint @@
Total Oilseeds American Desi Total Year/District
A P Y A P Y A P Y A P Y 1 62 63 64 65 66 67 68 69 70 71 72 73
1966-67 212.0 92.0 . . 81.0 134 300 102.0 153 289 183.0 287 . .1970-71 142.6 98.8 . . 88.6 188 359 104.8 185 299 193.4 373 . .1975-76 153.5 79.4 . . 108.3 214 340 146.7 251 290 255.0 465 . .1980-81 311.2 187.5 . . 211.6 480 387 104.6 163 264 316.2 643 . .1985-86 380.1 287.8 . . 262.3 622 402 81.8 123 255 344.1 745 3671990-91 488.5 638.0 . . 421.6 1042 421 69.0 113 278 490.6 1155 4001995-96 611.0 783.1 . . 490.3 986 342 161.5 298 313 651.8 1284 . .2000-01 414.0 562.8 . . 394.1 1081 466 161.3 302 319 555.4 1383 4242005-06 735.8 822.1 . . 478.3 1,267 479 105.5 235 380 583.8 1,502 4372008-09 527.6 911.5 . . 414.5 1,755 721 41.6 107 433 456.1 1,862 6942009-10* 523.0 862.0 . . 475.1 1,841 659 30.0 77 397 505.1 1,918 646Ambala 1.6 2.7 . . — — — @ — — @ — —Panchkula 2.5 5.0 . . — — — — — — @ — —Yamunanagar 3.1 5.1 . . — — — @ — — @ — —Kurukshetra 6.0 11.4 . . — — — — — — — — —Kaithal 0.7 — . . 2.3 9 725 1.2 3 510 3.5 12 674Karnal 0.9 2.1 . . — — — — — — — — —Panipat 0.8 2.0 . . — — — — — — — — —Sonipat 2.5 3.0 . . — — — 0.6 2 — 0.6 2 390Rohtak 14.1 22.0 . . 7.7 17 363 0.1 — 390 7.8 17 363Jhajjar 33.0 52.0 . . 0.9 3 530 — — — 0.9 3 530Faridabad 0.8 2.0 . . — — — — — — — — —Palwal 3.2 4.0 . . 0.3 — — — — — 0.3 @ —Gurgaon 14.6 25.3 . . — — — — — — — — —Mewat 28.6 42.1 . . — — — — — — — — —Rewari 65.4 119.2 . . 0.6 1 243 — — — 0.6 1 243Mahendragarh 93.8 145.0 . . 0.7 2 386 0.2 — — 0.9 2 386Bhiwani 139.1 214.2 . . 29.2 81 475 3.7 7 298 32.8 88 455Jind 5.2 8.0 . . 41.9 134 541 4.1 7 298 46.0 141 522Hisar 54.3 102.8 . . 127.8 463 615 5.0 14 476 132.8 477 610Fatehabad 9.3 17.6 . . 80.3 361 767 5.4 13 453 85.8 374 745Sirsa 43.5 76.5 . . 183.4 770 715 9.7 31 529 193.1 801 706@@ In thousand bales of 170 Kg. each.
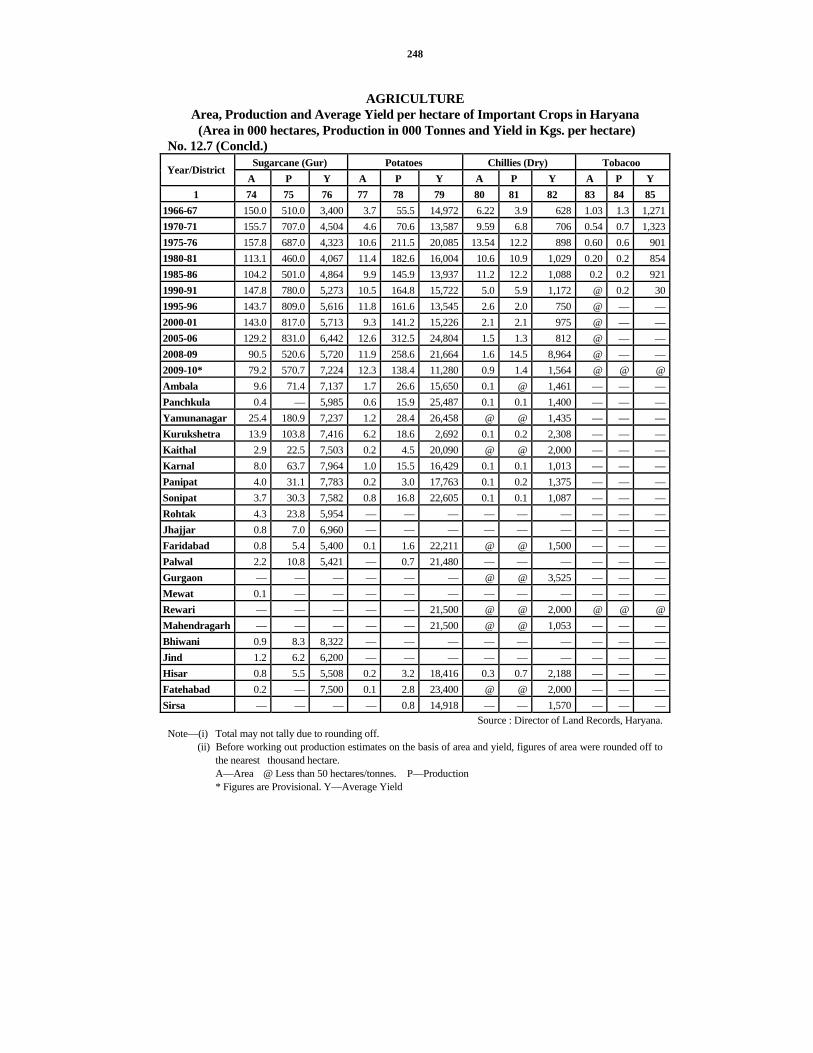
248
AGRICULTURE
Area, Production and Average Yield per hectare of Important Crops in Haryana (Area in 000 hectares, Production in 000 Tonnes and Yield in Kgs. per hectare)
No. 12.7 (Concld.) Sugarcane (Gur) Potatoes Chillies (Dry) Tobacoo
Year/District A P Y A P Y A P Y A P Y
1 74 75 76 77 78 79 80 81 82 83 84 85 1966-67 150.0 510.0 3,400 3.7 55.5 14,972 6.22 3.9 628 1.03 1.3 1,2711970-71 155.7 707.0 4,504 4.6 70.6 13,587 9.59 6.8 706 0.54 0.7 1,3231975-76 157.8 687.0 4,323 10.6 211.5 20,085 13.54 12.2 898 0.60 0.6 9011980-81 113.1 460.0 4,067 11.4 182.6 16,004 10.6 10.9 1,029 0.20 0.2 8541985-86 104.2 501.0 4,864 9.9 145.9 13,937 11.2 12.2 1,088 0.2 0.2 9211990-91 147.8 780.0 5,273 10.5 164.8 15,722 5.0 5.9 1,172 @ 0.2 301995-96 143.7 809.0 5,616 11.8 161.6 13,545 2.6 2.0 750 @ — —2000-01 143.0 817.0 5,713 9.3 141.2 15,226 2.1 2.1 975 @ — —2005-06 129.2 831.0 6,442 12.6 312.5 24,804 1.5 1.3 812 @ — —2008-09 90.5 520.6 5,720 11.9 258.6 21,664 1.6 14.5 8,964 @ — —2009-10* 79.2 570.7 7,224 12.3 138.4 11,280 0.9 1.4 1,564 @ @ @Ambala 9.6 71.4 7,137 1.7 26.6 15,650 0.1 @ 1,461 — — —Panchkula 0.4 — 5,985 0.6 15.9 25,487 0.1 0.1 1,400 — — —Yamunanagar 25.4 180.9 7,237 1.2 28.4 26,458 @ @ 1,435 — — —Kurukshetra 13.9 103.8 7,416 6.2 18.6 2,692 0.1 0.2 2,308 — — —Kaithal 2.9 22.5 7,503 0.2 4.5 20,090 @ @ 2,000 — — —Karnal 8.0 63.7 7,964 1.0 15.5 16,429 0.1 0.1 1,013 — — —Panipat 4.0 31.1 7,783 0.2 3.0 17,763 0.1 0.2 1,375 — — —Sonipat 3.7 30.3 7,582 0.8 16.8 22,605 0.1 0.1 1,087 — — —Rohtak 4.3 23.8 5,954 — — — — — — — — —Jhajjar 0.8 7.0 6,960 — — — — — — — — —Faridabad 0.8 5.4 5,400 0.1 1.6 22,211 @ @ 1,500 — — —Palwal 2.2 10.8 5,421 — 0.7 21,480 — — — — — —Gurgaon — — — — — — @ @ 3,525 — — —Mewat 0.1 — — — — — — — — — — —Rewari — — — — — 21,500 @ @ 2,000 @ @ @Mahendragarh — — — — — 21,500 @ @ 1,053 — — —Bhiwani 0.9 8.3 8,322 — — — — — — — — —Jind 1.2 6.2 6,200 — — — — — — — — —Hisar 0.8 5.5 5,508 0.2 3.2 18,416 0.3 0.7 2,188 — — —Fatehabad 0.2 — 7,500 0.1 2.8 23,400 @ @ 2,000 — — —Sirsa — — — — 0.8 14,918 — — 1,570 — — —
Source : Director of Land Records, Haryana. Note—(i) Total may not tally due to rounding off. (ii) Before working out production estimates on the basis of area and yield, figures of area were rounded off to
the nearest thousand hectare. A—Area @ Less than 50 hectares/tonnes. P—Production * Figures are Provisional. Y—Average Yield

LAND UTILISATION INHARYANA 2009-10
(Percent)
Net Area Sown (81.2%)
Fallow Land(3.2 %)
Other Uncultivated Land Excluding
Fallow Land(1.6%)
Land Not Available for Cultivation
(13.1%)
Forests(0.9%)

PRODUCTION OF FOODGRAINS IN HARYANA (In Lakh Tonnes)
2.234.60 6.25
16.33 18.34 18.4726.95 31.94
36.0632.99
36.28
10.59
23.42 24.28
52.60
64.3672.91
96.69
88.53
102.32
113.60
104.88
153.45161.78152.94
130.06132.95
101.7295.59
81.47
54.40
47.71
25.92
0
20
40
60
80
100
120
140
160
180
66-67 70-71 75-76 85-86 90-91 95-96 00-01 05-06 07-08 08-09 09-10
Rice Wheat Total Foodgrains

PRODUCTION OF SUGARCANE (GUR),OILSEEDS AND COTTON (LINT)
IN HARYANA(000 Tonnes/000 Bales of 170 Kg. Each)
571
862
521
885817809780
501460
707
510
831
638
912
617
822783
18892
563
99
288
1918
1383
288
745
373
643
1155
1284
1502
1882 1862
0
500
1000
1500
2000
2500
66-67 70-71 80-81 85-86 90-91 95-96 00-01 05-06 07-08 08-09 09-10
Sugarcane (Gur) Oilseeds Cotton Lint

249
AGRICULTURE
Area under High Yielding Varieties of Foodgrains in Haryana No. 12.8 (000 Hectares)
Rice Maize Bajra Wheat Year/District
Total HYV % Total HYV % Total HYV % Total HYV % 1 2 3 4 5 6 7 8 9 10 11 12 13
1966-67 192.0 — — 87.0 — — 893.0 — — 743.0 — —
1970-71 269.2 30 11.1 114.4 14 12.2 879.6 240 27.3 1,129.3 630 55.8
1975-76 303.5 169 55.7 138.7 17 12.3 1,005.6 250 24.9 1,226.0 1,087 88.7
1980-81 483.9 414 85.6 71.3 28 39.3 870.3 335 38.4 1,479.0 1,360 92.0
1985-86 584.0 495 84.8 54.9 20 36.4 649.5 410 63.1 1,701.3 1,612 94.8
1990-91 661.2 479 72.4 34.8 16 46.0 608.6 410 67.4 1,850.1 1,829 98.9
1995-96 830.0 498 60.0 26.0 12 46.2 575.2 329 57.2 1,972.1 1863 94.5
2000-01 1,054.3 656.7 62.3 15.4 8.0 51.9 608.3 516.0 84.8 2,354.8 2295.0 97.5
2005-06 1,046.6 785.0 75.0 17.5 8.0 45.7 631.7 544.9 86.3 2,302.7 2,289.9 99.4
2008-09 1,211.2 845.0 69.8 11.8 7.0 59.3 612.9 539.1 88.0 2,461.4 2,410.0 97.9
2009-10 (P) 1,206.0 805.0 66.7 12.0 8.0 66.7 584.0 570.0 97.6 2,488.0 2,450.0 98.5
Ambala 82.0 69.0 84.1 2.0 1.0 50.0 — — — 87.0 86.0 98.9
Panchkula 8.0 6.0 75.0 6.0 5.0 85.3 1.0 1.0 100.0 16.0 15.0 93.8
Yamunanagar 74.0 60.0 81.1 1.0 1.0 100.0 1.0 1.0 100.0 86.0 85.0 98.8
Kurukshetra 118.0 88.0 74.6 — — — — — — 114.0 113.0 99.1
Kaithal 158.0 136.0 86.1 — — — 11.0 10.0 90.9 172.0 170.0 98.8
Karnal 172.0 123.0 71.5 1.0 .05 50.0 1.0 1.0 100.0 171.0 169.0 98.8
Panipat 77.0 48.0 62.3 — — — — — — 87.0 86.0 98.9
Sonipat 90.0 54.0 60.0 1.0 .05 50.0 12.0 11.0 91.7 141.0 139.0 98.6
Rohtak 35.0 17.0 48.6 1.0 — — 20.0 19.0 95.0 104.0 103.0 99.0
Jhajjar 26.0 14.0 53.8 — — — 31.0 30.0 96.8 101.0 100.0 99.0
Faridabad 10.0 6.0 60.0 — — — 4.0 4.0 100.0 34.0 34.0 100.0
Palwal 31.0 13.0 41.9 — — — 7.0 7.0 100.0 99.0 98.0 99.0
Gurgaon 5.0 2.0 40.0 — — — 34.0 33.0 97.1 52.0 51.0 98.1
Mewat 6.0 4.0 66.7 — — — 26.0 26.0 100.0 74.0 73.0 98.6
Rewari 2.0 1.0 50.0 — — — 59.0 57.0 96.6 48.0 48.0 100.0
Mahendragarh — — — — — — 103.0 101.0 98.1 41.0 41.0 100.0
Bhiwani 19.0 9.0 47.4 — — — 172.0 169.0 — 156.0 153.0 98.1
Jind 108.0 68.0 63.0 — — — 45.0 44.0 97.8 215.0 210.0 97.7
Hisar 43.0 14.0 32.6 — — — 46.0 45.0 97.8 225.0 220.0 97.8
Fatehabad 81.0 46.0 56.8 — — — 8.0 8.0 100.0 186.0 181.0 97.3
Sirsa 61.0 27.0 44.3 — — — 3.0 3.0 100.0 279.0 275.0 98.6 (P) Provisional. Source : —Director of Agriculture, Haryana.

250
AGRICULTURE
Area under Fruits and Vegetables : 2009-10 No. 12.9 (Hectares)
District Apples Grapes Bananas Citrus Mangoes Peaches and
Pears Other fresh
fruits 1 2 3 4 5 6 7 8
Ambala — — — — — — 102Panchkula — — — — — — 9Yamunanagar — — — — 530 — 2Kurukshetra — — — — — — 541Kaithal — — — — — — 318Karnal — — — 249 335 — 48Panipat — — — — — — 666Sonipat — — — — — — 1,346Rohtak — — — — — — 562Jhajjar — — — — — — 260Faridabad — — — — 368 — —Palwal — — — — — — 438Gurgaon — — — — — — 17Mewat — — — — — — 142Rewari — — — — — — 93Mahendragarh — — — — — — 1Bhiwani — — — — — — 469Jind — — — — — — 877Hisar — 6 — 231 1 1 2,146Fatehabad — 19 — 32 — — 957Sirsa — 24 — 440 — — 4,106Total — 49 — 952 1,234 1 13,100

251
AGRICULTURE Area under Fruits and Vegetables : 2009-10
No. 12.9 (Concld.) (Hectares)
District Dry
fruits Potatoes
Sweet Potatoes
Onion Other
Vegetables Total fruits &
vegetables
Total condiments and spices
1 9 10 11 12 13 14 15 Ambala — 1,698 — 78 2,078 3,956 263Panchkula — 622 — 59 1,681 2,371 242Yamunanagar — 1,151 — 141 2,611 4,435 400Kurukshetra — 6,173 — 291 1,152 8,157 142Kaithal — 223 — 11 786 1,338 41Karnal — 941 — 1 2,948 4,522 459Panipat — 171 14 20 2,244 3,115 435Sonipat — 834 1 61 5,199 7,441 94Rohtak — — — 13 1,363 1,938 571Jhajjar — — — — 699 959 339Faridabad — 74 — — 2,799 3,241 —Palwal — 34 — — 574 1,046 —Gurgaon — — 39 2 3,360 3,418 39Mewat — — — 748 2,408 3,298 —Rewari — — — 92 671 856 11Mahendragarh — 3 5 16 526 551 583Bhiwani — — — — 1,351 1,820 2,569Jind — — — — 1,632 2,509 140Hisar — 173 — — 2,043 4,601 1,125Fatehabad — 119 — — 1,186 2,313 172Sirsa — 53 — 2 1,655 6,280 420Total — 12,269 59 1,535 38,966 68,165 8,045
Source : —Director of Land Records, Haryana.

252
AGRICULTURE Districtwise Percentage Distribution of Principal Crops in Haryana : 2009-10
No. 12.10 Net Area Irrigated
District Total Cultivable
Area (000 Hectares)
Net area sown Area
(000 Hectares)
Percentage to total Cultivable
Area Area
(000 Hectares) Percentage to Col. 3
1 2 3 4 5 6 Ambala 133 132 99.2 113 85.6Panchkula 34 24 70.6 17 70.8Yamunanagar 127 125 98.7 115 92.0Kurukshetra 151 150 99.3 150 100.0Kaithal 202 202 100.0 201 99.5Karnal 217 197 90.8 197 100.0Panipat 108 95 88.0 95 100.0Sonipat 161 153 95.0 152 99.3Rohtak 159 140 88.0 112 80.0Jhajjar 181 163 90.1 122 74.8Faridabad 38 37 97.4 36 97.3Palwal 117 104 88.9 94 90.4Gurgaon 85 84 98.8 72 85.7Mewat 117 107 91.5 68 63.6Rewari 132 126 95.5 109 86.5Mahendragarh 157 151 96.2 125 82.8Bhiwani 416 371 89.2 202 54.4Jind 238 238 100.0 231 97.1Hisar 354 332 93.0 267 80.4Fatehabad 225 224 99.6 221 98.7Sirsa 404 395 97.8 370 93.7Total 3,756 3,550 94.5 3,069 86.4

253
AGRICULTURE Districtwise Percentage Distribution of Principal Crops in Haryana : 2009-10
No. 12.10 (Contd.) Rice Jowar Bajra Maize
District Percentage
to Rice Area in State
Percentage to State
Production
Percentage to Jowar Area in State
Percentage to State
Production
Percentage to Bajra Area in State
Percentage to State
Production
Percentage to Maize Area in State
Percentage to State
Production
1 7 8 9 10 11 12 13 14 Ambala 6.8 8.4 — — 0.1 — 16.4 19.2 Panchkula 0.7 0.6 — — 0.1 0.2 50.8 50.0 Yamunanagar 6.1 7.4 — — 0.2 0.2 9.9 7.7 Kurukshetra 9.8 12.5 — — — — 0.8 — Kaithal 13.1 12.7 — — 1.9 2.2 — — Karnal 14.2 14.4 — — 0.2 0.2 2.5 7.7 Panipat 6.4 5.7 — — 0.1 — — — Sonipat 7.5 6.0 13.4 12.8 2.1 2.9 9.8 7.7 Rohtak 2.9 1.4 27.0 25.6 3.4 3.3 8.2 7.7 Jhajjar 2.1 1.3 24.1 23.1 5.3 6.6 0.8 — Faridabad 0.8 0.7 2.4 2.6 0.6 0.6 — — Palwal 2.5 2.3 9.7 10.2 1.2 1.4 — — Gurgaon 0.4 0.4 1.4 2.6 5.9 6.8 — — Mewat 0.5 0.5 12.6 12.8 4.4 4.7 — — Rewari 0.2 0.1 0.6 — 10.0 10.4 — — Mahendragarh — — — — 17.7 19.7 — — Bhiwani 1.6 1.2 8.8 10.3 29.5 19.5 0.8 — Jind 9.0 8.2 — — 7.7 8.5 — — Hisar 3.6 2.6 — — 7.8 9.9 — — Fatehabad 6.7 8.0 — — 1.3 2.3 — — Sirsa 5.1 5.6 — — 0.5 0.6 — — Total 100.0 100.0 100.0 100.0 100.0 100.0 100.0 100.0

254
AGRICULTURE Districtwise Percentage Distribution of Principal Crops in Haryana : 2009-10
No. 12.10 (Contd.) Wheat Barley
District Percentage to Wheat Area in
State Percentage
Percentage to State Production
Percentage to Barley Area in
State
Percentage to State Production
1 15 16 17 18 Ambala 3.5 3.3 — —Panchkula 0.6 0.4 — —Yamunanagar 3.4 3.4 — —Kurukshetra 4.6 5.0 — —Kaithal 6.9 7.4 — —Karnal 6.9 7.4 — —Panipat 3.5 3.7 — —Sonipat 5.7 5.8 0.5 —Rohtak 4.2 4.0 3.3 2.2Jhajjar 4.1 4.0 6.2 5.8Faridabad 1.4 1.3 0.7 —Palwal 4.0 3.9 2.4 2.2Gurgaon 2.1 2.1 4.0 5.8Mewat 3.0 2.9 2.1 1.5Rewari 1.9 2.1 4.0 5.1Mahendragarh 1.6 1.5 1.7 1.5Bhiwani 6.3 5.3 25.5 25.5Jind 8.6 8.9 2.1 2.2Hisar 9.0 8.9 16.6 16.1Fatehabad 7.5 8.0 8.8 10.2Sirsa 11.2 10.7 22.1 21.9Total 100.0 100.0 100.0 100.0
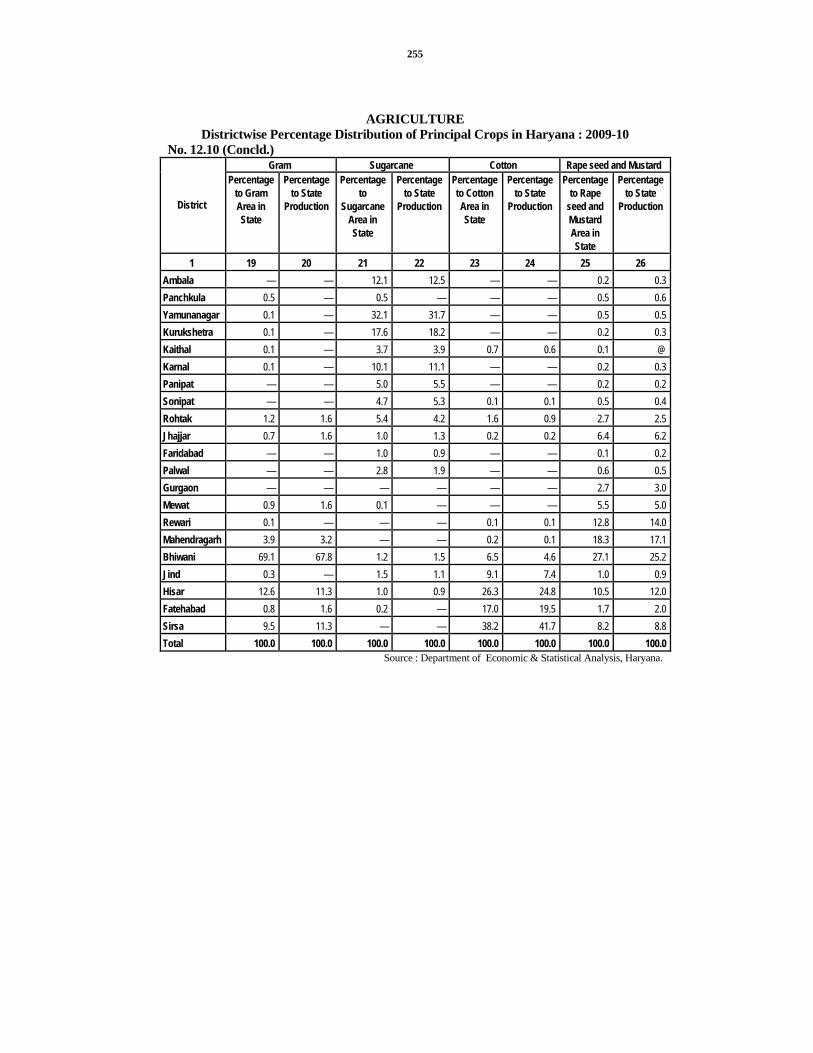
255
AGRICULTURE Districtwise Percentage Distribution of Principal Crops in Haryana : 2009-10
No. 12.10 (Concld.) Gram Sugarcane Cotton Rape seed and Mustard
District
Percentage to Gram Area in State
Percentage to State
Production
Percentage to
Sugarcane Area in State
Percentage to State
Production
Percentage to Cotton Area in State
Percentage to State
Production
Percentage to Rape
seed and Mustard Area in State
Percentage to State
Production
1 19 20 21 22 23 24 25 26 Ambala — — 12.1 12.5 — — 0.2 0.3 Panchkula 0.5 — 0.5 — — — 0.5 0.6 Yamunanagar 0.1 — 32.1 31.7 — — 0.5 0.5 Kurukshetra 0.1 — 17.6 18.2 — — 0.2 0.3 Kaithal 0.1 — 3.7 3.9 0.7 0.6 0.1 @ Karnal 0.1 — 10.1 11.1 — — 0.2 0.3 Panipat — — 5.0 5.5 — — 0.2 0.2 Sonipat — — 4.7 5.3 0.1 0.1 0.5 0.4 Rohtak 1.2 1.6 5.4 4.2 1.6 0.9 2.7 2.5 Jhajjar 0.7 1.6 1.0 1.3 0.2 0.2 6.4 6.2 Faridabad — — 1.0 0.9 — — 0.1 0.2 Palwal — — 2.8 1.9 — — 0.6 0.5 Gurgaon — — — — — — 2.7 3.0 Mewat 0.9 1.6 0.1 — — — 5.5 5.0 Rewari 0.1 — — — 0.1 0.1 12.8 14.0 Mahendragarh 3.9 3.2 — — 0.2 0.1 18.3 17.1 Bhiwani 69.1 67.8 1.2 1.5 6.5 4.6 27.1 25.2 Jind 0.3 — 1.5 1.1 9.1 7.4 1.0 0.9 Hisar 12.6 11.3 1.0 0.9 26.3 24.8 10.5 12.0 Fatehabad 0.8 1.6 0.2 — 17.0 19.5 1.7 2.0 Sirsa 9.5 11.3 — — 38.2 41.7 8.2 8.8 Total 100.0 100.0 100.0 100.0 100.0 100.0 100.0 100.0
Source : Department of Economic & Statistical Analysis, Haryana.

256
AGRICULTURE Various Index Numbers relating to Agriculture in Haryana
No.12.11 (Base : Triennium ending 1981-82=100)
Year
Index of Area under crops
Index of net area
sown
Index of cropping intensity
Index of cropping pattern
Index of yield
Index of productivity per hectare of net area
sown
Index of Agricultural production
1 2 3 4 5 6 7 8
1969-70 92.79 98.37 93.35 96.68 101.92 92.95 91.43
1975-76 101.98 100.49 100.83 97.40 100.49 99.33 99.82
1980-81 100.51 99.88 101.66 101.31 104.46 106.50 106.37
1985-86 103.36 100.19 103.93 103.13 132.75 141.23 141.50
1990-91 110.07 99.13 111.00 107.76 152.70 182.71 181.12
1995-96 114.45 99.44 111.68 116.57 146.17 196.11 195.01
2000-01 116.32 97.78 127.40 118.54 161.53 227.79 222.73
2004-05 120.57 97.88 133.77 100.00 201.55 248.27 243.01
2005-06 122.07 98.93 134.08 100.00 187.94 231.90 229.42
2006-07 119.61 98.65 132.35 100.00 216.91 263.00 259.45
2007-08 119.12 99.70 132.00 100.00 214.49 256.27 255.50
2008-09 121.02 99.20 133.53 100.00 221.10 269.74 267.58
2009-10(P) 120.25 98.48 131.42 100.00 212.42 259.37 255.43Source : Department of Economic & Statistical Analysis, Haryana.
(P) Provisional.

INDEX OF AGRICULTURAL PRODUCTIONIN HARYANA
(BASE TRIENNIUM ENDING 1981-82=100)
255.43267.58
229.42222.73
106.3799.82
86.8891.43
141.50
181.12
195.01
0
50
100
150
200
250
300
69-70 70-71 75-76 80-81 85-86 90-91 95-96 00-01 05-06 08-09 09-10
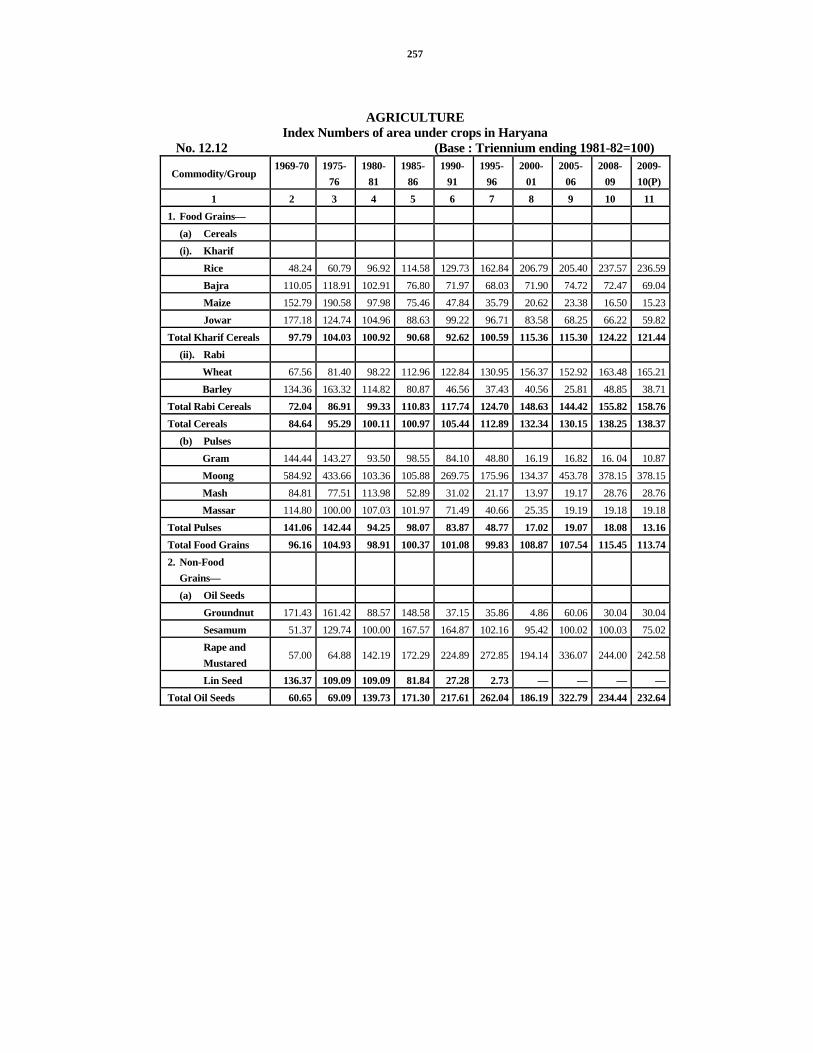
257
AGRICULTURE Index Numbers of area under crops in Haryana
No. 12.12 (Base : Triennium ending 1981-82=100)
Commodity/Group 1969-70 1975-
76 1980-
81 1985-
86 1990-
91 1995-
96 2000-
01 2005-
06 2008-
09 2009-10(P)
1 2 3 4 5 6 7 8 9 10 11 1. Food Grains—
(a) Cereals (i). Kharif
Rice 48.24 60.79 96.92 114.58 129.73 162.84 206.79 205.40 237.57 236.59Bajra 110.05 118.91 102.91 76.80 71.97 68.03 71.90 74.72 72.47 69.04Maize 152.79 190.58 97.98 75.46 47.84 35.79 20.62 23.38 16.50 15.23Jowar 177.18 124.74 104.96 88.63 99.22 96.71 83.58 68.25 66.22 59.82
Total Kharif Cereals 97.79 104.03 100.92 90.68 92.62 100.59 115.36 115.30 124.22 121.44(ii). Rabi
Wheat 67.56 81.40 98.22 112.96 122.84 130.95 156.37 152.92 163.48 165.21Barley 134.36 163.32 114.82 80.87 46.56 37.43 40.56 25.81 48.85 38.71
Total Rabi Cereals 72.04 86.91 99.33 110.83 117.74 124.70 148.63 144.42 155.82 158.76Total Cereals 84.64 95.29 100.11 100.97 105.44 112.89 132.34 130.15 138.25 138.37
(b) Pulses Gram 144.44 143.27 93.50 98.55 84.10 48.80 16.19 16.82 16. 04 10.87Moong 584.92 433.66 103.36 105.88 269.75 175.96 134.37 453.78 378.15 378.15Mash 84.81 77.51 113.98 52.89 31.02 21.17 13.97 19.17 28.76 28.76Massar 114.80 100.00 107.03 101.97 71.49 40.66 25.35 19.19 19.18 19.18
Total Pulses 141.06 142.44 94.25 98.07 83.87 48.77 17.02 19.07 18.08 13.16Total Food Grains 96.16 104.93 98.91 100.37 101.08 99.83 108.87 107.54 115.45 113.742. Non-Food
Grains—
(a) Oil Seeds Groundnut 171.43 161.42 88.57 148.58 37.15 35.86 4.86 60.06 30.04 30.04Sesamum 51.37 129.74 100.00 167.57 164.87 102.16 95.42 100.02 100.03 75.02Rape and Mustared
57.00 64.88 142.19 172.29 224.89 272.85 194.14 336.07 244.00 242.58
Lin Seed 136.37 109.09 109.09 81.84 27.28 2.73 — — — —Total Oil Seeds 60.65 69.09 139.73 171.30 217.61 262.04 186.19 322.79 234.44 232.64
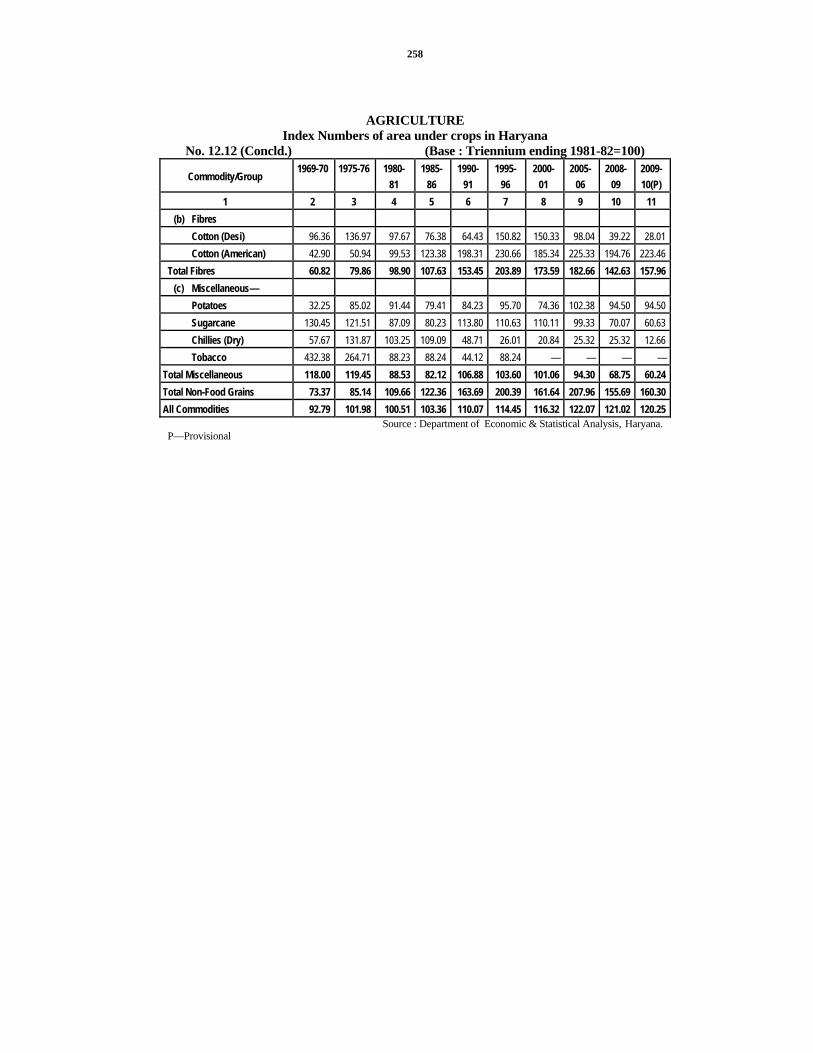
258
AGRICULTURE Index Numbers of area under crops in Haryana
No. 12.12 (Concld.) (Base : Triennium ending 1981-82=100)
Commodity/Group 1969-70 1975-76 1980-
81 1985-
86 1990-
91 1995-
96 2000-
01 2005-
06 2008-
09 2009-10(P)
1 2 3 4 5 6 7 8 9 10 11 (b) Fibres
Cotton (Desi) 96.36 136.97 97.67 76.38 64.43 150.82 150.33 98.04 39.22 28.01 Cotton (American) 42.90 50.94 99.53 123.38 198.31 230.66 185.34 225.33 194.76 223.46
Total Fibres 60.82 79.86 98.90 107.63 153.45 203.89 173.59 182.66 142.63 157.96 (c) Miscellaneous—
Potatoes 32.25 85.02 91.44 79.41 84.23 95.70 74.36 102.38 94.50 94.50 Sugarcane 130.45 121.51 87.09 80.23 113.80 110.63 110.11 99.33 70.07 60.63 Chillies (Dry) 57.67 131.87 103.25 109.09 48.71 26.01 20.84 25.32 25.32 12.66 Tobacco 432.38 264.71 88.23 88.24 44.12 88.24 — — — —
Total Miscellaneous 118.00 119.45 88.53 82.12 106.88 103.60 101.06 94.30 68.75 60.24 Total Non-Food Grains 73.37 85.14 109.66 122.36 163.69 200.39 161.64 207.96 155.69 160.30 All Commodities 92.79 101.98 100.51 103.36 110.07 114.45 116.32 122.07 121.02 120.25
Source : Department of Economic & Statistical Analysis, Haryana. P—Provisional

259
AGRICULTURE
Index of Agricultural Production in Haryana No. 12.13 (Base : Triennium ending 1981-82 = 100)
Commodity/Group Weight 1969-70
1975-76
1980-81
1985-86
1990-91
1995-96
2000-01
2005-06
2008-09
2009-10(P)
1 2 3 4 5 6 7 8 9 10 11 12 1. Food Grains—
(a) Cereals Kharif Rice 11.48 32.32 54.31 109.41 141.91 159.37 160.51 234.20 277.55 286.67 315.26 Bajra 4.72 123.56 146.15 113.94 75.72 127.00 98.75 158.39 170.45 262.43 224.53 Maize 0.81 202.48 252.73 119.70 94.58 72.41 70.92 50.24 53.19 36.94 38.42 Jowar 0.37 150.00 97.23 133.33 77.79 180.56 72.22 63.25 71.50 121.00 107.25
Total Kharif Cereals 17.38 67.53 89.41 111.63 120.36 146.98 137.68 201.40 233.62 264.83 274.82 (i). Rabi
Wheat 42.51 61.50 69.56 99.99 150.71 184.40 208.89 277.01 253.63 325.45 300.47 Barley 1.46 128.88 153.12 125.40 110.85 74.13 69.28 81.76 54.74 128.17 94.92
Total Rabi Cereals 43.97 63.74 72.33 100.83 149.39 180.74 204.25 270.53 247.03 319.14 293.71 Total Cereals 61.35 64.81 77.17 103.89 141.17 171.18 185.39 250.94 243.23 301.84 287.65
(b) Pulses Gram 9.79 331.64 252.42 126.62 173.92 130.48 106.00 22.26 20.03 35.88 17.24 Moong 0.09 335.30 427.04 102.35 109.41 204.70 109.41 43.40 294.16 257.39 257.39 Mash 0.20 56.15 75.37 112.31 56.16 19.20 16.24 3.40 10.34 10.34 10.34 Massar 0.29 101.71 95.71 105.36 111.00 86.87 57.93 41.17 29.77 29.77 29.77
Total Pulses 10.37 319.93 246.14 125.54 169.33 127.76 102.95 22.61 22.49 37.74 19.81 Total Food Grains 71.72 101.70 101.60 107.02 145.24 164.90 173.47 217.93 211.31 262.10 248.00 2. Non-Food Grains—
(a) Oil Seeds Groundnut 0.22 126.33 160.54 102.63 119.73 25.00 25.00 2.63 29.63 9.88 19.76 Sesamum 0.07 52.17 130.44 104.35 169.58 130.46 65.23 52.83 63.39 63.39 63.39 Rape and Mustard
4.57 60.66 50.61 138.59 214.91 493.70 567.67 436.07 615.94 696.14 659.54
Linseed 0.01 225.00 150.00 75.00 75.00 75.00 97.50 — — — — Total Oil Seeds 4.87 63.84 56.93 136.34 209.67 466.45 534.97 410.09 580.25 654.56 620.96
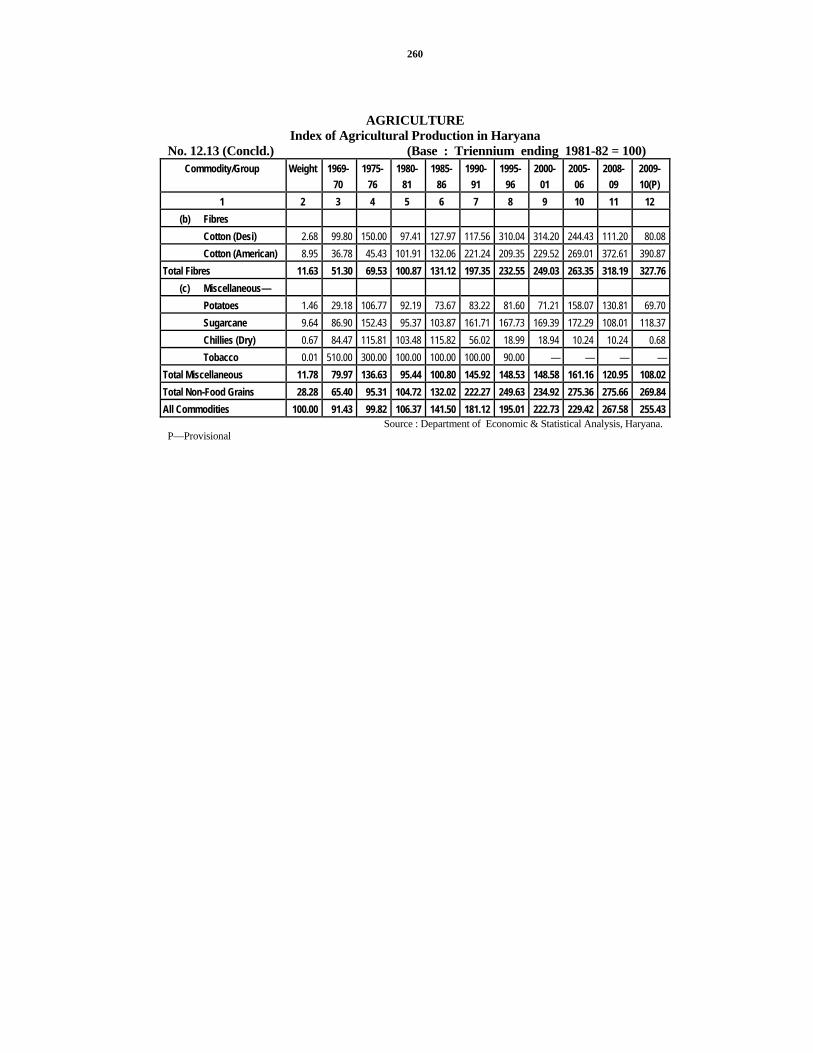
260
AGRICULTURE Index of Agricultural Production in Haryana
No. 12.13 (Concld.) (Base : Triennium ending 1981-82 = 100) Commodity/Group Weight 1969-
70 1975-
76 1980-
81 1985-
86 1990-
91 1995-
96 2000-
01 2005-
06 2008-
09 2009-10(P)
1 2 3 4 5 6 7 8 9 10 11 12 (b) Fibres
Cotton (Desi) 2.68 99.80 150.00 97.41 127.97 117.56 310.04 314.20 244.43 111.20 80.08 Cotton (American) 8.95 36.78 45.43 101.91 132.06 221.24 209.35 229.52 269.01 372.61 390.87
Total Fibres 11.63 51.30 69.53 100.87 131.12 197.35 232.55 249.03 263.35 318.19 327.76 (c) Miscellaneous—
Potatoes 1.46 29.18 106.77 92.19 73.67 83.22 81.60 71.21 158.07 130.81 69.70 Sugarcane 9.64 86.90 152.43 95.37 103.87 161.71 167.73 169.39 172.29 108.01 118.37 Chillies (Dry) 0.67 84.47 115.81 103.48 115.82 56.02 18.99 18.94 10.24 10.24 0.68 Tobacco 0.01 510.00 300.00 100.00 100.00 100.00 90.00 — — — —
Total Miscellaneous 11.78 79.97 136.63 95.44 100.80 145.92 148.53 148.58 161.16 120.95 108.02 Total Non-Food Grains 28.28 65.40 95.31 104.72 132.02 222.27 249.63 234.92 275.36 275.66 269.84 All Commodities 100.00 91.43 99.82 106.37 141.50 181.12 195.01 222.73 229.42 267.58 255.43
Source : Department of Economic & Statistical Analysis, Haryana. P—Provisional

261
AREA UNDER PRINCIPAL CROPS IN INDIA
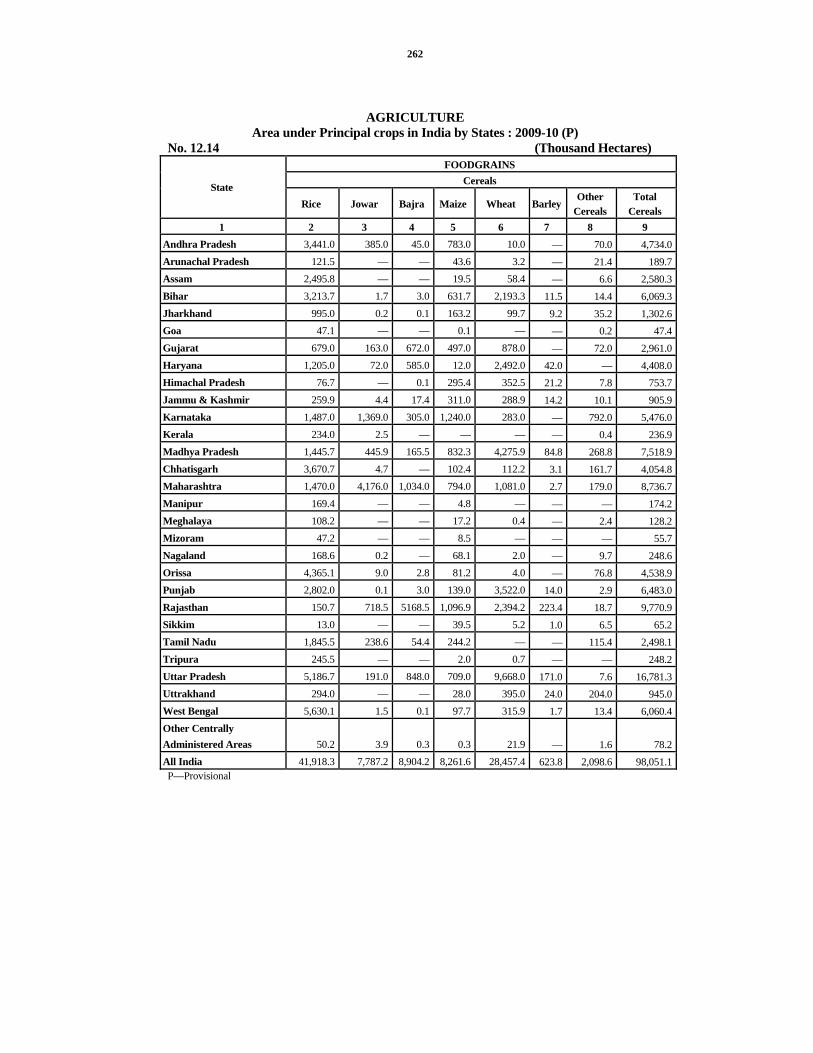
262
AGRICULTURE Area under Principal crops in India by States : 2009-10 (P)
No. 12.14 (Thousand Hectares) FOODGRAINS
Cereals State Rice Jowar Bajra Maize Wheat Barley
Other Cereals
Total Cereals
1 2 3 4 5 6 7 8 9 Andhra Pradesh 3,441.0 385.0 45.0 783.0 10.0 — 70.0 4,734.0Arunachal Pradesh 121.5 — — 43.6 3.2 — 21.4 189.7Assam 2,495.8 — — 19.5 58.4 — 6.6 2,580.3Bihar 3,213.7 1.7 3.0 631.7 2,193.3 11.5 14.4 6,069.3Jharkhand 995.0 0.2 0.1 163.2 99.7 9.2 35.2 1,302.6Goa 47.1 — — 0.1 — — 0.2 47.4Gujarat 679.0 163.0 672.0 497.0 878.0 — 72.0 2,961.0Haryana 1,205.0 72.0 585.0 12.0 2,492.0 42.0 — 4,408.0Himachal Pradesh 76.7 — 0.1 295.4 352.5 21.2 7.8 753.7Jammu & Kashmir 259.9 4.4 17.4 311.0 288.9 14.2 10.1 905.9Karnataka 1,487.0 1,369.0 305.0 1,240.0 283.0 — 792.0 5,476.0Kerala 234.0 2.5 — — — — 0.4 236.9Madhya Pradesh 1,445.7 445.9 165.5 832.3 4,275.9 84.8 268.8 7,518.9Chhatisgarh 3,670.7 4.7 — 102.4 112.2 3.1 161.7 4,054.8Maharashtra 1,470.0 4,176.0 1,034.0 794.0 1,081.0 2.7 179.0 8,736.7Manipur 169.4 — — 4.8 — — — 174.2Meghalaya 108.2 — — 17.2 0.4 — 2.4 128.2Mizoram 47.2 — — 8.5 — — — 55.7Nagaland 168.6 0.2 — 68.1 2.0 — 9.7 248.6Orissa 4,365.1 9.0 2.8 81.2 4.0 — 76.8 4,538.9Punjab 2,802.0 0.1 3.0 139.0 3,522.0 14.0 2.9 6,483.0Rajasthan 150.7 718.5 5168.5 1,096.9 2,394.2 223.4 18.7 9,770.9Sikkim 13.0 — — 39.5 5.2 1.0 6.5 65.2Tamil Nadu 1,845.5 238.6 54.4 244.2 — — 115.4 2,498.1Tripura 245.5 — — 2.0 0.7 — — 248.2Uttar Pradesh 5,186.7 191.0 848.0 709.0 9,668.0 171.0 7.6 16,781.3Uttrakhand 294.0 — — 28.0 395.0 24.0 204.0 945.0West Bengal 5,630.1 1.5 0.1 97.7 315.9 1.7 13.4 6,060.4Other Centrally Administered Areas 50.2 3.9 0.3 0.3 21.9 — 1.6 78.2All India 41,918.3 7,787.2 8,904.2 8,261.6 28,457.4 623.8 2,098.6 98,051.1P—Provisional

263
AGRICULTURE Area under Principal crops in India by States : 2009-10 (P)
No. 12.14 (Contd.) (Thousand Hectares) FOODGRAINS Oil seeds
Pulses State Gram Tur Other
Pulses Total Pulses
Total food-grains Groundnut Sesamum
Rape seed and
mustard 1 10 11 12 13 14 15 16 17
Andhra Pradesh 647.0 463.0 822.0 1,932.0 6,666.0 1,301.0 90.0 4.0Arunachal Pradesh — 0.6 8.3 8.9 198.6 0.5 1.1 25.9Assam 1.8 6.2 107.3 115.3 2,695.6 — 12.8 244.9Bihar 57.6 27.9 479.4 564.9 6,634.2 0.4 2.3 88.7Jharkhand 63.0 61.2 191.5 315.7 1,618.3 14.2 4.3 96.3Goa — — 7.9 7.9 55.3 2.9 — —Gujarat 132.0 266.0 335.0 733.0 3,694.0 1,822.0 225.0 216.0Haryana 84.0 22.0 26.0 132.0 4,540.0 2.0 3.0 513.0Himachal Pradesh 0.7 — 29.7 30.4 784.1 0.2 2.9 8.7Jammu & Kashmir 0.2 — 29.5 29.7 935.6 — 4.6 60.3Karnataka 972.0 604.0 903.0 2,479.0 7,955.0 818.0 76.0 5.0Kerala — 2.6 7.7 10.3 247.3 1.3 0.6 —Madhya Pradesh 3,085.5 362.1 1,492.9 4,940.5 12,459.4 188.1 202.4 790.5Chhatisgarh 252.2 60.0 496.7 808.9 4,863.7 28.9 20.4 59.6Maharashtra 1,291.0 1,093.0 992.0 3,376.0 12,112.7 321.0 55.0 6.0Manipur — — 14.5 14.5 188.7 — 0.5 0.4Meghalaya 0.6 0.8 2.6 4.0 132.2 — 1.6 7.2Mizoram — — 3.9 3.9 59.6 — 1.1 0.4Nagaland 0.6 3.0 29.9 33.5 282.1 0.7 3.0 58.6Orissa 45.0 132.9 689.3 867.2 5,406.1 76.3 45.5 12.8Punjab 3.0 4.6 12.5 20.1 6,503.1 2.5 7.3 30.0Rajasthan 884.4 18.3 2,598.3 3,501.0 13,271.9 326.0 598.3 2,309.9Sikkim — — 13.2 13.2 78.4 — — 5.8Tamil Nadu 7.4 26.5 500.8 534.7 3,032.8 412.8 62.7 0.3Tripura 0.3 1.0 5.1 6.4 254.7 0.4 1.5 1.5Uttar Pradesh 618.0 305.0 1,617.7 2,540.7 19,322.0 91.0 332.0 613.0Uttrakhand 1.0 2.0 61.0 64.0 1,009.0 1.0 2.0 15.0West Bengal 21.8 0.8 159.3 181.9 6,242.3 65.9 185.9 410.3Other Centrally Administered Areas 0.1 2.2 10.4 12.7 90.7 0.4 0.3 3.9All India 8,169.2 3,465.7 11,647.4 23,282.3 1,21,333.4 5,477.5 1,942.1 5,588.0
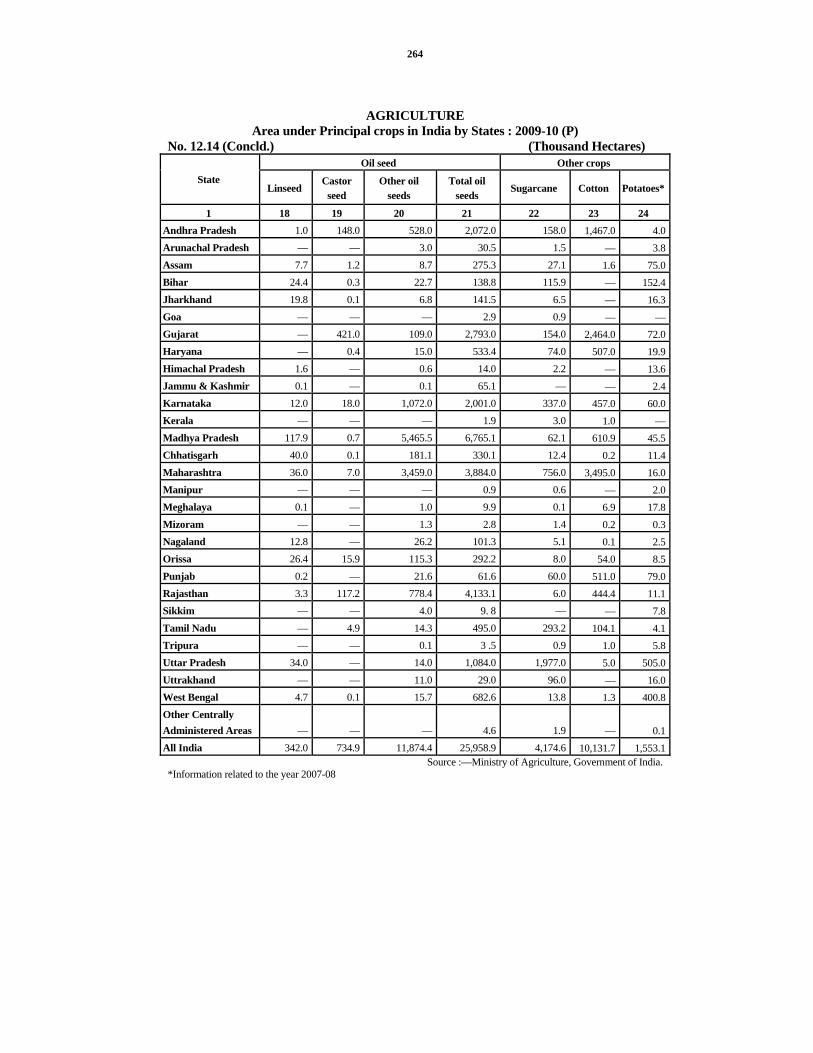
264
AGRICULTURE Area under Principal crops in India by States : 2009-10 (P)
No. 12.14 (Concld.) (Thousand Hectares) Oil seed Other crops
State Linseed
Castor seed
Other oil seeds
Total oil seeds
Sugarcane Cotton Potatoes*
1 18 19 20 21 22 23 24 Andhra Pradesh 1.0 148.0 528.0 2,072.0 158.0 1,467.0 4.0Arunachal Pradesh — — 3.0 30.5 1.5 — 3.8Assam 7.7 1.2 8.7 275.3 27.1 1.6 75.0Bihar 24.4 0.3 22.7 138.8 115.9 — 152.4Jharkhand 19.8 0.1 6.8 141.5 6.5 — 16.3Goa — — — 2.9 0.9 — —Gujarat — 421.0 109.0 2,793.0 154.0 2,464.0 72.0Haryana — 0.4 15.0 533.4 74.0 507.0 19.9Himachal Pradesh 1.6 — 0.6 14.0 2.2 — 13.6Jammu & Kashmir 0.1 — 0.1 65.1 — — 2.4Karnataka 12.0 18.0 1,072.0 2,001.0 337.0 457.0 60.0Kerala — — — 1.9 3.0 1.0 —Madhya Pradesh 117.9 0.7 5,465.5 6,765.1 62.1 610.9 45.5Chhatisgarh 40.0 0.1 181.1 330.1 12.4 0.2 11.4Maharashtra 36.0 7.0 3,459.0 3,884.0 756.0 3,495.0 16.0Manipur — — — 0.9 0.6 — 2.0Meghalaya 0.1 — 1.0 9.9 0.1 6.9 17.8Mizoram — — 1.3 2.8 1.4 0.2 0.3Nagaland 12.8 — 26.2 101.3 5.1 0.1 2.5Orissa 26.4 15.9 115.3 292.2 8.0 54.0 8.5Punjab 0.2 — 21.6 61.6 60.0 511.0 79.0Rajasthan 3.3 117.2 778.4 4,133.1 6.0 444.4 11.1Sikkim — — 4.0 9. 8 — — 7.8Tamil Nadu — 4.9 14.3 495.0 293.2 104.1 4.1Tripura — — 0.1 3 .5 0.9 1.0 5.8Uttar Pradesh 34.0 — 14.0 1,084.0 1,977.0 5.0 505.0Uttrakhand — — 11.0 29.0 96.0 — 16.0West Bengal 4.7 0.1 15.7 682.6 13.8 1.3 400.8Other Centrally Administered Areas — — — 4.6 1.9 — 0.1All India 342.0 734.9 11,874.4 25,958.9 4,174.6 10,131.7 1,553.1
Source :—Ministry of Agriculture, Government of India. *Information related to the year 2007-08

265
AGRICULTURE Production of Principal Crops in India by States : 2009-10 (P)
No. 12.15 (000 Tonnes) FOODGRAINS
Cereals State Rice Jowar Bajra Maize Wheat Barley
Other Cereals
Total Cereals
1 2 3 4 5 6 7 8 9 Andhra Pradesh 10,538.0 437.0 53.0 2,762.0 10.0 — 66.0 13,866.0Arunachal Pradesh 215.8 — — 60.2 4.8 — 18.4 299.2Assam 4,335.8 — — 14.1 63.5 — 3.1 4,416.5Bihar 3,599.3 1.8 3.3 1,478.7 4,570.8 12.9 11.4 9,678.2Jharkhand 1,538.4 0.1 — 190.7 173.2 8.5 17.6 1,928.5Goa 100.6 — — 0.6 — — 0.2 101.4Gujarat 1,292.0 171.0 828.0 533.0 2,352.0 — 68.0 5,244.0Haryana 3,625.0 36.0 932.0 27.0 10,500.0 137.0 — 15,257.0Himachal Pradesh 105.9 — 0.1 543.2 327.1 16.2 4.0 996.5Jammu & Kashmir 497.4 2.5 10.9 487.0 289.9 7.9 5.0 1,300.6Karnataka 3,691.0 1,406.0 153.0 3,013.0 251.0 — 1,323.0 9,837.0Kerala 598.3 1.9 — — — — 0.3 600.5Madhya Pradesh 1,260.6 564.9 247.5 1,045.2 8,410.0 110.0 73.6 11,711.8Chhatisgarh 4,110.4 5.9 — 143.3 121.9 2.4 30.2 4,414.1Maharashtra 2,183.0 3,566.0 766.0 1,828.0 1,740.0 1.3 132.0 10,216.3Manipur 319.9 — — 11.7 — — 0.1 331.7Meghalaya 206.7 — — 26.3 0.7 — 1.9 235.6Mizoram 44.4 — — 11.5 — — — 55.9Nagaland 240.3 0.1 — 73.2 2.4 — 3.5 319.5Orissa 6,917.5 5.8 1.7 175.1 5.8 — 47.8 7,153.7Punjab 11,236.0 0.1 4.0 475.0 15,169.0 47.0 1.0 26,932.1Rajasthan 228.3 104.2 2,034.9 1,145.7 7,500.9 619.8 2.6 11,636.4Sikkim 24.3 — — 66.0 5.9 1.2 7.0 104.4Tamil Nadu 5,665.2 221.7 82.3 1,144.3 — — 193.7 7,307.2Tripura 640.0 — — 2.0 1.3 — 0.1 643.4Uttar Pradesh 10,807.1 169.0 1,389.0 1,039.0 27,518.0 362.0 9.8 41,293.9Uttrakhand 608.0 — — 38.0 845.0 26.0 233.0 1,750.0West Bengal 14,340.7 0.6 — 385.2 846.7 2.4 15.7 15,591.3Other Centrally Administered Areas 123.1 3.6 0.7 0.5 93.7 0.1 1.4 223.1All India 89,093.0 6,698.2 6,506.4 16,719.5 80,803.6 1,354.7 2,270.4 2,03,445.8P—Provisional

266
AGRICULTURE Production of Principal Crops in India by States : 2009-10 (P)
No. 12.15 (Contd.) (000 Tonnes) FOODGRAINS Oil seeds
Pulses State Gram Tur
Other Pulses
Total Pulses
Total foodgrains
Groundnut Sesamum
1 10 11 12 13 14 15 16 Andhra Pradesh 846.0 203.0 380.0 1,429.0 15,295.0 1,006.0 20.0Arunachal Pradesh — 0.5 9.2 9.7 308.9 0.4 0.7Assam 0.9 4.4 59.3 64.6 4,481.1 — 7.2Bihar 58.4 42.2 371.8 472.4 10,150.6 0.7 1.8Jharkhand 57.6 53.3 112.8 223.7 2,152.2 10.7 1.3Goa — — 8.5 8.5 109.9 8.1 —Gujarat 125.0 241.0 151.0 517.0 5,761.0 1,757.0 80.0Haryana 62.0 23.0 15.0 100.0 15,357.0 2.0 1.0Himachal Pradesh 0.4 — 20.3 20.7 1,017.2 0.1 0.3Jammu & Kashmir 0.1 — 13.5 13.6 1,314.2 — 2.0Karnataka 574.0 282.0 262.0 1,118.0 10,955.0 512.0 31.0Kerala — 4.0 6.3 10.3 610.8 1.0 0.2Madhya Pradesh 3,304.1 308.0 692.5 4,304.6 16,016.4 217.9 86.6Chhatisgarh 221.9 30.6 236.2 488.7 4,902.8 39.1 9.0Maharashtra 1,114.0 919.0 337.0 2,370.0 12,586.3 359.0 15.0Manipur — — 7.2 7.2 338.9 — 0.5Meghalaya 0.3 0.6 2.6 3.5 239.1 — 0.9Mizoram — — 6.5 6.5 62.4 — 0.7Nagaland 0.4 2.1 32.2 34.7 354.2 0.6 1.5Orissa 33.7 111.8 253.9 399.4 7,553.1 89.2 10.5Punjab 3.4 4.4 10.2 18.0 26,950.1 3.1 2.6Rajasthan 534.6 7.0 172.1 713.7 12,350.1 354.5 97.2Sikkim — — 12.9 12.9 117.3 — —Tamil Nadu 4.5 20.3 179.4 204.2 7,511.4 889.8 29.2Tripura 0.2 0.7 3.6 4.5 647.9 0.5 0.9Uttar Pradesh 509.0 202.0 1,190.4 1,901.4 43,195.3 61.0 34.0Uttrakhand 1.0 2.0 43.0 46.0 1,796.0 2.0 1.0West Bengal 24.2 0.6 125.5 150.3 15,741.6 113.0 153.2Other Centrally Administered Areas 0.2 2.1 6.5 8.8 231.9 0.8 0.1All India 7,475.9 2,464.6 4,721.4 14,661.9 2,18,107.7 5,428.5 588.4
Source :—Ministry of Agriculture, Government of India. Note :— (i) Groundnut is in nut shell. (ii) Production of cotton is in terms of thousand bales of 170 Kg. each.

267
AGRICULTURE Production of Principal Crops in India by States : 2009-10 (P)
No. 12.15 (Concld.) (000 Tonnes) Oil seeds Other crops
State Rape seed and mustard
Linseed Castor seeds oil
Other oil seeds
Total oil seeds Sugarcane Cotton Potatoes
1 17 18 19 20 21 22 23 24 Andhra Pradesh 2.0 — 81.0 391.0 1,500.0 11,708.0 3,227.0 50.0Arunachal Pradesh 23.8 — — 3.4 28.3 27.1 — 29.2Assam 128.6 4.0 0.5 4.4 144.7 1,059.0 0.8 521.0Bihar 89.4 20.6 0.2 31.9 144.6 5,032.6 — 1,203.0Jharkhand 55.7 8.5 — 3.4 79.6 447.0 — 195.7Goa — — — — 8.1 52.3 — —Gujarat 341.0 — 852.0 67.0 3,097.0 12,400.0 7,986.3 1,796.0Haryana 849.0 — 2.0 23.5 877.5 5,335.0 1,926.0 352.2Himachal Pradesh 2.5 0.4 — 0.5 3.8 45.6 — 123.8Jammu & Kashmir 47.6 0.1 — — 49.7 — — 18.3Karnataka 2.0 4.0 18.0 438.0 1,005.0 30,443.0 868.2 257.0Kerala — — — — 1.2 285.0 1.3 —Madhya Pradesh 848.9 51.4 0.4 6,431.0 7,636.2 2,535.0 855.3 570.2Chhatisgarh 25.0 12.0 24.0 91.3 200.4 29.2 0.3 48.0Maharashtra 2.0 9.0 3.0 2,426.0 2,814.0 64,159.0 5,859.3 75.0Manipur 0.2 — — — 0.7 21.3 — 15.1Meghalaya 4 .9 — — 1.2 7.0 0.2 5.5 174.6Mizoram 0 .3 — — 2.0 3.0 12.4 0.8 1.2Nagaland 46.9 8.8 — 26.8 84.6 152.9 — 19.9Orissa 2.7 11.9 10.9 46.9 172.1 489.9 147.2 94.2Punjab 39.0 0.1 — 38.6 83.4 3,700.0 2,006.0 1,477.3Rajasthan 2,948.2 6.5 177.3 823.5 4,407.2 344.5 903.1 112.3Sikkim 5.3 — — 4.1 9.4 — — 35.2Tamil Nadu 0.1 — 1.7 18.8 939.6 29,745.6 225.0 68.0Tripura 1.1 — — — 2.5 44.9 1.4 84.6Uttar Pradesh 682.0 15.0 — 24.0 816.0 1,17,140.0 5.0 11,095.0Uttrakhand 12.0 — — 18.0 33.0 5,842.0 — 152.0West Bengal 443.0 1.4 — 16.5 727.1 1,000.8 3.3 9,900.9Other Centrally Administered Areas 4.9 — 0.1 0.1 6.0 249.3 0.0 0.9All India 6,608.1 153.7 1,171.1 10,931.9 24,881.7 2,92,301.6 24,021.8 28,470.6
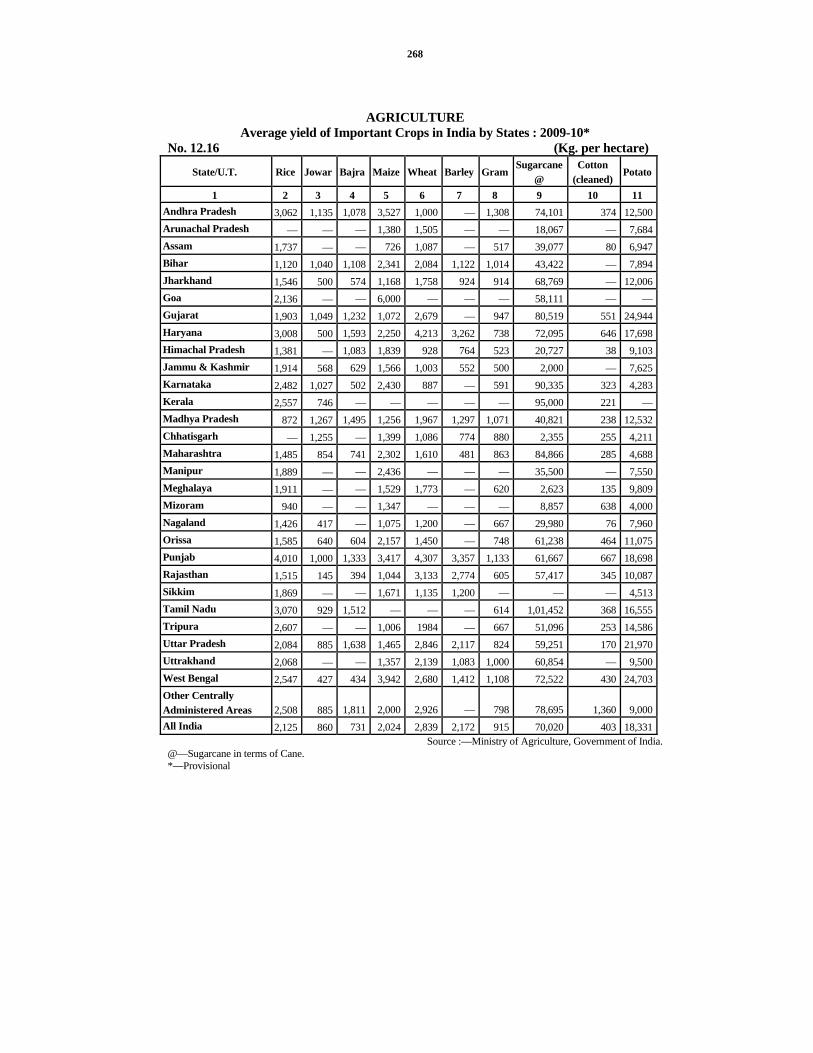
268
AGRICULTURE Average yield of Important Crops in India by States : 2009-10*
No. 12.16 (Kg. per hectare)
State/U.T. Rice Jowar Bajra Maize Wheat Barley GramSugarcane
@ Cotton
(cleaned) Potato
1 2 3 4 5 6 7 8 9 10 11 Andhra Pradesh 3,062 1,135 1,078 3,527 1,000 — 1,308 74,101 374 12,500 Arunachal Pradesh — — — 1,380 1,505 — — 18,067 — 7,684 Assam 1,737 — — 726 1,087 — 517 39,077 80 6,947 Bihar 1,120 1,040 1,108 2,341 2,084 1,122 1,014 43,422 — 7,894 Jharkhand 1,546 500 574 1,168 1,758 924 914 68,769 — 12,006 Goa 2,136 — — 6,000 — — — 58,111 — — Gujarat 1,903 1,049 1,232 1,072 2,679 — 947 80,519 551 24,944 Haryana 3,008 500 1,593 2,250 4,213 3,262 738 72,095 646 17,698 Himachal Pradesh 1,381 — 1,083 1,839 928 764 523 20,727 38 9,103 Jammu & Kashmir 1,914 568 629 1,566 1,003 552 500 2,000 — 7,625 Karnataka 2,482 1,027 502 2,430 887 — 591 90,335 323 4,283 Kerala 2,557 746 — — — — — 95,000 221 — Madhya Pradesh 872 1,267 1,495 1,256 1,967 1,297 1,071 40,821 238 12,532 Chhatisgarh — 1,255 — 1,399 1,086 774 880 2,355 255 4,211 Maharashtra 1,485 854 741 2,302 1,610 481 863 84,866 285 4,688 Manipur 1,889 — — 2,436 — — — 35,500 — 7,550 Meghalaya 1,911 — — 1,529 1,773 — 620 2,623 135 9,809 Mizoram 940 — — 1,347 — — — 8,857 638 4,000 Nagaland 1,426 417 — 1,075 1,200 — 667 29,980 76 7,960 Orissa 1,585 640 604 2,157 1,450 — 748 61,238 464 11,075 Punjab 4,010 1,000 1,333 3,417 4,307 3,357 1,133 61,667 667 18,698 Rajasthan 1,515 145 394 1,044 3,133 2,774 605 57,417 345 10,087 Sikkim 1,869 — — 1,671 1,135 1,200 — — — 4,513 Tamil Nadu 3,070 929 1,512 — — — 614 1,01,452 368 16,555 Tripura 2,607 — — 1,006 1984 — 667 51,096 253 14,586 Uttar Pradesh 2,084 885 1,638 1,465 2,846 2,117 824 59,251 170 21,970 Uttrakhand 2,068 — — 1,357 2,139 1,083 1,000 60,854 — 9,500 West Bengal 2,547 427 434 3,942 2,680 1,412 1,108 72,522 430 24,703 Other Centrally Administered Areas 2,508 885 1,811 2,000 2,926 — 798 78,695 1,360 9,000 All India 2,125 860 731 2,024 2,839 2,172 915 70,020 403 18,331
Source :—Ministry of Agriculture, Government of India. @—Sugarcane in terms of Cane. *—Provisional

CONSUMPTION OF CHEMICAL FERTILIZERS IN HARYANA
(000 Tonnes)
1370 97
231
372
586
724
930
1129
12891356 1358
0
200
400
600
800
1000
1200
1400
1600
66-67 70-71 75-76 80-81 85-86 90-91 95-96 00-01 05-06 08-09 09-10 10-11

269
AGRICULTURE Fertilizer Consumption in Haryana (Nutrients)
No. 12.17 (In Tonnes) Consumption Year/District
N P K Total 1 2 3 4 5
1966-67 12,626 574 147 13,3471970-71 60,972 6,860 2,228 70,0601975-76 86,308 8,322 2,285 96,9151980-81 1,87,385 31,340 12,098 2,30,8231985-86 2,96,394 69,639 6,154 3,72,1871990-91 4,43,245 1,38,005 5,042 5,86,2921995-96 5,87,045 1,33,582 3,160 7,23,7872000-01 7,14,308 2,06,319 9,668 9,30,2952005-06 8,47,427 2,52,570 28,674 11,28,6712009-10 9,61,875 3,33,165 60,648 13,55,6882010-11 9,74,045 3,35,950 47,627 13,57,622Ambala 39,739 13,688 2,728 56,155Panchkula 3,816 1,173 112 5,101Yamunanagar 48,724 16,081 5,586 70,391Kurukshetra 71,648 21,530 4,131 97,309Kaithal 64,244 18,168 2,861 85,273Karnal 83,864 28,390 3,962 1,16,216Panipat 36,858 10,104 1,020 47,982Sonipat 62,632 21,959 1,969 86,560Rohtak 39,017 16,520 642 56,179Jhajjar 15,459 5,061 321 20,841Faridabad 11,185 6,956 301 18,442Palwal 41,427 15,680 3,336 60,443Gurgaon 11,069 4,988 590 16,647Mewat 15,974 6,039 534 22,547Rewari 29,116 15,370 1,474 45,960Mahendragarh 22,220 8,323 1,334 31,877Bhiwani 41,896 16,315 852 59,063Jind 76,235 22,925 3,343 1,02,503Hisar 80,158 28,095 3,747 1,12,000Fatehabad 77,009 22,989 3,538 1,03,536Sirsa 1,01,755 35,596 5,246 1,42,597
Source :—Director of Agriculture, Haryana. N : Nitrogenous P : Phosphatic K : Potassic Note :—For the years 1974-75 to 1980-81 fertilizer year has been taken as February to January.

270
AGRICULTURE Consumption of Pesticides (Technical Grade)
No. 12.18 Year Quantity (In Tonnes) Area covered (In 000 Hectare)
1 2 3 1966-67 273.00 1,9171970-71 412.00 3,2061975-76 1,400.00 3,7331980-81 2,150.00 5,0581985-86 3,608.26 7,0201990-91 5,164.53 6,4201995-96 5,100.00 7,8802000-01 5,025.00 8,7982004-05 4,700.00 8,5652005-06 4,650.00 8,4952007-08 4,390.91 7,5552008-09 4,288.00 7,2902009-10(R) 4,070.00 7,1192010-11(P) 4,060.00 7,110
Source :—Director of Agriculture, Haryana. P—Provisional R—Revised
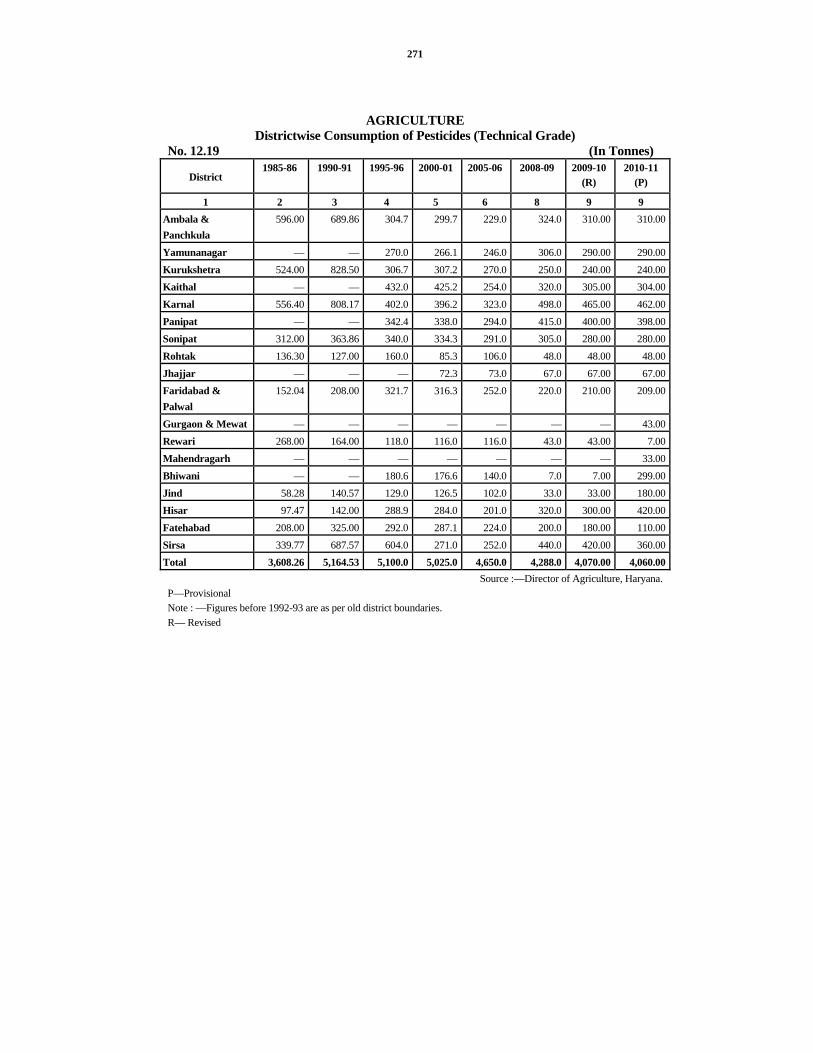
271
AGRICULTURE Districtwise Consumption of Pesticides (Technical Grade)
No. 12.19 (In Tonnes)
District 1985-86 1990-91 1995-96 2000-01 2005-06 2008-09 2009-10
(R) 2010-11
(P)
1 2 3 4 5 6 8 9 9 Ambala & Panchkula
596.00 689.86 304.7 299.7 229.0 324.0 310.00 310.00
Yamunanagar — — 270.0 266.1 246.0 306.0 290.00 290.00Kurukshetra 524.00 828.50 306.7 307.2 270.0 250.0 240.00 240.00Kaithal — — 432.0 425.2 254.0 320.0 305.00 304.00Karnal 556.40 808.17 402.0 396.2 323.0 498.0 465.00 462.00Panipat — — 342.4 338.0 294.0 415.0 400.00 398.00Sonipat 312.00 363.86 340.0 334.3 291.0 305.0 280.00 280.00Rohtak 136.30 127.00 160.0 85.3 106.0 48.0 48.00 48.00Jhajjar — — — 72.3 73.0 67.0 67.00 67.00Faridabad & Palwal
152.04 208.00 321.7 316.3 252.0 220.0 210.00 209.00
Gurgaon & Mewat — — — — — — — 43.00Rewari 268.00 164.00 118.0 116.0 116.0 43.0 43.00 7.00Mahendragarh — — — — — — — 33.00Bhiwani — — 180.6 176.6 140.0 7.0 7.00 299.00Jind 58.28 140.57 129.0 126.5 102.0 33.0 33.00 180.00Hisar 97.47 142.00 288.9 284.0 201.0 320.0 300.00 420.00Fatehabad 208.00 325.00 292.0 287.1 224.0 200.0 180.00 110.00Sirsa 339.77 687.57 604.0 271.0 252.0 440.0 420.00 360.00Total 3,608.26 5,164.53 5,100.0 5,025.0 4,650.0 4,288.0 4,070.00 4,060.00
Source :—Director of Agriculture, Haryana. P—Provisional Note : —Figures before 1992-93 are as per old district boundaries. R— Revised

272
AGRICULTURE Animal Driven Agriculture implements and equipment for livestock and poultry in
Haryana: Livestock Census 2007 No. 12.20
Animal operated implements
District
Wooden plough
Steel
plough
Cultivator
Disc
harrow
Seed-cum-fertiliser drill/Seed
drill
Leveller
Wet land
puddler
Sugarcane
crusher
Animal
cart
1 2 3 4 5 6 7 8 9 10 Panchkula 2,363 1,532 142 411 200 2,235 1,185 21 1,755Ambala 1,495 2,120 1,939 2,897 1,133 2,159 583 35 6,254Yamunanagar 1,564 8,654 1,548 2,686 647 7,658 1,254 66 7,542Kurukshetra 1,018 635 1,691 2,349 845 1,804 771 8 14,520Kaithal 2,157 3,005 1,092 2,656 773 2,095 392 25 16,704Karnal 2,281 1,964 2,472 3,924 1,127 2,823 772 81 20,240Panipat 1,363 341 1,901 2,213 607 1,512 421 41 14,042Sonipat 2,420 573 1,399 1,390 782 1,175 256 21 12,109Jind 14,673 17,176 6,128 10,026 3,626 13,063 627 5 53,780Fatehabad 6,653 7,354 2,217 2,005 1,976 3,434 404 162 6,477Sirsa 6,735 4,992 2,071 1,619 1,837 3,711 570 28 12,401Hisar 25,413 35,339 8,955 11,551 6,363 16,442 3,601 77 32,826Bhiwani 13,175 18,999 4,237 4,062 3,913 4,908 634 84 10,440Rohtak 3,613 3,246 2,306 2,633 2,002 2,668 493 70 13,437Jhajjar 498 278 1,364 1,279 988 1,206 338 6 1,607Mahendergarh 4,937 1,579 9 11 9 1,123 2 0 4,224Rewari 1,002 339 553 555 609 516 54 0 1,024Gurgaon 1,853 964 323 211 305 615 76 93 549Faridabad 198 42 303 309 235 223 166 10 870Mewat 320 33 140 136 172 110 32 1 19Total 93,731 1,09,165 40,790 52,923 28,149 69,480 12,631 834 2,30,820

273
AGRICULTURE Animal Driven Agriculture implements and equipment for livestock and poultry in
Haryana: Livestock Census 2007 No. 12.20 (Concld.)
Animal operated implements Equipment for Livestock & Poultry
District Ghanis
Water lifting
devices (animal)
Incubators/ Breeders
Milking
machine
Baler
Straw reaper
Forage
harvester
Manually operated
Animal
operated
Power
operated
1 11 12 13 14 15 16 17 18 19 20 Panchkula 2 1 0 3 1 14 52 3,548 208 6,148 Ambala 853 0 0 0 1 75 1,796 11,616 1,604 21,057 Yamunanagar 112 35 6 3 32 433 24516 564 36,589 Kurukshetra 329 178 27 23 156 117 1,793 16,105 394 43,302 Kaithal 252 28 9 7 13 140 579 8,704 1,267 32,996 Karnal 188 19 20 327 20 335 2,601 22,840 1,295 56,944 Panipat 19 7 4 0 171 63 3,795 8,438 394 36,918 Sonipat 93 167 833 1 48 64 1,067 9,144 738 59,485 Jind 6 11 4 0 0 268 4,332 19,121 96 88,644 Fatehabad 488 181 0 0 0 76 506 15,209 240 19,622 Sirsa 29 17 0 0 0 168 682 50,276 128 22,274 Hisar 124 29 142 355 7760 581 7,417 20,974 1,481 63,793 Bhiwani 34 152 13 125 7 31 1,921 29,371 47 78,249 Rohtak 738 28 21 400 12 115 1,176 4,984 413 44,240 Jhajjar 11 2 0 6 4 715 1,185 11,517 328 45,818 Mahendergarh 0 0 0 0 0 0 48 46,702 20 24,166 Rewari 0 0 0 0 0 21 805 21,356 167 11,945 Gurgaon 63 425 25 10 48 4 2,254 26,548 242 17,895 Faridabad 6 0 0 0 1 1 77 4,096 61 5,261 Mewat 4 1 0 1 1 6 250 19,533 78 1,568 Total 3,351 1,281 1,104 1,258 8,246 2,826 32,769 3,74,598 9,765 7,16,914
Source :—Director of Animal Husbandry and Dairying, Haryana.

274
AGRICULTURE Number of Tractors in Haryana
No. 12.21 Year/District Number of Tractors
1 2 1966-67 4,803 1970-71 12,312 1975-76 25,451 1980-81 52,689 1985-86 83,120 1990-91 1,30,246 1995-96 1,62,030 2000-01 2,09,613 2005-06 2,46,914 2009-10 2,59,030 20010-11 2,62,236 Ambala 8,514 Panchkula 11,076 Yamunanagar 12,122 Kurukshetra 13,976 Kaithal 12,314 Karnal 18,651 Panipat 2,155 Sonipat 16,541 Rohtak 12,567 Jhajjar 16,278 Faridabad 3,779 Palwal 14,495 Gurgaon 5,254 Mewat 4,417 Rewari 8,564 Mahendragarh 5,650 Bhiwani 21,456 Jind 13,848 Hisar 21,030 Fatehabad 16,153 Sirsa 23,396
Source :—Director of Agriculture, Haryana. P— Figures are Provisional.

NUMBER OF TRACTORS IN HARYANA
4803 12
312
2545
1 5268
9
8312
0
1302
46
1620
30
2096
13
2469
14 2649
73
2590
30
2622
360
50000
100000
150000
200000
250000
300000
66-67 70-71 75-76 80-81 85-86 90-91 95-96 00-01 05-06 08-09 09-10 10-11

275
AGRICULTURE Number of Villages Repartitioned in Haryana
No. 12.22 Number of revenue villages where consolidation operations have been completed
District
1965-66 Upto 1965-66 1980-81 Upto 1980-
81
2008-09 Upto 2010-
11
2010-11 Total number of revenue villages where
consolidation operations were
completed by 31st March, 2011
1 2 3 4 5 6 Ambala 1,176 1,239 707 — 707Yamunanagar ** ** 540 — 540Kurukshetra ** 740 417 — 417Kaithal ** ** 321 — 321Karnal 1,330 612 418 — 418Panipat ** ** 215 — 215Sonipat ** 339 343 — 343Rohtak 755 435 439 — 439Faridabad ** — 465 — 465Gurgaon 1,512 1,157 373 2 375Rewari ** ** 343 — 343Mahendragarh 484 721 737 — 737Bhiwani ** 402 393 — 393Jind 296 355 347 — 347Hisar 979 483 512 — 512Sirsa ** 323 325 — 325Total 6,532 6,806 6,895 2 6,897
Source :—Director, Consolidation of Holdings, Haryana. Note : — Information of Panchkula, Jhajjar and Fatehabad districts are included in Ambala, Rohtak and Hisar districts
respectively. ** Districts were not in existence.

276
AGRICULTURE Area Repartitioned in Haryana
No. 12.23 (000 Hectares) Area repartitioned
District Area
repartitioned upto the end of
1965-66
Area repartitioned
upto the end of 1980-81
Area repartitioned
upto the end of 2008-09
During 2009-10
upto 2010-11
Total Area repartitioned
upto the end of 2010-11
1 2 3 4 5 6 Ambala 338 365 366.370 — 366.370
Yamunanagar ** ** 1.539 — 1.539
Kurukshetra ** 368 368.000 — 368.000
Kaithal ** ** 3.140 — 3.140
Karnal 759 355 359.461 — 359.461
Panipat ** ** 10.400 — 10.400
Sonipat * 207 207.000 — 207.000
Rohtak 565 341 342.000 — 342.000
Faridabad ** — 230.000 — 230.000
Gurgaon 574 450 221.930 190.000 411.930
Rewari * * — — —
Mahendragarh 280 284 284.000 — 284.000
Bhiwani ** 543 576.566 — 576.566
Jind 239 325 325.000 — 325.000
Hisar 1,236 619 622.110 — 622.110
Sirsa ** 320 322.020 — 322.020
Total 3,991 4,177 4,239.445 190.000 4,430.536
Source :—Director, Consolidation of Holdings, Haryana.
Note : — Information of Panchkula, Jhajjar and Fatehabad districts are included in Ambala, Rohtak and Hisar districts respectively.
** Districts were not in existenice.
277
SECTION XIII
IRRIGATION
The tables in this section contain the irrigation statistics of Haryana as well as India. Information has been
collected from the Departments of Irrigation, Agriculture and Land Records of Haryana State and Economic and
Statistical Adviser, Ministry of Agriculture, Government of India.
Table No. 13.1 shows net area under irrigation in Haryana according to different sources.
Table No. 13.2 shows net area under irrigation in India by different sources.
Table No. 13.3 shows gross area irrigated and total cropped area in Haryana.
Table No. 13.4 shows gross area irrigated under various crops in Haryana.
Table No. 13.5 shows cropwise gross area irrigated in India by States.
Table No. 13.6 gives the number of tube-wells and pumping sets. The information has been collected from
Development Blocks through Agriculture Department.
Table No. 13.7 shows data concerning principal works and results of their operations.
Table No. 13.8 presents canal irrigated area in Haryana.

278

NET AREA IRRIGATED BY DIFFERENT SOURCES IN HARYANA
(In Lakh Hectares)
5.80
12.8212.7413.31
14.7613.7513.37
11.9111.6110.36
9.529.91
17.83
9.4110.42
12.48
16.0015.91
14.6713.52
6.82
0.043.02 0.030.140.150.330.150.150.320.36
30.69
28.7729.3629.5827.60
26.00
22.4821.34
17.54
15.32
12.93
0
5
10
15
20
25
30
35
66-67 70-71 75-76 80-81 85-86 90-91 95-96 00-01 05-06 08-09 09-10
Canals Tubewells Others Total

279
IRRIGATION Net Area under Irrigation in Haryana
No. 13.1 (000 Hectares) Net area irrigated
Year/District Government canals
Tanks Wells Tubewells Other sources
Total Percentage to net area
sown 1 2 3 4 5 6 7 8
1966-67 991 4 289 — 9 1,293 37.81970-71 952 1 574 — 5 1,532 43.01975-76 1,036 1 31 682 4 1,754 48.41980-81 1,161 (a) 26 941 6 2,134 59.21985-86 1,191 1 10 1,042 4 2,248 62.21990-91 1,337 1 (a) 1,248 14 2,600 72.71995-96 1,375 1 (a) 1,352 32 2,760 77.02000-01 1,476 1 (a) 1,467 14 2,958 83.92005-06 1,331 (a) (a) 1,591 14 2,936 82.32008-09 1,274 (a) 1 1,600 2 2,877 80.52009-10* 1,282 (a) 2 1,783 2 3,069 86.4Ambala 14 (a) -- 98 1 113 85.6Panchkula (a) — 2 14 (a) 16 66.7Yamunanagar 3 — — 112 — 115 92.0Kurukshetra 31 — — 120 — 151 100.7Kaithal 97 — — 104 — 201 99.5Karnal 43 — — 154 (a) 197 100.0Panipat 34 — — 61 — 95 100.0Sonipat 85 — — 67 — 152 99.3Rohtak 74 — — 38 — 112 80.0Jhajjar 79 — — 42 — 121 74.2Faridabad 1 — — 35 — 36 97.3Palwal 18 — — 76 — 94 90.4Gurgaon 2 — — 69 — 71 84.5Mewat 7 — — 60 — 67 62.6Rewari 2 — — 107 — 109 86.5Mahendragarh 2 — — 124 — 126 83.4Bhiwani 84 — — 117 1 202 54.4Jind 113 — — 118 — 231 97.1Hisar 206 — — 61 — 267 80.4Fatehabad 125 — — 97 — 222 99.1Sirsa 262 — — 109 — 371 93.9 (a) Means less than 500 hectares. * Provisional Source :— Director of Land Records, Haryana.

280
IRRIGATION
Net Area under Irrigation in India 2008-09 (Provisional) No. 13.2 (000 Hectares)
State Government canals
Private canals
Tanks Tubewells Other wells
Other sources
Total Percentage of net area irrigated to
net area sown
1 2 3 4 5 6 7 8 9
Andhra Pradesh 1669 — 648 1610 713 180 4,820 44.3
Arunachal Pradesh — — — — — 56 56 26.5
Assam ** 33 — 3 — 2 101 140 5.1
Bihar ** 971 — 155 2264 7 132 3,529 62.3
Jharkhand 8 — 21 17 46 17 110 7.3
Goa 8 — 1 — 20 7 35 25.9
Gujarat 789 — 40 1133 2174 102 4238 43.2
Haryana 1274 — — 1600 1 2 2877 80.4
Himachal Pradesh** 4 — 1 14 1 84 104 19.2
Jammu & Kashmir 161 127 5 3 1 17 314 42.5
Karnataka 1061 — 206 1140 406 424 3238 31.8
Kerala 96 6 40 18 133 96 390 18.7
Madhya Pradesh 1065 1 130 1985 2385 941 6,506 43.5
Chhatisgarh 886 1 51 288 28 84 1,339 28.4
Maharashtra 1002 — — — 2171 — 3,173 18.2
Manipur ** — — — — — 52 52 22.0
Meghalaya 17 45 — — — — 62 21.8
Mizoram 2 9 — — — — 11 11.6
Nagaland — — — — — 77 77 24.4
Orissa 1418 — — 331 101 341 2,192 39.1
Punjab 1109 4 — 2963 — 4 4,079 97.8
Rajasthan 1583 — 31 2437 2,122 73 6,245 35.6
Sikkim ** 2 — — — — 7 9 8.4
Tamil Nadu 765 1 540 387 1,227 11 2,931 58.1
Tripura ** 15 — 2 7 2 35 61 21.8
Uttar Pradesh** 2,358 — 105 9576 1,004 41 13,085 79.7
Uttarakhand 93 3 1 198 16 30 340 45.1
West Bengal ** — — — — — 3,135 3,135 59.2

281
IRRIGATION Net Area under Irrigation in India 2008-09 (Provisional)
No. 13.2 (Concld.) (000 Hectares) State Government
canals Private canals
Tanks Tubewells Other wells
Other sources
Total Percentage of net area irrigated to
net area sown
1 2 3 4 5 6 7 8 9
Other Centrally Administered Areas**
11 — — 30 3 4 49 57.6
All India 2008-09(P)
16,401 196 1,979 26,004 12,563 6,053 63,196 44.7
All India 2007-08(R)
16,474 217 1,968 26,328 12,033 6,080 63,099 44.8
Source : — Economic & Statistical Adviser, Ministry of Agriculture,Govt. of India. (P) Provisional. Total may not tally due to rounding off. ** The figures related to irrigated area are either estimated based on the data for the latest available year received
from the states/UTs or are estimated / taken from agriculture census. (R) Revised.

282
IRRIGATION Gross Area Irrigated and Total Cropped Area by Districts in Haryana during 2009-10
No. 13.3 (000 Hectares) Year/District Gross Irrigated
Area Percentage to State
Total Percentage of Gross
Area Irrigated to Total Cropped Area
Irrigation Intensity (Gross Irrigated Area X 100/Net Irrigated Area)
1 2 3 4 5
Ambala 189 3.4 91.3 167.3
Panchkula 25 0.5 64.1 156.3
Yamunanagar 202 3.7 93.5 175.7
Kurukshetra 283 5.1 100.0 187.4
Kaithal 379 6.8 99.7 188.6
Karnal 388 7.0 99.7 197.0
Panipat 189 3.4 100.0 198.9
Sonipat 292 5.3 98.3 192.1
Rohtak 196 3.5 87.5 175.0
Jhajjar 190 3.4 81.9 157.0
Faridabad 68 1.2 100.0 188.9
Palwal 180 3.3 94.7 191.5
Gurgaon 104 1.9 88.9 146.5
Mewat 102 1.8 59.0 152.2
Rewari 150 2.7 78.1 137.6
Mahendragarh 151 2.7 56.3 119.8
Bhiwani 403 7.3 56.4 199.5
Jind 444 8.0 95.1 192.2
Hisar 540 9.7 89.1 202.2
Fatehabad 408 7.4 98.3 183.8
Sirsa 662 11.9 96.5 178.4
Total 5,545 100.0 87.3 180.7Source :—Director of Land Records, Haryana.

GROSS CROPPED AREA AND GROSS IRRIGATED AREA IN HARYANA
(In Lakh Hectares)
45.9
9 49.5
7 54.5
1
54.6
2
56.0
1 59.1
9
59.7
4
61.1
5 65.0
9
65.0
0
63.5
1
55.4
5
55.4
4
54.5
1
52.2
3
46.7
3
42.3
7
36.7
9
33.0
9
27.3
2
22.3
0
17.3
6
0
10
20
30
40
50
60
70
66-67 70-71 75-76 80-81 85-86 90-91 95-96 00-01 05-06 08-09 09-10
Gross Cropped Area Gross Irrigated Area
283
Gross Area Irrigated in Haryana

284
IRRIGATION Gross Area Irrigated in Haryana (Cropwise)
No. 13.4 (000 Hectares) Year/District Rice Jowar Bajra Wheat Barley
1 2 3 4 5 6
1966-67 138 72 47 512 92
1970-71 235 55 88 914 54
1975-76 274 50 112 1,084 102
1980-81 469 37 103 1,378 76
1985-86 577 43 84 1,623 57
1990-91 655 61 94 1,805 41
1995-96 824 68 102 1,939 36
2000-01 1,052 70 147 2,334 40
2005-06 1,046 67 189 2,280 26
2008-09 1,210 61 227 2,444 51
2009-10* 1,205 55 222 2,474 41
Ambala 82 — — 86 @
Panchkula 8 — @ 12 @
Yamunanagar 73 — @ 83 @
Kurukshetra 118 — @ 114 @
Kaithal 158 @ 10 172 @
Karnal 172 @ 1 171 @
Panipat 77 @ 1 87 @
Sonipat 90 10 10 140 @
Rohtak 35 18 9 104 1
Jhajjar 26 13 15 100 2
Faridabad 10 2 4 34 @
Palwal 31 7 6 99 1
Gurgaon 4 1 22 52 2
Mewat 6 1 1 69 1
Rewari 2 @ 22 49 2
Mahendragarh @ @ 18 41 1
Bhiwani 19 3 36 156 11
Jind 108 @ 27 215 1
Hisar 43 — 31 225 7
Fatehabad 82 — 6 186 3
Sirsa 61 — 3 279 9

285
IRRIGATION Gross Area Irrigated in Haryana (Cropwise)
No. 13.4 (Contd.) (000 Hectares) Year/District Maize Other cereals
and Millets Total cereals Gram Other Pulses
1 7 8 9 10 11
1966-67 23 @ 884 268 20
1970-71 35 @ 1,381 238 15
1975-76 38 1 1,661 307 18
1980-81 17 1 2,081 311 23
1985-86 15 2 2,401 191 37
1990-91 8 1 2,665 141 55
1995-96 4 @ 2,973 70 45
2000-01 2 @ 3,645 41 18
2005-06 3 @ 3,611 24 38
2008-09 1 — 3,994 19 37
2009-10* 3 — 4,000 14 27
Ambala @ — 168 @ @
Panchkula @ — 21 @ @
Yamunanagar @ — 157 @ 1
Kurukshetra @ — 232 @ 1
Kaithal @ — 340 @ 1
Karnal 1 — 344 @ 1
Panipat @ — 164 @ 1
Sonipat 1 — 252 @ 4
Rohtak 1 — 168 @ 5
Jhajjar @ — 157 @ 3
Faridabad -- — 49 — 1
Palwal @ — 143 @ 1
Gurgaon @ — 81 @ @
Mewat @ — 79 @ @
Rewari @ — 75 @ 1
Mahendragarh — — 60 2 1
Bhiwani @ — 225 6 2
Jind -- — 351 @ 1
Hisar @ — 306 2 2
Fatehabad @ — 277 1 —
Sirsa @ — 351 3 1
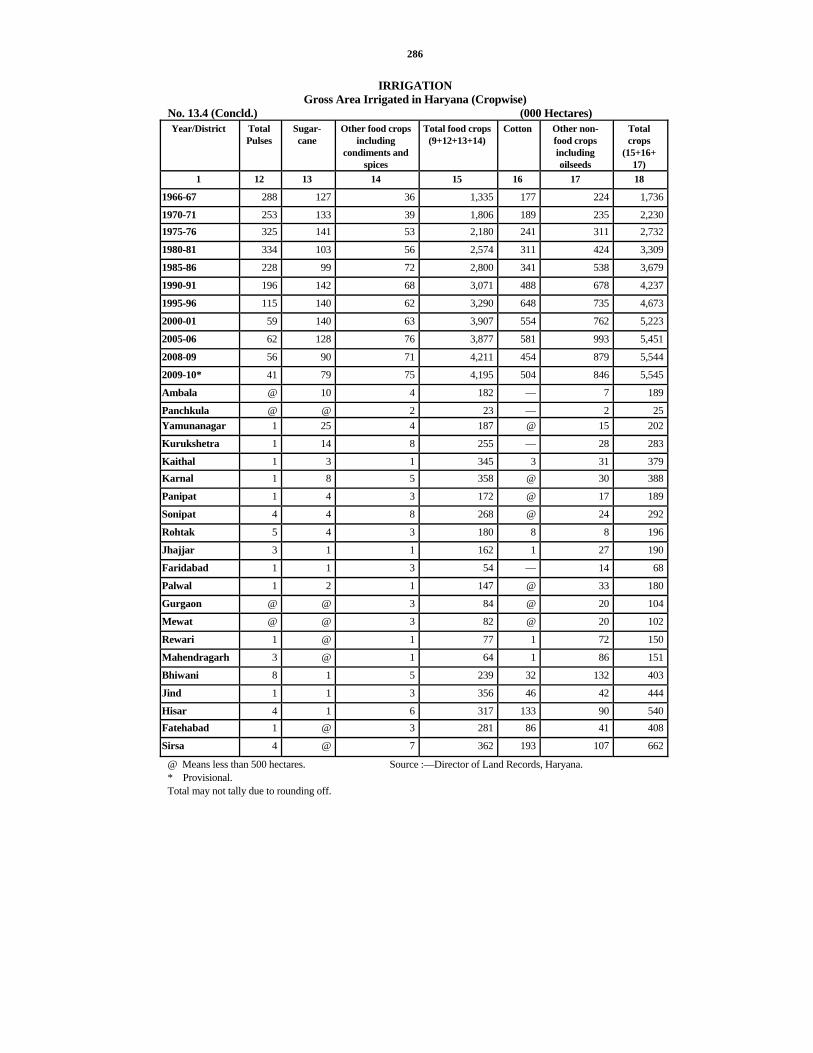
286
IRRIGATION Gross Area Irrigated in Haryana (Cropwise)
No. 13.4 (Concld.) (000 Hectares) Year/District Total
Pulses Sugar-cane
Other food crops including
condiments and spices
Total food crops (9+12+13+14)
Cotton Other non- food crops including oilseeds
Total crops
(15+16+ 17)
1 12 13 14 15 16 17 18
1966-67 288 127 36 1,335 177 224 1,736
1970-71 253 133 39 1,806 189 235 2,2301975-76 325 141 53 2,180 241 311 2,732
1980-81 334 103 56 2,574 311 424 3,309
1985-86 228 99 72 2,800 341 538 3,679
1990-91 196 142 68 3,071 488 678 4,237
1995-96 115 140 62 3,290 648 735 4,673
2000-01 59 140 63 3,907 554 762 5,223
2005-06 62 128 76 3,877 581 993 5,451
2008-09 56 90 71 4,211 454 879 5,544
2009-10* 41 79 75 4,195 504 846 5,545
Ambala @ 10 4 182 — 7 189
Panchkula @ @ 2 23 — 2 25Yamunanagar 1 25 4 187 @ 15 202
Kurukshetra 1 14 8 255 — 28 283
Kaithal 1 3 1 345 3 31 379Karnal 1 8 5 358 @ 30 388
Panipat 1 4 3 172 @ 17 189
Sonipat 4 4 8 268 @ 24 292
Rohtak 5 4 3 180 8 8 196
Jhajjar 3 1 1 162 1 27 190
Faridabad 1 1 3 54 — 14 68
Palwal 1 2 1 147 @ 33 180
Gurgaon @ @ 3 84 @ 20 104
Mewat @ @ 3 82 @ 20 102
Rewari 1 @ 1 77 1 72 150
Mahendragarh 3 @ 1 64 1 86 151
Bhiwani 8 1 5 239 32 132 403
Jind 1 1 3 356 46 42 444
Hisar 4 1 6 317 133 90 540Fatehabad 1 @ 3 281 86 41 408
Sirsa 4 @ 7 362 193 107 662
@ Means less than 500 hectares. Source :—Director of Land Records, Haryana. * Provisional. Total may not tally due to rounding off.
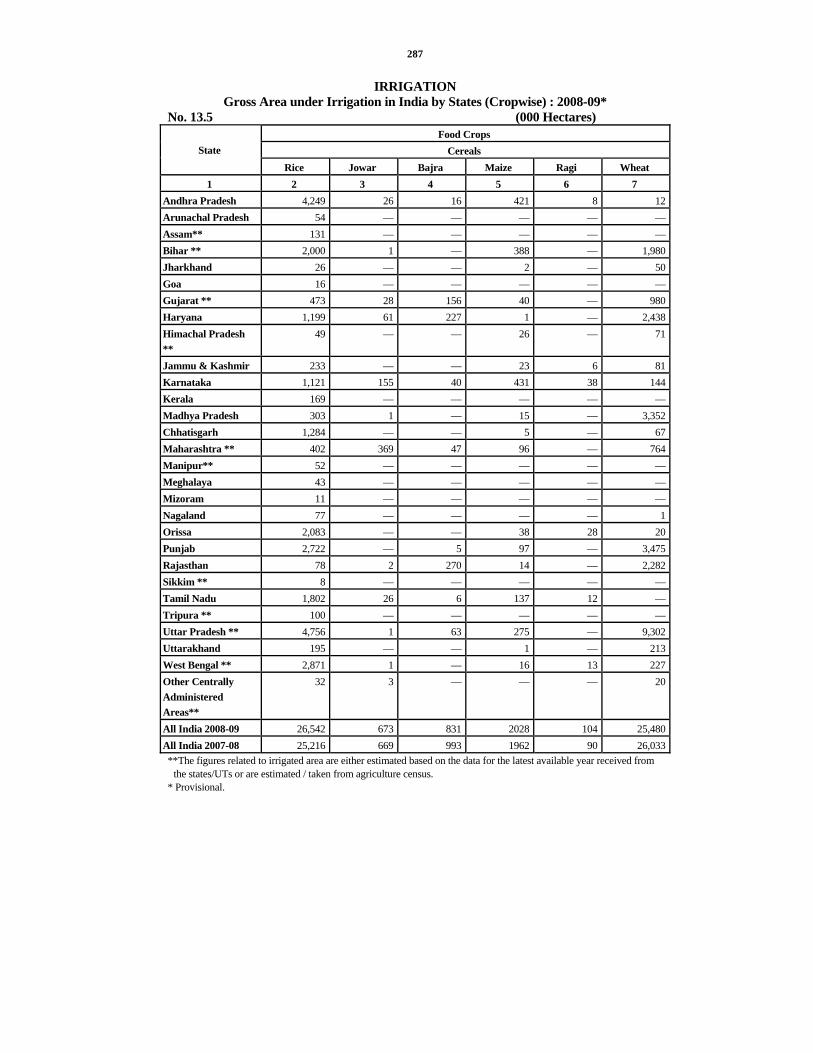
287
IRRIGATION Gross Area under Irrigation in India by States (Cropwise) : 2008-09*
No. 13.5 (000 Hectares) Food Crops
Cereals State Rice Jowar Bajra Maize Ragi Wheat
1 2 3 4 5 6 7 Andhra Pradesh 4,249 26 16 421 8 12Arunachal Pradesh 54 — — — — —Assam** 131 — — — — —Bihar ** 2,000 1 — 388 — 1,980Jharkhand 26 — — 2 — 50Goa 16 — — — — —Gujarat ** 473 28 156 40 — 980Haryana 1,199 61 227 1 — 2,438Himachal Pradesh **
49 — — 26 — 71
Jammu & Kashmir 233 — — 23 6 81Karnataka 1,121 155 40 431 38 144Kerala 169 — — — — —Madhya Pradesh 303 1 — 15 — 3,352Chhatisgarh 1,284 — — 5 — 67Maharashtra ** 402 369 47 96 — 764Manipur** 52 — — — — —Meghalaya 43 — — — — —Mizoram 11 — — — — —Nagaland 77 — — — — 1Orissa 2,083 — — 38 28 20Punjab 2,722 — 5 97 — 3,475Rajasthan 78 2 270 14 — 2,282Sikkim ** 8 — — — — —Tamil Nadu 1,802 26 6 137 12 —Tripura ** 100 — — — — —Uttar Pradesh ** 4,756 1 63 275 — 9,302Uttarakhand 195 — — 1 — 213West Bengal ** 2,871 1 — 16 13 227Other Centrally Administered Areas**
32 3 — — — 20
All India 2008-09 26,542 673 831 2028 104 25,480All India 2007-08 25,216 669 993 1962 90 26,033**The figures related to irrigated area are either estimated based on the data for the latest available year received from
the states/UTs or are estimated / taken from agriculture census. * Provisional.

288
IRRIGATION
Gross Area under Irrigation in India by States (Cropwise) : 2008-09* No. 13.5 (Contd.) (000 Hectares)
Food Crops Cereals Pulses
State Barley Other Cereals
Total Cereals
Gram Tur/Arhar Other Pulses
Total Pulses
Total food-grains
(10+14) 1 8 9 10 11 12 13 14 15
Andhra Pradesh — — 4,731 13 1 14 28 4,758 Arunachal Pradesh — — 54 — — — — 54 Assam** — — 131 — — — — 131 Bihar ** 2 4 4,376 4 — 10 14 4,390 Jharkhand — 1 80 1 — 2 3 83 Goa — — 16 — — 9 9 25 Gujarat ** 9 9 1,695 50 22 17 89 1,784 Haryana 51 — 3,978 19 27 10 56 4,034 Himachal Pradesh ** 3 1 151 — — 4 5 156 Jammu & Kashmir 4 2 348 — — 4 4 352 Karnataka — — 1,929 125 29 21 175 2,104 Kerala — — 169 — — — — 169 Madhya Pradesh 41 — 3,711 1,474 4 236 1,715 5,426 Chhatisgarh — — 1,357 75 — 7 81 1,438 Maharashtra ** — — 1,680 293 17 13 323 2,003 Manipur** — — 52 — — — — 52 Meghalaya — — 44 — — — — 44 Mizoram — — 11 — — — — 11 Nagaland — — 78 — — — — 79 Orissa — — 2,169 — — 154 154 2,323 Punjab 16 5 6,320 2 6 14 22 6,342 Rajasthan 283 — 2,929 488 1 72 561 3,490 Sikkim ** — — 9 — — — — 9 Tamil Nadu — — 1,984 — 1 29 31 2,014 Tripura ** — — 100 — — 1 1 101 Uttar Pradesh ** 119 5 14,522 81 40 345 466 14,988 Uttarakhand — — 409 1 — 3 3 412 West Bengal ** — 1 3,128 7 — 18 25 3,154 Other Centrally Administered Areas**
— — 56 — — 1 1 57
All India 2008-09 528 29 56,215 2,634 148 984 3,766 59,981 All India 2007-08 475 42 55,479 2,641 156 1,130 3,926 59,405
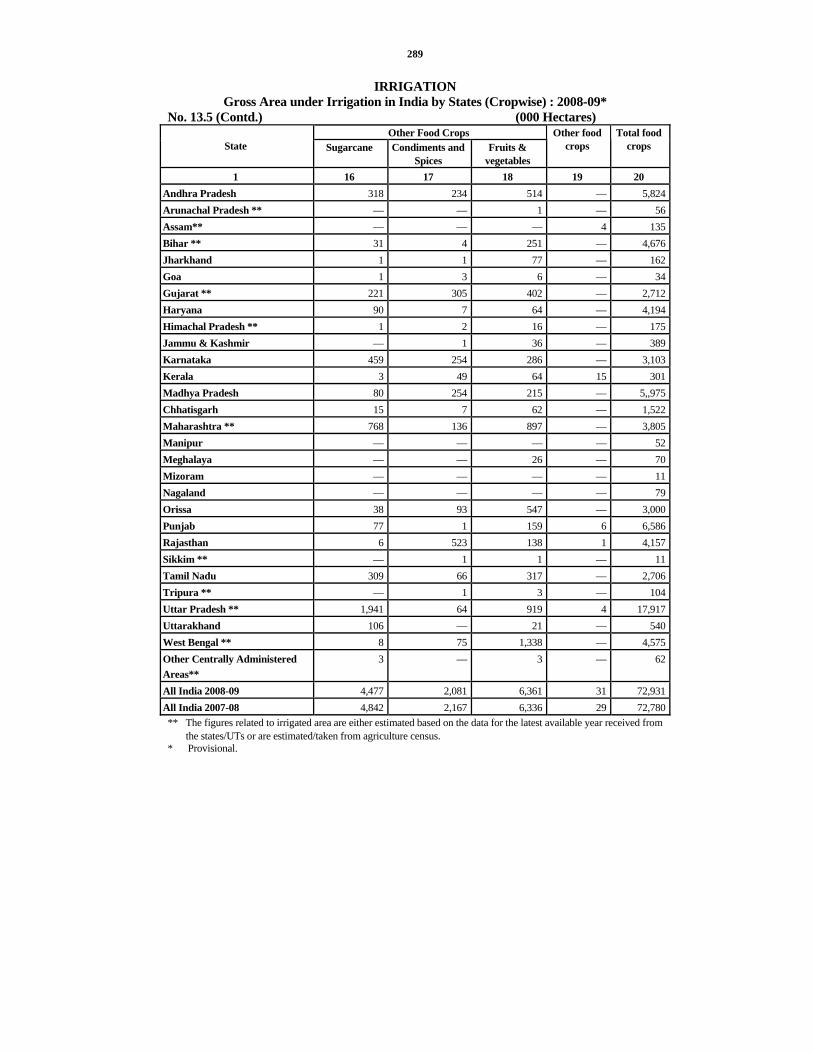
289
IRRIGATION Gross Area under Irrigation in India by States (Cropwise) : 2008-09*
No. 13.5 (Contd.) (000 Hectares) Other Food Crops
State Sugarcane Condiments and Spices
Fruits & vegetables
Other food crops
Total food crops
1 16 17 18 19 20 Andhra Pradesh 318 234 514 — 5,824Arunachal Pradesh ** — — 1 — 56Assam** — — — 4 135Bihar ** 31 4 251 — 4,676Jharkhand 1 1 77 — 162Goa 1 3 6 — 34Gujarat ** 221 305 402 — 2,712Haryana 90 7 64 — 4,194Himachal Pradesh ** 1 2 16 — 175Jammu & Kashmir — 1 36 — 389Karnataka 459 254 286 — 3,103Kerala 3 49 64 15 301Madhya Pradesh 80 254 215 — 5,,975Chhatisgarh 15 7 62 — 1,522Maharashtra ** 768 136 897 — 3,805Manipur — — — — 52Meghalaya — — 26 — 70Mizoram — — — — 11Nagaland — — — — 79Orissa 38 93 547 — 3,000Punjab 77 1 159 6 6,586Rajasthan 6 523 138 1 4,157Sikkim ** — 1 1 — 11Tamil Nadu 309 66 317 — 2,706Tripura ** — 1 3 — 104Uttar Pradesh ** 1,941 64 919 4 17,917Uttarakhand 106 — 21 — 540West Bengal ** 8 75 1,338 — 4,575Other Centrally Administered Areas**
3 — 3 — 62
All India 2008-09 4,477 2,081 6,361 31 72,931All India 2007-08 4,842 2,167 6,336 29 72,780** The figures related to irrigated area are either estimated based on the data for the latest available year received from
the states/UTs or are estimated/taken from agriculture census. * Provisional.

290
IRRIGATION
Gross Area under Irrigation in India by States (Cropwise) : 2008-09* No. 13.5 (Contd.) (000 Hectares)
Non- Food Crops Oil Seeds State
Groundnut Sesamum/ Jingali
Rape seed & mustard
Linseed Others Total Oil Seeds
Cotton
1 21 22 23 24 25 26 27 Andhra Pradesh 294 13 3 1 252 562 255Arunachal Pradesh ** — — — — — — —Assam** — — — — — — —Bihar ** — — 34 1 19 54 —Jharkhand — — 1 — — 2 —Goa 1 — — — 1 2 —Gujarat ** 210 6 280 — 394 891 1,334Haryana 1 2 399 — 8 409 454Himachal Pradesh ** — 1 1 1 — 3 —Jammu & Kashmir — — 46 — — 46 —Karnataka 186 1 — — 482 669 82Kerala — — — — 157 157 —Madhya Pradesh 17 — 390 3 21 432 252Chhatisgarh 4 — 4 — 6 15 —Maharashtra ** 73 — — 2 101 177 86Manipur — — — — — — —Meghalaya — — 3 — — 3 —Mizoram — — — — — — —Nagaland — — 4 — — 4 —Orissa 103 21 25 — 14 164 2Punjab 1 7 25 — 22 54 528Rajasthan 231 15 2,351 2 159 2,758 283Sikkim ** — — — — — — —Tamil Nadu 179 21 — — 353 554 32Tripura ** — — — — — — —Uttar Pradesh ** 2 1 712 1 10 726 3Uttarakhand — — 6 — 1 7 —West Bengal ** — 146 330 — 23 500 3Other Centrally Administered Areas**
1 — — — 1 2 —
All India 2008-09 1,304 235 4,616 10 2,026 8,191 3,314All India 2007-08 1,382 224 4,169 19 1,960 7,753 3,489

291
IRRIGATION Gross Area under Irrigation in India by States (Cropwise) : 2008-09*
No. 13.5 (Concld.) (000 Hectares) Non-Food Crops
Other non- food crops State Tobacco Fodder crops Other non-
food crops Total non- food
crops Total food and non-food crops
(20+31) 1 28 29 30 31 32
Andhra Pradesh 47 19 34 916 6,741Arunachal Pradesh ** — — — — 56Assam** — — 15 16 150Bihar ** 11 — 11 76 4,752Jharkhand — — — 2 164Goa — — — 2 36Gujarat ** 90 221 30 2,566 5,278Haryana — 462 8 1,333 5,528Himachal Pradesh ** — 5 1 9 184Jammu & Kashmir — 35 — 82 471Karnataka 14 6 69 840 3,942Kerala — — — 157 458Madhya Pradesh — 33 22 740 6,714Chhatisgarh — — — 15 1,537Maharashtra ** 1 99 35 397 4,202Manipur — — — — 52Meghalaya — — — 3 73Mizoram — — — — 11Nagaland — — — 4 82Orissa 4 — 6 177 3,177Punjab — 501 55 1,139 7,724Rajasthan 1 542 169 3,753 7,910Sikkim ** — — — — 11Tamil Nadu 5 19 77 687 3,393Tripura ** — — — — 104Uttar Pradesh ** 22 599 254 1,605 19,522Uttarakhand — 22 1 30 570West Bengal ** 12 — 420 934 5,509Other Centrally Administered Areas**
— 2 1 5 67
All India 2008-09 206 2,566 1,210 15,488 88,419All India 2007-08 195 2,545 1,158 15,140 87,920
Source : Economic and Statistical Advisor, Ministry of Agriculture, Government of India.
Note :—Totals may not tally due to rounding off.

292
IRRIGATION Tubewells and Pumping Sets
No. 13.6 Year/District Diesel Sets Electric Sets Total
1 2 3 4 1966-67 — — 25,3111970-71 17,903 86,455 1,04,3581975-76 65,092 1,39,644 2,04,7361980-81 1,09,353 2,22,674 3,32,0271985-86 1,34,136 2,72,282 4,06,4181990-91 1,55,842 3,41,729 4,97,5711993-94 2,14,343 3,17,297 5,31,6401994-95 2,25,485 3,21,731 5,47,2161995-96 2,25,848 3,23,448 5,49,296 2000-01 2,55,302 3,34,171 5,89,4732005-06 2,31,821 3,86,202 6,18,0232009-10(R) 2,36,146 4,67,311 7,03,4572010-11(P) 2,31,146 4,92,311 7,23,457Ambala 5,119 21,197 26,316Panchkula 1,287 3,365 4,652Yamunanagar 6,095 24,770 30,865Kurukshetra 9,365 62,545 71,910Kaithal 19,890 40,882 60,772Karnal 193 40,154 40,347Panipat 3,033 28,896 31,929Sonipat 21,860 22,405 44,265Rohtak 16,580 3,409 19,989Jhajjar 22,288 7,024 29,312Faridabad 2,435 7,626 10,061Palwal 15,608 9,542 25,150Gurgaon 623 23,953 24,576Mewat 8,022 7,635 15,657Rewari 5,502 28,029 33,531Mahendragarh 142 27,266 27,408Bhiwani 23,560 27,614 51,174Jind 19787 30,414 50,201Hisar 20,543 10,558 31,101Fatehabad 9,191 28,821 38,012Sirsa 20,023 36,206 56,229Note : Sets include both pumping sets and tubewells. Source :—Director of Agriculture, Haryana. P—Provisional.

TUBEWELLS AND PUMPING SETS IN HARYANA
(In Lakh)
0.25
7.23
4.98
4.06
3.32
2.05
1.04
7.036.78
6.185.89
5.49
0
1
2
3
4
5
6
7
8
66-67 70-71 75-76 80-81 85-86 90-91 95-96 00-01 05-06 08-09 09-10 10-11

293
IRRIGATION
Irrigation Works in Haryana Principal Results of Operation
No. 13.7 Length of operative canals (in
Miles)* Total capital outlay Direct and Indirect
(` in lakh) Net Revenue
Year
Main canals and branches
Distri-butories
Area of land
irrigated during
the year (000
hectares)
During the year
At the end of
the year
Gross Receipts Directs
and indirect
(` in lakh)
Working expenses
Direct and indirect
(` in lakh)
Amount (` in lakh)
% on Capital outlay
(col. 9 to col. 6)
% of working expenses to receipt (col. 8 to
col. 7)
1 2 3 4 5 6 7 8 9 10 11
1966-67 910 4,708 1,311 91 1,121 387 115 272 24.3 29.7
1970-71 988 4,769 1,437 540 2,278 494 258 173 7.6 52.2
1975-76 1,236 5,569 1,694 1,783 9,882 845 1,147 — — 135.7
1980-81 1,452 6,124 1,818 6,244 36,241 1,009 1,813 — — 179.7
1985-86 1,490 6,377 1,945 12,491 72,928 1,209 2,940 — — 243.2
1990-91 1,494 6,570 1,981 7,621 1,18,062 1,731 4,441 — — 256.6
1995-96 1,494 6,580 1,996 12,504 1,70,031 2,100 8,491 — — 404.3
2000-01 1,518 7,032 2,147 23,101 3,08,289 5,430 8,096 N.A. N.A. 149.1
2005-06 1,518 7,032 2,170 34,067 4,25,350 6,663 13,375 N.A. N.A. 200.7
2008-09 N.A. N.A. 2,164 58,761 5,90,003 7,401 N.A. N.A. N.A. N.A.
2009-10 N.A. N.A. 2,134 50,411 6,40,414 N.A. N.A. N.A. N.A. N.A.Source :—Engineer-in-Chief, Irrigation Department, Haryana.
1. The information relates to both productive and unproductive works. 2. *Miles shown are canal miles of 5,000 feet. 3. The area irrigated includes the area of Delhi State irrigated by Haryana Canals but excludes the area irrigated in
Haryana by Agra Canal system which is maintained by U.P. authorities. 4. N.A.—Not Available. P—Provisional.

294
IRRIGATION Gross Area Irrigated by Canals in Haryana
No. 13.8 (000 Hectares) Year Area Irrigated in
Haryana by Haryana Canals
Area Irrigated in Haryana by Agra
Canals
Total Area Irrigated by Canals in Haryana
Area Irrigated in Delhi State by
Haryana Canals 1 2 3 4 5
1966-67 1,293 32 1,325 181970-71 1,421 26 1,447 161975-76 1,678 27 1,705 161980-81 1,807 33 1,840 111985-86 1,934 33 1,967 111990-91 1,972 33 2,005 91995-96 1,986 40 2,026 102000-01 2,138 50 2,188 92005-06 2,161 25 2,186 92007-08 2,134 25 2,159 92008-09 2,164 29 2,193 202009-10 2,139 23 2,162 19P— Provisional Source :—Engineer-in-Chief, Irrigation, Haryana. N.A.—Not Available.

295
SECTION XIV LIVESTOCK, ANIMAL HUSBANDRY AND DAIRYING
This section contains statistics relating to livestock, veterinary institutions and Government poultry farms, The information regarding livestock is based on quinquennial livestock Census, 2007 conducted by the Director General, Animal Husbandry and Dairying, Haryana.
Tables 14.1 to 14.9 present data in respect of livestock in Haryana.
Tables 14.10 and 14.11 show the number of cattle and poultry per square kilometre and per thousand human population according to estimated population of 2001.
Tables 14.12 and 14.13 indicate the comparative position in respect of livestock and poultry and number of working cattle in various States of India.
Tables 14.14 to 14.21 show the number of veterinary institutions and staff, work done in the institutions, mortality amongst livestock due to various contagious diseases, livestock development centres, number of bulls kept in artificial insemination centres, Intensive Cattle Development Projects, Development of Gaushala and number of recognised slaughter houses.
Tables 14.22 to 14.24 show number of Government Poultry Farms, birds kept and eggs produced therein.
Table 14.25 depicts the data regarding procurement of milk and number of milk plants/milk chilling centres.
Table 14.26 depicts the estimated production of milk and per capita availability of milk per day in Haryana.

296
LIVESTOCK Livestock and Poultry in Haryana : 2007
No. 14.1 District Cattle Buffaloes Horses Ponies Donkeys Mules Sheep
1 2 3 4 5 6 7 8 Ambala 60,835 2,23,347 1,099 144 22 337 18,801Panchkula 27,939 68483 119 18 122 231 2,253Yamunanagar 1,05,662 2,16,328 1,028 226 77 141 13,543Kurukshetra 82,899 2,56,882 1,287 199 33 143 12,808Kaithal 85,017 3,84,470 2,013 364 118 672 21,874Karnal 1,23,432 3,94,261 3,654 356 99 416 23,730Panipat 40,693 2,59,993 1,224 74 35 101 8,845Sonipat 69,646 3,64,913 1,102 216 164 394 14,658Rohtak 54,710 2,77,359 554 273 367 388 24,364Jhajjar 40,001 2,37,963 329 268 297 500 26,176Faridabad 68,728 3,57,705 384 219 140 216 15,666Gurgaon 31,178 1,31,964 828 140 437 244 6,116Mewat 47,536 2,94,574 230 138 343 112 22,490Rewari 27,650 1,74,449 321 257 334 3,780 11,363Mahendragarh 31,554 2,26,398 509 70 127 382 43,511Bhiwani 93,925 4,71,999 1,088 603 822 890 89,517Jind 1,20,926 5,01,938 1,942 439 349 489 44,359Hisar 1,67,573 4,86,057 1,157 306 288 371 82,098Fatehabad 81,545 3,00,344 985 193 117 202 32,158Sirsa 1,90,912 3,23,801 1,241 237 547 591 87,049Total 2007 15,52,361 59,53,228 21,094 4,740 4,838 10,600 6,01,379

297
LIVESTOCK Livestock and Poultry in Haryana : 2007
No. 14.1 (Concld.) District Goats Camels Pigs Domestic Dogs Total Poultry
1 9 10 11 12 13 14 Ambala 6,916 — 5,893 8,566 325,960 6,21,689Panchkula 13,970 37 1,209 5,213 119,594 57,30,293Yamunanagar 13,995 3 6,429 6,622 364,054 15,51,173Kurukshetra 5,374 3 4,113 10,153 373,894 14,38,715Kaithal 6,238 15 10,968 6,555 518,304 6,53,237Karnal 11,454 13 10,057 12,531 580,003 50,97,097Panipat 6,465 23 7,698 5,438 330,589 15,81,231Sonipat 9,828 12 12,479 4,316 477,728 15,67,100Rohtak 10,617 108 9,884 7,750 386,374 4,19,148Jhajjar 13,848 304 6,056 17,576 343,318 1,40,207Faridabad 24,180 9 8,981 11,018 487,246 65,572Gurgaon 14,207 163 8,364 10,239 203,880 9,34,563Mewat 83,169 410 2,315 2,449 453,766 1,24,016Rewari 31,033 2,421 1,372 8,019 260,999 4,96,238Mahendragarh 78,716 5,487 755 3,104 390,613 3,95,019Bhiwani 89,854 11,696 8,094 16,197 784,685 7,94,720Jind 9,924 343 15,545 832 697,086 42,41,226Hisar 30,959 2,836 10,238 14,927 796,810 23,72,896Fatehabad 16,121 3,595 2,321 15,983 453,564 2,90,454Sirsa 61,452 11,130 750 23,962 701,672 2,70,903Total 2007 5,38,320 38,608 1,33,521 1,91,450 90,50,139 2,87,85,497
Source :—Director General, Animal Husbandry and Dairying, Haryana.

298
LIVESTOCK Cattle in Haryana : 2007
No. 14.2 Indigenous male cattle over 3 years Indigenous female cattle over 3 years
District For Breeding
only
For agriculture
and Breeding
For Bullock cart and Breeding
Others In Milk Dry Not
calved once
Others
1 2 3 4 5 6 7 8 9 Ambala 220 2,631 3,271 1,109 7,690 3,710 822 599Panchkula 78 5,692 799 2,936 5,130 2,144 561 513Yamunanagar 146 3,217 1,590 842 11,397 4,082 1,310 716Kurukshetra 63 320 1,184 630 5,205 3,130 598 97Kaithal 206 5,457 11,705 4,645 12,166 5,834 1,502 475Karnal 111 740 1,614 571 10,058 6,786 1,066 447Panipat 203 758 848 328 7,192 3,467 812 395Sonipat 254 1,028 2,534 634 12,744 7,907 710 450Rohtak 216 3,818 9,026 3,729 7,961 2,915 596 812Jhajjar 209 568 1,974 303 7,379 3,862 1,125 552Faridabad 177 645 2,969 484 16,322 5,263 969 316Gurgaon 72 191 240 108 6,000 2,293 387 830Mewat 96 613 1,224 315 13,298 5,577 797 287Rewari 50 197 189 66 6,401 1,981 313 316Mahendragarh 179 148 234 175 6,024 4,081 1,347 280Bhiwani 305 5,131 6,098 3,475 18,581 7,127 2,967 767Jind 3,698 10,229 17,589 18,363 16,373 10,363 1,428 441Hisar 348 23,228 16,523 35,678 19,214 11,999 2,530 2,337Fatehabad 412 9,881 8,804 8,677 9,459 5,655 1,125 381Sirsa 352 1,168 12,311 3,863 29,125 13,851 2,658 1,495Total 2007 7,395 75,660 100,726 86,931 227,719 112,027 23,623 12,506
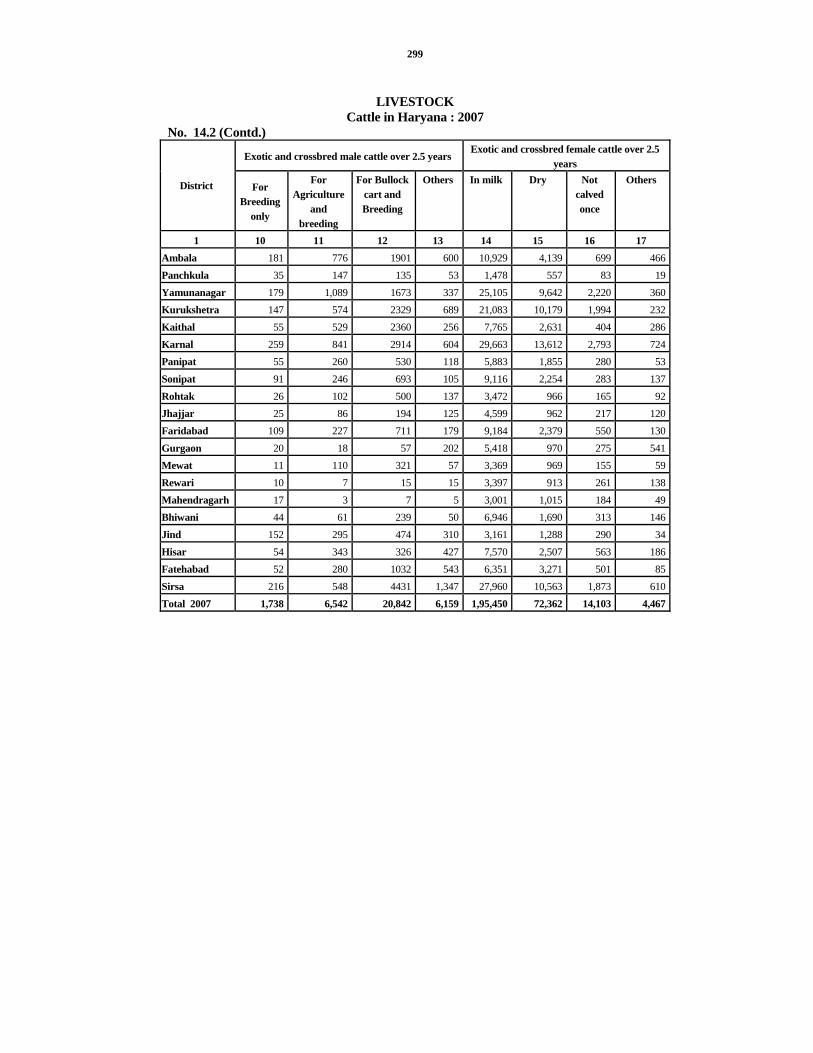
299
LIVESTOCK
Cattle in Haryana : 2007 No. 14.2 (Contd.)
Exotic and crossbred male cattle over 2.5 years Exotic and crossbred female cattle over 2.5
years
District For Breeding
only
For Agriculture
and breeding
For Bullock cart and Breeding
Others In milk Dry Not calved once
Others
1 10 11 12 13 14 15 16 17 Ambala 181 776 1901 600 10,929 4,139 699 466Panchkula 35 147 135 53 1,478 557 83 19Yamunanagar 179 1,089 1673 337 25,105 9,642 2,220 360Kurukshetra 147 574 2329 689 21,083 10,179 1,994 232Kaithal 55 529 2360 256 7,765 2,631 404 286Karnal 259 841 2914 604 29,663 13,612 2,793 724Panipat 55 260 530 118 5,883 1,855 280 53Sonipat 91 246 693 105 9,116 2,254 283 137Rohtak 26 102 500 137 3,472 966 165 92Jhajjar 25 86 194 125 4,599 962 217 120Faridabad 109 227 711 179 9,184 2,379 550 130Gurgaon 20 18 57 202 5,418 970 275 541Mewat 11 110 321 57 3,369 969 155 59Rewari 10 7 15 15 3,397 913 261 138Mahendragarh 17 3 7 5 3,001 1,015 184 49Bhiwani 44 61 239 50 6,946 1,690 313 146Jind 152 295 474 310 3,161 1,288 290 34Hisar 54 343 326 427 7,570 2,507 563 186Fatehabad 52 280 1032 543 6,351 3,271 501 85Sirsa 216 548 4431 1,347 27,960 10,563 1,873 610Total 2007 1,738 6,542 20,842 6,159 1,95,450 72,362 14,103 4,467

300
LIVESTOCK Cattle in Haryana : 2007
No. 14.2 (Concld.)
Calves under one year
Indigenous Calves under one year
Exotic and Crossbreed calves
one to 2.5 years
Indigenous calves one to 3 years District
Male Female Male Female Male Female Male Female
Total Cattle
1 18 19 20 21 22 23 24 25 26 Ambala 2,149 4,917 1,583 3,393 1,032 4,129 1,046 2,843 60,835 Panchkula 324 606 1,619 1,937 149 515 979 1,450 27,939 Yamunanagar 5,450 12,206 2,505 5,599 1,976 8,941 1,375 3,705 1,05,662 Kurukshetra 4,354 11,455 1,201 2,568 1,489 10,244 550 2,584 82,899 Kaithal 1,907 4,033 4,333 5,900 707 2,760 3,393 5,708 85,017 Karnal 6,827 15,709 2,669 5,204 2,519 12,126 1,246 4,329 1,23,432 Panipat 1,568 3,271 2,253 3,706 544 1,825 1,924 2,565 40,693 Sonipat 2,917 5,131 3,990 6,842 755 2,895 2,617 5,313 69,646 Rohtak 1,398 1,970 3,664 4,458 567 1,271 4,153 2,696 54,710 Jhajjar 1,446 2,824 2,486 4,751 373 1,580 982 3,259 40,001 Faridabad 2,417 4,241 4,359 7,800 645 2,238 1,814 4,600 68,728 Gurgaon 1,319 2,759 2,044 3,170 130 1,593 585 1,956 31,178 Mewat 1,276 1,847 4,775 6,693 223 802 1,258 3,404 47,536 Rewari 953 2,011 2,153 3,733 84 1,302 412 2,733 27,650 Mahendragarh 831 1,736 1,946 4,228 62 1,350 911 3,741 31,554 Bhiwani 2,183 4,054 7,284 10,578 479 2,699 4,190 8,518 93,925 Jind 1,015 1,780 7,974 8,673 390 1,470 7,778 7,358 1,20,926 Hisar 2,452 4,247 7,342 10,757 645 3,161 7,671 7,465 1,67,573 Fatehabad 2,323 3,564 3,185 5,245 479 3,023 2,368 4,849 81,545 Sirsa 6,949 14,191 8,508 15,863 1,386 13,388 3,028 15,228 1,90,912 Total 2007 50,058 1,02,552 75,873 1,21,098 14,634 77,312 48,280 94,304 15,52,361
Source :—Director General, Animal Husbandry and Dairying, Haryana.
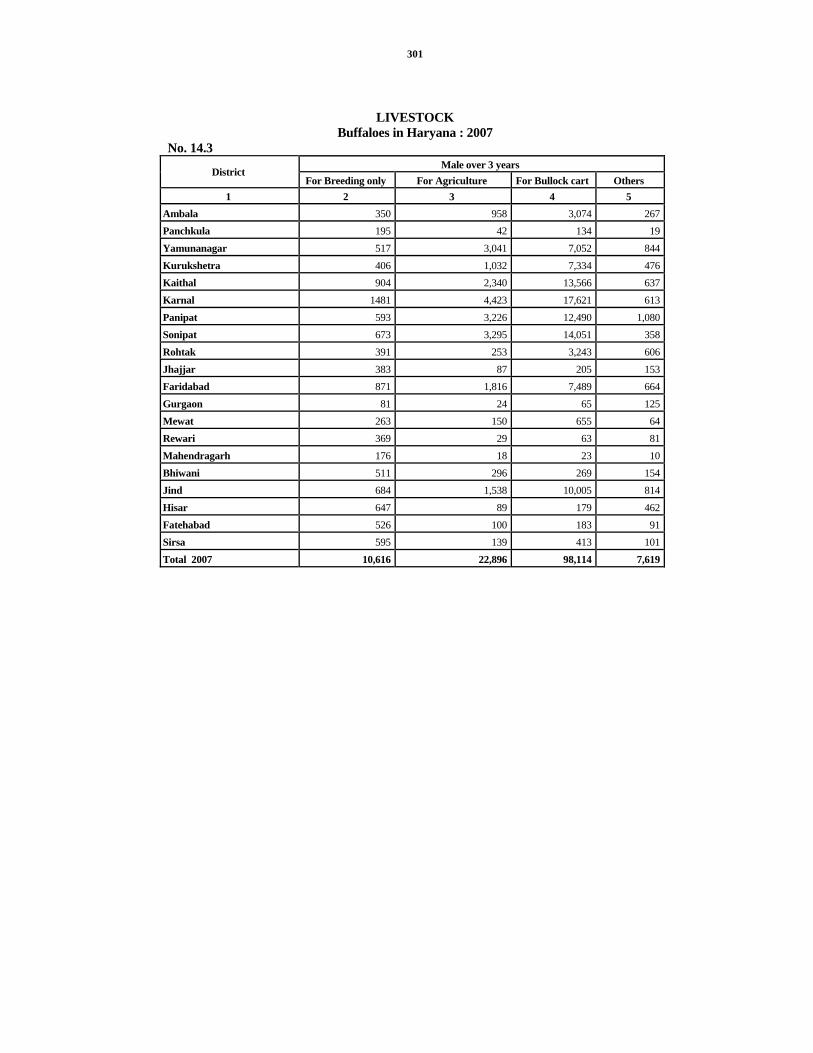
301
LIVESTOCK Buffaloes in Haryana : 2007
No. 14.3 Male over 3 years
District For Breeding only For Agriculture For Bullock cart Others
1 2 3 4 5 Ambala 350 958 3,074 267Panchkula 195 42 134 19Yamunanagar 517 3,041 7,052 844Kurukshetra 406 1,032 7,334 476Kaithal 904 2,340 13,566 637Karnal 1481 4,423 17,621 613Panipat 593 3,226 12,490 1,080Sonipat 673 3,295 14,051 358Rohtak 391 253 3,243 606Jhajjar 383 87 205 153Faridabad 871 1,816 7,489 664Gurgaon 81 24 65 125Mewat 263 150 655 64Rewari 369 29 63 81Mahendragarh 176 18 23 10Bhiwani 511 296 269 154Jind 684 1,538 10,005 814Hisar 647 89 179 462Fatehabad 526 100 183 91Sirsa 595 139 413 101Total 2007 10,616 22,896 98,114 7,619

302
LIVESTOCK Buffaloes in Haryana : 2007
No. 14.3 (Concld.) Female over 3 years
Calves under one year Calves one to three years District
In Milk Dry Not yet calved
Others Male Female Male Female Total
Buffaloes
1 6 7 8 9 10 11 12 13 14 Ambala 83559 29,634 4,915 1,877 20,460 41,214 4,941 32,098 2,23,347 Panchkula 28310 8,414 1,715 471 6,442 12,005 1,074 9,662 68,483 Yamunanagar 68956 22,682 7,264 1,442 21,148 42,323 7,945 33,114 2,16,328 Kurukshetra 84178 35,323 8,202 1,408 23,757 44,511 7,118 43,137 2,56,882 Kaithal 117996 53,783 11,126 3,048 38,641 63,926 11,301 67,202 3,84,470 Karnal 118328 57,104 14,095 3,387 36,900 63,109 14,608 62,592 3,94,261 Panipat 83159 28,385 8,312 807 29,597 44,226 11,978 36,140 2,59,993 Sonipat 121473 37,530 6,447 2,385 43,687 64,100 16,822 54,092 3,64,913 Rohtak 93911 29,038 4,724 — 33,130 53,995 9,083 48,985 2,77,359 Jhajjar 83978 21,451 5,815 947 31,076 47,950 3,645 42,273 2,37,963 Faridabad 139687 42,918 9,331 1,984 37,159 66,740 9,135 39,911 3,57,705 Gurgaon 54582 11,827 2,285 308 16,374 27,882 954 17,457 1,31,964 Mewat 110357 37,641 7,764 1,631 36,501 60,172 5,172 34,204 2,94,574 Rewari 60997 19,473 3,287 1,444 19,621 36,980 645 31,460 1,74,449 Mahendragarh 80661 25,696 4,019 1,169 22,905 48,081 868 42,772 2,26,398 Bhiwani 149628 50,502 11,630 1,844 49,941 91,942 3,721 111,561 4,71,999 Jind 149042 64,449 17,270 3,008 53,821 86,212 16,169 98,926 5,01,938 Hisar 158090 56,317 15,273 4,516 56,780 93,410 8,971 91,323 4,86,057 Fatehabad 96535 39,973 8,746 1,180 29,987 54,183 2,940 65,900 3,00,344 Sirsa 103866 44,615 9,830 2,665 29,173 58,334 2,832 71,238 3,23,801 Total 2007 19,87,293 7,16,755 1,62,050 35,521 6,37,100 11,01,295 1,39,922 10,34,047 59,53,228
Source :—Director General, Animal Husbandry and Dairying, Haryana.

303
LIVESTOCK Horses in Haryana : 2007
No. 14.4 Under three years Three years and above
Male District Male Female
For cart For sports Female
Total
1 2 3 4 5 6 7 Ambala 152 153 249 31 514 1,099Panchkula 9 15 26 3 66 119Yamunanagar 102 155 281 20 470 1,028Kurukshetra 138 239 333 21 556 1,287Kaithal 275 325 609 68 736 2,013Karnal 414 847 745 316 1,332 3,654Panipat 131 171 226 24 672 1,224Sonipat 106 197 230 26 543 1,102Rohtak 73 108 117 15 241 554Jhajjar 52 76 44 4 153 329Faridabad 45 60 73 6 200 384Gurgaon 146 157 71 99 355 828Mewat 28 24 87 5 86 230Rewari 34 40 92 2 153 321Mahendragarh 20 79 99 3 308 509Bhiwani 195 224 158 43 468 1,088Jind 238 397 411 49 847 1,942Hisar 153 277 164 37 526 1,157Fatehabad 121 216 143 57 448 985Sirsa 138 259 143 43 658 1,241Total 2007 2,570 4,019 4,301 872 9,332 21,094
Source :—Director General, Animal Husbandry and Dairying, Haryana.

304
LIVESTOCK Ponies in Haryana : 2007
No. 14.5 Under three years Three years and above
Male District Male Female
For cart For sports Female
Total
1 2 3 4 5 6 7 Ambala 59 20 27 — 38 144Panchkula — — 8 — 10 18Yamunanagar 16 13 117 10 70 226Kurukshetra 93 8 52 1 45 199Kaithal 19 27 180 2 136 364Karnal 46 29 119 28 134 356Panipat 17 19 30 8 74Sonipat 42 36 75 1 62 216Rohtak 15 15 187 — 56 273Jhajjar 56 17 154 7 34 268Faridabad 42 9 149 2 17 219Gurgaon 13 12 90 6 19 140Mewat 7 13 101 7 10 138Rewari 59 9 150 5 34 257Mahendragarh 27 4 32 — 7 70Bhiwani 181 61 257 4 100 603Jind 54 46 210 16 113 439Hisar 23 28 179 2 74 306Fatehabad 12 20 108 5 48 193Sirsa 46 13 146 1 31 237Total 2007 827 399 2,371 97 1,046 4,740
Source :-Director General, Animal Husbandry and Dairying, Haryana.

305
LIVESTOCK Donkeys and Mules in Haryana : 2007
No. 14.6 Donkeys Mules
under 3 years 3 years and above Under 3 years and
above District
Male Female Male Female Total
Male Female Total
1 2 3 4 5 6 7 8 9 Ambala — 6 9 7 22 57 280 337Panchkula 8 16 35 63 122 16 215 231Yamunanagar 4 28 21 24 77 12 129 141Kurukshetra 7 3 20 3 33 38 105 143Kaithal 13 27 46 32 118 173 499 672Karnal 38 13 28 20 99 185 231 416Panipat 2 — 32 1 35 26 75 101Sonipat 36 23 55 50 164 87 307 394Rohtak 59 26 175 107 367 98 290 388Jhajjar 46 11 139 101 297 80 420 500Faridabad 14 15 68 43 140 64 152 216Gurgaon 63 70 179 125 437 69 175 244Mewat 46 64 136 97 343 29 83 112Rewari 42 29 165 98 334 1 3,779 3,780Mahendragarh 20 17 62 28 127 68 314 382Bhiwani 111 51 514 146 822 226 664 890Jind 21 5 302 21 349 52 437 489Hisar 58 35 116 79 288 44 327 371Fatehabad 5 6 59 47 117 28 174 202Sirsa 32 63 151 301 547 45 546 591Total 2007 625 508 2,312 1,393 4,838 1,398 9,202 10,600
Source :—Director General, Animal Husbandry and Dairying, Haryana.

306
LIVESTOCK Sheep in Haryana : 2007
No. 14.7 Under 6 months 6 months and above
Indigenous Crossbreed/ Exotic Indigenous Crossbreed/ Exotic District
Male Female Male Female Male Female Male Female
Total
1 2 3 4 5 6 7 8 9 10 Ambala 1297 3,707 243 488 1,373 9,583 174 1,936 18,801Panchkula 211 358 4 40 134 1,365 6 135 2,253Yamunanagar 1201 2,978 10 549 1,146 7,066 21 572 13,543Kurukshetra 940 2,590 68 139 972 7,714 90 295 12,808Kaithal 2156 3,989 77 185 2,088 12,996 59 324 21,874Karnal 2340 4,116 92 360 1,827 13,948 168 879 23,730Panipat 697 1,352 150 233 833 4,632 215 733 8,845Sonipat 1505 2,755 77 104 1,397 8,414 54 352 14,658Rohtak 3048 4,471 35 117 2,166 14,303 11 213 24,364Jhajjar 2465 6,049 215 335 1,901 14,176 160 875 26,176Faridabad 1540 2,921 35 107 1,617 8,988 38 420 15,666Gurgaon 701 1,302 27 90 614 3,054 23 305 6,116Mewat 2266 4,364 23 82 2,162 13,369 49 175 22,490Rewari 1180 1,894 35 25 659 7,430 13 127 11,363Mahendragarh 4065 8,041 262 494 2,415 27,089 121 1,024 43,511Bhiwani 10817 17,314 445 281 5,388 53,798 291 1,183 89,517Jind 4088 8,250 189 326 2,964 27,203 136 1,203 44,359Hisar 7515 15,222 331 697 5,256 49,940 519 2,618 82,098Fatehabad 3251 5,585 25 94 2,329 20,614 111 149 32,158Sirsa 8055 15,759 94 156 5,754 56,403 78 750 87,049Total 2007 59,338 113,017 2,437 4,902 42,995 362,085 2,337 14,268 601,379
Source :—Director General, Animal Husbandry and Dairying, Haryana.

307
GOATS, CAMELS AND PIGS IN
HARYANA

308
LIVESTOCK Goats Camels and Pigs in Haryana : 2007
No. 14.8 One year and above Goats Under one year Goats
Female District Male
In milk Dry Not calved
once Male Female
Total Goats
1 2 3 4 5 6 7 8 Ambala 712 2,686 1,316 193 695 1,314 6,916Panchkula 1216 4,787 2,813 1,255 1,480 2,419 13,970Yamunanagar 1134 4,806 2,521 1,497 1,670 2,367 13,995Kurukshetra 371 1,807 1,274 349 481 1,092 5,374Kaithal 608 1,999 1,369 438 562 1,262 6,238Karnal 956 3,608 2,638 576 1,312 2,364 11,454Panipat 800 2,067 1,247 268 844 1,239 6,465Sonipat 746 3,757 2,133 197 1,088 1,907 9,828Rohtak 760 3,941 2,202 555 1,068 2,091 10,617Jhajjar 785 4,921 3,120 359 1,430 3,233 13,848Faridabad 2248 9,293 4,649 625 3,173 4,192 24,180Gurgaon 821 5,473 3,180 431 1,565 2,737 14,207Mewat 6434 29,107 18,778 4,019 10,518 14,313 83,169Rewari 1222 10,815 8,327 1,348 3,404 5,917 31,033Mahendragarh 2160 31,142 17,779 2,163 9,731 15,741 78,716Bhiwani 4872 31,043 20,306 4,570 11,171 17,892 89,854Jind 629 3,251 2,477 429 1,043 2,095 9,924Hisar 2217 10,789 6,848 1,381 3,419 6,305 30,959Fatehabad 1157 5,168 4,234 776 1,833 2,953 16,121Sirsa 2781 21,949 16,252 2,953 5,674 11,843 61,452Total 2007 32,629 192,409 123,463 24,382 62,161 103,276 538,320

309
LIVESTOCK
Goats Camels and Pigs in Haryana : 2007 No. 14.8 (Concld.)
Camels Four years and above Under four year District
Male Female Male Female Total
Camels Pigs Dogs Rabbits
9 10 11 12 13 14 15 16 Ambala — — — — — 5,893 8,566 125Panchkula 28 2 6 1 37 1,209 5,213 20Yamunanagar — 3 — — 3 6,429 6,622 74Kurukshetra — — 3 — 3 4,113 10,153 30Kaithal 10 2 1 2 15 10,968 6,555 29Karnal 4 7 1 1 13 10,057 12,531 69Panipat 8 9 2 4 23 7,698 5,438 14Sonipat 12 — — — 12 12,479 4,316 19Rohtak 30 40 22 16 108 9,884 7,750 69Jhajjar 102 142 28 32 304 6,056 17,576 19Faridabad 7 2 — — 9 8,981 11,018 140Gurgaon 62 36 40 25 163 8,364 10,239 51Mewat 352 21 37 — 410 2,315 2,449 320Rewari 874 1,214 189 144 2,421 1,372 8,019 —Mahendragarh 2072 2,426 482 507 5,487 755 3,104 3Bhiwani 2208 6,915 978 1,595 11,696 8,094 16,197 11Jind 73 206 15 49 343 15,545 832 1Hisar 361 2,169 72 234 2,836 10,238 14,927 49Fatehabad 544 2,758 78 215 3,595 2,321 15,983 58Sirsa 1886 8,141 320 783 11,130 750 23,962 18Total 2007 8,633 24,093 2,274 3,608 38,608 133,521 191,450 1,119
Source :—Director General, Animal Husbandry and Dairying, Haryana.

310
LIVESTOCK Fowls, Ducks and other Poultry in Haryana : 2007
No. 14.9 Backyard Poultry
Fowls Ducks District Hens Cocks Chickens Ducks Drakes Duckling
Others Total
Backyard Poultry
Total Farm Poultry
Grand Total
1 2 3 4 5 6 7 8 9 10 11 Ambala 3,608 2,044 18,459 — 42 — 232 24,385 597,304 6,21,689 Panchkula 383 190 183 — — — 66 822 57,29,471 57,30,293 Yamunanagar 1,353 652 700 10 20 7 6 2,748 15,48,425 15,51,173 Kurukshetra 1,734 1,377 23,165 41 36 5 57 26,415 14,12,300 14,38,715 Kaithal 42,527 2,080 17,686 15 23 4 2 62,337 5,90,900 6,53,237 Karnal 2,989 1,590 2,832 13 111 2 120 7,657 50,89,440 50,97,097 Panipat 5,821 2,131 2,968 — — 4 4 10,928 15,70,303 15,81,231 Sonipat 2,882 1,818 1,021 9 12 2 2 5,746 15,61,354 15,67,100 Rohtak 2,255 1,408 13,323 5 307 4 446 17,748 4,01,400 4,19,148 Jhajjar 775 1,142 7,179 4 7 — 100 9,207 1,31,000 1,40,207 Faridabad 4,402 2,235 995 32 43 3 62 7,772 57,800 65,572 Gurgaon 608 300 606 6 9 — 34 1,563 9,33,000 9,34,563 Mewat 17,935 8,925 19,168 91 100 33 25 46,277 77,739 1,24,016 Rewari 2,905 3,001 2,707 8 17 — — 8,638 4,87,600 4,96,238 Mahendragarh 607 225 136 — — — — 968 3,94,051 3,95,019 Bhiwani 1,304 1,405 1,132 3 22 12 222 4,100 7,90,620 7,94,720 Jind 40,600 2,347 27,447 19 37 12 39 70,501 41,70,725 42,41,226 Hisar 1,535 1,108 546 10 14 2 170 3,385 23,69,511 23,72,896 Fatehabad 1,318 1,050 431 32 51 — 2 2,884 2,87,570 2,90,454 Sirsa 3,853 2,079 907 21 23 38 325 7,246 2,63,657 2,70,903 Total 2007 1,39,394 37,107 141,591 319 874 128 1,914 321,327 2,84,64,170 2,87,85,497
Source :—Director General, Animal Husbandry and Dairying, Haryana.
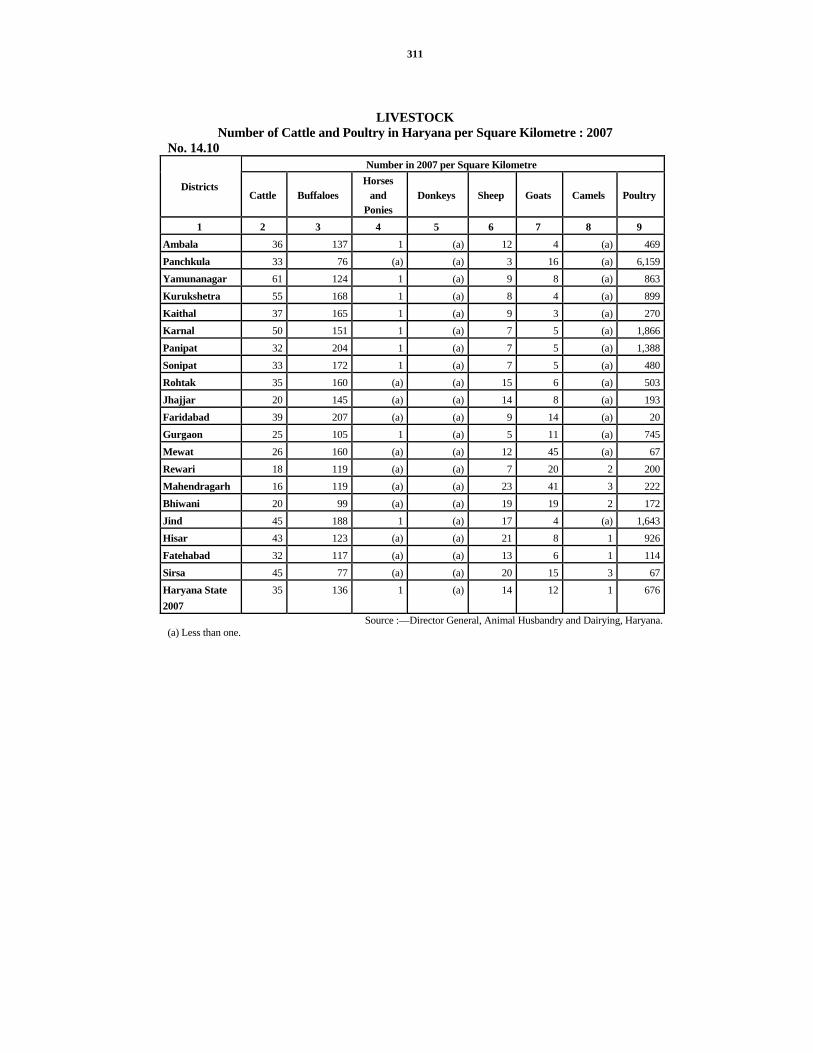
311
LIVESTOCK Number of Cattle and Poultry in Haryana per Square Kilometre : 2007
No. 14.10 Number in 2007 per Square Kilometre
Districts Cattle Buffaloes
Horses and
Ponies Donkeys Sheep Goats Camels Poultry
1 2 3 4 5 6 7 8 9 Ambala 36 137 1 (a) 12 4 (a) 469Panchkula 33 76 (a) (a) 3 16 (a) 6,159 Yamunanagar 61 124 1 (a) 9 8 (a) 863 Kurukshetra 55 168 1 (a) 8 4 (a) 899 Kaithal 37 165 1 (a) 9 3 (a) 270 Karnal 50 151 1 (a) 7 5 (a) 1,866 Panipat 32 204 1 (a) 7 5 (a) 1,388 Sonipat 33 172 1 (a) 7 5 (a) 480 Rohtak 35 160 (a) (a) 15 6 (a) 503Jhajjar 20 145 (a) (a) 14 8 (a) 193 Faridabad 39 207 (a) (a) 9 14 (a) 20 Gurgaon 25 105 1 (a) 5 11 (a) 745Mewat 26 160 (a) (a) 12 45 (a) 67 Rewari 18 119 (a) (a) 7 20 2 200 Mahendragarh 16 119 (a) (a) 23 41 3 222Bhiwani 20 99 (a) (a) 19 19 2 172 Jind 45 188 1 (a) 17 4 (a) 1,643 Hisar 43 123 (a) (a) 21 8 1 926Fatehabad 32 117 (a) (a) 13 6 1 114 Sirsa 45 77 (a) (a) 20 15 3 67Haryana State 2007
35 136 1 (a) 14 12 1 676
Source :—Director General, Animal Husbandry and Dairying, Haryana. (a) Less than one.

312
LIVESTOCK Number of Cattle and Poultry in Haryana per thousand Human beings : 2007
No. 14.11 Number in 2007 per thousand human beings*
District Cattle Buffaloes
Horses and Ponies
Donkeys Sheep Goats Camels Poultry
1 2 3 4 5 6 7 8 9 Ambala 55 213 1 (a) 19 7 (a) 728Panchkula 62 146 (a) (a) 5 30 (a) 11,807 Yamunanagar 103 211 1 (a) 15 14 (a) 1,464 Kurukshetra 101 311 2 (a) 16 7 (a) 1,667 Kaithal 91 404 3 (a) 23 7 (a) 662 Karnal 98 299 2 (a) 14 9 (a) 3,690 Panipat 42 267 1 (a) 9 7 (a) 1,820 Sonipat 54 285 1 (a) 12 8 (a) 796 Rohtak 66 297 1 (a) 27 11 (a) 934Jhajjar 42 302 (a) (a) 29 17 1 403 Faridabad 35 182 (a) (a) 8 12 (a) 17 Gurgaon 36 152 1 (a) 7 16 (a) 1,073Mewat 48 299 (a) (a) 23 84 (a) 125 Rewari 37 247 1 1 16 41 3 417 Mahendragarh 37 279 (a) (a) 54 97 7 519Bhiwani 66 331 1 1 63 63 8 577 Jind 102 428 2 (a) 38 8 (a) 3,732 Hisar 112 318 1 (a) 55 21 2 2,400Fatehabad 100 369 1 (a) 40 20 4 360 Sirsa 173 293 1 (a) 78 57 10 255Haryana State 2007
74 283 1 (a) 29 26 2 1,413
Source :—Director General, Animal Husbandry and Dairying, Haryana. *Based on population of 2001. (a) Less than one.

313
LIVESTOCK Number of Livestock and Poultry in various States of India : 2007(P)
No. 14.12 (Number 000)
State Cattle Buffaloes Sheep Goats Horses
and PoniesOthers*
Total Livestock
Poultry
1 2 3 4 5 6 7 8 9 Andhra Pradesh 11223 13272 25539 9626 26 489 60175 123981Arunachal Pradesh
503 3 20 292 6 589 1413 1348
Assam 10041 500 354 4320 11 2000 17227 29060Bihar 12559 6690 218 10167 51 656 30342 11420Jharkhand 8781 1506 483 6592 5 733 18100 11231Gujarat 7976 8774 2002 4640 14 110 23515 13352Goa 71 37 — 11 — 58 177 505Haryana 1552 5953 601 538 26 189 8859 28785Himachal Pradesh
2269 762 901 1241 13 30 5217 810
Jammu & Kashmir
3443 1050 4127 2068 167 131 10987 6683
Karnataka 10503 4327 9558 6153 11 307 30859 42068Kerala 1740 58 1 1729 — 59 3587 15686Madhya Pradesh 21915 9129 390 9014 27 220 40696 7387Chhatisgarh 9491 1604 140 2768 1 413 14418 14246Maharashtra 16184 6073 2909 10391 38 359 35954 64756Manipur 342 62 9 51 1 324 789 2403Meghalaya 887 23 21 365 2 524 1823 3093Mizoram 35 6 1 16 1 269 328 1239Nagaland 470 35 4 178 1 731 1419 3156Orissa 12310 1190 1818 7127 — 612 23057 20600
(P) Provisional.

314
LIVESTOCK Number of Livestock and Poultry in various States of India : 2007
No. 14.12 (Concld.) (Number 000)
States Cattle Buffaloes Sheep Goats Horses
and Ponies
Others* Total
Livestock Poultry
1 2 3 4 5 6 7 8 9 Punjab 1777 5062 208 290 33 39 7408 10685Rajasthan 12120 11092 11190 21503 25 734 56663 4946Sikkim 135 — 3 92 — 40 270 157Tamil Nadu 11189 2009 7991 9275 7 289 30759 128108Tripura 954 14 4 633 — 264 1869 3701Uttar Pradesh 18883 23812 1188 14793 122 1474 60272 8754Uttaranchal 2235 1220 290 1335 15 45 5141 2602West Bengal 19188 764 1577 15069 6 815 37419 86210Union Territories 299 316 10 262 1 69 958 1859All India 2007 199075 105343 71558 140537 611 12573 529698 648830All India 2003 185181 97922 61469 124358 751 15320 485002 489012All India 1997 198882 89918 57494 122721 826 15539 485384 347611
Source :—Ministry of Agriculture, Department of Animal Husbandry, Dairying & Fisheries Government of India, New Delhi.
* Dogs are not included. Note :-Totals may not tally due to rounding off of the figures.

315
LIVESTOCK Working cattle in various States of India : 2003
No. 14.13 (Number 000) State Cattle Buffaloes Total cattle & Buffaloes
used for work only 1 2 3 4
Andhra Pradesh 35,79 4,01 39,80Arunachal Pradesh 89 1 90Assam 21,55 1,69 23,24Bihar 22,05 2,19 24,24Chhatisgarh 29,48 9,08 38,56Delhi — 3 3Gujarat 24,93 79 25,72Goa 22 5 27Haryana 2,81 1,41 4,22Himachal Pradesh 6,44 1 6,45Jammu & Kashmir 4,75 31 5,06Jharkhand 31,66 5,54 37,20Karnataka 28,73 1,08 29,81Kerala 11 8 19Madhya Pradesh 62,11 2,04 64,15Maharashtra 59,50 1,97 61,47Manipur 1,27 18 1,45Meghalaya 1,72 6 1,78Mizoram 4 1 5Nagaland 32 10 42Orissa 49,05 5,38 54,43Punjab 2,24 72 2,96Rajasthan 21,03 42 21,45Sikkim 20 — 20Tamil Nadu 9,31 31 9,62Tripura 1,80 4 1,84Uttar Pradesh 52,33 14,62 66,95Uttranchal 6,24 33 6,57West Bengal 50,62 5,82 56,44Union Territories 50 6 56All India 2003 5,27,69 58,34 5,86,03
Source :—Ministry of Agriculture, Department of Animal Husbandry, Dairying & Fisheries Government of India, New Delhi.
Note :- The figures are only in respect of male cattle and buffaloes as the data in respect of female cattle and buffaloes are not being collected by the source agency.

316
ANIMAL HUSBANDRY Veterinary Institutions Functioning
No. 14.14
Year/District
GVH RAIC GVD SMC/ KVC
Sheep Wool
Extension Centres
Poultry Farms/ PEC/ IDB Poultry-cum-Pigery Centres
Piggery Farms
Horse Breeding Centre
Gosadan
1 2 3 4 5 6 7 8 9 10 1966-67 125 17 66 97 23 17 — — 11970-71 154 37 71 337 25 13 2 — 21980-81 301 60 273 765 29 22 2 1 11990-91 495 60 679 777 59 22 2 1 21995-96 546 60 859 751 59 22 2 1 22000-01 579 60 853 751 59 22 2 1 22005-06 673 60 999 745 59 35 2 1 22009-10 942 — 1,809 — — — 2 — 22010-11 942 — 1,809 — — — 2 — 2Ambala 37 — 94 — — — 1 — 1Panchkula 15 — 30 — — — — — —Yamunanagar 24 — 64 — — — — — —Kurukshetra 47 — 73 — — — — — —Kaithal 41 — 81 — — — — — —Karnal 49 — 134 — — — — — —Panipat 34 — 73 — — — — — —Sonipat 51 — 87 — — — — — —Rohtak 64 — 35 — — — — — —Jhajjar 90 — 53 — — — — — —Faridabad 16 — 45 — — — — — —Palwal 20 — 92 — — — — — —Gurgaon 21 — 46 — — — — — —Mewat 21 — 65 — — — — — —Rewari 49 — 61 — — — — — —Mahendragarh 51 — 59 — — — — — —Bhiwani 74 — 146 — — — — — —Jind 60 — 172 — — — — — —Hisar 70 — 140 — — — 1 — 1Fatehabad 49 — 87 — — — — — —Sirsa 59 — 172 — — — — — —
Source :—Director General, Animal Husbandry and Dairying, Haryana. GVH—Govt, Veterinary Hospital. RAIC—Regional Artificial Insemination Centre. GVD—Govt, Veterinary Dispensary. SMC/KVC—Stockmen Centre/Key Village Centre. PEC—Poultry Extention Centre includes 12 PEC and one Poultry Farm (22+13=35).

317
ANIMAL HUSBANDRY Staff of Veterinary Institutions in Haryana
No. 14.15
Year/District
Number of Veterinary Surgeons
Number of Animal
Husbandary Assistants
Number of Compounders of
Provincialized Dispensaries
Number of VLDA
Number of Dressers and
Farriers
Other Class IV
1 2 3 4 5 6 7 1966-67 115 9 79 77 23 —1970-71 154 2 120 14 30 —1980-81 322 4 312 907 22 2,5461990-91 548 — — 2,665 20 4,0181995-96 634 — — 2,736 23 4,5722000-01 731 — — 2,738 23 4,7842005-06 697 — — 2,848 23 4,5382009-10 799 — — 2,626 23 44022010-11 781 — — 2,529 23 4,194Ambala 29 — — 90 — 185Panchkula 15 — — 27 — 38Yamunanagar 21 — — 61 — 74Kurukshetra 38 — — 103 — 220Kaithal 26 — — 109 — 221Karnal 34 — — 156 1 250Panipat 21 — — 94 — 174Sonipat 40 — — 135 1 193Rohtak 54 — — 112 1 215Jhajjar 63 — — 201 — 158Faridabad 18 — — 89 5 138Palwal 15 — — 22 — 73Gurgaon 23 — — 42 — 120Mewat 16 — — 82 — 120Rewari 32 — — 59 1 120Mahendragarh 42 — — 96 7 220Bhiwani 57 — — 231 7 255Jind 45 — — 234 — 253Hisar 95 — — 243 — 789Fatehabad 43 — — 127 — 146Sirsa 54 — — 216 — 232
Source :—Director General, Animal Husbandry and Dairying, Haryana.
Note :– (i) From the year 1975-76 onwards, Stock Assistants working in all the Schemes have been included. (ii) Compounders merged as VLDA. VLDA :— Veterinary and Livestock Development Assistant.

318
ANIMAL HUSBANDRY
Work done in the Veterinary Institutions in Haryana No. 14.16
Number of inoculations and vaccinations performed Year/District Number of cases treated
Castrations performed R.P. PPR H.S. B.Q.
1 2 3 4 5 6 7 1966-67 11,07 1,80 5,56 — 10,00 —1970-71 11,86 1,48 7,97 — 9,53 181980-81 15,13 19 26,26 — 31,99 301990-91 21,27 8 27,84 — 49,90 611995-96 27,31 4 — — 56,57 712000-01 26,59 6 — — 70,55 342005-06 47,19 7 — — 75,45 362009-10 38,25 9 — 494 88,16 2502010-11 39,46 8 — 411 8515 86Ambala 205 @ — 13 337 —-Panchkula 60 @ — 4 119 —-Yamunanagar 140 @ — 22 390 2Kurukshetra 181 @ — 8 368 —Kaithal 285 1 — 26 541 —Karnal 237 @ — 26 578 5Panipat 137 @ — 7 332 —Sonipat 158 @ — 6 499 1Rohtak 156 1 — 6 363 —Jhajjar 155 @ — 14 332 4Faridabad 86 @ — 1 234 —Palwal 123 1 — 9 332 —Gurgaon 122 @ — 7 191 —Mewat 138 @ — 12 267 —Rewari 117 @ — 7 246 —Mahendragarh 174 @ — 24 286 1Bhiwani 366 @ — 47 597 12Jind 397 3 — 35 670 14Hisar 264 1 — 45 766 6Fatehabad 167 @ — 28 448 5Sirsa 278 1 — 64 619 36

319
ANIMAL HUSBANDRY
Work done in the Veterinary Institutions in Haryana No. 14.16 (Concld.) (In thousands)
Number of inoculations and vaccinations performed Year/District
R.K. F.P. Sheep Pox
Foot Mouth
Swine Fever
Entrotoximia Others Total
(4 to 14)
1 8 9 10 11 12 13 14 15 1966-67 37 8 — — — — 8 16,091970-71 99 35 — — — — — 19,021980-81 6,09 3,96 2,36 1,56 25 3,26 8 76,111990-91 14,83 8,08 3,85 4,43 41 8,71 1,54 1,20,201995-96 23,34 11,94 7,22 16,35 33 7,00 1 1,23,472000-01 21,27 8,76 6,29 9,60 14 6,41 1,98 1,25,342005-06 27,75 13,94 6,41 68,42 35 6,44 2,85 2,01,972009-10 2071 1340 511 3879 40 402 7 1,78,102010-11 2367 1723 474 10622 54 460 5 24717Ambala 125 125 17 310 7 13 — 947Panchkula 142 142 4 58 1 3 — 473Yamunanagar 126 115 9 460 4 10 — 1138Kurukshetra 16 4 9 173 1 7 — 586Kaithal — — 17 710 2 15 — 1311Karnal 1193 1104 20 404 23 14 — 3367Panipat 18 14 8 188 — 6 — 573Sonipat — — 15 746 1 15 — 1283Rohtak — — 20 601 1 16 — 1007Jhajjar — — 20 422 1 16 — 809Faridabad 30 20 6 304 — 9 — 604Palwal — — 5 526 — 4 — 876Gurgaon 711 194 6 242 1 6 — 1358Mewat — — 16 392 — 22 — 709Rewari — — 10 188 — 13 — 464Mahendragarh — — 14 349 1 31 — 706Bhiwani 2 — 66 750 2 56 — 1532Jind — 2 37 1088 5 37 4 1892Hisar 4 3 69 1111 3 58 — 2065Fatehabad — — 25 675 1 26 1 1209Sirsa — — 81 925 — 83 — 1808
Source :—Director General, Animal Husbandry and Dairying, Haryana. R.P.—Rinderpest, H.S.—Hameorrhagic Septicaimia, B.Q.—Black Quarter , R.K. — Ranikhet, @ : —Less than 500, F.P.—Fowlpox. PPR1 - Peste-des Peffits Ruminants.

320
ANIMAL HUSBANDRY Mortality Amongst Livestock due to Contagious Diseases in Haryana*
No. 14.17 Year/District Cattle Buffaloes Equines Sheep Goats Dogs Camels Pigs Poultry
1 2 3 4 5 6 7 8 9 10 1966-67 687 673 8 336 209 — 219 — —1970-71 56 800 7 — — — — — —1980-81 338 — — — — — — — —1990-91 14 95 — — — — — — 8261995-96 9 85 — — — — — — —2000-01 31 98 — — — — — — —2005-06 1 35 — — — — — — —2009-10 — — — — — — — — —2010-11 — — — — — — — — —Ambala — — — — — — — — —Panchkula — — — — — — — — —Yamunanagar — — — — — — — — —Kurukshetra — — — — — — — — —Kaithal — — — — — — — — —Karnal — — — — — — — — —Panipat — — — — — — — — —Sonipat — — — — — — — — —Rohtak — — — — — — — — —Jhajjar — — — — — — — — —Faridabad — — — — — — — — —Palwal — — — — — — — — —Gurgaon — — — — — — — — —Mewat — — — — — — — — —Rewari — — — — — — — — —Mahendragarh — — — — — — — — —Bhiwani — — — — — — — — —Jind — — — — — — — — —Hisar — — — — — — — — —Fatehabad — — — — — — — — —Sirsa — — — — — — — — —
Source :—Director General, Animal Husbandry and Dairying, Haryana.
* The outbreaks which have come to the notice of Director of Animal Husbandry and other Government Institutions.

321
ANIMAL HUSBANDRY Number of Bulls kept in Artificial Insemination centres and the Work done under
A.I. Scheme in Haryana No. 14.18 ¼In thousands½
Number of animals covered at A.I.Centres Number of bulls kept in Semen Banks.
Semen/Key villages*
Number of bulls kept in key villages for natural Services
By A.I.Method By natural method Year/District
Cows Buff. Cows Buff. Cows Buff. Cows Buff. 1 2 3 4 5 6 7 8 9
1966-67 32 28 65 68 4 9 2 —1970-71 17 28 37 51 33 40 2 —1980-81 88 81 11 — 1,52 65 — —1990-91 1,18 1,03 — — 4,00 3,22 — —1995-96 73 89 — — 3,45 3,05 — —2000-01 71 1,08 — — 2,55 3,06 — —2005-06 28 1,06 — — 3,73 10,49 — —2009-10 27 1,20 — — 5,85 14,52 — —2010-11 25 103 — — 653 1,578 — —Ambala — — — — 31 63 — —Panchkula — — — — 6 17 — —Yamunanagar 8 27 — — 51 51 — —Kurukshetra — — — — 45 71 — —Kaithal — — — — 27 100 — —Karnal — — — — 64 103 — —Panipat — — — — 29 78 — —Sonipat — — — — 33 90 — —Rohtak — — — — 18 74 — —Jhajjar — — — — 16 60 — —Faridabad — — — — 13 39 — —Palwal — — — — 20 61 — —Gurgaon 6 25 — — 17 33 — —Mewat — — — — 16 47 — —Rewari — — — — 15 47 — —Mahendragarh — — — — 21 63 — —Bhiwani — — — — 47 126 — —Jind — — — — 31 137 — —Hisar 11 51 — — 43 139 — —Fatehabad — — — — 25 82 — —Sirsa — — — — 85 97 — —
Source : Director General, Animal Husbandry and Dairying, Haryana.
* Separate break up for number of bulls kept in K.V. units is not available and is included in the Number of A.I. Centres.

322
ANIMAL HUSBANDRY Intensive Cattle Development Projects in Haryana
No. 14.19
Year/District Number of large size
Projects Number of medium size
Projects Number of semen banks
under projects 1 2 3 4
1975-76 2 5 61980-81 2 5 71990-91 2 5 71995-96 2 5 72000-01 2 5 72005-06 2 5 72009-10 2 5 72010-11 2 5 7Ambala — 1 1Panchkula — — —Yamunanagar — — —Kurukshetra — 1 1Kaithal — — —Karnal 1 — 1Panipat — — —Sonipat — — —Rohtak — — —Jhajjar — — —Faridabad — — —Palwal — — —Gurgaon 1 — 1Mewat — — —Rewari — — —Mahendragarh — — —Bhiwani — 1 1Jind — 1 1Hisar — — —Fatehabad — — —Sirsa — 1 1
Source :—Director General, Animal Husbandry and Dairying, Haryana.

323
ANIMAL HUSBANDRY Development of Gaushalas and Cattle Catching Operations in Haryana
No. 14.20 Number of cattle catching
parties* Number of animals
caught Year/District
Developed Gaushala
Number of Gaushalas affiliated with Gaushala
Sangh in the State Stray Cattle Wild Cattle Stray Cattle Wild Cattle
1 2 3 4 5 6 7 1966-67 — 49 — — 726 1431970-71 — 51 1 1 596 1851980-81 29 56 1 — 171 341990-91 57 67 1 — 178 681995-96 57 71 1 — — —2000-01 79 91 1 — 624 —2005-06 215 215 1 — 357 —2009-10 2,84 2,84 1 — 454 —2010-11 283 257 1 — — —Ambala 5 5 — — — —Panchkula 4 4 — — — —Yamunanagar 1 1 — — — —Kurukshetra 14 11 — — — —Kaithal 14 12 — — — —Karnal 15 15 — — — —Panipat 19 14 — — — —Sonipat 11 11 — — — —Rohtak 9 9 — — — —Jhajjar 7 7 — — — —Faridabad 8 4 — — — —Palwal 3 3 — — — —Gurgaon 3 3 — — — —Mewat 7 7 — — — —Rewari 5 3 — — — —Mahendragarh 15 15 — — — —Bhiwani 27 26 — — — —Jind 17 15 — — — —Hisar 31 29 1 — — —Fatehabad 21 20 — — — —Sirsa 47 43 — — — —
Source :—Director General, Animal Husbandry and Dairying, Haryana.
* The party is at the state level and only one cattle catching party worked after the year 1970-71 for the stray and wild cattle.

324
ANIMAL HUSBANDRY
Number of Recognised Slaughter Houses and Livestock Slaughtered therein in Haryana
No. 14.21 (in 000) Animals Slaughtered
Year/District Number of recognized
Slaughter houses Sheep Goats Pigs Total 1 2 3 4 5 6
1966-67 33 94.1 — 4.8 98.91970-71 34 147.6 — 8.4 156.01980-81 43 45.0 91.0 19.1 155.11990-91 42 59.6 137.6 20.7 217.91995-96 46 62.9 102.6 19.4 184.92000-01 34 55.5 56.3 14.6 126.42005-06 28 38.4 57.5 10.7 106.62009-10 37 35.6 59.2 18.9 113.72010-11 37 32.9 43.2 12.9 89.0Ambala 3 3.2 2.6 2.9 8.7Panchkula 1 0.6 1.2 0.9 2.7Yamunanagar 2 2.8 3.1 2.4 8.3Kurukshetra 1 0.2 0.3 0.2 0.7Kaithal 1 0.1 — 0.1 0.2Karnal 3 2.6 3.5 1.4 7.5Panipat 1 — — — —Sonipat 1 — — — —Rohtak 2 3.9 2.6 0.1 6.6Jhajjar 1 0.2 0.2 0.1 0.5Faridabad 1 1.7 8.2 0.7 10.6Palwal — — — — —Gurgaon 2 — 1.8 — 1.8Mewat — — — — —Rewari 1 — 1.0 — 1.0Mahendragarh 2 — 3.8 0.3 4.1Bhiwani 4 6.1 4.6 0.9 11.6Jind 1 7.0 2.4 1.5 10.9Hisar 5 1.1 3.0 0.4 4.5Fatehabad 3 1.7 1.2 0.4 3.3Sirsa 2 1.7 3.7 0.6 6.0
Source :—Director General, Animal Husbandry and Dairying, Haryana.

325
POULTRY STATISTICS Number of Government Poultry Farms in Haryana
No. 14.22
Year/District Government
Poultry Farms Poultry
Extension Centres
Intensive Poultry Development Blocks
Poultry- cum- Piggery Centres
A.N.P. Block Total
1 2 3 4 5 6 7 1966-67 1 3 10 4 — 181970-71 1 3 10 4 — 181980-81 2 3 10 2 5 221990-91 4 22 — — — 261995-96 4 22 — — — 262000-01 4 22 — — — 262005-06 4 22 — — — 262009-10 4 — — — — 4 2010-11 4 — — — — 4 Ambala 1 — — — — 1 Panchkula — — — — — —
Yamunanagar — — — — — —
Kurukshetra — — — — — —
Kaithal — — — — — —
Karnal — — — — — —
Panipat — — — — — —
Sonipat — — — — — —
Rohtak 1 — — — — 1Jhajjar — — — — — —
Faridabad — — — — — —
Palwal — — — — — —Gurgaon — — — — — —Mewat — — — — — —
Rewari — — — — — —
Mahendragarh — — — — — —Bhiwani 1 — — — — 1 Jind — — — — — —
Hisar 1 — — — — 1Fatehabad — — — — — —
Sirsa — — — — — —Source :—Director General, Animal Husbandry and Dairying, Haryana.

326
POULTRY STATISTICS Poultry Birds in Government Poultry Farms in Haryana 2010-11
No. 14.23
District
Last year's
balance as on 31st
March 2009
Birds hatched during
the year
Birds received
from other Farms
Total Birds transferred
to other Farms
Birds sold
Birds died
Males destroyed
after sexing
Balance at the end of year
1 2 3 4 5 6 7 8 9 10 Ambala — — 1744 1744 — 55 590 — 1099Panchkula — — — — — — — — —
Yamunanagar — — — — — — — — —
Kurukshetra — — — — — — — — —
Kaithal — — — — — — — — —
Karnal — — — — — — — — —
Panipat — — — — — — — — —
Sonipat — — — — — — — — —
Rohtak — — — — — — — — —
Jhajjar — — — — — — — — —Faridabad — — — — — — — — —
Palwal — — — — — — — — —Gurgaon — — — — — — — — —
Mewat — — — — — — — — —Rewari — — — — — — — — —
Mahendragarh — — — — — — — — —Bhiwani — — — — — — — — —
Jind — — — — — — — — —
Hisar 1030 35203 1200 37433 — 34517 1442 996 478 Fatehabad — — — — — — — — —
Sirsa — — — — — — — — —Total 2009-10 1030 35203 2944 39177 — 34572 2032 996 1577 Total 2008-09 1449 30715 2879 35043 — 30272 2439 1302 1030
Source :—Director General, Animal Husbandry and Dairying, Haryana.

327
POULTRY STATISTICS Egg Production in Government Poultry Farms in Haryana during 2010-11
No. 14.24
District
Last year's
balance as on 31st
March, 2009
Eggs laid
during the year
Eggs received
from other Farms
Total Eggs dispatched
to other Farms
Eggs Sold for hatching
Eggs sold for eatable purposes
Eggs issued
for hatching
Destroyed or broken
Balance at the end of year
1 2 3 4 5 6 7 8 9 10 11 Ambala — 83152 — 83152 7465 — 75053 — — 634 Panchkula — — — — — — — — — — Yamunanagar — — — — — — — — — — Kurukshetra — — — — — — — — — — Kaithal — — — — — — — — — — Karnal — — — — — — — — — — Panipat — — — — — — — — — — Sonipat — — — — — — — — — — Rohtak — — — — — — — — — — Jhajjar — — — — — — — — — — Faridabad — — — — — — — — — — Palwal — — — — — — — — — — Gurgaon — — — — — — — — — — Mewat — — — — — — — — — — Rewari — — — — — — — — — — Mahendragarh — — — — — — — — — — Bhiwani — — — — — — — — — — Jind — — — — — — — — — — Hisar 4236 99436 — 103672 — — 37140 66140 — 392 Fatehabad — — — — — — — — — — Sirsa — — — — — — — — — — Total 2010-11 4236 182588 — 186824 7465 — 112193 66140 — 1026 Total 2009-10 2822 227560 — 230382 15240 35 134432 76439 — 4236
Source :—Director General, Animal Husbandry and Dairying, Haryana.

328
DAIRYING Procurement of Milk, number of Milk Plants and Milk Chilling Centres in Haryana
No. 14.25
Milk Plants Milk Chilling
Centres
Year/District Milk Procurement* (lac
litres) Number
Capacity (lac litres) per day
Number
Capacity (lac
litres) per day
1 2 3 4 5 6 1978-79 283.5 5 2.35 6 0.751980-81 211.8 5 2.35 10 1.451985-86 598.5 5 3.15 16 2.701990-91 341.5 6 3.65 12 2.301995-96 434.1 5 5.15 9 1.701999-00 918.3 5 4.70 16 2.452000-01 1009.3 5 4.70 19 3.052001-02 1237.1 5 4.70 23 3.002005-06 1468.28 5 4.70 27 3.332009-10 1906.76 5 4.70 27 3.332010-11(P) 1875.45 5 4.70 27 3.33Rohtak/Sonipat/ Mahendragarh/ Rewari/Bhiwani/Jhajjar
389.12 1 1.00 5 0.80
Jind/Hisar/Fatehabad 404.80 1 1.00 3 0.55Ambala/Yamunanagar/Panchkula 410.86 1 0.70 5 0.48Karnal/Panipat Kurukshetra/Kaithal
150.29 — — 4 0.55
Sirsa 508.94 1 1.00 6 0.25Gurgaon/Faridabad 234.07 1 1.00 4 0.70
Source :—Haryana Dairy Development Corporation. * Milk procured through societies only. P—Provisional.

329
DAIRYING Estimated production of Milk and per capita availability of milk per day in Haryana
No. 14.26 Year Estimated production of milk (lakh tones) Per capita availability of milk per day
(grams) 1 2 3
1966-67 10.89 3521977-78 17.27 4121980-81 21.87 4841985-86 25.55 4781990-91 34.19 5711991-92 35.65 5791995-96 40.56 6021996-97 42.04 6111997-98 43.73 6211998-99 45.27 6261999-00 46.79 6312000-01 48.49 6402001-02 49.77 6462002-03 51.36 6562003-04 52.20 6602004-05 52.20 6602005-06 52.98 6602006-07 53.67 6602007-08 54.51 6602008-09 57.45 6682009-10 60.06 6732010-11 62.67 680
Source :—Director General, Animal Husbandry and Dairying, Haryana. P— Provisional Note :— The estimates of milk production for the years 1967-68 to 1976-77 are not available as the scheme under
which the information is collected was started only in 1977-78, Districtwise estimates are not worked out.

331
SECTION XV FORESTS
Area under forests is classified according to type of ownership. Forests owned by corporate bodies and private individuals have been included under private forests. Further the area under forests has also been classified according to its legal status, such as ‘Reserved’, ‘Protected’ and ‘Unclassed’. Reserved forests are permanently dedicated either to the production of timber or other forest produce and the grazing and cultivation is not permitted. In protected forests these rights are allowed subject to certain restrictions. Unclassed forests include non-exploitable forests which owing to physical conditions or for other reasons have no prospect of being used as forests, area serving only protective purposes and area permanantly destroyed as forests but yet not converted to other land uses.
The area under Forests shown in this section will not tally with the figures shown under the section‘Agriculture’ supplied by the Director of Land Records due to different definitions followed by the Forest and Land Records Departments. The Forest Department reckons entire area including non-wooded area under its control as the forest area whereas the Land Records Department calculates on the basis of actual area under forests.
The data have been obtained from the Principal Chief Conservator of Forests, Haryana.
Table 15.1—gives area under Forests—According to type of ownership in Haryana.
Table 15.2—indicates percentage of area under forests and forest area per lakh of population.
Table 15.3—depicts quantity and value of Major Forest Produce in respect of State Forests only.
Table 15.4—presents value of Minor Forest Produce in respect of State Forests only.
Table 15.5—presents forest area protected against fire and cattle grazing.
Table 15.6—relates to revenue and expenditure of Forest Department, Haryana.

332

333
FORESTS Area under Forests in Haryana
No. 15.1 (In Square kilometres) State Forests Private Forests
Year/District
Reserved Protected Unclassed Closed under Indian Forests
Act
Closed under land
Preservation Act
Total Percentage of State
forests to total
Forests
1 2 3 4 5 6 7 8 1966-67 187 413 13 110 639 1,362 45.01 1970-71 160 485 106 74 653 1,478 50.81 1975-76 212 695 39 30 439 1,415 66.86 1980-81 224 1,022 38 42 336 1,662 77.26 1985-86 229 1,087 72 32 265 1,685 82.37 1990-91 247 1,080 89 23 263 1,702 83.20 1995-96 247 1,104 70 11 115 1,547 91.86 2000-01 249 1,154 21 4 125 1,553 91.69 2005-06 249 1,158 19 10 123 1,559 91.47 2009-10 249 1,159 19 12 240 1,679 84.99 2010-11(P) 249 1,166 17 11 241 1,684 85.04 Ambala 2 35 — @ 15 52 71.15 Panchkula 86 253 @ — 45 384 88.28 Yamunanagar 70 131 3 — 14 218 93.58 Kurukshetra 18 27 — — — 45 100.00 Kaithal 37 36 4 @ — 77 100.00 Karnal 4 71 — 1 @ 76 98.68 Panipat — 41 — — — 41 100.00 Sonipat — 74 — — — 74 100.00 Rohtak — 40 4 — 2 46 95.65 Jhajjar — 38 1 — 2 41 95.12 Faridabad 2 12 — — 55 69 20.28 Palwal 1 19 1 — 1 22 95.45 Gurgaon 2 16 @ 3 68 89 20.22 Mewat @ 13 @ — 19 32 40.63 Rewari 5 36 1 — 9 51 82.35 Mahendragarh 17 24 @ 5 11 57 71.93 Bhiwani 1 88 @ 2 — 91 97.80 Jind 4 62 2 — — 68 100.00 Hisar — 63 @ @ — 63 100.00 Fatehabad — 39 1 @ — 40 100.00 Sirsa @ 48 @ @ — 48 100.00 @ less than one. Source :—Forest Department, Haryana.

334
FORESTS Percentage of Area under Forests and Forest Area per lakh of population in Haryana
No. 15.2 Year/District Total Forest
Area (Sq. Km.) Total
Geographical Area
(Sq. Km.)
Percentage of forest area to total
geographical area
Forest Area per lakh of
population* (sq. km.)
1 2 3 4 5 1966-67 1,362 44,056 3.09 17.94 1970-71 1,478 44,056 3.35 14.73 1975-76 1,415 44,222 3.20 14.10 1980-81 1,662 44,212 3.76 12.86 1985-86 1,685 44,212 3.81 13.04 1990-91 1,702 44,212 3.85 10.34 1995-96 1,547 44,212 3.50 9.40 2000-01 1,553 44,212 3.51 9.43 2005-06 1,559 44,212 3.53 7.37 2009-10 1,679 44,212 3.80 7.94 2010-11(P) 1,684 44,212 3.81 6.64 Ambala 52 1,574 3.30 4.57 Panchkula 384 898 42.76 6.88 Yamunanagar 218 1,768 12.33 1.80 Kurukshetra 45 1,530 2.94 4.67 Kaithal 77 2,317 3.32 7.18 Karnal 76 2,520 3.02 5.05 Panipat 41 1,268 3.23 3.41 Sonipat 74 2,122 3.49 5.00 Rohtak 46 1,745 2.64 4.35 Jhajjar 41 1,834 2.24 4.28 Faridabad 69 743 9.29 3.84 Palwal 22 1,009 2.18 2.11 Gurgaon 89 1,254 7.10 5.88 Mewat 32 1,859 1.72 2.94 Rewari 51 1,594 3.20 5.69 Mahendragarh 57 1,899 3.00 6.18 Bhiwani 91 4,778 1.90 5.59 Jind 68 2,702 2.52 5.10 Hisar 63 3,983 1.58 3.61 Fatehabad 40 2,538 1.58 4.25 Sirsa 48 4,277 1.12 3.71 *—Based on relevant Population Census figures. Source :—Forest Department, Haryana.
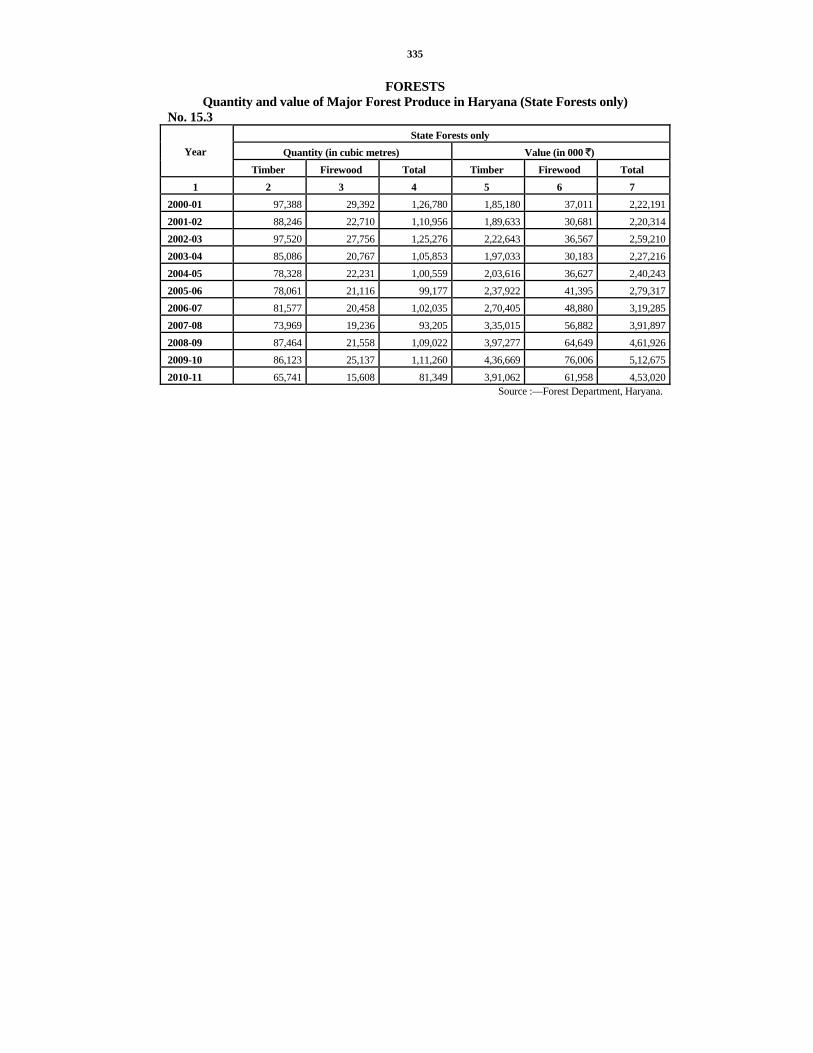
335
FORESTS Quantity and value of Major Forest Produce in Haryana (State Forests only)
No. 15.3 State Forests only
Quantity (in cubic metres) Value (in 000 `) Year
Timber Firewood Total Timber Firewood Total 1 2 3 4 5 6 7
2000-01 97,388 29,392 1,26,780 1,85,180 37,011 2,22,1912001-02 88,246 22,710 1,10,956 1,89,633 30,681 2,20,3142002-03 97,520 27,756 1,25,276 2,22,643 36,567 2,59,2102003-04 85,086 20,767 1,05,853 1,97,033 30,183 2,27,2162004-05 78,328 22,231 1,00,559 2,03,616 36,627 2,40,2432005-06 78,061 21,116 99,177 2,37,922 41,395 2,79,3172006-07 81,577 20,458 1,02,035 2,70,405 48,880 3,19,2852007-08 73,969 19,236 93,205 3,35,015 56,882 3,91,8972008-09 87,464 21,558 1,09,022 3,97,277 64,649 4,61,9262009-10 86,123 25,137 1,11,260 4,36,669 76,006 5,12,6752010-11 65,741 15,608 81,349 3,91,062 61,958 4,53,020
Source :—Forest Department, Haryana.
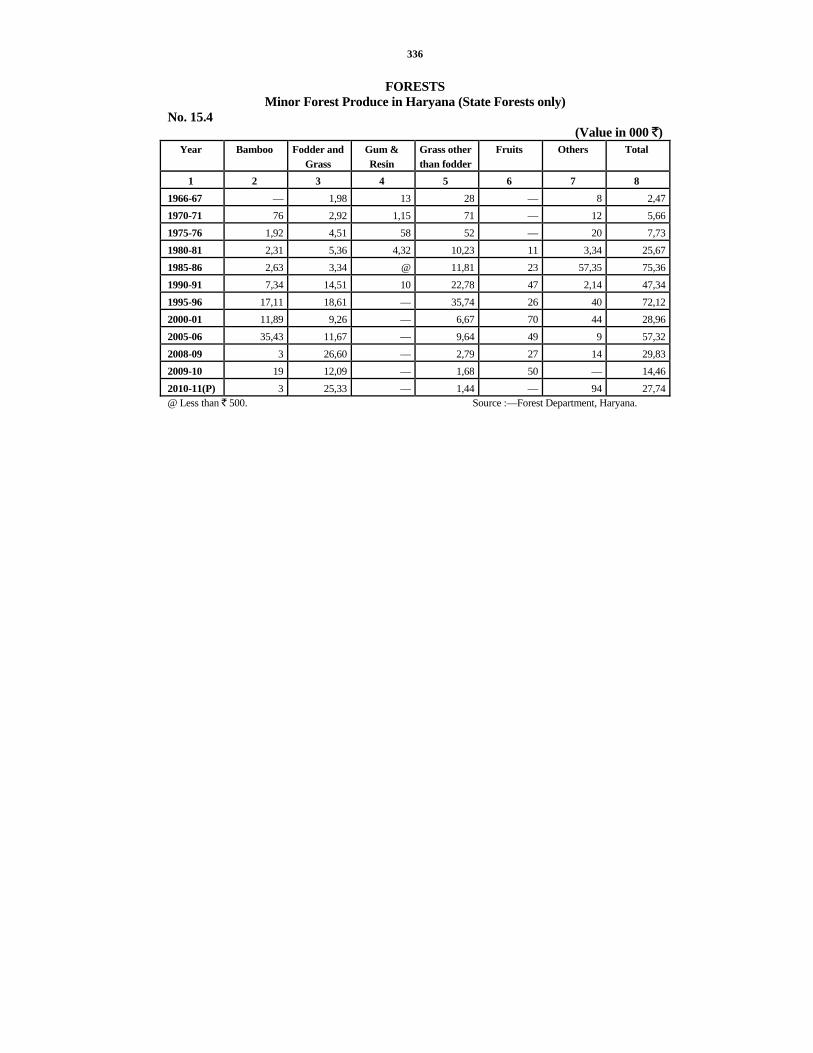
336
FORESTS Minor Forest Produce in Haryana (State Forests only)
No. 15.4 (Value in 000 `)
Year Bamboo Fodder and Grass
Gum & Resin
Grass other than fodder
Fruits Others Total
1 2 3 4 5 6 7 8 1966-67 — 1,98 13 28 — 8 2,471970-71 76 2,92 1,15 71 — 12 5,661975-76 1,92 4,51 58 52 — 20 7,731980-81 2,31 5,36 4,32 10,23 11 3,34 25,671985-86 2,63 3,34 @ 11,81 23 57,35 75,361990-91 7,34 14,51 10 22,78 47 2,14 47,341995-96 17,11 18,61 — 35,74 26 40 72,122000-01 11,89 9,26 — 6,67 70 44 28,962005-06 35,43 11,67 — 9,64 49 9 57,322008-09 3 26,60 — 2,79 27 14 29,832009-10 19 12,09 — 1,68 50 — 14,462010-11(P) 3 25,33 — 1,44 — 94 27,74@ Less than ` 500. Source :—Forest Department, Haryana.

337
FOREST AREA PROTECTED FROM FIRE AND CATTLE GRAZING

338
FORESTS Forest Area protected from fire and cattle grazing
No.15.5 (In Sq. Kilometres) Protection against fire
Year Total Forest
Area Attempted to be
protected Actually protected
Percentage of forests under
fire protection to total forest area
Cost of fire conservancy
operations (`)
1 2 3 4 5 6
1966-67 1,362 1,362 1,344 98.68 20,545
1970-71 1,477.73 1,477.73 1,437.12 97.25 18,368
1975-76 1,415.48 1,415.48 1,406.36 99.36 13,118
1980-81 1,661.64 1,661.64 1,640.33 98.72 21,245
1985-86 1,685.43 1,685.43 1,670.44 99.11 3,94,761
1990-91 1,701.99 1,701.99 1,701.70 99.98 5,03,000
1995-96 1,547.06 1,547.06 1,532.12 99.03 4,50,000
2000-01 1,553.02 1,553.02 1,549.62 99.78 10,74,994
2005-06 1,559.10 1,559.10 1,554.28 99.69 53,57,416
2008-09 1,563.28 1,563.28 1,554.58 99.44 14,41,865
2009-10 1,679.54 1,679.54 1,675.08 99.73 38,15,720
2010-11(P) 1,683.82 1,683.82 1,679.43 99.74 1,03,54,000

339
FORESTS Forest Area protected from fire and cattle grazing
No.15.5 (Concld.) (In Sq. Kilometres) Protection against grazing
Area open to grazing throughout the year
Area open to grazing for part of the year Year Area closed to
grazing For all animals For Non-brousers only
For all animals For Non-brousers only
1 7 8 9 10 11
1966-67 889.92 — 444.63 — 27.82
1970-71 1,383.46 — 24.86 22.81 46.60
1975-76 1,342.12 21.27 18.17 4.19 29.73
1980-81 1,426.02 60.75 54.07 106.80 14.00
1985-86 1,457.53 28.52 66.01 55.50 77.87
1990-91 1,674.18 13.91 1.40 12.50 —
1995-96 1,515.21 17.98 1.40 12.50 —
2000-01 1,553.02 — — — —
2005-06 1,559.10 — — — —
2008-09 1,563.28 — — — —
2009-10 1,679.54 — — — —
2010-11(P) 1,683.82 — — — —P—Provisional Source :—Forest Department, Haryana.
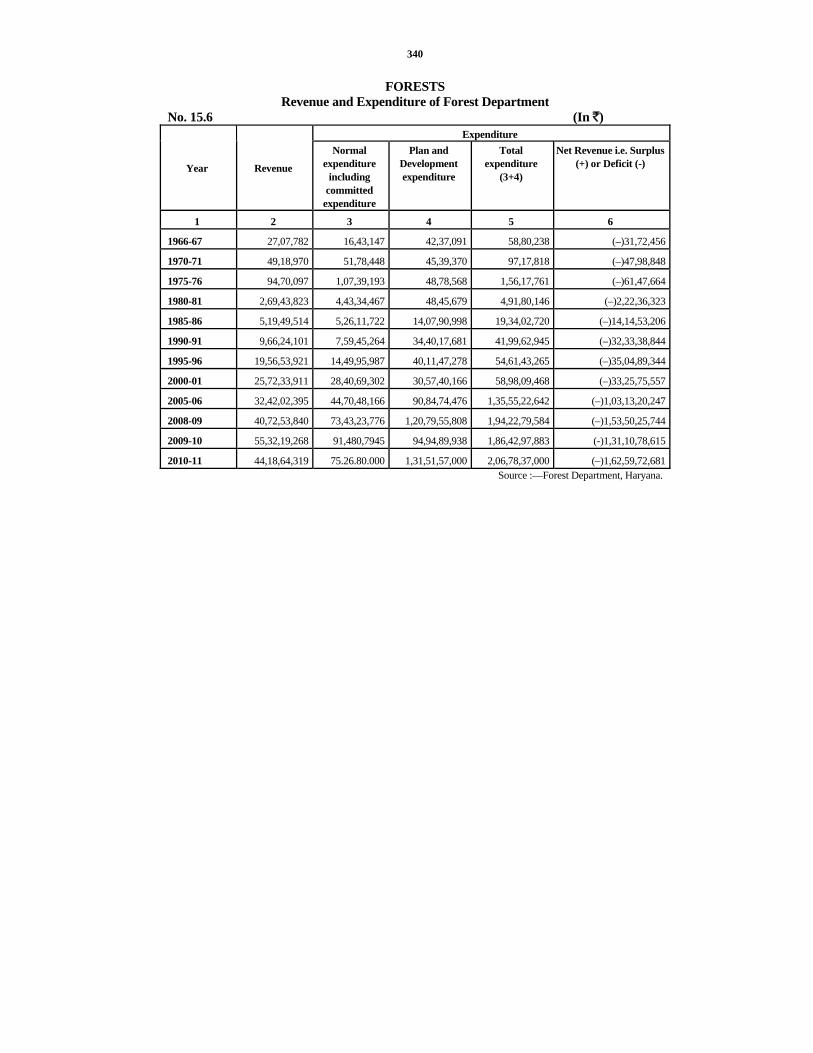
340
FORESTS Revenue and Expenditure of Forest Department
No. 15.6 (In `) Expenditure
Year Revenue
Normal expenditure
including committed
expenditure
Plan and Development expenditure
Total expenditure
(3+4)
Net Revenue i.e. Surplus (+) or Deficit (-)
1 2 3 4 5 6
1966-67 27,07,782 16,43,147 42,37,091 58,80,238 (–)31,72,456
1970-71 49,18,970 51,78,448 45,39,370 97,17,818 (–)47,98,848
1975-76 94,70,097 1,07,39,193 48,78,568 1,56,17,761 (–)61,47,664
1980-81 2,69,43,823 4,43,34,467 48,45,679 4,91,80,146 (–)2,22,36,323
1985-86 5,19,49,514 5,26,11,722 14,07,90,998 19,34,02,720 (–)14,14,53,206
1990-91 9,66,24,101 7,59,45,264 34,40,17,681 41,99,62,945 (–)32,33,38,844
1995-96 19,56,53,921 14,49,95,987 40,11,47,278 54,61,43,265 (–)35,04,89,344
2000-01 25,72,33,911 28,40,69,302 30,57,40,166 58,98,09,468 (–)33,25,75,557
2005-06 32,42,02,395 44,70,48,166 90,84,74,476 1,35,55,22,642 (–)1,03,13,20,247
2008-09 40,72,53,840 73,43,23,776 1,20,79,55,808 1,94,22,79,584 (–)1,53,50,25,744
2009-10 55,32,19,268 91,480,7945 94,94,89,938 1,86,42,97,883 (-)1,31,10,78,615
2010-11 44,18,64,319 75.26.80.000 1,31,51,57,000 2,06,78,37,000 (–)1,62,59,72,681Source :—Forest Department, Haryana.

341
SECTION XVI FISHERIES
This section contains information regarding fisheries in the Haryana State.
Table 16.1 gives the data regarding fisheries development in Haryana State.
Table 16.2 depicts the disposition of fish catch.

342

343
FISHERIES Fisheries Development in Haryana
No. 16.1 Year/District Area
stocked in hectares
Fishing licenses
issued (Nos.)
Total receipts
from Fisheries
(000 `)
Number of cases
detected without license
Compensation realized (`)
Sale of confiscated
fish (`)
1 2 3 4 5 6 7 1966-67 222 161 367 81 553 —1970-71 155 2,789 578 116 1,797 609 1975-76 624 4,067 707 349 12,745 7,121 1980-81 295 2,975 2,583 66 1,245 178 1985-86 2,714 1,217 4,609 26 775 590 1990-91 2,078 3,189 8,728 8 1,135 320 1995-96 6,180 2,740 40,655 152 8,100 1,447 2000-01 7,745 8,619 8,26,827* 186 6,385 1,632 2005-06 10,532 6,810 14,49,101 228 8,887 —2009-10 15,290 6,667 35,25,200 286 70,525 —2010-11 17,094 7,239 50,84,326 388 5,640 850Ambala 427 396 9,51,750 11 220 —Panchkula 115 34 37,919 5 200 —Yamunanagar 398 3,895 97,718 35 1,070 30Kurukshetra 465 200 1,12,950 10 500 —Kaithal 959 200 2,33,460 10 100 —Karnal 583 250 2,38,635 40 400 —Panipat 790 250 2,21,760 25 250 —Sonipat 1,300 208 3,71,115 40 400 —Rohtak 786 100 2,09,115 20 200 —Jhajjar 1,130 160 2,89,395 20 200 —Faridabad 667 700 1,61,415 30 300 —Palwal 994 100 2,32,515 10 100 —Gurgaon 482 100 1,17,432 10 270 —Mewat 1,145 50 2,71,312 10 150 —Rewari 615 20 1,45,926 10 100 —Mahendragarh 939 25 88,425 10 200 —Bhiwani 966 81 2,25,743 10 100 820Jind 939 50 2,50,920 25 250 —Hisar 1,405 100 3,31,380 12 180 —Fatehabad 905 120 2,25,090 10 100 —Sirsa 1084 200 2,70,351 35 350 —
Source :—Director of Fisheries, Haryana. *Includes income of Fish Farmers from Fisheries.

344
FISHERIES Disposition of Fish Catch during the year, 2010-11
No. 16.2 (Production in Tonnes) District Marketing
fish Freezing Sun dried Salted Canning Deduction Misc.
purposes Total
1 2 3 4 5 6 7 8 9 Ambala 2,115 — — — — — — 2,115Panchkula 843 — — — — — — 843Yamunanagar
2,171 — — — — — — 2,171Kurukshetra 2,510 — — — — — — 2,510Kaithal
5,188 — — — — — —
5,188 Karnal 5,303 — — — — — — 5,303Panipat
4,928 — — — — — — 4,928Sonipat 8,247 — — — — — — 8,247Rohtak 4,647 — — — — — — 4,647Jhajjar 6,431 — — — — — — 6,431Faridabad 3,587 — — — — — — 3,587Palwal 5,167 — — — — — — 5,167Gurgaon 2,610 — — — — — — 2,610Mewat 6,029 — — — — — — 6,029Rewari 3,243 — — — — — — 3,243Mahendragarh 1,965 — — — — — — 1,965Bhiwani 5,016 — — — — — — 5,016Jind 5,576 — — — — — — 5,576Hisar 7,364 — — — — — — 7,364Fatehabad 5,002 — — — — — — 5,002Sirsa 6,008 — — — — — — 6,008Total 93,950 — — — — — — 93,950
Source :—Director of Fisheries, Haryana.
345
SECTION XVII RURAL DEVELOPMENT AND CO-OPERATION
This section shows the progress of rural development and co-operative movement in Haryana. The information has been collected from Development and Panchayat Department, Haryana and the Registrar Co-operative Societies, Haryana.
Table 17.1 shows Government expenditure on Community Development Programmes in Haryana.
Table 17.2 shows people's contribution in the Community Development Programme in Haryana.
Table 17.3 indicates number, membership and working capital of all types of co-operative societies in Haryana.
Table 17.4 presents classification of all types of co-operative societies and banks in Haryana.
Table 17.5 and 17.6 show selected statistics regarding Primary Agricultural and non-agricultural Credit Societies.
Table 17.7 covers selected statistics regarding Primary Land Development Banks.
Table 17.8 presents information on selected statistics of Central Co-operative Banks.
Table 17.9 relates to Apex State Marketing Federations.
Table 17.10 gives data on selected statistics on Central Consumer Stores.
Tables 17.11 to 17.15 give selected statistics of Labour and Construction, Housing, Dairy and Milk Supply, Women Co-operative Societies and Industrial Co-operative Societies, respectively.

346
RURAL DEVELOPMENT AND CO-OPERATION
Government Expenditure on Community Development Programme in Haryana No. 17.1 (` in lakh)
Year
Block Headquarters
Animal Husbandry and
Agriculture Extension
Irrigation Land Reclamation
Health and Rural
Sanitation
1 2 3 4 5 6 Upto 31st March, 1967 195.97 59.73 190.55 16.83 75.86Upto 31st March, 1971 427.72 98.24 216.99 16.83 107.02Upto 31st March, 1976 844.50 130.94 293.37 16.83 169.28Upto 31st March, 1981 1621.78 166.90 378.59 16.83 280.37During 1985-86 332.17 — — — 73.26During 1986-87 369.39 — — — 69.90During 1987-88 489.76 — — — 58.70During 1988-89 561.50 — — — 53.34During 1989-90 620.17 — — — 63.00During 1990-91 710.14 — — — 96.48During 1995-96 68.46 — — — 120.59During 1996-97 75.30 — — — 135.75During 1997-98 1457.48 — — — 21.00During 1998-99 1530.35 — — — 23.10During 2000-01 3172.02 — — — 319.00During 2001-02 2993.94 — — — 166.68During 2003-04 3695.17 — — — —During 2004-05 3790.17 — — — 40.00During 2005-06 3807.37 — — — 1715.00During 2006-07 3860.00 — — — 2176.14During 2007-08 4060.00 — — — 1700.00During 2008-09 4952.00 — — — 1038.40During 2009-10 6091.00 — — — 687.56During 2010-11 5481.00 — — — 1932.47

347
RURAL DEVELOPMENT AND CO-OPERATION Government Expenditure on Community Development Programme in Haryana
No. 17.1 (Concld.) (` in lakh)
Year Education Social
Education Communicaton Rural Arts
and Crafts Housing and
other Miscellaneous
Total
1 7 8 9 10 11 12 Upto 31st March, 1967 45.91 28.92 63.65 24.63 7.71 709.76Upto 31st March, 1971 73.47 52.43 89.57 51.13 91.76 1,225.16Upto 31st March, 1976 109.63 70.14 122.24 88.23 290.30 2,135.46Upto 31st March, 1981 194.16 70.14 171.20 99.02 1,046.92 4,045.91During 1985-86 36.63 — 12.21 — 424.64 878.91During 1986-87 34.95 — 11.65 — 386.11 872.00During 1987-88 29.10 — 9.70 — 459.08 1,046.34During 1988-89 30.30 — 10.10 — 433.69 1,088.93During 1989-90 31.50 — 10.50 — 512.57 1,237.74During 1990-91 46.62 — 15.60 — 446.12 1,314.96During 1995-96 56.25 — 19.66 — 1,459.29 1,724.25During 1996-97 61.37 — 21.65 — 1,605.91 1,899.98During 1997-98 10.50 — 3.50 — 863.25 2,355.73During 1998-99 12.00 — 3.85 — 906.30 2,475.60During 2000-01 — — — — 125.00 3,616.02During 2001-02 — — — — 84.00 3,244.62During 2003-04 — — — — — 3,695.17During 2004-05 — — — — — 3,830.17During 2005-06 — — — — — 5,522.37During 2006-07 — — — — — 6,036.14During 2007-08 — — — — — 5,760.00During 2008-09 — — — — — 5990.40During 2009-10 — — — — — 6778.56During 2010-11 — — — — — 7413.47
Source : Development & Panchayat Deptt., Haryana.

348
RURAL DEVELOPMENT AND CO-OPERATION People's Contribution in the Community Development Programme in Haryana
No. 17.2 (` in lakh)
Year Agriculture and
Animal Husbandry
Irrigation Land Reclaimation
Health and Rural Sanitation
Education
1 2 3 4 5 6 Upto 31st March, 1967
18.80 40.41 16.03 131.40 216.17
Upto 31st March, 1971
25.00 40.41 16.03 139.06 216.17
Upto 31st March, 1976
27.17 40.41 16.03 148.05 216.17
Upto 31st March, 1981
27.17 40.41 16.03 158.21 216.17
During 1985-86 — — — 3.04 23.59During 1986-87 — — — 3.46 18.39During 1987-88 — — — 1.16 5.31During 1988-89 — — — 2.35 6.79During 1989-90 — — — 2.02 13.50During 1990-91 — — — 1.75 12.75During 1995-96 — — — 234.78 176.76During 1996-97 — — — 258.26 194.43During 1997-98 — — — 320.21 241.06During 1998-99 — — — 352.20 253.14During 2000-01 — — — 869.23 —During 2001-02 — — — 174.95 —During 2003-04 — — — 811.00 —During 2004-05 — — — 1115.50 —During 2005-06 — — — 315.90 —During 2006-07 — — — 498.35 —During 2007-08 — — — 600.00 —During 2008-09 — — — 326.83 —During 2009-10 — — — 319.35 —During 2010-11 — — — 126.56 —

349
RURAL DEVELOPMENT AND CO-OPERATION
People's Contribution in the Community Development Programme in Haryana No. 17.2 (Concld.) (` in lakh)
Year
Social Educatio
n
Community Recreation
Centres
Commu-nication
Housing Village andSmall
Industries
Other Works
Programme
Total
1 7 8 9 10 11 12 13
Upto 31st March, 1967
29.50 11.32 126.51 33.40 2.96 21.69 648.19
Upto 31st March, 1971
29.50 11.32 126.51 33.40 3.11 67.94 708.45
Upto 31st March, 1976
29.50 11.32 126.51 33.40 4.36 86.29 739.21
Upto 31st March, 1981
29.50 11.32 126.51 33.40 5.39 99.33 763.44
During 1985-86 — — 0.24 — — 1.61 28.48 During 1986-87 — — 0.09 — — 3.80 25.74 During 1987-88 — — 0.44 — — 1.08 7.99 During 1988-89 — — — — — 3.71 12.85 During 1989-90 — — 0.06 — — 2.06 17.64 During 1990-91 — — 1.05 — — 6.62 22.17 During 1995-96 — — 46.56 — — 135.13 593.23 During 1996-97 — — 51.21 — — 148.64 652.54 During 1997-98 — — 63.49 — — 184.30 809.06 During 1998-99 — — 69.74 — — 193.52 868.60 During 2000-01 — — — — — 125.00 994.23 During 2001-02 — — — — — 84.00 258.95 During 2003-04 — — — — — — 811.00 During 2004-05 — — — — — — 1115.50 During 2005-06 — — — — — — 315.90 During 2006-07 — — — — — — 498.35 During 2007-08 — — — — — — 600.00 During 2008-09 — — — — — — 326.83 During 2009-10 — — — — — — 319.35 During 2010-11 — — — — — — 126.56
Source : Development & Panchayat Deptt., Haryana.
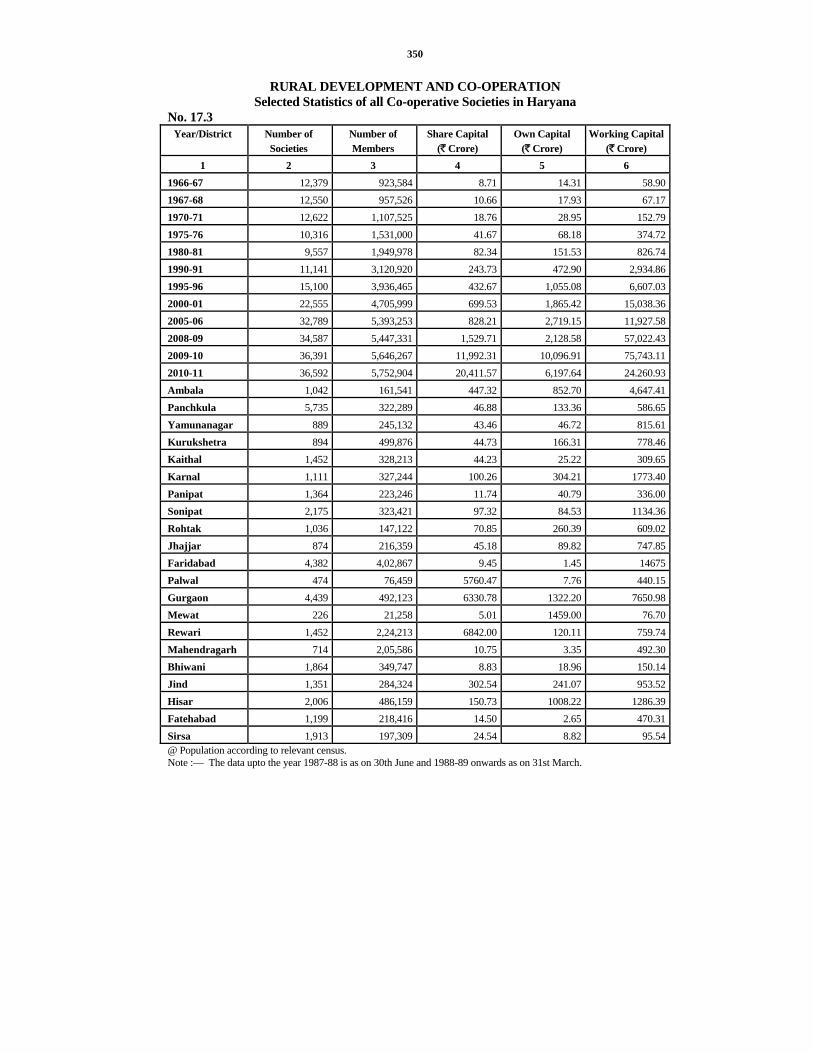
350
RURAL DEVELOPMENT AND CO-OPERATION Selected Statistics of all Co-operative Societies in Haryana
No. 17.3 Year/District Number of
Societies Number of Members
Share Capital (` Crore)
Own Capital (` Crore)
Working Capital(` Crore)
1 2 3 4 5 6 1966-67 12,379 923,584 8.71 14.31 58.901967-68 12,550 957,526 10.66 17.93 67.171970-71 12,622 1,107,525 18.76 28.95 152.791975-76 10,316 1,531,000 41.67 68.18 374.721980-81 9,557 1,949,978 82.34 151.53 826.741990-91 11,141 3,120,920 243.73 472.90 2,934.861995-96 15,100 3,936,465 432.67 1,055.08 6,607.032000-01 22,555 4,705,999 699.53 1,865.42 15,038.362005-06 32,789 5,393,253 828.21 2,719.15 11,927.582008-09 34,587 5,447,331 1,529.71 2,128.58 57,022.432009-10 36,391 5,646,267 11,992.31 10,096.91 75,743.112010-11 36,592 5,752,904 20,411.57 6,197.64 24.260.93Ambala 1,042 161,541 447.32 852.70 4,647.41Panchkula 5,735 322,289 46.88 133.36 586.65Yamunanagar 889 245,132 43.46 46.72 815.61Kurukshetra 894 499,876 44.73 166.31 778.46Kaithal 1,452 328,213 44.23 25.22 309.65Karnal 1,111 327,244 100.26 304.21 1773.40Panipat 1,364 223,246 11.74 40.79 336.00Sonipat 2,175 323,421 97.32 84.53 1134.36Rohtak 1,036 147,122 70.85 260.39 609.02Jhajjar 874 216,359 45.18 89.82 747.85Faridabad 4,382 4,02,867 9.45 1.45 14675Palwal 474 76,459 5760.47 7.76 440.15Gurgaon 4,439 492,123 6330.78 1322.20 7650.98Mewat 226 21,258 5.01 1459.00 76.70Rewari 1,452 2,24,213 6842.00 120.11 759.74Mahendragarh 714 2,05,586 10.75 3.35 492.30Bhiwani 1,864 349,747 8.83 18.96 150.14Jind 1,351 284,324 302.54 241.07 953.52Hisar 2,006 486,159 150.73 1008.22 1286.39Fatehabad 1,199 218,416 14.50 2.65 470.31Sirsa 1,913 197,309 24.54 8.82 95.54@ Population according to relevant census. Note :— The data upto the year 1987-88 is as on 30th June and 1988-89 onwards as on 31st March.

351
RURAL DEVELOPMENT AND CO-OPERATION
Selected Statistics of all Co-operative Societies in Haryana No. 17.3 (Concld.)
Year/District
Population@ No. of Societies per lakh of population
No. of members of all societies per
thousand of population
Average Working Capital per head (`)
1 7 8 9 10 1966-67 7,590,543 163 122 781967-68 7,590,543 165 127 891970-71 10,036,808 126 110 1521975-76 10,036,808 103 152 3731980-81 12,922,618 74 151 6401990-91 16,463,648 68 190 1,7831995-96 16,463,648 92 239 4,0132000-01 21,082,989 107 223 7,1332005-06 21,144,564 155 255 5,6412008-09 21,144,564 164 258 26,9682009-10 21,144,564 164 258 35,8222010-11 25,353,081 144 227 9,569Ambala 1,136,784 92 142 40,882Panchkula 558,890 103 58 10,497Yamunanagar 1,214,162 73 202 1,459Kurukshetra 964,231 93 52 8,073Kaithal 1,072,861 135 306 1,653Karnal 1,506,323 74 217 11,773Panipat 1,202,811 113 186 2,793Sonipat 1,480,080 147 219 7,664Rohtak 1,058,683 98 139 5,753Jhajjar 956,907 91 23 7,815Faridabad 1,798,954 244 224 815Palwal 1,040,493 46 74 4,230Gurgaon 1,514,085 293 325 5,053Mewat 1,089,406 21 20 704Rewari 896,129 162 250 8,478Mahendragarh 921,680 77 223 5,341Bhiwani 1,629,109 114 215 9,216Jind 1,332,042 101 213 7,158Hisar 1,742,815 115 279 7,381Fatehabad 941,522 127 23 4,995Sirsa 1,295,114 148 152 738
Source : Registrar, Co-operative Societies, Haryana.

352
RURAL DEVELOPMENT AND CO-OPERATION Co-operative Societies and Banks Classified by types in Haryana
No. 17.4
Year/District
Apex Societies
Central Co-
operative Banks
Central Land Development
Banks
Agricultural Credit
Non-Agricultural
Credit
Primary Land
Development Banks
Marketing
1 2 3 4 5 6 7 8 1966-67 9 10 — 6,685 584 11 56 1967-68 9 10 — 6,648 589 18 56 1970-71 9 9 — 6,582 562 27 61 1975-76 11 12 — 2,861 491 31 69 1980-81 11 13 — 2,635 312 33 74 1990-91 11 13 — 2,418 431 77 74 1995-96 12 17 — 2,379 755 80 78 2000-01 12 19 — 2,466 1,032 86 78 2005-06 12 19 19 2,441 974 — 80 2008-09 12 19 19 622 985 — 86 2009-10 12 19 19 628 1,613 — 74 2010-11 12 19 19 646 1,231 — 74 Ambala** 1 1 1 45 71 — 5 Panchkula 10 1 1 11 47 — — Yamunanagar — 1 1 39 43 — 2 Kurukshetra — 1 1 63 34 — 4 Kaithal — 1 1 34 38 — 5 Karnal — 1 1 49 103 — 5 Panipat 1 1 1 32 23 — 4 Sonipat — 1 1 34 22 — 5 Rohtak — 1 1 22 54 — 4 Jhajjar — 1 1 23 4 — — Faridabad — 1 1 30 47 — 1 Palwal — — — — 23 — 3 Gurgaon — 1 1 33 25 — 4 Mewat — — — — 23 — 1 Rewari — 1 1 25 28 — 2 Mahendragarh — 1 1 22 22 — 2 Bhiwani — 1 1 41 56 — 5 Jind — 1 1 30 41 — 7 Hisar — 1 1 47 238 — 5 Fatehabad — 1 1 30 214 — 4 Sirsa — 1 1 36 75 — 6 ** Apex co-operative institutions having their headquarters at Chandigarh have been included in district Ambala. Note :— The data upto the year 1987-88 is as on 30th June and 1988-89 onwards as on 31st March.

353
RURAL DEVELOPMENT AND CO-OPERATION Co-operative Societies and Banks Classified by types in Haryana
No. 17.4 (Concld.) Year/District Sugarcane
Supply Milk
Supply Weaver
societies Consumer
societies/Stores Housing societies
Farming societies
Women societies
Others Total
1 9 10 11 12 13 14 15 16 17 1966-67 10 148 332 95 102 599 440 3,300 12,3811967-68 10 156 346 95 104 588 455 3,466 12,5501970-71 9 310 369 81 93 500 431 3,579 12,6221975-76 9 1,233 448 92 122 437 329 4,171 10,3161980-81 3 1,766 426 98 133 283 57 3,708 9,5521990-91 10 2,195 443 89 1,484 143 11 3,742 11,1411995-96 11 2,440 461 91 1,879 118 10 6,769 15,1002000-01 11 2,764 471 91 1,878 106 10 13,531 22,5552005-06 10 4,127 364 71 15,685 131 8 8,848 32,7892008-09 10 6,169 1,296 63 15,863 100 2 9,341 34,5872009-10 9 5,396 1,130 63 15,863 101 2 11,462 36,3912010-11 9 5,500 1,251 63 15,934 143 2 11,689 36,592Ambala** 2 174 33 3 34 4 — 668 1,042Panchkula — 54 28 4 5,283 — — 296 5,735Yamunanagar 5 107 62 3 30 10 — 586 889Kurukshetra 1 223 33 2 29 38 1 464 894Kaithal — 178 90 — 25 8 — 1,072 1,452Karnal 1 121 104 9 32 8 — 677 1,111Panipat — 46 320 9 459 1 — 467 1,364Sonipat — 300 27 2 1,155 3 — 625 2,175Rohtak — 293 59 6 34 — — 562 1,036Jhajjar — 333 21 — 6 1 — 484 874Faridabad — 161 17 3 3,947 — — 174 4,382Palwal — — 5 1 228 — — 214 474Gurgaon — 256 24 — 3,850 — — 245 4,439Mewat — — 3 — 2 — — 197 226Rewari — 505 47 1 572 4 — 266 1,452Mahendragarh — 347 15 — 7 — — 297 714Bhiwani — 760 104 5 20 29 — 842 1,864Jind — 564 34 3 23 6 — 641 1,351Hisar — 334 119 8 124 1 1 1,127 2,006Fatehabad — 210 71 1 28 1 — 638 1,199Sirsa — 534 35 3 46 29 — 1,147 1,913
Source : Registrar, Co-operative Societies, Haryana.
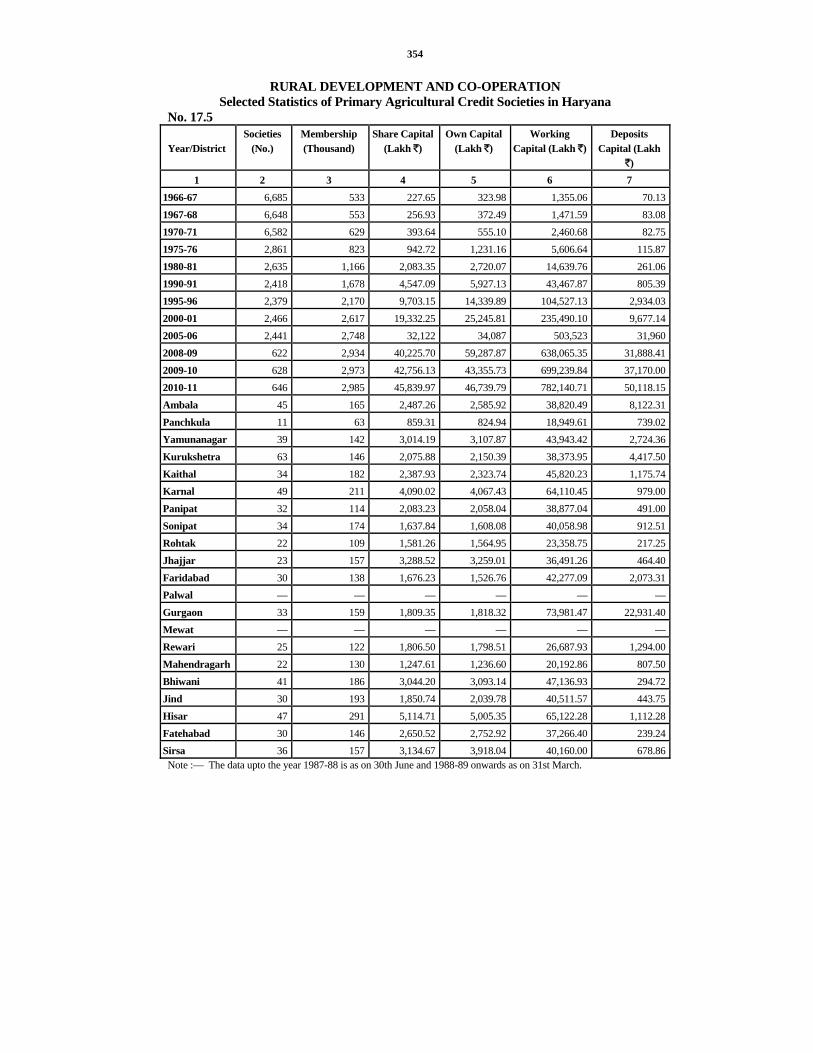
354
RURAL DEVELOPMENT AND CO-OPERATION Selected Statistics of Primary Agricultural Credit Societies in Haryana
No. 17.5
Year/District Societies
(No.) Membership (Thousand)
Share Capital (Lakh `)
Own Capital (Lakh `)
Working Capital (Lakh `)
Deposits Capital (Lakh
`) 1 2 3 4 5 6 7
1966-67 6,685 533 227.65 323.98 1,355.06 70.131967-68 6,648 553 256.93 372.49 1,471.59 83.081970-71 6,582 629 393.64 555.10 2,460.68 82.751975-76 2,861 823 942.72 1,231.16 5,606.64 115.871980-81 2,635 1,166 2,083.35 2,720.07 14,639.76 261.061990-91 2,418 1,678 4,547.09 5,927.13 43,467.87 805.391995-96 2,379 2,170 9,703.15 14,339.89 104,527.13 2,934.032000-01 2,466 2,617 19,332.25 25,245.81 235,490.10 9,677.142005-06 2,441 2,748 32,122 34,087 503,523 31,9602008-09 622 2,934 40,225.70 59,287.87 638,065.35 31,888.412009-10 628 2,973 42,756.13 43,355.73 699,239.84 37,170.002010-11 646 2,985 45,839.97 46,739.79 782,140.71 50,118.15Ambala 45 165 2,487.26 2,585.92 38,820.49 8,122.31Panchkula 11 63 859.31 824.94 18,949.61 739.02Yamunanagar 39 142 3,014.19 3,107.87 43,943.42 2,724.36Kurukshetra 63 146 2,075.88 2,150.39 38,373.95 4,417.50Kaithal 34 182 2,387.93 2,323.74 45,820.23 1,175.74Karnal 49 211 4,090.02 4,067.43 64,110.45 979.00Panipat 32 114 2,083.23 2,058.04 38,877.04 491.00Sonipat 34 174 1,637.84 1,608.08 40,058.98 912.51Rohtak 22 109 1,581.26 1,564.95 23,358.75 217.25Jhajjar 23 157 3,288.52 3,259.01 36,491.26 464.40Faridabad 30 138 1,676.23 1,526.76 42,277.09 2,073.31Palwal — — — — — —Gurgaon 33 159 1,809.35 1,818.32 73,981.47 22,931.40Mewat — — — — — —Rewari 25 122 1,806.50 1,798.51 26,687.93 1,294.00Mahendragarh 22 130 1,247.61 1,236.60 20,192.86 807.50Bhiwani 41 186 3,044.20 3,093.14 47,136.93 294.72Jind 30 193 1,850.74 2,039.78 40,511.57 443.75Hisar 47 291 5,114.71 5,005.35 65,122.28 1,112.28Fatehabad 30 146 2,650.52 2,752.92 37,266.40 239.24Sirsa 36 157 3,134.67 3,918.04 40,160.00 678.86Note :— The data upto the year 1987-88 is as on 30th June and 1988-89 onwards as on 31st March.

355
RURAL DEVELOPMENT AND CO-OPERATION Selected Statistics of Primary Agricultural Credit Societies in Haryana
No. 17.5 (Concld.)
Year/District
Borrowings (Lakh `)
Loans Advanced during the year (Lakh
`)
Loans Recovered (Lakh `)
Loans outstanding at the end of year (Lakh
`)
Over dues (Lakh. `)
Over dues as %age of
outstanding loans (%)
Societies showing
profit (No.)
1 8 9 10 11 12 13 14 1966-67 952.12 800.43 591.12 1,062.41 231.55 21.79 4,2631967-68 1,009.83 767.98 715.28 1,115.11 324.93 29.14 4,2061970-71 1,807.13 1,567.48 1,435.35 1,880.56 899.50 47.83 3,6481975-76 4,073.30 4,539.98 3,765.51 4,313.88 1,473.09 34.15 1,4331980-81 11,458.09 12,473.65 10,937.64 11,743.88 5,514.95 46.96 1,3641990-91 37,376.33 23,345.92 23,882.21 35,063.63 20,397.30 58.17 1,5131995-96 90,516.42 109,044.32 94,052.71 89,215.23 28,823.71 32.31 9032000-01 212,537.83 237,628.28 220,962.22 195,958.83 84,706.48 43.23 7202005-06 391,210 475,956 423,431 388,465 147,616.70 38 1,1982008-09 434,591.93 302,218.42 315,137.39 433,405.43 236,145.48 54.48 1472009-10 448,529.33 431,664.36 388,263.44 483,279.50 242,770.91 967.86 332010-11 493,651.44 513,567.98 475,295.25 527,964.15 246,044.61 46.60 80Ambala 17,778.57 17,778.57 17,681.92 32,846.30 13,904.54 42.33 9Panchkula 11,344.73 9,994.92 8,776.92 12,492.00 8,412.00 67.34 —Yamunanagar 24,231.73 22,619.05 19,776.31 27,009.56 15,925.37 58.96 2Kurukshetra 22,799.56 23,396.34 20,651.85 26,525.27 14,693.13 55.39 5Kaithal 30,042.38 29,528.40 28,123.33 29,496.19 14,618.19 49.56 1Karnal 44,876.27 48,513.87 41,106.06 45,843.91 20,845.05 45.47 11Panipat 27,184.90 32,664.68 31,507.18 27,640.74 11,355.80 41.08 2Sonipat 24,619.19 21,989.18 25,841.39 24,634.35 8,201.83 33.29 —Rohtak 16,615.12 20,329.58 16,939.25 18,410.97 5,963.91 32.39 11Jhajjar 25,260.61 30,471.39 28,340.25 28,859.46 11,227.38 38.90 8Faridabad 28,185.27 30,779.71 24,005.76 38,850.12 9,721.55 25.02 1Palwal — — — — — — —Gurgaon 29,189.33 30,812.74 29,439.74 25,114.66 13,540.15 53.91 3Mewat — — — — — — —Rewari 19,502.20 22,013.00 18,340.43 21,858.22 10,290.50 47.07 3Mahendragarh 13,655.56 13,172.28 13,137.90 14,806.75 8,391.35 50.67 2Bhiwani 37,829.71 34,305.65 32,848.60 34,775.20 19,728.62 56.73 —Jind 27,328.24 27,990.58 26,788.64 23,816.17 10,670.18 44.80 6Hisar 42,315.30 41,270.25 38,608.32 44,173.82 24,013.71 54.36 1Fatehabad 25,249.89 25,221.46 23,887.09 24,319.99 11,870.10 48.81 3Sirsa 25,642.88 30,716.33 29,494.31 26,490.47 12,671.25 47.83 12
Source : Registrar, Co-operative Societies, Haryana.
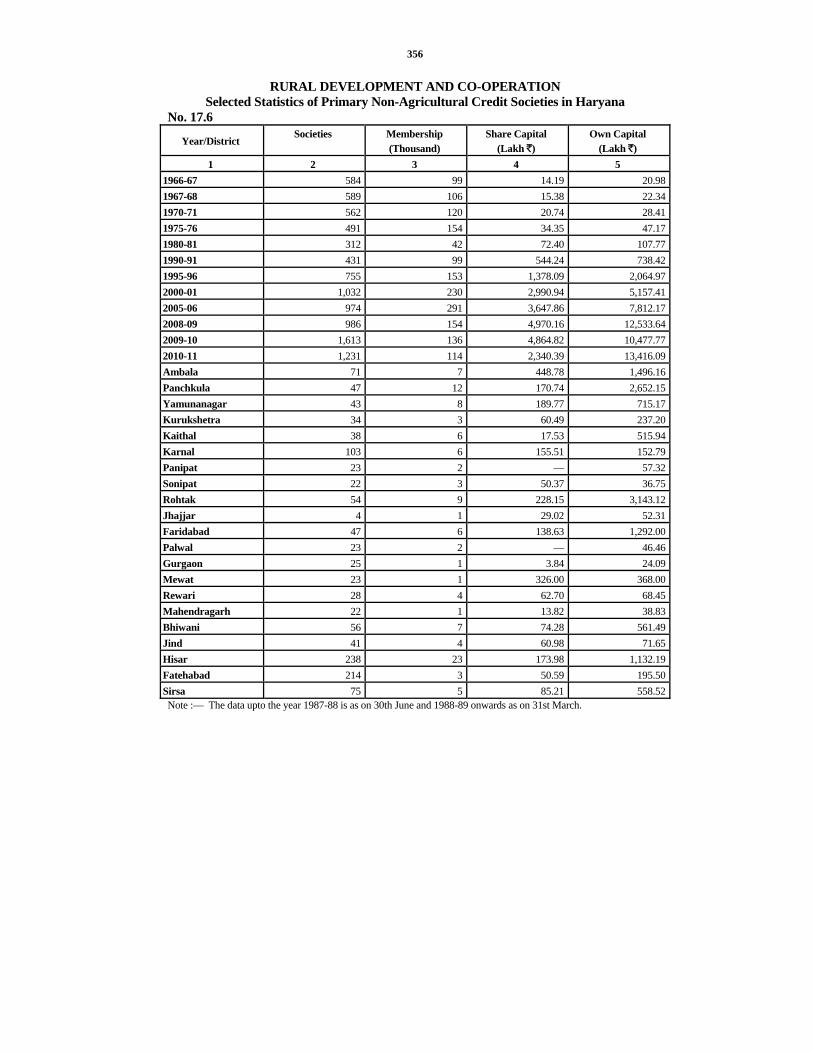
356
RURAL DEVELOPMENT AND CO-OPERATION Selected Statistics of Primary Non-Agricultural Credit Societies in Haryana
No. 17.6
Year/District Societies Membership
(Thousand) Share Capital
(Lakh `) Own Capital
(Lakh `) 1 2 3 4 5
1966-67 584 99 14.19 20.981967-68 589 106 15.38 22.341970-71 562 120 20.74 28.411975-76 491 154 34.35 47.171980-81 312 42 72.40 107.771990-91 431 99 544.24 738.421995-96 755 153 1,378.09 2,064.972000-01 1,032 230 2,990.94 5,157.412005-06 974 291 3,647.86 7,812.172008-09 986 154 4,970.16 12,533.642009-10 1,613 136 4,864.82 10,477.772010-11 1,231 114 2,340.39 13,416.09Ambala 71 7 448.78 1,496.16Panchkula 47 12 170.74 2,652.15Yamunanagar 43 8 189.77 715.17Kurukshetra 34 3 60.49 237.20Kaithal 38 6 17.53 515.94Karnal 103 6 155.51 152.79Panipat 23 2 — 57.32Sonipat 22 3 50.37 36.75Rohtak 54 9 228.15 3,143.12Jhajjar 4 1 29.02 52.31Faridabad 47 6 138.63 1,292.00Palwal 23 2 — 46.46Gurgaon 25 1 3.84 24.09Mewat 23 1 326.00 368.00Rewari 28 4 62.70 68.45Mahendragarh 22 1 13.82 38.83Bhiwani 56 7 74.28 561.49Jind 41 4 60.98 71.65Hisar 238 23 173.98 1,132.19Fatehabad 214 3 50.59 195.50Sirsa 75 5 85.21 558.52Note :— The data upto the year 1987-88 is as on 30th June and 1988-89 onwards as on 31st March.

357
RURAL DEVELOPMENT AND CO-OPERATION Selected Statistics of Primary Non-Agricultural Credit Societies in Haryana
No. 17.6 (Concld.)
Year/District
Working Capital (Lakh `)
Deposits (Lakh `)
Loans Advanced (Lakh `)
Outstanding loans
(Lakh `)
Over dues (Lakh `)
Over dues as %age of
out standing
Loans (%)
Societies showing
profit (No.)
1 6 7 8 9 10 11 12 1966-67 55.52 12.30 37.88 48.04 25.38 52.83 238 1967-68 59.85 15.85 40.81 51.18 19.77 38.63 218 1970-71 87.89 31.88 70.31 72.15 22.46 31.13 264 1975-76 187.20 85.96 125.15 135.99 37.58 27.63 130 1980-81 536.40 305.73 273.04 397.99 74.83 18.80 77 1990-91 5,673.16 3,438.26 3,535.18 4,273.26 606.55 14.19 218 1995-96 16,594.87 10,105.81 15,499 12,036.80 1,455.13 12.08 368 2000-01 42,599.25 16,949.25 28,652.58 29,012.57 5,528.48 19.06 501 2005-06 61,382.27 40,992.63 9,881.53 32,998.87 5,039.56 15.00 301 2008-09 79,546.38 47,691.13 28,982.12 39,210.67 11,759.58 29.99 356 2009-10 49,624.35 31,788.87 24,929.95 23,418.22 11,752.52 1,441.07 377 2010-11 45,556.25 17,152.04 11,790.45 27,880.90 12,406.24 44.50 321 Ambala 2,618.33 1,899.91 236.70 1,942.54 1,209.27 62.25 9 Panchkula 4,625.85 1,330.11 478.91 3,008.95 669.47 22.25 7 Yamunanagar 1,192.42 117.91 610.21 2,140.48 358.11 16.73 14 Kurukshetra 1,123.21 683.71 422.14 732.81 301.99 41.21 21 Kaithal 782.64 320.74 657.10 684.33 69.22 10.12 12 Karnal 2,694.66 2,187.48 2,698.79 2,067.71 128.58 6.22 15 Panipat 359.23 60.39 45.12 313.28 58.74 18.75 14 Sonipat 451.60 16.13 133.02 246.75 65.28 26.46 13 Rohtak 4,743.80 3,810.94 702.66 3,256.73 1,433.22 44.01 23 Jhajjar 122.57 10.59 97.66 106.42 — — 4 Faridabad 1,319.00 712.00 1,160.00 1,100.00 113.00 10.27 20 Palwal 891.74 32.06 41.48 280.46 147.28 52.51 10 Gurgaon 140.35 3.6 13.02 89.50 81.25 90.78 — Mewat 7,390.00 15.00 — 5,038.00 5,038.00 100.00 — Rewari 735.78 448.95 351.91 564.51 244.17 43.25 6 Mahendragarh 146.91 77.17 21.29 91.56 86.81 94.81 2 Bhiwani 1,466.77 70.40 70.18 1,049.13 443.89 42.31 18 Jind 839.38 481.70 370.38 689.88 126.20 18.29 23 Hisar 12,173.42 4,106.35 3,535.71 3,437.11 1,531.28 44.55 60 Fatehabad 765.81 376.43 3.02 223.90 90.57 40.45 29 Sirsa 972.78 390.47 141.15 816.85 209.91 25.70 21
Source : Registrar, Co-operative Societies, Haryana.

358
RURAL DEVELOPMENT AND CO-OPERATION
Selected Statistics of Primary Land Development Banks in Haryana No. 17.7 (Contd.)
Year/District Banks (No.) Membership (Lakh) 1 2 3
1966-67 11 0.131967-68 18 0.181970-71 27 0.561975-76 31 1.161980-81 33 1.751990-91 77 3.481995-96 80 4.672000-01 86 10.832005-06 19 6.822008-09 21 7.292009-10 19 7.492010-11 19 7.33Ambala 1 0.22Panchkula 1 0.09Yamunanagar 1 0.29Kurukshetra 1 0.25Kaithal 1 0.40Karnal 1 0.48Panipat 1 0.23Sonipat 1 0.33Rohtak 1 0.15Jhajjar 1 0.30Faridabad 1 0.68Palwal — —Gurgaon 1 0.58Mewat — —Rewari 1 0.29Mahendragarh 1 0.62Bhiwani 1 0.77Jind 1 0.42Hisar 1 0.42Fatehabad 1 0.38Sirsa 1 0.43Note :— The data upto the year 1987-88 is as on 30th June and 1988-89 onwards as on 31st March.

359
RURAL DEVELOPMENT AND CO-OPERATION Selected Statistics of Primary Land Development Banks in Haryana
No. 17.7 (Contd.)
Share Capital Loans advanced during the year
(Lakh `)
Year/District Held by Govt
(Lakh `).
Held by Others
(Lakh `)
Own Capital
(Lakh `)
Working Capital
(Lakh `)
Debt. Redemption
(Lakh `)-
For purchase of
land (Lakh `)
For purchase of
Tractors (Lakh `)
1 4 5 6 7 8 9 10 1966-67 — 21.51 23.23 191.94 7.06 3.95 3.371967-68 — 34.97 37.47 396.39 4.45 3.24 71.421970-71 — 154.54 172.65 2,424.10 3.07 39.42 128.931975-76 13.56 394.32 543.23 5,438.54 4.36 26.19 693.411980-81 65.65 745.22 1,240.92 10,743.14 109.29 80.09 191.571990-91 476.87 2,074.95 3,202.72 35,543.21 9.67 58.22 1,333.731995-96 895.97 3,826.75 6,313.46 70,274.83 105.27 79.52 6,040.932000-01 2,202.56 8,033.94 13,283.01 154,463.51 253.20 264.33 11,001.992005-06 1,971.35 9,519.50 12,231.94 300,250.94 — 2,103.63 2,206.802008-09 2,660.44 8,033.32 11,505.18 429,469.47 — 1,378.46 2,345.952009-10 2,748.06 8,400.54 14,777.59 277,566.43 — 1,133.41 1,878.012010-11 3,334.05 8,233.82 12,418.73 2,03,773.92 — 949.56 822.53Ambala 276.31 130.58 412.38 6,912.18 — — 36.50Panchkula — 59.83 60.20 1,233.29 — — —Yamunanagar 149.60 412.67 693.98 9,857.89 — 205.71 —Kurukshetra 156.80 340.97 541.98 7,655.71 — 276.95 27.85Kaithal 114.47 389.92 597.54 7,489.48 — 61.95 88.90Karnal 93.99 633.84 770.07 15,077.50 — 138.95 80.55Panipat 96.42 203.41 355.71 4,117.86 — 12.00 64.75Sonipat 149.24 495.90 667.01 11,887.31 — — 14.05Rohtak 64.08 157.09 225.31 2,854.63 — — 54.70Jhajjar 14.57 302.56 331.35 6,373.76 — — 99.55Faridabad 198.62 810.96 1,028.94 20,092.28 — — 45.80Palwal — — — — — — —Gurgaon 124.67 546.22 716.99 12,776.71 — 2.00 20.20Mewat — — — — — — —Rewari 165.09 296.51 515.89 6,009.17 — 4.50 128.50Mahendragarh 123.94 910.71 1,188.14 20,386.55 — — 6.50Bhiwani 224.37 994.29 1,273.26 22,956.26 — 44.00 52.40Jind 555.80 136.77 722.30 13,013.37 — 70.95 89.30Hisar 226.32 446.27 693.40 10,461.60 — 113.60 12.98Fatehabad 394.92 483.36 892.90 12,289.56 — 6.00 —Sirsa 204.84 481.96 731.38 12,328.81 — 12.95 —

360
RURAL DEVELOPMENT AND CO-OPERATION Selected Statistics of Primary Land Development Banks in Haryana
No. 17.7 (Contd.) Year/District Installation of Tubewells
(Lakh `) Other Land improvement
(Lakh `) 1 11 12
1966-67 17.53 5.261967-68 112.10 30.741970-71 280.77 132.411975-76 444.25 160.381980-81 345.45 2,325.651990-91 1,871.36 2,039.471995-96 4,356.19 9,180.952000-01 4,103.38 15,288.932005-06 1,100.45 24,857.012008-09 730.93 28,638.982009-10 667.07 33,928.032010-11 464.35 38,518.55Ambala 150.40 1,272.00Panchkula — 88.43Yamunanagar 30.50 1,109.31Kurukshetra — 1,542.85Kaithal — 696.78Karnal — 2,658.57Panipat — 234.86Sonipat 127.50 3,202.40Rohtak 1.00 450.78Jhajjar — 956.43Faridabad 63.90 3774.86Palwal — —Gurgaon — 1,724.92Mewat — —Rewari — 870.20Mahendragarh — 3,475.87Bhiwani 19.75 5,052.17Jind 10.50 2,031.83Hisar 38.45 2,857.40Fatehabad 19.15 3,423.16Sirsa 3.20 3,095.73Note :— The data upto the year 1987-88 is as on 30th June and 1988-89 onwards as on 31st March.

361
RURAL DEVELOPMENT AND CO-OPERATION Selected Statistics of Primary Land Development Banks in Haryana
No. 17.7 (Concld.) Year/District Total
Columns 8 to 12 (Lakh `)
Loans recovered during the year (Lakh
`)
Overdues (Lakh `)
No. of Banks
showing profit
Amount of profit
(Lakh `)
No. of Banks
showing loss
Amount of Loss
Lakh `)
1 13 14 15 16 17 18 19 1966-67 57.17 17.18 1.98 7 0.27 4 0.251967-68 221.95 20.95 0.12 9 0.34 7 0.631970-71 584.60 273.92 0.27 25 19.84 1 0.011975-76 1,328.59 838.32 21.05 27 34.14 2 0.341980-81 3,052.05 1,707.38 182.37 29 68.14 2 4.871990-91 5,312.45 3,860.65 7,093.33 24 323.65 53 910.201995-96 19,762.86 8,540.73 8,130.92 48 497.53 31 351.652000-01 30,911.83 18,085.50 37,076.01 23 260.81 63 2,755.222005-06 30,267.89 48,866.52 75,728.28 1 66.35 18 7,253.402008-09 33,094.32 25,023.84 87,052.21 4 2,532.45 15 4,493.162009-10 37,606.52 38,583.39 100,734.53 — — 19 16,175.902010-11 40,754.99 54,350.47 1,02,570.54 — — 19 11,657.03Ambala 1,458.90 1,785.48 3,216.40 — — 1 436.39Panchkula 88.43 277.57 1,347.85 — — 1 14.05Yamunanagar 1,345.52 2,831.22 3,718.00 — — 1 584.24Kurukshetra 1,847.65 2,397.90 3,386.71 — — 1 237.62Kaithal 847.63 1,662.67 5,660.78 — — 1 644.52Karnal 2,878.07 3,982.69 9,859.77 — — 1 669.00Panipat 311.61 1,077.25 2,541.48 — — 1 274.91Sonipat 3,343.95 3,698.98 3,540.64 — — 1 365.63Rohtak 506.48 788.88 1,429.38 — — 1 438.22Jhajjar 1,055.98 2,081.14 3,345.59 — — 1 568.60Faridabad 3,884.56 4,918.54 8,560.10 — — 1 698.80Palwal — — — — — — —Gurgaon 1,747.12 2,099.18 7,549.37 — — 1 1,064.66Mewat — — — — — — —Rewari 1,003.20 1,730.42 1,962.04 — — 1 342.03Mahendragarh 3,482.37 4.654.98 13,476.47 — — 1 729.65Bhiwani 5,168.32 5,966.25 12,696.17 — — 1 1,700.82Jind 2,202.58 3,519.06 10,629.55 — — 1 1,027.50Hisar 3,022.43 3,266.89 4,017.42 — — 1 533.19Fatehabad 3,448.31 3,607.45 2,826.97 — — 1 432.73Sirsa 3,111.88 4,003.92 2,805.85 — — 1 894.47
Source : Registrar, Co-operative Societies, Haryana.

362
RURAL DEVELOPMENT AND CO-OPERATION Selected Statistics of Central Co-operative Banks in Haryana
No. 17.8 Share Capital
Year/District
No. of Banks
No. of Branches
Membership (Thousand) Held by
Govt. (Lakh `)
Held by Others
(Lakh `)
Own Capital (Lakh `)
1 2 3 4 5 6 7 1966-67 10 30 11 40.49 102.42 246.631967-68 10 31 11 55.99 135.82 310.041970-71 9 59 11 124.74 276.61 598.451975-76 12 135 12 205.06 548.40 1,306.251980-81 13 194 8 523.70 730.88 2,909.101990-91 13 263 10 1,411.66 2,058.62 6,581.371995-96 17 302 16 2,878.00 4,424.78 11,907.172000-01 19 344 24.9 3,143.03 10,385.21 30,207.112005-06 19 359 27.7 3,718.00 18,974.00 64,663.002008-09 19 594 27.9 5,068.00 21,233.00 56,134.002009-10 19 594 9,529 3,271.00 24,225.00 6 6772.002010-11 19 595 — 3,142.00 26,617.00 66,636.00Ambala 1 28 — 271.00 1,196.00 2,904.00Panchkula 1 12 — 111.00 611.00 1,917.00Yamunanagar 1 31 — 12.00 1,234.00 2,737.00Kurukshetra 1 36 — 50.00 1,240.00 2,447.00Kaithal 1 29 — 327.00 1,504.00 3,415.00Karnal 1 46 — 53.00 2,137.00 5,864.00Panipat 1 22 — 170.00 1,455.00 6,301.00Sonipat 1 35 — 296.00 1,312.00 3,658.00Rohtak 1 26 — 28.00 756.00 3,762.00Jhajjar 1 24 — 83.00 1,228.00 4,603.00Faridabad 1 33 — 102.00 1,640.00 5,749.00Palwal — — — — — —Gurgaon 1 38 — 134.00 1,412.00 4,231.00Mewat — — — — — —Rewari 1 27 — 140.00 1,051.00 2,838.00Mahendragarh 1 21 — 59.00 892.00 3,232.00Bhiwani 1 38 — 268.00 1,920.00 3,323.00Jind 1 33 — 472.00 1,436.00 1,947.00Hisar 1 46 — 249.00 3,100.00 3,501.00Fatehabad 1 29 — 50.00 1,099.00 3,020.00Sirsa 1 41 — 267.00 1,394.00 1,187.00

363
RURAL DEVELOPMENT AND CO-OPERATION Selected Statistics of Central Co-operative Banks in Haryana
No. 17.8 (Concld.)
Year/District
Working Capital
(Lakh `)
Deposits (Lakh `) Borrowings (Lakh `)
Loans advanced during the
year (Lakh `)
Loans outstanding at the end of the Year (Lakh `)
Over dues (Lakh `)
1 8 9 10 11 12 13 1966-67 1,481.57 493.62 695.26 936.02 1,105.94 177.051967-68 1,577.37 617.80 621.59 911.35 1,161.76 274.261970-71 2,445.04 1,000.89 718.41 1,738.17 1,916.33 704.271975-76 6,471.84 2,758.92 1,558.07 6,163.59 4,600.01 1,394.431980-81 16,451.22 5,945.54 6,715.25 16,015.19 12,627.25 3,862.271990-91 60,483.48 25,823.04 26,446.17 36,843.15 45,726.29 13,661.381995-96 148,420.75 58,837.85 71,174.27 153,152.00 118,251.50 30,144.542000-01 339,765.96 146,173.39 147,797.71 683,629.34 274,414.12 77,468.152005-06 595,660.00 279,840.00 220,283.00 556,450.00 458,156.00 109,027.002008-09 795,417.00 380,023.00 274,217.00 454,418.00 552,909.00 229,526.002009-10 836,560.56 443,795.79 265,115.99 454,419.00 550,819.00 229,527.002010-11 9,69,689.00 4,94,019.00 3,36,327.00 6,93,265.00 6,59,580.00 2,37,133.00Ambala 40,608.00 25,895.00 9,850.00 22,119.00 25,905.00 11,689.00Panchkula 25,949.00 14,806.00 6,700.00 12,358.00 16,791.00 5,919.00Yamunanagar 43,406.00 23,324.00 12,296.00 28,156.00 30,107.00 13,291.00Kurukshetra 49,230.00 22,366.00 20,949.00 43,511.00 37,105.00 10,306.00Kaithal 47,003.00 16,953.00 24,857.00 43,034.00 38,864.00 14,064.00Karnal 75,700.00 28,868.00 36,932.00 68,589.00 59,131.00 19,601.00Panipat 49,195.00 18,846.00 21,568.00 48,777.00 38,260.00 11,941.00Sonipat 49,690.00 24,609.00 16,725.00 41,335.00 35,465.00 12,117.00Rohtak 49,573.00 32,588.00 11,707.00 35,256.00 27,551.00 5,791.00Jhajjar 48,951.00 28,690.00 13,000.00 37,544.00 33,225.00 10,928.00Faridabad 57,218.00 26,297.00 18,977.00 37,502.00 40,657.00 15,387.00Palwal — — — — — —Gurgaon 95,753.00 67,741.00 14,048.00 35,165.00 34,452.00 12,845.00Mewat — — — — — —Rewari 35,012.00 20,623.00 9,837.00 25,229.00 24,746.00 8,473.00Mahendragarh 26,638.00 13,681.00 7,610.00 16,609.00 17,371.00 7,965.00Bhiwani 72,375.00 45,183.00 18,470.00 40,589.00 45,367.00 22,341.00Jind 43,464.00 18,873.00 19,800.00 34,534.00 33,958.00 13,384.00Hisar 78,850.00 37,569.00 30,216.00 51,068.00 56,526.00 21,924.00Fatehabad 40,976.00 11,063.00 23,487.00 36,560.00 33,744.00 10,673.00Sirsa 40,098.00 16,044.00 19,298.00 35,330.00 30,355.00 8,494.00
Source : Registrar, Co-operative Societies, Haryana.

364
RURAL DEVELOPMENT AND CO-OPERATION Selected Statistics of Central Co-operative Banks in Haryana
No. 17.8 (Concld.)
Year/District
Over dues as percentage of outstanding
Loans
Banks Showing Profit (No.)
Profit (Lakh `)
No. of Banks showing Loss
Loss (Lakh `)
1 14 15 16 17 18 1966-67 16.01 10 15.71 — —1967-68 23.61 9 19.47 1 0.541970-71 36.75 9 46.32 — —1975-76 30.31 12 151.38 — —1980-81 30.59 13 149.65 — —1990-91 29.88 11 139.34 2 44.421995-96 25.49 16 1,330.28 1 18.472000-01 28.23 17 2,032.52 2 126.012005-06 24.00 17 2,516.00 2 700.002008-09 41.51 18 3,113.00 1 910.002009-10 41.67 18 3,113.00 1 910.002010-11 35.95 14 447.00 5 2,527.00Ambala 45.12 — — 1 119.00Panchkula 35.25 1 63.00 — —Yamunanagar 44.15 — — 1 869.00Kurukshetra 27.78 — — 1 392.00Kaithal 36.19 1 10.00 — —Karnal 33.15 1 62.00 — —Panipat 31.12 1 113.00 — —Sonipat 34.17 1 19.00 — —Rohtak 21.02 1 54.00 — —Jhajjar 32.89 1 22.00 — —Faridabad 37.85 1 27.00 — —Palwal — — — — —Gurgaon 37.28 1 25.00 — —Mewat — — — — —Rewari 34.24 1 3.00 — —Mahendragarh 45.85 1 15.00 — —Bhiwani 49.25 1 7.00 — —Jind 39.41 1 — 1 530.00Hisar 38.79 — 21.00 — —Fatehabad 31.63 1 6.00 — —Sirsa 27.98 — — 1 617.00
RURAL DEVELOPMENT AND COOPERATION Selected Statistics of Apex State Marketing Federations in Haryana

365
No. 17.9 Share capital
Year Membership
No. Held by Govt.
(Lakh `)
Held by Others
(Lakh `)
Own Funds (Lakh `)
Working capital
(Lakh `)
Quantity of produce
processed (Tonnes)
1 2 3 4 5 6 7
1966-67 59 22.40 0.96 40.60 179.18 —
1967-68 60 45.25 1.09 58.84 279.37 —
1970-71 64 98.06 8.68 143.05 1,440.63 —
1975-76 76 244.71 24.96 506.65 3,421.63 41,383
1980-81 78 656.18 86.14 1,665.19 6,309.62 79,406
1990-91 77 1,639.45 183.71 5,285.00 19,002.91 1,96,824
1995-96 78 1,579.41 294.37 18,397.16 44,809.27 1,06,902
2002-03 79 19.00 686.00 34,364.00 8,144.00 59,954
2005-06 74 18.75 810.83 38,184.00 19,810.00 10,18,611
2008-09 74 18.75 1,040.97 51,768.00 27,020.00 8,081.88
2009-10 74 18.75 1,273.00 560.00 24,563.00 —
2010-11 74 18.75 1,421.00 67,547.00 20,916.00 —Note :—The data upto the year 1987-88 is as on 30th June and 1988-89 onwards as on 31st March.

366
RURAL DEVELOPMENT AND COOPERATION Selected Statistics of Apex State Marketing Federations in Haryana
No. 17.9 (Concld.)
Year
Value of Produce
processed (Lakh `)
Business turnover (Lakh `)
Agricultural Produce
Marketed (Lakh `)
Seed Distributed
(Lakh `)
Fertilizer distributed (Lakh `)
Consumer goods distri buted
(Lakh `)
Profit (Lakh `)
1 8 9 10 11 12 13 14 1966-67 — 231.32 4.54 18.25 201.77 0.10 0.911967-68 — 477.69 77.03 52.43 342.69 — 2.081970-71 — 1,862.54 652.59 — 1,200.01 — 5.731975-76 440.25 6,300.91 3,126.65 27.14 2,919.95 84.56 56.031980-81 — 16,669.31 10,934.42 175.50 4,728.17 752.25 100.121990-91 7,800.31 26,761.33 19,476.18 43.10 7,171.90 — 699.801995-96 11,002.73 87,097.47 65,884.22 34.21 21,132.45 — 929.962002-03 31,834.96 3,65,892.00 1,40,668.00 139.20 17,258,00 372.53 2,203.002005-06 75,461.20 3,09,509.00 2,49,339.00 169.36 26,298.75 305.14 5,836.002008-09 80,957.00 3,09,229.00 1,44,238.00 58.09 46,016.00 1,740.00 3,378.002009-10 114,573.00 425,355.00 401,788.00 1,785.00 46,305.00 3,892.00 4,345.002010-11 119,130.00 548,900.00 374,676.00 36 52,057.00 5,691.00 4,080.00
Source : Registrar, Cooperative Societies, Haryana.
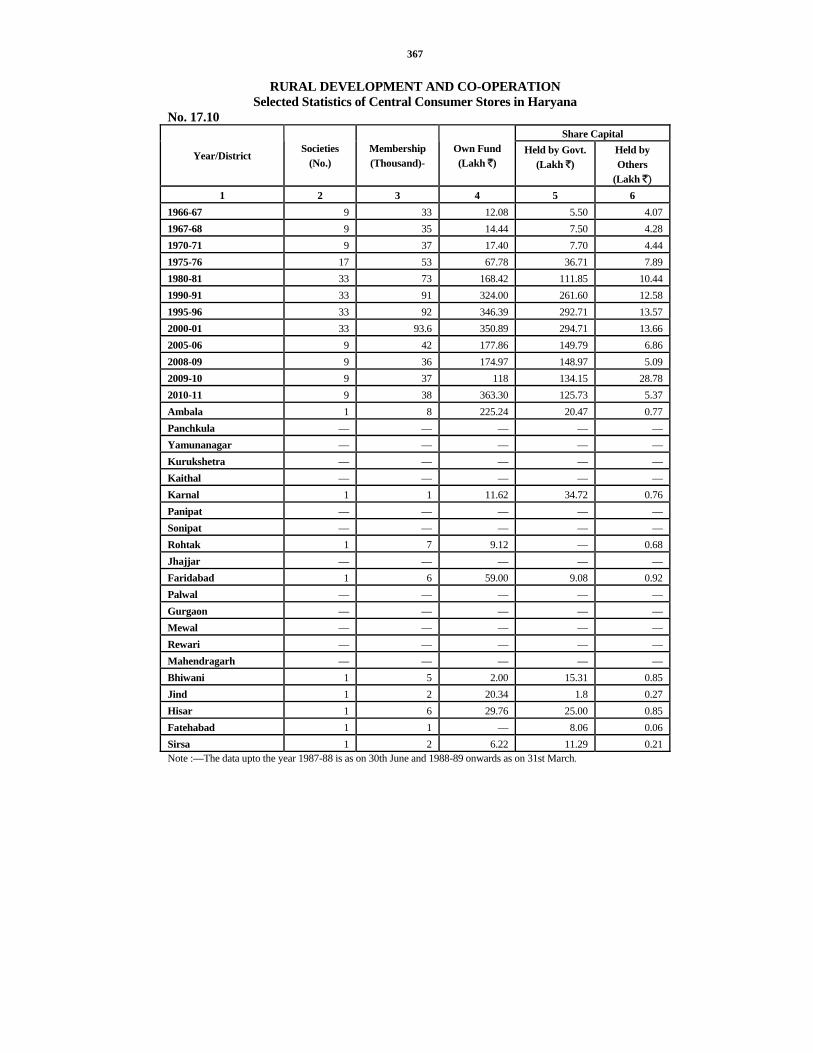
367
RURAL DEVELOPMENT AND CO-OPERATION Selected Statistics of Central Consumer Stores in Haryana
No. 17.10 Share Capital
Year/District Societies
(No.) Membership (Thousand)-
Own Fund (Lakh `)
Held by Govt. (Lakh `)
Held by Others
(Lakh ` 1 2 3 4 5 6
1966-67 9 33 12.08 5.50 4.07 1967-68 9 35 14.44 7.50 4.28 1970-71 9 37 17.40 7.70 4.44 1975-76 17 53 67.78 36.71 7.89 1980-81 33 73 168.42 111.85 10.44 1990-91 33 91 324.00 261.60 12.58 1995-96 33 92 346.39 292.71 13.57 2000-01 33 93.6 350.89 294.71 13.66 2005-06 9 42 177.86 149.79 6.86 2008-09 9 36 174.97 148.97 5.09 2009-10 9 37 118 134.15 28.78 2010-11 9 38 363.30 125.73 5.37 Ambala 1 8 225.24 20.47 0.77 Panchkula — — — — — Yamunanagar — — — — — Kurukshetra — — — — — Kaithal — — — — — Karnal 1 1 11.62 34.72 0.76 Panipat — — — — — Sonipat — — — — — Rohtak 1 7 9.12 — 0.68 Jhajjar — — — — — Faridabad 1 6 59.00 9.08 0.92 Palwal — — — — — Gurgaon — — — — — Mewal — — — — — Rewari — — — — — Mahendragarh — — — — — Bhiwani 1 5 2.00 15.31 0.85 Jind 1 2 20.34 1.8 0.27 Hisar 1 6 29.76 25.00 0.85 Fatehabad 1 1 — 8.06 0.06 Sirsa 1 2 6.22 11.29 0.21 Note :—The data upto the year 1987-88 is as on 30th June and 1988-89 onwards as on 31st March.
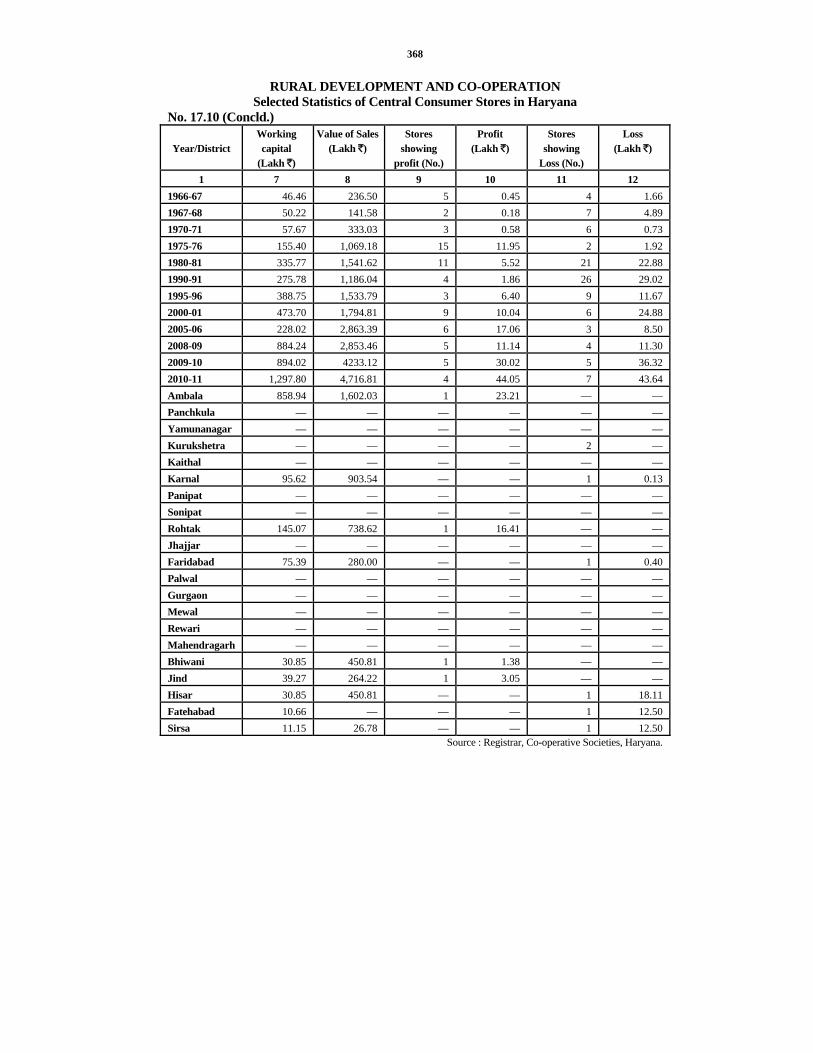
368
RURAL DEVELOPMENT AND CO-OPERATION Selected Statistics of Central Consumer Stores in Haryana
No. 17.10 (Concld.)
Year/District Working capital
(Lakh `)
Value of Sales (Lakh `)
Stores showing
profit (No.)
Profit (Lakh `)
Stores showing
Loss (No.)
Loss (Lakh `)
1 7 8 9 10 11 12 1966-67 46.46 236.50 5 0.45 4 1.66 1967-68 50.22 141.58 2 0.18 7 4.89 1970-71 57.67 333.03 3 0.58 6 0.73 1975-76 155.40 1,069.18 15 11.95 2 1.92 1980-81 335.77 1,541.62 11 5.52 21 22.88 1990-91 275.78 1,186.04 4 1.86 26 29.02 1995-96 388.75 1,533.79 3 6.40 9 11.67 2000-01 473.70 1,794.81 9 10.04 6 24.88 2005-06 228.02 2,863.39 6 17.06 3 8.50 2008-09 884.24 2,853.46 5 11.14 4 11.30 2009-10 894.02 4233.12 5 30.02 5 36.32 2010-11 1,297.80 4,716.81 4 44.05 7 43.64 Ambala 858.94 1,602.03 1 23.21 — — Panchkula — — — — — — Yamunanagar — — — — — — Kurukshetra — — — — 2 — Kaithal — — — — — — Karnal 95.62 903.54 — — 1 0.13 Panipat — — — — — — Sonipat — — — — — — Rohtak 145.07 738.62 1 16.41 — — Jhajjar — — — — — — Faridabad 75.39 280.00 — — 1 0.40 Palwal — — — — — — Gurgaon — — — — — — Mewal — — — — — — Rewari — — — — — — Mahendragarh — — — — — — Bhiwani 30.85 450.81 1 1.38 — — Jind 39.27 264.22 1 3.05 — — Hisar 30.85 450.81 — — 1 18.11 Fatehabad 10.66 — — — 1 12.50 Sirsa 11.15 26.78 — — 1 12.50
Source : Registrar, Co-operative Societies, Haryana.
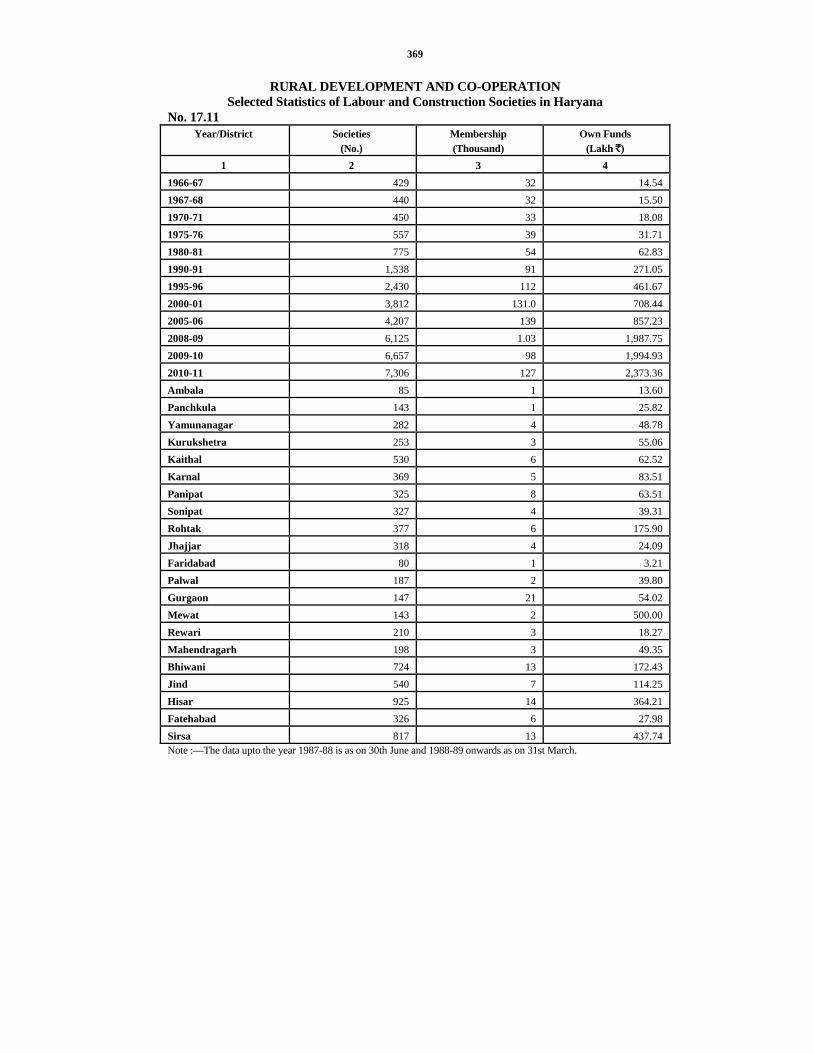
369
RURAL DEVELOPMENT AND CO-OPERATION Selected Statistics of Labour and Construction Societies in Haryana
No. 17.11 Year/District Societies
(No.) Membership (Thousand)
Own Funds (Lakh `)
1 2 3 4 1966-67 429 32 14.54 1967-68 440 32 15.50 1970-71 450 33 18.08 1975-76 557 39 31.71 1980-81 775 54 62.83 1990-91 1,538 91 271.05 1995-96 2,430 112 461.67 2000-01 3,812 131.0 708.44 2005-06 4,207 139 857.23 2008-09 6,125 1.03 1,987.75 2009-10 6,657 98 1,994.93 2010-11 7,306 127 2,373.36 Ambala 85 1 13.60 Panchkula 143 1 25.82 Yamunanagar 282 4 48.78 Kurukshetra 253 3 55.06 Kaithal 530 6 62.52 Karnal 369 5 83.51 Panipat 325 8 63.51 Sonipat 327 4 39.31 Rohtak 377 6 175.90 Jhajjar 318 4 24.09 Faridabad 80 1 3.21 Palwal 187 2 39.80 Gurgaon 147 21 54.02 Mewat 143 2 500.00 Rewari 210 3 18.27 Mahendragarh 198 3 49.35 Bhiwani 724 13 172.43 Jind 540 7 114.25 Hisar 925 14 364.21 Fatehabad 326 6 27.98 Sirsa 817 13 437.74 Note :—The data upto the year 1987-88 is as on 30th June and 1988-89 onwards as on 31st March.
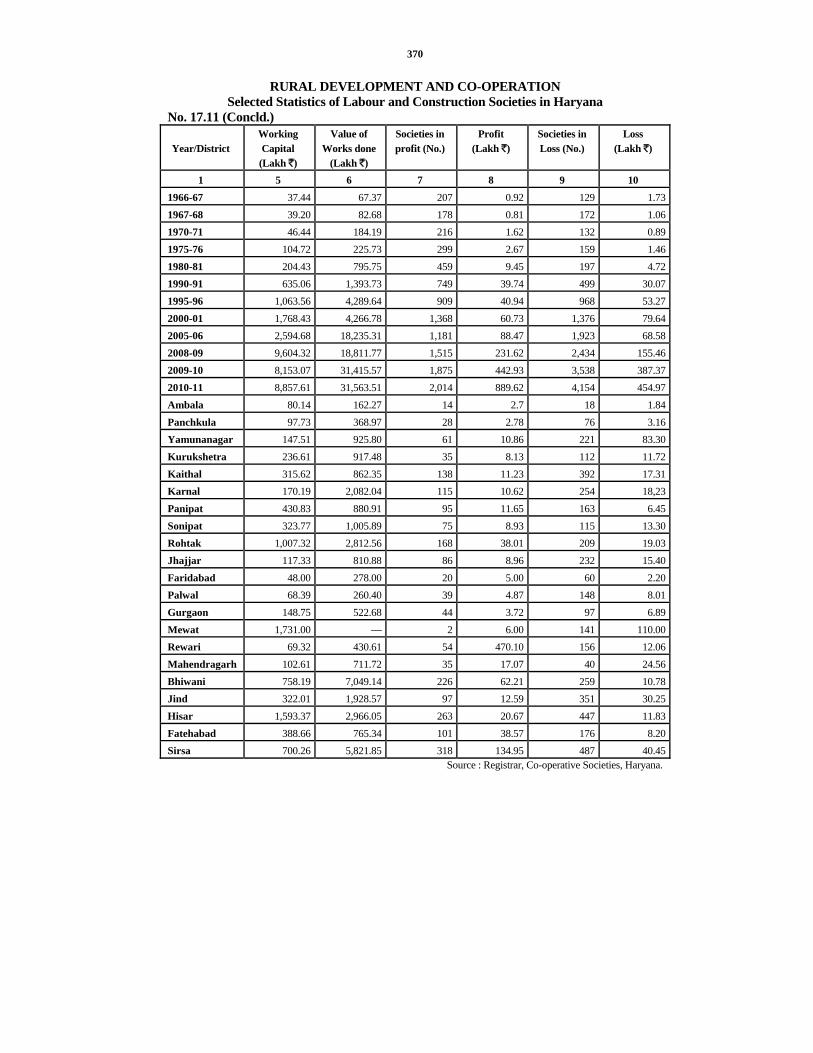
370
RURAL DEVELOPMENT AND CO-OPERATION Selected Statistics of Labour and Construction Societies in Haryana
No. 17.11 (Concld.)
Year/District Working Capital
(Lakh `)
Value of Works done
(Lakh `)
Societies in profit (No.)
Profit (Lakh `)
Societies in Loss (No.)
Loss (Lakh `)
1 5 6 7 8 9 10 1966-67 37.44 67.37 207 0.92 129 1.731967-68 39.20 82.68 178 0.81 172 1.061970-71 46.44 184.19 216 1.62 132 0.891975-76 104.72 225.73 299 2.67 159 1.461980-81 204.43 795.75 459 9.45 197 4.721990-91 635.06 1,393.73 749 39.74 499 30.071995-96 1,063.56 4,289.64 909 40.94 968 53.272000-01 1,768.43 4,266.78 1,368 60.73 1,376 79.642005-06 2,594.68 18,235.31 1,181 88.47 1,923 68.582008-09 9,604.32 18,811.77 1,515 231.62 2,434 155.462009-10 8,153.07 31,415.57 1,875 442.93 3,538 387.372010-11 8,857.61 31,563.51 2,014 889.62 4,154 454.97Ambala 80.14 162.27 14 2.7 18 1.84Panchkula 97.73 368.97 28 2.78 76 3.16Yamunanagar 147.51 925.80 61 10.86 221 83.30Kurukshetra 236.61 917.48 35 8.13 112 11.72Kaithal 315.62 862.35 138 11.23 392 17.31Karnal 170.19 2,082.04 115 10.62 254 18,23Panipat 430.83 880.91 95 11.65 163 6.45Sonipat 323.77 1,005.89 75 8.93 115 13.30Rohtak 1,007.32 2,812.56 168 38.01 209 19.03Jhajjar 117.33 810.88 86 8.96 232 15.40Faridabad 48.00 278.00 20 5.00 60 2.20Palwal 68.39 260.40 39 4.87 148 8.01Gurgaon 148.75 522.68 44 3.72 97 6.89Mewat 1,731.00 — 2 6.00 141 110.00Rewari 69.32 430.61 54 470.10 156 12.06Mahendragarh 102.61 711.72 35 17.07 40 24.56Bhiwani 758.19 7,049.14 226 62.21 259 10.78Jind 322.01 1,928.57 97 12.59 351 30.25Hisar 1,593.37 2,966.05 263 20.67 447 11.83Fatehabad 388.66 765.34 101 38.57 176 8.20Sirsa 700.26 5,821.85 318 134.95 487 40.45
Source : Registrar, Co-operative Societies, Haryana.

371
RURAL DEVELOPMENT AND CO-OPERATION Selected Statistics of Housing Co-operative Societies, Haryana
No. 17.12 Year/District Societies
(No.) Membership (Thousand)
Own Funds (Lakh `)
1 2 3 4 1966-67 102 6 18.101967-68 104 6 19.651970-71 93 7 24.281975-76 122 11 31.331980-81 133 19 59.761990-91 1,484 115 503.771995-96 1,879 136 1,080.352000-01 1,878 148 1,250.512005-06 15,676 481 1,402.362008-09 15,394 533 3,773.832009-10 14,296 491 7,723.302010-11 15,934 498 17,909.60Ambala 34 3 35.40Panchkula 5,283 138 191.24Yamunanagar 30 3 77.12Kurukshetra 29 2 200.89Kaithal 25 2 23.25Karnal 32 1 29.86Panipat 459 3 295.60Sonipat 1,155 2 66.20Rohtak 34 4 5,163.14Jhajjar 6 1 0.29Faridabad 3,947 98 8,771.00Palwal 228 1 1,361.00Gurgaon 3,850 185 1,215.39Mewat 2 1 23.00Rewari 572 11 57.95Mahendragarh 7 1 21.14Bhiwani 20 4 54.76Jind 23 3 15.99Hisar 124 22 119.90Fatehabad 28 5 77.80Sirsa 46 8 108.68Note :—The data upto the year 1987-88 is as on 30th June and 1988-89 onwards as on 31st March.

372
RURAL DEVELOPMENT AND CO-OPERATION Selected Statistics of Housing Co-operative Societies, Haryana
No. 17.12 (Concld.)
Year/District
Working Capital
(Lakh `)
Houses constructed upto the end of the year
(No.)
Societies in profit (No.)
Profit (Lakh `)
Societies in Loss (No.)
Loss (Lakh ` )
1 5 6 7 8 9 10 1966-67 56.20 1,294 27 0.92 38 0.721967-68 58.63 1,297 33 0.83 30 0.331970-71 77.31 2,370 36 1.04 22 0.601975-76 142.99 2,724 18 0.06 29 0.511980-81 384.75 3,123 40 0.95 47 2.551990-91 8,977.51 25,650 503 32.48 438 41.351995-96 27,106.03 33,039 880 52.26 723 60.232000-01 50,511.49 50,110 949 48.13 667 47.332005-06 24,983.12 42,164 324 58.17 1,252 41.892008-09 61,263.41 78,956 2,143 0.89 9,725 331,542009-10 129,641.85 72,489 2,393 128.08 9,459 610.032010-11 41,712.93 25,771 2,328 127.36 8,121 725.90Ambala 451.02 — 4 13.81 15 7.95Panchkula 259.57 378 12 0.13 5,255 18.97Yamunanagar 797.29 — 4 1.63 26 277.26Kurukshetra 263.32 — 10 3.63 17 8.39Kaithal 274.85 — 6 0.64 19 3.79Karnal 276.59 229 — — 26 4.57Panipat 1,446.45 10 4 1.61 252 3.33Sonipat 119.93 272 2 1.05 14 5.75Rohtak 2,836.18 468 9 10.52 14 21.63Jhajjar 132.17 148 2 0.31 4 0.28Faridabad 8,695.00 4,300 13 3.5 189 86.00Palwal 1.22 — — — 28 7.56Gurgaon 7,347.45 13,055 2,177 45.95 1,654 182.75Mewat 84.00 215 — — 2 3.00Rewari 2,447.26 247 8 2.36 464 36.13Mahendragarh 86.60 697 1 5.78 6 1.79Bhiwani 268.79 678 7 4.50 8 2.64Jind 248.79 470 7 4.58 8 2.56Hisar 15.093.37 306 47 15.84 74 4.20Fatehabad 352.52 452 10 7.45 12 15.19Sirsa 230.56 3,846 5 4.07 34 32.16
Source : Registrar, Co-operative Societies, Haryana.
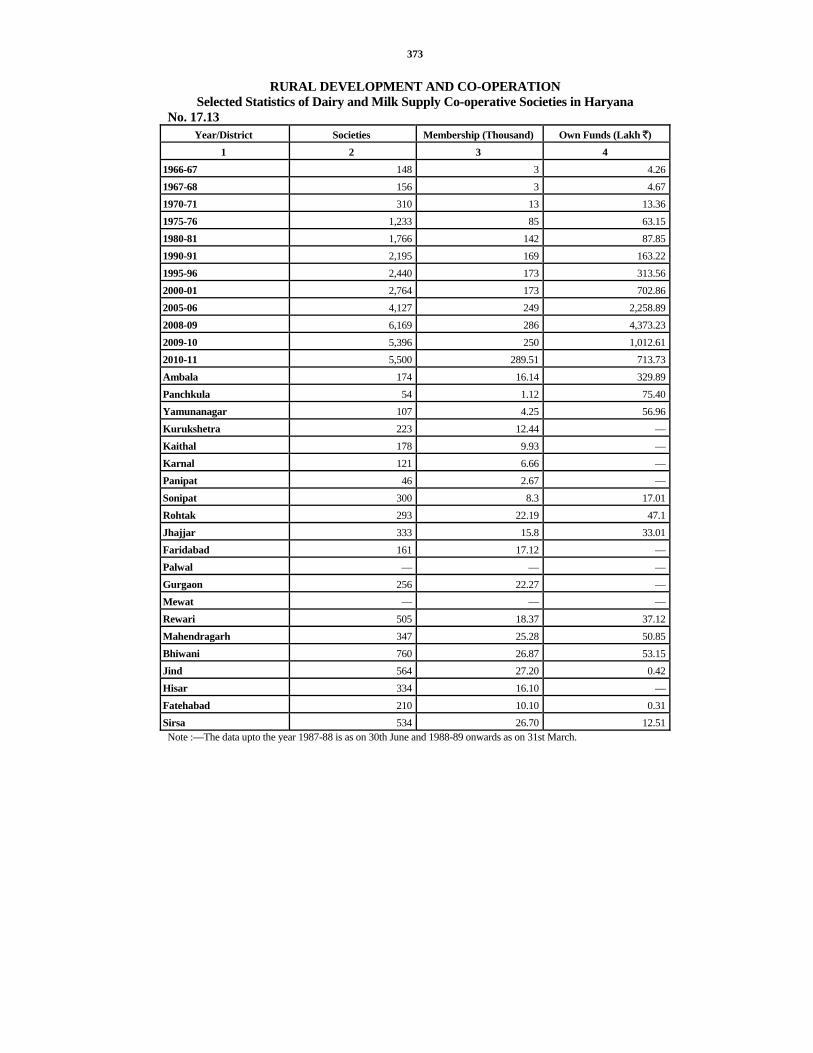
373
RURAL DEVELOPMENT AND CO-OPERATION Selected Statistics of Dairy and Milk Supply Co-operative Societies in Haryana
No. 17.13 Year/District Societies Membership (Thousand) Own Funds (Lakh `)
1 2 3 4 1966-67 148 3 4.261967-68 156 3 4.671970-71 310 13 13.361975-76 1,233 85 63.151980-81 1,766 142 87.851990-91 2,195 169 163.221995-96 2,440 173 313.562000-01 2,764 173 702.862005-06 4,127 249 2,258.892008-09 6,169 286 4,373.232009-10 5,396 250 1,012.612010-11 5,500 289.51 713.73Ambala 174 16.14 329.89Panchkula 54 1.12 75.40Yamunanagar 107 4.25 56.96Kurukshetra 223 12.44 —Kaithal 178 9.93 —Karnal 121 6.66 —Panipat 46 2.67 —Sonipat 300 8.3 17.01Rohtak 293 22.19 47.1Jhajjar 333 15.8 33.01Faridabad 161 17.12 —Palwal — — —Gurgaon 256 22.27 —Mewat — — —Rewari 505 18.37 37.12Mahendragarh 347 25.28 50.85Bhiwani 760 26.87 53.15Jind 564 27.20 0.42Hisar 334 16.10 —Fatehabad 210 10.10 0.31Sirsa 534 26.70 12.51Note :—The data upto the year 1987-88 is as on 30th June and 1988-89 onwards as on 31st March.
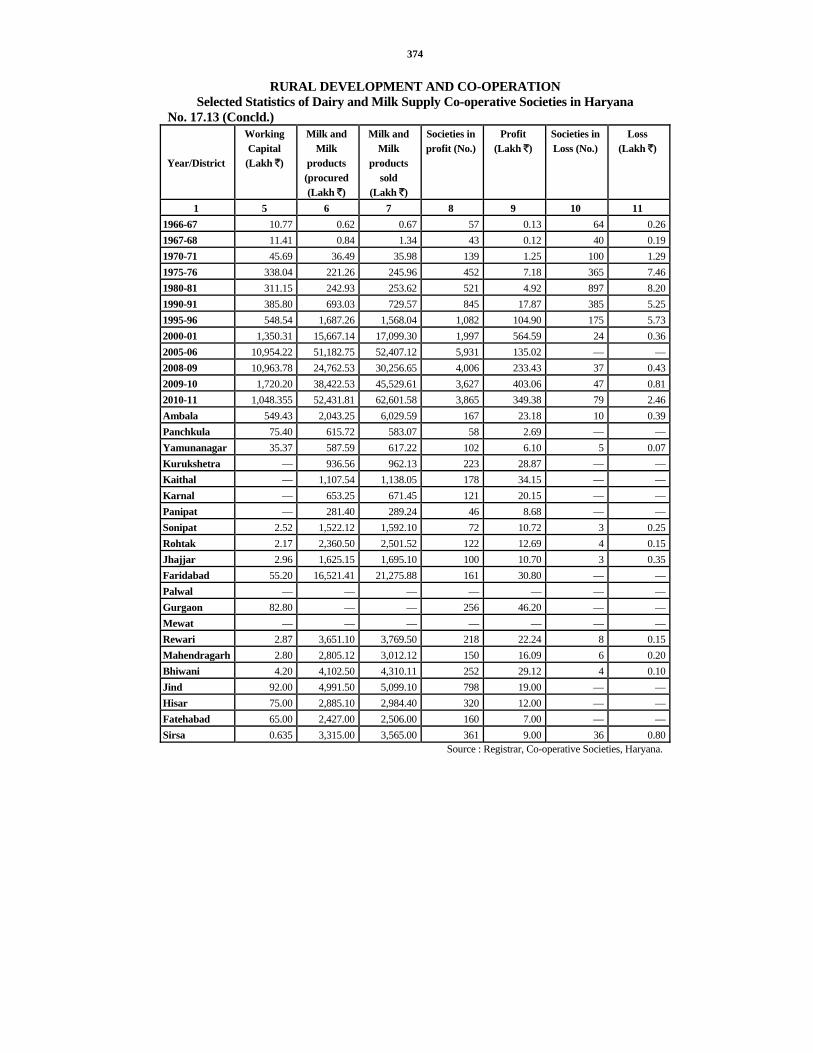
374
RURAL DEVELOPMENT AND CO-OPERATION Selected Statistics of Dairy and Milk Supply Co-operative Societies in Haryana
No. 17.13 (Concld.)
Year/District
Working Capital
(Lakh `)
Milk and Milk
products (procured (Lakh `)
Milk and Milk
products sold
(Lakh `)
Societies in profit (No.)
Profit (Lakh `)
Societies in Loss (No.)
Loss (Lakh `)
1 5 6 7 8 9 10 11 1966-67 10.77 0.62 0.67 57 0.13 64 0.261967-68 11.41 0.84 1.34 43 0.12 40 0.191970-71 45.69 36.49 35.98 139 1.25 100 1.291975-76 338.04 221.26 245.96 452 7.18 365 7.461980-81 311.15 242.93 253.62 521 4.92 897 8.201990-91 385.80 693.03 729.57 845 17.87 385 5.251995-96 548.54 1,687.26 1,568.04 1,082 104.90 175 5.732000-01 1,350.31 15,667.14 17,099.30 1,997 564.59 24 0.362005-06 10,954.22 51,182.75 52,407.12 5,931 135.02 — —2008-09 10,963.78 24,762.53 30,256.65 4,006 233.43 37 0.432009-10 1,720.20 38,422.53 45,529.61 3,627 403.06 47 0.812010-11 1,048.355 52,431.81 62,601.58 3,865 349.38 79 2.46Ambala 549.43 2,043.25 6,029.59 167 23.18 10 0.39Panchkula 75.40 615.72 583.07 58 2.69 — —Yamunanagar 35.37 587.59 617.22 102 6.10 5 0.07Kurukshetra — 936.56 962.13 223 28.87 — —Kaithal — 1,107.54 1,138.05 178 34.15 — —Karnal — 653.25 671.45 121 20.15 — —Panipat — 281.40 289.24 46 8.68 — —Sonipat 2.52 1,522.12 1,592.10 72 10.72 3 0.25Rohtak 2.17 2,360.50 2,501.52 122 12.69 4 0.15Jhajjar 2.96 1,625.15 1,695.10 100 10.70 3 0.35Faridabad 55.20 16,521.41 21,275.88 161 30.80 — —Palwal — — — — — — —Gurgaon 82.80 — — 256 46.20 — —Mewat — — — — — — —Rewari 2.87 3,651.10 3,769.50 218 22.24 8 0.15Mahendragarh 2.80 2,805.12 3,012.12 150 16.09 6 0.20Bhiwani 4.20 4,102.50 4,310.11 252 29.12 4 0.10Jind 92.00 4,991.50 5,099.10 798 19.00 — —Hisar 75.00 2,885.10 2,984.40 320 12.00 — —Fatehabad 65.00 2,427.00 2,506.00 160 7.00 — —Sirsa 0.635 3,315.00 3,565.00 361 9.00 36 0.80
Source : Registrar, Co-operative Societies, Haryana.

375
RURAL DEVELOPMENT AND CO-OPERATION Selected Statistics of Women Co-operative Societies in Haryana
No. 17.14
Year/District Societies (No.) Membership
(Thousand) Share Capital (Lakh `) Own Funds (Lakh `)
1 2 3 4 5 1966-67 440 13 4.07 4.181967-68 455 13 3.85 4.011970-71 431 12 2.72 3.021975-76 329 9 1.98 2.371980-81 57 2 0.41 0.491990-91 11 — 0.10 0.101995-96 10 2 0.83 0.952000-01 10 2 0.93 1.692005-06 2 1 0.12 0.882008-09 2 2 0.02 0.012009-10 2 2 0.01 0.402010-11 2 24 0.01 0.40Ambala — — — —Panchkula — — — —Yamunanagar — — — —Kurukshetra 1 11 0.01Kaithal — — — —Karnal — — — —Panipat — — — —Sonipat — — — —Rohtak — — — —Jhajjar — — — —Faridabad — — — —Palwal — — — —Gurgaon — — — —Mewat — — — —Rewari — — — —Mahendragarh — — — —Bhiwani — — — —Jind — — — —Hisar 1 13 0.40Fatehabad — — — —Sirsa — — — —Note :—The data upto the year 1987-88 is as on 30th June and 1988-89 onwards as on 31st March.

376
RURAL DEVELOPMENT AND CO-OPERATION Selected Statistics of Women Co-operative Societies in Haryana
No. 17.14 (Concld.)
Year/District
Working Capital
(Lakh `)
Loans advanced during the year (Lakh
`)
Loans outstanding at the end of
the year (Lakh `)
Societies in profit (No.)
Profit (Lakh `)
Societies in Loss (No.)
Loss (Lakh `)
1 6 7 8 9 10 11 12 1966-67 4.21 — 6 356 0.10 4 —1967-68 4.06 1 6 173 0.03 37 —1970-71 3.10 2 5 151 0.07 31 —1975-76 2.61 2 1 320 0.11 58 —1980-81 0.48 — — — — 3 11990-91 4.02 — — — — 1 0.041995-96 29.69 — 0.41 — — 2 3.072000-01 27.67 0.41 — — — — —2005-06 10.17 — — — — — —2008-09 6.61 — — — — 1 3.302009-10 0.41 — — — — — —2010-11 0.41 — — — — — —Ambala — — — — — — —Panchkula — — — — — — —Yamunanagar — — — — — — —Kurukshetra 0.01 — — — — — —Kaithal — — — — — — —Karnal — — — — — — —Panipat — — — — — — —Sonipat — — — — — — —Rohtak — — — — — — —Jhajjar — — — — — — —Faridabad — — — — — — —Palwal — — — — — — —Gurgaon — — — — — — —Mewat — — — — — — —Rewari — — — — — — —Mahendragarh — — — — — — —Bhiwani — — — — — — —Jind — — — — — — —Hisar 0.40 — — — — — —Fatehabad — — — — — — —Sirsa — — — — — — —
Source : Registrar, Co-operative Societies, Haryana.

377
RURAL DEVELOPMENT AND CO-OPERATION Selected Statistics of Industrial Co-operative Societies in Haryana
No. 17.15
Year/District Societies (No.) Membership Share Capital
(Lakh `) Own Funds
(Lakh `) Working Capital
(Lakh `) 1 2 3 4 5 6
1966-67 2,258 38,230 50.53 81.82 216.631967-68 2,363 36,291 74.73 89.98 231.751970-71 2,679 42,159 131.80 151.07 377.191975-76 2,350 51,716 371.25 426.22 951.011980-81 2,832 44,901 430.80 578.69 1,279.391990-91 2,169 33,979 659.60 915.39 3,023.631995-96 2,034 35,161 800.46 1,217.80 4,290.412000-01 1,951 34,304 858.06 1,426.28 4,347.062005-06 1,439 24 386.17 522.09 2,217.332008-09 1,296 29 727.82 742 3,147.542009-10 1,245 26 350.44 778.83 3,322.292010-11 1,251 9,459.44 1,664.41 712.13 3,327.88Ambala 33 434 1,321.00 7.24 65.7Panchkula 28 0.04 1.39 12.50 13.79Yamunanagar 62 0.856 6.61 8.68 29.60Kurukshetra 33 434 17.69 24.64 107.35Kaithal 90 1,505 43.72 70.90 296.29Karnal 104 1,412 8.88 25.37 34.48Panipat 320 5.18 95.56 344.85 1,419.12Sonipat 27 0.383 3.09 9.61 42.56Rohtak 59 1,038 16.42 18.68 106.86Jhajjar 21 410 9.19 3.17 435.39Faridabad 17 0.1 1.1 4.5 5.5Palwal 5 76 1.61 1.58 4.32Gurgaon 24 357 10.2 9.84 14.43Mewat 3 33 4 6 5Rewari 47 612 8.21 4.21 16.96Mahendragarh 15 179 3.05 2.78 27.08Bhiwani 104 1,218 35.08 38.53 212.59Jind 34 0.469 7.15 17.94 27.37Hisar 119 1,570 43 56.39 308.07Fatehabad 71 1,133 24.4 39.21 146.23Sirsa 35 452 3.06 5.51 9.19Note :—The data upto the year 1987-88 is as on 30th June and 1988-89 onwards as on 31st March.

378
RURAL DEVELOPMENT AND CO-OPERATION Selected Statistics of Industrial Co-operative Societies in Haryana
No. 17.15 (Concld.)
Year/District
Deposits (Lakh `)
Value of goods
produced (Lakh `)
Value of goods sold (Lakh `)
Societies in profit (No.)
Profit (Lakh `)
Societies in Loss (No.)
Loss (Lakh `)
1 7 8 9 10 11 12 13 1966-67 16.59 170.09 167.49 794.00 2.63 894.00 4.321967-68 18.01 171.51 165.53 844.00 10.39 865.00 5.361970-71 26.19 311.76 289.53 953.00 4.34 1,045.00 7.751975-76 31.33 894.13 891.00 1,171.00 13.85 1,209.00 24.351980-81 45.11 1,448.03 1,391.13 787.00 21.62 1,193.00 32.461990-91 396.98 3,944.96 4,148.96 526.00 39.73 815.00 28.501995-96 399.72 4,492.74 5,497.09 349.00 77.34 583.00 16.782000-01 411.84 3,723.07 5,911.45 285.00 182.01 173.00 60.922005-06 140.15 764.60 735.86 207.00 4.93 319.00 12.612008-09 161.87 2,531.42 3,034.60 222.00 51.75 285.00 20.962009-10 337.85 1,693.06 3,775.61 285.00 38.85 743.00 147.772010-11 314.16 1,500.07 3,588.88 2.91 498.22 804.19 145.19Ambala 4.52 48.04 42.71 2 0.83 — —Panchkula 0.29 1 — — — 10 1.23Yamunanagar 19.13 22.20 20.51 5.00 1.48 57 10.85Kurukshetra — 66.00 67.90 6.00 1.91 19 2.58Kaithal 0.26 — — 9 4.32 81 8.54Karnal 0.43 22.56 56.80 25 0.96 79 10.78Panipat 227.41 1,108.66 3,207.43 169 11.23 151 1.56Sonipat 1.98 64.55 31.01 4 0.8 23 0.77Rohtak 4.56 8.45 8.29 17 2.66 42 6.29Jhajjar — — — 3.00 0.15 13.00 5.84Faridabad 0.1 — — — — 17 0.3Palwal — — — 3.00 0.04 1.00 0.02Gurgaon 1.4 0.7 0.62 — — 21 0.44Mewat — — — — — 3 2.00Rewari — — — 7 0.78 40 7.04Mahendragarh — — — — — 15 0.74Bhiwani 15.59 113.13 109.98 19 469.00 32 4.78Jind 2.71 36.02 37.45 5 0.23 27 4.09Hisar 5.80 1.55 1.09 4 0.86 101 66.34Fatehabad 4.24 7.21 5.09 13 2.97 37.19 8.33Sirsa 25.74 — — — — 35 2.67
Source : Registrar, Co-operative Societies, Haryana.

379
SECTION XVIII MINING AND QUARRYING
Statistics of mineral production are collected under the Mineral Conservation and Development Rules, 1988. Data have been obtained from the Indian Bureau of Mines, Nagpur.
The basis of evaluation is pit-mouth value of production. Information given in this section relates to Haryana State.
Table 18.1 indicates production of Minerals in Haryana.
Table 18.2 indicates districtwise production of Minerals in Haryana.

380
MINING AND QUARRYING Production of Minerals in Haryana
(Quantity in Metric Tonnes) No. 18.1 (Value in ` 000 rupees)
1966 1970 1975 Mineral
Quantity Value Quantity Value Quantity Value 1 2 3 4 5 6 7
Calcite — — — — — —Kaolin (Natural)*
5,627 19 6,579 67 5,280 1,09
Dolomite 2,613 14 614 3 198 2Felspar — — — — — —Sulphur** — — — — — —Limestone 4,92,829 29,38 4,67,842 38,75 4,07,976 87,66Lime Kankar 3,63,214 6,03 3,23,977 6,90 2,20,922 27,31Quartz — — — — — —Slate 827 1,06 521 52 408 1,25Minor minerals . . 17,77 . . . . . . 70,84Silica Sand 50 1 . . . . 554 6Sand (other) — — — — — —Iron ore — — — — — —* Also known as China Clay. Kaolin (Natural) refer to the mineral produced and consumed as such. ** Recovered as by-product from fertilizers Plants, (National Fertilizers Ltd., Panipat). P—Provisional. . . Not available.

381
MINING AND QUARRYING Production of Minerals in Haryana
(Quantity in Metric Tonnes) No. 18.1 (Contd.) (Value in 000 rupees)
1980 1985 1990-91 1995-96 Mineral
Quantity Value Quantity Value Quantity Value Quantity Value 1 8 9 10 11 12 13 14 15
Calcite 10 . . 75 5 — — — —Kaolin (Natural)*
8,926 2,10 4,368 1,53 19,633 14,01 83,221 69,57
Dolomite — — — — — — — —Felspar 520 26 285 17 12 1 — —Sulphur** — — 2,591 64,61 3,310 1,11,80 5,201 1,81,04Limestone 4,07,200 1,11,69 5,05,000 2,91,26 6,24,000 5,05,93 1,78,000 2,21,86Lime Kankar 4,550 71 97,515 63,19 36,223 8,68 65,630 26,10Quartz 455 11 20,18 83 2,776 2,05 — —Slate 362 1,69 637 1,47 5,279 46,50 — —Minor minerals . . 8,88,57 . . 7,99,98 . . . . — 35,25,11Silica Sand — — 7,116 1,68 5,28,558 2,03,66 2,96,662 1,56,52Sand (other) — — 3,16,834 47,54 — — — —Iron ore — — — — 3,000 2,47 5,000 8,16
Source : Indian Bureau of Mines, Nagpur.

382
MINING AND QUARRYING Production of Minerals in Haryana
(Quantity in Metric Tonnes) No. 18.1 (Contd.) (Value in 000 rupees)
2000-01 Mineral
Quantity Value 1 16 17
Calcite — —Kaolin (Natural)* 30,720 32,20Dolomite — —Felspar — —Sulphur** 12,422 . .Limestone 3,000 3,00Lime Kankar — —Quartz — —Slate — —Minor minerals . . 1,48,72,15Silica Sand 11,66,584 7,63,40Sand (other) — —Iron ore . . 63* Also known as China Clay. Kaolin (Natural) refer to the mineral produced and consumed as such. ** Recovered as by-product from fertilizers Plants, (National Fertilizers Ltd., Panipat). P—Provisional. Note :— District-wise detail of Minor Minerals is not available. . . Not available.

383
MINING AND QUARRYING Production of Minerals in Haryana
(Quantity in Metric Tonnes) No. 18.1 (Concld.) (Value in 000 rupees)
2005-06 2007-08 2008-09 Mineral
Quantity Value Quantity Value Quantity Value 1 18 19 20 21 22 23
Calcite — — — — — —Kaolin (Natural)*
— — — — — —
Dolomite — — — — — —Felspar — — — — — —Sulphur** 31,838 — 1,08,064 — 1,30,155 —Limestone — — — — — —Lime Kankar — — — — — —Quartz 2,37 24 — — — —Slate — — — — — —Minor minerals
— 24 — 1,48,71,98 — 1,48,71,98
Silica Sand — — — — — —Sand (other) — — — — — —Iron ore — — — — — —
Source : Indian Bureau of Mines, Nagpur.

384
MINING AND QUARRYING Districtwise Production of Mineral Ores in Haryana: 2008-09
(Quantity in Metric Tonnes) No. 18.2 (Value in 000 rupees)
Calcite Kaolin* (Natural) Sulphur Felspar District
Quantity Value Quantity Value Quantity Value Quantity Value 1 2 3 4 5 6 7 8 9
Ambala — — — — — — — —Panchkula — — — — — — — —Yamunanagar — — — — — — — —Kurukshetra — — — — — — — —Kaithal — — — — — — — —Karnal — — — — — — — —Panipat — — — — 1,30,155 — — —Sonipat — — — — — — — —Rohtak — — — — — — — —Jhajjar — — — — — — — —Faridabad — — — — — — — —Gurgaon — — — — — — — —Rewari — — — — — — — —Mahendragarh — — — — — — — —Bhiwani — — — — — — — —Jind — — — — — — — —Hisar — — — — — — — —Fatehabad — — — — — — — —Sirsa — — — — — — — —Total — — — — 1,30,155 —. — —* Also known as China Clay. Kaolin (Natural) refer to the mineral produced and consumed as such.

385
MINING AND QUARRYING Districtwise Production of Mineral Ores in Haryana: 2008-09
(Quantity in Metric Tonnes) No. 18.2 (Contd.) (Value in 000 rupees)
Iron ore Limestone Lime Kankar Quartz District
Quantity Value Quantity Value Quantity Value Quantity Value 1 10 11 12 13 14 15 16 17
Ambala — — — — — — — —Panchkula — — — — — — — —Yamunanagar — — — — — — — —Kurukshetra — — — — — — — —Kaithal — — — — — — — —Karnal — — — — — — — —Panipat — — — — — — — —Sonipat — — — — — — — —Rohtak — — — — — — — —Jhajjar .— — — — — — — —Faridabad — — — — — — — —Gurgaon — — — — — — — —Rewari — — — — — — — —Mahendragarh — — — — — — — —Bhiwani — — — — — — — —Jind — — — — — — — —Hisar — — — — — — — —Fatehabad — — — — — — — —Sirsa — — — — — — — —Total — — — — — — — —

386
MINING AND QUARRYING Districtwise Production of Mineral Ores in Haryana: 2008-09
(Quantity in Metric Tonnes) No. 18.2 (Concld.) (Value in 000 rupees)
Slate Silica Sand Sand (Others) District
Quantity Value Quantity Value Quantity Value 1 18 19 20 21 22 23
Ambala — — — — — —Panchkula — — — — — —Yamunanagar — — — — — —Kurukshetra — — — — — —Kaithal — — — — — —Karnal — — — — — —Panipat — — — — — —Sonipat — — — — — —Rohtak — — — — — —Jhajjar — — — — — —Faridabad — — — — — —Gurgaon — — — — — —Rewari — — — — — —Mahendragarh — — — — — —Bhiwani — — — — — —Jind — — — — — —Hisar — — — — — —Fatehabad — — — — — —Sirsa — — — — — —Total — — — — — —
Source : Indian Bureau of Mines, Nagpur.

387
SECTION XIX INDUSTRIES
Information given in this section has been collected from Labour Commissioner, Haryana, Director, Industries and Commerce Department, Haryana, Haryana Financial Corporation, Chandigarh and Haryana Khadi and Village Industries Board, Panchkula.
Table 19.1—Shows the number of Factories registered in the State under section 2 m (i), 2 m (ii) and 85 of the Factories Act, 1948, Under Section 2 m, factories means any premises including the percincts thereof;
2 m (i) Wherein ten or more workers are working or were working on any day of the preceding twelve months and in any part of which a manufacturing process is being carried on with the aid of power, or is ordinarily so carried on.
2 m (ii) Wherein twenty or more workers are working or were working on any day of the preceding twelve months and in any part of which a manufacturing process is being carried on without the aid of power or is ordinarily so carried on and does not include a mine subject to the operations of the Indian Mines Act, 1923, or a railway running school.
Under Section 85 of the factories act, 1948, the State Government is empowered to notify any factory not covered under the above two sections.
Table 19.2—Shows the districtwise number of Registered Working Factories according to number of workers. This is based on the returns submitted by the factories and does not relate to all the working factories.
Table 19.3—Shows the districtwise size and distribution of registered working factories in Haryana.
Table 19.4—Shows the districtwise and industrywise break-up of working factories.
Table 19.5—Shows the districtwise and industrywise number of workers employed in working factories.
Table 19.6—Shows the production of various Industries in the State.
Table 19.7—Shows the number of cotton textile mills and spindles and looms installed therein.
Table 19.8—Shows the index of industrial production for different years.
Table 19.9—Shows index of industrial production by major groups.
Tables 19.10 and 19.11—Indicate loans to industries advanced by the Haryana Financial Corporation from its funds.
Table 19.12—Shows districtwise classification of loans and advances to industrial units in Haryana.
Table 19.13 and 19.14—Indicate the progress of Khadi and Village Industires in Haryana.
Table 19.15 — Indicate Khadi & Village Industries Board Group wise Margin Money released.

388
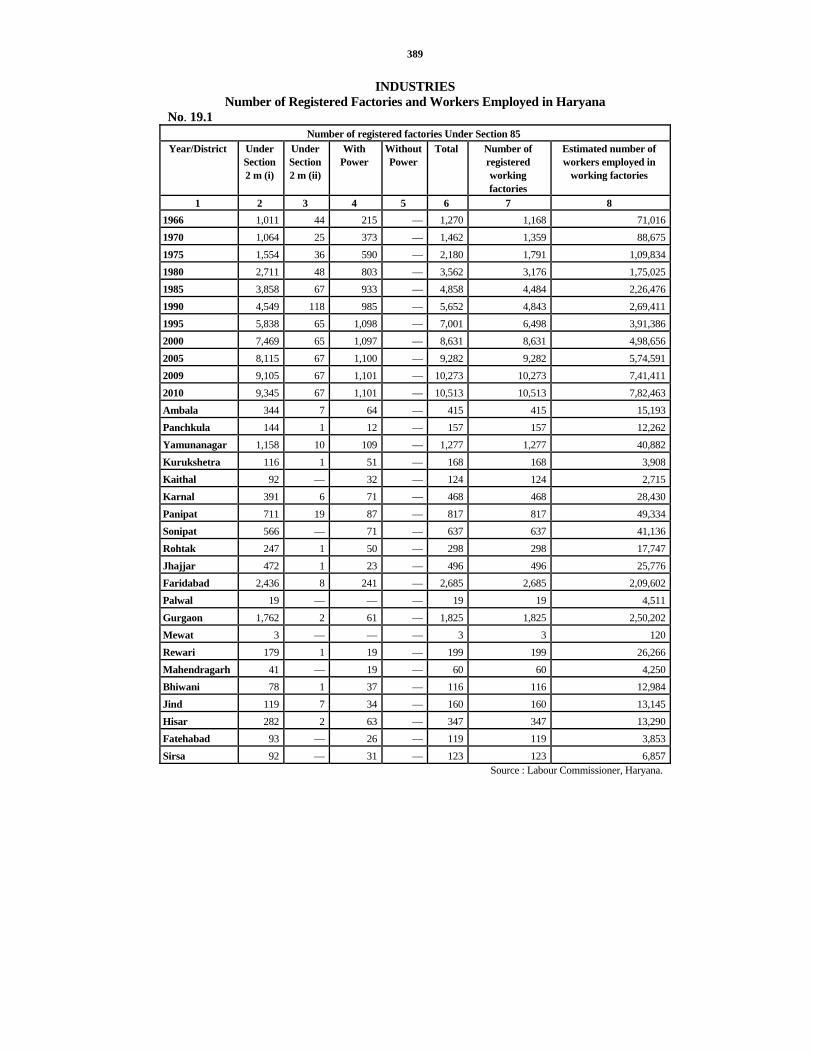
389
INDUSTRIES Number of Registered Factories and Workers Employed in Haryana
No. 19.1 Number of registered factories Under Section 85
Year/District Under Section 2 m (i)
Under Section 2 m (ii)
With Power
Without Power
Total Number of registered working factories
Estimated number of workers employed in
working factories
1 2 3 4 5 6 7 8 1966 1,011 44 215 — 1,270 1,168 71,0161970 1,064 25 373 — 1,462 1,359 88,6751975 1,554 36 590 — 2,180 1,791 1,09,8341980 2,711 48 803 — 3,562 3,176 1,75,0251985 3,858 67 933 — 4,858 4,484 2,26,4761990 4,549 118 985 — 5,652 4,843 2,69,4111995 5,838 65 1,098 — 7,001 6,498 3,91,3862000 7,469 65 1,097 — 8,631 8,631 4,98,6562005 8,115 67 1,100 — 9,282 9,282 5,74,5912009 9,105 67 1,101 — 10,273 10,273 7,41,4112010 9,345 67 1,101 — 10,513 10,513 7,82,463Ambala 344 7 64 — 415 415 15,193Panchkula 144 1 12 — 157 157 12,262Yamunanagar 1,158 10 109 — 1,277 1,277 40,882Kurukshetra 116 1 51 — 168 168 3,908Kaithal 92 — 32 — 124 124 2,715Karnal 391 6 71 — 468 468 28,430Panipat 711 19 87 — 817 817 49,334Sonipat 566 — 71 — 637 637 41,136Rohtak 247 1 50 — 298 298 17,747Jhajjar 472 1 23 — 496 496 25,776Faridabad 2,436 8 241 — 2,685 2,685 2,09,602Palwal 19 — — — 19 19 4,511Gurgaon 1,762 2 61 — 1,825 1,825 2,50,202Mewat 3 — — — 3 3 120Rewari 179 1 19 — 199 199 26,266Mahendragarh 41 — 19 — 60 60 4,250Bhiwani 78 1 37 — 116 116 12,984Jind 119 7 34 — 160 160 13,145Hisar 282 2 63 — 347 347 13,290Fatehabad 93 — 26 — 119 119 3,853Sirsa 92 — 31 — 123 123 6,857
Source : Labour Commissioner, Haryana.
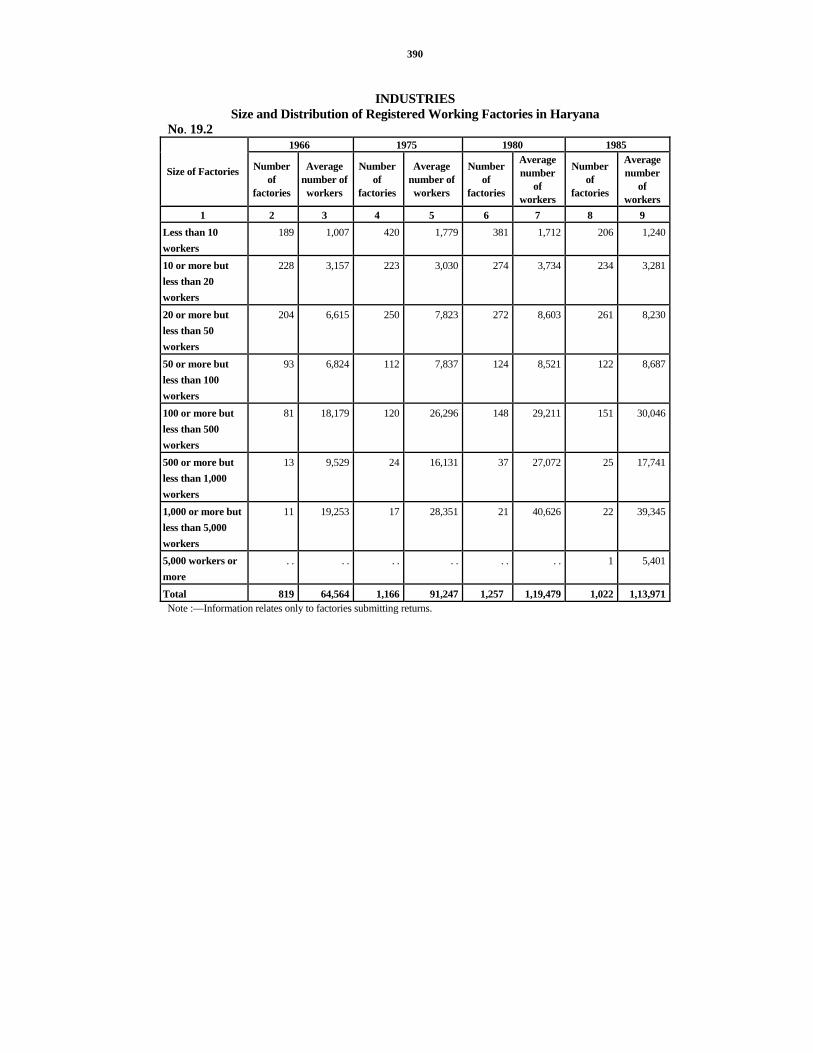
390
INDUSTRIES
Size and Distribution of Registered Working Factories in Haryana No. 19.2
1966 1975 1980 1985
Size of Factories Number of
factories
Average number of workers
Number of
factories
Average number of workers
Number of
factories
Average number
of workers
Number of
factories
Average number
of workers
1 2 3 4 5 6 7 8 9 Less than 10 workers
189 1,007 420 1,779 381 1,712 206 1,240
10 or more but less than 20 workers
228 3,157 223 3,030 274 3,734 234 3,281
20 or more but less than 50 workers
204 6,615 250 7,823 272 8,603 261 8,230
50 or more but less than 100 workers
93 6,824 112 7,837 124 8,521 122 8,687
100 or more but less than 500 workers
81 18,179 120 26,296 148 29,211 151 30,046
500 or more but less than 1,000 workers
13 9,529 24 16,131 37 27,072 25 17,741
1,000 or more but less than 5,000 workers
11 19,253 17 28,351 21 40,626 22 39,345
5,000 workers or more
. . . . . . . . . . . . 1 5,401
Total 819 64,564 1,166 91,247 1,257 1,19,479 1,022 1,13,971Note :—Information relates only to factories submitting returns.

391
INDUSTRIES Size and Distribution of Registered Working Factories in Haryana
No. 19.2 (Concld.) 1990 1995 2000 2005 2010(P)
Size of Factories
Number of
factories
Average number
of workers
Number of
factories
Average number
of workers
Number of
factories
Average number
of workers
Number of
factories
Average number
of workers
Number of
factories
Average number
of workers
1 10 11 12 13 14 15 16 17 18 19 Less than 10 workers
265 2,118 130 853 106 715 207 1,352 149 1,192
10 or more but less than 20 workers
325 6,008 248 3,530 181 2,489 335 4,794 251 4,518
20 or more but less than 50 workers
343 13,013 238 7,849 293 8,402 393 12,176 261 10,701
50 or more but less than 100 workers
180 13,205 187 13,197 156 10,764 225 15,045 152 12,768
100 or more but less than 500 workers
185 39,597 167 35,170 158 34,623 224 48,339 161 46,322
500 or more but less than 1,000 workers
49 27,555 36 23,420 23 15,891 40 20,984 29 17,980
1,000 or more but less than 5,000 workers
21 35,989 22 45,644 7 11,818 21 36,712 16 51,200
5,000 workers or more
. . . . — — — — — — — —
Total 1,368 1,37,485 1,028 1,29,663 924 84,702 1,445 1,39,402 1,019 1,44,681 Source :— Labour Commissioner, Haryana.
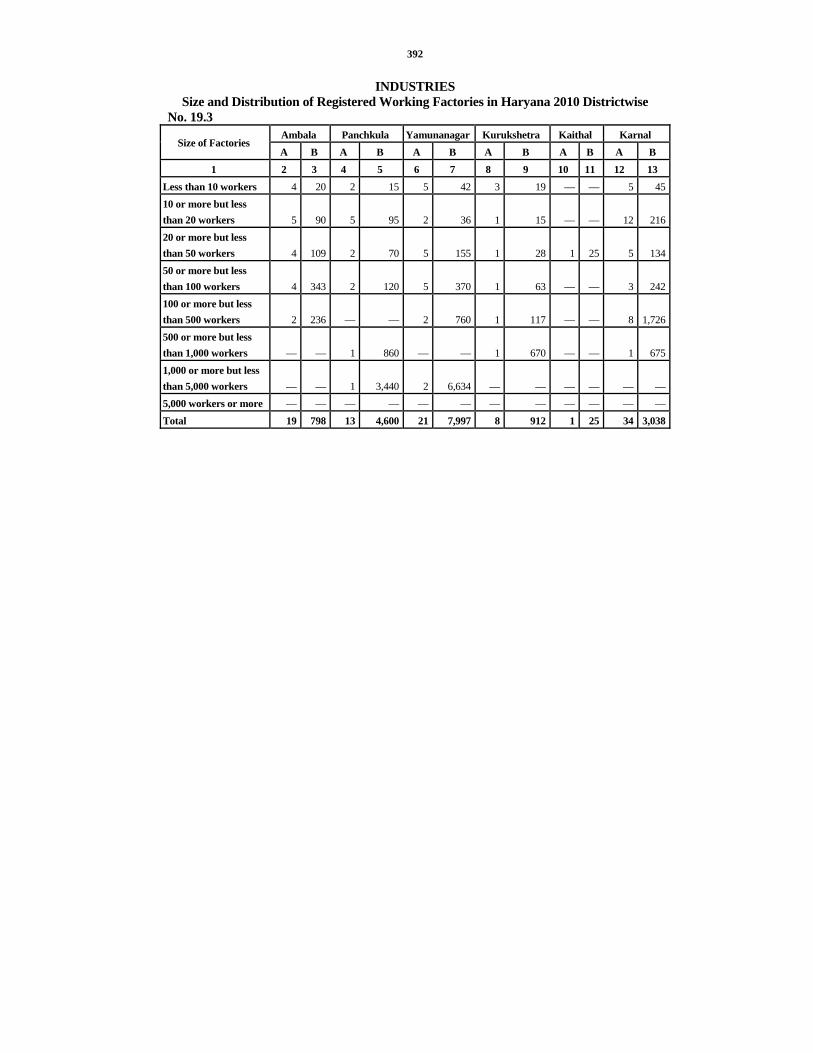
392
INDUSTRIES Size and Distribution of Registered Working Factories in Haryana 2010 Districtwise
No. 19.3 Ambala Panchkula Yamunanagar Kurukshetra Kaithal Karnal
Size of Factories A B A B A B A B A B A B
1 2 3 4 5 6 7 8 9 10 11 12 13 Less than 10 workers 4 20 2 15 5 42 3 19 — — 5 4510 or more but less than 20 workers 5 90 5 95 2 36 1 15 — — 12 21620 or more but less than 50 workers 4 109 2 70 5 155 1 28 1 25 5 13450 or more but less than 100 workers 4 343 2 120 5 370 1 63 — — 3 242100 or more but less than 500 workers 2 236 — — 2 760 1 117 — — 8 1,726500 or more but less than 1,000 workers — — 1 860 — — 1 670 — — 1 6751,000 or more but less than 5,000 workers — — 1 3,440 2 6,634 — — — — — —5,000 workers or more — — — — — — — — — — — —Total 19 798 13 4,600 21 7,997 8 912 1 25 34 3,038

393
INDUSTRIES Size and Distribution of Registered Working Factories in Haryana 2010 Districtwise
No. 19.3 (Contd.) Panipat Sonipat Rohtak Jhajjar Faridabad Gurgaon
Size of Factories A B A B A B A B A B A B
14 15 16 17 18 19 20 21 22 23 24 25 Less than 10 workers 5 35 5 40 5 45 20 142 37 296 30 26210 or more but less than 20 workers
13 234 12 228 2 27 20 380 100 1,758 30 540
20 or more but less than 50 workers
8 315 21 556 9 243 21 604 52 2,052 100 4,878
50 or more but less than 100 workers
5 440 12 921 2 190 5 460 56 4,487 39 3,448
100 or more but less than 500 workers
3 1,460 11 2,262 3 519 12 2,470 57 14,588 47 18,608
500 or more but less than 1,000 workers
3 1,840 2 1,240 1 500 3 1,675 5 4,985 8 3,314
1,000 or more but less than 5,000 workers
— — 2 3,295 — — 1 1,780 4 10,790 4 22,061
5,000 workers or more — — — — — — — — — — — —Total 37 4,324 65 8,542 22 1,524 82 7,511 311 38,956 258 53,111

394
INDUSTRIES Size and Distribution of Registered Working Factories in Haryana 2010 Districtwise
No. 19.3 (Concld.) Rewari Mahendragarh Bhiwani Jind Hisar Fatehabad Sirsa Total
A B A B A B A B A B A B A B A B Size of
Factories 26 27 28 29 30 31 32 33 34 35 36 37 38 39 40 41
Less than 10 workers
9 26 — — 3 21 2 16 14 168 — — — — 149 1,192
10 or more but less than 20 workers
20 360 — — 5 87 2 35 21 399 1 18 — — 251 4,518
20 or more but less than 50 workers
12 569 — — 3 145 2 87 14 695 1 36 — — 261 10,701
50 or more but less than 100 workers
6 595 — — 1 95 2 148 8 794 — — 1 52 152 12,768
100 or more but less than 500 workers
8 2,210 — — 2 650 1 106 4 610 — — — — 161 46,322
500 or more but less than 1,000 workers
1 528 — — 1 653 — — 2 1,040 — — — — 29 17,980
1,000 or more but less than 5,000 workers
1 1,760 — — — — — — 1 1,440 — — — — 16 51,200
5,000 workers or more
— — — — — — — — — — — — — — — —
Total 57 6,048 — — 15 1,651 9 392 64 5,146 2 54 1 52 1,019 1,44,681Source :— Labour Commissioner, Haryana.
(A) Number of Factories (B) Average number of workers. Note :— Information relates only to factories submitting returns.
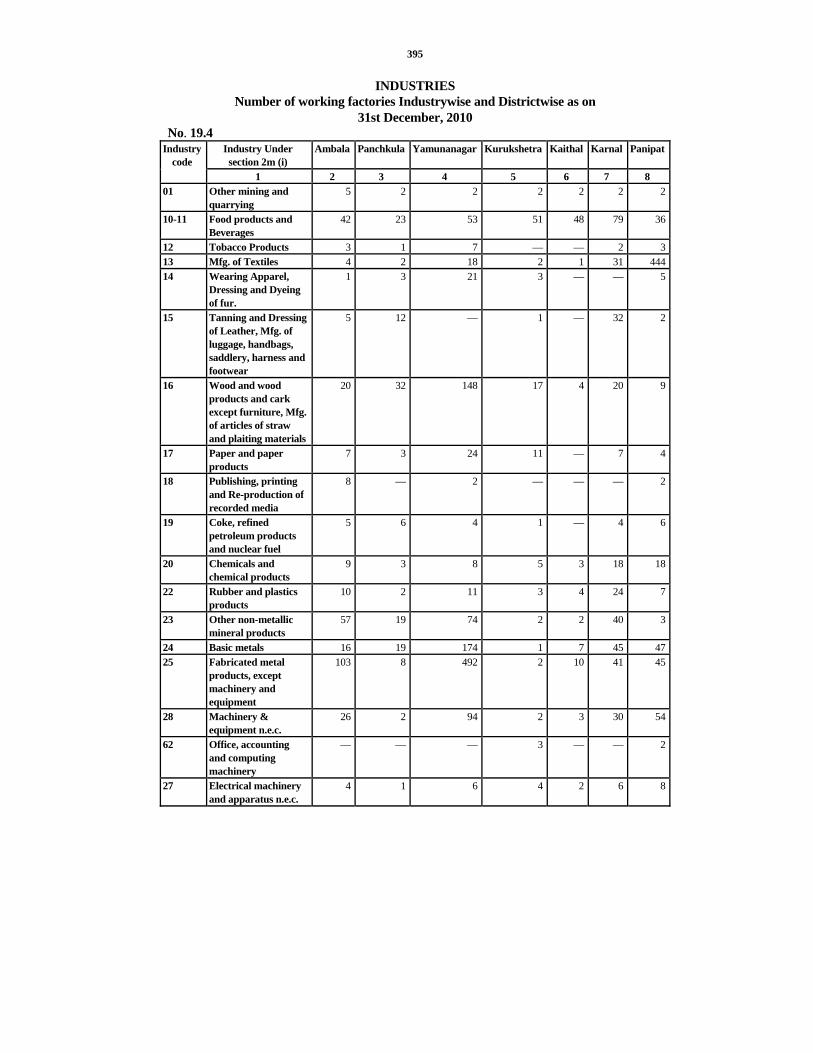
395
INDUSTRIES Number of working factories Industrywise and Districtwise as on
31st December, 2010 No. 19.4
Industry Under section 2m (i)
Ambala Panchkula Yamunanagar Kurukshetra Kaithal Karnal PanipatIndustry code
1 2 3 4 5 6 7 8 01 Other mining and
quarrying 5 2 2 2 2 2 2
10-11 Food products and Beverages
42 23 53 51 48 79 36
12 Tobacco Products 3 1 7 — — 2 313 Mfg. of Textiles 4 2 18 2 1 31 44414 Wearing Apparel,
Dressing and Dyeing of fur.
1 3 21 3 — — 5
15 Tanning and Dressing of Leather, Mfg. of luggage, handbags, saddlery, harness and footwear
5 12 — 1 — 32 2
16 Wood and wood products and cark except furniture, Mfg. of articles of straw and plaiting materials
20 32 148 17 4 20 9
17 Paper and paper products
7 3 24 11 — 7 4
18 Publishing, printing and Re-production of recorded media
8 — 2 — — — 2
19 Coke, refined petroleum products and nuclear fuel
5 6 4 1 — 4 6
20 Chemicals and chemical products
9 3 8 5 3 18 18
22 Rubber and plastics products
10 2 11 3 4 24 7
23 Other non-metallic mineral products
57 19 74 2 2 40 3
24 Basic metals 16 19 174 1 7 45 4725 Fabricated metal
products, except machinery and equipment
103 8 492 2 10 41 45
28 Machinery & equipment n.e.c.
26 2 94 2 3 30 54
62 Office, accounting and computing machinery
— — — 3 — — 2
27 Electrical machinery and apparatus n.e.c.
4 1 6 4 2 6 8

396
INDUSTRIES Number of working factories Industrywise and Districtwise as on
31st December, 2010 No. 19.4 (Contd.)
Industry Under section 2m (i) Sonipat Rohtak Jhajjar Faridabad Palwal Gurgaon Mewat RewariIndustry
code 1 9 10 11 12 13 14 15 16
01 Other mining and quarrying 3 — — 6 — 2 — 2
10-11 Food products and Beverages 37 34 23 61 5 49 — 16
12 Tobacco Products 3 1 — 2 — 4 — 113 Mfg. of Textiles 70 11 27 198 5 98 — 1914 Wearing Apparel,
Dressing and Dyeing of fur.
13 2 24 122 — 595 — 3
15 Tanning and Dressing of Leather, Mfg. of luggage, handbags, saddlery, harness and footwear
12 8 6 41 — 8 — 2
16 Wood and wood products and cark except furniture, Mfg. of articles of straw and plaiting materials
45 17 10 77 4 10 — 5
17 Paper and paper products 8 9 23 51 — 12 — 318 Publishing, printing and
Re-production of recorded media
8 8 22 28 — 15 — 3
19 Coke, refined petroleum products and nuclear fuel 12 3 5 22 — 10 — 6
20 Chemicals and chemical products 68 11 38 137 1 88 — 27
22 Rubber and plastics products 64 18 48 208 — 90 — 4
23 Other non-metallic mineral products 41 10 74 230 2 127 — 6
24 Basic metals 52 32 54 297 — 72 — 1725 Fabricated metal
products, except machinery and equipment
53 31 67 264 — 100 — 19
28 Machinery & equipment n.e.c. 18 22 27 288 — 76 2 14
62 Office, accounting and computing machinery — — 10 9 — 7 — 1
27 Electrical machinery and apparatus n.e.c. 18 12 4 156 2 115 — 9

397
INDUSTRIES
Number of working factories Industrywise and Districtwise as on 31st December, 2010
No. 19.4 (Contd.) Industry Under section
2m (i) Mahendragarh Bhiwani Jind Hisar Fatehabad Sirsa Total Industry
code 1 17 18 19 20 21 22 23
01 Other mining and quarrying — — 12 81 30 28 18110-11 Food products and
Beverages 2 8 47 63 5 44 726
12 Tobacco Products — — — — — — 2713 Mfg. of Textiles — 9 19 30 46 5 1,03914 Wearing Apparel, Dressing
and Dyeing of fur. 4 — — — — — 796
15 Tanning and Dressing of Leather, Mfg. of luggage, handbags, saddlery, harness and footwear
2 — 2 6 — — 139
16 Wood and wood products and cark except furniture, Mfg. of articles of straw and plaiting materials
— 2 2 18 1 6 447
17 Paper and paper products 1 — 5 5 — — 17318 Publishing, printing and Re-
production of recorded media
— — — 3 2 1 102
19 Coke, refined petroleum products and nuclear fuel
3 9 1 7 — — 104
20 Chemicals and chemical products
— 2 5 11 — 1 453
22 Rubber and plastics products
2 2 — 10 1 — 508
23 Other non-metallic mineral products
— 15 4 13 — 2 721
24 Basic metals 11 3 1 17 1 — 86625 Fabricated metal products,
except machinery and equipment
3 16 2 3 2 1 1,262
28 Machinery & equipment n.e.c.
— — 1 2 — — 661
62 Office, accounting and computing machinery
1 1 — — 1 — 35
27 Electrical machinery and apparatus n.e.c.
2 — 3 1 — 2 355

398
INDUSTRIES Number of working factories Industrywise and Districtwise as on
31st December, 2010 No. 19.4 (Contd.)
Industry Ambala Panchkula Yamunanagar Kurukshetra Kaithal Karnal PanipatIndustry code 1 2 3 4 5 6 7 8
26 Radio, television & communi cation equipment and apparatus
— — 2 — — — —
21 Medical, precision and optical instruments, watches and clocks
3 1 — 2 1 2 2
29 Motor vehicles, trailers and semi-trailers
1 — 7 — — 1 1
30 Other transport equipment 3 — 2 2 1 3 3
31 Furniture 8 2 6 — — — 235 Electricity, Gas,
Steam and Hot water supply
1 1 1 1 2 2 1
43 Construction — — 1 — — — —45 Sale, Maintenance
and repair of motor vehicles and motor cycles; retail sale of automotive fuel.
1 — — 1 1 — 1
46 Wholesale trade & commission trade except Motor vehicles
1 — — — — — 3
95 Retail Trade except Motor Vehicle, Repair of personal and household goods
1 2 1 — 1 2 —
52 Supporting and auxiliary transport activities; activities of travel agencies
— — — — — — 1
72 Research and Development — — — — — — —
Total 344 144 1,158 116 92 391 711Under section 2m (ii)
10-11 Mfg. of food products beverages — — — — — — 1
12 Mfg. of tobacco products 1 — — — — 1 —
13 Mfg. of Textiles 2 — 1 — — 2 217 Mfg. of Paper &
Paper products — — — — — — —
20 Mfg. of Chemicals & Chemicals products 1 — — — — — —
23 Mfg. of other non-metalic minerals products
2 1 8 1 — 3 12

399
INDUSTRIES Number of working factories Industrywise and Districtwise as on
31st December, 2010 No. 19.4 (Contd.)
Industry Sonipat Rohtak Jhajjar Faridabad Palwal Gurgaon Mewat Rewari Industry code 1 9 10 11 12 13 14 15 16
26 Radio, television & communi
cation equipment and apparatus 2 — — 21 — 50 — —
21 Medical, precision and optical
instruments, watches and clocks 4 3 2 21 — 39 1 2
29 Motor vehicles, trailers and semi-
trailers 7 5 2 85 — 113 — 4
30 Other transport equipment 12 6 1 46 — 60 — 8
31 Furniture 5 2 2 22 — 9 — 2
35 Electricity, Gas, Steam and Hot
water supply 2 1 2 — 4 1
43 Construction — — — 1 — 1 — —
45 Sale, Maintenance and repair of
motor vehicles and motor cycles;
retail sale of automotive fuel.
2 1 2 13 — 3 — 3
46 Wholesale trade & commission
trade except Motor vehicles — — — 2 — 2 — —
95 Retail Trade except Motor Vehicle,
Repair of personal and household
goods
1 — 1 20 — 2 — 1
52 Supporting and auxiliary transport
activities; activities of travel
agencies
6 — — 2 — — — 1
72 Research and Development — — — 4 — 1 — —
Total 566 247 472 2,436 19 1,762 3 179
Under section 2m (ii)
10-11 Mfg. of food products beverages — — — — — — — —
12 Mfg. of tobacco products — — — — — — — —
13 Mfg. of Textiles — — — 2 — — — —
17 Mfg. of Paper & Paper products — — 1 — — — — —
20 Mfg. of Chemicals & Chemicals
products — — — — — — — —
23 Mfg. Of Chemicals & Chemicals
products — — — 6 — 1 — —

400
INDUSTRIES Number of working factories Industrywise and Districtwise as on
31st December, 2010 No. 19.4 (Contd.)
Industry Mahendragarh Bhiwani Jind Hisar Fatehabad Sirsa TotalIndustry code 1 17 18 19 20 21 22 23
26 Radio, television & communi cation equipment and apparatus
— — — — — — 75
21 Medical, precision and optical instruments, watches and clocks
— — — 2 2 — 87
29 Motor vehicles, trailers and semi-trailers
1 — — 1 — — 228
30 Other transport equipment 1 1 3 2 1 — 15531 Furniture 2 — 2 1 — — 6535 Electricity, Gas, Steam and Hot
water supply — 5 3 2 1 — 30
43 Construction — — 2 1 — — 645 Sale, Maintenance and repair of
motor vehicles and motor cycles; retail sale of automotive fuel.
2 4 2 1 — 1 38
46 Wholesale trade & commission trade except Motor vehicles
— — 2 — — 1 11
95 Retail Trade except Motor Vehicle, Repair of personal and household goods
3 1 1 2 — — 39
52 Supporting and auxiliary transport activities; activities of travel agencies
1 — — — — — 11
72 Research and Development — — — — — — 5Total 41 78 119 282 93 92 9,345Under section 2m (ii)
10-11 Mfg. of food products beverages — — — — — — 112 Mfg. of tobacco products — — — — — — 213 Mfg. of Textiles — — 2 — — — 1117 Mfg. of Paper & Paper products — — — — — — 120 Mfg. of Chemicals & Chemicals
products — — — — — — 1
23 Mfg. of other non metallic minerals product
— 7 — — — — 41

401
INDUSTRIES Number of working factories Industrywise and Districtwise as on
31st December, 2010 No. 19.4 (Contd.)
Industry Ambala Panchkula Yamunanagar Kurukshetra Kaithal Karnal PanipatIndustry code 1 2 3 4 5 6 7 8
24 Mfg. of Basic Metals — — 1 — — — —27 Mfg. of electrical
machinery and apparatus
— — — — — — 1
26 Mfg. of Radio, Television & Communication equipment
— — — — — — 2
31 Mfg. of furniture — — — — — — 145 Retail trade exccept
motor vehicle, repair of personal household goods
1 — — — — — —
Total 7 1 10 1 — 6 19 Under Section 85
10-11 Food products & Beverage
5 — 8 13 10 20 21
12 Mfg. of Tobacco products
1 — — — — — 3
13 Mfg. of Textiles — — — — — — 116 Mfg. of Wood
products except furniture, straw board etc.
47 7 86 37 22 50 54
17 Paper and paper products
4 1 1 1 — 1 7
20 Chemicals and Chemical products
— 4 7 — — — 1
23 Other Non-metallic mineral products
— — — — — — —
24 Basic metals 7 — 7 — — — —25 Fabricated metal
products except machinery equipment
— — — — — — —
28 Machinery & equipment
— — — — — — —
27 Electrical machinery Apparatus &
— — — — — — —
Total 64 12 109 51 32 71 87Grand Total 415 157 1,277 168 124 468 817

402
INDUSTRIES Number of working factories Industrywise and Districtwise as on
31st December, 2010 No. 19.4 (Contd.)
Industry Sonipat Rohtak Jhajjar Faridabad Palwal Gurgaon Mewat RewariIndustry code 1 9 10 11 12 13 14 15 16
24 Mfg. of Basic Metals — 1 — — — 1 — 127 Mfg. of electrical
machinery and apparatus — — — — — — — —
26 Mfg. of Radio, Television & Communication equipment
— — — — — — — —
31 Mfg. of furniture — — — — — — — —45 Retail trade exccept
motor vehicle, repair of personal household goods
— — — — — — — —
Total — 1 1 8 — 2 — 1Under Section 85
10-11 Food products & Beverage
— 2 1 21 — 6 — 2
12 Mfg. of Tobacco products — — — — — — — —13 Mfg. of Textiles — — — — — 3 — —16 Mfg. of Wood products
except furniture, straw board etc.
58 43 19 140 — 36 — 17
17 Paper and paper products 7 1 — 1 — — — —20 Chemicals and Chemical
products 3 — — 11 — 5 — —
23 Other Non-metallic mineral products
3 4 3 52 — 8 — —
24 Basic metals — — — 1 — — — —25 Fabricated metal
products except machinery equipment
— — — 13 — 2 — —
28 Machinery & equipment — — — 2 — — — —27 Electrical machinery
Apparatus & — — — — — 1 — —
Total 71 50 23 241 — 61 — 19Grand Total 637 298 496 2,685 19 1,825 3 199

403
INDUSTRIES Number of working factories Industrywise and Districtwise as on
31st December, 2010 No. 19.4 (Concld.)
Industry Mahendragarh Bhiwani Jind Hisar Fatehabad Sirsa Total Industry code 1 17 18 19 20 21 22 23
24 Mfg. of Basic Metals 1 — — — — — 527 Mfg. of electrical machinery and
apparatus — — — — — — 126 Mfg. of Radio, Television &
Communication equipment — — — — — — 231 Mfg. of furniture — — — — — — 145 Retail trade exccept motor
vehicle, repair of personal household goods — — — — — — 1
Total 1 7 2 — — — 67Under Section 85
10-11 Food products & Beverage 1 6 4 8 2 9 13912 Mfg. of Tobacco products — — — — — — 413 Mfg. of Textiles — — — 1 — 3 816 Mfg. of Wood products except
furniture, straw board etc. 18 21 29 49 24 19 77617 Paper and paper products — — — 2 — — 2620 Chemicals and Chemical
products — 1 — 2 — — 3423 Other Non-metallic mineral
products — 9 — — — — 7924 Basic metals — — — — — — 1525 Fabricated metal products except
machinery equipment — — 1 1 — — 1728 Machinery & equipment — — — — — 227 Electrical machinery
& Apparatus — — — — — — 1Total 19 37 34 63 26 31 1,101Grand Total 61 122 155 345 119 123 10,513
Source : Labour Commissioner, Haryana.

404
INDUSTRIES Estimated workers employed in working factories Industry wise and Districtwise
as on 31st December, 2010 No. 19.5
Industry Ambala Panchkula Yamunanagar Kurukshetra Kaithal Karnal PanipatIndustry code 1 2 3 4 5 6 7 8
Under section 2m (i) 01 Other mining and
quarrying 136 25 11 21 39 12 23
10-11 Food products and Beverages
1,350 4,130 11,413 2,168 976 3,135 7,982
12 Tobacco Products 150 15 100 — — 20 2013 Mfg. of Textiles 365 90 840 36 13 7,181 17,68214 Wearing Apparel,
Dressing and Dyeing of fur.
10 125 1,075 60 — — 675
15 Tanning and Dressing of Leather, Mfg. of luggage, handbags, saddlery, harness and footwear
360 620 — 10 — 1,285 80
16 Wood and wood products and cark except furniture, Mfg. of articles of straw and plaiting materials
655 498 1,940 190 37 912 276
17 Paper and paper products
410 85 380 175 — 325 110
18 Publishing, printing and Re-production of recorded media
440 — 16 — — — 90
19 Coke, refined petroleum products
170 — — — — — —
20 Chemicals and chemical products
505 296 1,896 166 92 1,272 1,342
22 Rubber and plastics products
665 80 1,673 252 160 1,972 620
23 Other non-metallic mineral products
2,417 3,201 3,691 142 37 2,980 3,072
24 Basic metals 680 1,591 4,919 19 465 3,380 4,20525 Fabricated metal
products,except machinery & equipment
2,690 873 8,930 29 570 3,125 6,700
28 Machinery & equipment n.e.c.
1,753 374 1,524 54 120 1,285 4,465
62 Office, accounting and computing machinery
— — — — — — —
27 Electrical machinery and apparatus n.e.c.
187 90 382 190 30 671 372

405
INDUSTRIES Estimated workers employed in working factories Industry wise and Districtwise
as on 31st December, 2010 No. 19.5 (Contd.)
Sonipat Rohtak Jhajjar Faridabad Palwal Gurgaon Mewat RewariIndustry code
Industry 9 10 11 12 13 14 15 16
Under section 2m (i) 01 Other mining and
quarrying 25 — — 476 — 20 — 27
10-11 Food products and Beverages
2,268 3,683 9,622 23,933 1,265 5,039 20 2,055
12 Tobacco Products 156 20 — 50 — 69 — 2013 Mfg. of Textiles 9,021 980 1,327 13,263 — 17,164 — 3,26114 Wearing Apparel,
Dressing and Dyeing of fur.
775 85 1,063 7,291 150 76,244 — 210
15 Tanning and Dressing of Leather, Mfg. of luggage, handbags, saddlery, harness and footwear
670 340 272 5,898 — 4,661 — 37
16 Wood and wood products and cark except furniture, Mfg. of articles of straw and plaiting materials
2,878 760 566 15,933 260 1,985 — 756
17 Paper and paper products 340 170 815 1,618 — 591 — 15818 Publishing, printing and
Re-production of recorded media
190 110 489 1,577 — 1,016 — 190
19 Coke, refined petroleum products
— — — 690 — — — —
20 Chemicals and chemical products
4,330 870 1,807 8,478 — 11,754 — 2,800
22 Rubber and plastics products
5,843 2,492 1,991 16,992 100 10,546 — 560
23 Other non-metallic mineral products
2,825 1,825 1,351 21,090 — 17,354 — 640
24 Basic metals 3,032 2,604 2,333 30,972 543 24,990 — 2,12125 Fabricated metal
products,except machinery & equipment
6,564 3,070 2,512 35,419 827 29,389 — 9,901
28 Machinery & equipment n.e.c.
707 — 778 15,131 823 7,411 50 2,323
62 Office, accounting and computing machinery
— — 63 — — 338 — —
27 Electrical machinery and apparatus n.e.c.
820 — 250 4,451 — 13,224 — 374
INDUSTRIES Estimated workers employed in working factories Industry wise and Districtwise
as on 31st December, 2010

406
No. 19.5 (Contd.) Industry Mahendragarh Bhiwani Jind Hisar Fatehabad Sirsa Total Industry
code 1 17 18 19 20 21 22 23 Under section 2m (i)
01 Other mining and quarrying — — 360 1,604 410 503 3,69210-11 Food products and
Beverages 1,135 3,678 4,833 2,929 825 4,643 97,082
12 Tobacco Products — — — — — — 62013 Mfg. of Textiles — 3,884 1,920 535 1,436 386 79,38414 Wearing Apparel, Dressing
and Dyeing of fur. 240 — — — — — 88,003
15 Tanning and Dressing of Leather, Mfg. of luggage, handbags, saddlery, harness and footwear
256 — 120 618 — — 15,227
16 Wood and wood products and cark except furniture, Mfg. of articles of straw and plaiting materials
— 90 277 660 150 363 29,186
17 Paper and paper products 26 — 712 170 — — 6,08518 Publishing, printing and Re-
production of recorded media
— — — 484 300 150 5,052
19 Coke, refined petroleum products
— 1,683 — — — — 2,543
20 Chemicals and chemical products
— 90 1,254 380 — 137 37,469
22 Rubber and plastics products
290 284 — 752 133 — 45,405
23 Other non-metallic mineral products
— 1,440 1,932 2,468 — 387 66,852
24 Basic metals 1,381 150 180 1,750 20 — 85,33525 Fabricated metal
products,except machinery & equipment
573 1,369 793 150 243 32 1,13,759
28 Machinery & equipment n.e.c.
— — 16 73 — — 36,887
62 Office, accounting and computing machinery
— — — — — — 401
27 Electrical machinery and apparatus n.e.c.
137 — 175 50 — 143 21,546

407
INDUSTRIES Estimated Number of workers employed in working factories Industry wise and
Districtwise as on 31st December, 2010 No. 19.5 (Contd.)
Industry Ambala Panchkula Yamunanagar Kurukshetra Kaithal Karnal PanipatIndustry code 1 2 3 4 5 6 7 8
26 Radio, television & communi cation equipment and apparatus
— — 29 — — — —
21 Medical, precision and optical instruments, watches and clocks
65 — — — — — —
29 Motor vehicles, trailers and semi-trailers
20 — 490 — — 13 60
30 Other transport equipment
1,038 — 63 40 9 47 93
31 Furniture 218 — — — — — —35 Electricity, Gas, Steam
and Hot water supply 10 — — — — — —
43 Construction — — — — — — —45 Sale, Maintenance and
repair of motor vehicles and motor cycles; retail sale of automotive fuel.
9 — — — — — —
46 Wholesale trade & commission trade except Motor vehicles
17 — — — — — —
95 Retail Trade except Motor Vehicle, Repair of personal and household goods
— — — — — — —
52 Supporting and auxiliary transport activities; activities of travel agencies
— — — — — — —
72 Research and Development
— — — — — — —
Total 14,320 12,093 39,372 3,552 2,548 27,615 47,867Under section 2m (ii)
10-11 Mfg. of food products beverages
— — — — — — 8
12 Mfg. of tobacco products
33 — — — — 32 —
13 Mfg. of Textiles 106 — 58 — — 140 18017 Mfg. of Paper & Paper
products — — — — — — —
20 Mfg. of Chemicals & Chemicals products
60 — — — — — —
23 Mfg. of other non-metalic minerals products
58 20 339 75 — 280 582

408
INDUSTRIES Estimated Number of workers employed in working factories Industry wise and
Districtwise as on 31st December, 2010 No. 19.5 (Contd.)
Industry code Industry Sonipat Rohtak Jhajjar Faridabad Palwal Gurgaon Mewat Rewari
1 9 10 11 12 13 14 15 16 26 Radio, television & communi
cation equipment and apparatus
40 140 — 368 — 4,661 — —
21 Medical, precision and optical instruments, watches and clocks
— — — 106 — 2,009 — —
29 Motor vehicles, trailers and semi-trailers
60 180 84 1,626 — 13,251 — 196
30 Other transport equipment 180 87 50 1,309 — 6,427 — 380 31 Furniture — — — — — — — — 35 Electricity, Gas, Steam and
Hot water supply — — — — 513 106 — —
43 Construction — — — — — — — — 45 Sale, Maintenance and repair
of motor vehicles and motor cycles; retail sale of automotive fuel.
— — — 280 — 125 50 —
46 Wholesale trade & commission trade except Motor vehicles
— — — — — 16 — —
95 Retail Trade except Motor Vehicle, Repair of personal and household goods
— — — 220 — 71 — —
52 Supporting and auxiliary transport activities; activities of travel agencies
— — — 45 30 — — —
72 Research and Development — — — 260 — 1,170 — — Total 40,724 17,416 25,373 2,07,476 4,511 2,49,631 120 26,009
Under section 2m (ii) 10-11 Mfg. of food products
beverages — — — — — — — —
12 Mfg. of tobacco products — — — — — — — — 13 Mfg. of Textiles — — — 50 — — — — 17 Mfg. of Paper & Paper
products — — 182 — — — — —
20 Mfg. of Chemicals & Chemicals products
— — — — — — — —
23 Mfg. of other non-metalic minerals products
— — — 330 — 52 — —
INDUSTRIES

409
Estimated Number of workers employed in working factories Industry wise and Districtwise as on 31st December, 2010
No. 19.5 (Contd.) Industry
code Industry Mahendragarh Bhiwani Jind Hisar Fatehabad Sirsa Total
17 18 19 20 21 22 23 26
Radio, television & communi cation equipment and apparatus
— — — — 87 — 5,325
21 Medical, precision and optical instruments, watches and clocks
— — — — — — 2,180
29 Motor vehicles, trailers and semi-trailers
50 — — 75 — — 16,105
30 Other transport equipment 17 70 90 55 34 — 9,98931 Furniture — — — — — — 21835 Electricity, Gas, Steam and
Hot water supply — — — — — — 629
43 Construction — — — — — — —45 Sale, Maintenance and
repair of motor vehicles and motor cycles; retail sale of automotive fuel.
— — — — — — 464
46 Wholesale trade & commission trade except Motor vehicles
— — — — — — 33
95 Retail Trade except Motor Vehicle, Repair of personal and household goods
— — — — — — 291
52 Supporting and auxiliary transport activities; activities of travel agencies
— — — — — — 75
72 Research and Development — — — — — — 1,430Total 4,105 12,738 12,662 12,753 3,638 6,744 7,71,267Under section 2m (ii)
10-11 Mfg. of food products beverages
— — — — — — 8
12 Mfg. of tobacco products — — — — — — 6513 Mfg. of Textiles — — — 28 — — 56217 Mfg. of Paper & Paper
products — — — — — — 182
20 Mfg. of Chemicals & Chemicals products
— — — — — — 60
23 Mfg. of other non-metalic minerals products
— — 370 — — — 2,106

410
INDUSTRIES Estimated Number of workers employed in working factories Industry wise and
Districtwise as on 31st December, 2010 No. 19.5 (Contd.)
Industry Ambala Panchkula Yamunanagar Kurukshetra Kaithal Karnal PanipatIndustry code 1 2 3 4 5 6 7 8
24 Mfg. of Basic Metals — — 29 — — — —27 Mfg. of electrical
machinery and apparatus
— — — — — — 43
26 Mfg. of Radio, Television & Communication equipment products
— — — — — — 45
31 Mfg. of furniture — — — — — — 2995 Retail trade exccept
motor vehicle, repair of personal household goods
16 — — — — — —
Total 273 20 426 75 — 452 887Under Section 85
10-11 Food products & Beverage
38 — 52 92 77 29 112
12 Mfg. of Tobacco products
13 — — — — — 37
13 Mfg. of Textiles — — — — — — 916 Mfg. of Wood
products except furniture, straw board etc.
395 42 735 179 90 316 309
17 Paper and paper products
90 8 23 10 — 18 105
20 Chemicals and Chemical products
— — 120 — — — 8
23 Other Non-metallic mineral products
— 99 64 — — — —
24 Basic metals 64 — 90 — — — —25 Fabricated metal
products except machinery equipment
— — — — — — —
28 Machinery & equipment
— — — — — — —
27 Electrical machinery & Apparatus
— — — — — — —
Total 600 149 1,084 281 167 363 580 Grand Total 15,193 12,262 40,882 3,908 2,715 28,430 49,334

411
INDUSTRIES Estimated Number of workers employed in working factories Industry wise and
Districtwise as on 31st December, 2010 No. 19.5 (Contd.)
Industry Sonipat Rohtak Jhajjar Faridabad Palwal Gurgaon Mewat RewariIndustry code 1 9 10 11 12 13 14 15 16
24 Mfg. of Basic Metals — 16 — — — 20 — 9627 Mfg. of electrical
machinery and apparatus — — —
— — — — —
26 Mfg. of Radio, Television & Communication equipment products
— — —— — — — —
31 Mfg. of furniture — — — — — — — —95 Retail trade exccept
motor vehicle, repair of personal household goods
— — —— — — — —
Total — 16 182 380 — 72 — 96Under Section 85
10-11 Food products & Beverage
— 17 8 108 — 58 — 15
12 Mfg. of Tobacco products — — — — — — — —13 Mfg. of Textiles — — — — — 46 — —16 Mfg. of Wood products
except furniture, straw board etc.
311 261 198 926 — 239 — 146
17 Paper and paper products 47 20 — 8 — — — —20 Chemicals and Chemical
products 30 — — 164 — 82 — —
23 Other Non-metallic mineral products
24 17 15 287 — 42 — —
24 Basic metals — — — 78 — — — —25 Fabricated metal
products except machinery equipment
— — — 135 — 24 — —
28 Machinery & equipment — — — 40 — — — —27 Electrical machinery &
Apparatus — — — — — 8 — —
Total 412 315 221 1,746 — 499 — 161Grand Total 41,136 17,747 25,776 2,09,602 4,511 2,50,202 120 26,266
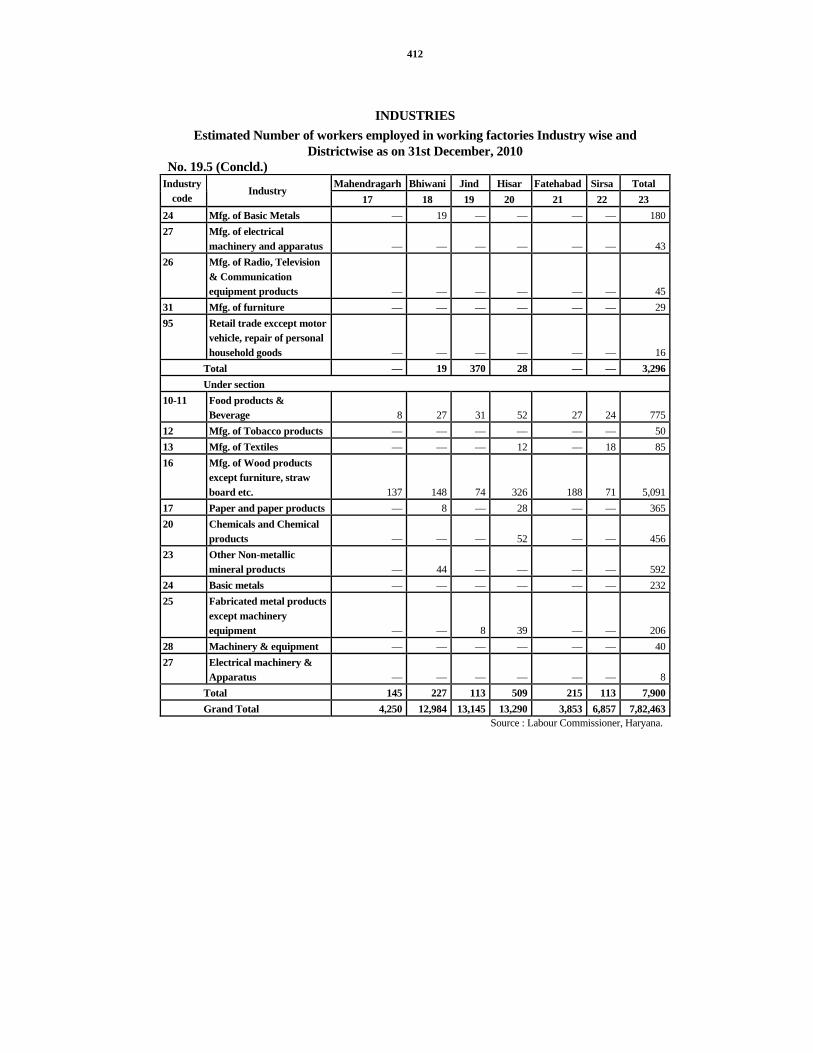
412
INDUSTRIES Estimated Number of workers employed in working factories Industry wise and
Districtwise as on 31st December, 2010 No. 19.5 (Concld.)
Mahendragarh Bhiwani Jind Hisar Fatehabad Sirsa Total Industry code
Industry 17 18 19 20 21 22 23
24 Mfg. of Basic Metals — 19 — — — — 18027 Mfg. of electrical
machinery and apparatus — — — — — — 4326 Mfg. of Radio, Television
& Communication equipment products — — — — — — 45
31 Mfg. of furniture — — — — — — 2995 Retail trade exccept motor
vehicle, repair of personal household goods — — — — — — 16
Total — 19 370 28 — — 3,296Under section
10-11 Food products & Beverage 8 27 31 52 27 24 775
12 Mfg. of Tobacco products — — — — — — 5013 Mfg. of Textiles — — — 12 — 18 8516 Mfg. of Wood products
except furniture, straw board etc. 137 148 74 326 188 71 5,091
17 Paper and paper products — 8 — 28 — — 36520 Chemicals and Chemical
products — — — 52 — — 45623 Other Non-metallic
mineral products — 44 — — — — 59224 Basic metals — — — — — — 23225 Fabricated metal products
except machinery equipment — — 8 39 — — 206
28 Machinery & equipment — — — — — — 4027 Electrical machinery &
Apparatus — — — — — — 8Total 145 227 113 509 215 113 7,900Grand Total 4,250 12,984 13,145 13,290 3,853 6,857 7,82,463
Source : Labour Commissioner, Haryana.

413
INDUSTRIES Industrial Production
No. 19.6 Paper Textiles
(Cotton) Cement Sugar Cycles Sewing Mchines Year/District
Production (M. tons)
Production (Lakh Rs.)
Production (M. tons)
Production (M. tons)
Production (No.)
Production (No.)
1 2 3 4 5 6 7 1966-67 42,313 16,34 5,19,076 59,586 3,77,093 30,587 1970-71 43,395 31,79 4,99,387 83,459 4,68,349 . . 1975-76 54,835 45,29 4,46,664 1,06,961 5,81,333 8,837 1980-81 67,540 71,26 3,49,000 2,00,497 9,46,208 17,037 1985-86 71,315 2,43,95 7,00,000 1,38,782 14,84,673 9,705 1990-91 63,785 6,83,67 6,52,110 6,68,290 14,43,836 6,291 1995-96 16,68,263 2,15,30 9,85,320 4,03,891 18,60,000 . . 2000-01 1,16,517 1,17,59 1,51,114 4,65,060 7,93,230 2,432 2005-06 3,32,846 41,668 43,433 27,73,446 9,69,680 20,505 2009-10 1,24,707 10,994 1,80,188 19,08,072 10,57,559 3,11,556 2010-11(P) 1,24,896 2,23,285 20,34,000 5,17,336 4,88,490 3,12,519 Ambala — — — 3,000 — — Panchkula — — — — — — Yamunanagar 80,221 — 17,985 1,26,174 — 500 Kurukshetra 20,517 — — 44,017 — — Kaithal — — — 15,387 — — Karnal 242 — — 28,067 — 110 Panipat — 37,812 20,00,000 19,850 — — Sonipat — 3,200 — 12,498 4,85,490 — Rohtak — — — 2,49,307 — — Jhajjar 6,377 34 — — — 353 Faridabad — 1,80,000 — — — — Palwal 8,935 2,187 — 5,338 — — Gurgaon — 18 — — 3,000 3,00,000 Mewat — — 3,235 — — — Rewari — — 10,780 — — — Mahendragarh — — 2,000 — — — Bhiwani — — — — — — Jind — — — 13,698 — — Hisar — — — — — 11,556 Fatehabad — — — — — — Sirsa 8,604 34 — — — —

414
INDUSTRIES Industrial Production
No. 19.6 (Contd.) Agricultural Implements
Machine Tools Steel Re-rolling Steel Tubes Water
Fittings Cycle Parts
Production (Lakh `)
Production (Lakh `)
Production (M. tons)
Production (M. tons)
Production (Lakh `)
Production (Lakh `)
Year/District
8 9 10 11 12 13 1966-67 4,81* . . 14,901 . . 33 1,41 1970-71 12,77* . . 23,576 . . 16 1,09 1975-76 16,34* . . 92,801 . . 19,89 1,38 1980-81 72,94* . . 2,75,270 . . 15,36 5,43 1985-86 54,08* . . 1,44,388 . . 23,70 4,58 1990-91 8,650 . . 2,02,603 . . 93 1,327 1995-96 81,43 32,60 . . 28,831 . . . . 2000-01 1,59,26 38,90 23,428 2,64,684 1,95 13,13 2005-06 3,07,05 1,93,76 9,53,377 4,91,605 1,93,56 16,97 2009-10 22,75,055 84,628 1,15,246 4,88,457 52,676 9,968 2010-11(P) 2,85,923 49,110 1,66,610 8,39,963 54,588 30,16,396 Ambala 2,160 59 — — — — Panchkula — 3,244 — — 74 — Yamunanagar 360 — — — — — Kurukshetra 1,346 — — — — — Kaithal 100 — — — — — Karnal 7,270 — — — — — Panipat — — 998 45 54 30,10,000 Sonipat 5,600 3,100 4,800 — 1,200 1,300 Rohtak 1,695 262 — — — — Jhajjar 1,300 1,300 826 3,45,296 50 — Faridabad 2,49,240 14,120 21,400 18,438 6,970 4,794 Palwal 165 24,790 24,504 26,250 501 — Gurgaon 855 2,100 — — 45,000 300 Mewat 322 — — — — — Rewari 800 — 80,000 15,000 — — Mahendragarh 5,400 — — — — — Bhiwani 3 37 3,872 206 142 — Jind 3,599 — — — — — Hisar 850 98 30,210 4,34,728 597 2 Fatehabad 3,000 — — — — — Sirsa 1,858 — — — — —

415
INDUSTRIES Industrial Production
No. 19.6 (Contd.) Scientific
Instruments Glass Hosiery Woollen Textiles
Powerloom Weaving
Handloom Weaving
Production Production (Lakh `)
Production (Lakh `)
Production (Lakh `)
Production (Lakh `)
Production (Sq. Mtrs.)
Year/District
14 15 16 17 18 19 1966-67 136 180 386 2,00 2,01 . . 1970-71 504 403 461 5,19 3,50 . . 1975-76 387 3 1,114 16,45 11,79 . . 1980-81 1,564 9,235 7,402 23,28 5,05 . . 1985-86 704 3,153 145 18,89 40,45 . . 1990-91 1,426 3,395 224 58,13 31,92 . . 1995-96 6,573 . . . . 44,65 1,74,42 44,93,100 2000-01 12,502 11,282 5,534 3,05,00 44,40,32 1,05,68,662 2005-06 13,555 3,535 93,571 45,69 59,11,80 23,93,950 2009-10 2,267 34,830 93,383 9,832 44,700 5,43,063 2010-11(P) 18,48,656 43,296 1,23,832 9,814 46,640 13,99,307 Ambala 2,100 — — — 1,425 94 Panchkula 202 — — — 1,341 — Yamunanagar — — — — — — Kurukshetra — — — — — — Kaithal — — — — — 20,000 Karnal — — — — 910 1,87,500 Panipat 18,45,000 — — 3,864 7,027 8,40,000 Sonipat 800 4,500 800 — 850 50,000 Rohtak — — — — — — Jhajjar 463 2,258 1,428 — 300 — Faridabad — — 32,190 4,850 27,225 320 Palwal — 82 9,314 — 300 — Gurgaon 45 65 80,100 1,100 1,400 — Mewat — — — — — — Rewari — 36,350 — — — — Mahendragarh — — — — — 2 Bhiwani — 41 — — 5,738 — Jind 46 — — — 124 27,211 Hisar — — — — — 2,70,180 Fatehabad — — — — — 4,000 Sirsa — — — — — —

416
INDUSTRIES Industrial Production
No. 19.6 (Concld.) Machine
Embroidery Cotton Ginning
and Pressing Sports Motor Cycle/ Scooters/Mopeds Automobiles Tractor
Production (Lakh `)
Production (Thousand
bales)
Production (Lakh `)
Production (No.)
Production (No.)
Production (No.)
Year/District
20 21 22 23 24 25 1966-67 50 263 58 . . . . 2,227 1970-71 120 . . 5 . . . . 11,425 1975-76 3 303 3 . . . . 19,246 1980-81 6 678 11 . . . . 28,886 1985-86 80 13,179 154 . . . . 51,645 1990-91 19 4,423 25 . . . . 75,629 1995-96 . . 1,063 . . 3,44,585 2,77,776 94,212 2000-01 50 345 8,017 6,95,448 3,00,000 12,880 2005-06 16,535 3,66,726 29,000 49,70,026 5,61,822 19,517 2009-10 21,890 5,41,132 37,917 42,83,579 35,41,065 20,202 2010-11(P) 29,645 5,72,128 38,019 55,95,651 35,01,100 17,656 Ambala — — — — — — Panchkula — — — — — — Yamunanagar — — — — — — Kurukshetra — — — — — — Kaithal — — — — — — Karnal — — 7 — — — Panipat — 806 12 — — — Sonipat — — — — — — Rohtak — 2,627 — — — — Jhajjar 2,000 — 3,000 — 600 — Faridabad 9,745 — — — — 14,200 Palwal — — — — — 3,456 Gurgaon 17,900 — 35,000 39,06,959 35,00,500 — Mewat — — — — — — Rewari — — — 16,88,692 — — Mahendragarh — — — — — — Bhiwani — 33,000 — — — — Jind — 15,050 — — — — Hisar — 824 — — — — Fatehabad — 250 — — — — Sirsa — 5,19,571 — — — —
Source : Director, Industries and Commerce Department, Haryana. * Includes machine tools also. . . Not available. (P) Figures are provisional.

417
INDUSTRIES Cotton/Man-made Fibre Textile Mills (Non-SSI) in Haryana State
No. 19.7 Number of Composite Mills Installed Capacity
year Spinning Composite Total Spindles
(000) Rotors Looms Number of Workers
1 2 3 4 5 6 7 8
1979-80 10 2 12 270 — 978 19,953
1989-90 14 2 16 277 1,080 336 16,388
1990-91 14 2 16 294 1,080 261 16,714
1995-96 62 2 64 350 28,184 200 21,352
1996-97 71 2 73 369 39,756 211 25,132
1997-98 74 2 76 366 51,958 211 25,466
1998-99 75 2 77 369 67,856 211 23,341
2000-01 76 2 78 384 68,416 211 22,445
2005-06 76 2 78 393 74,168 135 18,722
2009-10 66 2 68 304 71,396 155 13,366
2010-11 69 2 71 342 76,700 153 12,888
Source :— Textile Commissioner, Mumbai. P—Provisional

418
INDEX OF INDUSTRIAL PRODUCTION

419
INDUSTRIES Index of Industrial Production according to Industrial Classification
(Base 1999-2000=100) No. 19.8
Industry code
Item Weight 2000-01 2001-02 2002-03 2005-06
1 2 3 4 5 6 7 15 Food products & beverages 116.38 105.9 108.5 112.9 127.016 Tobacco products 0.45 125.0 136.5 125.8 152.317 Textile 34.30 101.2 102.6 107.9 118.318 Wearing apparel; dressing and dyeing of fur 35.64 108.1 116.3 134.5 234.7 19 Tanning & dressing of leather; manufacture
of luggage, handbags, saddlery, harness & footwear
20.98 113.2 123.0 131.1 161.5
20 Wood and products of wood and cork, except furniture; manufacture of articles of straw and plating materials
1.10 117.3 139.3 158.5 183.8
21 Paper & paper products 8.98 100.1 110.0 110.4 133.122 Publishing, Printing and reproduction of
reacorded media 5.44 92.1 84.5 82.5 92.9
23 Coke, refined petroleum products and nuclear fuel
0.80 104.1 121.6 99.8 71.3
24 Chemicals and Chemical products 43.03 92.2 101.3 103.4 102.125 Rubber and Plastic products 28.52 98.8 103.1 112.8 124.026 Other non-metallic mineral products 22.06 103.9 106.0 110.7 129.727 Basic metals 84.52 109.2 107.8 116.4 127.628 Febricated metal products, except
machinery and equipment 25.11 104.8 106.3 109.2 126.4
29 Machinery & equipment N.E.C. 123.04 99.9 99.3 99.5 114.730 Office, accounting & computing machinery 19.90 121.0 122.2 124.7 111. 131 Electrical machinery and appartus N.E.C. 32.14 101.6 113.8 121.8 141.932 Redio, Television & Communication
equipments and appartus 24.01 97.9 116.9 127.2 177.3
33 Medical, precision and optical instruments, watches and Clocks
10.80 114.6 136.7 157.6 217.6
34 Motor vehicles, trailers and semi trailers 200.23 101.1 105.6 118.7 176.135 Other transport equipment 83.24 129.1 163.3 191.7 319.836 Furniture ; manufacturing N.E.C. 4.27 115.9 111.4 120.3 99.9 Mining & Quarrying 18.83 114.2 119.2 109.1 92.9 Manufacturing 924.94 105.6 112.3 121.6 159. 1 Electricity 56.23 119.2 161.9 174.6 238.4 General Index 1,000.00 106.5 115.2 124.3 162.3*—Provisional.

420
INDUSTRIES Index of Industrial Production according to Industrial Classification
(Base 1999-2000=100) No. 19.8 (Concld)
Industry code
Item 2006- 07
2007-08
2008-09
2009- 10
2010- 11 (P)
Percentage increase/ decrease over the previous
year 1 2 8 9 10 11 12 13
15 Food products & beverages 136.6 144.0 129.4 128.0 132.7 3.7 16 Tobacco products 180.7 197.2 200.5 247.8 271.3 9.5 17 Textile 119.5 131.2 130.1 130.7 136.1 4.1 18 Wearing apparel; dressing and dyeing of fur 260.5 291.6 324.5 339.3 355.9 4.9 19 Tanning & dressing of leather; manufacture of
luggage, handbags, saddlery, harness & footwear 167.7 176.9 154.1 158.2 159.5 0.8
20 Wood and products of wood and cork, except furniture; manufacture of articles of straw and plating materials
164.0 147.8 151.8 152.9 153.3
0.3
21 Paper & paper products 153.0 155.9 157.3 158.4 156.8 -1.0 22 Publishing, Printing and reproduction of reacorded
media 93.9 90.2 86.7 87.3 78.0 -10.7
23 Coke, refined petroleum products and nuclear fuel 78.3 86.8 88.4 115.8 41.9 -63.8 24 Chemicals and Chemical products 115.5 124.2 135.4 159.3 174.7 9. 7 25 Rubber and Plastic products 120.8 125.4 128.4 138.1 160.8 16.4 26 Other non-metallic mineral products 144. 6 164.9 165.7 168.7 173.4 2.8 27 Basic metals 132. 1 146.0 142.4 150.2 156.3 4.1 28 Febricated metal products, except machinery and
equipment 136.0 145.9 153.5 181.5 206.5 13.8
29 Machinery & equipment N.E.C. 147.2 152.8 156.4 168.9 184.0 8.9 30 Office, accounting & computing machinery 124.7 128.4 156.8 201.2 234.5 16.6 31 Electrical machinery and appratus N.E.C. 164. 6 177.2 176.8 146.3 145.3 -0.7 32 Redio, Television & Communication equipments
and apparts 233.6 290.4 310.1 263.4 263.7 0.1
33 Medical, precision and optical instruments, watches and Clocks 250.1 295.3 317.9 387.6 478.1 23.3
34 Motor vehicles, trailers and semi trailers 194.5 222.0 234.0 304.9 341.6 12.0 35 Other transport equipment 344.5 356.4 363.6 375. 5 406.5 8.3 36 Furniture ; manufacturing N.E.C. 105.4 107.4 108.2 114.2 100.0 -12.4 Mining & Quarrying 86.0 89.5 96.0 98.7 97.6 -1.1 Manufacturing 176.7 192.4 196.9 218.0 236.5 8.5 Electricity 262.6 271.7 316.4 360.2 369.5 2.6 General Index 179.8 194.9 201.7 223.7 241.4 7.9

421
INDUSTRIES Index of Industrial Production (By Major Group)
(Base Year 1999-2000=100) No. 19.9 Item/Industry Code Weight 2000-
01 2001-
02 2002-
03 2005-
06 2006-
07 2007-
08 2008-
09 2009-
10 2010-
11 Percen-
tage increase/decrease over the previous year of 2009-10
1 2 3 4 5 6 7 8 9 10 11 12 General Index 1000.00 106.5 115.2 124.3 162.3 179.8 194.9 201.7 223.7 241.4 7.9 Used based classification A—Basic Goods Industries
191.43 108.7 122.9 128.0 146.9 156.6 166.5 180.0 195.6 203.7 4.1
B—Capital Goods Industries
254.51 93.9 95.2 97.3 129.3 149.8 167.3 173.7 201.7 233.6 15.8
C—Intermediate Goods Industries
207.25 113.5 121.3 138.2 172.6 191.3 207.0 219.5 274.9 287.1 4.5
D—Consumer Goods Industries
346.81 110.3 121.9 133.8 188.9 207.9 223.6 223.6 224.9 240.5 7.0
Durable Goods 118.91 117.0 141.0 161.3 263.7 295.7 315.4 323.9 319.2 345.9 8.4 Non-durable Goods 227.90 106.8 112.0 119.5 149.9 162.1 175.8 171.2 175.7 185.6 5.6
Source :— Department of Economic and Statistical Analysis, Haryana. P—Provisional

422
INDUSTRIES
Classification of Loans (Amountwise) Sanctioned by the Haryana Financial Corporation in Haryana State
No. 19.10 1966-67 1980-81 1985-86
Serial No.
Range involved Number of applications sanctioned
Amount involved (in 000 `)
Number of applications sanctioned
Amount involved (in 000 `)
Number of applications sanctioned
Amount involved (in
000 `)
1 2 3 4 5 6 7 8
1. Loans not exceeding Rs. 25,000 — — 166 30,35 27 5,01
2. Loans exceeding Rs. 25,000 but not
exceeding Rs. 50,000
— — 18 6,81 30 10,46
3. Loans exceeding Rs. 50,000 but not
exceeding Rs. 1,00,000
3 2,61 31 23,11 68 55,80
4. Loans exceeding Rs. 1,00,000 but not
exceeding Rs. 2,00,000
12 21,40 45 67,35 58 87,23
5. Loans exceeding Rs. 2,00,000 but not
exceeding Rs. 5,00,000
7 28,68 61 2,09,31 69 2,43,99
6. Loans exceeding Rs. 5,00,000 but not
exceeding Rs. 20,00,000
10 1,13,50 54 5,77,06 75 8,29,71
7. Loans exceeding Rs. 20,00,000 but
not exceeding Rs. 60,00,000
— — 5 1,41,34 37 12,55,52
8. Loans exceeding Rs. 60,00,000 but
not exceeding Rs. 90,00,000
— — — — — —
9. Loans exceeding Rs. 90,00,000 but
not exceeding Rs. 1,20,00,000
— — — — — —
10. Above Rs. 1,20,00,000 — — — — — —
Total 32 1,66,19 380 10,55,33 364 24,87,72

423
INDUSTRIES Classification of Loans (Amountwise) Sanctioned by the Haryana Financial Corporation
in Haryana State No. 19.10 (Contd.)
1990-91 1995-96 2000-01 Serial No. Range involved Number of
applications sanctioned
Amount involved (in 000 `)
Number of applications sanctioned
Amount involved (in 000 `)
Number of applications sanctioned
Amount involved (in 000 `)
1 2 9 10 11 12 13 14 1. Loans not exceeding Rs. 25,000 11 2,68 — — — — 2. Loans exceeding Rs. 25,000 but
not exceeding Rs. 50,000 80 29,60 13 5,38 — —
3. Loans exceeding Rs. 50,000 but not exceeding Rs. 1,00,000
62 75,16 22 18,06 2 1,94
4. Loans exceeding Rs. 1,00,000 but not exceeding Rs. 2,00,000
233 3,16,17 110 1,79,89 17 28,16
5. Loans exceeding Rs. 2,00,000 but not exceeding Rs. 5,00,000
393 14,16,40 225 8,31,54 35 1,27,11
6. Loans exceeding Rs. 5,00,000 but not exceeding Rs. 20,00,000
192 17,18,16 535 58,20,05 125 14,60,17
7. Loans exceeding Rs. 20,00,000 but not exceeding Rs. 60,00,000
58 21,12,74 217 78,10,52 91 33,19,53
8. Loans exceeding Rs. 60,00,000 but not exceeding Rs. 90,00,000
6 4,90,50 52 39,84,15 21 16,21,00
9. Loans exceeding Rs. 90,00,000 but not exceeding Rs. 1,20,00,000
— — 34 35,83,51 11 11,67,38
10. Above Rs. 1,20,00,000 — — 31 56,39,87 24 53,11,24 Total 1,035 61,61,41 1,239 2,78,72,97 326 1,30,36,53

424
INDUSTRIES Classification of Loans (Amountwise) Sanctioned by the Haryana Financial Corporation
in Haryana State No. 19.10 (Concld.)
2005-06 2009-10 2010-11(P)
Serial No. Range involved
Number of applica-
tions sanctioned
Amount involved (in 000 `)
Number of applica-
tions sanctioned
Amount involved (in 000 `)
Number of applica-
tions sanctioned
Amount involved (in 000 `)
15 16 17 18 19 20 1. Loans not exceeding
Rs. 25,000 6 1,07 — — — —
2. Loans exceeding Rs. 25,000 but not exceeding Rs. 50,000
6 2,31 — — — —
3. Loans exceeding Rs. 50,000 but not exceeding Rs. 1,00,000
10 7,04 — — — —
4. Loans exceeding Rs. 1,00,000 but not exceeding Rs. 2,00,000
23 35,22 — — — —
5. Loans exceeding Rs. 2,00,000 but not exceeding Rs. 5,00,000
45 1,41,54 2 6,91 1 2,70
6. Loans exceeding Rs. 5,00,000 but not exceeding Rs. 20,00,000
58 6,91,57 8 98,60 3 36,20
7. Loans exceeding Rs. 20,00,000 but not exceeding Rs. 60,00,000
44 15,11,76 24 8,55,58 2 77,43
8. Loans exceeding Rs. 60,00,000 but not exceeding Rs. 90,00,000
10 7,51,22 4 3,02,00 — —
9. Loans exceeding Rs. 90,00,000 but not exceeding Rs. 1,20,00,000
6 5,92,00 3 300,00 — —
10. Above Rs. 1,20,00,000 17 40,84,52 3 7,85,00 — —Total 225 78,18,25 44 23,48,09 6 1,16,33
Source :— Haryana Financial Corporation, Chandigarh. P—Provisional

425
INDUSTRIES Industrywise classification of Applications received, sanctioned or otherwise disposed of
and loans disbursed by Haryana Financial Corporation during 2010-11 No. 19.11
Type of Industry No. of
applications received
Amount (000 `)
No. of applications sanctioned
Amount (000 `)
#.
1 2 3 4 5 1. Stone quarrying, clay and sand pits — — — —2. Food manufacturing industries (except
Beverage Industries and cold storage) — — — —
3. Cold Storage — — — —4. Tobacco manufacturing — — — —5. Manufacturing of textiles, spinning, weaving
and finishing of textiles (excluding hosiery and cotton ginning and pressing)
— — — —
6. Hosiery — — — —7. Cotton ginning and pressing — — — —8. Manufacturing of footwear, other wearing
apparel and made-up garments 2 70.00 — —
9. Manufacturing of wood and cork except manufacturing of furniture
— — — —
10. Manufacturing of paper and paper 1 32.00 — —11. Printing, publishing and allied products
industries — — — —
12. Manufacturing of rubber products — — — —13. Manufacturing of chemicals and chemical
products — — — —
14. Manufacturing of non-metallic mineral products except products of petroleum and coal
— — — —
15. Basic metal industries—Iron and Steel 2 129.00 — —

426
INDUSTRIES
Industrywise classification of Applications received, sanctioned or otherwise disposed of and loans disbursed by Haryana Financial Corporation during 2010-11
No. 19.11 (Contd.)
#. Type of Industry
No. of applications rejected/withdrawn
Amount (Lacs `)
No. of applications
rejected/ withdrawn
Amount (Lacs `)
1 6 7 8 9 1. Stone quarrying and sand pits — — — —2. Food manufacturing industries
(except Beverage Industries and cold storage)
— — 1 7,93
3. Cold Storage — — — —4. Tobacco manufacturing Industries — — — —5. Manufacturing of textiles,
spinning, weaving and finishing of textiles (excluding hosiery and cotton ginning and pressing)
1 8,29 4 35,33
6. Hosiery — — — —7. Cotton ginning and pressing — — — —8. Manufacturing of footwear and
other wearing apparels and readymade garments
2 46,06 4 36,12
9. Manufacturing of wood and cork except manufacturing of furniture
— — — —
10. Manufacturing of paper and paper products
2 24,35 — —
11. Printing, publishing and allied products industries
1 5,20 — —
12. Manufacturing of rubber products — — — —13. Manufacturing of chemicals and
chemical products 1 — — —
14. Manufacturing of non-metal mineral products except products of petroleum and coal
— — — —
15. Basic metal industries—Iron and Steel
2 85,50 1 52,19
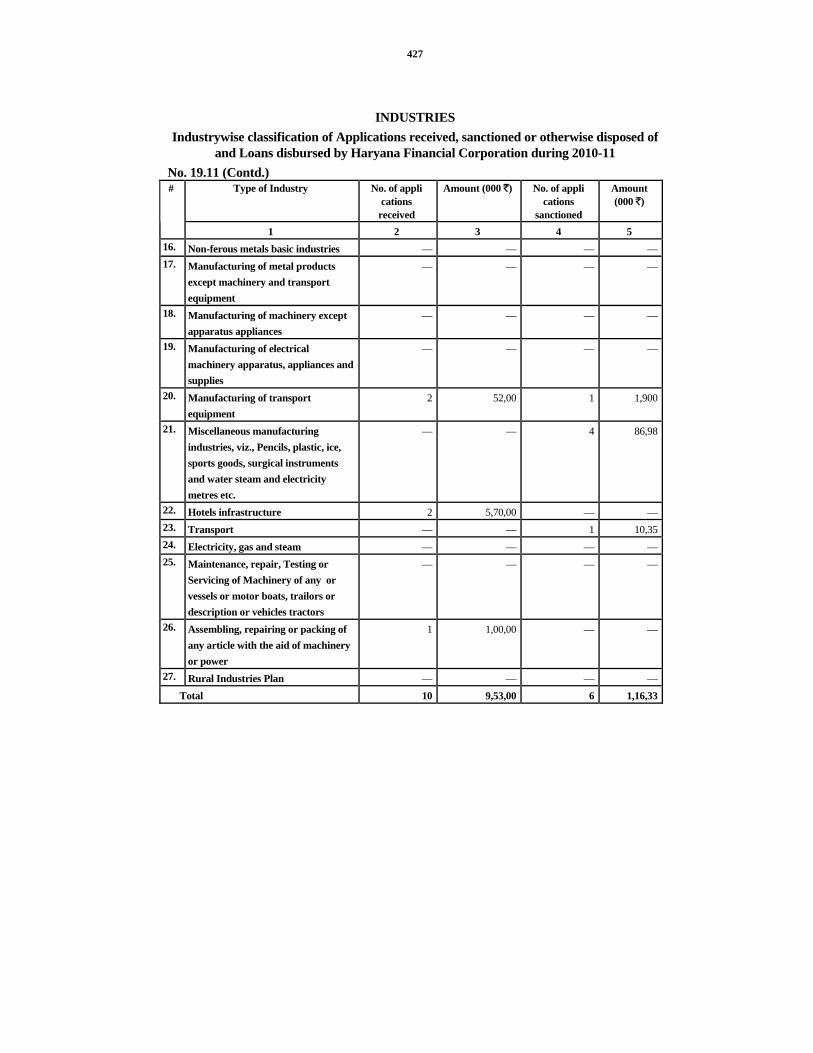
427
INDUSTRIES Industrywise classification of Applications received, sanctioned or otherwise disposed of
and Loans disbursed by Haryana Financial Corporation during 2010-11 No. 19.11 (Contd.)
Type of Industry No. of appli cations
received
Amount (000 `) No. of appli cations
sanctioned
Amount (000 `)
#
1 2 3 4 5 16. Non-ferous metals basic industries — — — —17. Manufacturing of metal products
except machinery and transport equipment
— — — —
18. Manufacturing of machinery except apparatus appliances
— — — —
19. Manufacturing of electrical machinery apparatus, appliances and supplies
— — — —
20. Manufacturing of transport equipment
2 52,00 1 1,900
21. Miscellaneous manufacturing industries, viz., Pencils, plastic, ice, sports goods, surgical instruments and water steam and electricity metres etc.
— — 4 86,98
22. Hotels infrastructure 2 5,70,00 — —23. Transport — — 1 10,3524. Electricity, gas and steam — — — —25. Maintenance, repair, Testing or
Servicing of Machinery of any or vessels or motor boats, trailors or description or vehicles tractors
— — — —
26. Assembling, repairing or packing of any article with the aid of machinery or power
1 1,00,00 — —
27. Rural Industries Plan — — — —Total 10 9,53,00 6 1,16,33

428
INDUSTRIES
Industrywise classification of Applications received, sanctioned or otherwise disposed of and Loan disbursed by Haryana Financial Corporation during 2010-11
No. 19.11 (Concld.) # Type of Industry No. of appli cations
rejected/withdrawn Amount (000 `)
No. of appli cations to whom loans disbursed
Amount (000 `)
1 6 7 8 9 16. Non-ferous metals basic
industries — — — —
17. Manufacturing of metal products except machinery and transport equipment
1 36,00 — —
18. Manufacturing of machinery except apparatus appliances
— — — —
19. Manufacturing of electrical machinery apparatus, appliances and supplies
1 1,26,28 2 28,04
20. Manufacturing of transport equipment
— 13,52 — —
21. Miscellaneous manufacturing of industries, viz., Pencils, plastic, ice, sports goods, surgical instruments and water steam and electricity metres etc.
1 13,94 9 1,42,45
22. Hotels infrastructure 4 4,09,68 1 34,8523. Transport 1 2,68 — —24. Electricity, gas and steam — — — —25. Maintenance, repair, testing
& servicing of machinery of any description of vehicles vessels of motor boats, trailors and tractors
— — — —
26. Assembling, repairing or packing of any articles with the aid of machinery or power
— — — —
27. Rural Industries Plan — — — —
Total 17 7,71,50 22 3,36,91Source : Haryana Financial Corporation, Chandigarh.
INDUSTRIES Classification of Loans and Advances in Haryana (Districtwise)
No. 19.12

429
Amount Sanctioned Amount disbursed Small-Scale Others Small-Scale Others Years/District
No. of units
Amount (000 `)
No. of units
Amount (000 `)
No. of units
Amount (000 `)
No. of units
Amount (000 `)
1 2 3 4 5 6 7 8 9 1970-71 48 1,15,25 12 1,22,70 27 53,88 15 56,071975-76 192 4,68,50 36 5,25,62 136 2,77,70 27 3,28,621980-81 368 8,03,61 12 2,51,72 265 3,88,42 13 1,23,761985-86 340 19,22,99 24 5,64,73 347 12,39,64 10 2,37,841990-91 1,012 51,92,20 23 9,69,21 627 32,93,46 9 4,94,811995-96 1,153 2,01,30,51 86 77,42,46 1,747 1,69,28,45 117 62,30,592000-01 316 1,16,72,43 10 13,64,10 306 51,00,43 6 3,65,052005-06 222 74,68,84 3 3,49,41 217 37,80,42 1 2,55,002009-10 44 23,48,09 — — 65 21,37,76 — —2010-11 6 11,633 — — 22 33,691 — —Ambala — — — — — — — —Panchkula 1 270 — — 1 270 — —Yamunanagar — — — — — — — —Kurukshetra — — — — — — — —Kaithal — — — — — — — —Karnal — — — — — — — —Panipat — — — — — — — —Sonipat 1 19,00 — — 6 67,90 — —Rohtak 2 28,78 — — 5 1,06,59 — —Jhajjar — — — — — — — —Faridabad — — — — 1 5,03 — —Gurgaon — — — — 7 86,97 — —Mewat — — — — — — — —Rewari — — — — — — — —Mahendragarh — — — — — — — —Bhiwani — — — — — — — —Jind — — — — — — — —Hisar* 2 65,85 — — 2 67,72 — —Fatehabad — — — — — — — —Sirsa — — — — — — — —

430
INDUSTRIES Classification of Loans and Advances in Haryana (Districtwise)
No. 19.12 (Concld) Amount outstanding
Small-Scale Others Small-Scale Others Years/District No. of units Amount (000 `) No. of units Amount (000 `)
1 10 11 12 13 1970-71 100 1,74,22 87 4,72,841975-76 810 11,42,13 141 10,35,461980-81 1,122 19,02,96 124 15,02,881985-86 2,380 53,30,69 125 17,71,101990-91 33,94 1,12,70,46 137 31,13,831995-96 5,620 4,36,21,37 383 1,10,66,682000-01 4,559 4,21,36,72 194 80,02,892005-06 2,435 2,37,57,88 109 50,14,072009-10 718 1,58,29,61 47 18,30,902010-11 597 1,18,35,66 39 16,84,49Ambala — — — —Panchkula 32 3,09,63 — — Yamunanagar — — — —Kurukshetra — — — —Kaithal — — — —Karnal — — — —Panipat 100 9,68,05 9 3,89,45Sonipat 83 15,79,53 1 87,12Rohtak 110 13,83,11 7 3,52,94Jhajjar — — — —Faridabad 41 8,29,06 5 35,78Gurgaon 157 57,82,35 15 6,39,22Mewat — — — —Rewari — — — —Mahendragarh — — — —Bhiwani — — — —Jind — — — —Hisar* 74 9,83,93 2 1,79,98Fatehabad — — — —Sirsa — — — —
Source :— Haryana Financial Corporation, Chandigarh. * Information of District Fatehabad is included in district Hisar. P—Provisional
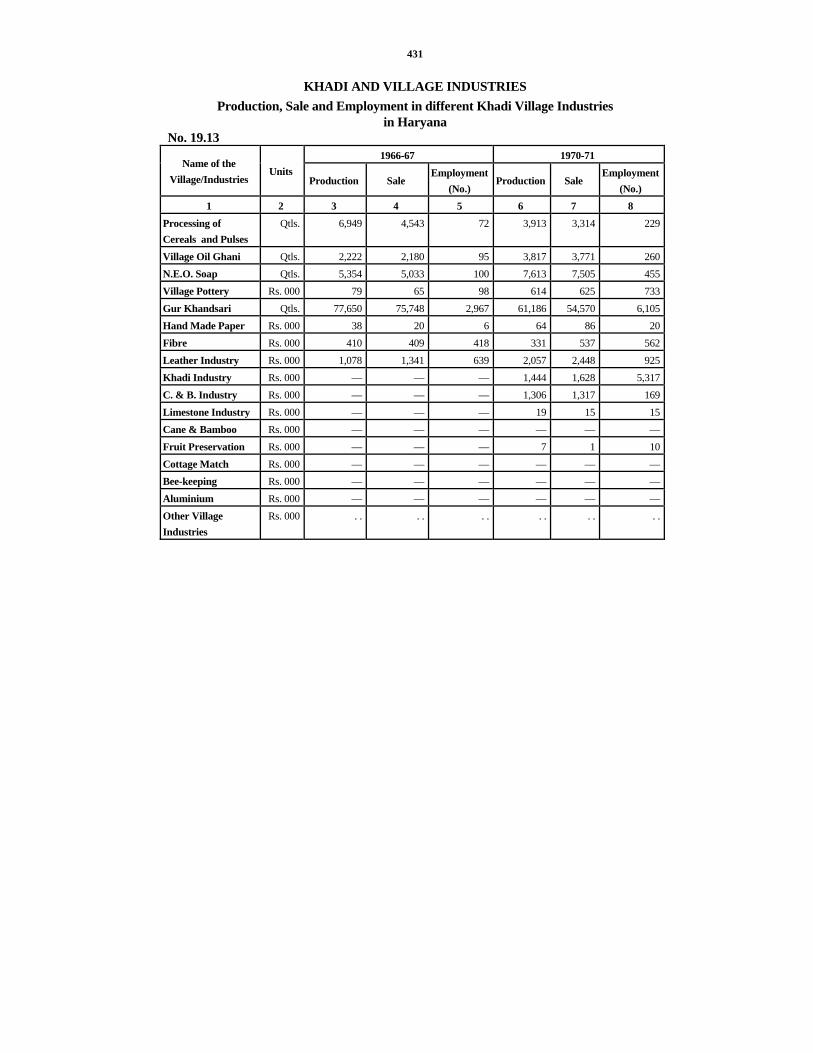
431
KHADI AND VILLAGE INDUSTRIES Production, Sale and Employment in different Khadi Village Industries
in Haryana No. 19.13
1966-67 1970-71 Name of the
Village/Industries Units
Production Sale Employment
(No.) Production Sale
Employment (No.)
1 2 3 4 5 6 7 8 Processing of Cereals and Pulses
Qtls. 6,949 4,543 72 3,913 3,314 229
Village Oil Ghani Qtls. 2,222 2,180 95 3,817 3,771 260N.E.O. Soap Qtls. 5,354 5,033 100 7,613 7,505 455Village Pottery Rs. 000 79 65 98 614 625 733Gur Khandsari Qtls. 77,650 75,748 2,967 61,186 54,570 6,105Hand Made Paper Rs. 000 38 20 6 64 86 20Fibre Rs. 000 410 409 418 331 537 562Leather Industry Rs. 000 1,078 1,341 639 2,057 2,448 925Khadi Industry Rs. 000 — — — 1,444 1,628 5,317C. & B. Industry Rs. 000 — — — 1,306 1,317 169Limestone Industry Rs. 000 — — — 19 15 15Cane & Bamboo Rs. 000 — — — — — —Fruit Preservation Rs. 000 — — — 7 1 10Cottage Match Rs. 000 — — — — — —Bee-keeping Rs. 000 — — — — — —Aluminium Rs. 000 — — — — — —Other Village Industries
Rs. 000 . . . . . . . . . . . .

432
KHADI AND VILLAGE INDUSTRIES Production, Sale and Employment in different Khadi, Village Industries in Haryana
No. 19.13 (Contd.) 1975-76 1980-81
Name of the Village/Industries
Units Production Sale
Employment (No.)
Production Sale Employment
(No.) 1 2 9 10 11 12 13 14
Processing of Cereals and Pulses
Qtls. 7,104 6,915 91 42,217 37,918 612
Village Oil Ghani Qtls. 5,879 5,765 149 5,740 5,693 141N.E.O. Soap Qtls. 14,955 14,852 207 27,351 26,971 365Village Pottery Rs. 000 8,583 9,033 4,696 18,553 23,086 13,662Gur Khandsari Qtls. 1,00,153 98,875 7,197 1,21,803 1,21,803 10,402Hand Made Paper Rs. 000 33 44 13 587 442 73Fibre Rs. 000 688 764 541 2,657 2,776 518Leather Industry Rs. 000 8,807 10,190 1,663 21,798 24,097 3,621Khadi Industry Rs. 000 1,724 2,485 3,791 2,153 3,715 2,454C. & B. Industry Rs. 000 9,100 9,832 730 34,433 35,154 2,813Limestone Industry Rs. 000 381 369 47 2,590 3,250 228Cane & Bamboo Rs. 000 — — — — — —Fruit Preservation Rs. 000 234 286 30 280 363 22Cottage Match Rs. 000 209 149 102 1,096 1,091 479Bee-keeping Rs. 000 4 4 — 10 11 116Aluminium Rs. 000 — — — — — —Other Village Industries
Rs. 000 . . . . . . . . . . . .

433
KHADI AND VILLAGE INDUSTRIES
Production, Sale and Employment in different Khadi and Village Industries in Haryana No. 19.13 (Contd.)
1985-86 1990-91 Name of the Village/Industries Units
Production Sale Employment (No.) Production Sale Employment
(No.) 1 2 15 16 17 18 19 20
Processing of Cereals and Pulses
Qtls. 75,208 70,760 1,782 42,733 41,634 1,589
Village Oil Ghani Qtls. 6,745 6,657 102 708 719 11N.E.O. Soap Qtls. 82,640 81,654 564 52,870 50,439 540Village Pottery Rs. 000 38,565 46,033 16,015 59,935 65,993 16,373Gur Khandsari Qtls. 40,605 40,364 1,567 79,783 78,934 1,664Hand Made Paper Rs. 000 1,639 1,767 100 4,358 3,945 162Fibre Rs. 000 7,913 8,767 1,790 14,924 19,698 2,760Leather Industry Rs. 000 37,226 40,780 6,295 45,249 48,995 7,971Khadi Industry Rs. 000 10,360 13,504 4,152 40,727 43,957 8,725C. & B. Industry Rs. 000 71,521 74,309 4,826 1,10,268 1,17,316 5,116Limestone Industry Rs. 000 5,257 6,315 364 8,891 10,353 445Cane & Bamboo Rs. 000 2,146 2,509 546 3,025 4,158 863Fruit Preservation Rs. 000 1,388 1,621 106 2,999 2,785 123Cottage Match Rs. 000 870 804 179 1,485 1,756 77Bee-keeping Rs. 000 165 240 236 329 372 212Aluminium Rs. 000 729 636 12 809 1,097 24Other Village Industries
Rs. 000 . . . . . . 1,451 2,441 421
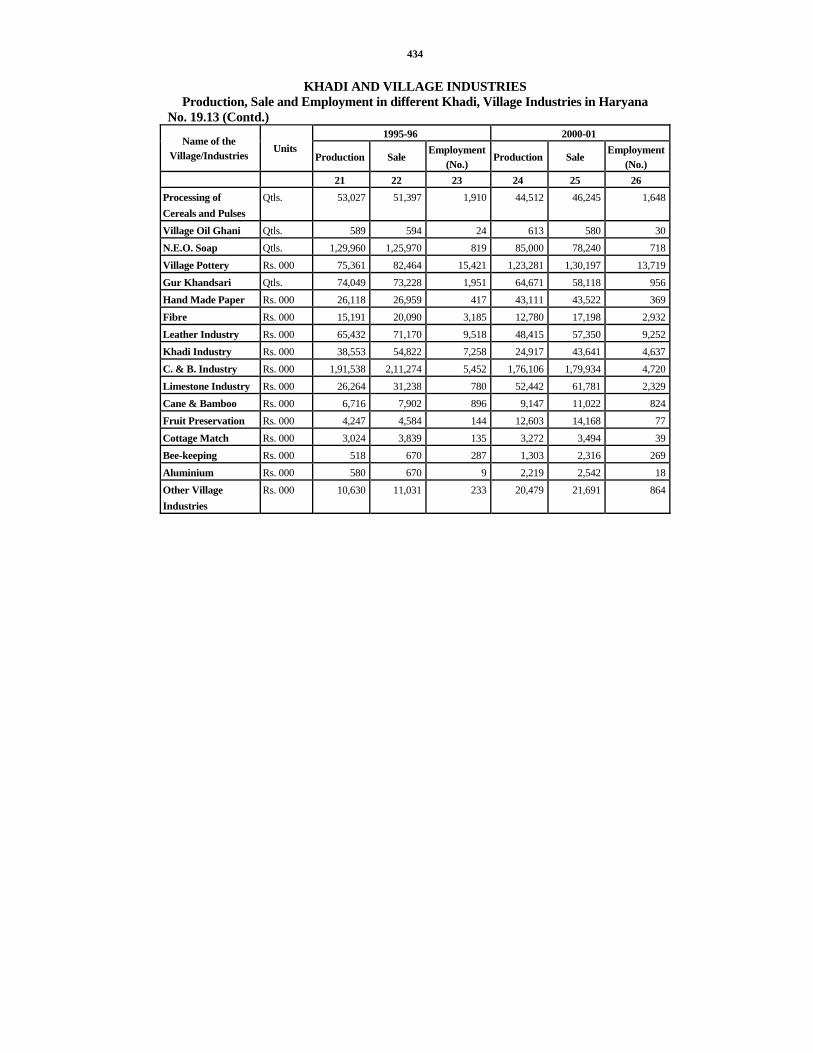
434
KHADI AND VILLAGE INDUSTRIES Production, Sale and Employment in different Khadi, Village Industries in Haryana
No. 19.13 (Contd.) 1995-96 2000-01
Name of the Village/Industries
Units Production Sale
Employment (No.)
Production Sale Employment
(No.) 21 22 23 24 25 26
Processing of Cereals and Pulses
Qtls. 53,027 51,397 1,910 44,512 46,245 1,648
Village Oil Ghani Qtls. 589 594 24 613 580 30N.E.O. Soap Qtls. 1,29,960 1,25,970 819 85,000 78,240 718Village Pottery Rs. 000 75,361 82,464 15,421 1,23,281 1,30,197 13,719Gur Khandsari Qtls. 74,049 73,228 1,951 64,671 58,118 956Hand Made Paper Rs. 000 26,118 26,959 417 43,111 43,522 369Fibre Rs. 000 15,191 20,090 3,185 12,780 17,198 2,932Leather Industry Rs. 000 65,432 71,170 9,518 48,415 57,350 9,252Khadi Industry Rs. 000 38,553 54,822 7,258 24,917 43,641 4,637C. & B. Industry Rs. 000 1,91,538 2,11,274 5,452 1,76,106 1,79,934 4,720Limestone Industry Rs. 000 26,264 31,238 780 52,442 61,781 2,329Cane & Bamboo Rs. 000 6,716 7,902 896 9,147 11,022 824Fruit Preservation Rs. 000 4,247 4,584 144 12,603 14,168 77Cottage Match Rs. 000 3,024 3,839 135 3,272 3,494 39Bee-keeping Rs. 000 518 670 287 1,303 2,316 269Aluminium Rs. 000 580 670 9 2,219 2,542 18Other Village Industries
Rs. 000 10,630 11,031 233 20,479 21,691 864

435
KHADI AND VILLAGE INDUSTRIES Production, Sale and Employment in different Khadi Village Industries in Haryana
No. 19.13 (Concld.) 2005-06 2006-07 Name of the
Village/Industries Units Production Sale Employment
(No.) Production Sale Employment (No.)
1 2 27 28 29 30 31 32 Processing of Cereals and Pulses
Qtls. 66,351 70,653 3,160 69,829 58,936 3,786
Village Oil Ghani Qtls. 3,914 3,852 242 4,654 4,605 307N.E.O. Soap Qtls. 95,558 91,430 1,188 94,874 90,735 1,187Village Pottery Rs. 000 3,39,439 3,74,313 27,144 3,70,100 4,06,981 28,213Gur Khandsari Qtls. 98,140 94,248 1,552 98,256 94,385 1,587Hand Made Paper Rs. 000 96,830 99,075 1,034 97,567 99,800 1,034Fibre Rs. 000 17,966 20,743 3,450 19,282 22,165 3,490Leather Industry Rs. 000 57,911 67,053 9,804 59,689 68,864 9,801Khadi Industry Rs. 000 53,633 88,326 4,839 72,423 1,19,957 4,872C. & B. Industry Rs. 000 4,74,836 5,12,763 9,736 5,32,252 5,74,749 10,616Limestone Industry Rs. 000 93,652 1,13,124 5,102 98,164 1,18,121 5,354Cane & Bamboo Rs. 000 13,612 15,622 1,111 22,455 25,465 1,222Fruit Preservation Rs. 000 53,156 55,652 530 64,369 67,233 618Cottage Match Rs. 000 5,164 6,476 92 6,456 7,963 107Bee-keeping Rs. 000 5,717 6,905 654 8,154 9,525 878Aluminium Rs. 000 5,705 6,469 75 6,405 7,280 80Other Village Industries
Rs. 000 95,065 82,879 3,258 1,09,816 92,664 3,866
Source :— Haryana Khadi and Village Industries Board, Panchkula.

436
KHADI AND VILLAGE INDUSTRIES
Amount of Grants and Loans disbursed to the various Industries in Haryana by Khadi and Village Industries Board
No. 19.14 (Thousand `) 1966-67 1967-68 1970-71
Name of the Industry Grants Loans Total Grants Loans Total Grants Loans Total
1 2 3 4 5 6 7 8 9 10 Processing of Cereals 5 85 90 — 40 40 15 99 114and Pulses Village Oil Ghani 6 66 72 — 8 8 5 25 30N.E.O. Soap 26 92 118 11 67 78 11 133 144Village Pottery 12 5 17 6 11 17 15 145 160Hand Made Paper — 25 25 — 25 25 — 70 70Gur Khandsari 10 58 68 6 71 77 32 499 531Leather Industry 34 14 48 13 50 63 63 150 213C. & B. Industry — — — — — — — — —Bee-keeping — — — — — — — — —Fibre 2 — 2 3 — 3 12 7 19Cane & Bamboo — — — — — — — — —Khadi Industry 22 943 965 — 19 19 — — —Cottage Match — — — — — — — — —Other Village — — — — — — 227 978 1,205Industries Fruit Preservation — — — — — — — — —Limestone Industry — — — — — — — — —Aluminium — — — — — — — — —Village Industries — — — — — — — — —Total 117 1,288 1,405 39 291 330 380 2,106 2,486

437
KHADI AND VILLAGE INDUSTRIES Amount of Grants and Loans disbursed to the various Industries in Haryana by Khadi
and Village Industries Board No. 19.14 (Contd.) (Thousand `)
1975-76 1980-81 1985-86 Grants Loans Total Grants Loans Total Grants Loans Total Name of the Industry
11 12 13 14 15 16 17 18 19 Processing of 41 156 197 60 403 463 –– 1,284 1,284Cereals and Pulses Village Oil Ghani 10 97 107 53 365 418 –– 742 742N.E.O. Soap 10 238 248 49 822 871 35 1,494 1,529Village Pottery 238 451 689 864 2,576 3,440 409 2,760 3,169Hand Made Paper –– 328 328 9 1,600 1,609 –– –– ––Gur Khandsari 9 568 577 46 1,543 1,589 3 837 840Leather Industry 185 435 620 244 2,181 2,425 271 2,420 2,691C. & B. Industry 27 371 398 226 4,378 4,604 72 7,328 7,400Bee-keeping 4 — 4 8 15 23 41 29 70Fibre 14 45 59 53 389 442 4 790 794Cane & Bamboo — — — — — — 12 134 146Khadi Industry –– 80 80 18 165 183 –– 1,849 1,849Cottage Match 11 140 151 78 950 1,028 4 281 285Other Village 31 186 217 9 61 70 10 118 128Industries Fruit Preservation –– –– –– 2 96 98 –– 180 180Limestone Industry — — — 16 237 253 12 839 851Aluminium — — — — — — — 348 348Village Industries — — — — — — — — —Total 580 3,095 3,675 1,735 15,781 17,516 873 21,433 22,306

438
KHADI AND VILLAGE INDUSTRIES Amount of Grants and Loans disbursed to the various Industries in Haryana by Khadi
and Village Industries Board No. 19.14 (Contd.) (Thousand `)
1990-91 1994-95 Grants Loans Total Grants Loans Total Name of the Industry
20 21 22 23 24 25 Processing of Cereals –– 1,313 1,313 –– 1,002 1,002and Pulses Village Oil Ghani –– 185 185 20 571 591N.E.O. Soap 195 3,478 3,673 33 3,394 3,427Village Pottery 36 2,389 2,425 –– 4,427 4,427Hand Made Paper — 864 864 42 563 605Gur Khandsari –– 1,706 1,706 –– 907 907Leather Industry –– 1,688 1,688 –– 1,502 1,502C & B Industry — 9,442 9,442 –– 4,536 4,536Bee-keeping 1 65 66 28 208 236Fibre –– 653 653 –– 306 306Cane & Bamboo — 548 548 4 888 892Khadi Industry –– 3,514 3,514 –– 192 192Cottage Match — 232 232 1 177 178Other Village Industries — 2,959 2,959 7 2,417 2,424Fruit Preservation — 987 987 –– 979 979Limestone Industry — 843 843 –– 974 974Aluminium — 371 371 –– 302 302Total 232 31,237 31,469 135 23,345 23,480

439
KHADI AND VILLAGE INDUSTRIES Amounts of Grants and Loans disbursed to the various Industries in Haryana by Khadi
and Village Industries Board No. 19.14 (Concld.) (Thousand `)
2000-01 2005-06 2006-07 Margin Money
Term Loan
Total Margin Money
Term Loan
Total Margin Money
Term Loan
Total Name of the Industry
26 27 28 29 30 31 32 33 34 Processing of Cereals and Pulses
1,881 6,502 8,383 12,793 46,062 58,855 14,510 68,915 83,425
Village Oil Ghani
330 208 538 2,669 9,598 12,267 3,178 11,863 15,041
N.E.O. Soap 753 11,994 12,747 2,475 7,485 9,960 2,687 8,126 10,813Village Pottery 2,863 14,757 17,620 11,798 46,790 58,588 13,108 47,188 60,296Hand Made Paper
253 4,529 4,782 3,927 11,217 15,144 3,782 8,276 12,058
Gur Khandsari 103 1,140 1,243 1,319 4,637 5,956 436 1,378 1,814Leather Industry
51 1,076 1,127 879 2,471 3,350 362 1,018 1,380
C & B Industry 2,417 31,619 34,036 29,576 89,225 1,18,801 30,118 1,22,213 1,52,331Bee-keeping — 1,485 1,485 5,960 21,450 27,410 11,456 45,824 57,280Fibre — — — 605 1,690 2,295 893 2,515 3,408Cane & Bamboo
25 2,010 2,035 476 1,714 2,190 939 4,123 5,062
Khadi Industry — — — — — — — — —Cottage Match 125 790 915 300 888 1,188 — — —Other Village 626 9,374 10,000 22,585 71,538 94,123 27,943 95,856 1,23,799Industries Fruit Preservation
311 1,965 2,276 1,640 5,902 7,542 1,411 5,145 6,556
Limestone Industry
532 6,516 7,048 6,598 18,785 25,383 11,389 41,000 52,389
Aluminium — — — — — — — — —Refund to Khadi
— — — — — — — — —
Village Industries Centres as unspent Money Total 10,270 93,965 1,04,235 1,03,600 3,39,452 4,43,052 1,22,212 4,63,440 5,85,652
Source :— Haryana Khadi and Village Industries Board, Panchkula.

440
KHADI AND VILLAGE INDUSTRIES Group-wise Margin Money released under Prime Minister employment
Generation Programme (PMEGP) by Haryana Khadi & Village Industries Board during the year 2010-11
No. 19.15 (` in lacs) Sr. No.
Name of the Industry No. of Projects
Margin Money utilization (`.)
Production (`.)
Sale (`.) Employment (No.)
Wages (`.)
1 2 3 4 5 6 7 8 1 Agro Based & Food
Processing 43 133.05 698.49 873.12 393 195.57
2 Forest Based Industry
12 22.23 116.70 145.86 70 32.67
3 Hand Made Paper & Fibre Industry
8 17.35 91.07 113.84 51 25.51
4 Mineral Based Industry
30 114.09 598.97 748.71 2049 167.67
5 Polymer & Chemical Based Industry
27 68.50 359.61 449.48 195 100.67
6 Rural Engineering and Bio-Technology Industry
70 126.72 665.26 831.53 341 186.24
7 Service Industry 65 84.05 441.23 551.53 313 123.53Total 255 565.99 2971.33 3714.07 3412 831.86

441
SECTION XX ELECTRICITY AND POWER
This section contains statistics relating to electricity in the State of Haryana. Haryana is the first State in the country to achieve 100 per cent electrification of all its 6,764 villages and 106 towns (according to 2001 Census). Uchani (Karnal) is the last of Haryana's all villages electrified on 29th November, 1970. The data have been collected from the Central Electricity Authority, Government of India and Haryana Vidyut Prasaran Nigam Limited.
Table 20.1 shows the L.T. and 11 KV. lines in Haryana.
Table 20.2 shows Consumption of electric power for different uses in Haryana.
Table 20.3 shows the number of connections using electricity for various purposes in Haryana.
Table 20.4 shows the number of pending applications for electric connections by uses.
Table 20.5 shows the number of the Tubewells energised in Haryana.
Table 20.6 indicates units sold and the per capita consumption of Electicity.
Table 20.7 gives information on installed generation capacity and Power availability in Haryana.
Tables 20.8 and 20.9 show installed plant capacity, electricity generated, utilised and number of consumers in India (Statewise) and installed plant capacity and consumption per square kilometre and per thousand of population in India (Statewise).
Table 20.10 depicts annual per capita (Statewise) consumption of electricity in India.
Table 20.11 indicates the number of villages electrified in various states.

442

443
ELECTRICITY AND POWER L.T. and 11 KV. Lines in Haryana
No. 20.1 (Circuit Kilometre)
Year /Circle L.T. Lines 11 KV. Lines Number of Transformers
1 2 3 4 1966-67 9,796 7,089 5,390
1970-71 32,056 22,819 15,236
1975-76 48,731 30,434 22,968
1980-81 66,493 35,939 31,385
1985-86 79,850 40,964 43,601
1990-91 92,831 48,602 68,883
1995-96 1,02,639 53,159 93,356
2000-01 1,05,356 55,607 1,10,855
2005-06 1,13,688 67,499 1,55,404
2009-10 1,16,411 90,981 2,67,843
2010-11 1,03,839 1,13,017 3,47,693
Hisar 11,288 8,910 36,927
Sirsa 8,112 5,806 28,673
Bhiwani 8,676 5,598 22,876
Gurgaon 6,536 8,911 13,989
Faridabad 5,328 10,035 14,904
Jind 7,022 5,902 22,470
Mahendragarh 9,448 15,674 26,668
Ambala 4,086 5,151 13,217
Karnal 11,810 7,479 58,030
Kurukshetra 5,462 7,661 28,974
Rohtak 2,547 2,632 5,669
Sonipat 4,944 5,734 13,892
Yamunanagar 6,478 7,401 18,574
Jhajjar 2,759 3,848 5,587
Panipat 3,432 5,434 12,103
Kaithal 5,911 6,841 25,140 Source :— Haryana Vidyut Prasaran Nigam Ltd.

444
ELECTRICITY AND POWER Consumption of Electricity in Haryana
No. 20.2 (Lakh KWH)
Purpose
Year Domestic Commer
cial Industrial Public
Lighting Public Water Works
Agriculture
Offices/workshops
Works etc.
Bulk Total Consumption
1 2 3 4 5 6 7 8 9 10 1966-67 293.56 191.83 2,692.73 24.59 . . 985.07 . . 155.54 4,343.32 1970-71 582.06 320.67 4,772.72 39.08 . . 2,985.72 9.67 328.79 9,038.71 1975-76 1,179.56 506.92 7,779.11 60.19 172.72 5,945.83 56.30 372.09 16,072.72 1980-81 2,271.96 729.14 12,202.01 73.81 186.04 9,537.71 64.81 491.70 25,557.18 1985-86 4,860.57 1,126.55 12,904.63 150.23 319.99 13,664.94 147.17 749.47 33,923.55 1990-91 11,375.45 1,749.03 17,451.07 234.10 838.33 27,117.77 421.61 1,326.39 60,513.75 1995-96 16,372.31 2,577.25 20,170.13 398.82 1,752.60 39,043.26 763.23 2,444.73 83,522.33 2000-01 21,537.21 4,475.45 20,813.82 314.44 2,414.25 47,559.38 504.10 3,817.51 1,01,436.16 2005-06 29,796.18 8,031.76 38,766.88 446.91 3,416.49 62,547.40 4,434.00 4,786.94 1,52,226.56 2009-10 43,237.75 16,149.51 60,535.82 723.37 5,514.91 89,983.26 5,560.20 6,378.78 2,28,083.60 2010-11 49,896.55 23,875.43 66,817.79 740.47 6,433.35 80,973.40 4,535.15 6,852.60 2,40,124.74
Source :— Haryana Vidyut Prasaran Nigam Ltd.

445
ELECTRICITY AND POWER Number of Connections in Haryana
No. 20.3 Year/Circle Domestic Commercial Industrial Public
lighting Agricultural Bulk Others Total
1 2 3 4 5 6 7 8 9 1966-67 2,23,903 57,875 9,749 184 20,190 13 . . 3,11,914 1970-71 3,61,746 78,142 17,032 278 86,455 42 . . 5,43,695 1975-76 5,14,251 1,08,748 26,950 437 1,42,685 68 . . 7,93,139 1980-81 7,98,907 1,48,716 42,883 2,073 2,26,469 125 . . 12,19,173 1985-86 12,01,272 1,88,010 54,537 5,989 2,77,327 211 . . 17,27,346 1990-91 18,41,462 2,50,645 67,973 5,726 3,47,803 333 . . 25,13,942 1995-96 23,97,663 3,11,466 76,482 4,872 3,80,181 392 . . 31,71,056 2000-01 27,63,467 3,42,569 70,710 1,374 3,67,718 734 . . 35,46,572 2005-06 31,19,788 3,87,520 70,181 1,011 4,11,454 578 10,128 40,00,660 2009-10 35,12,501 4,46,024 81,955 1,255 4,91,807 1,204 26,312 45,61,058 2010-11 36,84,410 4,62,520 85,501 1,511 5,20,391 1,369 32,220 47,87,922 Hisar 3,77,141 44,584 5,053 107 44,007 58 962 4,71,912 Sirsa 1,91,784 25,528 3,330 91 40,320 38 729 2,61,820 Bhiwani 2,17,802 20,343 2,600 86 29,003 45 1,099 2,70,978 Gurgaon 3,12,841 46,153 11,700 253 28,765 864 2,265 4,02,841 Faridabad 4,01,319 47,820 21,605 136 18,846 51 17,654 5,07,431 Jind 1,95,751 20,491 2,511 32 35,122 31 636 2,54,574 Mahendragarh 2,66,158 27,438 3,260 23 55,543 27 1,867 3,54,316 Ambala 2,60,023 45,357 5,000 184 18,564 67 1,137 3,30,332 Karnal 2,04,478 30,370 3,523 92 65,447 40 876 3,04,826 Kurukshetra 1,41,284 21,472 2,115 65 39,232 16 756 2,04,940 Rohtak 2,03,629 25,550 2,744 153 4,165 4 440 2,36,685 Sonipat 2,39,558 20,153 4,586 72 23,469 40 809 2,88,687 Jhajjar 1,51,804 11,630 2,884 84 8,066 11 451 1,74,930 Yamunanagar 2,51,783 36,297 6,221 39 37,855 45 1,263 3,33,503 Panipat 1,48,333 24,548 6,794 56 28,926 24 633 2,09,314 Kaithal 1,20,722 14,786 1,575 38 43,061 8 643 1,80,833
Source :— Haryana Vidyut Prasaran Nigam Ltd.
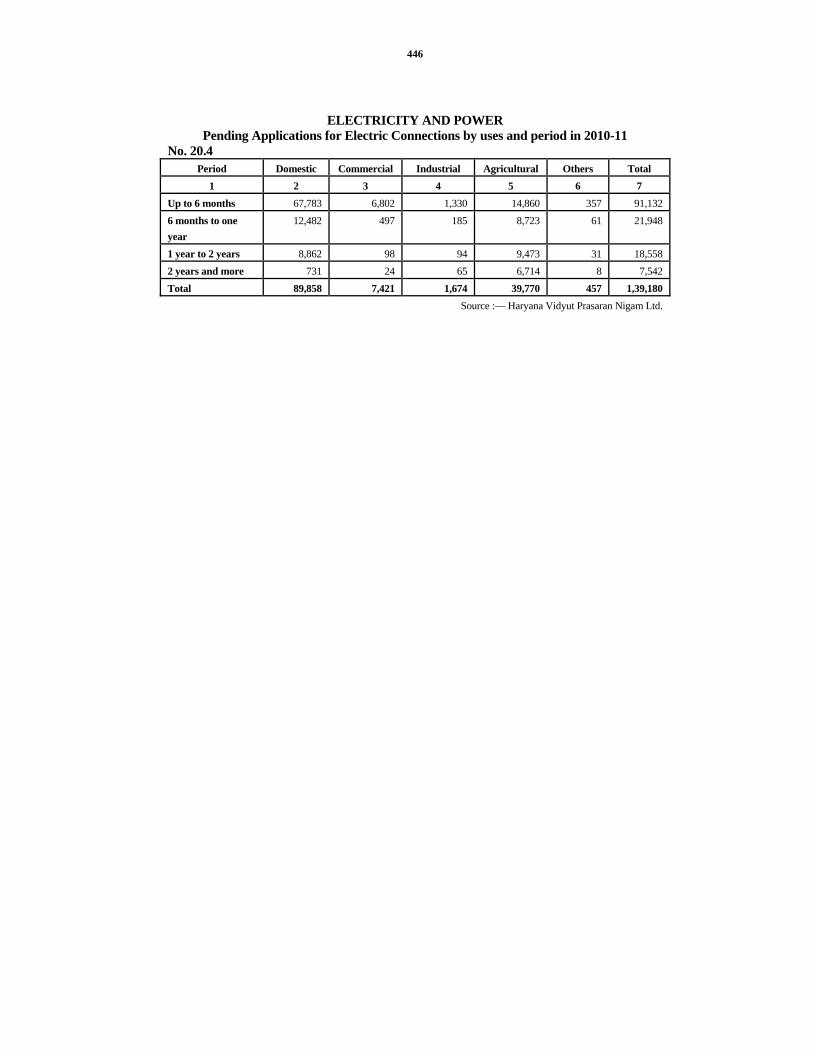
446
ELECTRICITY AND POWER Pending Applications for Electric Connections by uses and period in 2010-11
No. 20.4 Period Domestic Commercial Industrial Agricultural Others Total
1 2 3 4 5 6 7 Up to 6 months 67,783 6,802 1,330 14,860 357 91,132 6 months to one year
12,482 497 185 8,723 61 21,948
1 year to 2 years 8,862 98 94 9,473 31 18,558 2 years and more 731 24 65 6,714 8 7,542 Total 89,858 7,421 1,674 39,770 457 1,39,180
Source :— Haryana Vidyut Prasaran Nigam Ltd.

447
ELECTRICITY AND POWER Number of Energised Tubewells in Haryana
No. 20.5 (Up to end of the year)
Year/Circle Agricultural Private
Agricultural Government
Agricultural Lift Public Water Supply and Sewerage Tubewells
Total
1 2 3 4 5 6 1980-81 2,22,674 2,636 151 1,008 2,26,4691985-86 2,72,282 3,095 158 1,792 2,77,3271990-91 3,41,729 2,910 154 3,010 3,47,8031995-96 3,74,349 1,353 232 4,247 3,80,1812000-01 3,60,488 753 211 6,264 3,67,7162005-06 4,11,452 45 134 9,856 4,21,4872008-09 4,66,393 48 96 14,014 4,80,5512009-10 4,91,807 44 90 15,374 5,07,315Hisar 40,378 — — 900 41,278Sirsa 36,229 — — 704 36,933Bhiwani 27,570 — — 896 28,466Gurgaon 28,904 — — 2,329 31,233Faridabad 18,525 — — 1,853 20,378Jind 29,615 — 25 550 30,190Mahendragarh 54,847 — — 1,802 56,649Ambala 18,024 44 13 1,027 19,108Karnal 63,733 — — 816 64,549Kurukshetra 38,146 — 3 700 38,849Rohtak 3,172 — 19 310 3,501Sonipat 21,236 — 11 739 21,986Jhajjar 7,684 — 19 381 8,084Yamunanagar 35,750 — — 1,180 36,930Panipat 27,784 — — 596 28,380Kaithal 40,210 — — 591 40,801
Source :— Haryana Vidyut Prasaran Nigam Ltd.

448
ELECTRICITY AND POWER Units sold and per capita consumption of Electricity
No. 20.6 Year Units sold* (lakh K.W.H.) Units sold per capita (K.W.H.)
1 2 3 1966-67 4,343.32 48
1970-71 9,038.71 92
1975-76 16,072.72 147
1980-81 25,557.18 206
1985-86 33,923.55 234
1990-91 60,513.75 371
1995-96 83,522.33 454
2000-01 1,01,436.16 507
2005-06 1,52,226.56 660
2008-09 1,92,902.91 784
2009-10 2,28,083.60 905
2010-11 2,40,124.74 . . Source :— Haryana Vidyut Prasaran Nigam Ltd.
* Including units used on works and excluding generation by non-utilities.2010
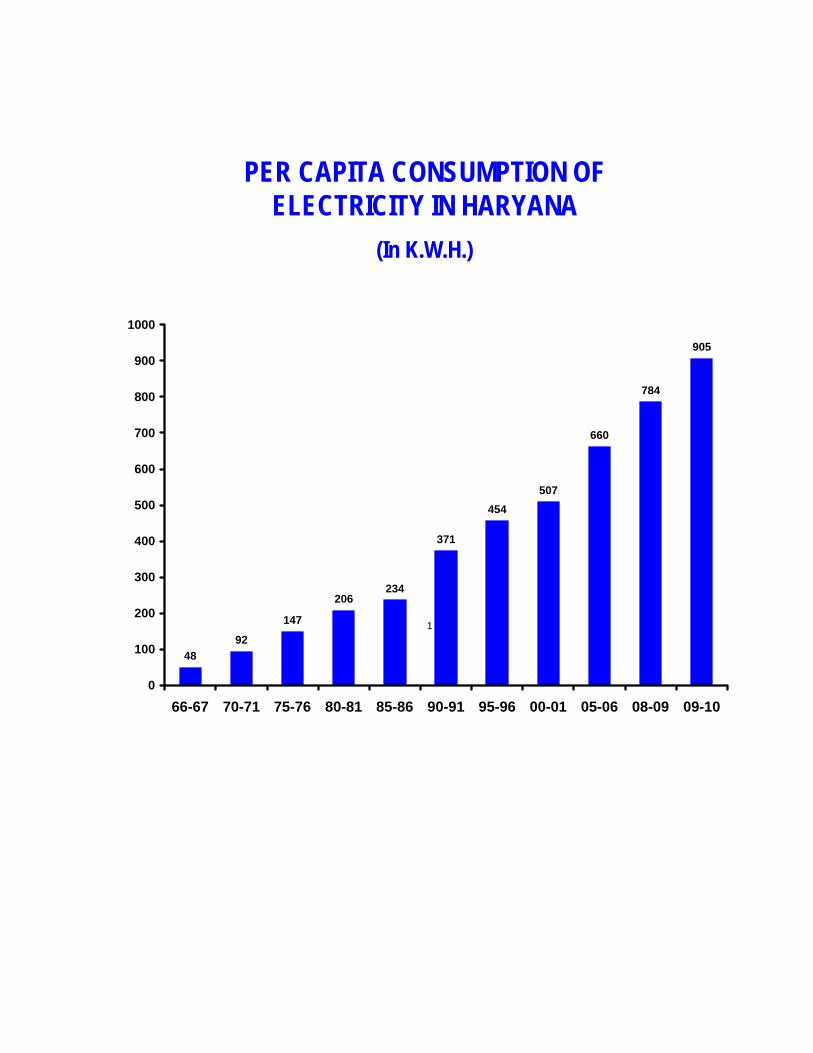
PER CAPITA CONSUMPTION OF ELECTRICITY IN HARYANA
(In K.W.H.)
4892
147
206234
371
454507
660
784
905
0
100
200
300
400
500
600
700
800
900
1000
66-67 70-71 75-76 80-81 85-86 90-91 95-96 00-01 05-06 08-09 09-10
1

POWER AVAILABILITY IN HARYANA (In Million K.W.H.)
2722
4
2646
6
2324
4
1685
5
1273
8
9025
5156
4184
2825
1246
601
0
5000
10000
15000
20000
25000
30000
66-67 70-71 75-76 80-81 85-86 90-91 95-96 00-01 05-06 07-08 08-09

449
INSTALLED GENERATION CAPACITY AND POWER AVAILABILITY IN HARYANA

450
ELECTRICITY AND POWER Installed Generation Capacity and Power
Availability in Haryana No. 20.7
Power Availability (in million K.W.H.) Installed Generation Capacity* (in M.W.)
Generation Year Hydel Thermal Internal
combustion plant
Total Hydel Thermal Total
1 2 3 4 5 6 7 8 1967-68 — 24.20 5.22 29.42 — 21.00 21.00 1968-69 — 24.20 5.22 29.42 — 11.00 11.00 1969-70 — 24.20 5.22 29.42 964.00 85.00 1049.00 1970-71 — 24.20 5.22 29.42 912.00 298.00 1210.00 1975-76 403.30 144.30 4.19 551.79 2001.00 681.00 2682.00 1980-81 654.00 417.50 2.50 1074.00 2967.00 1302.00 4269.00 1985-86 831.00 587.50 3.92 1422.42 3142.00 1634.00 4776.00 1990-91 879.00 877.50 — 1756.50 4093.00 2645.00 6738.00 1991-92 879.00 877.50 — 1756.50 3996.00 3606.00 7602.00 1992-93 879.00 877.50 — 1756.50 3927.00 3890.00 7817.00 1993-94 879.00 877.50 — 1756.50 3386.00 3154.00 6540.00 1994-95 884.00 877.50 — 1761.50 3732.00 3434.00 7166.00 1995-96 884.00 877.50 — 1761.50 3675.00 3342.00 7017.00 1996-97 884.00 877.50 — 1761.50 3828.00 3641.00 7469.00 1997-98 902.00 877.50 — 1779.50 3297.06 3826.22 7123.28 1998-99 902.00 877.50 — 1779.50 4267.92 3576.14 7844.06 2000-01 902.00 877.50 — 1779.50 3227.13 3766.27 6993.40 2005-06 937.40 1525.00 — 2462.40 3530.53 8923.00 12,453.53 2007-08 937.40 1525.00 — 2462.40 3294.27 10575.08 13869.35 2008-09(P) 937.40 2070.00 — 3007.40 3421.36 13236.58 16657.94 * Excluding the share of Haryana from Central Sector Generating Stations of NHPC, NTPC and others i.e.
MARUTI, MAGNUM, NAPP, RAPP etc.

451
ELECTRICITY AND POWER Installed Generation Capacity and Power
Availability in Haryana No. 20.7(Concld.)
Power Availability (in Million K.W.H.) Year Auxiliary
consumption Power
Purchased Power available for
sale (8+10–9)
Power sold@ in Million K.W.H.)
Transmission and distribution
losses (in Million K.W.H.)
(11-12) 1 9 10 11 12 13
1967-68 3.00 583.00 601.00 501.00 100.001968-69 1.00 908.00 918.00 662.00 256.001969-70 2.00 24.00 1071.00 799.00 272.001970-71 8.00 44.00 1246.00 903.00 343.001975-76 63.00 206.00 2825.00 2354.00 471.001980-81 205.00 120.00 4184.00 3391.00 793.001985-86 216.00 596.00 5156.00 4256.00 900.001990-91 327.00 2614.00 9025.00 6641.00 2384.001991-92 385.00 3336.00 10553.00 7741.00 2812.001992-93 417.00 4158.00 11558.00 8625.00 2933.001993-94 357.00 4985.00 11168.00 8316.00 2852.001994-95 377.00 4683.00 11472.00 8203.00 3269.001995-96 391.00 6112.00 12738.00 8745.00 3993.001996-97 456.00 6250.00 13263.00 9058.00 4205.001997-98 464.07 6643.85 13303.06 8864.44 4438.621998-99 429.53 6621.02 14035.55 9289.91 4745.642000-01 . . 9862.00 16855.40 15423.12 1432.282005-06 796.85 11587.64 23244.32 22239.47 1004.852007-08 1050.99 13647.24 26465.60 18278.60 8187.002008-09(P) 1280.96 11847.12 27224.10 19290.29 7933.81P—Provisional Source :— Haryana Vidyut Prasaran Nigam Ltd. @—Including power sold to other States/other Agencies also.

452
ELECTRICITY AND POWER Installed Plant Capacity, Electricity Generated and Utilised in India for the
Year 2008-09 (Statewise) No. 20.8
Name of the State/Union Territory
Installed Plant Capacity (M.W.)@
Generated Gross (Million KWH)@
Sales to ultimate consumers in the State excluding inter-State Sales
(Million kwh)
Number of consumers
1 2 3 4 5 A. Utilities Andhra Pradesh 9,224 42,439 54,241 266,38,110 Assam 471 1,859 2,798 10,87,976 Bihar 590 499 4,984 29,63,218 Chhatisgarh 3,074 20,564 12,021 28,21,917 Gujarat 9,273 46,834 45,968 1,29,82,822 Haryana 3,099 17,531 19,291 43,12,813 Himachal Pradesh 965 4,065 5,461 18,60,987 Jharkhand 1,754 5,672 12,583 15,59,643 Jammu and Kashmir 1,076 2,230 4,031 12,07,330 Kerala 2,306 7,576 12,189 94,09,853 Madhya Pradesh 4,774 19,744 21,678 1,58,22,869 Maharashtra 15,284 69,904 72,804 1,46,73,329 Karnataka 8,096 32,884 36,040 2,12,33,059 Nagaland 31 97 193 1,83,881 Orissa 2,520 9,142 11,733 32,01,894 Punjab 5,111 27,711 29,225 60,62,624 Rajasthan 4,703 26,405 26,642 82,02,867 Tamilnadu 11,132 43,872 53,553 1,97,32,364 Tripura 148 662 451 3,99,609 Uttrakhand 1,762 6,828 4,736 12,30,831 Uttar Pradesh 5,047 25,191 39,637 1,64,85,714 West Bengal 6,890 29,414 27,779 98,09,860 Manipur 51 19 197 1,83,656

453
ELECTRICITY AND POWER Installed Plant Capacity, Electricity Generated and Utilised in India for the
Year 2008-09 (Statewise) No. 20.8 (Concld.)
Name of the State/Union Territory
Installed Plant Capacity (M.W.)@
Generated Gross (Million KWH)@
Sales to ultimate consumers in the State excluding inter-State Sales (Million kwh)
Number of consumers
1 2 3 4 5 Meghalaya 189 616 946 2,62,647 Sikkim 46 139 277 78,354 Arunachal Pradesh 61 175 271 1,82,698 Goa 78 418 2,617 5,24,332 Mizoram 69 61 166 1,59,905 D.V.C. 3,334 15,753 — — Central Govt. Projects
45,777 2,77,160 — —
Delhi 920 5,195 17,465 38,28,331 Chandigarh — — 1,143 2,16,790 Daman & Diu — — 1,325 4,21,975 Dadra Nagar Haveli — — 3,070 53,536 Lakshdweep 11 32 1,865 3,43,073 Pondichery 33 258 24 21,765 Andaman & Nicobar Islands
66 218 160 84,233
Total India (Utilities) 1,47,965 7,41,167 5,27,564 18,82,44,865 Source :—Central Electricity Authority, New Delhi.
@ Installed capacity of jointly owned projects have shown divided between the partner States as per their theoritical share.
R — Figures have been repeated due to non furnishing of information by the department.

454
ELECTRICITY AND POWER Statewise Installed Plant Capacity and Energy Consumed per Square Kilometre and per
Thousand of population during 2008-09 in India (For utilities + non utilities)
No. 20.9 Installed Capacity@ Energy Consumed
Name of the State/Union Territories
Per 1,000 Population* (K.W.)
Per square Kilometre (K.W.)
Per 1,000 Population*
(K.W.H.)
Per square Kilometre (K.W.H.)
1 2 3 4 5
Andhra Pradesh 111.32 33.54 7,11,306 2,14,276
Assam 15.89 6.01 1,30,741 49,436
Bihar 6.25 6.27 54,532 54,712
Chattisgarh 130.98 22.74 10,01,081 1,73,795
Gujarat 162.37 47.31 11,34,299 3,30,459
Haryana 126.92 70.11 8,33,488 4,60,389
Himachal Pradesh 145.53 17.33 8,35,490 99,502
Jharkhand 57.62 22.01 5,30,587 2,02,623
Jammu and Kashmir 94.78 4.84 3,55,436 18,152
Kerala 67.90 59.34 3,72,821 3,25,811
Madhya Pradesh 68.76 15.49 3,59,935 81,072
Maharashtra 140.34 49.67 7,02,313 2,48,567
Manipur 21.37 2.28 82,824 8,828
Karnataka 139.75 42.21 6,81,130 2,05,735
Nagaland 14.00 1.85 88,114 11,639
Orissa 63.20 16.19 4,94,268 1,26,590
Punjab 189.87 101.50 11,16,283 5,96,711
Rajasthan 72.13 13.74 5,03,303 95,884
Tamilnadu 167.67 85.59 8,88,867 4,53,728
Tripura 42.27 14.14 1,28,444 42,978
Uttrakhand 183.55 32.95 5,32,739 95,630
Uttar Pradesh 26.24 20.95 2,51,737 2,00,946
West Bengal 78.74 77.64 3,39,481 3,34,738

455
ELECTRICITY AND POWER Statewise Installed Plant Capacity and Energy Consumed per Square Kilometre and per
Thousand of population during 2008-09 in India (For utilities + non utilities)
No. 20.9 (Concld.) Installed Capacity@ Energy Consumed
Name of the State/Union Territories
Per 1,000 Population*
(K.W.)
Per square Kilometre (K.W.)
Per 1,000 Population*
(K.W.H.)
Per square Kilometre (K.W.H.)
1 2 3 4 5
Meghalaya 74.15 8.43 4,04,016 45,931
Sikkim 78.15 6.49 4,70,017 39,058
Arunachal Pradesh 50.95 0.73 2,26,225 3,242
Goa 47.88 21.09 16,62,288 7,32,305
Mizoram 70.74 3.29 1,68,878 7,851
Delhi 53.42 621.89 10,13,696 1,18,01,336
Chandigarh — — 9,05,425 1,04,53,545
Daman & Diu — — 55,25,083 1,20,54,727
Dadra Nagar Haveli — — 99,34,871 62,85,327
Lakshdweep 464.57 1084.00 3,35,714 7,83,333
Pondicherry 8.65 22.35 16,51,589 42,66,604
Andaman & Nicobar Island
142.17 7.93 3,48,870 19,452
All India 85.64 30.07 5,29,575 1,85,958
Source :—Central Electricity Authority, New Delhi.
@ Installed capacity of jointly owned projects have been shown divided between the partner states as per their the oritical share.
* Installed capacity per 1000 population have been worked out on the basis of mid financial year estimates of population.

456
PER CAPITA ANNUAL CONSUMPTION OF ELECTRICITY IN INDIA (STATEWISE)

457
ELECTRICITY AND POWER Annual per capita consumption of Electricity in India during the year
2008-09 (Statewise) No. 20.10 (In KWH)
Name of the State/Union Territory
Domestic Commercial Industrial power Public lighting
1 2 3 4 5 Andhra Pradesh 140.90 46.88 211.36 19.54 Assam 36.21 13.03 31.13 0.23 Bihar 18.72 4.38 15.14 0.24 Chattisgarh 93.02 17.33 238.86 2.54 Delhi 452.29 327.26 154.70 16.84 Gujarat 136.75 62.54 365.83 4.19 Haryana 154.47 50.62 222.74 2.24 Himachal Pradesh 164.27 41.43 513.82 1.96 Jammu and Kashmir 123.27 18.80 — 1.01 Jharkhand 53.21 9.06 311.98 2.93 Kerala 175.27 61.99 98.72 8.67 Madhya Pradesh 72.99 17.72 78.21 2.82 Maharashtra 155.60 83.68 265.32 7.18 Manipur 50.47 5.97 3.64 1.34 Karnataka 115.59 100.31 156.55 10.64 Nagaland 66.21 4.09 6.35 2.22 Orissa 73.89 20.24 166.84 1.35 Punjab 239.92 70.47 387.74 5.02 Rajasthan 76.92 25.03 120.53 3.00 Tamilnadu 203.37 96.11 320.37 6.87 Tripura 68.90 11.69 8.83 3.82 Uttarakhand 121.14 74.21 238.30 4.71 Uttar Pradesh 82.63 15.38 61.69 3.01 West Bengal 87.20 0.54 1.12 2.84 Meghalaya 88.90 16.90 207.28 0.58 Sikkim 108.03 79.61 165.73 3.31 Arunachal Pradesh 80.83 24.17 37.50 14.17 Goa 384.37 101.88 994.37 22.26 Damman & Diu 235.38 112.42 5,107.30 18.04 Mizoram 113.60 12.07 1.64 4.20 Chandigarh 331.27 295.39 196.28 10.69 Dadra Nagar Haveli 163.38 448.62 9,206.06 23.80 Lakshdweep 226.86 86.43 3.86 18.57 Pondicherry 285.27 95.82 1,032.91 11.74 Andman Nikobar Islands 164.11 89.65 16.67 18.74 All India 112.67 46.39 169.73 5.32 Note :—Total may not tally on account of rounding off.

458
ELECTRICITY AND POWER
Annual per capita consumption of Electricity in India during the year 2008-09 (Statewise)
No. 20.10 (In KWH) Name of the
State/Union Territory Traction Agriculture Public water works &
sewage pumping Miscellaneous Utilities
Total 1 6 7 8 9 10
Andhra Pradesh 17.07 200.39 9.77 8.71 654.62Assam — 0.70 1.32 11.70 94.32Bihar 4.23 8.45 1.59 — 52.75Chattisgarh 30.30 87.34 4.54 38.27 512.20Delhi 16.52 3.06 10.90 32.10 1,013.67Gujarat 10.92 205.39 18.64 0.64 804.90Haryana 18.40 301.61 19.13 20.78 789.99Himachal Pradesh — 4.33 55.51 42.28 823.60Jammu and Kashmir — 23.91 40.55 63.89 271.43Jharkhand 31.69 2.29 2.22 — 413.38Kerala 4.19 6.92 2.08 1.09 358.93Madhya Pradesh 20.78 89.55 8.15 22.01 312.23Maharashtra 19.37 119.97 16.39 0.97 668.48Manipur — 0.05 4.01 17.33 82.81Karnataka 1.41 195.31 27.22 15.10 622.13Nagaland — 0.02 0.92 8.31 88.12Orissa 15.67 3.55 3.78 8.89 294.21Punjab 4.58 346.41 12.18 19.28 1,085.60Rajasthan 4.64 150.17 18.99 9.34 408.62Tamilnadu 7.81 158.59 13.51 — 806.63Tripura — 9.51 10.05 0.26 113.06Uttarakhand 0.99 31.27 22.64 0.09 493.35Uttar Pradesh 3.19 35.67 4.33 0.21 206.11West Bengal 11.34 9.64 6.10 18.39 137.17Meghalaya — 0.20 11.66 45.28 370.80 Sikkim — — — 113.34 470.02 Arunachal Pradesh — — 10.00 — 166.67 Goa — 24.65 77.98 — 1,605.51 Damman & Diu — 10.29 4.38 34.50 5,522.31 Mizoram — — 25.77 11.59 168.87 Chandigarh — 1.06 — 65.54 900.23 Dadra Nagar Haveli — 29.68 31.68 — 9,903.22 Lakshdweep — — — — 335.72 Pondicherry — 59.25 19.03 — 1,504.02 Andman Nikobar Islands
— 1.52 — 58.17 348.86
All India 10.23 93.37 10.56 8.77 457.04 Source :—Central Electricity Authority, New Delhi.

459
ELECTRICITY AND POWER Number of Villages Electrified in Various States as on 31st March, 2009
(2001 Census) No. 20.11
Name of the State Total No. of villages
No. of Villages electrified
Percentage of electrified village
1 2 3 4 Andhra Pradesh 26,613 26,613 100.0 Arunachal Pradesh 3,863 2,195 56.8 Assam 25,124 19,741 78.6 Bihar 39,015 23,914 61.3 Chhatisgarh 19,744 18,877 95.6 Delhi 158 158 100.0 Goa 347 347 100.0 Gujarat 18,066 18,015 99.7 Haryana 6,764 6,764 100.0 Himachal Pradesh 17,495 17,183 98.2 Jharkhand 29,354 9,119 31.1 Jammu and Kashmir 6,417 6,304 98.2 Karnataka 27,481 27,458 99.9 Kerala 1,364 1,364 100.0 Madhya Pradesh 52,117 50,226 96.4 Maharashtra 41,095 36,296 88.3 Manipur 2,315 1,986 85.8 Meghalaya 5,782 3,428 59.3 Mizoram 707 570 80.6 Nagaland 1,278 823 64.4 Orissa 47,529 29,735 62.6 Punjab 12,278 12,278 100.0 Rajasthan 39,753 27,506 69.2 Sikkim 450 425 94.4 Tamilnadu 15,400 15,400 100.0 Tripura 858 491 57.2 Uttarakhand 15,761 15,213 96.5 Uttar Pradesh 97,942 86,450 88.3 West Bengal 37,945 36,934 97.3 Chandigarh 23 23 100.0 Daman & Div 23 23 100.0 Dadra & Nagar Haveli 70 70 100.0 Pondicherry 92 92 100.0 Lakshdweep 8 8 100.0 Andaman & Nicobar Island 501 336 67.1 Total All India 5,93,732 4,96,365 83.6
Source :— Central Electricity Authority, New Delhi.

461
SECTION XXI TRANSPORT STATISTICS
This section contains information relating to road transport, development of roads and the railways. The information of road transport has been collected from the State Transport Controller, Haryana, Police (C.I.D.), Haryana, Engineer-in-Chief, Public Works Department, Building and Roads, Haryana, Ministry of Surface Transport (Transport Research Division), Government of India and Northern Railway, New Delhi.
The Railway system in India is divided into various zones which are further sub-divided into Divisions. The Divisions are not co-terminus with the State territories. On the re-organisation of the Punjab State, about 1,220 kilometres of rail length came to the share of Haryana State as against the total rail length of 3,312 kilometres in the erstwhile Punjab State. The railway administration prepares the railway statistics divisionwise and not stationwise or sectionwise. They have, therefore, shown their inability to supply the sectionwise data on goods booked and number of passengers originating and earnings accruing therefrom, sectionwise. In this section, the data have, therefore, been presented for Delhi, Ambala and Ferozepur divisions as a whole. This data will not thus provide a clear idea about the working of railways in Haryana.
Table 21.1 shows the districtwise number of different types of vehicles registered in Haryana.
Table 21.2 shows the districtwise number of different types of vehicles on road in Haryana State for different years.
Table 21.3 shows districtwise road accidents in Haryana for different years.
Table 21.4 shows the districtwise number of Professional and Non-Professional driving licences in Haryana for different years.
Table 21.5 presents the depotwise data relating to Commercial Wing of Haryana Roadways.
Table 21.6 reflects comparative position in respect of number of various types of vehicles on road in the different States of India.
Table 21.7 shows the number of Motor vehicles per 100 sp. km. of area and per lakh of population in different States of India.
Table 21.8 gives metalled and unmetalled road length maintained by Public Works Department in Haryana.
Table Nos. 21.9 and 21.10 furnish districtwise information by types of road length maintained by Public Works Department and Local Bodies in Haryana.
Table 21.11 shows the length of surfaced roads in Haryana.
Table Nos. 21.12 and 21.13 give number and percentage of villages connected with metalled roads in Haryana.

462
Table Nos. 21.14 and 21.15 provide Statewise information in respect of total length of different Highways and surfaced roads in India respectively.
Table 21.16 shows road length per 100 square Kilometres of area and per lakh of population.
Table 21.17 includes Route Kilometres of the Railways. In calculating route Kilometres, double or triple lines are counted only once.
Table 21.18 gives number of wagons loaded with important commodities on broad gauge.

463
TRANSPORT STATISTICS Number of different Types of Motor Vehicles registered in Haryana (Districtwise)
No. 21.1
Year/District
Cars Jeeps Trucks Taxies Tractors Buses Motor Cycles/rick-
Scooters/Auto cycles
Auto-rickshaws
Miscellaneous
Total
1 2 3 4 5 6 7 8 9 10 11 1966* 206 122 309 2 661 156 971 93 44 2,564 1970-71 544 338 1,120 7 2,708 208 2,569 270 23 7,787 1975-76 487 185 1,003 13 3,419 199 4,559 112 1,139 11,116 1980-81 440 302 2,206 15 8,650 227 10,037 171 2,868 24,916 1985-86 2,028 579 1,500 — 15,580 327 21,141 1,112 3,804 46,071 1990-91 3,635 1,244 5,212 — 15,153 48 52,728 1,832 3,628 83,480 1995-96 8,866 3,955 7,548 114 16,705 699 73,687 1,376 8,412 1,21,362 2000-01 28,324 7,289 11,304 2,689 20,989 1,022 1,26,173 2,315 7,008 2,07,113 2005-06 61,593 3,227 10,711 1,004 16,720 3,191 2,29,739 5,468 13,965 3,45,618 2008-09 80,698 4,944 13,101 1,423 21,510 4,744 2,68,819 8,574 10,426 4,23,238 2009-10 96,669 4,493 12,288 1,115 25,970 3,533 2,99,458 10,028 14,701 4,68,255 2010-11 1,22,244 4,894 17,700 4,686 25,797 2,888 3,44,788 10,353 22,544 5,55,894 Ambala 5,658 18 — 48 818 102 21,614 460 368 29,086 Panchkula 5,185 52 802 238 301 33 10,147 537 240 17,535 Yamunanagar 3,242 — 631 31 1,059 116 17,235 367 353 23,034 Kurukshetra 3,375 8 136 32 965 124 15,689 252 407 20,988 Kaithal 2,169 — 172 5 1,231 135 13,247 232 313 17,504 Karnal 5,400 84 551 133 1,450 129 22,158 446 2,461 32,812 Panipat 3,088 240 289 114 2,554 152 16,500 299 523 23,759 Sonipat 4,844 270 747 122 2,023 68 18,564 601 710 27,949 Rohtak 3,886 27 520 — 1,178 — 14,892 746 575 21,824 Jhajjar 3,244 24 1,036 136 1,712 109 11,768 294 489 18,812 Faridabad 21,865 — 3,272 225 600 196 39,530 1,633 1,313 68,634 Palwal 2,263 95 302 101 944 120 12,384 504 215 16,928 Gurgaon 36,989 2,514 5,877 2,577 1,111 797 34,905 1,837 9,552 96,159 Mewat 1,119 — 1,094 65 656 62 8,487 — 1,263 12,746 Rewari 3,049 — 454 163 1,339 137 19,257 245 555 25,199 Mahendragarh 1,202 523 241 490 997 124 11,609 156 386 15,728 Bhiwani 3,081 530 735 52 2,302 99 15,537 577 912 23,825 Jind 2,335 66 309 29 1,038 79 12,098 455 422 16,831 Hisar 776 55 278 107 559 90 5,132 531 816 8,344 Fatehabad 1,809 254 119 17 1,344 51 9,864 71 353 13,882 Sirsa 2,805 134 135 1 1,616 165 14,171 110 318 19,455 Transport Commissioner Office
4,860 — — — — — — — — 4,860
Source :—State Transport Commissioner, Haryana. * Information relates to calender year.

464
TRANSPORT STATISTICS Number of different Types of Motor Vehicles on Road in Haryana
No. 21.2
Year/District
Auto- Cycles/ Motorcycles/
scooters
Auto-rick
shaws
Jeeps Private motor cars
Taxies Others public service vehicles
Goods vehicles
Tractors Miscella neous
Total
1 2 3 4 5 6 7 8 9 10 11 1966* 2,863 831 524 1,344 212 948 3,304 4,015 224 14,265 1970-71 7,964 981 1,028 2,210 38 1,220 5,735 9,399 157 28,732 1975-76 18,376 275 1,917 4,693 145 2,268 9,046 13,377 1,428 51,525 1980-81 48,814 527 2,317 5,890 228 3,760 13,667 35,160 12,419 1,22,782 1985-86 1,22,496 2,224 3,578 8,566 386 4,978 25,238 70,398 610 2,38,474 1990-91 3,10,184 6,562 8,383 21,600 271 9,829 41,671 1,11,390 23,076 5,32,966 1995-96 6,13,117 12,180 26,125 63,038 500 9,732 67,084 2,05,864 67,507 10,65,147 2000-01 11,01,101 26,396 79,888 1,90,909 4,775 8,168 1,39,342 3,41,202 31,323 19,23,104 2005-06 18,81,174 45,858 95,450 3,73,659 16,344 19,986 2,50,540 3,82,581 21,434 30,87,026 2008-09 24,63,672 64,111 1,08,885 5,41,380 13,876 26,922 3,11,550 4,30,365 13,030 39,73,791 2009-10 37,86,795 83,745 1,15,852 7,20,441 15,081 33,520 3,52,532 4,90,828 4,408 56,03,202 2010-11 33,70,426 94,770 1,13,384 8,55,596 19,978 35,646 3,89,546 4,87,321 10,336 53,77,003 Ambala 2,17,354 6,420 8,486 52,962 689 1,328 34,063 15,115 231 3,36,648 Panchkula 1,08,399 3,489 3,994 41,912 861 1,236 7,167 4,028 — 1,71,086 Yamunanagar 1,88,440 2,732 — 36,663 394 702 11,014 11,371 3 2,51,319 Kurukshetra 1,45,168 2,520 2,371 25,623 136 794 2,959 34,508 149 2,14,228 Kaithal 1,12,394 1,123 3,972 11,643 45 864 1,944 29,613 360 1,61,958 Karnal 2,88,822 7,106 4,578 36,738 362 1,019 13,217 51,954 7,070 4,10,866 Panipat 1,50,212 4,457 5,776 44,575 368 797 5,333 26,431 — 2,37,949 Sonipat 1,89,560 3,648 270 38,265 618 515 8,288 12,035 5 2,53,204 Rohtak 1,29,580 9,780 9,503 21,733 1,333 1,544 26,569 23,926 — 2,23,968 Jhajjar 78,406 4,262 2,385 13,368 770 432 18,655 39,174 — 1,57,452 Faridabad 4, 27,360 19,362 1,644 1,60,613 6,790 3,693 1,31,661 4,616 229 7,55,968 Palwal 23,765 504 215 3,634 92 120 517 2,120 — 30,967 Gurgaon 3,25,282 17,084 25,445 2,06,122 3,761 16,196 73,862 16,499 235 6,84,486 Mewat 53,161 1,409 95 4,152 101 285 5,366 7,134 23 71,726 Rewari 1,42,996 1,720 1,368 13,529 829 1,428 16,782 10,024 260 1,88,936 Mahendragarh 1,02,907 354 2,844 10,654 1,510 434 3,412 15,001 6 1,37,122 Bhiwani 1,08,245 1,832 7,041 19,761 185 602 5,502 30,986 1,470 1,75,624 Jind 1,09,424 2,761 2,297 13,365 803 771 5,487 37,767 — 1,72,675 Hisar 2,20,039 3,100 12,648 19,841 230 1,562 12,060 41,539 — 3,11,019 Fatehabad 90,169 703 4,140 9,978 64 347 3,052 31,061 295 1,39,809 Sirsa 1,54,149 404 14,312 24,608 37 977 2,636 42,419 — 2,39,542 Transport Commissioner Office
4,594 — — 45,857 — — — — — 50,451
Source :—State Transport Commissioner, Haryana. * Information relates to calender year.
TRANSPORT STATISTICS Road Accidents in Haryana
No. 21.3 (As on 31st December)

465
Year/District No. of accidents Vehicles involved Persons killed Persons injured 1 2 3 4 5
1966 335 339 140 2411970 660 723 257 5491975 759 934 354 8271980 1,552 1,581 594 1,6491985 2,676 2,909 968 3,3211990 4,707 5,309 2,118 5,4481995 6,677 7,021 2,574 6,8082000 8,392 9,192 2,974 8,5622005 9,520 10,198 3,419 8,9752008 11,231 13,225 4,522 10,2012009 11,258 14,245 4,617 10,3322010 10,934 12,301 4,724 9,891Ambala 545 545 244 383Panchkula 269 306 133 173Yamunanagar 385 385 153 286Kurukshetra 594 594 255 576Kaithal 308 491 119 293Karnal 601 601 284 522Panipat 503 504 283 432Sonipat 743 743 351 736Rohtak 493 764 217 528Jhajjar 455 898 244 411Faridabad 682 682 235 545Palwal 498 689 247 457Gurgaon 1141 1141 441 856Mewat 393 473 136 400Rewari 676 676 267 809Mahendragarh 475 475 144 590Bhiwani 577 577 222 529Jind 425 425 227 358Hisar 572 572 258 497Fatehabad 226 386 117 226Sirsa 292 293 130 284G.R.P. 81 81 17 --
Source :—Deputy Inspector General of Police (C.I.D.), Haryana.

466
TRANSPORT STATISTICS
Number of Driving Licences in Haryana (Districtwise) No. 21.4
Professional Non-professional Year/District
Issued Renewed Total Issued Renewed Total 1 2 3 4 5 6 7
1966-67 2,367 3,792 6,159 776 318 1,0941970-71 8,922 9,322 18,244* . . . . . .1975-76 2,865 8,924 11,789 10,944 13,286 24,2301980-81 7,005 12,800 19,805 21,931 19,476 41,4071985-86 7,421 14,986 22,407 43,139 36,630 79,7691990-91 16,987 41,778 58,765 33,907 91,622 1,25,5291995-96 20,256 27,222 47,478 93,589 67,981 1,61,5701999-00 3,188 11,637 14,825 2,15,879 1,00,071 3,15,9502000-01 4,614 18,346 22,960 2,08,111 93,559 3,01,670Ambala — — — 7,506 6,587 14,093Panchkula — — — 8,134 2,149 10,283 Yamunanagar — — — 14,973 6,838 21,811Kurukshetra — — — 9,207 3,300 12,507Kaithal — — — 4,055 3,016 7,071Karnal — — — 10,238 3,275 13,513Panipat — — — 8,459 3,562 12,021Sonipat — — — 18,457 1,290 19,747Rohtak — — — 8,795 3,700 12,495Jhajjar — — — 8,751 2,650 11,401Faridabad — — — 30,264 6,811 37,075Gurgaon — — — 21,980 10,222 32,202Rewari — — — 2,561 1,307 3,868Mahendragarh — — — 4,160 5,652 9,812Bhiwani — — — 11,192 6,422 17,614Jind — — — 5,737 6,192 11,929Hisar — — — 15,172 8,417 23,589Fatehabad — — — 2,962 4,965 7,927Sirsa — — — 15,508 7,204 22,712Regional Transport Authority
4,614 18,346 22,960 — — —
Source :—State Transport Commissioner, Haryana. Note :—Learner Licences have not been included. *Non-professional Licences have also been included.

467
PROGRESS-OF HARYANA-ROADWAYS (COMMERCIAL WING)

468
TRANSPORT STATISTICS Progress of Haryana Roadways (Commercial Wing) during 2010-11(P)
No. 21.5
Description Haryana
Roadways Faridabad
Haryana Roadways Ambala
Haryana Roadways Gurgaon
Haryana Roadways
Chandigarh
Haryana Roadways
Rohtak 1 2 3 4 5 6
(A) Physical Performances:— 1. Total Fleet 223 195 186 196 1762. Total Kilometrage (Lakhs) 216.19 242.30 182.17 275.68 185.133. Effective Kilometrage (Lakhs) 213.80 237.76 178.59 262.66 182.014. Kilometre per litre (On Gross) 4.52 4.94 4.83 4.41 4.705. Break downs 199 160 243 141 2726. Break downs per 10,000 Kilometres 0.09 0.07 0.13 0.05 0.157. Accidents (Number) 16 16 8 23 28. Total Staff (Number) 921 929 884 1003 9019. Daily Operated Kilometres on
effective 5858 6514 4893 7196 498710. Daily Operated Kilometres on total 5923 6638 4991 7553 507211. Daily Passengers Carried 4655 10646 2177 19606 4987(B) Financial Performance:— 12. Total Receipts (Lakh Rupees) 4424.63 5153.49 4310.46 6577.14 3457.7713. Total Expenditure (Lakh Rupees) 5813.04 6315.99 5376.17 7432.76 5028.45
14. Overall Receipts per Kilometre (Paise) 2070 2168 2414 2504 1900
15. Overall Expenditure per Kilometre (Paise) 2719 2656 3010 2830 2763
16. Total Profit (Lakh Rupees) -1388.41 -1162.50 -1065.71 -855.62 -1570.6817. Overall Profits per Kilometre (Paise) -649 -489 -597 -326 -86318. Interest Paid (Lakh Rupees) 170.00 169.60 145.00 185.00 160..0019. Total Returns (Lakh Rupees) -1218.41 -992.60 -920.71 -670.62 -1410.68P — Provisional.

469
TRANSPORT STATISTICS Progress of Haryana Roadways (Commercial Wing) during 2010-11
No. 21.5 (Contd.)
Description Haryana
Roadways Karnal
Haryana Roadways
Hisar
Haryana Roadways
Rewari
Haryana Roadways
Jind
Haryana Roadways Bhiwani
1 7 8 9 10 11
(A) Physical Performances:—
1. Total Fleet 168 191 114 156 187
2. Total Kilometrage (Lakhs) 211.35 243.68 152.01 197.64 215.10
3. Effective Kilometrage (Lakhs) 206.53 241.65 150.70 192.81 212.37
4. Kilometre per litre (On Gross) 4.87 4.91 4.83 4.80 4.85
5. Break downs 157 240 145 162 220
6. Break downs per 10,000 Kilometres 0.07 0.10 0.10 0.08 0.10
7. Accidents (Number) 18 16 17 25 20
8. Total Staff (Number) 818 1076 633 908 997
9. Daily Operated Kilometres on effective 5658 6621 4129 5282 5818
10. Daily Operated Kilometres on total 5790 6676 4165 5415 5893
11. Daily Passengers Carried 5667 5202 5246 8905 5825
(B) Financial Performance:—
12. Total Receipts (Lakh Rupees) 4223.60 4403.29 2910.54 3606.01 3624.11
13. Total Expenditure (Lakh Rupees) 5576.73 6617.45 4115.44 5467.20 5789.18
14. Overall Receipts per Kilometre (Paise) 2045 1822 1931 1870 1707
15. Overall Expenditure per Kilometre
(Paise) 2700 2738 2731 2836 2726
16. Total Profit (Lakh Rupees) -1353.13 -2214.16 -1204.90 -1861.19 -2165.07
17. Overall Profits per Kilometre (Paise) -655 -916 -800 -965 -1019
18. Interest Paid (Lakh Rupees) 145.00 175.00 125.00 130.00 145.00
19. Total Returns (Lakh Rupees) -1208.13 -2039.16 -1079.90 -1731.19 -2020.07
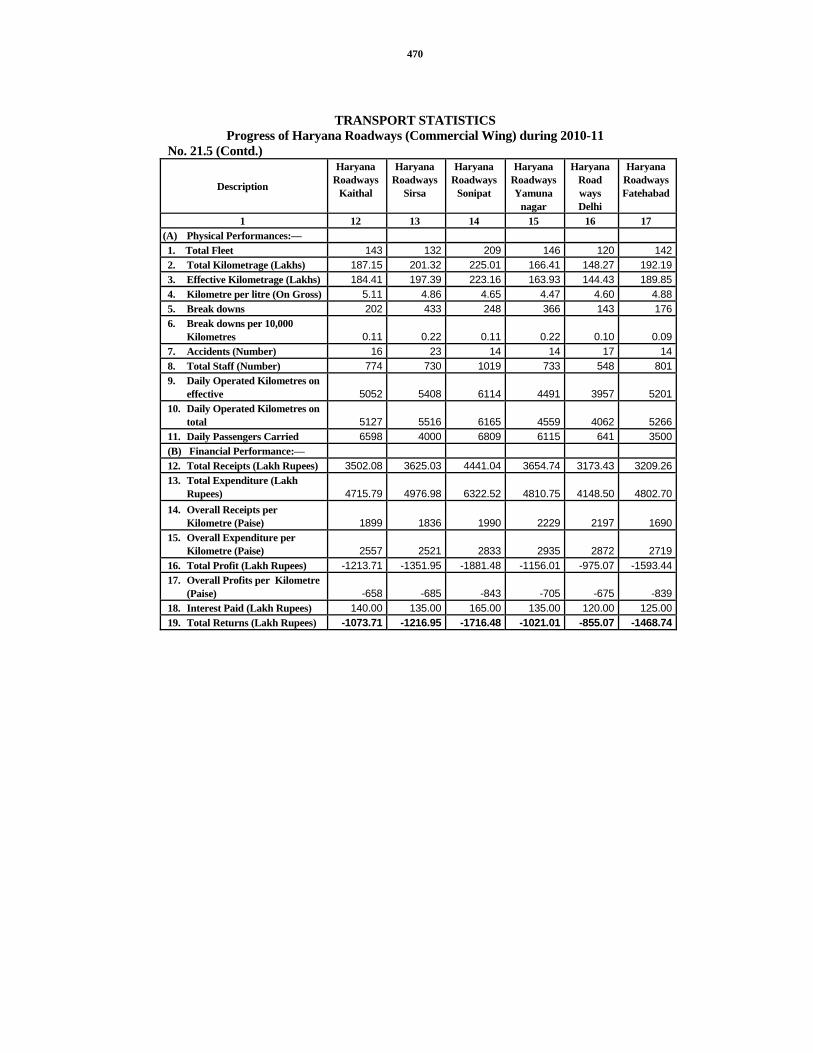
470
TRANSPORT STATISTICS Progress of Haryana Roadways (Commercial Wing) during 2010-11
No. 21.5 (Contd.)
Description
Haryana Roadways
Kaithal
Haryana Roadways
Sirsa
Haryana Roadways
Sonipat
Haryana Roadways Yamuna
nagar
Haryana Road ways Delhi
Haryana Roadways Fatehabad
1 12 13 14 15 16 17 (A) Physical Performances:— 1. Total Fleet 143 132 209 146 120 1422. Total Kilometrage (Lakhs) 187.15 201.32 225.01 166.41 148.27 192.193. Effective Kilometrage (Lakhs) 184.41 197.39 223.16 163.93 144.43 189.854. Kilometre per litre (On Gross) 5.11 4.86 4.65 4.47 4.60 4.885. Break downs 202 433 248 366 143 1766. Break downs per 10,000
Kilometres 0.11 0.22 0.11 0.22 0.10 0.097. Accidents (Number) 16 23 14 14 17 148. Total Staff (Number) 774 730 1019 733 548 8019. Daily Operated Kilometres on
effective 5052 5408 6114 4491 3957 520110. Daily Operated Kilometres on
total 5127 5516 6165 4559 4062 526611. Daily Passengers Carried 6598 4000 6809 6115 641 3500(B) Financial Performance:— 12. Total Receipts (Lakh Rupees) 3502.08 3625.03 4441.04 3654.74 3173.43 3209.2613. Total Expenditure (Lakh
Rupees) 4715.79 4976.98 6322.52 4810.75 4148.50 4802.7014. Overall Receipts per
Kilometre (Paise) 1899 1836 1990 2229 2197 169015. Overall Expenditure per
Kilometre (Paise) 2557 2521 2833 2935 2872 271916. Total Profit (Lakh Rupees) -1213.71 -1351.95 -1881.48 -1156.01 -975.07 -1593.4417. Overall Profits per Kilometre
(Paise) -658 -685 -843 -705 -675 -83918. Interest Paid (Lakh Rupees) 140.00 135.00 165.00 135.00 120.00 125.0019. Total Returns (Lakh Rupees) -1073.71 -1216.95 -1716.48 -1021.01 -855.07 -1468.74

471
TRANSPORT STATISTICS Progress of Haryana Roadways (Commercial Wing) during 2010-11
No. 21.5 (Concld.)
Description
Haryana Roadways
Kurukshetra
Haryana Roadways
Jhajjar
Haryana Roadways
Panipat
Haryana Roadways Narnaul
Staff I S B T + H R E C + H S R K N L
Total
1 18 19 20 21 22 23 (A) Physical Performances:— 1. Total Fleet 168 121 122 116 ----- 32112. Total Kilometrage (Lakhs) 220.43 125.91 140.42 137.93 ----- 3866.293. Effective Kilometrage (Lakhs) 216.01 124.78 137.50 136.74 ---- 3797.084. Kilometre per litre (On Gross) 4.93 4.74 4.78 4.90 ---- 4.785. Break downs 144 121 186 264 ---- 42226. Break downs per 10,000
Kilometres 0.07 0.10 0.13 0.19 ---- 0.117. Accidents (Number) 10 7 12 8 ---- 2968. Total Staff (Number) 798 651 598 589 225 165369. Daily Operated Kilometres on
effective 5918 3419 3767 3746 ---- 10402910. Daily Operated Kilometres on
total 6039 3450 3847 3779 ---- 10592611. Daily Passengers Carried 3501 3803 2939 3782 ---- 114604(B) Financial Performance:— 12. Total Receipts (Lakh Rupees) 4352.10 2272.67 2739.48 2504.70 ---- 76165.5713. Total Expenditure (Lakh
Rupees) 5482.64 3679.79 3853.20 3573.98 ---- 103899.26
14. Overall Receipts per Kilometre (Paise) 2015 1821 1992 1832 ---- 2006
15. Overall Expenditure per Kilometre (Paise) 2538 2949 2802 2614 ---- 2736
16. Total Profit (Lakh Rupees) -1130.54 -1407.12 -1113.72 -1069.28 ---- -27733.6917. Overall Profits per Kilometre
(Paise) -523 -1128 -810 -782 ----- -73018. Interest Paid (Lakh Rupees) 125.00 105.00 100.00 100.00 ---- 2799.6019. Total Returns (Lakh Rupees) -1005.54 -1302.12 1013.72 -969.28 ---- -24934.09
Source :—State Transport Commissioner, Haryana.

472
TRANSPORT Registered vehicles in use (Taxed and tax exempted) (As on 31st March, 2005
No. 21.6 (In Numbers) States/UTs All vehicles Two wheeler Auto Rickshaws Cars
1 2 3 4 5 Andhra Pradesh 64,57,921 51,16,696 2,81,236 4,85,709Arunachal Pradesh* 21,825 11,051 1,441 2,468Assam 8,15,239 4,76,378 32,386 1,24,275Bihar 13,51,938 9,03,261 42,050 71,834Chhattisgarh 13,75,292 11,17,136 8,219 51,622Goa (c) 4,82,303 3,42,087 9,763 80,619Gujarat 78,17,272 57,44,353 2,96,758 6,32,154Haryana 28,53,667 17,29,236 43,239 3,12,072Himachal Pradesh 3,00,779 1,67,906 3,717 51,019Jammu and Kashmir 4,77,856 2,73,265 15,054 85,812Karnataka 54,35,616 39,57,762 2,02,298 5,39,518Kerala 31,22,082 18,19,884 3,20,851 4,28,327Madhya Pradesh 41,87,973 31,76,549 47,976 1,66,393Jharkhand 13,56,978 10,49,303 40,714 1,02,186Maharashtra 99,35,965 69,26,576 5,15,249 10,39,800Manipur 1,14,497 80,557 2,630 9,532Meghalaya 92,128 27,237 3,001 19,186Mizoram 46,590 21,816 1,336 5,565Nagaland 1,72,399 39,989 9,100 34,866Orissa 17,15,360 13,60,582 30,310 74,265Punjab 38,76,106 28,77,147 39,664 3,00,594Rajasthan 42,60,729 30,16,763 71,711 2,34,297Sikkim 19,539 4,957 -- 2,505Tamilnadu 92,57,187 72,92,507 1,63,545 7,83,892Tripura** 72,730 34,450 11,881 5,784Uttar Pradesh 73,44,486 56,52,044 80,037 4,99,148Uttrakhand 5,73,309 4,33,981 7,060 50,303West Bengal 26,80,555 16,87,045 56,038 5,28,101Andaman Nicobar** 37,199 20,320 2,857 2,099Chandigarh 6,16,720 4,34,758 2,000 1,66,755Dadar Nagar Haveli 39,933 20,841 527 10,443Delhi 41,86,826 26,83,955 92,243 11,08,045Daman and Diu 50,583 30,761 942 13,602Lakshadweep 4,948 3,654 249 27Pondicherry 3,47,189 2,64,895 4,600 49,833All India 8,15,01,719 5,87,99,702 24,40,682 80,72,650Note :-- Includes trucks, three and four wheelers for carrying goods. P—Provisional

473
Includes Tractors and trailors also. . .--Not indicated TRANSPORT
Registered vehicles in use (Taxed and tax exempted) (As on 31st March, 2005 No. 21.6 (Contd.) (In Numbers
States/UTs Jeeps Taxis Buses Goods Vehicles (1) Miscellaneous (2)
1 6 7 8 9 10
Andhra Pradesh 61,692 97,516 57,726 2,38,001 1,19,345
Arunachal Pradesh* 2,271 334 678 2,910 672
Assam 14,808 11,440 10,776 1,03,970 41,206
Bihar 39,542 22,271 16,158 49,437 2,07,385
Chhattisgarh 7,855 4,736 22,294 65,059 98,371
Goa (c) @ 9,036 5,267 31,053 4,478
Gujarat 1,17,809 43,714 52,286 4,18,811 5,11,387
Haryana 90,513 17,294 11,297 2,34,428 4,15,588
Himachal Pradesh 8,278 14,695 7,012 47,290 862
Jammu and Kashmir 10,778 12,344 20,954 45,464 14,185
Karnataka 43,804 56,226 89,294 2,21,913 3,24,801
Kerala 72,227 1,00,012 95,486 2,34,191 51,104
Madhya Pradesh 37,704 67,570 25,990 1,15,813 5,49,978
Jharkhand 26,773 23,289 9,878 65,662 39,173
Maharashtra 2,83,016 1,13,380 63,405 5,59,847 4,34,692
Manipur 8,269 369 3,150 7,804 2,186
Meghalaya 10,490 7,180 3,285 17,726 4,023
Mizoram 3,576 4,316 672 4,061 5,248
Nagaland 21,999 4,721 4,079 54,735 2,910
Orissa 29,938 26,365 17,392 1,03,402 73,106
Punjab 36,751 9,616 19,855 1,187,66 4,73,713
Rajasthan 1,37,384 37,761 58,092 2,08,881 4,95,840
Sikkim 3,293 5,467 1,118 2,186 13
Tamilnadu 54,575 1,24,370 1,02,504 5,09,942 2,25,852
Tripura** 4,283 1,232 1,877 9,536 3,687
Uttar Pradesh 1,06,897 27,810 41,325 1,65,123 7,72,102
Uttrakhand 6,734 14,605 6,361 17,785 36,480
West Bengal @ 65,110 33,613 2,23,826 86,822

474
TRANSPORT Registered vehicles in use (Taxed and tax exempted) (As on 31st March, 2005
No. 21.6 (Concld.) (In Numbers) States/UTs Jeeps Taxis Buses Goods Vehicles (1) Miscellaneous (2)
1 6 7 8 9 10
Andaman Nicobar**
705 246 839 1,677 8,456
Chandigarh -- 1,550 2,211 9,446 --
Dadar Nagar Haveli 448 112 162 7,303 97
Delhi 61,286 13,470 1,02,624 1,20,324 4,879
Daman and Diu 301 43 427 4,144 363
Lakshadweep 86 -- 72 290 570
Pondicherry 3,841 1,538 4,628 10,712 7,142
All India 13,07,926 9,39,738 8,92,787 40,31,518 50,16,716Source :—Ministry of Surface Transport, Govt. of India, New Delhi.
*Data relates to 1996-97
**Data relates to 2001-02
(c ) LMV (Passengers) includes 5726 Motorcycles on hire also.
@ Included in cars. R—Revised
$ Includes Omni Buses. . . —Not indicated

475
TRANSPORT Registered vehicles in use (Taxed and tax exempted) (As on 31st March, 2006 (P)
No. 21.6(a) (In Numbers) States/UTs All vehicles Two wheeler Auto Rickshaws Cars
1 2 3 4 5 Andhra Pradesh 7218195 5707383 299776 576329Arunachal Pradesh* 22101 11112 1449 2595Assam 914023 541275 34906 145029Bihar 1432343 964594 45365 76896Chhattisgarh 1540849 1247658 9194 59591Goa (c) 529019 375571 10035 89547Gujarat 8622290 6352109 336695 703968Haryana 3087026 1881174 45858 373659Himachal Pradesh 333528 187883 2825 58005Jammu and Kashmir 523543 297656 15919 98309Karnataka 6220370 4512910 213721 635205Kerala 3558704 2099652 342527 498472Madhya Pradesh 4608627 3526416 51049 185700Jharkhand 1505051 1164854 46834 113500Maharashtra 10966434 7691856 534535 1165365Manipur 124129 86931 2721 11233Meghalaya*** 104116 31008 3569 22351Mizoram 51876 24737 1534 6286Nagaland 183716 42851 9548 37513Orissa 1931995 1530295 34360 82686Punjab 4035160 2975198 43280 335284Rajasthan 4754027 3393916 79576 269861Sikkim 22019 5282 -- 3053Tamilnadu 10053913 7936778 174646 840433Tripura* 105768 61968 13237 6656Uttar Pradesh 7989134 6083655 91346 615739Uttrakhand 643385 486734 7906 59368West Bengal 2871799 1833820 40315 556230Andaman Nicobar** 40815 23079 2997 2441Chandigarh 646629 454308 2000 176387Dadar Nagar Haveli 44656 23607 539 11820Delhi 4487412 2851920 96149 1222706Daman and Diu 55102 33379 976 15007Lakshadweep 6263 4822 273 38Pondicherry 384250 296735 4665 52593All India 89618267 64743126 2600325 9109855Note :— Includes trucks, three and four wheelers for carrying goods. Includes Tractors and trailors also. P—Provisional. ... :—Not indicated

476
TRANSPORT Registered vehicles in use (Taxed and tax exempted) (As on 31st March, 2006 (P)
No. 21.6(a) (Contd.) (In Numbers) States/UTs Jeeps Taxis Buses Goods Vehicles (1) Miscellaneous (2)
1 6 7 8 9 10 Andhra Pradesh 65377 113693 63582 266944 3612649Arunachal Pradesh* 2284 343 682 2956 680Assam 15080 12671 11378 111172 42512Bihar 41863 22698 16271 50016 214640Chhattisgarh 8575 5036 24955 73574 112266Goa (c) @ 9361 5689 34043 4773Gujarat 122864 47914 54446 457702 546592Haryana 95450 16344 19986 250540 404015Himachal Pradesh 9544 14542 7261 52426 1042Jammu and Kashmir 11058 13656 21654 50017 15274Karnataka 41989 67385 95627 276013 377520Kerala 73158 119753 127574 264262 33306Madhya Pradesh 38291 72760 27997 123236 583178Jharkhand 30962 24693 10238 68915 45055Maharashtra 300023 122389 66754 621971 463541Manipur 8568 377 3371 8600 2328Meghalaya*** 11300 8432 3497 19625 4334Mizoram 3712 4988 704 4480 5435Nagaland 22481 5004 4410 58893 3016Orissa 30547 30426 18563 122275 82843Punjab 41670 9937 21136 127720 8062Rajasthan 147840 42679 60979 229347 529829Sikkim 3769 6052 1435 2404 13222Tamilnadu 55673 134580 109948 547055 254800Tripura* 4358 1316 1974 10673 5586Uttar Pradesh 112837 28443 45564 184428 827122Uttrakhand 6944 16069 7578 20428 38358West Bengal @ 68926 43599 235269 93640Andaman Nicobar** 779 246 993 1792 8488Chandigarh -- 1771 2358 9805 --
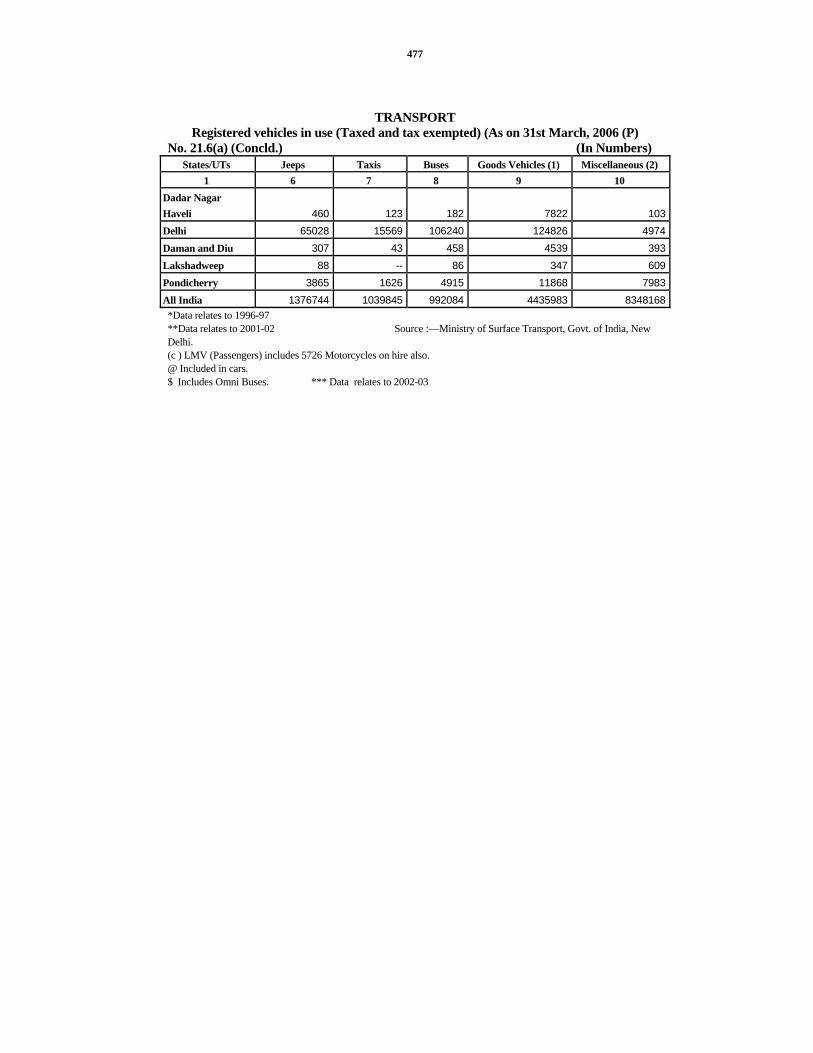
477
TRANSPORT Registered vehicles in use (Taxed and tax exempted) (As on 31st March, 2006 (P)
No. 21.6(a) (Concld.) (In Numbers) States/UTs Jeeps Taxis Buses Goods Vehicles (1) Miscellaneous (2)
1 6 7 8 9 10 Dadar Nagar Haveli 460 123 182 7822 103Delhi 65028 15569 106240 124826 4974Daman and Diu 307 43 458 4539 393Lakshadweep 88 -- 86 347 609Pondicherry 3865 1626 4915 11868 7983All India 1376744 1039845 992084 4435983 8348168*Data relates to 1996-97 **Data relates to 2001-02 Source :—Ministry of Surface Transport, Govt. of India, New Delhi. (c ) LMV (Passengers) includes 5726 Motorcycles on hire also. @ Included in cars. $ Includes Omni Buses. *** Data relates to 2002-03

478
TRANSPORT Number of Motor Vehicles in Various States of India in Relation to
Area and Population in 2005-06 No. 21.7
Number of Motor Vehicles per State 100 Square Kilometres of Area Lakh of Population*
1 2 3 Andhra Pradesh 2624 9471Arunachal Pradesh 26 2013Assam 1165 3429Bihar 1521 1726Chhattisgarh 1140 7396Goa 14290 3925Gujarat 4399 17062Haryana 6982 14599Himachal Pradesh 599 5488Jammu and Kashmir 236 5161Karnataka 3243 1177Kerala 9157 11176Madhya Pradesh 1495 5585Jharkhand 1888 4322Maharashtra 3564 11320Manipur 556 5729Meghalaya 464 4490Mizoram 246 5838Nagaland 1108 9232Orissa 1241 5249Punjab 8012 16565Rajasthan 1389 8413Sikkim 310 4071Tamilnadu 7730 16110Tripura 1009 3306Uttar Pradesh 3316 4807Uttarakhand 1203 7579West Bengal 3236 3582India 27261 8712
Source :—Ministry of Surface Transport, Govt. of India, New Delhi. *Based on 2001Census.

ROAD LENGTH IN HARYANA(In Kms.)
1633
9
1151
6
6137
2559
1
2565
3
2051
6
2455
7
2325
8
2370
6
2348
6
2301
7
2234
1
0
5000
10000
15000
20000
25000
30000
66-67 70-71 75-76 80-81 85-86 90-91 95-96 00-01 05-06 08-09 09-10 10-11
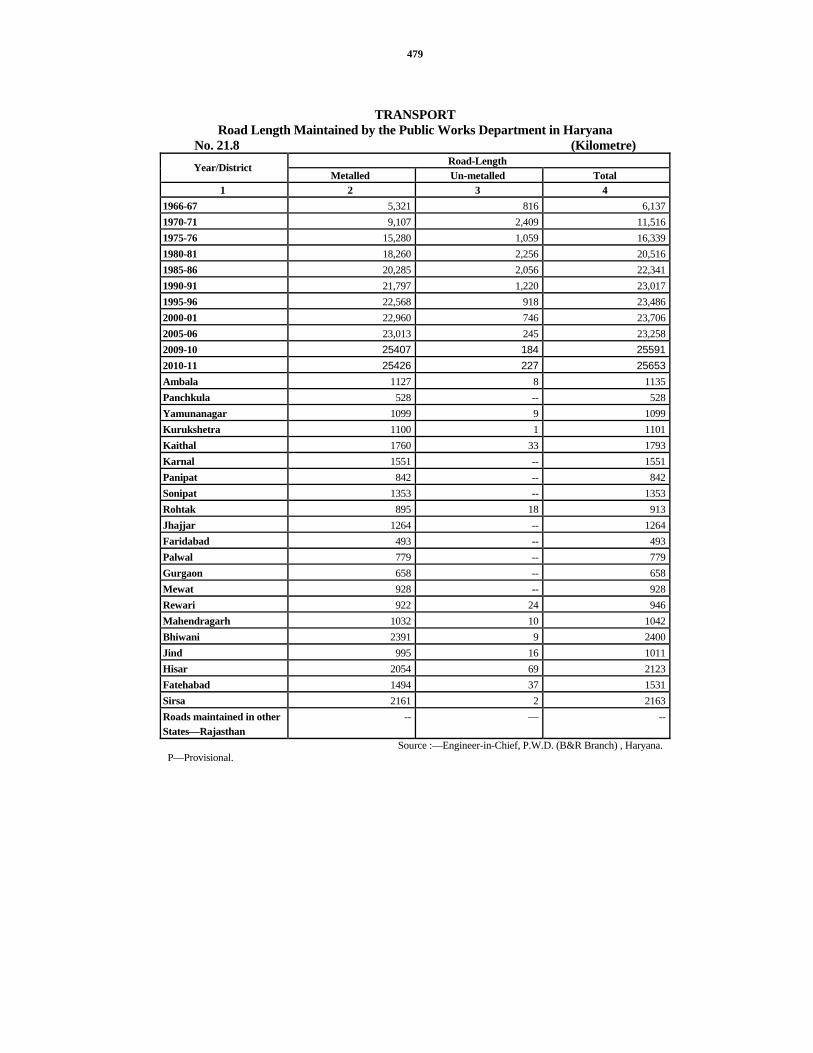
479
TRANSPORT Road Length Maintained by the Public Works Department in Haryana
No. 21.8 (Kilometre) Road-Length Year/District
Metalled Un-metalled Total 1 2 3 4
1966-67 5,321 816 6,1371970-71 9,107 2,409 11,5161975-76 15,280 1,059 16,3391980-81 18,260 2,256 20,5161985-86 20,285 2,056 22,3411990-91 21,797 1,220 23,0171995-96 22,568 918 23,4862000-01 22,960 746 23,7062005-06 23,013 245 23,2582009-10 25407 184 255912010-11 25426 227 25653Ambala 1127 8 1135Panchkula 528 -- 528Yamunanagar 1099 9 1099Kurukshetra 1100 1 1101Kaithal 1760 33 1793Karnal 1551 -- 1551Panipat 842 -- 842Sonipat 1353 -- 1353Rohtak 895 18 913Jhajjar 1264 -- 1264Faridabad 493 -- 493Palwal 779 -- 779Gurgaon 658 -- 658Mewat 928 -- 928Rewari 922 24 946Mahendragarh 1032 10 1042Bhiwani 2391 9 2400Jind 995 16 1011Hisar 2054 69 2123Fatehabad 1494 37 1531Sirsa 2161 2 2163Roads maintained in other States—Rajasthan
-- — --
Source :—Engineer-in-Chief, P.W.D. (B&R Branch) , Haryana. P—Provisional.

480
TRANSPORT Road Length Maintained by the Public Works Department (B&R) and Local
Bodies in Haryana No. 21.9 (Kilometre)
Maintained by Public Works National Highways State Roads
Metalled Metalled Year/District
Surfaced UnsurfacedUn-metalled Total
Surfaced Unsurfaced 1 2 3 4 5 6 7
1966-67 759 –– 8 767 4,273 2891970-71 677 5 –– 682 6,664 1,4651975-76 682 –– –– 682 13,862 3861980-81 655 –– –– 655 16,995 6101985-86 655 –– –– 655 19,475 1551990-91 656 –– –– 656 20,897 2441995-96 656 — — 656 21,912 —2000-01 1,346 — — 1,346 21,224 3902005-06 1,083 — — 1,083 21,798 1322009-10(P) 1462 -- -- 1462 25323 842010-11 1463 -- -- 1463 25418 8Ambala 138 -- -- 138 1127 --Panchkula 73 -- -- 73 528 --Yamunanagar 78 -- -- 78 1099 --Kurukshetra 77 -- -- 77 1100 --Kaithal 46 -- -- 46 1760 --Karnal 52 -- -- 52 1551 --Panipat 56 -- -- 56 842 --Sonipat 64 -- -- 64 1353 --Rohtak 124 -- -- 124 894 1Jhajjar 65 -- -- 65 1260 4Faridabad 92 -- -- 92 493 --Palwal -- -- -- -- 779 --Gurgaon 59 -- -- 59 658 --Mewat 20 -- -- 20 928 --Rewari 92 -- -- 92 921 1Mahendragarh -- -- -- -- 1032 --Bhiwani 36 -- -- 36 239 1Jind 124 -- -- 124 995 --Hisar 144 -- -- 144 2054 --Fatehabad 37 -- -- 37 1493 1Sirsa 86 -- -- 86 2161 --Roads maintained in other States—Rajasthan
— — — — -- —
P—Provisional. Note :—Decrease is due to transfer of some Roads to National Highways Authority.

481
TRANSPORT
Road Length Maintained by the Public Works Department (B&R) and Local Bodies in Haryana
No. 21.9 (Concld.) (Kilometre)
Department (B&R) Maintained by Local Bodies
Year/District Un-metalled Total
(6+7+8) Metalled Un-metalled Total
(10+11)
Total Road
Length 5+9+12)
1 8 9 10 11 12 13 1966-67 808 5,370 373 1,677 2,050 8,1871970-71 –– 8,129 296 2,409 2,705 11,5161975-76 –– 14,248 350 1,059 1,409 16,3391980-81 2,256 19,861 –– –– –– 20,5161985-86 2,056 21,686 –– –– –– 22,3411990-91 1,220 22,361 –– –– –– 23,0171995-96 918 22,830 — — — 23,4862000-01 746 22,360 — — — 23,7062005-06 245 22,175 — — — 23,2582009-10(P) 184 25,591 — — — 27,0532010-11 227 25,653 — — — 27,116Ambala 8 1135 — — — 1273Panchkula -- 528 — — — 601Yamunanagar -- 1099 — — — 1177Kurukshetra 1 1101 — — — 1178Kaithal 33 1793 — — — 1839Karnal -- 1551 — — — 1603Panipat -- 842 — — — 898Sonipat -- 1353 — — — 1417Rohtak 18 913 — — — 1037Jhajjar -- 1264 — — — 1329Faridabad -- 493 — — — 585Palwal -- 779 — — — 779Gurgaon -- 658 — — — 717Mewat -- 928 — — — 948Rewari 24 946 — — — 1038Mahendragarh 10 1042 — — — 1042Bhiwani 9 2400 — — — 2436Jind 16 1011 — — — 1135Hisar 69 2123 — — — 2267Fatehabad 37 1531 — — — 1568Sirsa 2 2163 — — — 2249Roads maintained in other States—Rajasthan
— -- — — — --
Source :—Engineer-in-Chief, P.W.D. (B&R Branch) , Haryana. Note :—No roads are being maintained by Local Bodies from 1978 onwards.

482
TRANSPORT
Road Length by Types Maintained by P.W.D. (B. & R.) in Haryana No. 21.10 (Kilometre)
Types of Roads 1966-67 1970-71
1980-81
1985- 86
1990- 91
1995- 96
2000-01
2005-06
2009-10
2010-11
1 2 3 4 5 6 7 8 9 10 11 Cement Concrete
5 5 3 3 2 2 43 283 982 958
Bitumen Macadam
–– –– –– –– –– –– –– –– — —
Premix bitumen asphalt carpet
–– –– –– –– –– –– –– –– — —
Black top surfaced roads
5,027 7,336 17,647 20,127 21,551 22,566** 22,527 22,598 25,803 24,460
Water Bound Macadam (stone metal only)
289 1,470 610 155 244 — 390 132 84 8
Water Bound Macadam (Kankar)
–– –– –– –– –– –– –– –– — —
Other lower type surface (Moorum, gravel and sand clay etc.)
–– –– –– –– –– –– –– –– — —
Unmetalled roads
816 ––* 2,256 2,056 1,220 918 746 245@ 184 227
Total : 6,137 8,811 20,516 22,341 23,017 23,486 23,706 23,258 27,053 25,653Source :— Engineer-in-Chief, Public Works Department (Building and Roads), Haryana.
Note :—The above figures also include the length maintained in other States. * For the years 1970-71 to 1975-76 record of unmetalled road length was not maintained by P.W.D. ** Includes un-surfaced length of roads also. P—Provisional. @ Decrease is due to transfer of some unmettaled Roads to HSAMB.

483
TRANSPORT
Length of Metalled Roads in Haryana No. 21.11 (Kilometre)
Metalled Road Length Year/District
Total length Per 100 Sq. km. of area Per lakh of population 1 2 3 4
1966-67 5,032 11.42 661970-71 7,377 16.68 971975-76 14,544 32.89 1451980-81 17,650 39.92 1761985-86 20,130 45.54 1561990-91 21,553 48.75 1321995-96 22,568 51.04 1372000-01 22,960 51.93 1092005-06 23,013 52.05 1092009-10 24202 54.74 1142010-11 26888 60.82 106Ambala 1265 80.37 111Panchkula 601 66.93 108Yamunanagar 1177 66.57 97Kurukshetra 1177 76.93 122Kaithal 1806 77.94 168Karnal 1603 63.61 106Panipat 898 70.82 75Sonipat 1417 66.78 96Rohtak 1019 58.40 96Jhajjar 1329 72.46 139Faridabad 531 71.47 56Palwal 832 60.82 80Gurgaon 717 57.17 47Mewat 948 50.99 87Rewari 1014 63.61 113Mahendragarh 1032 54.34 112Bhiwani 2427 50.79 149Jind 1119 41.41 84Hisar 2198 54.43 126Fatehabad 1531 60.32 163Sirsa 2247 52.53 174
Source :— Engineer-in-Chief, Public Works Department (Building and Roads), Haryana. Note :—Relevant Census population has been used. P—Provisional. * Information of Palwal Includes in Faridabad.

484
TRANSPORT
Number of villages connected with Metalled Roads No. 21.12
District 1980-81 1985-86 1990-91 1995-96 2000-01 2005-06 2009-10 2010-11 1 2 3 4 5 6 7 8 9
Ambala 1,151 1,180 688 688 688 482 482 482Panchkula — — — — — 222 222 222
Yamunanagar –– –– 625 625 625 611 612 613Kurukshetra 720 721 392 392 392 407 407 407Kaithal –– –– 287 287 287 270 270 270Karnal 574 585 372 372 372 421 421 422Panipat –– –– 214 214 214 179 179 179Sonipat 333 334 245 246 246 323 323 323Rohtak 426 428 470 470 470 146 146 146Jhajjar — — — — — 247 247 247Faridabad 420 420 411 411 411 413 333 333Palwal — — — — — — — —Gurgaon 646 649 662 662 662 694 271 271Mewat — — — — — — 503 503Rewari –– –– 403 403 403 397 397 397Mahendragarh 703 705 371 371 371 367 367 365Bhiwani 427 427 423 423 423 437 437 437Jind 348 352 300 300 300 304 304 304Hisar 492 495 501 501 501 272 272 272Fatehabad — — — — — 243 243 243Sirsa 310 313 313 313 313 321 321 321Haryana State 6,550 6,609 6,677 6,678 6,678 6,756 6,757 6,757P—Provisional. Source :—Engineer-in-Chief, P.W.D. (B. & R.), Haryana.

485
TRANSPORT Percentage of villages connected with Metalled Roads
No. 21.13 District 1980-81 1985-86 1990-91 1995-96 2000-01 2005-06 2009-10 2010-11
1 2 3 4 5 6 7 8 9 Ambala 94.26 96.34 97.31 97.31 97.31 100.00 100.00 100.00Panchkula — — — — — 99.11 99.11 99.11Yamunanagar –– –– 98.89 98.89 98.89 99.67 99.83 100.00Kurukshetra 99.58 99.72 99.75 99.75 99.75 100.00 100.00 100.00Kaithal –– –– 99.31 99.31 99.31 100.00 100.00 100.00Karnal 96.47 97.83 99.20 99.20 99.20 99.76 99.76 100.00Panipat –– –– 100.00 100.00 100.00 100.00 100.00 100.00Sonipat 99.11 99.11 99.19 99.19 99.70 100.00 100.00 100.00Rohtak 99.30 99.77 99.58 99.58 99.58 100.00 100.00 100.00Jhajjar — — — — — 100.00 100.00 100.00Faridabad 92.30 92.71 96.71 96.71 96.71 100.00 100.00 98.79Palwal — — — — — — — —Gurgaon 96.27 96.15 98.37 98.37 98.37 100.00 100.00 100.00Mewat — — — — — — 100.00 100.00Rewari –– –– 99.75 99.75 99.75 100.00 100.00 100.00Mahendragarh 99.15 99.29 100.00 100.00 100.00 99.73 99.73 99.09Bhiwani 99.53 99.53 99.76 99.76 99.76 100.00 100.00 100.00Jind 100.00 100.00 100.00 100.00 100.00 99.35 99.73 99.67Hisar 98.80 99.40 99.80 99.80 99.80 100.00 100.00 100.00Fatehabad — — — — — 100.00 100.00 100.00Sirsa 97.79 98.74 98.74 98.74 98.74 100.00 100.00 100.00Haryana State 97.31 98.00 98.99 98.99 98.99 99.88 99.89 99.90P—Provisional. Source :— Department of Economic and Statistical Analysis, Haryana.

486
TRANSPORT Total length of different Highways in India (Statewise) 2007-08 (P)
No. 21.14 (in Kms.) Year/District National Highways State Highways Other P.W.D. Roads
1 2 3 4 1970-71 23,838 56,765 2,76,8331975-76 29,132 89,215 3,40,4991980-81 31,671 94,359 4,21,8951985-86 32,088 1,00,461 5,00,8691990-91 33,650 1,27,311 5,09,4351995-96 34,508 1,35,187 7,16,7012000-01 57,737 1,32,100 7,36,0012004-05 65569 144416 7862302005-06 66590 148071 8036692006-07 66590 152816 8350032007-08 (P) 66754 154522 863241Andhra Pradesh 4472 10518 53886Arunachal Pradesh 392 -- 12967Assam 2836 3134 31813Bihar 3642 3767 74672Jharkhand 1805 1886 4994Delhi 72 -- 400Goa 269 279 4501Gujarat 3245 18447 52421Haryana 1512 2523 20108Himachal Pradesh 1208 1824 28428Jammu and Kashmir 1245 67 5466Karnataka 3843 20738 37943Kerala 1457 4137 24066Madhya Pradesh 4670 8729 60334Chattisgarh 2184 3419 28663Maharashtra 4176 33675 32055Manipur 959 1137 10522Meghalaya 810 1134 6366Mizoram 927 259 3991Nagaland 494 404 9688Orissa 3704 3806 10464Punjab 1557 1393 27276Rajasthan 5585 11240 92029Sikkim 62 179 1598Tamil Nadu 4462 9264 45962Tripura 400 689 14643Uttar Pradesh 5874 8391 138024Uttrakhand 1991 1576 18272West Bengal 2524 1682 9091Union Territories 377 225 2598

487
TRANSPORT Total length of different Highways in India (Statewise) 2007-08 (P)
No. 21.14 (Contd.) (in Kms.)
Year/District Zila
Parishad Roads
Village Panchayat
Roads
C.D./Panchayat Samiti Roads
Urban Roads
Project Roads
Total
1 5 6 7 8 9 10 1970-71 1,61,247 1,07,215 86,068 72,120 1,30,893 9,14,9791975-76 2,18,916 1,21,311 1,44,543 97,490 1,63,745 12,04,8511980-81 2,73,468 1,79,848 1,75,549 1,23,120 1,85,511 14,85,4211985-86 2,96,924 2,36,720 2,14,066 1,38,647 2,06,276 17,26,0511990-91 3,95,005 3,13,374 2,22,909 1,86,799 2,09,737 19,98,2201995-96 4,35,716 4,06,575 1,15,235 2,12,920 2,45,673 23,28,356(R)2000-01 4,87,604 4,33,003(R) 1,47,413 2,52,001 2,23,665 24,69,524(R)2004-05 469944 621904 327898 286707 259815 29624832005-06 473705 636205 331627 291991 262186 30140442006-07 507626 655299 334085 300580 268505 3120504 2007-08 (P) 508608 670107 336872 304327 270189 3174620 Andhra Pradesh 126843 2003 126837 13799 8657 347015Arunachal Pradesh -- -- -- 14 1118 14491Assam 14735 94824 69184 5747 8061 230334Bihar 25864 -- -- 9854 2328 120127Jharkhand -- -- -- 313 8533 17531Delhi -- -- -- 29087 -- 29559Goa -- 4207 -- 1193 120 10569Gujarat 44434 -- -- 19306 8777 146630Haryana -- -- -- 5024 559 29726Himachal Pradesh -- -- 560 2168 2110 36298Jammu and Kashmir -- -- 2740 1762 11043 22323Karnataka 144725 -- -- 24070 24135 255454Kerala -- 153797 -- 13289 8011 204757Madhya Pradesh -- 47166 -- 14605 30236 165740Chattisgarh -- 6418 12143 6553 15054 74434Maharashtra 102149 -- -- 20383 30884 223322Manipur -- -- 3716 168 -- 16502Meghalaya -- -- 604 41 884 9839

488
TRANSPORT Total length of different Highways in India (Statewise) 2007-08 (P)
No. 21.14 (Concld.) (in Kms.)
Year/District Zila
Parishad Roads
Village Panchayat
Roads
C.D./Panchayat Samiti Roads
Urban Roads
Project Roads Total
1 5 6 7 8 9 10 Mizoram -- -- -- 311 670 6158Nagaland 10055 1098 -- 95 470 22304Orissa -- 139942 20324 18149 19015 215404Punjab -- -- -- 8085 6867 45178Rajasthan -- -- 44287 12564 5774 171479Sikkim -- -- -- 29 5 1873Tamil Nadu -- 63538 32792 17559 7636 181213Tripura -- 14429 -- 226 1346 31733Uttar Pradesh 15520 31993 -- 47448 37423 284673Uttrakhand -- -- -- 3202 16000 41041West Bengal 24203 110692 22434 26850 14294 211770Union Territories 80 -- 1251 2433 179 7143
Source :—Ministry of Surface Transport, Govt. of India, New Delhi. Note : —Totals does not tally due to rounding off.
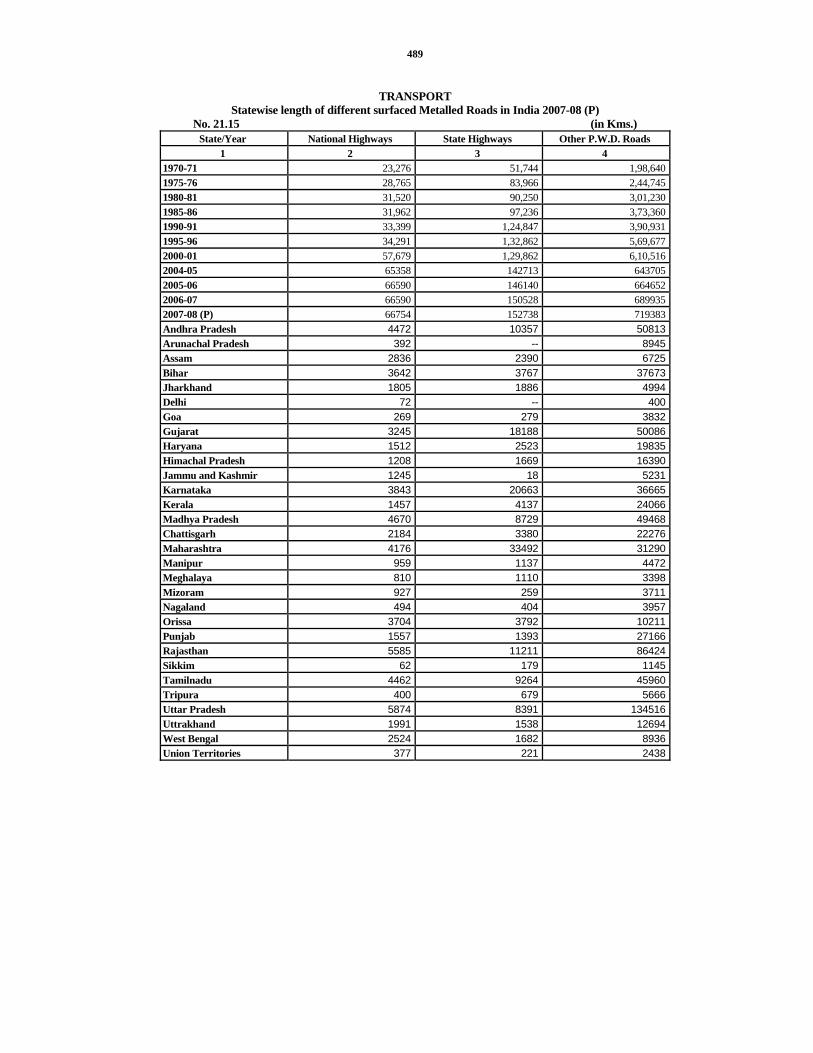
489
TRANSPORT
Statewise length of different surfaced Metalled Roads in India 2007-08 (P) No. 21.15 (in Kms.)
State/Year National Highways State Highways Other P.W.D. Roads 1 2 3 4
1970-71 23,276 51,744 1,98,6401975-76 28,765 83,966 2,44,7451980-81 31,520 90,250 3,01,2301985-86 31,962 97,236 3,73,3601990-91 33,399 1,24,847 3,90,931 1995-96 34,291 1,32,862 5,69,6772000-01 57,679 1,29,862 6,10,5162004-05 65358 142713 6437052005-06 66590 146140 6646522006-07 66590 150528 6899352007-08 (P) 66754 152738 719383 Andhra Pradesh 4472 10357 50813Arunachal Pradesh 392 -- 8945Assam 2836 2390 6725Bihar 3642 3767 37673Jharkhand 1805 1886 4994Delhi 72 -- 400Goa 269 279 3832Gujarat 3245 18188 50086Haryana 1512 2523 19835Himachal Pradesh 1208 1669 16390Jammu and Kashmir 1245 18 5231Karnataka 3843 20663 36665Kerala 1457 4137 24066Madhya Pradesh 4670 8729 49468Chattisgarh 2184 3380 22276Maharashtra 4176 33492 31290Manipur 959 1137 4472Meghalaya 810 1110 3398Mizoram 927 259 3711Nagaland 494 404 3957Orissa 3704 3792 10211Punjab 1557 1393 27166Rajasthan 5585 11211 86424Sikkim 62 179 1145Tamilnadu 4462 9264 45960Tripura 400 679 5666Uttar Pradesh 5874 8391 134516Uttrakhand 1991 1538 12694West Bengal 2524 1682 8936Union Territories 377 221 2438

490
TRANSPORT Statewise length of different surfaced Metalled Roads in India 2007-08 (P)
No. 21.15 (Contd.) (in Kms.)
State/Year Zila
Parishad Roads
Village Panchayat
Roads
C.D./Panchayat Samiti Roads
Urban Roads
Project Roads Total
1 5 6 7 8 9 10 1970-71 36,402 12,316 16,105 53,359 6,106 3,97,9481975-76 59,146 12,506 28,999 73,287 16,000 5,47,4141980-81 89,416 26,131 38,497 85,877 20,755 6,83,6761985-86 1,32,951 20,954 44,598 98,985 24,865 8,24,9111990-91 2,10,453 45,028 52,669 1,36,644 30,368 10,24,3391995-96 2,38,382 58,929 28,008 1,56,124 45,091 12,63,3642000-01 2,75,786 55,675 36,691 1,91,797 56,541 14,14,5472004-05 2,63,311 1,19,580 1,00,023 1,95,277 66,299 15,96,2662005-06 2,65,737 1,25,756 1,01,872 2,00,210 66,581 16,37,5382006-07 2,74,582 1,32,265 1,03,324 2,07,052 69,039 16,93,3152007-08 (P) 2,78,962 1,35,331 1,05,173 2,12,750 74,180 17,45,271Andhra Pradesh 54,225 -- 54,219 10,950 4,280 1,89,316Arunachal Pradesh -- 344 -- 14 60 9,755Assam 2,482 3,257 4,490 3,621 811 26,612Bihar 7,843 -- -- 4,492 719 58,136Jharkhand -- -- -- 300 1,052 10,037Delhi -- -- -- 20,401 -- 20,873Goa -- 2,149 -- 1,068 67 7,664Gujarat 41,767 -- -- 15,002 4,034 1,32,322Haryana -- -- -- 3,721 112 27,703Himachal Pradesh -- -- 129 1,701 100 21,197Jammu and Kashmir -- -- 1,693 1,752 202 10,141Karnataka 64,886 -- -- 15,418 11,668 1,53,143Kerala -- 69,993 -- 10,868 5,925 1,16,446Madhya Pradesh -- 5,162 -- 10,155 4,242 82,426Chattisgarh -- 2,238 5,926 4,963 2,561 43,528Maharashtra 85,549 -- -- 15,159 8,379 178,045Manipur -- -- -- 114 -- 6,682Meghalaya -- -- 5 37 112 5,472Mizoram -- -- -- 272 -- 5,169Nagaland 4,342 250 -- 93 -- 9,540Orissa -- -- -- 6,777 6,161 30,645Punjab -- -- -- 6,517 854 37,487Rajasthan -- -- 8,159 10,528 1,687 1,23,594Sikkim -- -- -- 29 3 1,418Tamilnadu -- 39,494 28,615 14,788 4763 1,47,346
TRANSPORT Statewise length of different surfaced Metalled Roads in India 2007-08 (P)

491
No. 21.15 (Concld.) (in Kms.)
State/Year Zila
Parishad Roads
Village Panchayat
Roads
C.D./Panchayat Samiti Roads
Urban Roads Project Roads Total
1 5 6 7 8 9 10 Tripura -- 5240 -- 185 12 12182Uttar Pradesh 7575 5853 -- 31142 9141 202492Uttrakhand -- -- -- 2442 1527 20192West Bengal 10213 1351 990 17838 5577 49111Union Territories 80 -- 947 2403 131 6597
Source :—Ministry of Surface Transport, Govt. of India, New Delhi.

492
TRANSPORT Road Length per 100 Square Kilometres of Area and per Lakh of Population in
Different States of India in 2007-08 No. 21.16 (Length in Kilometres)
Road length per State/Country
100 Square Kilometres Lakh of Population 1 2 3
All India* 96.57 277.32Andhra Pradesh 125.44 418.83Arunachal Pradesh 19.70 1376.79Assam 293.65 782.52Bihar 127.57 128.30Jharkhand 21.99 58.09Delhi 1993.19 174.34Goa 285.49 662.22Gujarat 74.80 258.94Haryana 67.24 122.98Himachal Pradesh 65.20 550.39Jammu and Kashmir 10.04 198.30Karnataka 133.19 443.88Kerala 526.87 605.75Madhya Pradesh 53.77 241.12Chattisgarh 55.06 319.88Maharashtra 72.57 206.83Manipur 73.91 698.05Meghalaya 43.87 388.89Mizoram 29.21 634.85Nagaland 134.53 1027.36Orissa 138.34 543.20Punjab 89.71 169.07Rajasthan 50.11 265.72Sikkim 26.40 316.92Tamilnadu 139.33 274.12Tripura 302.62 908.99Uttar Pradesh 532.27 149.63Uttrakhand 17.03 431.51West Bengal 238.61 243.43Union Territory 75.37 204.62
Source :—Ministry of Surface Transport, Govt. of India, New Delhi.

493
TRANSPORT
Railway Route Kilometres as on 31st March No. 21.17
Route in Kilometres
Division/Year Total
Broad Gauge 5'—6''
Metre Gauge 3'—
3''
Narrow Gauge 2'—6''
and 2'—0'' 1 2 3 4 5
(A) Delhi 1966-67 1,574.20 1,478.63 — 95.571970-71 1,592.50 1,496.93 — 95.571975-76 1,597.64 1,502.07 — 95.571980-81 1,852.76 1,757.19 — 95.571985-86 1,864.76 1,769.19 — 95.571990-91 1,192.95 1,192.95 — —1995-96 1,192.95 1,192.95 — —2000-01 1,188.38 1,188.38 — —2005-06 1,386.37 1,298.66 87.71 —2009-10 1315.68 3834.14 11.27 —2010-11 1315.68 1304.41 11.27 —(B) Ferozepur 1966-67 1,670.91 1,506.92 — 163.991970-71 1,698.73 1,534.74 — 163.991975-76 1,774.76 1,610.77 — 163.991980-81 1,777.28 1,613.29 — 163.991985-86 1,765.28 1,601.29 — 163.991990-91 1,464.80 1,300.81 — 163.991995-96 1,475.80 1,311.81 — 163.992000-01 1,562.44 1,398.45 — 163.992005-06 1,608.33 1,444.02 — 164.312009-10 1,726.23 1,561.92 — 164.312010-11 1,726.23 1,561.92 — 164.31(C) Ambala 1990-91 1,006.00 910.43 –– 95.571995-96 1,009.00 913.43 — 95.571997-98 987.09 890.55 — 96.542000-01 987.09 890.55 — 96.542005-06 1,053.10 956.56 — 96.542009-10 1,034.35 967.81 — 96.542010-11 1064.35 967.81 — 96.54
TRANSPORT Railway Route Kilometres as on 31st March

494
No. 21.17 (Concld.) Route in Kilometres
Division/Year Total
Broad Gauge 5'—6''
Metre Gauge 3'—
3''
Narrow Gauge 2'—6''
and 2'—0'' 1 2 3 4 5
1966-67 3,245.11 2,985.55 –– 259.561970-71 3,291.23 3,031.67 –– 259.561975-76 3,372.40 3,112.84 –– 259.561980-81 3,630.04 3,370.48 –– 259.561985-86 3,630.04 3,370.48 –– 259.561990-91 3,663.75 3,404.19 –– 259.561995-96 3,677.75 3,418.19 — 259.562000-01 3,737.91 3,477.38 — 260.532005-06 4,047.80 3,699.24 87.71 260.852009-10 4,106.26 3,834.14 11.27 260.852010-11 4106.26 3834.14 11.27 260.85
Source :—General Manager (Statistics), Northern Railway, New Delhi.
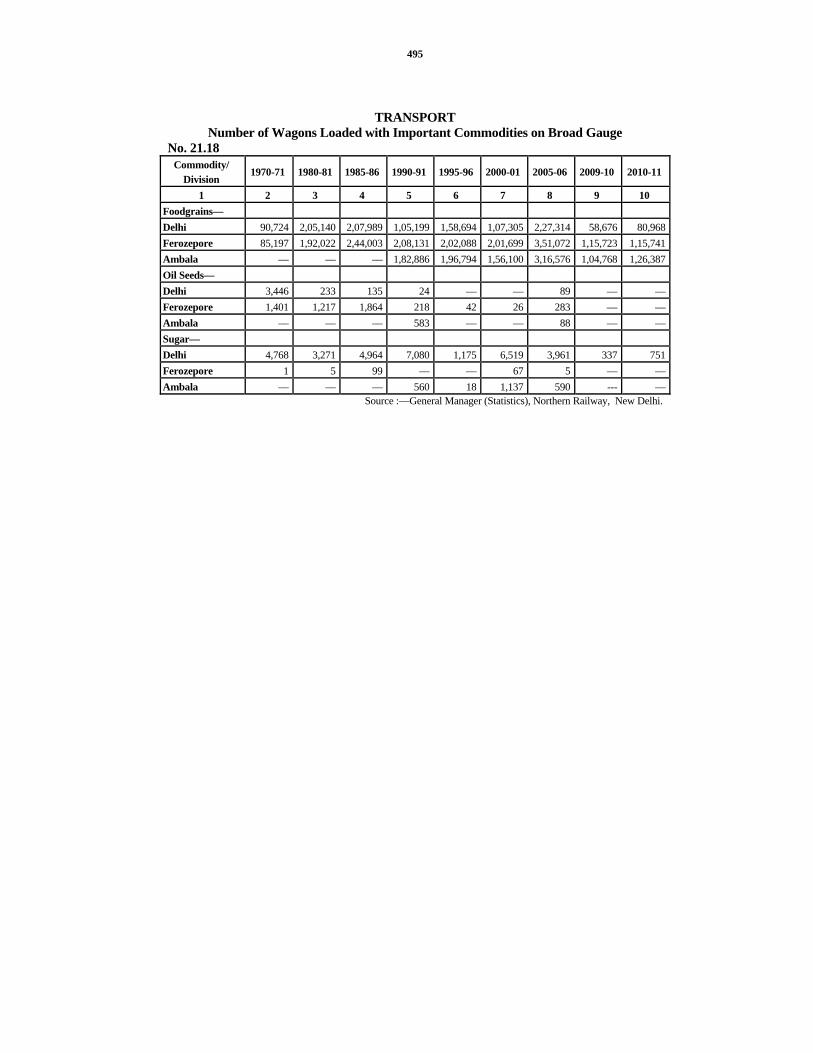
495
TRANSPORT Number of Wagons Loaded with Important Commodities on Broad Gauge
No. 21.18 Commodity/
Division 1970-71 1980-81 1985-86 1990-91 1995-96 2000-01 2005-06 2009-10 2010-11
1 2 3 4 5 6 7 8 9 10 Foodgrains— Delhi 90,724 2,05,140 2,07,989 1,05,199 1,58,694 1,07,305 2,27,314 58,676 80,968Ferozepore 85,197 1,92,022 2,44,003 2,08,131 2,02,088 2,01,699 3,51,072 1,15,723 1,15,741Ambala –– –– –– 1,82,886 1,96,794 1,56,100 3,16,576 1,04,768 1,26,387Oil Seeds—
Delhi 3,446 233 135 24 — — 89 — —Ferozepore 1,401 1,217 1,864 218 42 26 283 — —Ambala –– –– –– 583 — — 88 — —Sugar—
Delhi 4,768 3,271 4,964 7,080 1,175 6,519 3,961 337 751Ferozepore 1 5 99 –– — 67 5 — —Ambala –– –– –– 560 18 1,137 590 --- —
Source :—General Manager (Statistics), Northern Railway, New Delhi.

497
SECTION XXII MARKETING AND STORAGE
This section provides data on Principal Agricultural Markets, Sub-yards, capacity of State owned storages, procurement of important crops and arrival of agricultural produce in Haryana State. The information has been collected from Food and Supplies Department, Haryana and Haryana State Agricultural Marketing Board.
Table 22.1–– Gives the names of Principal Agricultural Markets in Haryana.
Table 22.2–– Shows the Districtwise number of markets in Haryana.
Table 22.3–– Shows market arrivals of agricultural produce.
Table 22.4–– Shows Capacity of State owned storages in Haryana.
Table 22.5–– Gives information on Districtwise capacity of State owned Warehouses in Haryana.
Table 22.6–– Gives information about the Districtwise number of cold storages with their capacity.
Table 22.7–– Presents data in respect of procurement of Wheat and Paddy in Haryana.
Table 22.8–– Gives information on Districtwise procurement of Wheat and Paddy by agencies in Haryana.

498

499
MARKETING AND STORAGE
Principal Agricultural Markets in Haryana (As on 31st March, 2011) No. 22.1
District Name of Market 1 2
Ambala 1. Ambala City 5. Mullana
2. Ambala Cantt. 6. Naraingarh
3. Barara 7. Shahzadpur
4. Naneola
Panchkula 1. Panchkula 3. Barwala
2. Raipur Rani
Yamunanagar 1. Jagadhri 5. Mustafabad
2. Yamunanagar 6. Radaur
3. Chhachhrauli 7. Bilaspur
4. Sadaura
Kurukshetra 1. Thanesar 5. Pehowa
2. Pipli 6. Ladwa
3. Ismailabad 7. Babain
4. Shahbad
Kaithal 1. Kaithal 5. Sewan
2. Cheeka 6. Kalayat
3. Fatehpur Pundri 7. Pai
4. Dhand
Karnal 1. Karnal 6. Nissing
2. Kunjpura 7. Gharaunda
3. Nilokheri 8. Nigdhu
4. Taraori 9. Jundla
5. Indri 10. Assandh
Panipat 1. Panipat 4. Madlauda
2. Israna 5. Bapauli
3. Samalkha
Sonipat 1. Sonipat 3. Gohana
2. Ganaur

500
MARKETING AND STORAGE Principal Agricultural Markets in Haryana (As on 31st March, 2011)
No. 22.1 (Concld.) District Name of Market
1 2 Rohtak 1. Rohtak 3. Sampla
2. Maham Jhajjar 1. Bahadurgarh 2. Jhajjar Faridabad 1. Faridabad 2. Ballabgarh Palwal 1. Hodal 3 Hassanpur 2. Palwal 4 Hathin Gurgaon 1. Gurgaon 3. Pataudi 2. Farukh.Nagar 4. Sohna Mewat 1. Nuh 3. Taoru 2. Punhana 4. Ferozepur Jhirka Rewari 1. Rewari 2. Kosli Mahendragarh 1. Narnaul 3. Kanina 2. Ateli 4. Mahendragarh Bhiwani 1. Bhiwani 5. Tosham 2. Charkhi Dadri 6. Behal 3. Loharu 7. Siwani 4. Jui Jind 1. Jind 4. Safidon 2. Julana 5. Uchana 3. Pilukhera 6. Narwana Hisar 1. Hisar 4. Uklana 2. Hansi 5. Barwala 3. Adampur 6. Narnaund Fatehabad 1. Fatehabad 5. Tohana 2. Bhattu Kalan 6. Dharsul 3. Ratia 7. Bhuna 4. Jakhal Sirsa 1. Sirsa 4. Kalanwali 2. Rania 5. Dabwali 3. Ellenabad 6. Ding Total 106
Source :—Haryana State Agricultural Marketing Board.

501
MARKETING AND STORAGE Districtwise Number of Markets in Haryana
No. 22.2 District Number of regulated
markets Number of Sub-
yards
Average number of villages*served per regulated market
Average area* served per regulated market
(Sq. Kms.) 2009-10 2010-11 2009-10 2010-11 2009-10 2010-11 2009-10 2010-11 1 2 3 4 5 6 7 8 9
Ambala 7 7 9 9 69 69 225 225Panchkula 3 3 3 3 75 75 299 299 Yamunanagar 7 7 10 10 88 88 253 253Kurukshetra 7 7 13 13 58 58 219 219Kaithal 7 7 16 16 39 39 331 331Karnal 10 10 8 8 42 42 254 254Panipat 5 5 4 4 36 36 254 254Sonipat 3 3 9 9 107 107 707 707Rohtak 3 3 4 4 49 49 582 582Jhajjar 2 2 3 3 126 126 917 917Faridabad 6 2 4 3 69 69 358 358Palwal - 4 - 1 ** ** ** **Gurgaon 4 4 4 4 88 88 346 346Mewat 4 4 3 3 ** ** ** **Rewari 2 2 6 6 200 200 791 791Mahendragarh 4 4 8 8 92 92 465 465Bhiwani 7 7 9 9 63 63 683 683Jind 6 6 10 10 51 51 450 450Hisar 6 6 22 22 45 45 664 664Fatehabad 7 7 15 15 35 35 360 360Sirsa 6 6 18 18 54 54 713 713Total : 106 106 178 178 64 64 417 417
Source :—Haryana State Agricultural Marketing Board. * Based on 2001 Census. **Information included in the old districts
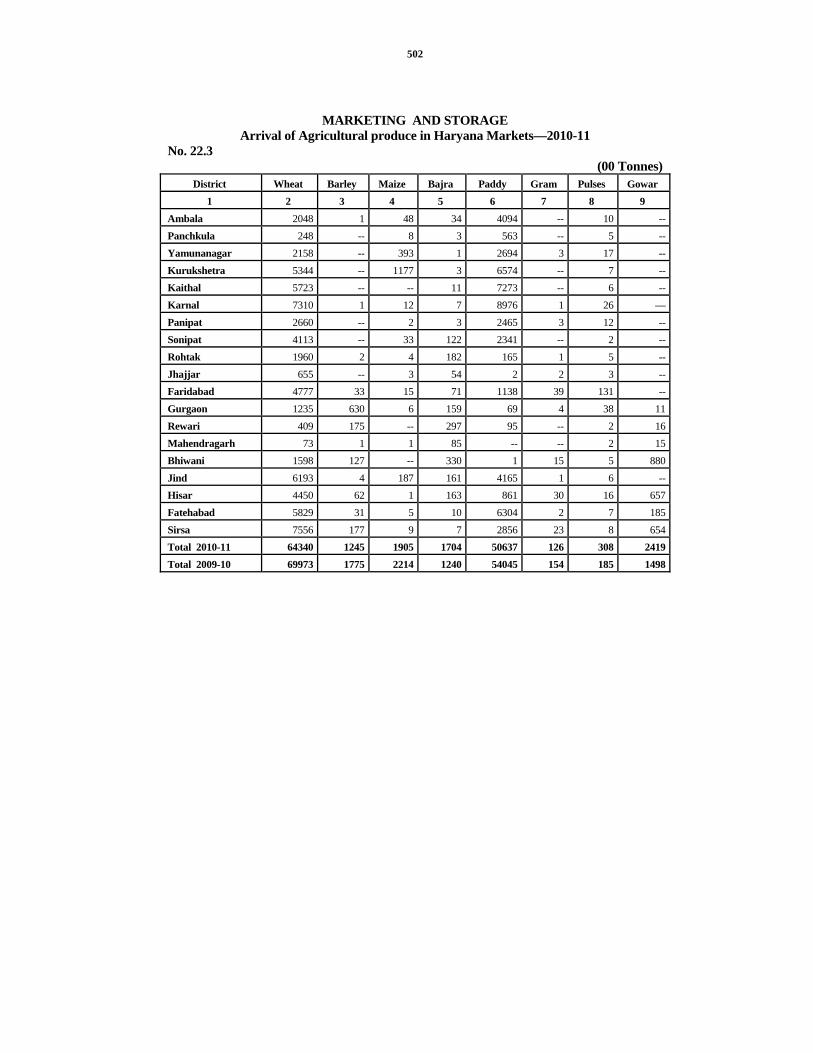
502
MARKETING AND STORAGE Arrival of Agricultural produce in Haryana Markets—2010-11
No. 22.3 (00 Tonnes)
District Wheat Barley Maize Bajra Paddy Gram Pulses Gowar 1 2 3 4 5 6 7 8 9
Ambala 2048 1 48 34 4094 -- 10 --Panchkula 248 -- 8 3 563 -- 5 --Yamunanagar 2158 -- 393 1 2694 3 17 --Kurukshetra 5344 -- 1177 3 6574 -- 7 --Kaithal 5723 -- -- 11 7273 -- 6 --Karnal 7310 1 12 7 8976 1 26 —Panipat 2660 -- 2 3 2465 3 12 --Sonipat 4113 -- 33 122 2341 -- 2 --Rohtak 1960 2 4 182 165 1 5 --Jhajjar 655 -- 3 54 2 2 3 --Faridabad 4777 33 15 71 1138 39 131 --Gurgaon 1235 630 6 159 69 4 38 11Rewari 409 175 -- 297 95 -- 2 16Mahendragarh 73 1 1 85 -- -- 2 15Bhiwani 1598 127 -- 330 1 15 5 880Jind 6193 4 187 161 4165 1 6 --Hisar 4450 62 1 163 861 30 16 657Fatehabad 5829 31 5 10 6304 2 7 185Sirsa 7556 177 9 7 2856 23 8 654Total 2010-11 64340 1245 1905 1704 50637 126 308 2419Total 2009-10 69973 1775 2214 1240 54045 154 185 1498

503
MARKETING AND STORAGE Arrival of Agricultural produce in Haryana Markets—2010-11
No. 22.3 (Contd.) (00 Tonnes)
District Oil Seeds Sunflower Cotton seed Cotton Onion Vegetables and fruits
1 10 11 12 13 14 15 Ambala 27 33 -- -- 134 574 Panchkula 1 11 -- -- 11 51 Yamunanagar 2 4 -- 1 67 558 Kurukshetra 15 139 -- -- 99 545 Kaithal -- 4 1 46 43 272 Karnal 14 -- -- -- 103 550 Panipat 2 -- -- -- 99 817 Sonipat 4 -- 2 -- 74 633 Rohtak 25 -- 10 56 52 440 Jhajjar 17 -- 3 -- 19 262 Faridabad 32 -- -- 1 187 1357 Gurgaon 141 -- 9 -- 280 1457 Rewari 288 -- 14 -- 24 346 Mahendragarh 186 -- 9 -- 19 207 Bhiwani 126 -- 14 44 36 322 Jind 27 -- 18 569 58 521 Hisar 802 -- 42 919 70 694 Fatehabad 56 -- 5 730 36 367 Sirsa 131 -- -- 1893 66 412 Total 2010-11 1897 190 127 4261 1476 10387 Total 2009-10 1600 298 88 3257 1432 9426

504
MARKETING AND STORAGE Arrival of Agricultural produce in Haryana Markets—2010-11
No. 22.3 (Concld.) (00 Tonnes)
District Chillies Gur/Shakkar, Kandsari
Ground Nut Potato Others Total
1 16 17 18 19 20 21 Ambala — 4 — 251 514 7772 Panchkula -- 1 -- 22 7 931 Yamunanagar -- 126 1 197 356 6578 Kurukshetra 1 6 2 441 204 14557 Kaithal -- 7 1 114 123 13624 Karnal -- 13 -- 219 149 17381 Panipat -- 53 -- 270 60 6446 Sonipat -- 7 3 207 85 7626 Rohtak 1 10 1 168 273 3355 Jhajjar -- 5 1 143 16 1185 Faridabad 4 27 17 728 486 9043 Gurgaon 1 29 1 787 181 5038 Rewari -- 17 -- 90 26 1799 Mahendragarh -- 5 -- 83 39 725 Bhiwani -- 10 1 105 185 3799 Jind -- 11 5 150 19 12095 Hisar 1 19 51 208 205 9251 Fatehabad 1 20 3 131 138 13860 Sirsa 1 46 3 150 147 14139 Total 2010-11 10 415 90 4463 3203 149203 Total 2009-10 11 443 97 3710 3230 154676
Source : Haryana State Agricultural Marketing Board Note : Total may not tally due to rounding off.

505
MARKETING AND STORAGE Capacity of State owned Storages in Haryana
No. 22.4 (000 Tonnes)
Name of Agency 1966-67 1967-68 1970-71 1980-81 1985-86 1990-91 1 2 3 4 5 6 7
1. Food Corporation of India— (a) Owned — — 1,15 3,50 6,62 7,34(b) Agriculture Refinance Development Corporation
— — — 5,62 5,32 3,33
2. Food and Supplies Department 31 31 36 1,53 1,66 1,66
3. Confed — — — — — —
4. Hafed — — 1,74 2,75 2,90
5. State Warehousing Corporation — 7 13 1,84 3,66 5,56
6. Central Warehousing Corporation — — 15 79 1,06 1,34
7. A.R.D.C. (with HWC) — — — 1,85 2,55 70
8. Food & Supplies (Bins) — — — –– –– —
9. Haryana Agro Industries Corporation — — — — — —
10. Others (Marketing Board) — — — –– –– 3,78Total : 31 38 1,79 16,87 23,62 26,61
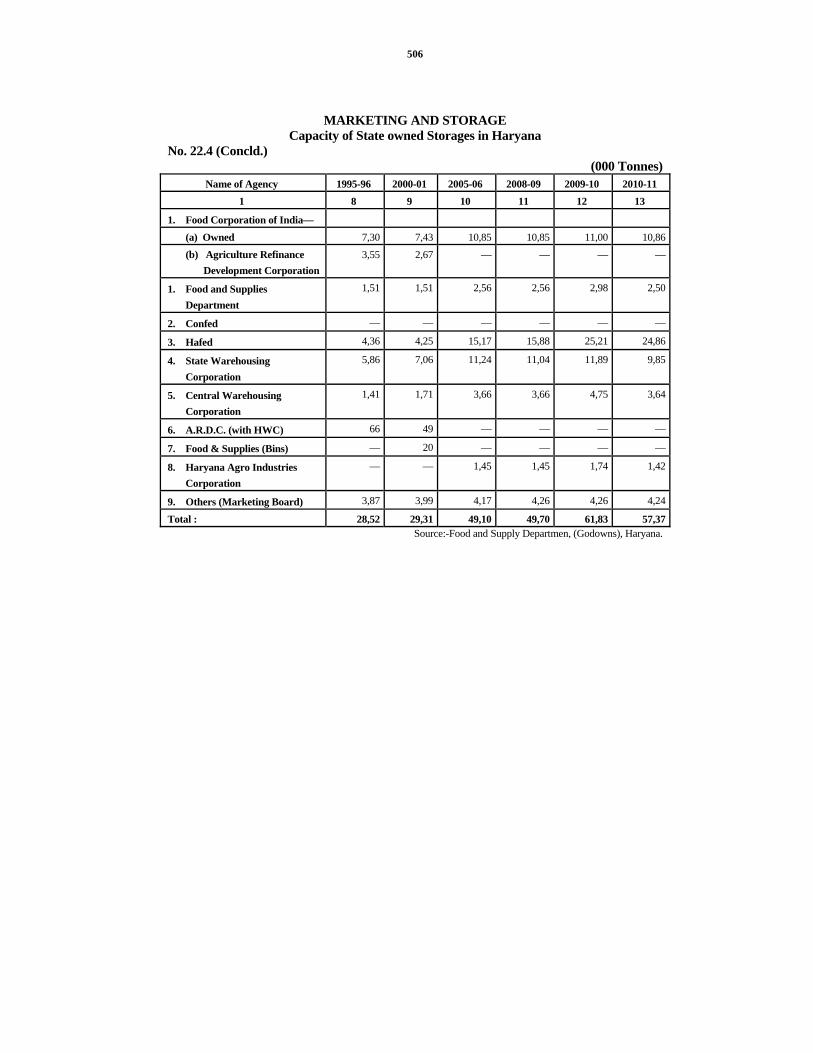
506
MARKETING AND STORAGE Capacity of State owned Storages in Haryana
No. 22.4 (Concld.) (000 Tonnes)
Name of Agency 1995-96 2000-01 2005-06 2008-09 2009-10 2010-11 1 8 9 10 11 12 13
1. Food Corporation of India—
(a) Owned 7,30 7,43 10,85 10,85 11,00 10,86(b) Agriculture Refinance
Development Corporation 3,55 2,67 — — — —
1. Food and Supplies Department
1,51 1,51 2,56 2,56 2,98 2,50
2. Confed — — — — — —
3. Hafed 4,36 4,25 15,17 15,88 25,21 24,86
4. State Warehousing Corporation
5,86 7,06 11,24 11,04 11,89 9,85
5. Central Warehousing Corporation
1,41 1,71 3,66 3,66 4,75 3,64
6. A.R.D.C. (with HWC) 66 49 — — — —
7. Food & Supplies (Bins) — 20 — — — —
8. Haryana Agro Industries Corporation
— — 1,45 1,45 1,74 1,42
9. Others (Marketing Board) 3,87 3,99 4,17 4,26 4,26 4,24
Total : 28,52 29,31 49,10 49,70 61,83 57,37Source:-Food and Supply Departmen, (Godowns), Haryana.
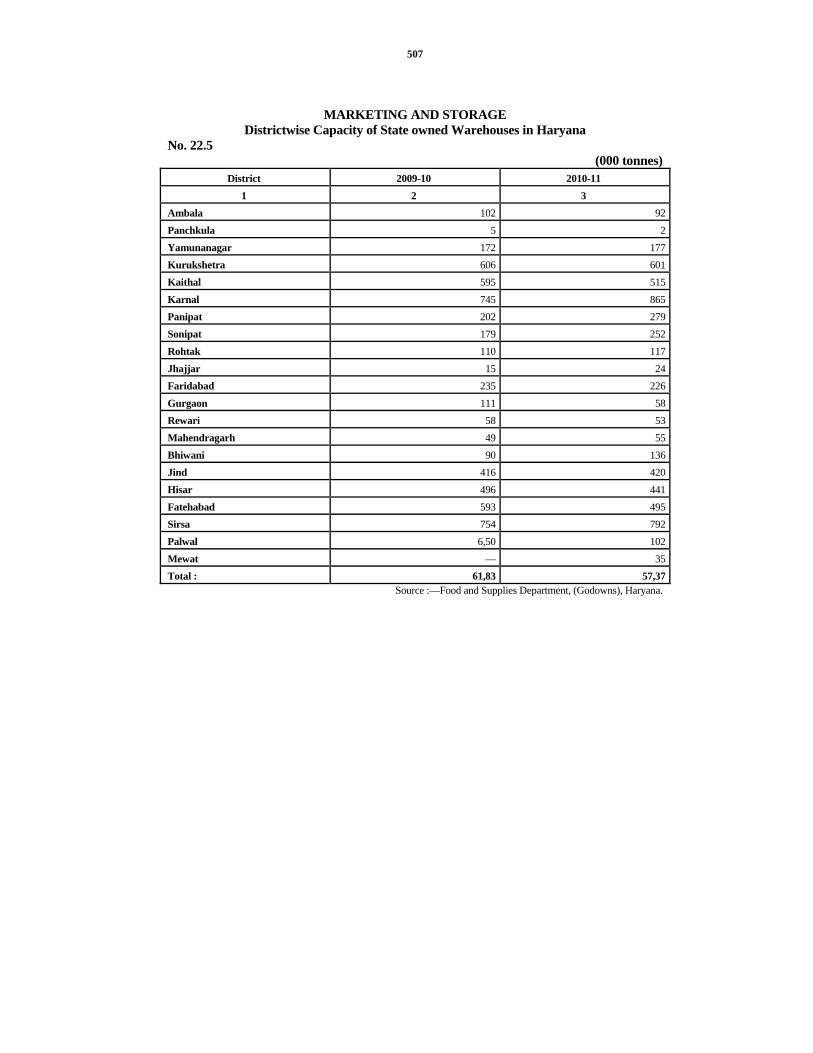
507
MARKETING AND STORAGE Districtwise Capacity of State owned Warehouses in Haryana
No. 22.5 (000 tonnes)
District 2009-10 2010-11 1 2 3
Ambala 102 92Panchkula 5 2Yamunanagar 172 177Kurukshetra 606 601Kaithal 595 515Karnal 745 865Panipat 202 279Sonipat 179 252Rohtak 110 117Jhajjar 15 24Faridabad 235 226Gurgaon 111 58Rewari 58 53Mahendragarh 49 55Bhiwani 90 136Jind 416 420Hisar 496 441Fatehabad 593 495Sirsa 754 792Palwal 6,50 102Mewat — 35Total : 61,83 57,37
Source :—Food and Supplies Department, (Godowns), Haryana.

508
MARKETING AND STORAGE Districtwise number of cold storages with capacity in Haryana
No. 22.6 Year/District No. of Cold Storages Capacity (000 tonnes)
1 2 3 1975-76 72 1,061980-81 127 1,571985-86 138 1,771990-91 154 1,951995-96 169 2,201996-97 176 2,331997-98 195 2,621998-99 198 2,67 Ambala 22 30Panchkula 3 2Yamunanagar 23 29Kurukshetra 51 80Kaithal 6 7Karnal 27 29Panipat 5 6Sonipat 29 48Rohtak 3 3Jhajjar — —Faridabad 3 3Gurgaon 3 1Rewari — —Mahendragarh — —Bhiwani — —Jind 7 8Hisar 6 9Fatehabad 6 10Sirsa 4 2
Source :—Agriculture Department, Haryana.
Note :—The information for the year 1999-2000 onward is not available due to repeal of cold storage Order 1979 w.e.f.
18-5-1999.

509
MARKETING AND STORAGE Procurement of Wheat and Paddy in Haryana
No. 22.7 (000 Tonnes)
Wheat Paddy District
2007-08 2008-09 2009-10 2010-11 2007-08 2008-09 2009-10 2010-11 1 2 3 4 5 6 7 8 9Ambala 75 1,62 1,78 2,05 241 267 381 382Panchkula 5 20 22 22 43 42 57 65Yamunanagar 79 1,31 1,92 2,14 139 166 312 254Kurukshetra 2,34 4,62 5,10 5,32 514 521 783 572Kaithal 3,66 5,46 6,15 5,71 33 52 275 282Karnal 4,01 6,01 7,19 7,30 292 267 428 417Panipat 1,26 2,10 2,91 2,66 9 3 16 9Sonipat 67 194 401 3,47 — 1 1 1Rohtak 45 1,09 2,13 1,95 — — — —Jhajjar 3 28 69 70 — — — —Faridabad 39 2,76 92 94 7 2 — 1Palwal — — 3,90 3,81 — — 29 46Mewat 10 70 63 75 — — — —Gurgaon 5 40 46 46 — — — —Rewari 7 37 38 34 — — — —Mahendragarh 6 17 19 7 — — — —Bhiwani 25 81 1,40 1,42 — — — —Jind 4,22 5,32 6,88 6,17 87 66 71 72Hisar 2,78 3,50 5,42 4,51 9 10 11 11Fatehabad 5,01 5,90 7,32 5,95 386 376 400 478Sirsa 6,56 7,81 9,64 7,53 25 49 52 48Total 33,50 52,37 69,24 63,47 1785 1822 2816 2638
Source . Food and Supplies Department, Haryana.

510
DISTRICTWISE PROCUREMENT OF WHEAT AND PADDY BY AGENCIES IN HARYANA

511
MARKETING AND STORAGE
Districtwise procurement of Wheat and Paddy by agencies in Haryana, 2010-11
No. 22.8 (In Tonnes)
Wheat District
State Govt. F.C.I. Hafed H.W.C. Agro Confed Total 1 2 3 4 5 6 7 8
Ambala 48069 24722 114474 -- -- 17420 204685Panchkula — — -- 5313 -- 16666 21979Yamunanagar 56581 12739 94773 12164 7411 30187 213855Kurukshetra 163980 105640 136301 10865 75032 40948 532766Kaithal 168928 129829 154044 18279 65331 35162 571573Karnal 238230 157139 189453 36502 99635 9021 729980Panipat 31355 32517 83269 58836 -- 59910 265887Sonipat 116355 47603 143070 8942 4739 26422 347131Rohtak 32242 67752 74035 21401 -- -- 195430Jhajjar 28185 17571 22121 1980 -- -- 69857Faridabad 44411 26911 17113 5683 -- -- 94118Palwal 96837 130517 65843 64900 -- 22551 380648Mewat — 18200 26694 14908 -- 15083 74885Gurgaon 9232 24534 -- 11971 — — 45737Rewari 11190 — 14110 8368 — — 33668Mahendragarh 2842 — 4080 — — — 6922Bhiwani 44798 11200 85562 — — — 141560Jind 153371 46247 209846 106542 43077 58110 617193Hisar 97556 31405 157196 40840 81057 42650 450704Fatehabad 164272 35684 199769 31065 136895 27638 595323Sirsa 162663 37325 299638 103989 46233 103654 753502Total 1671097 957535 2091391 562548 559410 505422 6347403

512
MARKETING AND STORAGE Districtwise procurement of Wheat and Paddy by agencies in Haryana, 2010-11
No. 22.8 (Concld.) (In Tonnes)
Paddy District State
Govt. F.C.I. Hafed Rice
Millers H.W.C. Agro Confed Total
1 9 10 11 12 13 14 15 16 Ambala 109113 — 186635 979 16445 — 68977 382149Panchkula — — 32414 444 — 31901 -- 64759Yamunanagar 81097 — 76621 1703 19928 40745 33503 253597Kurukshetra 249389 2334 153052 21552 45655 79941 19737 571660Kaithal 66490 8859 66553 77464 11003 27288 24255 281912Karnal 198012 1690 158560 14652 8379 29131 7140 417564Panipat — -- 4120 563 -- -- 3884 8567Sonipat — -- 786 -- -- -- -- 786Rohtak — 138 -- -- -- -- -- 138Jhajjar — — — — — — — —Faridabad — — — 833 — — — 833Palwal 5349 — 363 28647 8839 -- 3276 46474Mewat — — — 377 — — — 377Gurgaon — — — — — — — —Rewari — — — — — — — —Mahendragarh — — — — — — — —Bhiwani — — — — — — — —Jind 14159 4197 18765 364 358 34040 -- 71883Hisar — 967 3201 535 6783 — — 11486Fatehabad 187363 13216 192480 4880 26673 42898 10450 477960Sirsa 11063 -- 25899 3086 880 7259 -- 48187
Total 922035 31401 919449 156079 144943 293203 171222 2638332Source :—Food and Supplies Department, Haryana.

513
SECTION XXIII Tourism and Civil Aviation
This section gives information on Tourist Spots, Visitors, Flying Clubs and Planes in Haryana. The data have been collected from the Haryana Tourism Department and Civil Aviation Adviser, Haryana.
Table 23.1 shows the number of Tourist Spots and Visitors in Haryana.
Table 23.2 gives information about the number of Flying Clubs, Planes and persons trained in Haryana.

514

515
TOURISM AND CIVIL AVIATION Number of Tourist Spots and Tourists visited by districts in Haryana
No. 23.1 Number of Visitors
District/Year Number of Tourist Spots Foreigner Indian Total
1 2 3 4 5
1980-81 29 64,169 17,44,561 18,08,730
1985-86 31 84,516 22,48,867 23,33,383
1990-91 39 1,33,527 41,55,985 42,89,512
1995-96 45* 1,43,675 70,86,477 72,30,152
2000-01 47* 1,44,939 53,47,002 54,91,941
2005-06 44 73,401 65,19,652 65,93,053
2009-10 43 1,63,669 71,51,324 73,14,993
2010-11 43 1,30,423 68,25,459 69,55,882
Ambala 1 492 57,078 57,570
Panchkula 5 10,782 6,98,797 7,09,579
Yamunanagar 1 — 29,423 29,423
Kurukshetra 4 38,097 19,06,586 19,44,683
Kaithal 1 18 63,992 64,010
Karnal 3 12,081 10,35,929 10,48,010
Panipat 2 238 1,67,477 1,67,715
Sonipat 1 1,925 1,80,282 1,82,207
Rohtak 2 129 1,42,966 1,43,095
Jhajjar 1 409 79,004 79,413
Faridabad 8 62,254 16,85,186 17,47,440
Gurgaon 4 889 3,89,433 3,90,322
Rewari 2 2,915 1,27,356 1,30,271
Mahendragarh — — — —
Bhiwani 1 10 38,410 38,420
Jind 1 -- 33,268 33,268
Hisar 3 184 1,56,406 1,56,590
Sirsa 2 -- 25,157 25,157
Fatehabad 1 -- 8,709 8,709Source :—Haryana Tourism Department.
* Includes one Tourist Spot situated at Mussoorie.

516
TOURISM AND CIVIL AVIATION Number of Flying Clubs, Planes and persons trained in Haryana
No. 23.2 Number of Planes
Years Numbers of flying clubs In operation Not in operation Total
Number of persons trained
1 2 3 4 5 6
1966-67 2 6 2 8 21
1967-68 2 5 2 7 28
1970-71 2 7 9 16 53
1975-76 2 5 5 10 55
1980-81 2 6 1 7 52
1985-86 3 5 3 8 25
1990-91 3 7 4 11 66
1995-96 3 5 8 13 88
2000-01 3 6 6 12 19
2005-06 3 5 7 12 102
2007-08 3 7 4 11 73
2008-09 3 7 6 13 75
2009-10 3 8 5 13 69
2010-11 3 8 6 14 36Source :—Civil Aviation Adviser, Haryana.
517
SECTION XXIV LABOUR AND EMPLOYMENT
Data in respect of labour and its related activities has been given in this section. The information has been collected from Labour Commissioner, Haryana, Director of Employment, Haryana and Labour Bureau.
Table 24.1—Shows labour employed in shops, commercial establishments, hotels and restaurants.
Table 24.2—Average per capita annual money earnings of factory workers in India have been shown by States.
Tables 24.3 and 24.4—Industrial disputes affect labour and production. These data are collected by the State Labour Department under Industrial Disputes Act, 1947. Strike means work stoppage declared and organised by the workers and lock-out refers to work stoppage declared by employer generally after a strike. The number of workers involved means the actual number of workers affected either directly or indirectly in the dispute.
Table 24.5—Shows data regarding Trade Unions under the Trade Union Act, 1926.
Table 24.6—Shows classification of Trade Unions in Haryana according to membership.
Table 24.7—Shows registered trade unions affiliated to various parties in Haryana.
Table 24.8—Under Workmen’s Compensation Act, 1923, compensation is payable to workers employed in scheduled employment for injuries due to accidents resulting in death and disablement (permanent or temporary) and not caused through the fault of the worker himself.
Table 24.9—Shows wages paid to agricultural and skilled workers in certain selected villages of Haryana. The data are collected monthly and sent to Government of India.
Tables 24.10 and 24.11—Shows the data maintained in various employment exchanges in the State.
Table 24.12—Shows employment in the organised sector of Haryana.
Table 24.13—Shows estimated employment in Private and Public sectors in India. Act establishments are those which are covered by the Compulsory Notification of Vacancies Act, 1959. Others are non-Act establishments. Previously this classification used to be large and small establishments.

518
LABOUR AND EMPLOYMENT Number of Shops, Commercial Establishments, Hotels & Restaurants
and Persons Employed No:-24.1 (As on 31st December)
Shops Commercial Establishments
Hotels and Restaurants
Total Year/ District
Number of
Places Number Employees Number Employees Number Employees Number Employees 1 2 3 4 5 6 7 8 9 10
1966 42* 43,554 13,104 11,677 12,031 3,447 3,370 58,678 28,505 1970 46* 56,663 15,419 10,644 13,853 2,683 3,141 69,990 32,413 1980 72* 93,299 31,736 10,698 17,434 3,374 4,624 107,371 53,794 1985 79* 115,580 39,996 13,363 18,611 3,886 5,651 132,829 64,258 1990 90* 131,126 52,206 8,420 17,204 3,691 6,610 143,237 76,020 1995 90* 137,171 53,309 13,129 25,310 3,841 6,981 154,141 85,600 2000 91* 154,358 76,801 11,073 35,501 4,107 9,481 169,538 121,783 2005 * * 165,363 107,712 10,012 42,748 4,164 9,183 179,539 159,643 2009 * * 202,935 162,044 11,337 158,466 5,407 13,828 219,679 334,338 2010 * * 208,782 253,433 15,237 140,456 3,931 13,209 2,27,950 407,098 Ambala * * 38,775 28,646 3,011 4,317 823 2,049 42,609 35,012 Panchkula * * 8,814 7,037 2,640 2,890 160 1,050 11,614 10,977 Yamunanagar * * 25,671 10,435 346 1,483 341 684 26,358 12,602 Kurukshetra * * 8,888 3,579 429 2,415 245 691 9,562 6,685 Kaithal * * 6,388 3,225 136 1,239 79 199 6,603 4,663 Karnal * * 4,863 4,848 73 245 13 78 4,949 5,171 Panipat * * 14,366 11,774 473 4,331 196 728 15,035 16,833 Sonipat * * 10,000 3,446 55 237 15 77 10,070 3,760 Rohtak * * 11,307 7,768 -- -- 66 422 11,373 8,190 Jhajjar * * 4,124 4,679 -- -- 51 203 4,175 4,882 Faridabad * * 6,218 11,757 3,920 10,781 91 616 10,229 23,154 Palwal * * 3,859 2,371 1 32 -- -- 3,860 2,403 Gurgaon * * 6,937 1,23,069 1,182 106,344 177 3,661 8,296 233,074 Mewat * * 118 332 -- -- 2 296 120 628 Rewari * * 943 2,073 45 540 -- -- 988 2,613 Mahendragarh * * 268 275 6 58 2 5 276 338 Bhiwani * * 10,123 4,424 197 1,574 595 388 10,915 6,386 Jind * * 3,520 2,162 76 203 121 299 3,717 2,664 Hisar * * 25,329 14,683 1,165 1,136 471 633 26,965 16,452 Fatehabad * * 1,537 768 -- -- -- -- 1,537 768 Sirsa * * 16,734 6,082 1,482 2,631 483 1,130 18,699 9,843
Source :—Labour Commissioner, Haryana Note :—Above figures include cinemas/theatres also. * Covered under Punjab Shops and Commercial Establishments Act. 1958. ** Shop Act
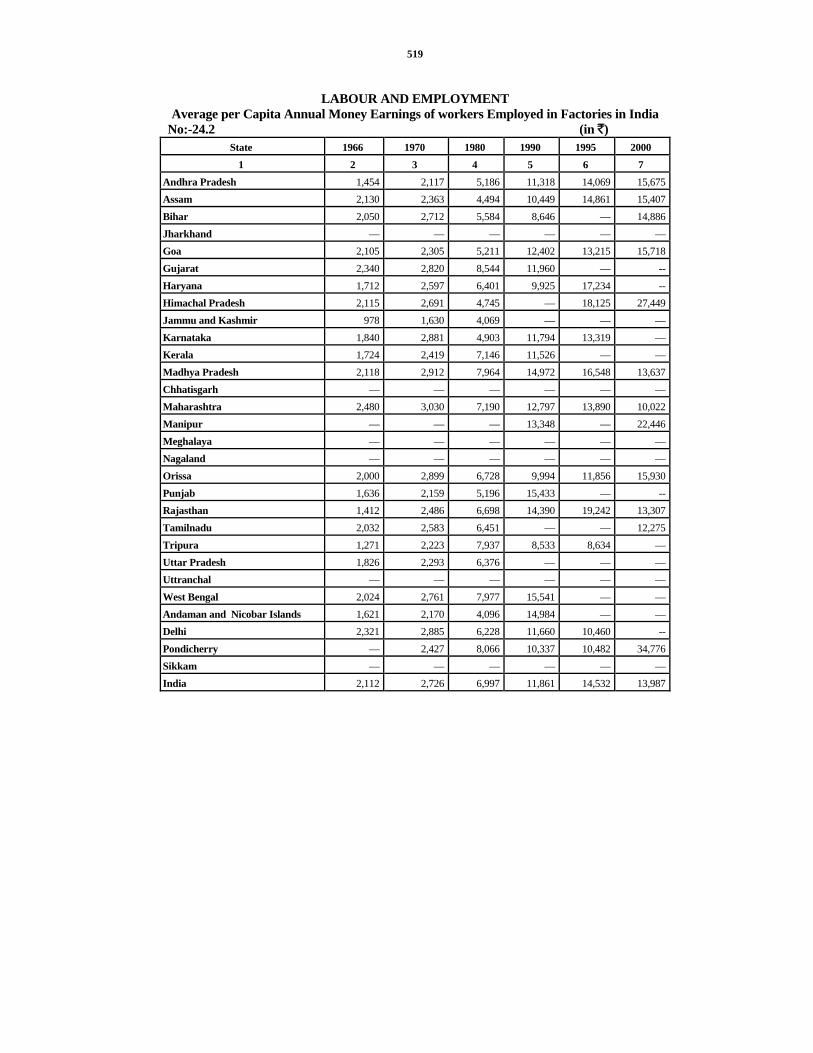
519
LABOUR AND EMPLOYMENT
Average per Capita Annual Money Earnings of workers Employed in Factories in India No:-24.2 (in `)
State 1966 1970 1980 1990 1995 2000 1 2 3 4 5 6 7
Andhra Pradesh 1,454 2,117 5,186 11,318 14,069 15,675Assam 2,130 2,363 4,494 10,449 14,861 15,407Bihar 2,050 2,712 5,584 8,646 — 14,886Jharkhand — — — — — —Goa 2,105 2,305 5,211 12,402 13,215 15,718Gujarat 2,340 2,820 8,544 11,960 — --Haryana 1,712 2,597 6,401 9,925 17,234 --Himachal Pradesh 2,115 2,691 4,745 — 18,125 27,449Jammu and Kashmir 978 1,630 4,069 — — —Karnataka 1,840 2,881 4,903 11,794 13,319 —Kerala 1,724 2,419 7,146 11,526 — —Madhya Pradesh 2,118 2,912 7,964 14,972 16,548 13,637Chhatisgarh — — — — — —Maharashtra 2,480 3,030 7,190 12,797 13,890 10,022Manipur — — — 13,348 — 22,446Meghalaya — — — — — —Nagaland — — — — — —Orissa 2,000 2,899 6,728 9,994 11,856 15,930Punjab 1,636 2,159 5,196 15,433 — --Rajasthan 1,412 2,486 6,698 14,390 19,242 13,307Tamilnadu 2,032 2,583 6,451 — — 12,275Tripura 1,271 2,223 7,937 8,533 8,634 —Uttar Pradesh 1,826 2,293 6,376 — — —Uttranchal — — — — — —West Bengal 2,024 2,761 7,977 15,541 — —Andaman and Nicobar Islands 1,621 2,170 4,096 14,984 — —Delhi 2,321 2,885 6,228 11,660 10,460 --Pondicherry — 2,427 8,066 10,337 10,482 34,776Sikkam — — — — — —India 2,112 2,726 6,997 11,861 14,532 13,987

520
LABOUR AND EMPLOYMENT Average per Capita Annual Money Earnings of workers Employed in Factories in India
No:-24.2 (Concld.) (in `) State 2004 2005 2007 2008
1 8 9 10 11 Andhra Pradesh 11,979 12,278 50,412 65,928 Assam 13,463 — .. .. Bihar — — .. .. Jharkhand 18,252 18,154 39,681 .. Goa 49,921 37,207 49,382 .. Gujarat @ @ .. .. Haryana @ @ .. .. Himachal Pradesh @ @ 39,251 51,393 Jammu and Kashmir — — .. .. Karnataka @ @ .. .. Kerala @ @ 24,541 24,882 Madhya Pradesh @ @ .. .. Chhatisgarh — — .. .. Maharashtra 11,385 12,484 .. .. Manipur 19,113 — 38,766 .. Meghalaya — — .. .. Nagaland — — .. .. Orissa 13,933 14,488 47,129 44,976 Punjab @ @ 66,740 67,514 Rajasthan 15,844 19,587 .. .. Tamilnadu — — .. .. Tripura 12,146 7,657 .. .. Uttar Pradesh — — 48,997 .. Uttranchal — — .. .. West Bengal — — .. .. Andaman and Nicobar Islands
@ @ .. ..
Delhi @ @ .. .. Pondicherry — — .. 74,843 Sikkam — — .. .. India 16,189 15,833* 47,989 64,124
Source :—Labour Bureau, Chandigarh. Note —Static which were out of the purview of the Payment of Wages Act, 1936 for the yeart 2005. Arunachal
Pradesh, Delhi, Gujarat, Haryana, Himachal Pradesh, Karnataka, Kerla, Madhya Pradesh, Mizoram, Punjab, A& N Islands, Chandigarh and Lakshadweep.
* The Per Capita Average Annual Earnings under payment of Wages Act, 1936 for the year 2005 is worked out on the basis of workers earning less then `. 1600/-

521
LABOUR AND EMPLOYMENT
Number of Industrial Disputes in Haryana No. 24.3 (As on 31st December)
Year/District Number of Disputes Number of strikes and lock-outs
Number of workers involved in strikes
Number of man-days lost
1 2 3 4 5 1966 757 34 8,715 122,641 1970 1,390 58 11,801 142,871 1980 3,495 72 15,862 407,882 1985 5,134 36 8,964 181,268 1990 5,751 56 15,462 446,599 1995 5,295 54 18,864 373,540 2000 8,798 54 18,534 1,163,197 2005 5,693 19 20,662 588,138 2009 5,880 9 4,869 194,496 2010 4,397 11 2,735 141,961 Ambala 89 — — — Panchkula 73 — — — Yamunanagar 88 — — — Kurukshetra 25 — — — Kaithal 19 — — — Karnal 51 — — — Panipat 167 — — — Sonipat 84 — — — Rohtak 93 — — — Jhajjar 163 — — — Faridabad 1,625 6 1,162 61,949 Palwal 170 — — — Gurgaon 1,351 5 1,573 80,012 Mewat 2 — — — Rewari 203 — — — Mahendragarh — — — — Bhiwani 67 — — — Jind 10 — — — Hisar 39 — — — Fatehabad — — — — Sirsa 78 — — —
Source :—Labour Commissioner, Haryana.

522
LABOUR AND EMPLOYMENT
Industrial Disputes Resulting in Strikes and Lock-outs by Causes No:-24.4 (As on 31st December)
Year/District Wages and Allowances
Bonus Reinstatement of terminated/
suspended Workers
Leave and
hours of work
Retrenchment Others Total
1 2 3 4 5 6 7 8 1966 6 4 11 2 2 9 341970 25 11 –– –– 6 16 581980 18 9 33 –– –– 12 721985 5 3 18 –– –– 10 361990 4 4 19 –– –– 29 561995 25 3 14 4 2 6 542000 5 5 18 1 2 23 542005 5 3 8 2 — 1 192009 — — 1 — 6 2 92010 4 — 3 — -- 4 11Ambala — — — — — — —Panchkula — — — — — — —Yamunanagar — — — — — — —Kurukshetra — — — — — — —Kaithal — — — — — — —Karnal — — — — — — —Panipat — — — — — — —Sonipat — — — — — — —Rohtak — — — — — — —Jhajjar — — — — — — —Faridabad 4 — 2 — -- — 6Palwal — — — — — — —Gurgaon — — 1 — — 4 5Mewat — — — — — — —Rewari — — — — — — —Mahendragarh — — — — — — —Bhiwani — — — — — — —Jind — — — — — — —Hisar — — — — — — —Fatehabad — — — — — — —Sirsa — — — — — — —
Source :—Labour Commissioner, Haryana.

523
LABOUR AND EMPLOYMENT Trade Unions under the Trade Union Act, 1926 in Haryana
No:-24.5 (As on 31st December) Year/District Total
Number of Unions
standing registered
Number* of Unions which
submitted returns
Number* of members
Opening* Balance (`)
Income* (`) Expenditure* (`)
Closing* Balance (`)
1 2 3 4 5 6 7 8 1966 282 138 33,737 66,357 235,816 219,097 83,076 1970 424 223 87,227 136,673 406,581 365,925 177,329 1980 613 235 188,955 576,914 1,337,858 1,141,751 773,021 1985 920 319 214,905 1,132,476 2,047,659 1,883,687 1,296,448 1990 1,085 317 268,440 5,138,089 4,818,903 3,791,321 6,165,671 1995 1,036 280 200,209 3,189,307 4,295,705 4,304,096 3,180,916 2000 1,309 308 288,658 10,356,809 21,075,292 17,757,023 13,675,078 2005 1,469 364 310,490 21,152,011 18,769,290 15,377,105 24,544,196 2009 1,523 334 315,957 18,136,377 17,536,962 14,730,220 20,943,119 2010 1,544 270 363,637 27,259,193 21,432,565 15,296,012 33,395,746 Ambala 107 23 62,650 267,208 3,307,392 2,987,704 586,896 Panchkula 62 9 13,167 479,209 1,376,388 1,399,099 456,498 Yamunanagar 121 14 13,310 75,250 1,191,290 1,143,142 123,398 Kurukshetra 56 7 1,099 8,058 131,892 56,374 83,576 Kaithal 25 5 1,265 52,450 246,862 225,127 74,185 Karnal 77 26 22,809 106,125 1,761,374 1,683,041 184,458 Panipat 86 27 13,079 1,693,808 1,309,824 706,681 2,296,951 Sonipat 78 22 10,370 4,317,724 3,631,650 598,208 7,351,166 Rohtak 52 6 25,413 126,991 222,505 243,851 105,645 Jhajjar 37 9 4,733 115,470 203,280 197,217 121,533 Faridabad 365 49 32,870 94,99,743 1,372,227 609,659 10,262,311 Palwal — — — — — — — Gurgaon 232 41 13,608 4,935,769 2,383,694 1,508,044 5,811,419 Mewat 1 — 1 — — — — Rewari 45 7 2,597 1,234,351 553,977 355,588 1,432,740 Mahendragarh 10 1 228 -- 55,440 38,045 17,395 Bhiwani 51 11 61,065 3,421,010 1,584,055 1,573,484 3,431,581 Jind 25 2 760 200 56,200 51,850 4,550 Hisar 74 7 82,632 918,575 18,34,735 1,713,843 1,039,467 Fatehabad 7 3 1,652 3,062 190,040 184,685 8,417 Sirsa 33 1 329 4,190 19,740 20,370 3,560
Source :—Labour Commissioner, Haryana. * Based on the returns received.

524
LABOUR AND EMPLOYMENT
Classification of Trade Unions according to membership, 2008 and 2009 No:-24.6
2009 2010 Group of Members Number of Trade Unions
submitting returns Membership Number of Trade
Unions submitting returns
Membership
1 2 3 4 5 Below 50 40 1,346 35 950 50 or above but below 100 44 3,652 40 3,399 100 or above but below 300 121 20,869 90 18,041 300 or above but below 500 46 17,416 41 15,467 500 or above but below 1000 46 30,761 32 29,334 1000 or above but below 2000 15 18,700 12 22,280 2000 or above but below 5000 9 23,143 10 37,765 5000 and above 13 200,070 10 236,401 Total 334 315,957 270 363,637
Source :—Labour Commissioner, Haryana.

525
LABOUR AND EMPLOYMENT Party Affiliation of Registered Trade Unions in Haryana—2009 and 2010
No:-24.7 (As on 31st December) 2009 2010 Name of Central organisation with
which the union is affiliated Number of Unions submitting returns
Membership Number of Unions submitting returns
Membership
1 2 3 4 5 B.M.S. 125 106,112 108 84,324 A.I.T.U.C. 38 12,755 20 7,270 N.L.O. — — — — I.N.T.U.C. 44 36,884 34 50,209 C.I.T.U. 43 81,130 39 89,978 H.M.P. — — — — H.M.S. 16 6,865 21 13,231 U.T.U.C. — — — — U.T.U.C. (L&S) 13 37,119 13 41,073 Lok Dal — — — — Others 55 35,092 35 77,552 Total 334 315,957 270 363,637
Source :—Labour Commissioner, Haryana.
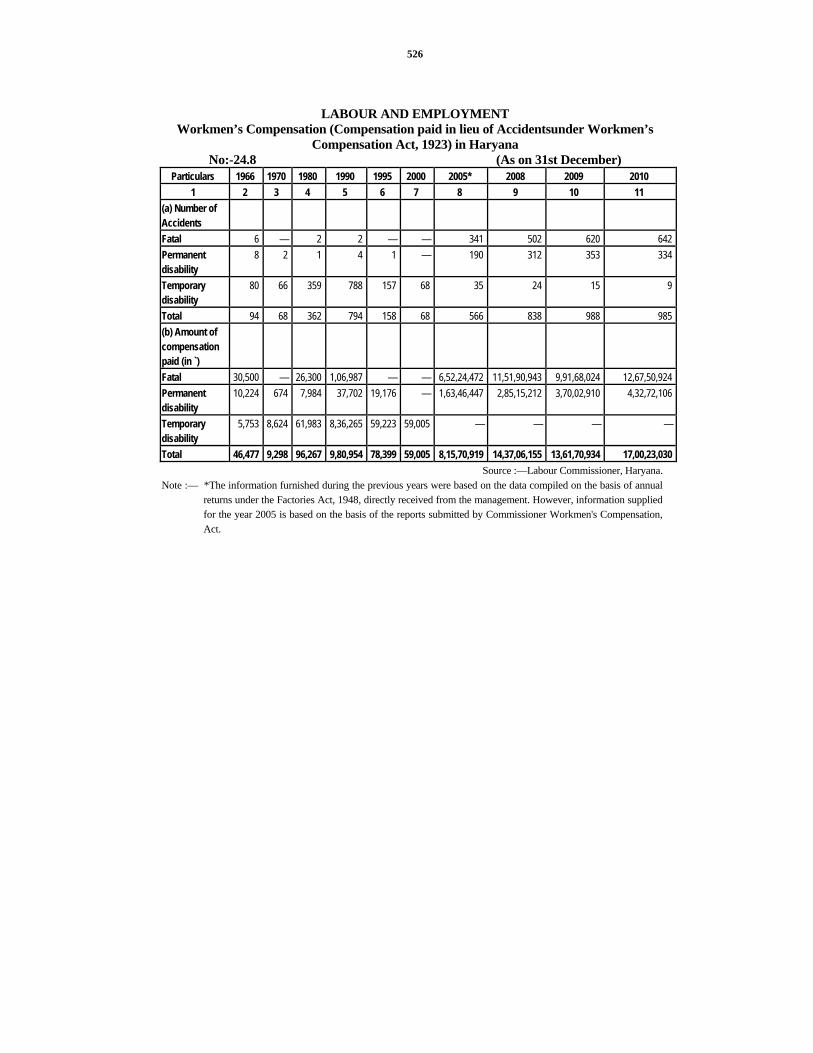
526
LABOUR AND EMPLOYMENT Workmen’s Compensation (Compensation paid in lieu of Accidentsunder Workmen’s
Compensation Act, 1923) in Haryana No:-24.8 (As on 31st December)
Particulars 1966 1970 1980 1990 1995 2000 2005* 2008 2009 2010 1 2 3 4 5 6 7 8 9 10 11
(a) Number of Accidents
Fatal 6 — 2 2 — — 341 502 620 642 Permanent disability
8 2 1 4 1 — 190 312 353 334
Temporary disability
80 66 359 788 157 68 35 24 15 9
Total 94 68 362 794 158 68 566 838 988 985 (b) Amount of compensation paid (in `)
Fatal 30,500 — 26,300 1,06,987 — — 6,52,24,472 11,51,90,943 9,91,68,024 12,67,50,924 Permanent disability
10,224 674 7,984 37,702 19,176 — 1,63,46,447 2,85,15,212 3,70,02,910 4,32,72,106
Temporary disability
5,753 8,624 61,983 8,36,265 59,223 59,005 — — — —
Total 46,477 9,298 96,267 9,80,954 78,399 59,005 8,15,70,919 14,37,06,155 13,61,70,934 17,00,23,030 Source :—Labour Commissioner, Haryana.
Note :— *The information furnished during the previous years were based on the data compiled on the basis of annual returns under the Factories Act, 1948, directly received from the management. However, information supplied for the year 2005 is based on the basis of the reports submitted by Commissioner Workmen's Compensation, Act.
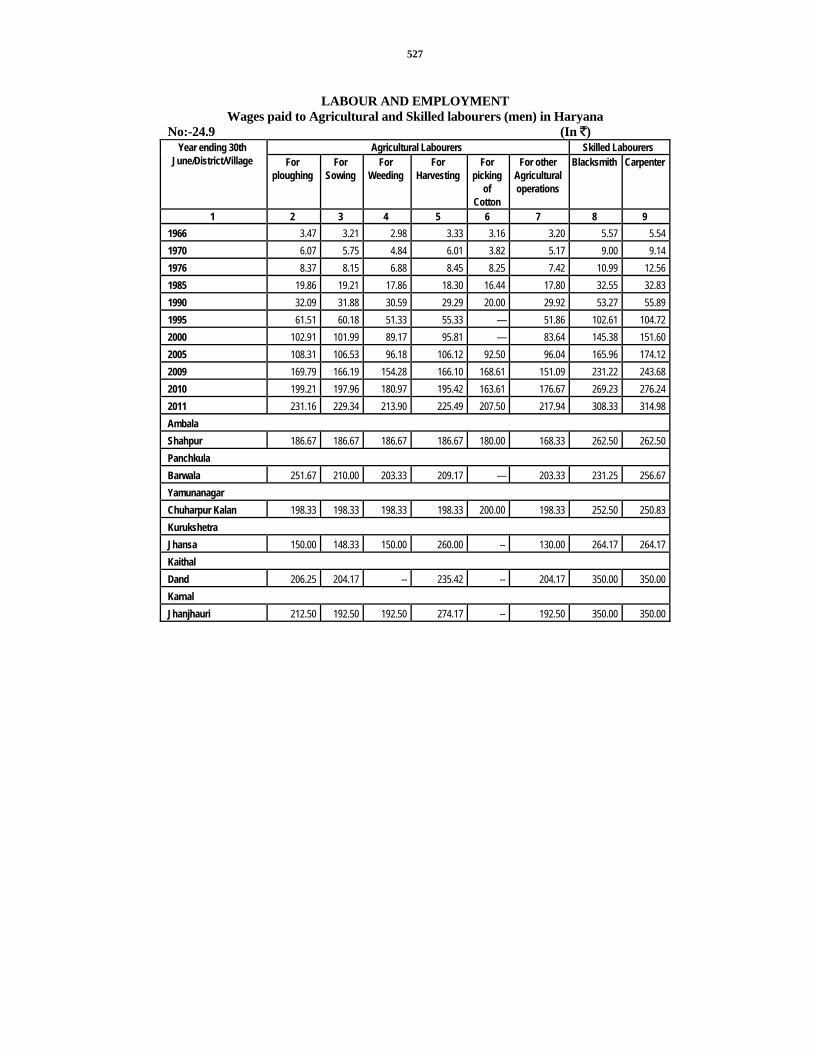
527
LABOUR AND EMPLOYMENT
Wages paid to Agricultural and Skilled labourers (men) in Haryana No:-24.9 (In `)
Agricultural Labourers Skilled Labourers Year ending 30th June/District/Village For
ploughing For
Sowing For
Weeding For
Harvesting For
picking of
Cotton
For other Agricultural operations
Blacksmith Carpenter
1 2 3 4 5 6 7 8 9 1966 3.47 3.21 2.98 3.33 3.16 3.20 5.57 5.54 1970 6.07 5.75 4.84 6.01 3.82 5.17 9.00 9.14 1976 8.37 8.15 6.88 8.45 8.25 7.42 10.99 12.56 1985 19.86 19.21 17.86 18.30 16.44 17.80 32.55 32.83 1990 32.09 31.88 30.59 29.29 20.00 29.92 53.27 55.89 1995 61.51 60.18 51.33 55.33 — 51.86 102.61 104.72 2000 102.91 101.99 89.17 95.81 — 83.64 145.38 151.60 2005 108.31 106.53 96.18 106.12 92.50 96.04 165.96 174.12 2009 169.79 166.19 154.28 166.10 168.61 151.09 231.22 243.68 2010 199.21 197.96 180.97 195.42 163.61 176.67 269.23 276.24 2011 231.16 229.34 213.90 225.49 207.50 217.94 308.33 314.98 Ambala Shahpur 186.67 186.67 186.67 186.67 180.00 168.33 262.50 262.50 Panchkula Barwala 251.67 210.00 203.33 209.17 — 203.33 231.25 256.67 Yamunanagar Chuharpur Kalan 198.33 198.33 198.33 198.33 200.00 198.33 252.50 250.83 Kurukshetra Jhansa 150.00 148.33 150.00 260.00 -- 130.00 264.17 264.17 Kaithal Dand 206.25 204.17 -- 235.42 -- 204.17 350.00 350.00 Karnal Jhanjhauri 212.50 192.50 192.50 274.17 -- 192.50 350.00 350.00

528
LABOUR AND EMPLOYMENT Wages paid to Agricultural and Skilled labourers (men) in Haryana
No:-24.9 (Concld.) (In `) Agricultural Labourers Skilled Labourers Year ending 30th
June/ District/Village
For ploughing
For Sowing
For Weeding
For Harvesting
For picking of
Cotton
For other Agricultural operations
Blacksmith Carpenter
1 2 3 4 5 6 7 8 9 Panipat Uggra Kheri 181.67 180.00 180.00 200.00 — 180.00 — — Sonipat Mohna 290-91 291.67 200.00 0.00 200.00 237.50 -- 309.17 Rohtak Sunderpur 258.33 258.33 255.83 258.33 250.00 250.83 303.33 303.33 Jhajjar Jahazgarh 297.93 312.50 240.91 238.64 -- 245.45 400.00 400.00 Faridabad Sikri 206.67 197.50 200.00 180.00 -- 181.67 295.00 295.00 Palwal Idera Saray 220.00 204.17 206.25 203.33 -- 203.33 296.25 302.92 Gurgaon Bahora Kalan 209.17 205.00 185.00 162.50 -- 162.50 375.00 375.00 Mewat Chhayhasa 213.33 200.83 199.17 207.50 -- 200.83 209.17 209.17 Rewari Manethi 212.50 250.00 216.67 204.17 -- 204.17 354.17 354.17 Mahendragarh Sherpur 260.00 253.57 225.00 250.00 -- 396.43 -- 350.00 Bhiwani Chang 262.50 262.50 275.00 287.50 -- 262.50 387.50 387.50 Jind Gatauli 281.82 289.17 258.33 -- -- 258.33 -- 326.67 Hisar Mangali 270.83 287.50 195.00 228.33 -- 224.17 308.33 350.00 Fatehabad Daryapur 275.00 283.33 280.00 281.67 -- 238.33 300.00 300.00 Sirsa
Madho Singhana 208.33 200.00 230.00 218.50 -- 234.00 302.50 302.50 Source :—Director, Department of Economic and Statistical Analysis, Haryana
Note :—For a normal working day of eight hours.

529
EMPLOYMENT STATISTICS

530
LABOUR AND EMPLOYMENT
Registration and Placing by Employment Exchanges in Haryana No:-24.10
(As on 31st December)
Particulars 1966 1970 1980 1990 2000 2005 2009 2010 Serial No.
1 2 3 4 5 6 7 8 9 1. Number of Employment
Exchanges including Sub-Offices*
19 23 44 92 100 61 62 56
2. Registration 1,07,997 1,60,506 2,32,828 2,39,097 2,47,405 2,85,364 237338 1603423. Placing 22,113 29,551 37,255 7,228 4,709 3,281 1945 61694. Vacancies notified 42,026 56,277 69,315 30,538 12,000 10,860 15925 239695. Vacancies filled 21,729 29,447 36,894 6,907 4,876 3,281 1945 61146. Vacancies outstanding 3,437 5,530 13,176 8,202 6,978 7,677 16085 109907. Submission made 99,412 1,91,103 4,23,568 1,29,250 34,108 13,738 15901 211108. Number of unemployed
persons on the Live Register
36,522 82,843 3,59,255 5,91,423 7,85,408 10,74,703 960145 911824
9. Employers using the Employment Exchanges
6,337 10,863 12,116 3,038 942 637 457 505
Source :—Director of Employment, Haryana * Includes University Employment Information and Guidance Bureau, Town Employment Exchanges, Rural
Employment Exchange and State Employment Exchange at Chandigarh.

531
LABOUR AND EMPLOYMENT Occupational Distribution of person on the Live Register of Employment
Exchanges in Haryana. No:-24.11
(As on 31st December) Particulars 2010Serial
No. 1 21. Legislators, Senior Officials & Manager 289 2. Professional 44,175 3. Associate Professionals 25,897 4. Clerks 34,516 5. Service Workers & Shop Market Sales Workers 40,282 6. Skilled Agricultural and Fishery Workers 1,093 7. Craft and Related Trade Workers 29,431 8. Plant and Machine operators & Assemblers 21,488 9. Elementary Occupations 39,249
10. Persons without professional or Vocational training or previous work experience
6,75,404
Total 9,11,824Source :—Director of Employment, Haryana

532
LABOUR AND EMPLOYMENT Employment in the Organised Sector in Haryana
No:-24.12 (As on 31st March) Public Sector Private Sector
Quasi Government
Year / District Central Govt.
State Govt.
Central State*
Local Bodies
Total Act Non-Act Total Total
Employment
1 2 3 4 5 6 7 8 9 10 11 1966-67 19,980 86,323 13,364 — 10,892 1,30,559 — — 85,523 2,16,082 1970-71 19,566 1,15,047 28,491 — 11,601 1,74,705 — — 1,05,650 2,80,355 1980-81 28,581 1,95,932 25,162 56,923 14,231 3,20,829 1,64,484 20,675 1,85,159 5,05,988 1985-86 32,298 2,20,195 37,018 63,776 15,361 3,68,648 1,66,421 23,173 1,89,594 5,58,242 1990-91 32,667 2,34,260 43,865 69,894 15,381 3,96,067 1,83,131 22,611 2,05,742 6,01,809 1995-96 32,686 2,53,791 42,969 77,606 18,410 4,25,462 2,15,344 21,903 2,37,247 6,62,709 2000-01 30,950 2,53,476 42,535 71,691 17,227 4,15,879 2,13,311 23,081 2,36,392 6,52,271 2005-06 24,890 2,45,807 38,407 63,147 14,598 3,86,849 2,27,396 21,110 2,48,506 6,35,355 2009-10 21,620 244,271 36,874 60,237 14,138 377,140 268,804 24,764 293,568 670,708 2010-11(P) 22,543 246,108 37,611 62,349 20,726 389,337 296,334 27,667 324,001 713,338 Ambala 5,333 17,668 2,350 5,580 1,318 32,249 7,196 2,596 9,792 42,041 Panchkula 1,066 2,855 3,923 4,804 60 12,708 2,375 1,048 3,423 16,131 Yamunanagar 6,975 11,152 1,487 2,584 852 23,050 11,203 3,354 14,557 37,607 Kurukshetra 685 9,239 1,827 3,400 540 15,691 4,121 882 5,003 20,694 Kaithal 64 9,405 553 1,536 322 11,880 1,071 269 1,340 13,220 Karnal 869 16,786 5,839 3,296 739 27,529 7,206 1,838 9,044 36,573 Panipat 42 8,232 3,260 6,232 750 18,516 8,894 3,287 12,181 30,697 Sonipat 461 14,046 1,191 1,929 525 18,152 29,686 4,107 33,793 51,945 Rohtak 452 12,955 1,124 2,697 660 17,888 6,834 718 7,552 25,440 Jhajjar -- 1,649 325 143 90 2,207 7,970 181 8,151 10,358 Faridabad 3,246 16,972 5,847 5,371 3,970 35,406 73,148 4,180 77,328 1,12,734 Gurgaon 1,542 14,283 2,269 3,942 668 22,704 1,11,515 1,382 1,12,897 1,35,601 Mewat -- 1,837 140 523 93 2,593 518 105 623 3,216 Rewari 8 9,094 692 1,872 397 12,063 13,782 600 14,382 26,445 Mahendragarh 85 11,177 398 1,081 222 12,963 263 300 563 13,526 Bhiwani 205 18,012 1,385 3,109 558 23,269 4,133 398 4,531 27,800 Jind — 15,143 1,170 3,034 629 19,976 1,952 830 2,782 22,758 Hisar 1,371 22,088 2,601 2,888 875 29,823 2,633 634 3,267 33,090 Fatehabad -- 5,614 248 749 6,853 13,464 344 63 407 13,871 Sirsa 139 11,338 982 1,770 605 14,834 1,490 895 2,385 17,219 Haryana Govt. Offices in Chandigarh
— 16,563 -- 5,809 -- 22,372 -- -- -- 22,372
Source :— Director of Employment, Haryana. P — Provisional

EMPLOYMENT IN THE ORGANISED SECTOR IN HARYANA
(In Thousand)
324294
85105
154185 189
206237 236 248
291
389377
131175
249
321
369396
426 416387 379
713671
216
280
403
506
558602
663 652635
670
0
100
200
300
400
500
600
700
800
67-68 70-71 75-76 80-81 85-86 90-91 95-96 00-01 05-06 08-09 09-10 10-11
Private Sector Public Sector Total

533
* Prior to 1980 the information in regard to employment of State Govt. in Quasi-Govt. category was included in Central Govt. (Col. 4)
LABOUR AND EMPLOYMENT Estimated employment in private and public sectors in India
No:-24.13 (In lakh) Public Sector Private Sector State/Union
Territory Central Govt. State Govt. Quasi Govt. Establishment
Local Bodies
Act Non-Act
Grand Total
1 2 3 4 5 6 7 8 1970-71 27.71 41.52 19.29 18.78 60.35 7.26 1,74.911980-81 31.95 56.76 45.76 20.37 66.00 7.95 2,28.791990-91 34.10 71.13 62.22 23.13 67.83 8.92 2,67.332000-01 32.60 74.24 61.92 22.61 77.09 9.43 2,77.892005-06 28.60 73.00 59.09 21.18 78.04 10.01 2,69.332008-09 26.60 72.38 58.24 20.73 93.17 10.60 281.722009-10 25.52 73.53 56.68 20.89 97.10 11.36 285.08Andhra Pradesh 2.07 5.03 4.93 2.43 6.77 0.59 21.82Arunachal Pradesh — — — — — — —Assam 0.67 3.12 1.39 0.13 5.73 0.09 11.13Bihar 0.92 2.06 0.83 0.15 0.22 0.05 4.23Delhi 2.03 1.31 1.80 0.82 2.06 0.59 2.61Gujarat 0.80 1.74 2.27 3.05 9.57 2.40 19.83Goa 0.06 0.54 0.20 0.02 0.54 0.04 1.40Haryana 0.23 2.44 0.97 0.14 2.64 0.25 6.67Himachal Pradesh 0.14 1.89 0.60 0.04 1.14 0.06 3.87Jammu and Kashmir 0.28 1.48 0.17 0.06 0.10 0.01 2.10Karnataka 0.97 5.71 3.25 0.68 11.58 0.66 22.85Kerala 0.61 2.67 2.58 0.27 4.27 0.71 11.11Maharashtra 3.06 5.31 6.07 6.35 19.80 1.97 42.56Madhya Pradesh 1.29 4.64 2.00 0.53 1.36 0.11 9.93Manipur 0.04 0.61 0.08 0.04 0.02 0.01 0.80Meghalaya 0.05 0.28 0.05 0.01 0.05 0.01 0.45Mizoram 0.01 0.33 0.03 0.03 0.01 0.00 0.41Nagaland 0.05 0.63 0.05 0.01 0.02 0.02 0.78Orissa 0.61 3.70 1.60 0.18 1.09 0.10 7.28Punjab 0.62 2.54 1.43 0.28 3.16 0.22 8.25Rajasthan 1.18 6.00 1.65 0.73 2.58 0.54 12.68Sikkim — — — — — — —Tamilnadu 2.17 5.74 5.12 1.77 7.30 1.55 23.65Tripura 0.02 1.17 0.10 0.08 0.04 0.00 1.41Uttar Pradesh 3.24 6.91 5.07 1.10 4.73 0.48 21.53West Bengal 2.72 2.77 4.47 1.47 7.44 0.39 19.26Chhatisgarh 0.27 1.40 1.13 0.13 0.33 0.02 3.28Jharkhand 0.96 1.77 9.79 0.19 3.01 0.35 16.07Uttarakhand 0.22 1.06 0.71 0.12 0.74 0.04 2.89
LABOUR AND EMPLOYMENT
Estimated employment in private and public sectors in India
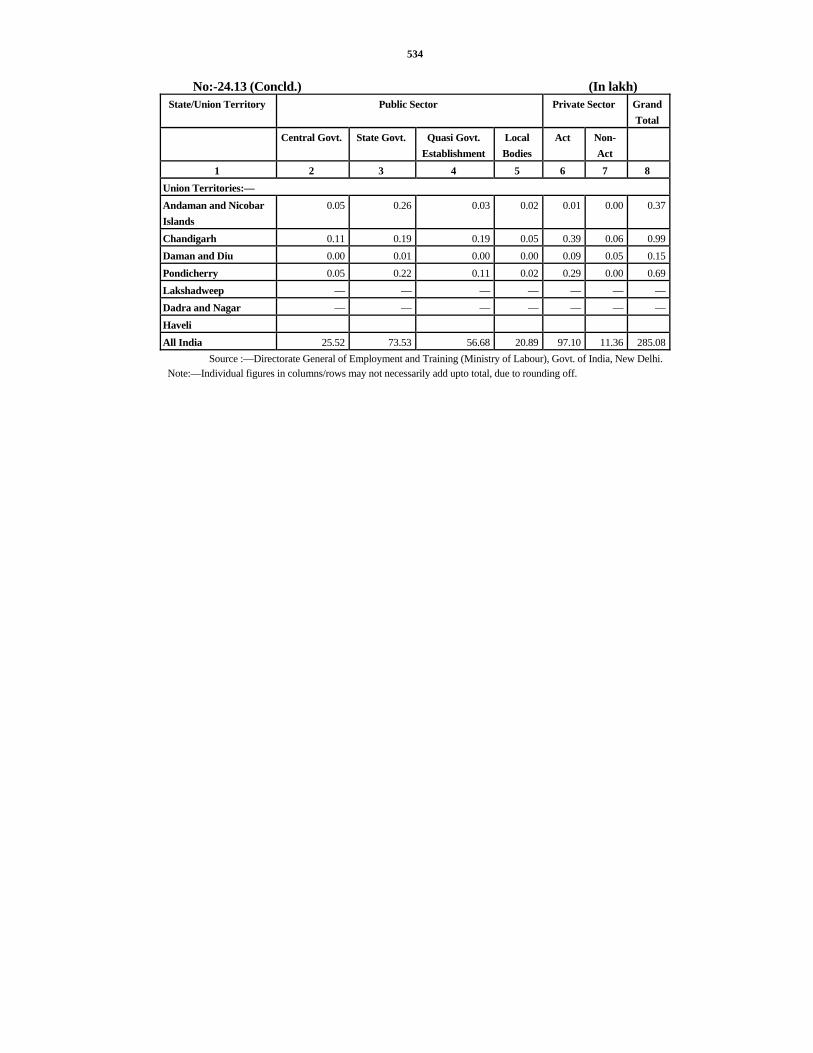
534
No:-24.13 (Concld.) (In lakh) State/Union Territory Public Sector Private Sector Grand
Total Central Govt. State Govt. Quasi Govt.
Establishment Local Bodies
Act Non-Act
1 2 3 4 5 6 7 8 Union Territories:— Andaman and Nicobar Islands
0.05 0.26 0.03 0.02 0.01 0.00 0.37
Chandigarh 0.11 0.19 0.19 0.05 0.39 0.06 0.99Daman and Diu 0.00 0.01 0.00 0.00 0.09 0.05 0.15Pondicherry 0.05 0.22 0.11 0.02 0.29 0.00 0.69Lakshadweep — — — — — — —Dadra and Nagar — — — — — — —Haveli All India 25.52 73.53 56.68 20.89 97.10 11.36 285.08
Source :—Directorate General of Employment and Training (Ministry of Labour), Govt. of India, New Delhi. Note:—Individual figures in columns/rows may not necessarily add upto total, due to rounding off.

535
SECTION XXV BANKING
This section gives information on the development of Banking in Haryana State. The information has been taken from the Publication ‘Statistical Tables relating to Banks in India’ published by the Reserve Bank of India.
Table 25.1 incorporates information on different types of banks functioning in the State.
Table 25.2 denotes the districtwise deposits and credits of Scheduled Commercial banks in Haryana.
Table 25.3 gives deposits and credits of Scheduled Commercial Banks in India.
Table 25.4 gives the number of banking offices in various states per thousand square kilometres of area and per lakh of population.

536
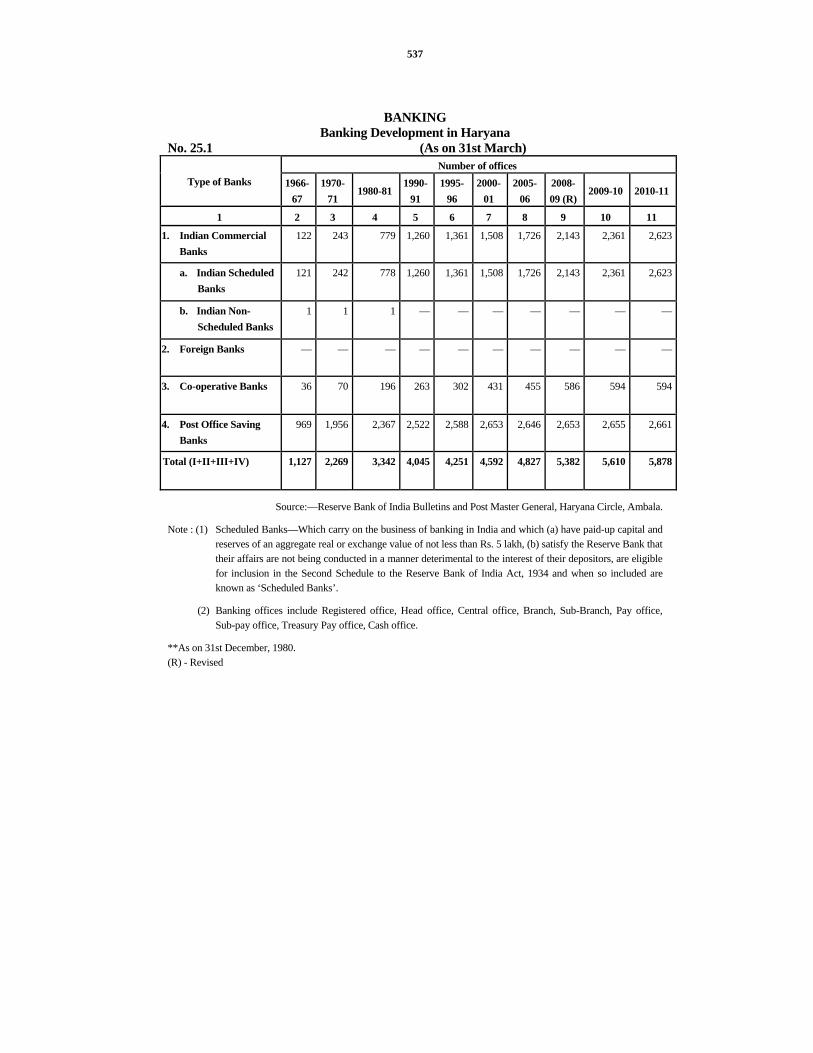
537
BANKING Banking Development in Haryana
No. 25.1 (As on 31st March) Number of offices
Type of Banks 1966-67
1970-71
1980-81 1990-
91 1995-
96 2000-
01 2005-
06 2008-09 (R)
2009-10 2010-11
1 2 3 4 5 6 7 8 9 10 11
1. Indian Commercial Banks
122 243 779 1,260 1,361 1,508 1,726 2,143 2,361 2,623
a. Indian Scheduled Banks
121 242 778 1,260 1,361 1,508 1,726 2,143 2,361 2,623
b. Indian Non-Scheduled Banks
1 1 1 — — — — — — —
2. Foreign Banks — — — — — — — — — —
3. Co-operative Banks 36 70 196 263 302 431 455 586 594 594
4. Post Office Saving Banks
969 1,956 2,367 2,522 2,588 2,653 2,646 2,653 2,655 2,661
Total (I+II+III+IV) 1,127 2,269 3,342 4,045 4,251 4,592 4,827 5,382 5,610 5,878
Source:—Reserve Bank of India Bulletins and Post Master General, Haryana Circle, Ambala.
Note : (1) Scheduled Banks—Which carry on the business of banking in India and which (a) have paid-up capital and reserves of an aggregate real or exchange value of not less than Rs. 5 lakh, (b) satisfy the Reserve Bank that their affairs are not being conducted in a manner deterimental to the interest of their depositors, are eligible for inclusion in the Second Schedule to the Reserve Bank of India Act, 1934 and when so included are known as ‘Scheduled Banks’.
(2) Banking offices include Registered office, Head office, Central office, Branch, Sub-Branch, Pay office, Sub-pay office, Treasury Pay office, Cash office.
**As on 31st December, 1980. (R) - Revised

538
BANKING Districtwise Deposits and Credits of Scheduled Commercial Banks in Haryana
as on 31st March No. 25.2
(` in crore) Number of offices Deposits Credits Credit-Deposit Ratio (%)
District 2010 2011 2010 2011 2010 2011 March, 2010 March, 2011
1 2 3 4 5 6 7 8 9 Ambala 145 156 510 5,898 2,611 2,856 51.14 48.42Panchkula 111 127 14,532 16,374 8,586 12,079 59.08 73.77Yamunanagar 115 126 3,556 4,041 2,308 2,667 64.90 66.00Kurukshetra 97 109 2,877 3,201 2,088 2,510 72.58 78.41Kaithal 84 95 1,474 1,568 2,030 2,866 137.72 182.78Karnal 138 159 4,181 4,818 5,959 8,136 142.53 168.87Panipat 117 121 3,604 4,213 4,214 5,193 116.93 123.26Sonipat 133 156 4,779 5,365 1,945 2,445 40.70 45.57Rohtak 122 131 5,046 5,953 2,594 4,180 51.41 70.22Jhajjar 79 91 2,616 3,118 1,741 1,918 66.55 61.51Faridabad 159 177 12,919 14,408 6,771 8,345 52.41 57.92Palwal 61 67 1,237 1,494 833 949 67.34 63.52Gurgaon 290 336 31135 38,883 10,869 17,377 34.91 44.69Mewat 35 36 580 793 290 364 50.00 45.90Rewari 87 96 2,931 3,715 1,209 1,833 41.25 49.34Mahendragarh 62 68 1,432 1,755 713 855 49.79 48.72Bhiwani 113 124 2,588 3,051 1,987 2,242 76.78 73.48Jind 83 96 1,605 1,897 1,621 2,052 101.00 108.17Hisar 139 147 4,072 5,243 7,405 9,929 181.85 189.38Fatehabad 76 85 1,246 1,531 1,319 1,547 105.86 101.04Sirsa 115 120 2,060 2,407 1,973 2,429 95.78 100.91Total* 2,361 2,623 1,09,577 1,29,721 69,067 92,773 63.03 71.52
Source: — Reserve Bank of India, Quarterly Handout on Banking Statistics, March, 2010 and March, 2011
* Totals may not tally on account of rounding off.
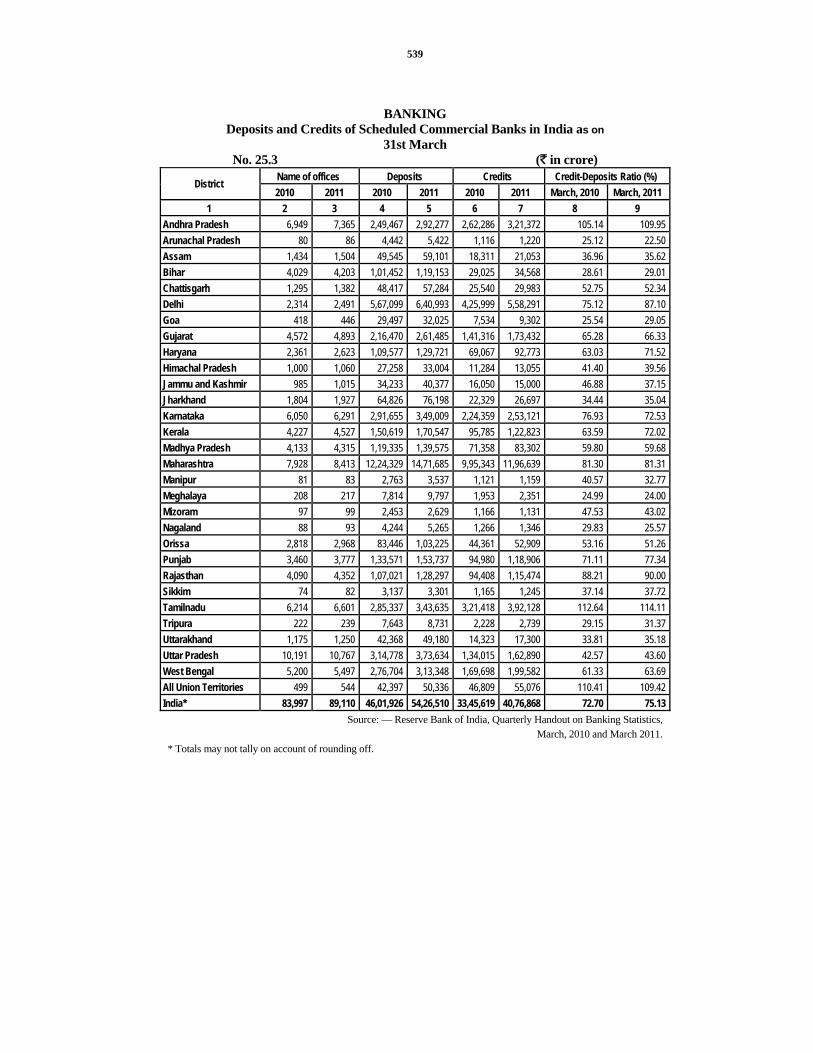
539
BANKING Deposits and Credits of Scheduled Commercial Banks in India as on
31st March No. 25.3 (` in crore)
Name of offices Deposits Credits Credit-Deposits Ratio (%) District 2010 2011 2010 2011 2010 2011 March, 2010 March, 2011
1 2 3 4 5 6 7 8 9 Andhra Pradesh 6,949 7,365 2,49,467 2,92,277 2,62,286 3,21,372 105.14 109.95 Arunachal Pradesh 80 86 4,442 5,422 1,116 1,220 25.12 22.50 Assam 1,434 1,504 49,545 59,101 18,311 21,053 36.96 35.62 Bihar 4,029 4,203 1,01,452 1,19,153 29,025 34,568 28.61 29.01 Chattisgarh 1,295 1,382 48,417 57,284 25,540 29,983 52.75 52.34 Delhi 2,314 2,491 5,67,099 6,40,993 4,25,999 5,58,291 75.12 87.10 Goa 418 446 29,497 32,025 7,534 9,302 25.54 29.05 Gujarat 4,572 4,893 2,16,470 2,61,485 1,41,316 1,73,432 65.28 66.33 Haryana 2,361 2,623 1,09,577 1,29,721 69,067 92,773 63.03 71.52 Himachal Pradesh 1,000 1,060 27,258 33,004 11,284 13,055 41.40 39.56 Jammu and Kashmir 985 1,015 34,233 40,377 16,050 15,000 46.88 37.15 Jharkhand 1,804 1,927 64,826 76,198 22,329 26,697 34.44 35.04 Karnataka 6,050 6,291 2,91,655 3,49,009 2,24,359 2,53,121 76.93 72.53 Kerala 4,227 4,527 1,50,619 1,70,547 95,785 1,22,823 63.59 72.02 Madhya Pradesh 4,133 4,315 1,19,335 1,39,575 71,358 83,302 59.80 59.68 Maharashtra 7,928 8,413 12,24,329 14,71,685 9,95,343 11,96,639 81.30 81.31 Manipur 81 83 2,763 3,537 1,121 1,159 40.57 32.77 Meghalaya 208 217 7,814 9,797 1,953 2,351 24.99 24.00 Mizoram 97 99 2,453 2,629 1,166 1,131 47.53 43.02 Nagaland 88 93 4,244 5,265 1,266 1,346 29.83 25.57 Orissa 2,818 2,968 83,446 1,03,225 44,361 52,909 53.16 51.26 Punjab 3,460 3,777 1,33,571 1,53,737 94,980 1,18,906 71.11 77.34 Rajasthan 4,090 4,352 1,07,021 1,28,297 94,408 1,15,474 88.21 90.00 Sikkim 74 82 3,137 3,301 1,165 1,245 37.14 37.72 Tamilnadu 6,214 6,601 2,85,337 3,43,635 3,21,418 3,92,128 112.64 114.11 Tripura 222 239 7,643 8,731 2,228 2,739 29.15 31.37 Uttarakhand 1,175 1,250 42,368 49,180 14,323 17,300 33.81 35.18 Uttar Pradesh 10,191 10,767 3,14,778 3,73,634 1,34,015 1,62,890 42.57 43.60 West Bengal 5,200 5,497 2,76,704 3,13,348 1,69,698 1,99,582 61.33 63.69 All Union Territories 499 544 42,397 50,336 46,809 55,076 110.41 109.42 India* 83,997 89,110 46,01,926 54,26,510 33,45,619 40,76,868 72.70 75.13
Source: — Reserve Bank of India, Quarterly Handout on Banking Statistics, March, 2010 and March 2011.
* Totals may not tally on account of rounding off.

540
BANKING Number of Banking Offices in various States per thousand square kilometres of area and per lakh
of population No. 25.4
State
Number of Commercial Bank Offices (As on 31st
March 2011)
Area (thousand sq. kms.)
2011
Number of Bank Offices
(per thousand sq. km. of area)
Population (in lakhs) 2011
census
Number of Bank offices (per lakh of Population)
1 2 3 4 5 6 Andhra Pradesh 7,365 275 27 847 9Arunachal Pradesh 86 84 1 14 6Assam 1,504 78 19 312 5Bihar 4,203 94 45 1,038 4Chattisgarh 1,382 135 10 255 5Delhi 2,491 1 2,491 168 15Goa 446 4 112 15 30Gujarat 4,893 196 25 604 8Haryana 2,623 44 60 254 10Himachal Pradesh 1,060 56 19 68 16Jammu and Kashmir 1,015 222 5 125 8Jharkhand 1,927 80 24 330 6Karnataka 6,291 192 33 611 10Kerala 4,527 39 116 334 14Madhya Pradesh 4,315 308 14 726 6Maharashtra 8,413 308 27 1,124 7Manipur 83 22 4 27 3Meghalaya 217 22 10 30 7Mizoram 99 21 5 11 9Nagaland 93 16 6 20 5Orissa 2,968 156 19 419 7Punjab 3,777 50 76 277 14Rajasthan 4,352 342 13 686 6Sikkim 82 7 12 6 14Tamilnadu 6,601 130 51 721 9Tripura 239 11 22 37 6Uttarakhand 1,250 54 23 101 12Uttar Pradesh 10,767 241 45 1,996 5West Bengal 5,497 89 62 913 6All Union Territories 544 10 54 33 16All India* 89,110 3,287 27 12,102 7
Source :— Reserve Bank of India, Quarterly Handout on Banking Statistics, March, 2011. * Totals may not tally on account of rounding off.

541
SECTION XXVI PUBLIC FINANCE
This section contains data on Public Finance of Haryana Government. Figures in this section have been taken from the Haryana Government Budget Documents and Regional Director, National Savings, Haryana.
Tables 26.1 to 26.4 present information on the revenue receipts and revenue expenditure of Haryana Government.
Table 26.5 shows data on capital receipts of Haryana Government.
Table 26.6 shows data on capital expenditure of Haryana Government.
Tables 26.7 to 26.8 present information regarding Public Account of Haryana Government (receipts and disbursement).
Table 26.9 shows the financial position of Haryana Government.
Table 26.10 shows the purpose classification of Budgetary Expenditure of Administrative Departments of Haryana Government.
Table 26.11 shows the economic classification of Haryana Government Budgetary Expenditure.
Table 26.12 gives an account of Small Saving Schemes.

542

543
PUBLIC FINANCE Tax Revenue of Haryana Government
No. 26.1 (` in crore)
Item 2008-09 2009-10 2010-11 2011-12
(Budget Estimates)
1 2 3 4 5 (A) State’s own Tax Revenue 11655.28 13219.50 16790.37 20006.89 (87.11) (88.17) (87.94) (87.86) 1. Taxes on Agricultural Income 0.00 0.00 0.00 0.00 (0.00) (0.00) (0.00) (0.00) 2. Taxes on Property and Capital
Transactions (i to ii) 1334.97 1302.99 2,329.30 2,366.09
(9.98) (8.69) (12.20) (10.39) (i.) Stamps and Registration 1326.39 1293.56 2319.28 2350.00 (9.91) (8.63) (12.15) (10.32) (ii.) Land Revenue 8.58 9.43 10.02 16.09
(0.07) (0.06) (0.05) (0.07) 3. Taxes on Commodities and Services (i
to viii) 10320.31 11916.51 14461.07 17640.80
(77.13) (79.48) (75.74) (77.47) (i.) Sales Tax 8154.73 9032.37 11,082.01 14,100.00 (60.95) (60.24) (58.04) (61.92) (ii.) State Excise 1418.53 2059.02 2365.81 2400.00 (10.60) (13.73) (12.39) (10.54) (iii.) Taxes on Vehicles 239.30 277.07 457.36 515.00 (1.79) (1.85) (2.40) (2.26) (iv.) Taxes on Goods and Passengers 370.29 391.45 387.14 425.00 (2.77) (2.61) (2.03) (1.87) (v.) Taxes and Duties on Electricity 106.31 119.58 130.27 155.00 (0.79) (0.80) (0.68) (0.68) (vi.) Entertainment Tax 24.40 35.55 35.09 37.95 (0.18) (0.24) (0.18) (0.17) (vii.) Receipts under the Sugar cane
(Regulations supply and Purchase Control)
6.75 1.47 1.95 7.85
(0.05) (0.01) (0.01) (0.03) (viii.) Other Receipts 0.00 0.00 1.44 0.00
(0.00) (0.00) (0.01) (0.00)

544
PUBLIC FINANCE Tax Revenue of Haryana Government
No. 26.1 (Concld.) (` in crore)
Item 2008-09 2009-10 2010-11 2011-12
(Budget Estimates)
1 2 3 4 5 (B) Share in Central Taxes (1 to 8) 1724.62 1774.47 2301.75 2765.11
(12.89) (11.83) (12.06) (12.14)1. Taxes on income other than
Corporation Tax 355.07 406.78 475.45 549.50
(2.65) (2.71) (2.49) (2.41)2. Union Excise Duties 287.57 200.04 292.81 357.07 (2.15) (1.33) (1.54) (1.57)3. Corporation Tax 565.45 730.23 899.72 1,117.21 (4.23) (4.87) (4.71) (4.91)4. Tax on Wealth 0.50 1.65 1.85 2.10 (* *) (0.01) (0.01) (0.01)5. Customs 329.73 248.34 402.51 468.17 (2.47) (1.66) (2.11) (2.05)6. Service Tax 186.30 187.33 229.41 271.06 (1.39) (1.25) (1.20) (1.19)7. Other Taxes on Income & Expenditure
@ 0.00 0.00 0.00 0.00
(0.00) (0.00) (0.00) (0.00)8. Others* 0.00 0.10 0.00 (0.00)
(0.00) (**) (0.00) (0.00)
Total Tax Revenue (A+B) 13379.90 14993.97 19092.12 22772.00
(100.00) (100.00) (100.00) (100.00)Source :—State Budget Documents/Department of Economic & Statistical Analysis, Haryana.
Note :—Figures in brackets are percentage to total tax revenue. ∗ Net proceeds assigned to state by the centre, given under the Head--'Other Taxes and
Duties on Commodities and Services' included in share in central taxes instead of state’s own tax revenue.
@ Adjustment of excess share of previous year. ** Percentage is negligible.

545
PUBLIC FINANCE Non-Tax Revenue of Haryana Government
No. 26.2 (` in crore)
Item
2008-09 2009-10 2010-11 2011-12 (Budget
Estimates) 1 2 3 4 5
(C) State’s own Non-Tax Revenue (1 to 5) 3238.45 2741.40 3420.94 4287.08 (63.84) (45.70) (52.86) (46.37) 1. Interest Receipts (i to iv) 776.28 667.89 689.34 816.49 (15.30) (11.13) (10.65) (8.83)
(i.) Departmental Commercial Undertakings
420.64 569.17 594.30 679.71
(8.29) (9.49) (9.18) (7.35) (ii.) Public Sector and other Undertakings 13.45 15.56 8.76 24.97 (0.26) (0.26) (0.13) (0.27) (iii.) Realised on investment of cash balances
302.81 25.40 40.59 28.00
(5.97) (0.42) (0.63) (0.30) (iv.) Others 39.38 57.76 45.69 83.81
(0.78) (0.96) (0.71) (0.91) 2. Dividends and Profits 8.27 9.60 2.48 10.70 (0.16) (0.16) (0.04) (0.12) 3. General Services 310.81 271.80 216.34 303.16 (6.13) (4.53) (3.34) (3.28) 4. Social Services (i to vii) 1124.79 502.31 1363.56 1775.83 (22.17) (8.37) (21.07) (19.21)
(i.) Education, Sports, Art & Culture 156.10 285.10 270.37 299.47 (3.08) (4.75) (4.18) (3.24) (ii.) Medical and Public Health 30.94 30.23 47.06 102.99 (0.61) (0.50) (0.72) (1.12) (iii.) Water supply & Sanitation 30.74 30.02 40.03 38.50 (0.60) (0.50) (0.62) (0.42) (iv.) Urban Development 884.50 133.69 974.54 1300.00 (17.44) (2.23) (15.06) (14.06) (v.) Labour and Employment 13.02 15.00 14.84 17.00 (0.25) (0.25) (0.23) (0.18) (vi.) Social Security and Welfare 5.92 4.47 11.55 11.17 (0.12) (0.08) (0.18) (0.12) (vii.) Others 3.57 3.80 5.17 6.70
(0.07) (0.06) (0.08) (0.07)

546
PUBLIC FINANCE Non-Tax Revenue of Haryana Government
No. 26.2 (Contd.) (` in crore)
Item 2008-09 2009-10 2010-11 2011-12
(Budget Estimates)
1 2 3 4 5 5. Economic Services (i to xii) 1018.30 1289.80 1149.22 1380.90 (20.08) (21.51) (17.76) (14.93)
(i.) Crop Husbandry 4.02 4.70 5.74 5.25 (0.08) (0.08) (0.09) (0.06)
(ii.) Animal Husbandry 2.56 4.45 1.32 4.16 (0.05) (0.07) (0.02) (0.04)
(iii.) Forestry and Wild life 40.74 56.14 44.32 61.00 (0.80) (0.94) (0.68) (0.66)
(iv.) Co-operation 9.34 6.87 5.02 11.15 (0.19) (0.11) (0.08) (0.12)
(v.) Other Rural Development Programmes
11.63 11.83 10.94 12.60
(0.23) (0.20) (0.17) (0.14) (vi.) Major, medium and minor Irrigation 74.13 218.74 202.39 142.60
(1.46) (3.65) (3.13) (1.54) (vii.) Industries and Village and Small
Industries 3.71 2.17 2.88 2.90
(0.07) (0.04) (0.04) (0.03) (viii.) Non-Ferrous, mining and
metallurgical Industries 195.97 247.49 82.59 0.75
(3.86) (4.13) (1.28) (0.01) (ix.) Power 2.67 2.57 2.80 6.50
(0.05) (0.04) (0.04) (0.07) (x.) Road and Bridges 14.40 17.38 10.89 15.25
(0.29) (0.29) (0.17) (0.16) (xi.) Road Transport 645.04 699..57 761.73 1100.00
(12.72) (11.66) (11.77) (11.90) (xii.) Others 14.09 17.89 18.60 18.74
(0.28) (0.30) (0.29) (0.20) (D) Grant-in-aid from Central Government
(1 to 4) 1833.96 3257.29 3050.62 4959.11
(36.16) (54.30) (47.14) (53.63) 1. State Plan Schemes 731.32 920.37 749.74 1442.17 (14.42) (15.34) (11.58) (15.60) 2. Centrally Sponsored Plan Schemes 547.29 668.72 447.11 1255.45 (10.79) (11.15) (6.91) (13.58)

547
PUBLIC FINANCE Non-Tax Revenue of Haryana Government
No. 26.2 (Concld.) (` in crore)
Item
2008-09 2009-10 2010-11 2011-12 (Budget
Estimates) 1 2 3 4 5
3. Non-Plan Grants 523.37 1617.33 1765.98 1855.04
(10.32) (26.96) (27.29) (20.06)
4. Central Plan Schemes 31.98 50.87 87.79 406.45
(0.63) (0.85) (1.36) (4.39)
Total Non-tax Revenue (C+D) 5,072.41 5,998.69 6471.56 9246.19
(100.00) (100.00) (100.00) (100.00)
Total Tax Revenue (From Table No. 26.1) 13,379.90 14,993.97 19092.12 22772.00
Total Revenue Receipts 18,452.31 20,992.66 25563.68 32018.19 Source :—State Budget Documents/Department of Economic and Statistical Analysis, Haryana.
Note :—Figures in brackets are percentage to total non-tax revenue.

548
PUBLIC FINANCE
Developmental Revenue Expenditure of Haryana Government No. 26.3
( ` in crore) 2008-09 2009-10 2010-11 2011-12
(Budget Estimates) Item
2 3 4 5 (A) Social Services (1 to 14) 7258.73 9902.22 10904.08 13968.52
(50.78) (56.80) (57.69) (58.47) 1. General Education 3543.69 4922.31 5597.09 6820.79
(24.79) (28.24) (29.61) (28.55) 2. Technical Education 234.66 206.38 195.26 222.47 (1.64) (1.18) (1.03) (0.93) 3. Art and Culture 4.99 6.61 8.08 10.02 (0.03) (0.04) (0.04) (0.04) 4. Sports and Youth Services 70.96 71.24 96.37 82.95 (0.50) (0.41) (0.51) (0.35) 5. Medical & Public Health 643.73 927.05 965.44 1250.64 (4.50) (5.32) (5.11) (5.24) 6. Family Welfare 81.07 94.90 102.95 117.75 (0.57) (0.54) (0.55) (0.49) 7. Water Supply and Sanitation 649.48 743.34 866.21 909.31 (4.55) (4.26) (4.58) (3.81) 8. Urban Development 500.61 334.02 322.17 1195.01 (3.50) (1.92) (1.71) (5.00) 9. Welfare of SC, ST and other
Backward Classes 121.09 161.31 199.73 339.78
(0.85) (0.93) (1.06) (1.42) 10. Housing 20.55 16.54 23.37 18.55 (0.14) (0.09) (0.12) (0.08) 11. Labour and Employment 145.44 186.37 214.52 239.13 (1.02) (1.07) (1.14) (1.00) 12. Social Security and Welfare 949.65 1795.84 1862.56 2249.27 (6.64) (10.30) (9.85) (9.41) 13. Relief on account of Natural
Calamities 112.68 209.13 280.05 258.23
(0.79) (1.20) (1.48) (1.08) 14. Others 180.13 227.18 170.28 254.62
(1.26) (1.30) (0.90) (1.07)

549
PUBLIC FINANCE Developmental Revenue Expenditure of Haryana Government
No. 26.3 (Contd.) (` in crore)
Item 2008-09 2009-10 2010-11 2011-12
(Budget Estimates)
1 2 3 4 5 (B) Economic Services (1 to 11) 7035.75 7529.91 7996.73 9923.52 (49.22) (43.20) (42.31) (41.53) 1. General Economic Services 125.07 305.71 201.05 290.74 (0.88) (1.75) (1.06) (1.22) 2. Agriculture and Allied Services (i to x) 939.60 1122.33 1360.74 1738.38
(6.57) (6.44) (7.20) (7.28) (i.) Crop Husbandry 236.17 331.47 426.41 612.42 (1.65) (1.90) (2.26) (2.56) (ii.) Soil and Water Conservation 34.06 50.61 42.64 52.26 (0.24) (0.29) (0.23) (0.22) (iii.) Animal Husbandry 244.70 292.91 301.33 369.06 (1.71) (1.68) (1.59) (1.54) (iv.) Dairy Development 3.34 3.55 3.27 3.82 (0.02) (0.02) (0.02) (0.02) (v.) Fisheries 21.33 24.17 24.62 24.64 (0.15) (0.14) (0.13) (0.10) (vi.) Forestry and Wild Life 182.94 175.88 194.49 221.02 (1.28) (1.01) (1.03) (0.93) (vii.) Food, Storage and Warehousing 12.62 9.92 12.05 13.52 (0.09) (0.06) (0.06) (0.06) (viii.) Agriculture Research and Education 140.46 160.64 187.51 244.19 (0.98) (0.92) (0.99) (1.02) (ix.) Co-operation 62.75 71.61 166.69 195.68 (0.44) (0.41) (0.88) (0.82) (x.) Other Agricultural Programmes 1.23 1.57 1.73 1.77
(0.01) (0.01) (0.01) (0.01) 3. Rural Development 843.73 869.11 967.86 1101.49 (5.90) (4.99) (5.12) (4.61) 4. Irrigation and Flood Control 755.44 858.47 900.74 1264.98 (5.28) (4.93) (4.77) (5.29) 5. Energy 3012.06 2787.86 2955.78 3334.06 (21.07) (15.99) (15.64) (13.95) 6. Industries, Village and Small Industries 60.88 56.90 74.23 94.35 (0.43) (0.33) (0.39) (0.39) 7. Non-Ferrous Mining and Metallurgical
Industries 12.29 12.91 15.17 15.08
(0.09) (0.07) (0.08) (0.06)

550
PUBLIC FINANCE Developmental Revenue Expenditure of Haryana Government
No. 26.3 (Contd.) (` in crore)
Item
2008-09 2009-10 2010-11 2011-12 (Budget
Estimates) 1 2 3 4 5
8. Civil Aviation 1.46 1.39 1.50 1.61
(0.01) (0.01) (0.01) (0.01)
9. Science, Technology and Environment 9.51 35.09 15.18 15.90
(0.07) (0.20) (0.08) (0.07)
10. Road & Bridges 449.18 522.80 430.43 810.82
(3.14) (3.00) (2.28) (3.39)
11. Road Transport 826.53 957.34 1074.05 1256.11
(5.78) (5.49) (5.68) (5.26)
Total Developmental Revenue Expenditure (A+B) 14294.48 17432.13 18900.81 23892.04
(100.00) (100.00) (100.00) (100.00)
Source :—State Budget Documents/Department of Economic and Statistical Analysis, Haryana. Note :—Figures in brackets are percentage to the total developmental revenue expenditure.

551
PUBLIC FINANCE
Non-Developmental Revenue Expenditure of Haryana Government No. 26.4 (` in crore)
Item 2008-09 2009-10 2010-11 2011-12 (Budget
Estimates) 1 2 3 4 5
1. Organs of State 233.07 296.76 367.63 402.86 (3.87) (3.83) (3.94) (3.77) 2. Fiscal Services 190.30 231.58 249.82 255.47 (3.16) (2.99) (2.68) (2.39) 3. Interest Payment and Servicing of Debt (A+B) 2386.34 2809.01 3424.24 4531.98 (39.61) (36.22) (36.71) (42.42) (A) Appropriation for Reduction Avoidance of Debt 47.43 72.48 105.68 152.22 (0.79) (0.93) (1.13) (1.43) (B) Interest Payments (i to iv) 2338.91 2736.53 3318.56 4379.76 (38.82) (35.29) (35.58) (40.99)
(i.) Interest on Loans from the Central Govt. 164.09 106.41 147.91 172.53 (2.72) (1.37) (1.59) (1.61) (ii.) Interest on Internal Debt ( a to d) 1656.08 2058.54 2541.28 3466.35
(27.49) (26.55) (27.24) (32.44) (a) Interest on Market Loans 371.74 624.03 1007.30 1451.27 (6.17) (8.05) (10.80) (13.58) (b) Interest on Spl. Securities issued to NSS Fund
of GOI by State Govt. 1035.80 1026.36 1078.15 1257.05
(17.19) (13.24) (11.56) (11.77) (c) Interest on ways and means Advances from
R.B.I. 0.04 0.05 1.15 40.00
(**) (**) (0.01) (0.37) (d) Others 248.50 408.10 454.68 718.03 (4.13) (5.26) (4.87) (6.72)
(iii.) Interest on Small Savings Provident Funds, etc.
487.23 543.67 602.34 708.97
(8.09) (7.01) (6.46) (6.64) (iv.) Others 31.51 27.91 27.03 31.91
(0.52) (0.36) (0.29) (0.30) 4. Administrative Services (i to v) 1599.62 2026.85 2191.18 2242.47
(26.55) (26.13) (23.49) (20.99) (i.) District Administration 82.60 102.79 114.48 119.19 (1.37) (1.33) (1.23) (1.11) (ii.) Police 1065.23 1390.16 1569.94 1604.32 (17.68) (17.92) (16.83) (15.02)
PUBLIC FINANCE Non-Developmental Revenue Expenditure of Haryana Government

552
No. 26.4 (Concld.) (` in crore)
Item
2008-09 2009-10 2010-11 2011-12 (Budget
Estimats) 1 2 3 4 5
(iii.) Public Works 226.56 264.48 207.70 215.46
(3.76) (3.41) (2.22) (2.02)
(iv.) Secretariat General Services 65.09 78.33 86.50 82.01
(1.08) (1.01) (0.93) (0.77)
(v.) Others 160.14 191.09 212.56 221.49
(2.66) (2.46) (2.28) (2.07)
5. Pensions and Miscellaneous General Services
1,615.14 2,391.14 3095.27 3251.29
(26.81) (30.83) (33.18) (30.43)
I. Total Non-Developmental Revenue Expenditure
6,024.47 7,755.34 9328.14 10684.07
(100.00) (100.00) (100.00) (100.00)
II. Total Developmental Revenue Expenditure From (Table No. 26.3)
14,294.48 17,432.13 18900.81 23892.04
III. Compensation and Assignments to Local Bodies and Panchayati Raj Institutions
215.78 69.91 81.24 102.76
Total Revenue Expenditure (I+II+III) 20,534.73 25,257.38 28310.19 34678.87Source :—State Budget Documents/Department of Economic and Statistical Analysis, Haryana.
Note :—Figures in brackets are percentage to the total Non-Developmental Revenue Expenditure. ** Percentage is negligible.

553
PUBLIC FINANCE Capital Receipts of Haryana Government
No. 26.5 (` in crore)
Item
2008-09 2009-10 2010-11 2011-12 (Budget
Estimates) 1 2 3 4 5
1. Recoveries of Loans 351.80 212.84 233.05 232.93
(11.91) (3.59) (3.81) (3.26)
2. Other Loans 6.80 9.39 8.00 16.56
(0.23) (0.16) (0.13) (0.23)
3. Public Debt. (Net) (i + ii) 2,596.23 5,709.40 5871.64 6902.77
(87.86) (96.25) (96.06) (96.51)
(i.) Internal Debt of the State Government (Net)
2,643.68 5,743.56 5687.93 6386.35
(89.47) (96.83) (93.05) (89.29)
(ii.) Loans & Advances from Central Govt. (Net)
(–)47.45 (–)34.16 183.71 516.42
(–)(1.61) (–)(0.58) (3.01) (7.22)
Total 2,954.83 5,931.63 6112.70 7152.26
(100.00) (100.00) (100.00) (100.00) Source :—State Budget Documents/Department of Economic and Statistical Analysis, Haryana.
Note :—Figures in brackets are percentage to total.

554
PUBLIC FINANCE
Capital Expenditure of Haryana Government No. 26.6 (` in crore)
Item 2007-08 2008-09 2009-10 2010-11
(Budget Estimates)
1 2 3 4 5 I Capital Outlay (A+B) 4501.67 5218.48 4031.10 4640.51 (93.13) (86.28) (84.81) (82.90)(A) Developmental (a+b) 4306.86 5031.11 3832.16 4450.91 (89.10) (83.18) (80.63) (79.52)(a) Social Services (1 to 8) 1109.28 1070.00 1229.71 1819.12 (22.95) (17.69) (25.87) (32.50)
1. Education, Sports, Art and culture 90.54 113.71 75.68 81.44 (1.87) (1.88) (1.59) (1.46)2. Medical & Public Health, 44.14 74.59 18.51 75.22 (0.91) (1.23) (0.39) (1.34)3. Water Supply & Sanitation 826.93 741.90 698.16 991.00 (17.11) (12.27) (14.69) (17.71)4. Housing 28.84 27.39 16.78 63.27 (0.60) (0.45) (0.35) (1.13)5. Welfare of SC/ST and other Backward
Classes 2.40 2.80 2.66 2.84
(0.05) (0.05) (0.06) (0.05)6. Social Security and Welfare 15.32 17.59 7.81 27.46 (0.32) (0.29) (0.16) (0.49)7. Other Social Services 101.11 92.02 410.11 577.89 (2.09) (1.52) (8.63) (10.32)8. Family Welfare 0.00 0.00 0.00 0.00
(0.00) (0.00) (0.00) (0.00)(b) Economic Services (1 to 8) 3197.58 3961.11 2602.45 2631.79
(66.15) (65.49) (54.76) (47.02)1. General Economic Services 19.10 25.95 18.20 20.00 (0.40) (0.43) (0.38) (0.36)2. Agriculture and Allied Services (i to iv) 549.35 1031.06 196.82 (–)165.10
(11.36) (17.05) (4.14) (–)(2.95)(i.) Food Storage and Warehousing 511.46 1014.59 185.89 (–)178.76 (10.58) (16.78) (3.91) (–)(3.20)(ii.) Co-operation 34.04 16.39 10.54 13.36 (0.70) (0.27) (0.22) (0.24)(iii.) Fisheries 2.48 0.08 0.39 0.30 (0.05) (**) (0.01) (0.01)(iv.) Forestry & wild life 1.37 0.00 0.00 0.00 (0.03) (0.00) (0.00) (0.00)

555
PUBLIC FINANCE Capital Expenditure of Haryana Government
No. 26.6 (Contd.) (` in crore
Item
2008-09 2009-10 2010-11 2011-12 (Budget
Estimates) 1 2 3 4 5
3. Irrigation and Flood Control 811.39 756.36 760.61 483.50 (16.79) (12.50) (16.00) (8.64) 4. Energy/Power Projects 855.70 898.82 653.95 984.10 (17.70) (14.86) (13.76) (17.58) 5. Industries and Minerals 83.23 1.69 0.67 1.58 (1.72) (0.03) (0.02) (0.03) 6. Civil Aviation 38.23 3.82 1.97 1.30 (0.79) (0.06) (0.04) (0.02) 7. Roads & Bridges 731.14 1,164.15 866.75 1208.41 (15.13) (19.25) (18.24) (21.59) 8. Road Transport 109.44 79.26 103.48 98.00
(2.26) (1.31) (2.18) (1.75) (B) Non-Developmental (General
Services) 194.81 187.37 198.94 189.60
(4.03) (3.10) (4.18) (3.38) II Loans & Advances (C+D) 332.31 829.69 721.87 956.90 (6.87) (13.72) (15.19) (17.10) (C) Developmental (a+b) 219.02 714.78 622.54 804.57 (4.53) (11.82) (13.10) (14.38) (a) Social Services (i to iii) 76.58 492.31 336.09 110.10 (1.58) (8.14) (7.07) (1.97)
(i.) Loans to Govt. Servant for Housing
76.58 74.70 89.27 110.10
(1.58) (1.24) (1.88) (1.97) (ii.) Urban Development 0.00 417.61 246.82 0.00
(0.00) (6.90) (5.19) (0.00) (iii.) Welfare of SC/ST and other
Backward Classes 0.00 0.00 0.00 0.00
(0.00) (0.00) (0.00) (0.00)
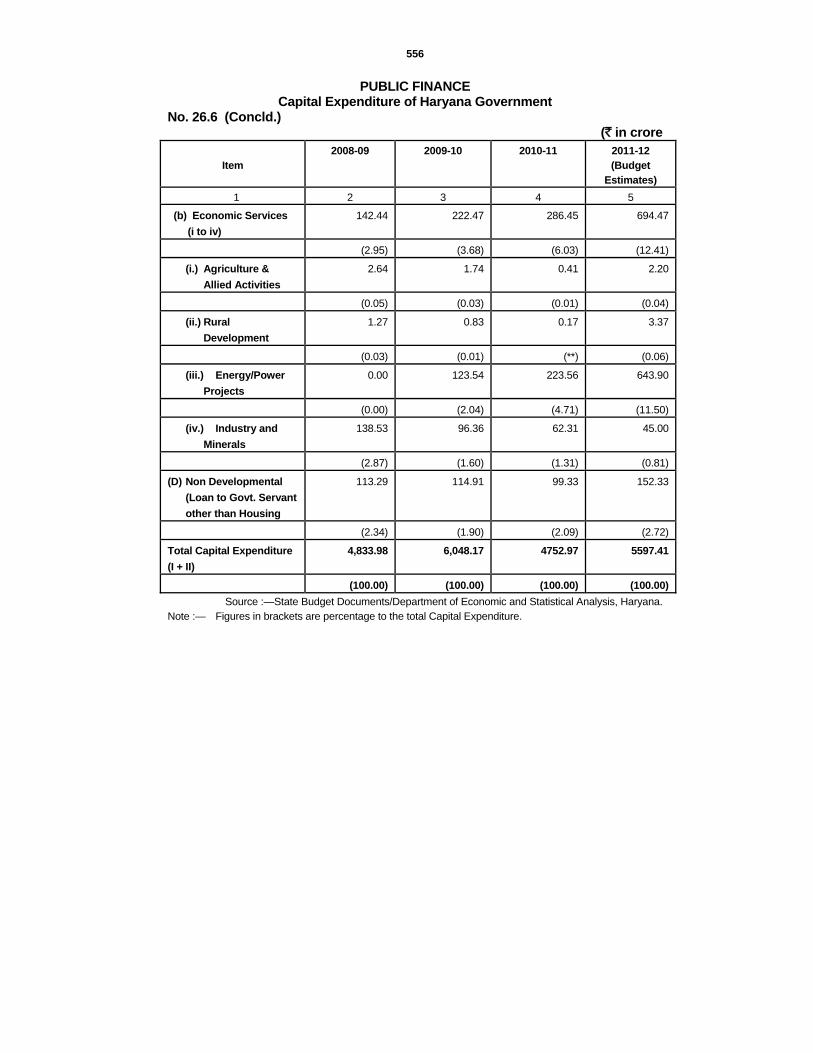
556
PUBLIC FINANCE Capital Expenditure of Haryana Government
No. 26.6 (Concld.) (` in crore
Item
2008-09 2009-10 2010-11 2011-12 (Budget
Estimates) 1 2 3 4 5
(b) Economic Services (i to iv)
142.44 222.47 286.45 694.47
(2.95) (3.68) (6.03) (12.41)
(i.) Agriculture & Allied Activities
2.64 1.74 0.41 2.20
(0.05) (0.03) (0.01) (0.04)
(ii.) Rural Development
1.27 0.83 0.17 3.37
(0.03) (0.01) (**) (0.06)
(iii.) Energy/Power Projects
0.00 123.54 223.56 643.90
(0.00) (2.04) (4.71) (11.50)
(iv.) Industry and Minerals
138.53 96.36 62.31 45.00
(2.87) (1.60) (1.31) (0.81)
(D) Non Developmental (Loan to Govt. Servant other than Housing
113.29 114.91 99.33 152.33
(2.34) (1.90) (2.09) (2.72)
Total Capital Expenditure (I + II)
4,833.98 6,048.17 4752.97 5597.41
(100.00) (100.00) (100.00) (100.00) Source :—State Budget Documents/Department of Economic and Statistical Analysis, Haryana.
Note :— Figures in brackets are percentage to the total Capital Expenditure.
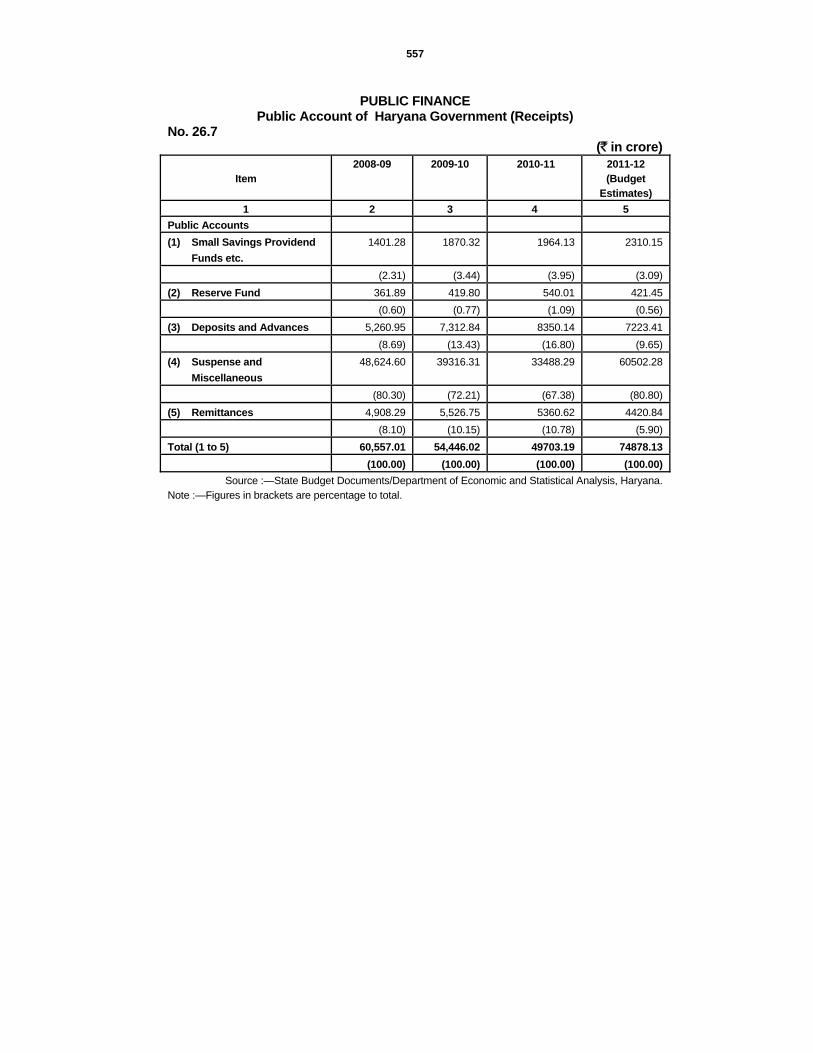
557
PUBLIC FINANCE
Public Account of Haryana Government (Receipts) No. 26.7
(` in crore)
Item
2008-09 2009-10 2010-11 2011-12 (Budget
Estimates) 1 2 3 4 5
Public Accounts (1) Small Savings Providend
Funds etc. 1401.28 1870.32 1964.13 2310.15
(2.31) (3.44) (3.95) (3.09) (2) Reserve Fund 361.89 419.80 540.01 421.45 (0.60) (0.77) (1.09) (0.56) (3) Deposits and Advances 5,260.95 7,312.84 8350.14 7223.41 (8.69) (13.43) (16.80) (9.65) (4) Suspense and
Miscellaneous 48,624.60 39316.31 33488.29 60502.28
(80.30) (72.21) (67.38) (80.80) (5) Remittances 4,908.29 5,526.75 5360.62 4420.84 (8.10) (10.15) (10.78) (5.90) Total (1 to 5) 60,557.01 54,446.02 49703.19 74878.13 (100.00) (100.00) (100.00) (100.00)
Source :—State Budget Documents/Department of Economic and Statistical Analysis, Haryana. Note :—Figures in brackets are percentage to total.

558
PUBLIC FINANCE
Public Account of Haryana Government (Disbursement) No. 26.8
(` in crore)
Item
2008-09 2009-10 2010-11 2011-12 (Budget
Estimates) 1 2 3 4 5
Public Accounts (1) Small Savings
Provident Funds etc. 1048.89 1008.40 1216.33 1126.80
(1.86) (1.99) (2.48) (1.53) (2) Reserve Fund 366.70 458.93 531.08 428.14 (0.65) (0.91) (1.08) (0.58) (3) Deposits and
Advances 5044.33 6786.20 8033.49 6672.15
(8.93) (13.41) (16.41) (9.07) (4) Suspense and
Miscellaneous 45078.22 36530.33 34124.16 60944.01
(79.82) (72.21) (69.70) (82.81) (5) Remittances 4934.92 5809.71 5055.54 4424.35
(8.74) (11.48) (10.33) (6.01) Total (1 to 5) 56473.06 50593.57 48960.60 73595.45 (100.00) (100.00) (100.00) (100.00)
Source :—State Budget Documents/Department of Economic and Statistical Analysis, Haryana. Note :—Figures in brackets are percentage to total.

559
PUBLIC FINANCE Financial Position of Haryana Government
No. 26.9 ( ` in crore)
Item
2008-09 2009-10 2010-11 2011-12(Budget
Estimates) 1 2 3 4 5
1. Opening Balance— According to books of :— (a) A.G. (–)725.22 (–)602.85 (–)1131.66 (–)932.86 (b) R.B.I. (–)670.29 (–)602.41 (–)1124.41 (–)925.61
2. Revenue Account— (a) Receipts 18,452.31 20,992.66 25563.68 32018.19 (b) Expenditure 20,534.73 25,257.38 28310.19 34678.87 (c) Surplus / Deficit (–)2,082.42 (–)4264.72 (–)2746.51 (–)2660.68
3. Miscellaneous Capital Receipts 6.80 9.39 8.00 16.56 4. Capital Outlay 4,501.67 5,218.48 4031.10 4640.51 5. Public Debt —
Debt incurred 3,888.06 8,455.37 10513.20 13568.89 Repayments 1291.83 2,745.97 4641.56 6666.12 Net (+)2,596.23 (+)5,709.40 (+)5871.64 (+)6902.77
6. Loans and Advances— Advances 332.31 829.69 721.87 956.90 Recoveries 351.80 212.84 233.05 232.93 Net (+)19.49 (–)616.85 (–)488.82 (–)723.97
7. Inter State Settlement — — — — 8. Appropriation to Contingency
Fund — — (+)200.00 --
9. Contingency Fund (Net) — — (–)190.00 -- 10. Small Savings, Provident Fund
etc. (Net) (+)352.38 (+)861.92 (+)747.80 (+)1183.36
11. Deposits and Advances, Reserve Funds and Suspense & Misc. (Net)
(+)3,758.19 (+)3,273.49 (–)310.28 (+)102.83
12. Remittances (Net) (–)26.63 (–)282.96 (+)305.08 (–)3.51 13. Net (On year's account) (+)122.37 (–)528.81 (–)644.19 (+)176.85 14. Closing Balanace— According to
books of —
(a) A.G. (–)602.85 1,131.66 (–)1775.85 (–)756.01 (b) R.B.I. (–)602.41 (–)1,124.41 (–)1771.03 (–)748.76
Source :—State Budget Documents/Department of Economic and Statistical Analysis, Haryana.

560
PUBLIC FINANCE Budgetary Expenditure of Administrative Departments of Haryana
Government—Purpose Classification No. 26.10
( ` in lakh)
Item 2008-09 2009-10 Revised
Estimates 2010-11
Budget Estimates 2011-12
1 2 3 4 5 1. General Public
Services 2,86,688 3,67,208 4,11,318 4,16,244
1.1 General Administration, Public Order & Safety
2,85,361 3,63,266 4,09,089 4,14,038
1.2 General Research 1,327 3,942 2,229 2,206 2. Civil Defence 1,209 2,065 1,380 743 3. Education Affairs
and Services 4,57,327 6,29,906 8,17,869 8,88,146
(i.) Administration, Regulation and Research
11,227 17,813 32,054 42,797
(ii.) Schools, University & Institutions
4,46,100 6,12,093 7,85,815 8,45,349
4. Health Affairs and Services
88,772 1,26,786 1,37,255 1,49,646
(i.) Administration, Regulation and Research
3,890 5,697 6,357 7,628
(ii.) Hospitals, Clinics and other Health Services
84,882 1,21,089 1,30,898 1,42,018
5. Welfare Affairs and Services
1,46,003 2,60,758 2,91,274 3,44,127
6. Housing and Community Amenity Affairs and Services
1,60,362 1,90,878 2,94,061 3,15,239
7. Cultural, Recreational and Religious Affairs and Services
12,195 12,953 16,647 13,462
8. Economic Affairs and Services
8,68,025 8,97,944 10,58,314 11,73,325
8.1 General Administration, Regulation and Research
15,184 19,580 24,685 25,534
8.2 Agriculture, Forestry, Fisheries and Hunting
1,31,855 1,12,472 1,69,534 1,79,184

561
PUBLIC FINANCE Budgetary Expenditure of Administrative Departments of Haryana Government-
-Purpose Classification No. 26.10 (Concld.)
( ` in lakh)
Item 2008-09
2009-10 Revised
Estimates 2010-11
Budget Estimates 2011-12
1 2 3 4 5 8.3 Mining,
Manufacturing and Construction
28,612 13,671 20,070 19,611
8.4 Electricity, Gas, Steam and Other Sources of Energy
3,86,531 3,80,770 4,24,258 4,95,590
8.5 Drinking Water Supply
1,42,151 1,45,147 1,77,550 1,85,463
8.6 Transport and Communication
1,45,732 2,07,331 2,09,209 2,25,786
8.7 Other Economic Services
17,960 18,973 33,008 42,157
9. Environmental Protection
223 410 394 436
10. Relief on Calamities
5,326 11,713 65,415 20,597
11. Interest 2,10,605 2,57,847 3,50,098 4,29,906
Total Administrative Department
22,36,735 27,58,468 34,44,025 37,51,871
Total Departmental Commercial undertaking
2,67,119 2,82,128 3,30,868 3,40,337
Total Expenditure 25,03,854 30,40,596 37,74,893 40,92,208
Source :—State Budget Documents/Department of Economic and Statistical Analysis, Haryana.

562
PUBLIC FINANCE Budgetary Expenditure of Haryana Government—Economic Classification
No. 26.11 (Contd.) (` in lakh)
Item 2008-09 2009-10 Revised
Estimates 2010-11
Budget Estimates 2011-12
1 2 3 4 5 I Administrative
Departments (1 to 10) 22,36,735 27,58,468 34,44,025 37,51,871
1. Consumption Expenditure
862544 11,70,360 14,56,753 14,59,026
(i.) Compensation of Employees
7,46,343 10,29,179 12,43,953 12,72,665
(ii.) Net Purchase of Commodities and Services
1,16,201 1,41,181 2,12,800 1,86,361
2. Gross Capital Formation
2,39,577 2,73,409 3,10,414 3,63,450
3. Current Transfers 2,60,612 3,53,130 4,51,513 5,23,545 4. Subsidy 3,19,869 3,08,871 3,58,665 3,84,727 5. Inputd Subsidy 92,936 93,660 1,51,873 1,46,421 6. Interest 2,10,605 2,57,847 3,50,098 4,29,906 7. Capital Transfers 1,18,284 1,25,763 2,05,028 2,47,396 8. Purchase of Financial
Assets 96,968 91,241 72,196 98,778
9. Loans and Advances 33,231 82,969 79,614 95,690 10. Net Purchase of
Physical Assets 2,109 1,218 7,871 2,932

563
PUBLIC FINANCE Budgetary Expenditure of Haryana Government—Economic Classification
No. 26.11 (Concld.) ( ` in lakh)
Item 2008-09 2009-10 Revised
Estimates 2010-11
Budget Estimates 2011-
12 1 2 3 4 5
II Departmental Commercial Undertakings (1 to 6)
2,67,119 2,82,128 3,30,868 3,40,337
1. Purchase of Commodities and Services including maintenance
62,434 73,051 76,086 80,638
2. Compensation of Employees
71,557 82,741 1,49,356 1,54,991
3. Consumption of Fixed Capital
3,491 3,223 3,294 3,396
4. Interest 32,736 36,280 37,251 38,071 5. Gross Capital Formation 96,148 83,716 63,831 61,991 6. Net Purchase of Physical
Assets 753 3,117 1,050 1,250
Total Expenditure (I+II) 25,03,854 30,40,596 37,74,893 40,92,208 Source :—State Budget Documents/Department of Economic and Statistical Analysis, Haryana.

564
Net receipts of small savings schemes in Haryana

565
PUBLIC FINANCE Net Receipts of Small Savings Schemes in Haryana
No. 26.12 (Crore rupees)
Year/District Encashment of Old
Certificates
Post Office Saving Bank
Deposits
Kisan Vikas Patras
National Saving Scheme
Monthly Income Scheme
6-Year National Saving
Certificates
Deposit Scheme
for Retiring
Govt. Employees
1 2 3 4 5 6 7 8 1970-71 (–)18,857 2,37,814 — — — — — 1975-76 (–)10,183 (–)44,049 — — — — — 1980-81 (–)3,737 2,04,669 — — — — — 1985-86 (–)50,569 12,699 — — — — — 1990-91 (–)5,48,264 (–)12,657 11,23,174 2,74,790 2,06,574 — — 1995-96 (–)1,21,531 51,839 13,45,905 (–)2,92,131 4,00,529 10,84,188 2,182 1999-00 (–)9,589 2,22,116 42,75,163 (–)87,504 19,47,376 17,05,921 18,606 2005-06 (–)19 1,464 (–)4,883 (–)418 51,001 4,446 (–)1,053 2009-10 51.57 156.89 154.90 (–)3.86 455.57 (–)62.91 6.42 2010-11 — 79.20 12.42 (–)2.41 209.47 6.40 — Ambala . . . . . . . . . . . . . . Panchkula — 0.85 0.42 (–)0.11 5.93 19.48 — Yamunanagar — 6.99 2.66 0.10 13.73 0.61 — Kurukshetra — 8.69 4.03 (–)0.30 15.86 1.61 — Kaithal — 0.62 (–)2.41 0.00 2.80 (–)1.66 — Karnal — 7.47 (–)1.39 (–)0.28 10.77 (–)4.15 — Panipat — 4.89 0.07 0.00 13.33 0.26 — Sonipat — 7.65 (–)6.41 (–)0.18 0.44 (–)3.13 — Rohtak — (–)9.22 0.42 0.00 (–)5.30 (–)1.86 — Jhajjar — 7.62 1.73 (–)0.03 13.29 0.73 — Faridabad — 8.28 2.88 0.00 25.51 (–)6.39 — Palwal — 6.71 6.49 0.00 13.88 3.16 — Gurgaon — 9.41 17.77 (–)0.51 33.36 0.81 — Mewat — 0.71 (–)1.16 0.00 (–)0.67 (–)0.55 — Rewari — 3.67 0.31 (–)0.02 13.68 0.54 — Mahendragarh — 2.25 (–)0.22 (–)0.01 13.17 0.28 — Bhiwani — 4.03 2.39 (–)0.07 35.60 (–)0.72 — Jind — 2.48 (–)6.08 (–)0.57 3.90 (–)0.88 — Hisar — 3.48 (–)0.86 (–)0.19 1.07 4.58 — Fatehabad — 2.32 (–)0.57 (–)0.18 0.71 (–)3.06 — Sirsa — 0.30 (–)7.65 (–)0.06 (–)1.59 (–)3.26 —

566
PUBLIC FINANCE Net Receipts of Small Savings Schemes in Haryana
No. 26.12 (Contd.) (Crore rupees)
Year/District Time Deposit 1-year
Time Deposit 2-years
Time Deposit 3-
years
Time Deposit 5-years
Post Office* Recurring Deposit
1 9 10 11 12 13 1970-71 8,111 — 1,910 3,467 1341975-76 (–)5,471 8,066 (–)6,918 17,049 17,2141980-81 7,683 (–)1,806 (–)2,739 49,980 36,7301985-86 75,717 5,129 (–)3,673 4,100 77,6531990-91 3,49,287 14,218 2,800 (–)14,701 1,71,2161995-96 (–)3,71,245 84,929 20,561 19,047 5,87,0751999-00 1,21,672 1,26,817 33,299 (–)73,417 11,83,2142005-06 15,353 963 1,098 1,286 27,1082009-10 270.25 20.45 (–)0.98 (–)5.11 114.412010-11 18.80 2.68 (–)8.91 18.04 89.38Ambala . . . . . . . . . .Panchkula 5.71 (–)0.29 0.66 (–)7.29 (–)6.79Yamunanagar 1.03 0.26 0.23 0.41 12.86Kurukshetra 5.22 0.19 (–)15.00 0.25 13.11Kaithal (–)2.26 0.40 0.00 0.10 6.56Karnal (–)1.94 0.31 0.00 0.10 13.05Panipat (–)3.05 0.44 0.72 0.78 3.86Sonipat (–)3.78 0.31 0.17 0.14 7.39Rohtak (–)3.72 0.03 (–)0.08 (–)0.09 (–)0.87Jhajjar 4.97 0.53 0.81 0.57 6.98Faridabad (–)4.20 0.00 1.80 0.32 7.00Palwal 0.20 0.30 0.50 20.32 4.60Gurgaon (–)0.09 (–)0.45 1.03 0.70 10.10Mewat 0.58 0.08 0.00 0.00 4.03Rewari 5.68 0.13 0.18 0.25 0.00Mahendragarh 5.15 (–)0.08 (–)0.07 0.04 (–)0.57Bhiwani 9.28 0.63 0.04 0.18 3.03Jind (–)0.82 0.10 0.15 0.05 5.11Hisar 1.31 (–)0.16 (–)0.02 0.74 2.02Fatehabad 0.88 (–)0.11 (–)0.01 0.49 1.35Sirsa (–)1.35 0.06 (–)0.02 (–)0.02 (–)3.44

567
PUBLIC FINANCE Net Receipts of Small Savings Schemes in Haryana
No. 26.12 (Concld.) (Crore rupees)
Year/District Public Provident Fund
Indira Vikas Patras Senior Citizen Saving
Scheme**
Total
1 14 15 16 17 1970-71 230 — — 2,32,8091975-76 364 — — (–)23,9281980-81 7,905 2,687 — 3,01,3721985-86 6,079 — — 1,27,1351990-91 1,22,096 6,50,390 — 23,38,9231995-96 3,91,466 5,74,833 — 37,77,6471999-00 14,03,640 (–)2,14,920 — 1,06,52,3942005-06 35,257 (–)2,802 14,760 1,87,5892009-10 745.78 (–)2.14 188.58 2388.122010-11 187.86 (–)0.05 205.04 817.92Ambala . . . . . . . .Panchkula 23.67 -- 17.71 59.95Yamunanagar 0.86 — 5.05 44.79Kurukshetra 13.40 -- 16.91 63.97Kaithal 1.00 — 1.32 6.47Karnal 3.53 -- 12.51 39.98Panipat 2.52 — 4.05 27.87Sonipat 3.84 — 5.83 12.27Rohtak 13.26 — 2.45 (–)4.98Jhajjar 5.86 — 2.12 45.18Faridabad 60.98 (–)0.02 52.89 149.05Palwal 0.71 -- 0.30 57.17 Gurgaon 19.36 -- 55.95 147.44Mewat 0.18 — 0.00 3.20Rewari 5.00 — 2.21 31.63Mahendragarh 3.33 — 1.92 25.19Bhiwani 6.44 -- 4.27 65.10Jind 3.85 -- 3.27 10.56Hisar 14.29 (–)0.03 3.24 29.47Fatehabad 3.08 — 11.36 16.26Sirsa 2.70 -- 1.68 (–)12.65* Information upto the year 2001-02 relate to
5-Years Recurring Deposit. ** Senior Citizens Savings scheme w.e.f. 02-08-2004.
Source :— Regional Director, National Savings, Haryana, Chandigarh.

569
SECTION XXVII EXCISE AND SALES TAX
This section contains six tables. The information has been collected from the Excise and Taxation Commissioner, Haryana.
Table 27.1 shows the number of assessees and sales tax realised over a number of years. Table 27.2 shows the consumption of liquor and opium.
Table 27.3 shows receipts from Entertainment Tax and Show Tax and Table 27.4 gives the number of entertainment places (districtwise).
Table 27.5 shows rates of excise duty on liquors, opium and other drugs.
Table 27.6 shows number of registered owners of vehicles and tax collected under Passengers and Goods Tax Act, 1952.

570

571
EXCISE AND SALES TAX Number of Assessees and Tax Realised in Haryana
No:-27.1 Number of Assessees as on 31st March Tax Realised (000 `)
Year/District Haryana Value Added
Tax Act, 2003 Central SalesTax
Act,1956 Haryana Value Added
Tax Act, 2003 Central SalesTax
Act, 1956
1 2 3 4 5 1966-67 20,366 15,749 51,511 20,258 1970-71 26,132 20,750 104,125 65,233 1980-81 54,546 49,779 558,820 445,145 1990-91 84,055 79,758 3,216,199 1,728,113 1995-96 99,726 95,714 6,948,623 3,689,348 2000-01 113,654 112,951 18,449,479 7,335,008 2005-06 133,528 130,819 43,994,058 12,444,553 2007-08 153,375 ** 64,294,702 15,066,438 2009-10 169,707 167,472 80,435,575 40,629,237 2010-11 1,79,161 1,77,043 103,870,712 28,618,474 Ambala 11,365 11,314 10,638,563 284,431 Panchkula 5,457 5,451 2,330,644 215,060 Yamunanagar 9,966 9,962 1,413,249 203,538 Kurukshetra 5,946 5,907 1,092,741 40,999 Kaithal 5,459 5,431 782,171 14,963 Karnal 9,857 9,774 5,669,276 327,941 Panipat 10,967 10,907 17,401,584 2,678,569 Sonipat 8,897 8,827 6.077,879 926,575 Rohtak 5,951 5,861 2,194,998 121,643 Jhajjar 5,529 5,475 1,842,710 565,090 Faridabad 32,290 31,209 18,363,303 2,642,991 Palwal ** ** 836,366 149,001 Gurgaon 26,471 26,212 24,603,554 3,206,202 Mewat 656 635 363,152 62,984 Rewari 4,498 4,484 3,266,213 694,177 Mahendragarh 2,848 2,836 189,504 3,218 Bhiwani 5,654 5,649 1,123,581 40,125 Jind 5,657 5,569 831,841 28,888 Hisar 8,733 8,633 2,118,092 416,540 Fatehabad 4,605 4,593 823,437 8,067 Sirsa 8,355 8,314 1,108,676 8,472 Head office ** ** 799,178 15,979,000
Source :—Excise and Taxation Commissioner, Haryana ** Information is not available.

572
EXCISE AND SALES TAX Consumption of Liquor and Opium in Haryana
No:-27.2
Year/District
Country Liquor (Proof Litres)
Foreign Liquor (Proof Litres)
Wine and Beer (Bulk Litres)
Opium (Kilograms)
1 2 3 4 5 1966-67 1,420,345 50,785 146,994 4 1970-71 4,146,157 170,546 567,526 2.06 1975-76 5,496,374 1,513,180 1,551,665 2.22 1980-81 4,993,664 4,443,067 5,721,705 5 1985-86 12,916,338 10,397,267 10,159,797 5 1990-91 23,810,988 22,384,493 15,305,645 5 1995-96 31,425,065 18,904,517 10,609,851 5 2000-01 42,990,000 17,688,000 17,041,875 2 2005-06 41,570,000 23,321,000 15,595,750 1.40 2007-08 68,095,531 46,527,197 70,156,104 13.40 2008-09 71,664,405 41,714,714 53,109,094 7.74 2009-10 96,064,711 50,657,544 63,244,149 1.52 Ambala 4,563,619 2,268,780 3,005,595 1.40 Panchkula 1,884,718 1,443,925 1,904,499 0.12 Yamunanagar 5,440,862 1,812,007 2,167,341 — Kurukshetra 3,740,000 1,196,000 1,461,590 — Kaithal 5,103,000 1,485,194 483,539 — Karnal 4,603,000 2,316,000 949,987 — Panipat 4,649,400 2,173,434 3,438,129 — Sonipat 5,069,376 2,363,780 3,614,626 — Rohtak 3,736,395 1,841,258 3,467,170 — Jhajjar 4,165,461 2,177,790 4,445,167 — Faridabad 7,226,912 9,884,822 8,643,445 — Palwal 2,538,173 1,372,398 2,627,158 Gurgaon 6,801,000 10,980,000 6,754,000 — Mewat 638,124 409,558 1,030,569 — Rewari 3,171,021 2,226,732 4,113,205 — Mahendragarh 2,951,550 171,960 540,499 — Bhiwani 5,643,338 1,568,650 4,150,136 — Jind 5,915,200 863,230 294,000 — Hisar 7,661,196 2,091,423 4,320,630 — Fatehabad 3,914,038 747,288 1,801,476 — Sirsa 6,648,328 1,263,315 4,031,388 —
Source :—Excise and Taxation Commissioner, Haryana.

573
EXCISE AND SALES TAX Receipts from Entertainment Tax and Show Tax
No:- 27.3 (Thousand `) Year/District Entertainment Tax Show Tax
1 2 3 1966-67 50,14 1,971970-71 1,10,54 10,031980-81 5,42,51 51,441985-86 8,36,64 79,121990-91 7,31,00 76,871995-96 10,05,49 95,622000-01 9,14,63 88,912005-06 13,56,09 * *2008-09 24,40,18 * *2009-10 35,55,00 * *2010-11 35,09,00 * *Ambala * * *Panchkula * * *Yamunanagar * * *Kurukshetra * * *Kaithal * * *Karnal * * *Panipat * * *Sonipat * * *Rohtak * * *Jhajjar * * * Faridabad * * *Gurgaon * * *Mewat * * *Rewari * * *Mahendragarh * * *Bhiwani * * *Jind * * *Hisar * * * Fatehabad * * *Sirsa * * *
Source :—Excise and Taxation Commissioner, Haryana. **Show tax has totally been abolished w.e.f. 1-7-2001. *Not available
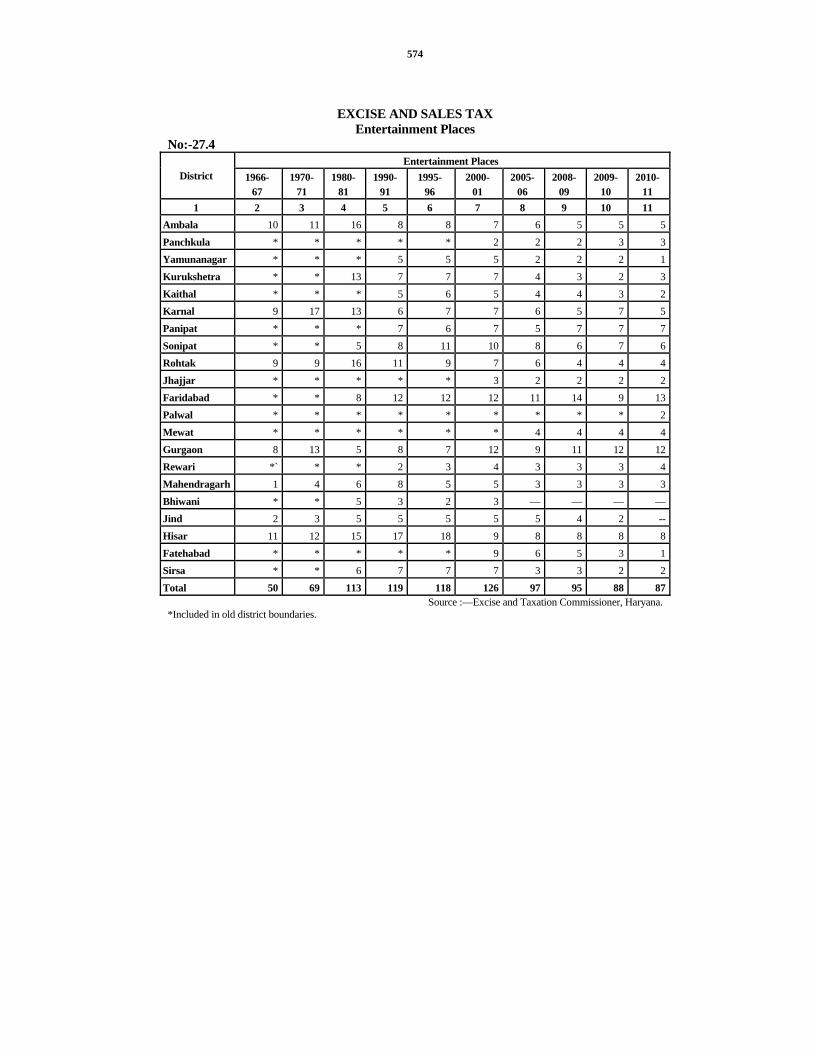
574
EXCISE AND SALES TAX Entertainment Places
No:-27.4 Entertainment Places
District 1966- 67
1970-71
1980-81
1990-91
1995- 96
2000- 01
2005-06
2008-09
2009-10
2010-11
1 2 3 4 5 6 7 8 9 10 11 Ambala 10 11 16 8 8 7 6 5 5 5Panchkula * * * * * 2 2 2 3 3Yamunanagar * * * 5 5 5 2 2 2 1Kurukshetra * * 13 7 7 7 4 3 2 3Kaithal * * * 5 6 5 4 4 3 2Karnal 9 17 13 6 7 7 6 5 7 5Panipat * * * 7 6 7 5 7 7 7Sonipat * * 5 8 11 10 8 6 7 6Rohtak 9 9 16 11 9 7 6 4 4 4Jhajjar * * * * * 3 2 2 2 2 Faridabad * * 8 12 12 12 11 14 9 13Palwal * * * * * * * * * 2Mewat * * * * * * 4 4 4 4Gurgaon 8 13 5 8 7 12 9 11 12 12Rewari *` * * 2 3 4 3 3 3 4Mahendragarh 1 4 6 8 5 5 3 3 3 3Bhiwani * * 5 3 2 3 — — — —Jind 2 3 5 5 5 5 5 4 2 --Hisar 11 12 15 17 18 9 8 8 8 8Fatehabad * * * * * 9 6 5 3 1Sirsa * * 6 7 7 7 3 3 2 2Total 50 69 113 119 118 126 97 95 88 87
Source :—Excise and Taxation Commissioner, Haryana. *Included in old district boundaries.

575
RATES OF EXCISE DUTY

576
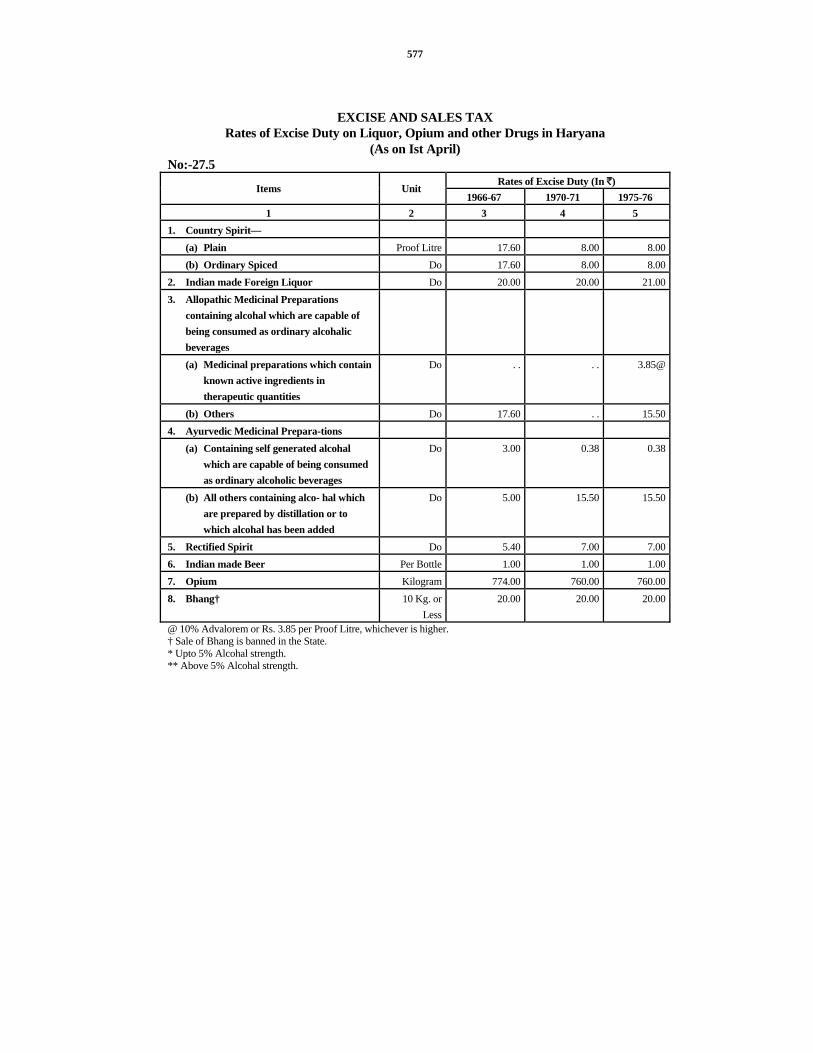
577
EXCISE AND SALES TAX Rates of Excise Duty on Liquor, Opium and other Drugs in Haryana
(As on Ist April) No:-27.5
Rates of Excise Duty (In `) Items Unit
1966-67 1970-71 1975-76 1 2 3 4 5
1. Country Spirit— (a) Plain Proof Litre 17.60 8.00 8.00(b) Ordinary Spiced Do 17.60 8.00 8.00
2. Indian made Foreign Liquor Do 20.00 20.00 21.003. Allopathic Medicinal Preparations
containing alcohal which are capable of being consumed as ordinary alcohalic beverages
(a) Medicinal preparations which contain known active ingredients in therapeutic quantities
Do . . . . 3.85@
(b) Others Do 17.60 . . 15.504. Ayurvedic Medicinal Prepara-tions
(a) Containing self generated alcohal which are capable of being consumed as ordinary alcoholic beverages
Do 3.00 0.38 0.38
(b) All others containing alco- hal which are prepared by distillation or to which alcohal has been added
Do 5.00 15.50 15.50
5. Rectified Spirit Do 5.40 7.00 7.006. Indian made Beer Per Bottle 1.00 1.00 1.007. Opium Kilogram 774.00 760.00 760.008. Bhang† 10 Kg. or
Less20.00 20.00 20.00
@ 10% Advalorem or Rs. 3.85 per Proof Litre, whichever is higher. † Sale of Bhang is banned in the State. * Upto 5% Alcohal strength. ** Above 5% Alcohal strength.

578
EXCISE AND SALES TAX Rates of Excise Duty on Liquor, Opium and other Drugs in Haryana
(As on Ist April) No:-27.5 (Concld.)
Rates of Excise Duty (In `) Items 1980-81 1985-86 1990-91 1995-96 2000-01 2005-
06 2006-
07 2007-
08 2008-
09 2009-
10 6 7 8 9 10 11 12 13 14 15
1. Country Spirit— (a) Plain 11.00 11.00 12.00 21.00 - - - - (b) Ordinary Spiced 11.00 11.00 12.00 21.00 21.00 1.00 5.00 5.00 6.00 10.00
2. Indian made Foreign Liquor
22.00 36.00 40.00 41.00 41.00 1.00 25.00 25.00 25.00 35.00
3. Allopathic Medicinal Preparations containing alcohal which are capable of being consumed as ordinary alcohalic beverages
(a) Medicinal preparations which contain known active ingredients in therapeutic quantities
13.20 13.20 20.00 N.A. N A N A N A NA NA NA
(b) Others 52.80 52.80 80.00 N.A. N A N A N A NA NA NA 4. Ayurvedic Medicinal
Prepara-tions
(a) Containing self generated alcohal which are capable of being consumed as ordinary alcoholic beverages
1.75 1.75 2.50 N.A. N A N A N A NA NA NA
(b) All others containing alco- hal which are prepared by distillation or to which alcohal has been added
52.80 52.80 80.00 N.A. N A N A N A NA NA NA
5. Rectified Spirit 7.00 7.00 7.00 15.00 NA NA NA NA NA NA 6. Indian made Beer 0.50 2.00 2.50 3.00* NA NA NA NA NA NA
5.00** NA NA NA NA NA NA 7. Opium 760.00 760.00 1250.00 760.00 2416.00 NA NA NA NA NA 8. Bhang† 20.00 — — — NA NA NA NA NA NA
Source :— Excise and Taxation Commissioner, Haryana
Note— Decrease is due to change in Rate of duty per proof litre by Govt. w.e.f. 1-4-2003.

579
EXCISE AND SALES TAX
Tax realised under Passenger and Goods Tax Act, 1952 and Motor Spirit Sales Tax Act, 1939.
No:-27.6
Year/District Number of registered owners of Vehicles Tax collected under passenger and
goods Tax Act, 1952 (000 `) 1 2 3
1966-67 5,977 1,97,641970-71 10,505 5,46,131980-81 23,643 33,39,961990-91 61,977 1,02,36,881995-96 96,798 1,49,44,322000-01 2,12,683 3,46,22,642005-06 3,20,167 4,27,71,712008-09 4,07,809 3,47,95,452009-10 4,07,965 3,74,75,002010-11 4,20,644 3,64,23,00Ambala * *Panchkula * *Yamunanagar * *Kurukshetra * *Kaithal * *Karnal * *Panipat * *Sonipat * *Rohtak * *Jhajjar * *Faridabad * *Gurgaon * *Mewat * *Rewari * *Mahendragarh * *Bhiwani * *Jind * *Fatehabad * *Hisar * *Sirsa * *Head Office * *
Source :—Excise and Taxation Commissioner, Haryana.

581
SECTION XXVIII PRICES
This section consists of eighteen tables containing information on harvest prices, wholesale prices, consumer price index numbers for important towns of Haryana and India and All-India Index numbers of wholesale prices by groups and Index numbers of wholesale prices of important agricultural commodities.
Table 28.1—Harvest Prices are the average of weekly wholesale prices in certain selected markets in each district during the period closely following the harvesting of various crops. The period prescribed for each crop is shown below the table.
Table 28.2—In this table weighted Index Numbers of Harvest (wholesale) Prices of Agricultural Commodities in Haryana during 2010-11 have been given. These indices are compiled by the Economic and Statistical Analysis Department, Haryana.
Table 28.3—Statistics of wholesale prices given in this table are based on weekly wholesale price reports received from important market committees. Annual average wholesale prices of important agricultural commodities have been given therein.
Table 28.4—The All India Index Numbers of wholesale prices are being compiled by the Economic Adviser, Ministry of Industry, Government of India. It is a general purpose index with year 1952-53 as base. This Index includes 112 commodities and 555 individual quotations divided into main groups.
Table 28.5—In this table information regarding all India Index numbers of wholesale prices compiled by the Economic Adviser, Ministry of Industry, Government of India have been given. The base year of this series is 1961-62. 139 commodities and 774 individual price quotations have been included for the compilation of these indices. Annual indices are arithmatic average of monthly indices.
Table 28.6—In this table information regarding All India Index Numbers of wholesale prices with 1970-71 as base have been given. The revised series is based on 1,275 price quotations covering 360 commodities.
Table 28.7—In this table information regarding new series of all India Index Numbers of wholesale prices with 1981-82 as base has been given.
Table 28.8—Gives consumer price index numbers for working class in India on base year 1960. These indices are compiled by the Labour Bureau, Government of India. Annual indices are arithmatic average of monthly indices.
Table 28.9—Gives consumer price index numbers for working class in India on base year 1982. These Indices are compiled by Labour Bureau, Government of India.
Table 28.10—All India Consumer Price Index Numbers for the Industrial workers are given in this Table.
Table 28.11—The consumer price index numbers of working class at Yamunanagar and Faridabad (base 1982) have been given in this table.
Table 28.12—Gives information regarding working class consumer price index numbers for six selected centres and Haryana State(base year1982)compiled by the Department of Economic and Statistical Analysis, Haryana.
Table 28.13—Gives information regarding wholesale price index numbers of 20 important agricultural commodities of the Haryana State (Base year 1980-81) compiled by the Department of Economic and Statistical Analysis, Haryana.

582
Table 28.14—Consumer price index numbers for agricultural labourers in Haryana State (Base year 1986-87) as compiled by the Labour Bureau, Government of India, have been shown in this table.
Table 28.15—In this table information regarding rural consumer price Index numbers (Base year 1988-89) of selected commodities of the Haryana State compiled by the Economic and Statistical Analysis Department, Haryana has been given.
Table 28.16—Gives consumer price index numbers for urban non-manual employees (Base year 1960) in respect of selected centres of India compiled by the Central Statistical Organisation. Annual indices are arithmatic average of monthly indices.
Table 28.17—Gives consumer price index numbers for urban non-manual employees (Base year 1984-85) in respect of selected centres of India compiled by the Central Statistical Organisation. Annual indices are arithmatic average of monthly indices.
Table 28.18—Gives information regarding commoditywise procurement prices in Haryana for different crops.

583
PRICES Harvest Prices in Haryana
No:-28.1 (` per Quintal) years
Crops 1966-67
1975-76
1980-81
1985-86
1990-91
1995-96 2000-01 2005-06 2009-10 2010-11
1 2 3 4 5 6 7 8 9 10 11
Rice
(Unhusked)
38.50 74.76 107.63 147.13 218.25 423.15 501.98 613.19 963.67 1056.57
Wheat 96.74 104.77 113.20 165.12 244.19 407.10 610.00 756.91 1,100.00 1,173.76
Barley 91.50 59.72 115.36 133.08 266.34 365.70 390.01 709.87 896.00 1,019.59
Jowar 56.03 82.95 114.47 169.10 212.83 402.72 519.78 659.59 939.19 1.165.63
Bajra 66.53 84.20 119.88 173.10 201.16 385.82 388.46 604.94 860.80 891.79
Maize 75.39 80.84 127.45 177.74 224.00 432.42 472.85 736.65 934.00 986.67
Gram 100.77 102.33 346.08 368.03 690.89 894.99 1,864.98 2,191.68 2,321.63 2,940.00
Rapeseed 164.62 174.14 424.13 455.28 839.47 1,031.08 1,132.52 1,634.53 2,341.00 2,463.71
Toria 162.35 158.31 386.76 348.91 938.09 959.22 1,034.87 1,492.59 2,297.00 2,375.00
Gur 90.32 109.12 280.05 299.01 388.37 637.59 885.43 1,366.36 2,445.53 2,586.90
Cotton Desi
(Unginned)
109.84 192.20 325.87 443.10 731.80 1,548.21 1,507.52 1,873.96 3,188.57 5,022.50
Tobacco 250.00 362.50 . . 481.52 526.79 820.48 882.86 1,329.09 2,188.92 2,629.97Source :—Department of Economic and Statistical Analysis, Haryana.
Note :—Period prescribed for each crop is noted against it :— Rice (Unhusked) October—November Wheat, Gram and Barley May—June Jowarä Bajraä Maize November—December Rapeseed April—May Toria January—February Gur December—February Cotton Desi (Unginned) November—January Tobacco July—August
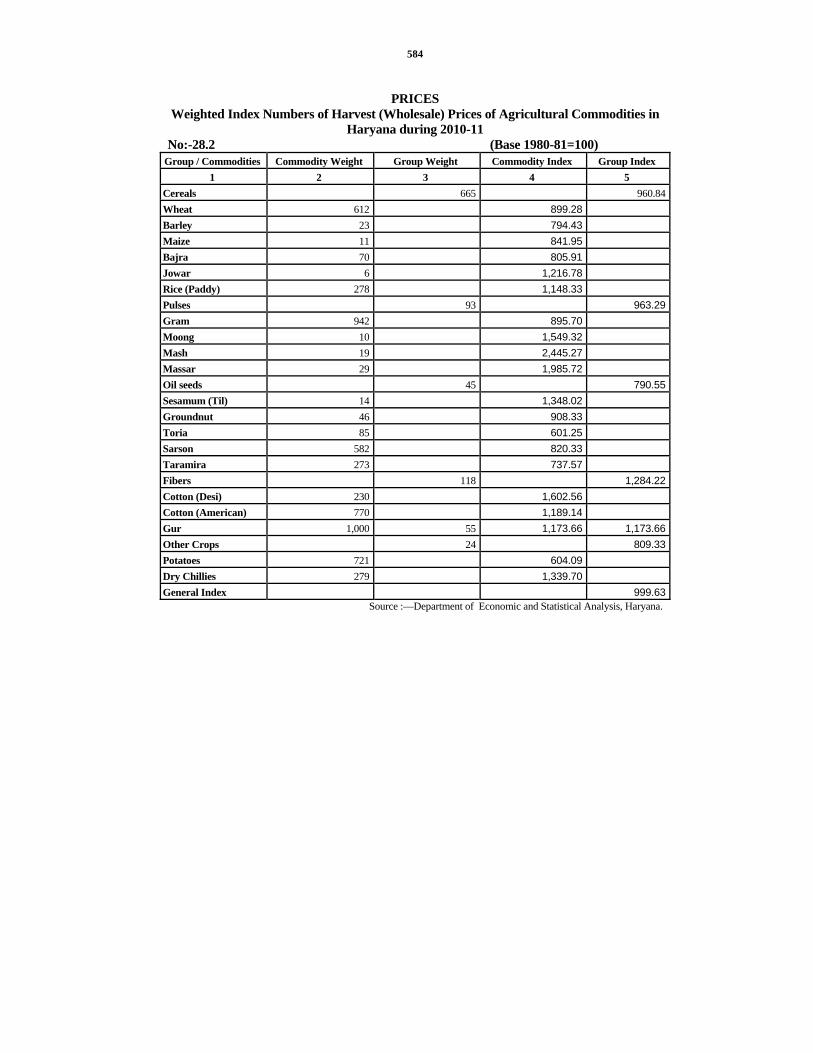
584
PRICES
Weighted Index Numbers of Harvest (Wholesale) Prices of Agricultural Commodities in Haryana during 2010-11
No:-28.2 (Base 1980-81=100) Group / Commodities Commodity Weight Group Weight Commodity Index Group Index
1 2 3 4 5 Cereals 665 960.84Wheat 612 899.28 Barley 23 794.43 Maize 11 841.95 Bajra 70 805.91 Jowar 6 1,216.78 Rice (Paddy) 278 1,148.33 Pulses 93 963.29Gram 942 895.70 Moong 10 1,549.32 Mash 19 2,445.27 Massar 29 1,985.72 Oil seeds 45 790.55Sesamum (Til) 14 1,348.02 Groundnut 46 908.33 Toria 85 601.25 Sarson 582 820.33 Taramira 273 737.57 Fibers 118 1,284.22Cotton (Desi) 230 1,602.56 Cotton (American) 770 1,189.14 Gur 1,000 55 1,173.66 1,173.66Other Crops 24 809.33Potatoes 721 604.09 Dry Chillies 279 1,339.70 General Index 999.63
Source :—Department of Economic and Statistical Analysis, Haryana.

585
ANNUAL WHOLESALE PRICES IN HARYANA Average of weekly quotation from important Mandies
No:-28.3 (` per Quintal) Commodity 1966 1975 1980 1985 1990 1995
1 2 3 4 5 6 7
Wheat (Dara) 69.18 121.54 131.70 169.01 226.80 379.93
Gram 69.16 187.58 292.92 478.07 686.19 865.32
Barley 65.91 93.60 117.13 162.46 206.36 349.07
Rice (Unhuksed) Begmi 37.55 89.30 100.05 147.79 214.58 435.84
Rice (husked) 74.81 229.04 — 304.90 437.85 760.07
Maize 57.05 120.18 126.36 157.01 220.84 444.72
Bajra 55.74 151.96 121.45 137.20 186.16 363.84
Jowar 58.24 118.84 121.98 166.86 214.05 426.61
Gur 51.25 159.63 327.42 315.77 437.39 756.59
Sesamum (Til) 177.54 356.03 — 606.13 928.53 1,833.67
Toria 135.21 193.34 377.98 362.24 757.58 1,071.41
Sarshaf (Sarson) 144.06 215.21 423.82 388.46 790.59 1,147.84
Linseed 132.50 178.86 — 378.00 741.26 1,421.00
Cotton Desi 102.87 213.02 302.96 505.28 656.21 1,797.85
(Un-ginned)
Cotton Desi (ginned) 174.72 425.17 608.33 1,281.58 1,314.03 3,819.95
Cotton American (Unginned) 125.37 254.48 359.96 510.93 731.71 2,064.40
Cotton American (ginned) — 486.46 650.00 1,361.73 1,503.46 3,696.95
Cotton-seed 71.88 158.01 206.10 285.82 478.16 835.65
Tobacco leaf (dry) 252.25 330.00 376.67 460.68 531.30 843.51
Bhusa (wheat straw) 10.88 23.29 20.28 35.32 46.73 98.46
Ghee 1,031.90 2,291.35 . . 4,196.00 6,319.00 11,221.00

586
PRICES ANNUAL WHOLESALE PRICES IN HARYANA
Average of weekly quotation from important Mandies No:-28.3 (Concld.) (Rupees per Quintal)
Commodity 2000 2005 2008 2009 2010 1 8 9 10 11 12
Wheat (Dara) 577.99 699.59 1,005.02 1,122.64 1,210.09
Gram 1,426.94 1,600.08 2,626.92 2,634.52 2,635.84
Barley 540.69 641.21 1,094.33 908.45 936.39
Rice (Unhuksed) Begmi 494.67 606.71 877.49 999.87 1,119.12
Rice (husked) 1,005.03 1,144.38 1,649.30 1,780.75 1,961.34
Maize 539.94 663.98 844.33 965.64 1,000.44
Bajra 509.05 578.13 698.41 869.67 902.53
Jowar 617.02 675.46 942.36 1,000.75 1,302.10
Gur 936.00 1,287.88 1,433.92 2,314.04 2,574.06
Sesamum (Til) 2,738.89 2,800.00 5,667.50 6,242.59 6,350.00
Toria 1,034.87 1,426.86 2,293.26 2,230.58 2,290.17
Sarshaf (Sarson) 1,147.86 1,575.83 2,475.76 2,401.15 2,399.66
Linseed — — — -- --
Cotton Desi 1,428.36 1,677.75 2,839.20 2,844.65 3,725,35
(Un-ginned)
Cotton Desi (ginned) 3,285.20 3,834.49 5,579.11 6,099.04 6,324.75
Cotton American
(Unginned)
1,915.24 1,847.77 2,743.60
2,877.69 3,761.63
Cotton American (ginned) 3,972.29 4,002.08 5,435.15 6,392.51 6,796.23
Cotton-seed 967.50 1,047.59 1,352.84 1,506.73 1,700.00
Tobacco leaf (dry) 915.21 1,306.13 2,133.34 2,344.56 2,800.88
Bhusa (wheat straw) 152.30 203.00 290.06 331.71 482.90
Ghee 12,591.00 16,300.00 20,903.77 23,500.00 31,055.00Source :—Department of Economic and Statistical Analysis, Haryana.

587
All India Index Numbers of Wholesale Prices by Groups
No:-28.4 (Base 1952-53=100) Particulars Weight 1955-56 1960-61 1965-66 1966-67 1967-68 1968-
69 1 2 3 4 5 6 7 8
A—1— All commodities 1,000 92.5 124.9 165.1 191.3 212.4 210.2
2—Food articles 504 86.6 120.0 168.8 199.9 242.2 231.3
3—Liquor and Tobacco 21 81.0 109.9 136.6 130.3 136.6 212.1
4—Fuel, Power, Light and Lubricants
30 95.2 120.0 153.0 169.7 184.5 192.5
5—Industrial Raw Materials 155 99.0 145.4 189.1 228.7 219.1 222.7
6—Manufacturers—
(i.) Total 290 99.7 123.9 149.2 163.0 165.5 168.0
(ii.) Intermediate Products 41 100.1 130.6 172.3 204.5 211.7 202.6
(iii.) Finished Products 249 99.6 122.8 145.4 156.1 157.9 163.2
B—Agricultural Commodities* 461 88.0 123.8 169.3 199.0 220.8 217.0 Source :—Reserve Bank of India Bulletins.
Derived series based on weighted average of rice, wheat, jowar, bajra, barley, maize, ragi, gram, other pulses, potatoes, onion, oranges, bananas, cashewnuts, tea, coffee and condiments, betelnuts, tobacco raw, cotton raw, jute raw, hemp, groundnuts, linseed, castor seed, gingili seed, cotton seed, copra, tanning materials, sugarcane, rubber, logs, timber and bamboos. Note — (i) Yearly indices are based on the average of twelve months. (ii) The 1952-53 series discontinued w.e.f. 1969-70.

588
589
ALL INDIA INDEX NUMBERS OF WHOLESALE PRICES BY GROUPS

590
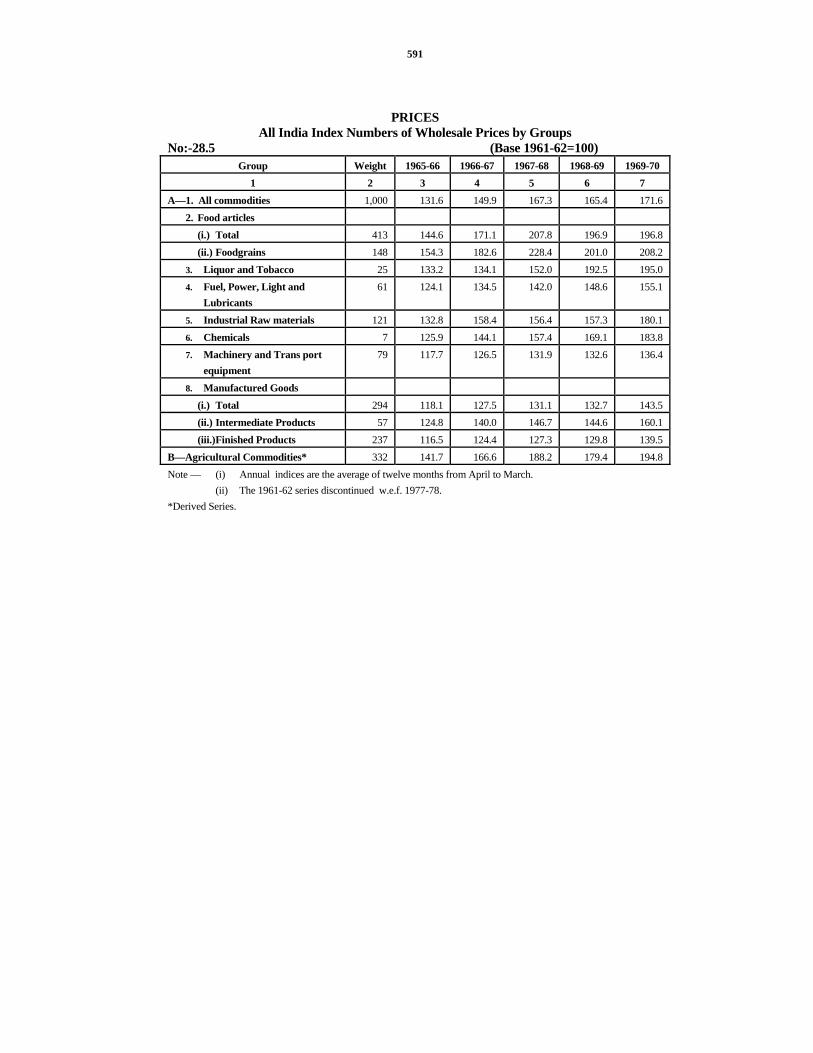
591
PRICES All India Index Numbers of Wholesale Prices by Groups
No:-28.5 (Base 1961-62=100) Group Weight 1965-66 1966-67 1967-68 1968-69 1969-70
1 2 3 4 5 6 7 A—1. All commodities 1,000 131.6 149.9 167.3 165.4 171.6
2. Food articles (i.) Total 413 144.6 171.1 207.8 196.9 196.8 (ii.) Foodgrains 148 154.3 182.6 228.4 201.0 208.2
3. Liquor and Tobacco 25 133.2 134.1 152.0 192.5 195.0 4. Fuel, Power, Light and
Lubricants 61 124.1 134.5 142.0 148.6 155.1
5. Industrial Raw materials 121 132.8 158.4 156.4 157.3 180.1 6. Chemicals 7 125.9 144.1 157.4 169.1 183.8 7. Machinery and Trans port
equipment 79 117.7 126.5 131.9 132.6 136.4
8. Manufactured Goods (i.) Total 294 118.1 127.5 131.1 132.7 143.5 (ii.) Intermediate Products 57 124.8 140.0 146.7 144.6 160.1 (iii.) Finished Products 237 116.5 124.4 127.3 129.8 139.5
B—Agricultural Commodities* 332 141.7 166.6 188.2 179.4 194.8 Note — (i) Annual indices are the average of twelve months from April to March. (ii) The 1961-62 series discontinued w.e.f. 1977-78. *Derived Series.

592
PRICES
All India Index Numbers of Wholesale Prices by Groups No:-28.5 (Concld.) (Base 1961-62=100)
1970-71 1971-72 1972-73 1973-74 1974-75 1975-76 1976-77 Groups
8 9 10 11 12 13 14 A—1. All commodities 181.1 188.4 207.1 254.2 313.0 302.8 319.7
2. Food articles (i.) Total 203.9 210.3 239.5 295.6 364.0 347.7 340.7 (ii.) Foodgrains 206.8 214.9 247.5 296.0 401.5 358.2 314.7
3. Liquor and Tobacco 184.9 194.8 233.0 251.2 305.4 318.6 333.4 4. Fuel, Power, Light and
Lubricants 161.8 172.1 180.7 215.1 316.4 351.8 371.2
5. Industrial Raw materials 197.3 191.0 204.0 299.2 328.0 268.7 318.66. Chemicals 188.0 197.0 200.8 219.8 301.3 324.4 291.8 7. Machinery and Trans
port equipment 148.0 159.0 168.2 183.6 241.9 261.7 257.8
8. Manufactured Goods (i.) Total 154.9 167.1 176.7 205.6 254.5 252.9 265.6 (ii.) Intermediate Products
178.7 196.7 212.3 268.0 320.1 305.9 332.9
(iii.) Finished Products 149.2 159.9 168.0 190.4 238.6 240.1 249.3 B—Agricultural Commodities* 201.0 199.6 219.7 280.6 351.2 311.4 —
Source :—Reserve Bank of India Bulletins.

593
PRICES All India Index Numbers of Wholesale Prices
No:-28.6 Month 1975 1976 1977 1978 1979 1980 1981 1982 1983 1984 1985 1986 1987 1988 1989*
1 2 3 4 5 6 7 8 9 10 11 12 13 14 15 16
January 176.9 166.4 178.8 184.4 185.6 224.0 263.2 281.1 290.6 322.7 340.1 357.5 377.7 416.0 437.5
February 176.0 164.8 182.7 181.5 184.6 230.2 268.8 278.7 292.2 323.4 339.2 358.9 376.6 415.8 439.0
March 174.6 162.6 182.9 181.8 189.0 232.6 270.0 277.1 294.3 322.6 342.5 359.8 378.1 417.6 443.3
April 175.4 166.2 184.1 181.2 195.3 234.1 275.7 276.9 298.6 323.3 350.5 363.3 381.2 422.2 448.6
May 178.2 169.3 187.4 182.2 197.9 239.9 277.9 278.1 307.4 327.2 353.0 367.2 390.3 423.6 457.6
June 177.8 171.5 188.3 184.7 201.9 247.1 279.8 285.8 309.2 335.0 357.5 371.1 394.0 425.2 462.2
July 176.0 177.6 188.7 186.8 211.3 257.3 286.2 291.5 312.9 342.8 362.3 378.3 400.6 432.3 —
August 177.6 178.5 188.4 186.9 218.1 259.0 289.2 294.5 317.7 346.3 363.1 381.6 409.6 435.7 —
September 177.5 179.5 188.2 186.2 220.9 262.5 284.8 290.6 319.1 342.4 357.6 381.5 408.9 434.7 —
October 177.2 177.7 185.2 187.5 221.6 264.6 284.1 289.8 318.9 343.1 359.7 384.8 409.5 439.4 —
November 173.5 176.8 184.4 187.5 221.7 258.6 281.5 290.3 319.3 341.3 357.9 380.6 411.1 436.7 —
December 169.1 177.3 185.5 184.8 224.1 257.1 279.5 288.7 318.7 338.0 356.4 377.9 410.3 434.4 —
Source :—Economic Adviser, Ministry of Industry, Government of India, New Delhi. Note — Data for August 1987 onwards are provisional. *The 1970-71 Series discontinued w.e.f. July, 1989.

594
PRICES All India Index Numbers of Wholesale Prices
No:-28.7 (Base 1981-82=100) Month 1989 1990 1991 1992 1994 1995 1996 1997 1998 1999
1 2 3 4 5 6 7 8 9 10 11 January 155.8 168.0 189.6 215.3 252.7 283.3 297.4 319.8 338.2 354.1 February 156.9 168.8 191.6 216.4 254.8 284.7 297.9 321.4 337.3 355.3March 156.6 170.1 191.7 217.7 257.6 284.9 299.4 320.7 336.8 353.7 April 158.4 172.8 192.8 219.4 262.3 288.4 302.8 322.3 340.5 355.2May 160.3 174.3 194.8 221.6 265.4 291.6 304.7 322.4 343.8 356.8 June 161.6 176.9 198.4 224.1 268.7 292.6 305.9 323.4 347.5 358.3July 163.6 179.3 202.8 226.6 271.3 294.2 311.8 324.5 350.5 359.6 August 166.7 180.2 209.2 228.8 272.1 296.1 314.4 326.0 353.2 361.1September 168.3 180.9 210.4 230.7 273.2 297.4 316.8 328.6 356.1 366.3 October 168.3 183.3 210.2 232.4 274.7 297.9 317.5 331.5 358.7 369.4 November 167.5 185.1 212.4 231.7 276.2 299.4 319.0 331.6 358.5 368.8December 166.6 186.6 213.2 231.4 279.9 297.7 320.1 334.4 355.5 365.6Average 162.5 177.2 201.4 224.7 267.4 292.4 309.0 325.6 348.1 360.4
Source :—Economic Adviser, Ministry of Industry, Government of India, New Delhi.

595
CONSUMER PRICE INDEX NUMBERS FOR THE INDUSTRIAL WORKERS

596

597
PRICES Consumer Price Index Numbers for the industrial Workers
(All India and Selected Centres) No:-28.8 (Base 1960=100)
Centre 1970-71 1975-76 1977-78 1978-79 1979-80 1980-81 1981-82 1 2 3 4 5 6 7 8
All India* 186 313 324 331 360 401 451Ahmedabad 176 293 310 323 348 376 441Alwaye 198 358 319 335 367 407 401Asansol 189 317 338 342 370 411 453Bangalore 186 332 342 339 376 434 506Bhavnagar 186 315 325 340 370 407 456Mumbai 182 300 318 325 359 400 460Kolkatta 182 287 320 331 351 382 414Delhi 199 333 358 368 389 426 472Digboi 189 317 336 339 367 414 445Gwalior 191 324 343 350 372 427 474Hawrah 186 290 313 319 339 370 398Hyderabad 189 316 337 341 368 406 465Jamshedpur 183 293 316 322 349 383 426Monghyr 205 325 345 348 382 430 480Munda Kayam 197 346 302 313 338 396 455Nagpur 187 326 315 325 354 398 469Saharanpur 186 313 335 345 363 409 456Sholapur 185 342 326 343 372 411 499

598
PRICES Consumer Price Index Numbers for the industrial Workers
(All India and Selected Centres) No:-28.8 (Concld.) (Base 1960=100)
Centre 1982-83 1983-84 1984-85 1985-86 1986-87 1987-88 1988-89@
1 9 10 11 12 13 14 15 All India* 486 547 582 620 674 735 786 Ahmedabad 487 544 570 599 657 724 763Alwaye 497 589 634 664 730 766 804 Asansol 486 529 572 616 657 709 752Bangalore 535 605 642 682 736 809 871 Bhavnagar 491 556 579 653 729 786 805Mumbai 502 564 609 654 717 791 856 Kolkatta 447 511 576 610 671 714 783Delhi 508 551 597 648 707 787 852 Digboi 475 528 588 615 659 716 784 Gwalior 506 545 581 628 670 726 779 Hawrah 434 489 531 570 626 654 702 Hyderabad 489 545 588 624 690 751 816 Jamshedpur 459 513 528 580 639 679 742 Monghyr 528 576 581 621 676 754 839 Munda Kayam 467 556 591 603 664 728 748 Nagpur 507 558 601 632 673 725 802 Saharanpur 499 543 574 623 661 714 768Sholapur 515 579 612 647 697 747 789
Source :—Reserve Bank of India Bulletins. * Based on indices of 50 Centres. @ Average of six months from April, 1988 to September, 1988. Note :— The series 1960 = 100 discontinued w.e.f. October, 1988.

599
PRICES Consumer Price Index Numbers for the Industrial Workers
(All India and Selected Centres) No:-28.9 (Base 1982=100)
Centre 1989-90 1990-91 1995-96 1999-00 2000-01 2005-06 2008-09 @ 2009-10@ 2010-11 @ 1 2 3 4 5 6 7 8 9 10
All India* 173 193 313 428 444 542 145 163 180
Ahmedabad 171 196 309 428 444 523 141 157 175
Asansol 170 189 290 408 412 516 155 178 199
Bangalore 166 183 310 410 429 541 154 171 185
Bhavnagar 175 198 325 453 469 540 137 154 178
Mumbai 179 201 346 474 512 613 148 163 178
Calcutta 178 203 319 439 461 594 145 161 176
Delhi 182 201 331 486 518 654 140 152 166
Hawrah 181 212 329 485 504 628 142 159 173
Hyderabad 167 182 290 399 424 537 139 156 167
Jamshedpur 166 187 290 398 408 514 145 165 189
Monghyr 170 189 293 417 413 517 148 169 185
Munda Kayam 171 184 324 448 452 520 150 162 179
Nagpur 178 201 320 439 469 559 155 183 207
Sholapur 180 197 337 452 466 543 151 166 182 Source :—Reserve Bank of India Bulletins.
* Based on indices of 78 Centres. @ Base year 2001 = 100
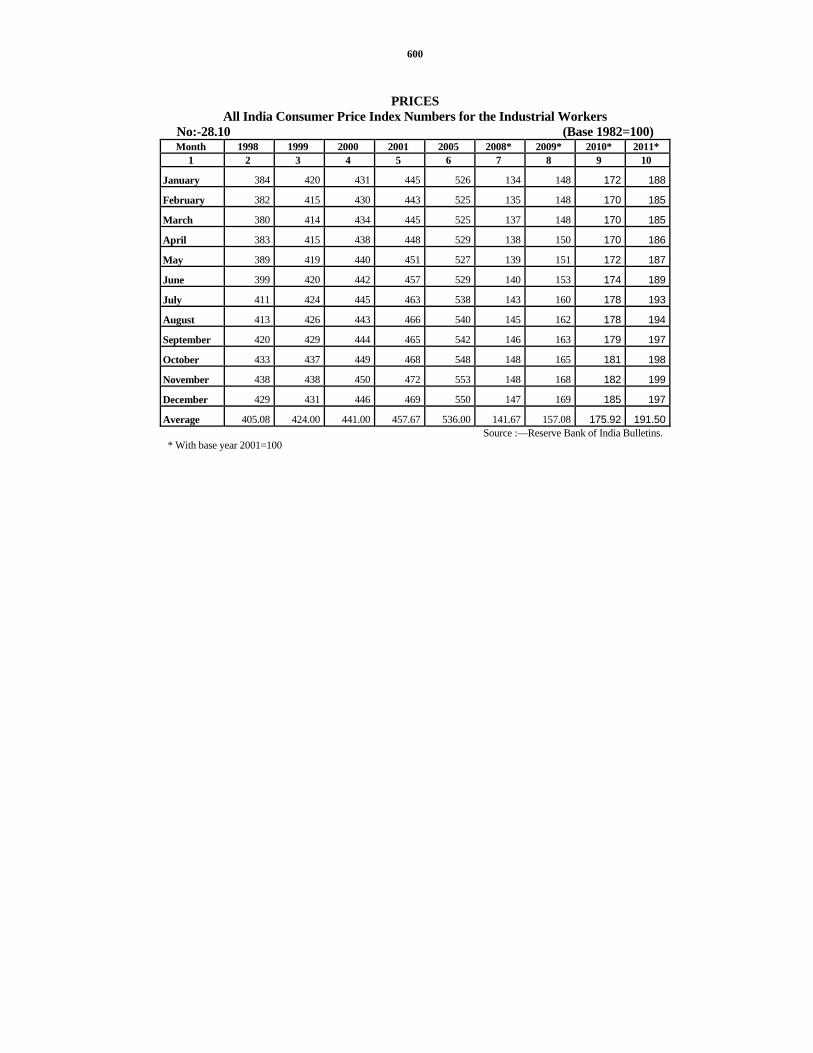
600
PRICES
All India Consumer Price Index Numbers for the Industrial Workers No:-28.10 (Base 1982=100) Month 1998 1999 2000 2001 2005 2008* 2009* 2010* 2011*
1 2 3 4 5 6 7 8 9 10
January 384 420 431 445 526 134 148 172 188
February 382 415 430 443 525 135 148 170 185
March 380 414 434 445 525 137 148 170 185
April 383 415 438 448 529 138 150 170 186
May 389 419 440 451 527 139 151 172 187
June 399 420 442 457 529 140 153 174 189
July 411 424 445 463 538 143 160 178 193
August 413 426 443 466 540 145 162 178 194
September 420 429 444 465 542 146 163 179 197
October 433 437 449 468 548 148 165 181 198
November 438 438 450 472 553 148 168 182 199
December 429 431 446 469 550 147 169 185 197
Average 405.08 424.00 441.00 457.67 536.00 141.67 157.08 175.92 191.50Source :—Reserve Bank of India Bulletins.
* With base year 2001=100

601
PRICES Consumer Price Index Numbers of Working Class at Yamunanagar and Faridabad
No:-28.11 (Base 1982=100) Year/Month Yamunanagar Faridabad
1 2 3 1989 162 1641990 176 1791991 201 2011992 218 2241993 235 2451994 259 2681995 293 2951996 315 3261997 335 3591998 378 4261999 392 4352001 428 4692005 521 5492008* 145 1452009* 162 1602010* 183 1822011* 197 194January 192 193February 191 189March 190 190April 192 191May 192 191June 193 190July 198 195August 197 197September 201 199October 208 202November 208 198December 206 195
Source :—Labour Bureau, Government of India, Shimla. * With base year 2001=100
602
CONSUMER PRICE INDEX NUMBERS FOR WORKING CLASS IN HARYANA

603

604
PRICES
Consumer Price Index Numbers for Working Class in Haryana No:-28.12 Base Year 1982 = 100
Haryana State Bhiwani Year/Month
Food General Food General 1 2 3 4 5
1990 — 176 169 1671991 — 201 200 1941992 — 222 223 2161993 — 239 236 2301994 — 260 260 2491995 — 280 283 2681996 — 301 302 2851997 — 329 336 3161998 — 370 386 3541999 — 382 393 3692000 — 395 401 3872001 — 412 400 4042005 — 475 450 4702006 — 498 482 4932007 — 522 519 5192008 — 563 577 5612009 — 626 658 6262010 — 698 736 6992011 . . 763 795 764January — 745 783 748February — 735 765 738March — 736 766 738April — 740 767 741May — 744 769 745June — 752 782 753July — 770 798 771August — 774 804 775September — 787 824 788October — 792 832 793November — 792 833 793December — 783 818 784* Indices for food group of Haryana State are not compiled.

605
PRICES Consumer Price Index Numbers for Working Class in Haryana
No:-28.12 (Concld.) Base Year 1982 = 100 Hisar Sonipat Surajpur-Pinjore Bahadurgarh Panipat
Year/Month Food General Food General Food General Food General Food General
1 6 7 8 9 10 11 12 13 14 15 1990 176 167 185 175 191 176 188 183 181 1821991 209 192 218 203 221 203 213 205 209 2081992 230 211 241 225 242 225 233 224 231 2301993 243 226 259 243 260 241 255 241 254 2511994 266 246 280 260 288 264 277 260 281 2731995 287 263 302 276 323 287 304 282 308 2941996 310 282 326 297 346 307 334 308 327 3171997 345 310 357 323 376 335 368 339 356 3451998 409 353 415 362 438 375 419 375 419 3891999 414 365 420 377 437 387 420 389 418 3992000 412 377 418 389 426 398 419 401 422 4122001 415 393 423 404 435 416 433 419 434 4302005 478 467 484 474 489 474 479 475 485 4892006 513 494 513 494 525 496 500 494 516 5132007 546 519 546 519 567 520 540 520 549 5352008 607 562 610 561 634 560 613 563 605 5722009 695 625 705 625 721 625 698 625 684 6302010 789 697 803 697 821 697 792 699 777 7012011 854 763 862 762 897 761 856 764 853 763January 843 746 849 744 885 743 842 746 843 746February 822 735 828 733 864 733 824 736 825 735March 824 736 830 734 866 734 824 736 826 736April 823 740 830 738 872 738 822 740 824 739May 824 744 831 742 874 742 825 744 823 743June 836 752 845 751 884 751 838 753 837 751July 856 770 867 769 894 769 859 771 854 770August 861 775 871 774 900 773 863 775 860 774September 887 788 896 787 930 786 889 789 884 788October 895 793 906 792 940 791 900 794 894 793November 895 793 906 792 940 791 899 794 894 793December 878 784 887 782 920 782 881 784 875 783
Source :—Department of Economic and Statistical Analysis, Haryana.

606
PRICES Index Numbers of Wholesale Prices of 20 Important Agricultural
Commodities in Haryana No:-28.13 (Base 1980-81=100)
Year/Month General 1 2
1986-87 126.31987-88 152.41988-89 167.41989-90 165.11990-91 192.71991-92 237.51992-93 241.21993-94 282.51994-95 313.91995-96 318.01996-97 375.51997-98 377.11998-99 405.41999-00 425.52000-01 408.82002-03 452.22004-05 481.22005-06 522.42006-07 607.92007-08 653.12008-09 756.42009-10 878.62010-11 979.69July 911.38August 926.99September 935.49October 961.35November 984.21December 991.64January 1,006.10February 1,004.30March 1,004.06April 1,011.87May 1,007.16June 1,011.69
Source :— Department of Economic and Statistical Analysis, Haryana.
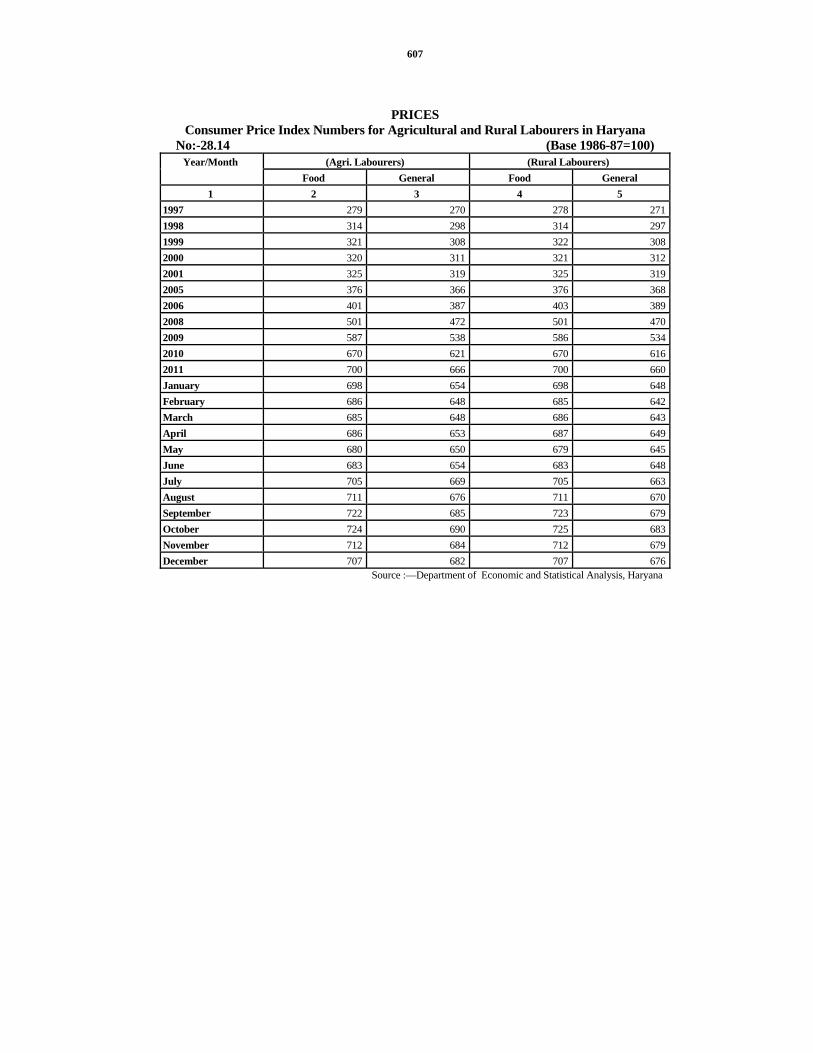
607
PRICES Consumer Price Index Numbers for Agricultural and Rural Labourers in Haryana
No:-28.14 (Base 1986-87=100) (Agri. Labourers) (Rural Labourers) Year/Month
Food General Food General 1 2 3 4 5
1997 279 270 278 2711998 314 298 314 2971999 321 308 322 3082000 320 311 321 3122001 325 319 325 3192005 376 366 376 3682006 401 387 403 3892008 501 472 501 4702009 587 538 586 5342010 670 621 670 6162011 700 666 700 660January 698 654 698 648February 686 648 685 642March 685 648 686 643April 686 653 687 649May 680 650 679 645June 683 654 683 648July 705 669 705 663August 711 676 711 670September 722 685 723 679October 724 690 725 683November 712 684 712 679December 707 682 707 676
Source :—Department of Economic and Statistical Analysis, Haryana

608
PRICES Consumer Price Indices of Selected Commodities for Rural Areas in Haryana
No:-28.15 (Base 1988-89=100) Years/Months Food General
1 2 3 1992-93 160 1581993-94 170 1691994-95 185 1841995-96 199 1981996-97 226 2221997-98 245 2441998-99 278 2751999-00 273 2762000-01 275 2812002-03 285 2942005-06 324 3272006-07 356 3512007-08 377 3732008-09 416 4052009-10 491 4602010-11 537 496July 518 479August 519 479September 523 482October 534 489November 535 490December 549 499January 549 506February 539 499March 543 502April 542 504May 544 506June 552 511
Source :—Department of Economic and Statistical Analysis, Haryana

609

610
CONSUMER PRICE INDEX NUMBERS FOR URBAN NON-MANUAL EMPLOYEES

611
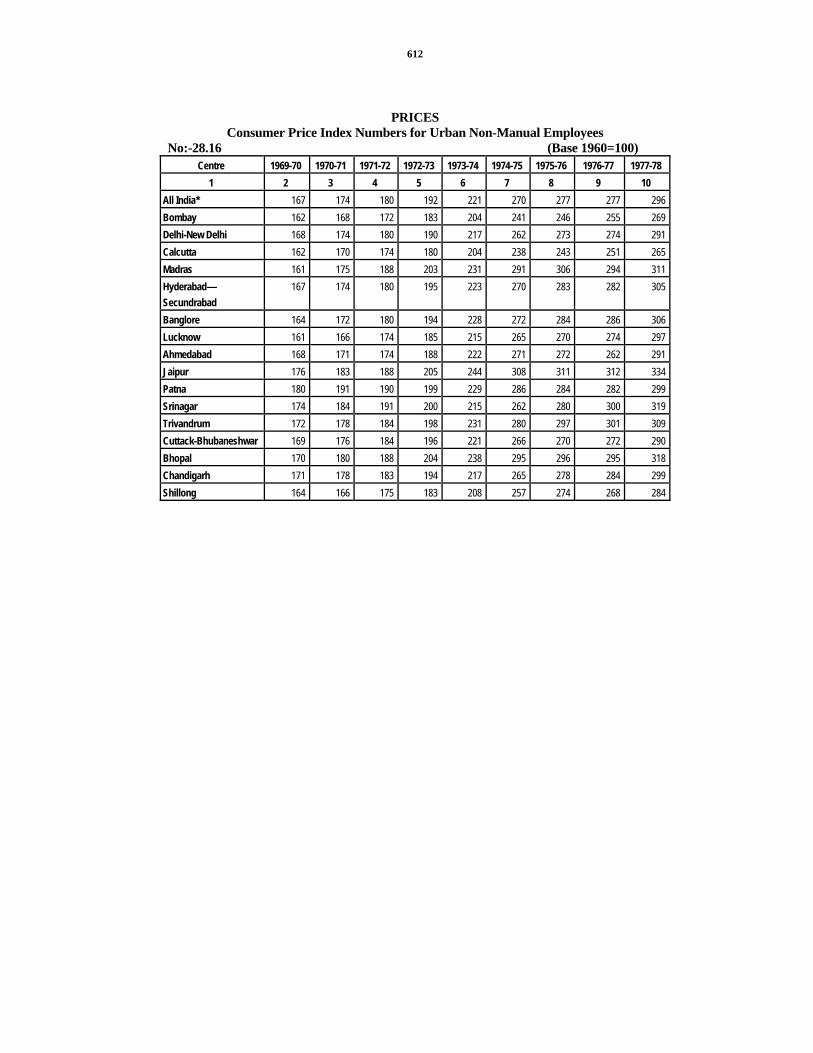
612
PRICES Consumer Price Index Numbers for Urban Non-Manual Employees
No:-28.16 (Base 1960=100) Centre 1969-70 1970-71 1971-72 1972-73 1973-74 1974-75 1975-76 1976-77 1977-78
1 2 3 4 5 6 7 8 9 10 All India* 167 174 180 192 221 270 277 277 296 Bombay 162 168 172 183 204 241 246 255 269 Delhi-New Delhi 168 174 180 190 217 262 273 274 291 Calcutta 162 170 174 180 204 238 243 251 265 Madras 161 175 188 203 231 291 306 294 311 Hyderabad— Secundrabad
167 174 180 195 223 270 283 282 305
Banglore 164 172 180 194 228 272 284 286 306 Lucknow 161 166 174 185 215 265 270 274 297 Ahmedabad 168 171 174 188 222 271 272 262 291 Jaipur 176 183 188 205 244 308 311 312 334 Patna 180 191 190 199 229 286 284 282 299 Srinagar 174 184 191 200 215 262 280 300 319 Trivandrum 172 178 184 198 231 280 297 301 309 Cuttack-Bhubaneshwar 169 176 184 196 221 266 270 272 290 Bhopal 170 180 188 204 238 295 296 295 318 Chandigarh 171 178 183 194 217 265 278 284 299 Shillong 164 166 175 183 208 257 274 268 284

613
PRICES Consumer Price Index Numbers for Urban Non-Manual Employees
No:-28.16 (Concld.) (Base 1960=100) 1978-79 1979-80 1980-81 1981-82 1982-83 1983-84 1984-85 1985-86 1986-87 1987-88* Centre
11 12 13 14 15 16 17 18 19 20
All India* 306 330 369 413 446 492 532 568 613 656
Bombay 285 315 347 393 440 493 538 568 612 666
Delhi-New Delhi 303 321 352 395 428 468 508 551 597 645
Calcutta 279 297 331 367 384 418 451 481 530 562
Madras 321 350 390 439 470 531 577 611 671 736
Hyderabad—
Secundrabad
318 346 388 439 469 505 551 589 644 690
Banglore 309 343 381 428 457 504 546 583 640 692
Lucknow 305 331 360 399 438 484 519 555 597 640
Ahmedabad 298 320 351 399 424 475 512 553 597 639
Jaipur 338 361 407 459 496 536 571 618 685 745
Patna 308 329 362 400 459 513 567 605 648 693
Srinagar 344 365 407 447 464 499 542 597 642 688
Trivandrum 319 349 406 468 498 561 613 637 698 749
Cuttack-
Bhubaneshwar
301 329 362 398 451 503 523 566 620 664
Bhopal 319 340 388 443 475 521 563 609 651 671
Chandigarh 308 327 364 406 434 469 505 533 568 614
Shillong 296 322 363 397 460 510 546 630 676 687Source :—Central Statistical Organisation.
** Average of seven months from April, 1987 to October, 1987. * Based on indices of 45 cities and towns. Note :— The series 1960 = 100 discontinued w.e.f. November, 1987.

614
PRICES Consumer Price Index Numbers for Urban Non-Manual Employees
No:-28.17 (Base 1984-85=100) Centre 1988-89 1989-90 1990-91 1995-96 1999- 2000-01 2001-02 2004-05 2005-06 2006-07
1 2 3 4 5 6 7 8 9 10 11 All India* 136 145 161 259 352 371 390 436 456 486 Mumbai 130 139 154 260 353 375 394 434 449 478 Delhi 135 143 156 247 359 381 398 446 472 499 Calcutta 135 146 164 251 328 344 355 398 416 439 Chennai 141 152 168 284 386 420 456 520 543 569 Hyderabad 138 150 164 272 357 383 410 459 488 526 Bangalore 137 147 161 257 365 389 412 456 480 513 Lucknow 133 139 158 247 326 342 364 421 438 465 Ahmedabad 130 137 153 238 316 337 350 385 400 426 Jaipur 139 148 165 262 357 371 388 427 443 477 Patna 133 142 167 262 340 344 359 396 418 451 Srinagar 138 146 150 194 364 393 403 430 449 475 Trivandrum 129 141 152 247 338 362 384 449 479 507 Cuttack Bhubaneshwar
132 139 154 247 357 365 379 428 447 479
Bhopal 140 151 166 255 343 361 375 394 416 456 Chandigarh 142 156 176 280 429 445 464 561 605 637 Shillong 147 157 179 270 359 382 406 445 466 499
Source :—Central Statistical Organisation. * Based on indices of 59 cities and towns.

615
PRICES Commoditywise Procurement Prices in Haryana
No:-28.18 (Rs. per Quintal) Paddy Wheat Year/District
Common Fine Superfine Grade I Grade II Maize
1 2 3 4 5 6 7 1980-81 105 109 113 117 115 105
1985-86 142 146 150 157 — 130
1990-91 205 215 225 215 — 180
1991-92 230 240 250 225 — 210
1992-93 270 280 290 280 — 245
1993-94 310 330 350 355 — 265
1994-95 340 375 380 350 — 290
1995-96 360 395 395 360 — 310
1996-97 380 — 415 380 — 320
Grade ‘A’ 1997-98 415 — 445 470 — 360
1998-99 440 — 470 510 — 390
1999-00 490 — 520 550 — 360
2000-01 510 — 540 580 — 445
2001-02 530 — 560 610 — 485
2002-03 550 — 580 630 — 490
2003-04 550 — 580 630 — 505
2004-05 560 — 590 630 — 525
2005-06 570 — 600 640 — 540
2008-09 900 — 930 1000 — 840
2009-10 1,000 — 1,030 1,080 — 840
2010-11 1,000 — 1,030 1,100 — 880Source :—Food and Supplies Department, Haryana.
Note :—1. Prior to 1990-91 there used to be two grades of wheat. 2. Since 1997-98, there are only two varieties of Paddy i.e. common and Grade ‘A’.

617
SECTION XXIX PLAN OF HARYANA
This section contains Major Headwise outlay and expenditure under Five Year / Annual Plans in Haryana and Funds released under Decentralised Planning in Haryana.
Table 29.1—Shows the outlay and expenditure under Five Year/Annual Plans.
Table 29.2—Shows funds released under decentralised planning in Haryana.

618

619
PLAN OF HARYANA Outlay and Expenditure under Five-Year/Annual Plans
No. 29.1 (`. in lakh)
Fourth Five-Year Plan 1969-74 Major-Head of Development
Expenditure Percentage to total expenditure 1 2 3
1. Agriculture and Allied Activities 2633 7.35
2. Rural Development 149 0.42
3. Special Area Programme — —
4. Irrigation & Flood Control 13418 37.45
5. Energy 8753 24.43
6. Industry & Minerals 549 1.53
7. Transport 5198 14.51
8. Science, Technology and Environment — —
9. General Economic Services 206 0.58
10. Decentralised Planning — —
11. Social Services 4877 13.61
General Services 43 0.12
Grand Total 35826 100.00
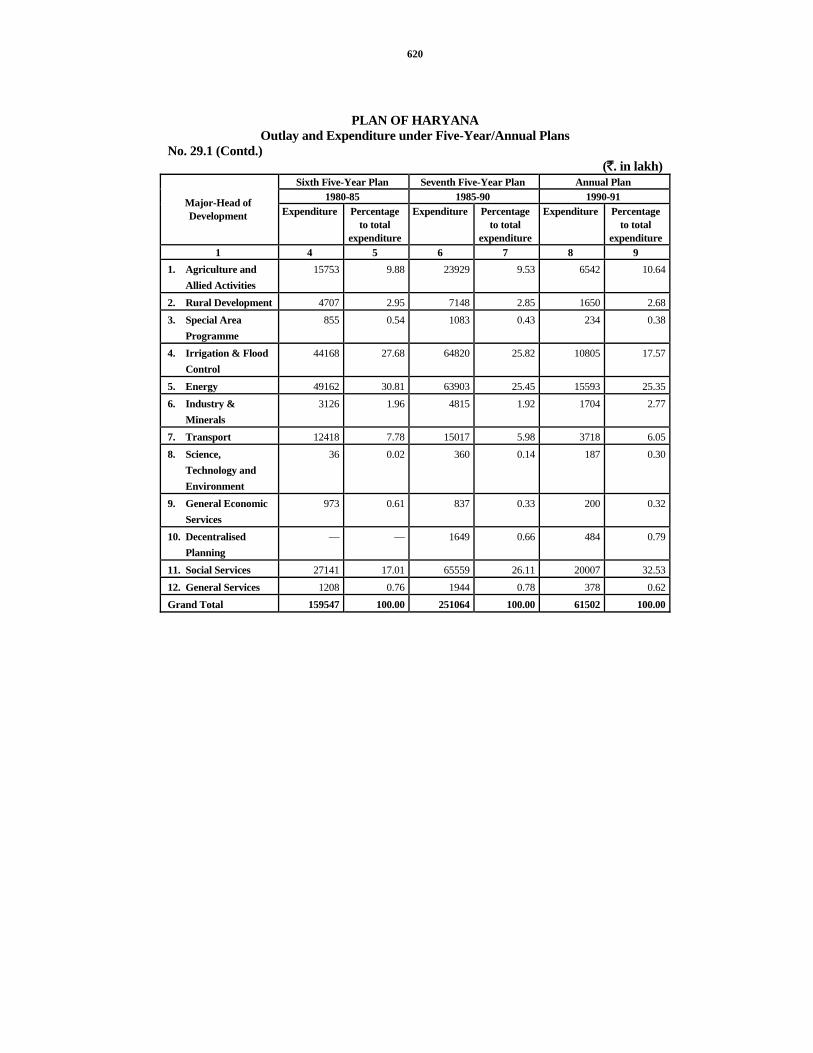
620
PLAN OF HARYANA Outlay and Expenditure under Five-Year/Annual Plans
No. 29.1 (Contd.) (`. in lakh)
Sixth Five-Year Plan Seventh Five-Year Plan Annual Plan 1980-85 1985-90 1990-91 Major-Head of
Development Expenditure Percentage to total
expenditure
Expenditure Percentage to total
expenditure
Expenditure Percentage to total
expenditure 1 4 5 6 7 8 9
1. Agriculture and Allied Activities
15753 9.88 23929 9.53 6542 10.64
2. Rural Development 4707 2.95 7148 2.85 1650 2.683. Special Area
Programme 855 0.54 1083 0.43 234 0.38
4. Irrigation & Flood Control
44168 27.68 64820 25.82 10805 17.57
5. Energy 49162 30.81 63903 25.45 15593 25.356. Industry &
Minerals 3126 1.96 4815 1.92 1704 2.77
7. Transport 12418 7.78 15017 5.98 3718 6.058. Science,
Technology and Environment
36 0.02 360 0.14 187 0.30
9. General Economic Services
973 0.61 837 0.33 200 0.32
10. Decentralised Planning
— — 1649 0.66 484 0.79
11. Social Services 27141 17.01 65559 26.11 20007 32.5312. General Services 1208 0.76 1944 0.78 378 0.62Grand Total 159547 100.00 251064 100.00 61502 100.00

621
PLAN OF HARYANA Outlay and Expenditure under Five-Year/Annual Plans
No. 29.1 (Contd.) (` in lakh)
Eighth Five-Year Plan 1992-97
Major-Head of Development Expenditure Percentage to total
expenditure 1 10 11
1. Agriculture and Allied Activities 45158 9.222. Rural Development 12540 2.563. Special Area Programme 3991 0.814. Irrigation & Flood Control 79702 16.275. Energy 120395 24.576. Industry & Minerals 16780 3.427. Transport 30650 6.268. Science, Technology & Environment 677 0.149. General Economic Services 1458 0.3010. Decentralised Planning 4600 0.9411. Social Services 170007 34.7012. General Services 3961 0.81Grand Total 489919 100.00

622
PLAN OF HARYANA Outlay and Expenditure under Five-Year/Annual Plans
No. 29.1 (Contd.) (`in lakh)
Ninth Five Year Plan Tenth Five Year Plan Eleventh Five Year Plan 1997-2002 2002-2007 2007-2012
Major-Head of Development
Expenditure Percentage to total
expenditure
Expenditure Percentage to total
expenditure
Approved Outlay
Percentage to total
approved outlay
1 12 13 14 15 16 17
1. Agriculture and Allied Activities
47620 5.96 59330 4.57 163882 4.68
2. Rural Development 29111 3.65 60790 4.68 126842 3.62
3. Special Area Programme
6559 0.82 10616 0.82 12740 0.36
4. Irrigation & Flood Control
159196 19.93 163449 12.59 416500 11.90
5. Energy 154798 19.38 200146 15.42 471346 13.47
6. Industry & Minerals 44901 5.62 65300 5.03 38952 1.11
7. Transport 58125 7.28 145631 11.22 433535 12.39
8. Science, Technology & Environment
762 0.10 1696 0.13 1988 0.06
9. General Economic Services
1689 0.21 4350 0.34 9034 0.26
10. Decentralised Planning
4850 0.61 8243 0.64 129293 3.69
11. Social Services 281447 35.24 561304 43.24 1669744 47.71
12. General Services 9554 1.20 17109 1.32 26144 0.75
Grand Total 798612 100.00 1297964 100.00 3500000 100.00

PLAN OUTLAY AND EXPENDITUREIN HARYANA (` in Crore)
225.
00
1800
.00
2900
.00
700.
00 5700
.00
1200
0.00
3500
0.00
1040
0.00
358.
26
1595
.47
2510
.64
615.
02
4899
.19
1297
9 .64
9624
.44
9000
0.00
*
1340
0.00
@
1110
0.00
1450
0.00
*
9574
.67
0.00
10000.00
20000.00
30000.00
40000.00
50000.00
60000.00
70000.00
80000.00
90000.00
100000.00
69-7
4
80-8
5
85-9
0
90-9
1
92-9
7
02-0
7
07-1
2
09-1
0
10-1
1
11-1
2
12-1
7
12-1
3
Outlay Expenditure
@ Revised outlay * Proposed outlay

623
PLAN OF HARYANA Outlay and Expenditure under Five-Year/Annual Plans
No. 29.1 (Contd.) (` in lakh)
Annual Plan 2008-09 Major-Head of Development
Expenditure Percentage to total expenditure1 18 19
1. Agriculture and Allied Activities 36933 5.20
2. Rural Development 48286 6.79
3. Special Area Programme 2192 0.31
4. Irrigation & Flood Control 80250 11.29
5. Energy 86423 12.16
6. Industry & Minerals 13428 1.89
7. Transport 91779 12.91
8. Science, Technology & Environment 601 0.08
9. General Economic Services 1922 0.27
10. Decentralised Planning 10062 1.42
11. Social Services 327975 46.14
12. General Services 10977 1.54
Grand Total 710828 100.00

624
PLAN OF HARYANA Outlay and Expenditure under Five-Year/Annual Plans
No. 29.1 (Contd.) (` in lakh)
Annual Plan 2009-10 Annual Plan 2010-11 Annual Plan 2011-12
Major-Head of Development Expenditure Percentage to total
expenditure
Expenditure Percentage to Revised
Outlay
Revised outlay
Percentage to total Revised outlay
1 20 21 22 23 24 25 A. State Budget
1. Agriculture and Allied Activities
46023 4.78 68,576 7.16 1,03,484 7.72
2. Rural Development 59412 6.17 69,649 7.27 94,162 7.03
3. Special Area Programme
2670 0.28 2,109 0.22 3,000 0.22
4. Irrigation & Flood Control
79811 8.29 73,203 7.65 98,500 7.35
5. Energy 103037 10.71 96,612 10.09 1,15,836 8.65
6. Industry & Minerals 5749 0.60 6,523 0.68 10,062 0.75
7. Transport 130984 13.61 1,04,178 10.88 1,24,233 9.27
8. Science, Technology & Environment
3114 0.32 1,062 0.11 2,144 0.16
9. General Economic Services
2615 0.27 1,905 0.20 2,226 0.17
10. Decentralised Planning 27507 2.86 15,216 1.59 23,213 1.73
11. Social Services 488035 50.71 5,07,905 53.05 7,49,435 55.93
12. General Services 13487 1.40 10,529 1.10 13,705 1.02
Tot al 962444 100.00 9,57,467 100.00 13,40,000 100.00B. State Public Sector Enterprises
-- -- 5,70,019 -- 4,96,000 --
C. Local Bodies -- -- 22,231 -- 1,97,000 --Grand Total -- -- 15,49,717 -- 20,33,000 --

625
PLAN OF HARYANA Outlay and Expenditure under Five-Year/Annual Plans
No. 29.1 (Concld.) (` in lakh)
Twelth Five Year Plan 2012-17 Annual Plan 2012-13
Major-Head of Development Proposed outlay Percentage to total proposed
outlay
Proposed outlay
Percentage to total
proposed outlay
1 26 27 28 29
A. State Budget
1. Agriculture and Allied Activities 5,88,000 6.53 95,008 6.55
2. Rural Development 6,22,300 6.91 1,07,259 7.40
3. Special Area Programme 20,200 0.22 3,300 0.23
4. Irrigation & Flood Control 7,70,000 8.55 86,000 5.93
5. Energy 7,40,200 8.23 1,35,668 9.36
6. Industry & Minerals 64,700 0.73 8,701 0.60
7. Transport 9,86,000 10.96 1,46,594 10.11
8. Science, Technology & Environment
12,000 0.13 2,315 0.16
9. General Economic Services 20,000 0.22 3,149 0.22
10. Decentralised Planning 1,55,500 1.73 29,441 2.03
11. Social Services 49,47,430 54.97 8,19,891 56.54
12. General Services 73,670 0.82 12,674 0.87
Total 90,00,000 100.00 14,50,000 100.00B. State Public Sector Enterprises 73,57,000 -- 9,95,000 --C. Local Bodies 13,19,000 -- 2,03,500 --Grand Total 1,76,76,000 -- 26,48,500 --
Source :—Department of Economic and Statistical Analysis, Haryana
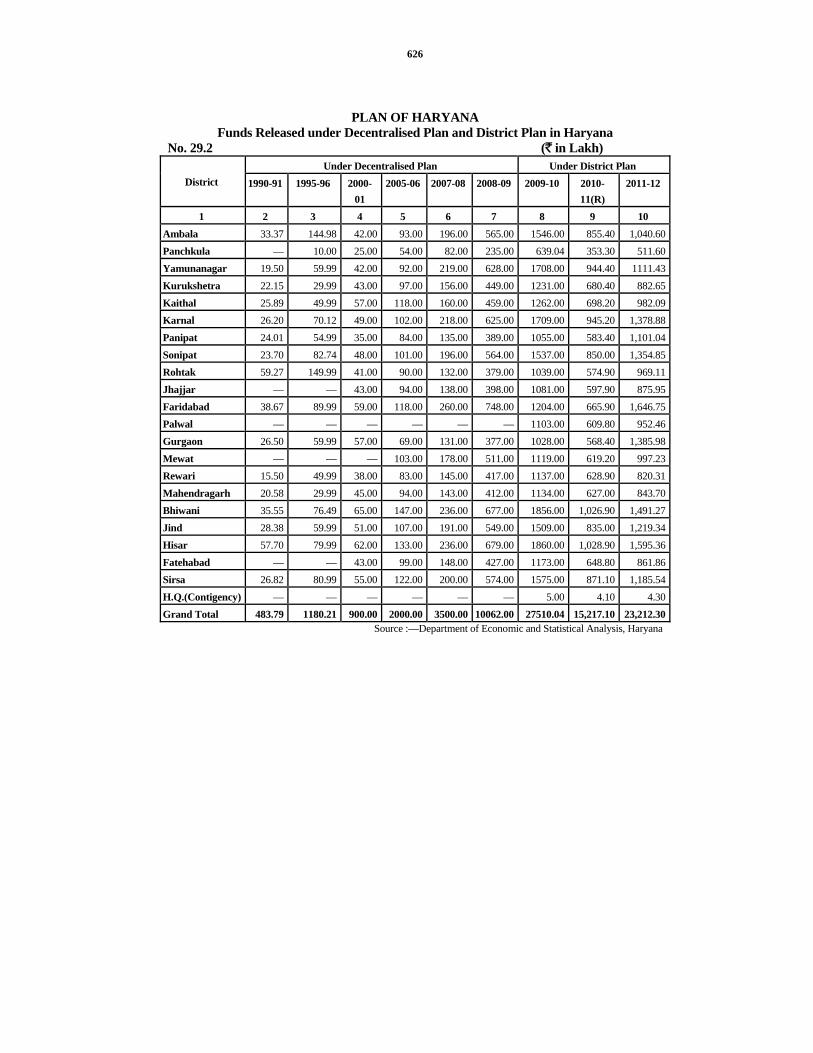
626
PLAN OF HARYANA Funds Released under Decentralised Plan and District Plan in Haryana
No. 29.2 (` in Lakh) Under Decentralised Plan Under District Plan
District 1990-91 1995-96 2000-01
2005-06 2007-08 2008-09 2009-10 2010-11(R)
2011-12
1 2 3 4 5 6 7 8 9 10 Ambala 33.37 144.98 42.00 93.00 196.00 565.00 1546.00 855.40 1,040.60Panchkula — 10.00 25.00 54.00 82.00 235.00 639.04 353.30 511.60Yamunanagar 19.50 59.99 42.00 92.00 219.00 628.00 1708.00 944.40 1111.43Kurukshetra 22.15 29.99 43.00 97.00 156.00 449.00 1231.00 680.40 882.65Kaithal 25.89 49.99 57.00 118.00 160.00 459.00 1262.00 698.20 982.09Karnal 26.20 70.12 49.00 102.00 218.00 625.00 1709.00 945.20 1,378.88Panipat 24.01 54.99 35.00 84.00 135.00 389.00 1055.00 583.40 1,101.04Sonipat 23.70 82.74 48.00 101.00 196.00 564.00 1537.00 850.00 1,354.85Rohtak 59.27 149.99 41.00 90.00 132.00 379.00 1039.00 574.90 969.11Jhajjar — — 43.00 94.00 138.00 398.00 1081.00 597.90 875.95Faridabad 38.67 89.99 59.00 118.00 260.00 748.00 1204.00 665.90 1,646.75Palwal — — — — — — 1103.00 609.80 952.46Gurgaon 26.50 59.99 57.00 69.00 131.00 377.00 1028.00 568.40 1,385.98Mewat — — — 103.00 178.00 511.00 1119.00 619.20 997.23Rewari 15.50 49.99 38.00 83.00 145.00 417.00 1137.00 628.90 820.31Mahendragarh 20.58 29.99 45.00 94.00 143.00 412.00 1134.00 627.00 843.70Bhiwani 35.55 76.49 65.00 147.00 236.00 677.00 1856.00 1,026.90 1,491.27Jind 28.38 59.99 51.00 107.00 191.00 549.00 1509.00 835.00 1,219.34Hisar 57.70 79.99 62.00 133.00 236.00 679.00 1860.00 1,028.90 1,595.36Fatehabad — — 43.00 99.00 148.00 427.00 1173.00 648.80 861.86Sirsa 26.82 80.99 55.00 122.00 200.00 574.00 1575.00 871.10 1,185.54H.Q.(Contigency) — — — — — — 5.00 4.10 4.30Grand Total 483.79 1180.21 900.00 2000.00 3500.00 10062.00 27510.04 15,217.10 23,212.30
Source :—Department of Economic and Statistical Analysis, Haryana
627
PART– III
OTHER STATISTICS

628

629
SECTION XXX JOINT STOCK COMPANIES
The data for this section have been collected from the Ministry of Law, Justice and Company Affairs (Government of India), New Delhi.
The tables 30.1 and 30.2 show the districtwise number of registered, public and private limited companies operating in Haryana.
Table 30.3 gives the distribution of new joint stock companies registered in Haryana according to size and industrial classification.
Table 30.4 shows the number and paid-up capital of companies in India.

630

631
JOINT STOCK COMPANIES Companies Registered in Haryana (During the year)
No. 30.1 Year/District Number of Companies
Registered Authorised Capital
(lakh `) 1 2 3
1966-67 12 1141970-71 29 4931975-76 24 2641980-81 40 8441985-86 111 2,1181991-92 379 4,8491995-96 467 10,0631997-98 357 88,3491998-99 317 16,4401999-00 272 14,4622001-02 185 14,3642002-03 205 2,437Ambala 25 212Panchkula 3 25Yamunanagar 4 36Kurukshetra 11 55Kaithal 1 5Karnal 11 33Panipat 8 52Sonipat 4 9Rohtak 8 49Jhajjar 2 3Faridabad 60 250Gurgaon 46 1,438Rewari 3 27Mahendragarh — —Bhiwani 1 50Jind 2 3Hisar 10 160Fatehabad — —Sirsa 6 30Others* — —
Source :-- Ministry of Law, Justice and Company Affairs, Government of India, New Delhi. * Unclassified.

632
JOINT STOCK COMPANIES Number of Public and Private Limited Companies Operating in Haryana
No. 30.2 Number of Companies
Year/District Public Private Total
1 2 3 4 1966-67 46 161 2071970-71 53 208 2611975-76 96 306 4021980-81 122 403 5251985-86 192 814 1,0061990-91 272 2,084 2,3561995-96 502 3,704 4,2061998-99 676 4,774 5,4501999-00 701 5,021 5,7222000-01 702 5,187 5,8892001-02 715 5,154 5,8692002-03 736 5,366 6,102Ambala 116 602 718Panchkula 15 37 52Yamunanagar 17 90 107Kurukshetra 18 125 143Kaithal 13 21 34Karnal 26 381 407Panipat 16 249 265Sonipat 31 233 264Rohtak 29 356 385Jhajjar 2 45 47Faridabad 119 1,489 1,608Gurgaon 172 898 1,070Rewari 11 19 30Mahendragarh 12 15 27Bhiwani 17 87 104Jind 13 137 150Hisar 77 472 549Fatehabad — 2 2Sirsa 8 70 78Others* 24 38 62
Source :-- Ministry of Law, Justice and Company Affairs, Government of India, New Delhi. *Companies which have not intimated their registered office addresses.
JOINT STOCK COMPANIES

633
Distribution of New Joint Stock Companies in Haryana during 2005-06 according to Size, Pattern and Industrial Classification
No. 30.3 Size Group according to authorised Capital
Industrial Classification Below ` 1 lakh
` 1 lakh and above but under ` 5 lakhs
` 5 lakhs and above but under ` 10 lakhs
` 10 lakhs and above but under ` 25 lakhs
` 25 lakh and
above
Association not having share
capital Total
1 2 3 4 5 6 7 8 0. Agriculture, Hunting
and Fishing 0 1 0 0 1 0 2
1. Mining and Quarrying 0 0 0 0 0 0 02. Manufacturing of
Food Products 0 15 8 4 12 0 39
3. Manufacturing of Basic Chemicals
0 34 25 7 18 0 84
4. Electricity Generation, Transmission and Distribution
0 1 1 0 1 0 3
5. Construction 0 20 8 15 15 0 586. Wholesale and Retail
trade and Restaurants and Hotels
0 28 10 10 9 0 57
7. Transport, Storage and Communication
0 5 4 0 3 0 12
8. Financing Insurance Real Estate and Business Services
0 71 11 18 12 0 112
9. Community, Social and personal Services
0 6 4 2 2 0 14
Total 0 181 71 56 73 0 381Source :—Ministry of Law, Justice and Company Affairs, Government of India, New Delhi.

634
JOINT STOCK COMPANIES Number and Paid-up Capital of Joint Stock Companies Limited by
Shares at Work in India No. 30.4 (Paid-up Capital in crore of `)
Public Limited Private Limited Total Year Number Paid-up capital Number Paid-up capital Number Paid-up
capital 1 2 3 4 5 6 7
1966-67 6,543 1,669.5 20,484 1,731.8 27,027 3,401.31967-68 6,569 1,783.4 20,775 1,890.4 27,344 3,673.81970-71 6,690 2,091.5 23,632 2,412.1 30,322 4,503.61975-76 7,836 3,143.9 35,570 6,475.6 43,406 9,619.51980-81 9,740 4,681.9 52,974 11,462.1 62,714 16,144.01985-86 20,280 12,495.2 1,04,099 24,099.4 1,24,379 36,594.61990-91 27,358 38,567.8 1,97,094 36,230.1 2,24,452 74,797.91991-92 29,792 50,809.0 2,20,569 33,833.3 2,50,361 84,642.31992-93 34,112 57,929.6 2,41,552 36,125.5 2,75,664 94,055.11993-94 38,000 71,836.2 2,67,625 41,985.7 3,05,625 1,13,821.91994-95 46,662 84,257.2 3,06,630 47,066.5 3,53,292 1,31,323.71995-96 57,402 1,13,042.24 3,51,740 51,046.14 4,09,142 1,64,088.381996-97 64,109 1,27,399.57 3,86,841 63,119.04 4,50,950 1,90,518.611997-98 68,546 1,46,225.20 4,15,954 71,423.41 4,84,500 2,17,648.611998-99 71,033 1,79,850.69 4,40,957 83,508.59 5,11,990 2,63,359.281999-00 73,862 2,20,348.39 4,68,572 98,461.86 5,42,434 3,18,810.252000-01 76,270 2,46,569.82 4,92,830 1,10,676.97 5,69,100 3,57,246.792001-02 76,279 2,76,467.41 5,12,967 1,29,285.82 5,89,246 4,05,753.232002-03 76,523 3,20,629.21 5,35,632 1,36,429.50 6,12,155 4,57,058.712003-04 77,380 3,49,494.06 5,64,132 1,49,296.69 6,41,512 4,98,790.752004-05(P) 78,328 4,68,668.12 6,01,321 1,85,353.45 6,79,649 6,54,021.57
Source :—Ministry of Law, Justice and Company Affairs Government of India, New Delhi. P— Provisional

635
SECTION XXXI PUBLIC UNDERTAKINGS
The tables in this section show the working of Public Undertakings in Haryana.
Table 31.1 shows loans advanced by Haryana Financial Corporation to various industries.
Table 31.2 indicates loans advanced by Haryana Financial Corporation to weaker sections and priority sectors.
Table 31.3 shows the amount of loan received by Haryana Housing Board and houses constructed for different income groups.
Table 31.4 shows the progress of Haryana Agro-Industries Corporation.

636
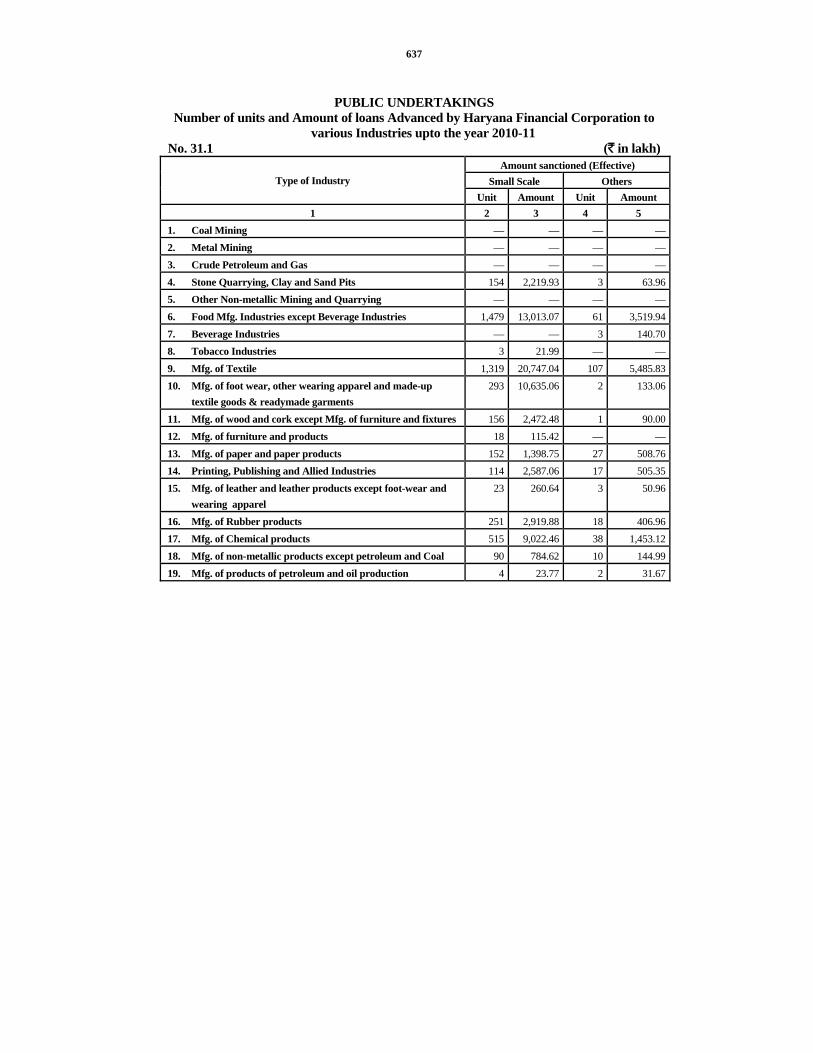
637
PUBLIC UNDERTAKINGS
Number of units and Amount of loans Advanced by Haryana Financial Corporation to various Industries upto the year 2010-11
No. 31.1 (` in lakh) Amount sanctioned (Effective)
Small Scale Others Type of Industry Unit Amount Unit Amount
1 2 3 4 5 1. Coal Mining — — — —2. Metal Mining — — — —3. Crude Petroleum and Gas — — — —4. Stone Quarrying, Clay and Sand Pits 154 2,219.93 3 63.965. Other Non-metallic Mining and Quarrying — — — —6. Food Mfg. Industries except Beverage Industries 1,479 13,013.07 61 3,519.947. Beverage Industries — — 3 140.708. Tobacco Industries 3 21.99 — —9. Mfg. of Textile 1,319 20,747.04 107 5,485.8310. Mfg. of foot wear, other wearing apparel and made-up
textile goods & readymade garments 293 10,635.06 2 133.06
11. Mfg. of wood and cork except Mfg. of furniture and fixtures 156 2,472.48 1 90.0012. Mfg. of furniture and products 18 115.42 — —13. Mfg. of paper and paper products 152 1,398.75 27 508.7614. Printing, Publishing and Allied Industries 114 2,587.06 17 505.3515. Mfg. of leather and leather products except foot-wear and
wearing apparel 23 260.64 3 50.96
16. Mfg. of Rubber products 251 2,919.88 18 406.9617. Mfg. of Chemical products 515 9,022.46 38 1,453.1218. Mfg. of non-metallic products except petroleum and Coal 90 784.62 10 144.9919. Mfg. of products of petroleum and oil production 4 23.77 2 31.67

638
PUBLIC UNDERTAKINGS
Number of units and Amount of loans Advanced by Haryana Financial Corporation to various Industries upto the year 2010-11
No. 31.1(Contd.) (` in lakh) Amount Disbursed Amount outstanding
Small Scale Others Small Scale Others Type of Industry Unit Amount Unit Amount Unit Amount Unit Amount
1 6 7 8 9 10 11 12 13 1. Coal Mining — — — — — — — —2. Metal Mining — — — — — — — —3. Crude Petroleum and Gas — — — — — — — —4. Stone Quarrying, Clay and
Sand Pits 206 1,911.11 6 72.54 6 19.09 5. Other Non-metallic Mining
and Quarrying — — — — — — — —6. Food Mfg. Industries except
Beverage Industries 1,872 12,346.07 82 3,181.83 49 572.07 7 334.957. Beverage Industries — — 3 117.55 — — — —8. Tobacco Industries 3 16.2 — — — — — —9. Mfg. of Textile 2,049 19,705.42 123 3,987.19 81 1,343.78 15 666.6210. Mfg. of foot wear, other
wearing apparel and made-up textile goods & readymade garments 420 8,551.99 3 35.62 42 2,029.03 — —
11. Mfg. of wood and cork except Mfg. of furniture and fixtures 191 1,651.77 — — 17 103.67 — —
12. Mfg. of furniture and products 14 59.36 — — — — — —
13. Mfg. of paper and paper products 139 1,288.94 22 268.90 11 132.52 — —
14. Printing, Publishing and Allied Industries 185 2,013.70 14 309.15 11 85.68 — —
15. Mfg. of leather and leather products except foot-wear and wearing apparel 19 123.60 4 53.93 — — — —
16. Mfg. of Rubber products 375 2,684.03 20 364.96 9 85.64 — —17. Mfg. of Chemical products 766 7630.91 42 1,226.08 22 300.79 2 105.8818. Mfg. of non-metallic products
except petroleum and Coal 82 455.41 8 49.25 — — — —19. Mfg. of products of petroleum
and oil production 1 0.92 1 1.67 — — — —
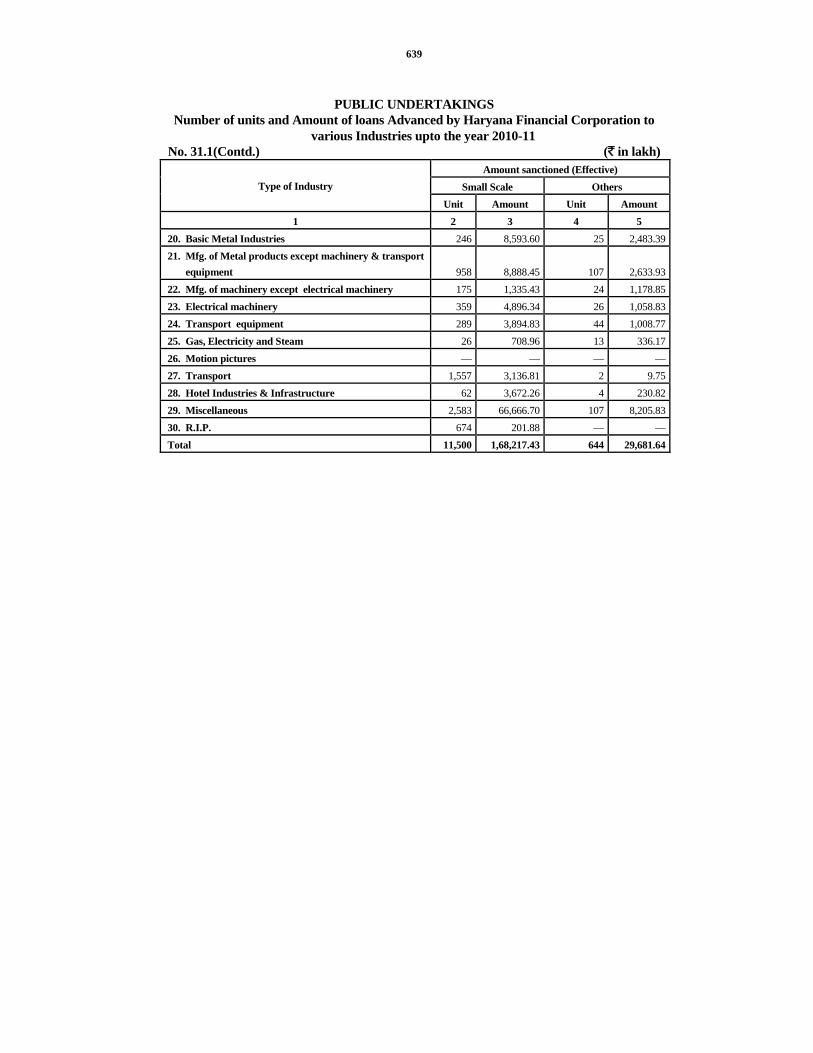
639
PUBLIC UNDERTAKINGS
Number of units and Amount of loans Advanced by Haryana Financial Corporation to various Industries upto the year 2010-11
No. 31.1(Contd.) (` in lakh) Amount sanctioned (Effective)
Small Scale Others Type of Industry
Unit Amount Unit Amount 1 2 3 4 5
20. Basic Metal Industries 246 8,593.60 25 2,483.3921. Mfg. of Metal products except machinery & transport
equipment 958 8,888.45 107 2,633.9322. Mfg. of machinery except electrical machinery 175 1,335.43 24 1,178.8523. Electrical machinery 359 4,896.34 26 1,058.8324. Transport equipment 289 3,894.83 44 1,008.7725. Gas, Electricity and Steam 26 708.96 13 336.1726. Motion pictures — — — —27. Transport 1,557 3,136.81 2 9.7528. Hotel Industries & Infrastructure 62 3,672.26 4 230.8229. Miscellaneous 2,583 66,666.70 107 8,205.8330. R.I.P. 674 201.88 — —Total 11,500 1,68,217.43 644 29,681.64

640
PUBLIC UNDERTAKINGS
Number of units and Amount of loans Advanced by Haryana Financial Corporation to various Industries upto the year 2010-11
No. 31.1 (Concld.) (` in lakh) Amount Disbursed Amount outstanding
Small Scale Others Small Scale Others Type of Industry
Unit Amount Unit Amount Unit Amount Unit Amount 6 7 8 9 10 11 12 13
20. Basic Metal Industries 613 7,439.77 50 2,088.04 48 589.46 6 212.1221. Mfg. of Metal products
except machinery & transport equipment 1,151 8,182.90 105 1,915.08 3 87.97 — —
22. Mfg. of machinery except electrical machinery 257 1,313.80 24 1,139.08 — — — —
23. Electrical machinery 501 3,463.58 26 638.64 5 25.63 — —24. Transport equipment 322 3,077.84 46 948.45 19 563.08 1 3.7525. Gas, Electricity and Steam 38 474.24 10 286.83 5 132.20 — —26. Motion pictures — — — — — — — —27. Transport 1,505 2,930.02 4 8.83 30 53.56 2 3.2028. Hotel Industries &
Infrastructure 121 4,002.65 8 199.21 12 924.20 — —29. Miscellaneous 3,973 56,395.42 214 8,031.81 499 10,479.87 13 549.3430. R.I.P. 651 189.1 — — — — — —Total 15,454 1,45,908.75 815 24,924.64 869 17,528.24 46 1,875.86
Source :—Haryana Financial Corporation, Chandigarh.

641
PUBLIC UNDERTAKINGS
Purposewise loans advanced to weaker sections and priority sector in Haryana by Financial Corporation during 2010-11
No. 31.2 (Amount in lakh `)
Weaker Sections Priority Sections
Purpose
No.of Loanees
Amount disbursed
Average amount
disbursed per
Loanee
No.of Loanees
Amount disbursed
Average amount
disbursed per
Loanee
1 2 3 4 5 6 7 1. Agricultural Development,
purchase of land, land Development, Tube-wells, Pumping sets, Dairy Farming, Poultry Farming etc. — — — — — —
2. Small Scale Industries Shoe Making, Hosiery, (Handloom, etc.) — — — 22 336.91 15.31
3. Housing — — — — — —4. Transport — — — — — —5. Miscellaneous — — — — — —Total — — — 22 336.91 15.31
Source :—Haryana Financial Corporation, Chandigarh.

642
HOUSING BOARD HARYANA

643
PUBLIC UNDERTAKINGS
Loans Received and Houses Constructed-by the Housing Board, Haryana No. 31.3
Loans (` in lakh) Year/District From State
Govt. From HUDCO From
Debentures From Central
Govt. Others Total
1 2 3 4 5 6 7 1972-73 35.00 15.00 55.00 — — 105.001975-76 7.00 208.00 55.00 — — 270.001980-81 77.00 150.20 55.00 — — 282.201985-86 88.00 655.56 110.00 — — 853.561990-91 30.00 453.00 — — — 483.001995-96 — 1,545.69 — — — 1,545.692000-01 — 383.62 — — — 383.622005-06 — — — — — —2008-09 — — — — — —2009-10 — — — — — —2010-11 — — — — — —Ambala — — — — — —Panchkula — — — — — —Yamunanagar — — — — — —Kurukshetra — — — — — —Kaithal — — — — — —Karnal — — — — — —Panipat — — — — — —Sonipat — — — — — —Rohtak — — — — — —Jhajjar — — — — — —Faridabad — — — — — —Palwal — — — — — —Gurgaon — — — — — —Mewat — — — — — —Rewari — — — — — —Mahendragarh — — — — — —Bhiwani — — — — — —Jind — — — — — —Hisar — — — — — —Fatehabad — — — — — —Sirsa — — — — — —* Includes 3,033 rural houses.

644
PUBLIC UNDERTAKINGS
Loans Received and Houses Constructed-by the Housing Board, Haryana No. 31.3 (Contd.)
Number of houses constructed During the year
Year/District Economically Weakers
Sections of Society
Low Income Group
Middle Income Group
Higher Income Group
Others Total
1 8 9 10 11 12 13 1972-73 500 — — — — 5001975-76 510 192 231 — — 9331980-81 1,234 820 847 — — 2,9011985-86 — 1,944 526 145 — 26151990-91 729 633 251 154 94 1,8611995-96 31 2,500 249 8 — 2,7882000-01 — 3,914 26 8 — 3,9482005-06 — 353 — — 280 6332008-09 20 — — 100 514 6342009-10 48 336 388 — 744 1,5162010-11 258 514 208 292 194 1,466Ambala — — — — — —Panchkula — — — — 170 170Yamunanagar — — — — — —Kurukshetra — — — — 18 18Kaithal — — — — — —Karnal — — — — 6 6Panipat — — — — — —Sonipat 22 176 — 152 — 350Rohtak — — — — — —Jhajjar — — — — — —Faridabad — 248 — — --- 248Palwal — — — — — —Gurgaon 236 — — — — 236Mewat --- — — — --- ---Rewari — — — — — —Mahendragarh — --- --- — — ---Bhiwani — 90 208 140 — 438Jind — --- — — — ---Hisar — — — — — —Fatehabad — — — — — —Sirsa — — — — — —
PUBLIC UNDERTAKINGS
Loans Received and Houses Constructed by the Housing Board, Haryana
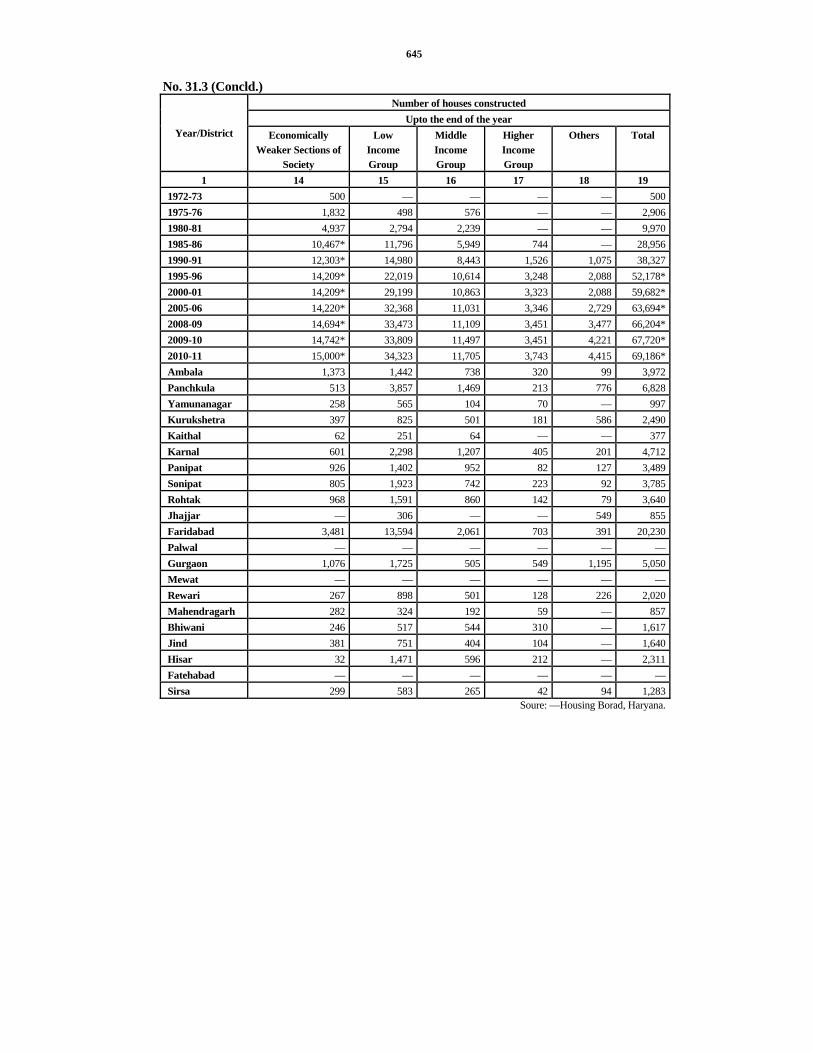
645
No. 31.3 (Concld.) Number of houses constructed
Upto the end of the year Year/District Economically
Weaker Sections of Society
Low Income Group
Middle Income Group
Higher Income Group
Others Total
1 14 15 16 17 18 19 1972-73 500 — — — — 5001975-76 1,832 498 576 — — 2,9061980-81 4,937 2,794 2,239 — — 9,9701985-86 10,467* 11,796 5,949 744 — 28,9561990-91 12,303* 14,980 8,443 1,526 1,075 38,3271995-96 14,209* 22,019 10,614 3,248 2,088 52,178*2000-01 14,209* 29,199 10,863 3,323 2,088 59,682*2005-06 14,220* 32,368 11,031 3,346 2,729 63,694*2008-09 14,694* 33,473 11,109 3,451 3,477 66,204*2009-10 14,742* 33,809 11,497 3,451 4,221 67,720*2010-11 15,000* 34,323 11,705 3,743 4,415 69,186*Ambala 1,373 1,442 738 320 99 3,972Panchkula 513 3,857 1,469 213 776 6,828Yamunanagar 258 565 104 70 — 997Kurukshetra 397 825 501 181 586 2,490Kaithal 62 251 64 — — 377Karnal 601 2,298 1,207 405 201 4,712Panipat 926 1,402 952 82 127 3,489Sonipat 805 1,923 742 223 92 3,785Rohtak 968 1,591 860 142 79 3,640Jhajjar — 306 — — 549 855Faridabad 3,481 13,594 2,061 703 391 20,230Palwal — — — — — —Gurgaon 1,076 1,725 505 549 1,195 5,050Mewat — — — — — —Rewari 267 898 501 128 226 2,020Mahendragarh 282 324 192 59 — 857Bhiwani 246 517 544 310 — 1,617Jind 381 751 404 104 — 1,640Hisar 32 1,471 596 212 — 2,311Fatehabad — — — — — —Sirsa 299 583 265 42 94 1,283
Soure: —Housing Borad, Haryana.
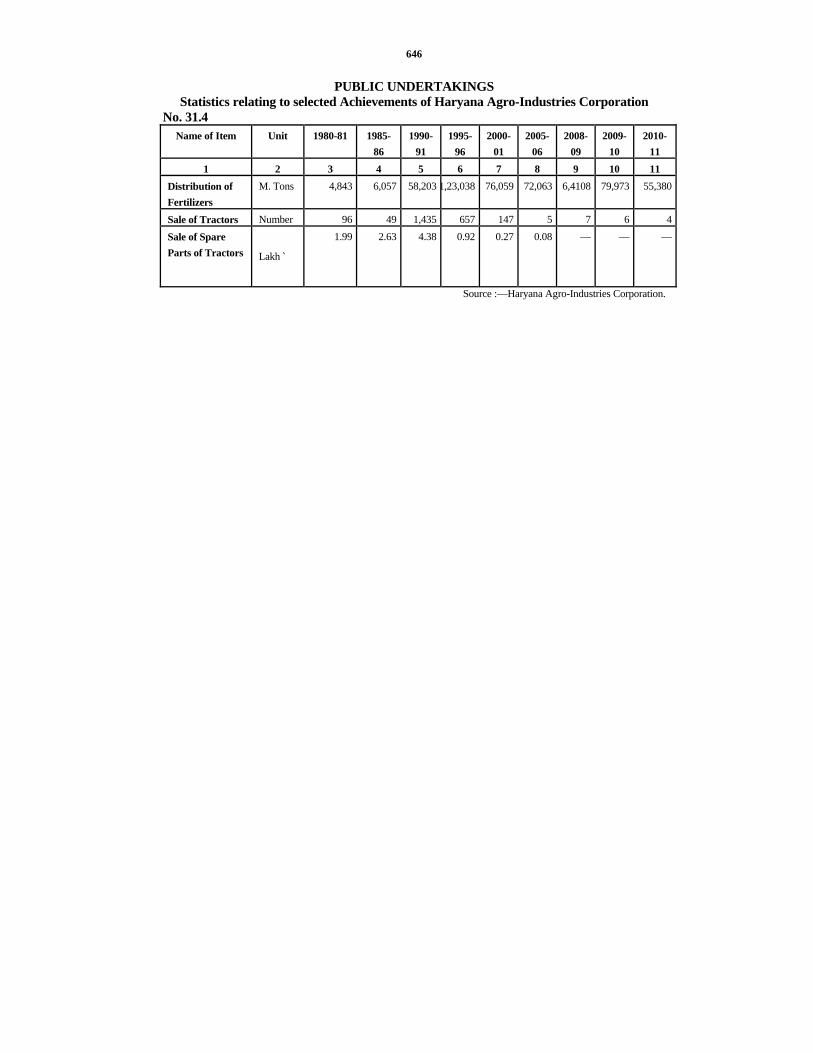
646
PUBLIC UNDERTAKINGS Statistics relating to selected Achievements of Haryana Agro-Industries Corporation
No. 31.4 Name of Item Unit 1980-81 1985-
86 1990-
91 1995-
96 2000-
01 2005-
06 2008-
09 2009-
10 2010-
11 1 2 3 4 5 6 7 8 9 10 11
Distribution of Fertilizers
M. Tons 4,843 6,057 58,203 1,23,038 76,059 72,063 6,4108 79,973 55,380
Sale of Tractors Number 96 49 1,435 657 147 5 7 6 4
Sale of Spare Parts of Tractors Lakh `
1.99 2.63 4.38 0.92 0.27 0.08 — — —
Source :—Haryana Agro-Industries Corporation.
647
SECTION XXXII LOCAL BODIES
This section presents data on number, population, income and expenditure of Municipal Committees/Councils/Corporations in Haryana.
The information has been collected from the Municipal Committees/Councils/ Corporations through the District Statistical Officers.
Table 32.1 shows the districtwise number, population, income and expenditure of Municipal Committees/Councils/Corporations in Haryana.
Table 32.2 shows the number, population, income and expenditure of Municipal Committees/ Councils/Corporations.
Tables 32.3 and 32.4 show the income and expenditure data of Municipal Committees/Councils/ Corporations in Haryana under various heads respectively.
Table 32.5 gives data on Gram Panchayats, Panchayat Samities and Zila Parishads in Haryana.

648

649
LOCAL BODIES Number, Population, Income and Expenditure of Municipal
Committees/Councils/Corporations in Haryana (Districtwise) No. 32.1 (` in lakh)
Accounts 2007-08 2008-09 2009-10
District
Number of Municipal
Committees/ Councils/
Corporation (2009-2010)
Population within Muni- cipal Commi- ttees/Councils/ Corporation
limits (Census 2001)
Income Expen- diture
Income Expen- diture
Income Expen- diture
1 2 3 4 5 6 7 8 9 Ambala 3 2,63,809 1,775 1,773 2,181 2,110 2,031 2,016Panchkula 3 2,01,645 1,991 1,590 4,928 2,843 4,398 2,645Yamunanagar 2 2,90,887 2,047 1,833 2,211 1,885 2,654 2,408Kurukshetra 4 2,15,820 1,387 1,436 1,517 1,407 1,388 1,324Kaithal 4 1,83,121 1,006 972 1,787 1,361 1,926 1,734Karnal 7 478,112 2,311 2,544 4,333 2,525 5,060 3,315Panipat 2 2,98,679 1,563 1,511 1,625 1,381 1,911 1,398Sonipat 4 3,21,432 3,005 3,202 7,482 3,047 7,538 3,972Rohtak 4 3,35,999 1,701 2,566 2,384 1,925 2,802 2,246Jhajjar 3 1,81,896 1,895 1,611 2,287 1,903 2,439 2,020Faridabad 1 1,054,981 24,468 22,759 33,438 30,133 35,511 30,908Palwal 3 149,753 — — 854 768 860 745Gurgaon 5 2,71,986 3,912 3,423 15,448 3,357 44,790 13,254Mewat 4 59,189 515 553 1,106 570 1,324 696Rewari 3 135,854 848 805 1,131 947 1,465 1,148Mahendragarh 4 1,01,936 890 783 1,716 906 1,835 1,376Bhiwani 5 2,59,024 999 926 1,945 1,033 2,428 1,864Jind 5 2,42,025 1,300 1,254 2,092 1,637 2,285 1,870Hisar 4 3,87,044 1,957 1,857 2,902 1,948 3,323 2,643Fatehabad 3 1,35,202 2,080 2,101 2,525 1,293 3,202 2,289Sirsa 5 2,92,840 1,277 1,226 1,901 1,221 2,392 1,767Total 78 58,61,234 56,927 54,725 95,793 64,200 1,31,562 81,638
Source :—District Statistical Officers. Note :—*Excluding the population of Municipal Committees which remained disolved.

650
LOCAL BODIES Number, Population, Income and Expenditure of Municipal
Committees/Councils/Corporations in Haryana (Districtwise) No. 32.2 (` in 000)
Accounts Accounts Accounts 2007-08 2008-09 2009-10
District
Name of Municipal Committees/
Councils/Corporations
Population within Muni- cipal Commi-
ttees/ Councils/ Corporations
limits (Census 2001)
Income Expen- diture
Income Expen- diture
Income Expen- diture
1 2 3 4 5 6 7 8 9 1. Ambala city 1,39,222 81,153 81,369 92,581 92,362 97,348 96,397 2. Naraingarh 18,209 13,335 10,928 13,882 11,376 15,702 15,244
Ambala
3. Mahesh Nagar/ Ambala Sadar
1,06,378 82,995 84,955 111,658 107,238 90,016 89,909
1. Kalka 30,887 12,929 13,301 32,513 11,082 47,700 18,374 2. Pinjore 29,766 20,908 21,868 53,827 27,175 60,474 31,220
Panchkula
3. Panchkula 1,40,992 1,65,244 1,23,840 406,417 246,008 3,31,663 2,14,935 1. Yamunanagar 1,89,587 1,09,768 99,961 130,726 110,313 1,93,606 1,79,979 Yamuna-
nagar 2. Jagadhri 1,01,300 94,900 83,323 90,420 78,222 71,840 60,850 1. Thanesar 1,22,704 84,116 84,264 84,133 75,926 80,283 74,603 2. Ladwa 22,439 10,708 11,233 15,874 15,444 19,252 18,805 3. Shahbad
Markanda 37,130 17,070 24,947 23,838 22,319 20,215 20,047
Kuruk- shetra
4. Pehowa 33,547 26,810 23,185 27,877 27,001 19,039 18,919 1. Kaithal 1,17,226 45,662 45,575 64,867 63,495 91,958 86,344 2. Pundri 17,022 3,832 3,531 5,319 4,643 6,552 5,723 3. Guhla Cheeka 32,126 45,533 44,374 86,966 59,546 61,675 59,146
Kaithal
4. Kalayat 16,747 5,591 3,686 21,517 8,393 32,453 22,167 1. Karnal 2,22,017 1,70,889 1,87,286 274,631 192,466 2,87,545 2,34,936 2. Gharaunda 30,179 18,535 24,760 27,725 19,050 30,141 24,068 3. Nilokheri 16,400 10,419 8,790 8,508 8,394 8,252 7,141 4. Indri 14,515 8,945 11,522 2,740 8,253 8,653 8,448 5. Taraori 22,205 9,921 9,946 10,461 10,247 18,718 18,040 6. Assandh 22,707 12,422 12,133 33,847 14,062 71,405 38,193
Karnal
7. Nissing — — — 69,377 46 81,293 634

651
LOCAL BODIES Number, Population, Income and Expenditure of Municipal
Committees/Councils/Corporations in Haryana (Districtwise) No. 32.2 (Contd.) (` in 000)
Accounts Accounts Accounts 2007-08 2008-09 2009-10
District
Name of Municipal Committees/
Councils/Corporations
Population within Muni- cipal Commi-
ttees/Councils/ Corporations
limits
Income Expen- diture
Income Expen- diture
Income Expen- diture
1 2 3 4 5 6 7 8 9 1. Panipat 2,68,823 1,41,322 1,40,286 118,270 116,751 1,21,211 1,14,986 Panipat 2. Samalkha 29,856 15,023 10,823 44,240 21,368 69,870 24,836 1. Sonipat 2,25,151 180,812 2,35,742 526,325 196,704 5,30,943 2,75,943 2. Ganaur 29,005 28,143 23,697 64,092 21,504 54,379 22,904 3. Kharkhoda 18,758 7,745 7,966 28,711 5,365 46,088 6,555
Sonipat
4. Gohana 48,518 83,749 52,834 129,054 81,147 1,22,348 91,771 1. Rohtak 2,94,537 1,52,974 2,47,557 168,152 158,411 2,03,362 1,79,991 2. Kalanaur 16,847 8,402 5,645 16,010 7,722 18,098 9,630 3. Maham 18,166 5,239 3,356 21,384 19,666 10,922 9,793
Rohtak
4. Sampla 6,449 3,518 7 32,858 6,671 47,824 25,172 1. Jhajjar 39,004 79,218 70,862 88,926 60,719 84,684 56,680 2. Beri 16,146 + + 33,560 31,298
Jhajjar
3. Bahadurgarh 1,26,746 1,10,329 90,193 139,768 129,575 1,25,701 1,14,057 Faridabad 1. Faridabad
Complex 10,54,981 23,81,213 22,08,072 3,343,778 3,013,262 35,51,140 30,90,774
1. Gurgaon 2,01,759 3,34,512 2,92,903 1,393,976 292,804 42,53,991 12,50,766 2. Sohna 27,571 28,790 22,117 39,191 11,551 78,061 29,679 3. Pataudi 16,064 9,272 7,187 51,981 11,909 63,032 10,155 4. Haili Mandi 17,072 10,231 11,507 37,310 15,402 43,104 25,171
Gurgaon
5. Farukhnagar 9,520 8,372 8,573 22,375 4,035 40,767 9,612 1. Nuh 11,038 9,745 11,009 36,462 20,657 36,462 20,657 2. Ferozepur-
Jhirka 17,751 22,097 22,938 37,233 24,229 59,067 36,818
Mewat
3. Punhara 13173 — — 1,152 217 1,152 217

652
LOCAL BODIES Number, Population, Income and Expenditure of Municipal
Committees/Councils/Corporations in Haryana (Districtwise) No. 32.2 (Contd.) (` in 000)
Accounts Accounts Accounts 2007-08 2008-09 2009-10
District
Name of Municipal Committees/
Councils/Corporations
Population within Muni- cipal Commi-
ttees/Councils/ Corporations
limits
Income Expen-diture
Income Expen-diture
Income Expen-diture
1 2 3 4 5 6 7 8 9 4. Taoru 17,227 13,712 14,139 35,759 11,932 35,759 11,932
1. Rewari 1,00,946 65,831 64,865 68,419 67,762 97,645 88,535 2. Bawal 12,016 18,952 15,648 30,362 22,310 21,464 16,683
Rewari
3. Dharuheda 18,892 * * 14,359 4,599 27,388 9,588 1. Mahendragarh 23,977 22,041 16,498 55,183 22,334 55,183 22,334 2. Narnaul 62,091 48,301 45,415 82,555 53,352 94,434 89,596 3. Kanina 10,195 10,842 9,081 16,666 8,955 16,666 8,955
Mahen- dragarh
4. Ateli 5,673 7,782 7,339 17,205 5,964 17,176 16,744 1. Bhiwani 1,69,424 62,062 61,215 70,599 68,623 70,599 68,624 2. Charkhi Dadri 44,892 26,530 19,695 87,603 23,467 1,09,982 69,471 3. Bawani Khera 17,438 3,006 4,778 3,209 3,060 4,049 3,569 4. Siwani 15,849 5,746 5,470 4,502 4,043 5,019 4,449
Bhiwani
5. Loharu 11,421 2,538 1,398 28,601 4,148 53,109 40,309 1. Safidon 27,542 16,331 16,473 31,858 31,712 28,800 28,789 2. Narwana 50,659 35,034 34,733 64,917 45,887 72,915 69,610 3. Uchana 14,100 27,447 22,510 41,409 19,080 66,961 30,240 4. Jind 1,36,089 44,404 45,,280 44,520 40,496 48,215 47,650
Jind
5. Julana 13,635 6,756 6,442 26,488 26,249 11,569 10,730 1. Hisar 2,63,070 1,23,153 1,21,912 139,148 123,359 1,62,108 1,50,444 2. Hansi 75,730 49,572 35,746 119,513 49,765 1,21,767 77,672 3. Barwala 33,130 14,819 14,778 19,413 14,900 28,853 24,765
Hisar
4. Narnaund 15,114 8,185 1,321,969 12,173 6,773 19,610 11,422 1. Fatehabad 59,863 40,965 43,669 106,308 61,051 1,01,180 68,196 2. Tohana 51,518 1,41,208 1,42,220 87,932 41,794 1,24,041 93,354
Fatehabad
3. Ratia 23,821 25,895 24,209 58,238 26,447 94,970 67,315
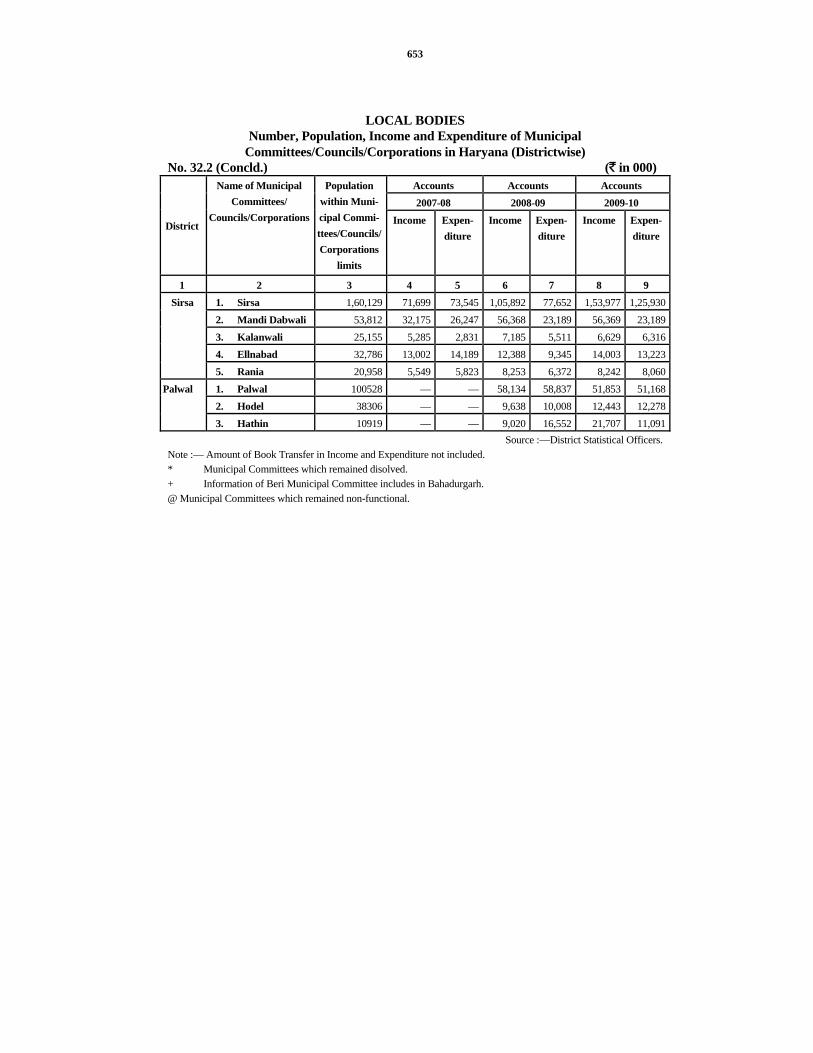
653
LOCAL BODIES Number, Population, Income and Expenditure of Municipal
Committees/Councils/Corporations in Haryana (Districtwise) No. 32.2 (Concld.) (` in 000)
Accounts Accounts Accounts 2007-08 2008-09 2009-10
District
Name of Municipal Committees/
Councils/Corporations
Population within Muni- cipal Commi- ttees/Councils/Corporations
limits
Income Expen- diture
Income Expen- diture
Income Expen- diture
1 2 3 4 5 6 7 8 9 1. Sirsa 1,60,129 71,699 73,545 1,05,892 77,652 1,53,977 1,25,9302. Mandi Dabwali 53,812 32,175 26,247 56,368 23,189 56,369 23,1893. Kalanwali 25,155 5,285 2,831 7,185 5,511 6,629 6,3164. Ellnabad 32,786 13,002 14,189 12,388 9,345 14,003 13,223
Sirsa
5. Rania 20,958 5,549 5,823 8,253 6,372 8,242 8,0601. Palwal 100528 — — 58,134 58,837 51,853 51,1682. Hodel 38306 — — 9,638 10,008 12,443 12,278
Palwal
3. Hathin 10919 — — 9,020 16,552 21,707 11,091Source :—District Statistical Officers.
Note :— Amount of Book Transfer in Income and Expenditure not included. * Municipal Committees which remained disolved. + Information of Beri Municipal Committee includes in Bahadurgarh. @ Municipal Committees which remained non-functional.

654
LOCAL BODIES Income of Municipal Committees/Councils/Corporations in Haryana
No. 32.3 (` in Lakh) Account
2007-08 2008-09 2009-10 Source of Income
2 3 4 I. Tax Revenue 21,345 24,468 18,141A. Taxes on Income 11 21 196
(i). Profession and Trade Tax 11 21 113(ii). Servant’s Tax — — 83
B. Taxes on Commodities and Services 4,940 5,597 6,331(i). Octroi 18 11 —(ii). Terminal Tax 243 230 271(iii). Water Tax — 1,159 1,385(iv). Taxes on Vehicles 704 700 770(v). Taxes on Animals (including fees for registration of
dogs) 51 33 17
(vi). Tolls on Vehicles and Animals 21 43 6(vii). Income from Public Safety and Convenience
(Lighting, fire etc.) 2,040 1,098 2,424
(viii). Water Fees (Sale of water) 981 1,159 —(ix). Fees for Vehicle's Licences (including driving
Licences) 247 561 346
(x). Licence Fees for Job Porters — 22 87(xi). Dangerous and Offensive Trade Licence Fee and Fee
for Letting of Fireworks 635 581 1,025
(xii). Local Rate — — —C. Taxes on Properties and Capital Transactions 16,394 18,850 11,621
(i). Taxes on Buildings and Land 8,310 6,914 5,937(ii). Rents of Land and Buildings (including sale of land
etc.) 7,639 11,541 5,162
(iii). Dak Bungalows and Sarais 76 113 153(iv). Gardens and roadside trees 31 9 34(v). Teh bazari Fees (including fees for occupation of
portions of streets) 338 273 335

655
LOCAL BODIES Income of Municipal Committees/Councils/Corporations in Haryana
No. 32.3 (Concld.) (` in Lakh) Account
2007-08 2008-09 2009-10 Source of Income 2 3 4
II. Administrative Receipts 112 2,775 303(i). Education 38 31 30(ii). Medical 9 8 3(iii). Public Health 65 2,736 270
III. Revenue Grants and Contributions 4,987 2,496 2,798(i). Grants for Famine Relief/Dev. Work 343 1,333 999(ii). Contribution for Veterinary Deptt. 27 — 4(iii). Other Grants or Contribution 4,617 1,163 1,795
IV. Capital Transfers 10,658 17,117 27,604(i). Grants for Capital Expenditure on Water
Supply 184 207 8,637
(ii). Recoveries for Water Supply Works 68 — 182(iii). Contributions for Government for Drainage
Works — — —
(iv). Contributions for Municipal Works 8,822 11,513 12,936(v). Suspense Accounts, (Stationery, Prinitng,
Stores, Advances, Deposits, Cattle Pounds, Ferries etc.)
1,584 5,397 5,849
V. Loans 605 2,382 207(i). Loans for Water Supply Works — — —(ii). Loans for Drainage Works 605 2,341 —(iii). Loans for General Purposes — 41 207(iv). Other Loans — — —
VI. Other Receipts 19,220 46,555 82,502(i). Interest Receipts 989 742 1,500(ii). Income on Investment 20 205 689(iii). Other General Taxes (copying fee etc.) 817 2,194 1,985(iv). Miscellaneous Unclassified Receipts 1,252 1,800 16,662(v). Stamp Duty 10,292 22,603 27,468(vi). Miscellaneous 5,850 19,011 34,198
Total Income 56,927 95,793 1,31,562Source :—Department of Economic and Statistical Analysis, Haryana.
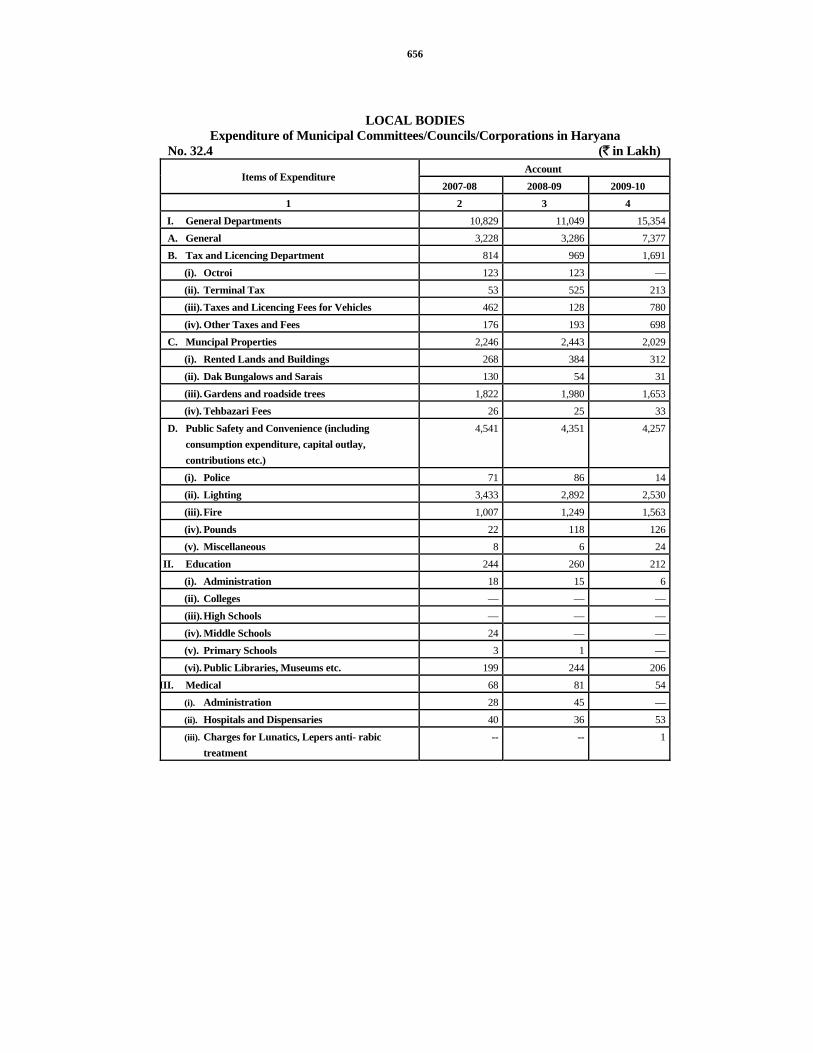
656
LOCAL BODIES Expenditure of Municipal Committees/Councils/Corporations in Haryana
No. 32.4 (` in Lakh) Account
Items of Expenditure 2007-08 2008-09 2009-10
1 2 3 4 I. General Departments 10,829 11,049 15,354A. General 3,228 3,286 7,377B. Tax and Licencing Department 814 969 1,691
(i). Octroi 123 123 —(ii). Terminal Tax 53 525 213(iii). Taxes and Licencing Fees for Vehicles 462 128 780(iv). Other Taxes and Fees 176 193 698
C. Muncipal Properties 2,246 2,443 2,029(i). Rented Lands and Buildings 268 384 312(ii). Dak Bungalows and Sarais 130 54 31(iii). Gardens and roadside trees 1,822 1,980 1,653(iv). Tehbazari Fees 26 25 33
D. Public Safety and Convenience (including consumption expenditure, capital outlay, contributions etc.)
4,541 4,351 4,257
(i). Police 71 86 14(ii). Lighting 3,433 2,892 2,530(iii). Fire 1,007 1,249 1,563(iv). Pounds 22 118 126(v). Miscellaneous 8 6 24
II. Education 244 260 212(i). Administration 18 15 6(ii). Colleges — — —(iii). High Schools — — —(iv). Middle Schools 24 — —(v). Primary Schools 3 1 —(vi). Public Libraries, Museums etc. 199 244 206
III. Medical 68 81 54(i). Administration 28 45 —(ii). Hospitals and Dispensaries 40 36 53(iii). Charges for Lunatics, Lepers anti- rabic
treatment -- -- 1

657
LOCAL BODIES Expenditure of Municipal Committees/Councils/Corporations in Haryana
No. 32.4 (Concld.) (` in Lakh) Account Items of Expenditure
2007-08 2008-09 2009-10 1 2 3 4
IV. Public Health 14,012 15,660 20,085(i). Administration 450 458 3,142(ii). Vital Statistics and Infant welfare 4 1 3(iii). Vaccination 16 15 18(iv). Plague and other Epidemic Diseases 22 32 20(v). Conservancy 9,962 11,110 13,753(vi). Drainage 3,522 3,890 3,037(vii). Control of Food Supplies (Markets, slaugher
houses etc.) 18 10 3
(viii). Burning and Burials of Paupers etc. 11 14 26(ix). Miscellaneous 7 130 83
V. Water Supply 5,089 6,386 4,467(i). Administration 1,368 1,480 1,554(ii). Collection of Revenue from Water — — —(iii). Cost of Canal Water — — —(iv). Maintenance (including work stores) 28 14 269(v). Water Analysis — 1 —(vi). Capital Expenditure 3,691 4,877 2,642(vii). Loans (a) Interest — 4 —
(b) Repayment 2 10 2VI. Veterinary Department 83 2 310
(i). Veterinary Hospitals 83 2 310(ii). Grants to Society for Prevention of Cruelty to
Animals — — —
(iii). Horse and Cattle Fairs — — —VII. Municipal Works 2,1844 27,867 32,951
(i). Administration 7,432 11,185 4,711(ii). Streets (Maintenance, watering, loans etc.) 14,354 16,616 28,153(iii). Execution 58 66 87
VIII. Suspense Accounts 1,892 1,971 6,761IX. Reserve for Unforeseen Charges 664 924 1,444Total Expenditure (I to IX) 54725 64200 81,638
Source :—Department of Economic & Statistical Analysis, Haryana.

658
LOCAL BODIES Number and Members of Gram Panchayats, Panchayat Samities and Zila
Parishads in Haryana : 2010-11 No. 32.5
Number of Panches
Men Women District
Number of Gram
Panchayats Gen. S.C. Total Gen. S.C. Total
1 2 3 4 5 6 7 8 Ambala 405 1,041 546 1,587 719 455 1,174
Panchkula 121 406 63 469 252 96 348
Yamunanagar 441 1,158 577 1,735 815 490 1,305
Kurukshetra 382 1,244 341 1,585 819 381 1,200
Kaithal 270 1,173 325 1,498 711 313 1,024
Karnal 372 1,499 411 1,910 911 413 1,324
Panipat 167 862 194 1,056 505 188 693
Sonipat 323 1,604 314 1,918 935 345 1,280
Rohtak 141 781 199 980 483 168 651
Jhajjar 249 1,178 237 1,415 699 260 959
Faridabad 111 514 105 619 310 108 418
Palwal 239 1,129 222 1,351 679 227 906
Gurgaon 210 796 139 935 498 193 691
Mewat 308 1,468 50 1,518 965 140 1,105
Rewari 351 1,285 247 1,532 782 349 1,131
Mahendragarh 344 1,445 195 1,640 830 330 1,160
Bhiwani 461 2,041 393 2,434 1,203 471 1,674
Jind 300 1,450 378 1,828 889 334 1,223
Hisar 309 1,591 478 2,069 937 406 1,343
Fatehabad 245 917 416 1,333 598 321 919
Sirsa 334 1,307 519 1,826 802 436 1,238
Total 6,083 24,889 6,349 31,238 15,342 6,424 21,766

659
LOCAL BODIES Number and Members of Gram Panchayats, Panchayat Samities and Zila Parishads in
Haryana: 2010-11 No. 32.5 (Contd.)
Number of Sarpanches Men Women District
B.C. Total
Panches (5+8+9)
Gen. S.C. Total Gen. S.C. Total
Total Sarpanches
(13+16) 1 9 10 11 12 13 14 15 16 17
Ambala 378 3,139 209 60 269 108 28 136 405Panchkula 81 898 61 13 74 38 9 47 121Yamunanagar 427 3,467 252 53 305 107 29 136 441Kurukshetra 377 3,162 209 47 256 97 29 126 382Kaithal 264 2,786 149 34 183 69 18 87 270Karnal 361 3,595 203 46 249 97 26 123 372Panipat 167 1,916 91 21 112 43 12 55 167Sonipat 321 3,519 172 42 214 86 23 109 323Rohtak 140 1,771 74 19 93 37 11 48 141Jhajjar 235 2,609 135 32 167 66 16 82 249Faridabad 105 1,142 60 15 75 27 9 36 111Palwal 221 2,478 123 34 157 67 15 82 239Gurgaon 200 1,826 105 35 140 56 14 70 210Mewat 306 2,929 170 44 214 72 22 94 308Rewari 342 3,005 189 45 234 92 25 117 351Mahendragarh 334 3,134 178 45 223 93 28 121 344Bhiwani 433 4,541 242 62 304 121 36 157 461Jind 297 3,348 160 39 199 80 21 101 300Hisar 303 3,715 164 40 204 81 24 105 309Fatehabad 238 2,490 136 29 165 63 17 80 245Sirsa 323 3,387 182 42 224 87 23 110 334Total 5,853 58,857 3,264 797 4,061 1,587 435 2,022 6,083

660
LOCAL BODIES Number and Members of Gram Panchayats, Panchayat Samities and Zila Parishads in
Haryana: 2010-11 No. 32.5 (Contd.)
Number of Members of Panchayat Samities
Men Women District Number of Panchayats
Samities Gen. S.C. Total Gen. S.C. Total 1 18 19 20 21 22 23 24
Ambala 6 46 25 71 27 15 42Panchkula 4 17 3 20 12 4 16Yamunanagar 6 52 22 74 27 15 42Kurukshetra 5 57 15 72 28 12 40Kaithal 6 68 19 87 35 13 48Karnal 6 84 25 109 43 16 59Panipat 5 54 13 67 30 9 39Sonipat 7 90 20 110 47 13 60Rohtak 5 53 13 66 28 8 36Jhajjar 5 59 13 72 32 9 41Faridabad 2 30 6 36 15 4 19Palwal 4 57 13 70 30 8 38Gurgaon 4 43 9 52 24 6 30Mewat 5 75 4 79 39 5 44Rewari 5 62 14 76 31 11 42Mahendragarh 5 74 13 87 38 10 48Bhiwani 10 103 25 128 57 16 73Jind 7 84 22 106 46 13 59Hisar 9 104 29 133 54 21 75Fatehabad 6 56 22 78 31 15 46Sirsa 7 73 31 104 41 18 59Total 119 1,341 356 1,697 715 241 956

661
LOCAL BODIES Number and Members of Gram Panchayats, Panchayat Samities and Zila
Parishads in Haryana: 2010-11 No. 32.5 (Contd.)
Number of Chairmen Men Women
District B.C.
Total Panches
(21+24+25) Gen. S.C. Total Gen. S.C. Total
Total Chairmen
(29+32)
1 25 26 27 28 29 30 31 32 33 Ambala 6 119 3 1 4 1 1 2 6Panchkula 4 40 — — — 3 1 4 4Yamunanagar 6 122 2 1 3 2 1 3 6Kurukshetra 5 117 2 1 3 2 — 2 5Kaithal 6 141 1 2 3 3 — 3 6Karnal 6 174 3 — 3 3 — 3 6Panipat 5 111 3 — 3 2 — 2 5Sonipat 7 177 4 1 5 1 1 2 7Rohtak 5 107 2 — 2 2 1 3 5Jhajjar 5 118 1 — 1 3 1 4 5Faridabad 2 57 2 — 2 — — — 2Palwal 4 112 3 — 3 1 — 1 4Gurgaon 4 86 3 — 3 1 — 1 4Mewat 5 128 3 — 3 1 1 2 5Rewari 5 123 2 — 2 3 — 3 5Mahendragarh 5 140 3 — 3 1 1 2 5Bhiwani 10 211 5 2 7 3 — 3 10Jind 7 172 3 — 3 4 — 4 7Hisar 9 217 5 1 6 2 1 3 9Fatehabad 6 130 4 — 4 1 1 2 6Sirsa 7 170 3 1 4 3 — 3 7Total 119 2,772 57 10 67 42 10 52 119

662
LOCAL BODIES Number and Members of Gram Panchayats, Panchayat Samities and Zila
Parishads in Haryana: 2010-11 No. 32.5 (Contd.)
District Number of Zila Parishads
Number of Presidents
1 34 35 Ambala 1 1Panchkula 1 1Yamunanagar 1 1Kurukshetra 1 1Kaithal 1 1Karnal 1 1Panipat 1 1Sonipat 1 1Rohtak 1 1Jhajjar 1 1Faridabad 1 1Palwal 1 1Gurgaon 1 1Mewat 1 1Rewari 1 1Mahendragarh 1 1Bhiwani 1 1Jind 1 1Hisar 1 1Fatehabad 1 1Sirsa 1 1Total 21 21

663
LOCAL BODIES Number and Members of Gram Panchayats, Panchayat Samities and Zila
Parishads in Haryana: 2010-11 No. 32.5 (Concld.)
Number of Members of Zila Parishads Men Women
District
Gen. S.C. Total Gen. S.C. Total B.C.
Total Members
(38+41+42)
1 36 37 38 39 40 41 42 43 Ambala 5 3 8 3 2 5 1 14Panchkula 4 1 5 3 1 4 1 10Yamunanagar 6 3 9 4 2 6 1 16Kurukshetra 7 2 9 3 2 5 1 15Kaithal 9 2 11 5 2 7 1 19Karnal 10 3 13 6 2 8 1 22Panipat 6 2 8 4 1 5 1 14Sonipat 12 3 15 6 2 8 1 24Rohtak 6 2 8 4 1 5 1 14Jhajjar 9 2 11 5 1 6 1 18Faridabad 4 1 5 3 1 4 1 10Palwal 8 2 10 5 1 6 1 17Gurgaon 4 1 5 3 1 4 1 10Mewat 11 -- 11 5 1 6 1 18Rewari 7 2 9 5 1 6 1 16Mahendragarh 9 2 11 5 1 6 1 18Bhiwani 14 4 18 8 2 10 1 29Jind 12 3 15 6 2 8 1 24Hisar 13 4 17 7 3 10 1 28Fatehabad 7 3 10 4 2 6 1 17Sirsa 9 4 13 5 2 7 1 21Total 172 49 221 99 33 132 21 374
Source :—Director of Panchayats, Haryana.

665
SECTION XXXIII ELECTORAL STATISTICS
Under the Constitution of India, there shall be a Parliament for the Union consisting of the President and two Houses to be known respectively as the Council of States (Rajya Sabha) and the House of People (Lok Sabha). Similarly, in each State there shall be a legislature consisting of either one House or two Houses known as Legislative Assembly (Vidhan Sabha) and the Legislative Council (Vidhan Parishad). In Haryana State, there is only one House, i.e.,Vidhan Sabha.
The data presented in this section have been collected from the Chief Electoral Officer, Haryana.
Table 33.1 indicates the district-wise data regarding number of electors, Vidhan Sabha and Lok Sabha seat in Haryana.
Table 33.2 shows the names of members elected to the Parliamentary Constituency in the 2009 general elections. The party affiliation at the time of Elections has also been given.
Table 33.3 shows the name of members elected to the Haryana Vidhan Sabha in the 2009 elections.
Tables 33.4 shows the number of electors and votes polled in Haryana Vidhan Sabha Elections, 2009.
Table 33.5 shows the Parliamentry constituency-wise number of votes polled in Haryana during 2009 General Elections to Lok Sabha.
Table 33.6 shows the State-wise number of Lok Sabha and Vidhan Sabha seats in India.

666

667
ELECTIONS Number of Electors, Seats (Lok Sabha and Vidhan Sabha) in Haryana
No. 33.1 No. of Electors (In thousand)
District 1967 1977 1987@ 1995££ 1998** 1999£ 2000*
1 2 3 4 5 6 7 8 Ambala 4,59 6,13 8,88 7,54 5,44 5,49 555Panchkula — — — — 1,98 1,98 201 Yamunanagar — — — 6,46 6,13 5,93 598Kurukshetra — 4,82 7,17 3,79 3,67 3,54 360Kaithal — — — 5,70 5,62 5,69 574Karnal 8,40 5,71 8,53 7,48 7,33 7,27 737Panipat — — — 4,27 4,05 4,03 409Sonipat — 4,12 5,77 7,41 7,09 7,08 701Rohtak 8,16 6,60 9,33 11,42 5,23 5,19 523Jhajjar — — — — 5,50 5,41 543 Faridabad — — 7,23 10,38 10,33 9,70 982Gurgaon 7,48 8,32 6,03 8,29 7,89 7,96 803Rewari — — — 4,11 4,03 4,02 406Mahendragarh 3,26 4,58 6,37 4,08 3,90 3,88 394Bhiwani — 4,79 6,74 7,25 8,12 8,08 814Jind 2,72 4,27 6,28 6,82 6,67 6,65 679Hisar 9,27 6,60 9,70 13,65 7,14 7,10 716Fatehabad — — — — 4,74 4,81 488 Sirsa — 3,45 4,98 6,15 6,00 6,18 627Mewat — — — — — — —Palwal — — — — — — —Total 43,88 59,39 87,01 1,14,80 1,10,86 1,09,99 1,11,10Note:— The information for the year 1967 and 1972 relates to the old seven district boundaries. @ Number of voters as on 17th June. * Number of voters as on 31st January, 2000. £ £ Number of voters as on 27th July, 1995. ** Number of voters as on 1st January, 1998. £ Number of voters as on 31st October, 1999.

668
ELECTIONS Number of Electors, Seats (Lok Sabha and Vidhan Sabha) in Haryana
No. 33.1 (Contd.) No. of Electors (In thousand) No. of Seats in Vidhan Sabha
District 2004 2005 2009 2010 1967 1987 2000 2005 2009 2010
1 9 10 11 12 13 14 15 16 17 18 Ambala 585 611 644 643 9 10 5 5 4 4Panchkula 227 244 266 285 — — 1 1 2 2Yamunanagar 650 659 623 611 — — 5 5 4 4Kurukshetra 396 412 520 516 — 8 3 3 4 4Kaithal 610 617 604 604 — — 5 5 4 4Karnal 798 814 792 782 16 9 6 6 5 5Panipat 443 466 543 562 — — 3 3 4 4Sonipat 754 776 772 778 — 6 6 6 6 6Rohtak 590 597 596 611 15 10 5 5 4 4Jhajjar 610 629 547 553 — — 5 5 4 4Faridabad 1,130 1,215 797 836 — 6 6 6 6 6Gurgaon 964 1,034 770 790 13 6 6 6 4 4Rewari 441 452 516 524 — — 3 3 3 3Mahendragarh 442 448 530 534 6 6 3 3 4 4Bhiwani 926 945 895 907 — 7 7 7 6 6Jind 743 749 723 737 5 7 6 6 5 5Hisar 792 816 953 981 17 10 6 6 7 7Fatehabad 543 555 512 528 — — 4 4 3 3Sirsa 677 697 729 739 — 5 5 5 5 5Mewat — — 358 366 — — — — 3 3Palwal — — 427 441 — — — — 3 3Total 12,321 12,736 13,117 13,328 81 90 90 90 90 90

669
ELECTIONS Number of Electors, Seats (Lok Sabha and Vidhan Sabha) in Haryana
No. 33.1 (Concld.) No. of Lok Sabha Seats District
1967 1980 1989 1996 1998 1999 2004 2009 2010 1 19 20 21 22 23 24 25 26 27
Ambala 1 1 1 1 1 1 1 1 1
Panchkula — — — — — — — — —
Yamunanagar — — — — — — — — —
Kurukshetra — 1 1 1 1 1 1 1 1
Kaithal — — — — — — — — —
Karnal 2 1 1 1 1 1 1 1 1
Panipat — — — — — — — — —
Sonipat — 1 1 1 1 1 1 1 1
Rohtak 2 1 1 1 1 1 1 1 1
Jhajjar — — — — — — — — —
Faridabad — 1 1 1 1 1 1 1 1
Gurgaon 1 — — — — — — 1 1
Rewari — — — — — — — — —
Mahendragarh 1 1 1 1 1 1 1 — —
Bhiwani — 1 1 1 1 1 1 1 1
Jind — — — — — — — — —
Hisar 2 1 1 1 1 1 1 1 1
Fatehabad — — — — — — — — —
Sirsa — 1 1 1 1 1 1 1 1
Mewat — — — — — — — — —
Palwal — — — — — — — — —
Total 9 10 10 10 10 10 10 10 10Source:—Chief Electoral Officer, Haryana.

670
ELECTIONS Names of Elected Members for Parliament from Haryana Parliamentary Constituencies
in General Elections, 2009 No. 33.2
Serial No. Name of the Parliamentary Constituency Names of the Elected Members Party Affiliation at the time of Elections
1 2 3 4 Sarvshri/Shrimati/Miss
1. Hisar Kuldeep Bishnoi* H.J.C.(B.L.)2. Sirsa (S.C.) Ashok Tanwar I.N.C.3. Bhiwani-Mahendragarh Shruti Chaudhry I.N.C.4. Faridabad Avtar Singh Bhadana I.N.C.5. Ambala (S.C.) Selja I.N.C.6. Karnal Arvind Kumar Sharma I.N.C.7. Kurukshetra Naveen Jindal I.N.C.8. Rohtak Deepender Singh Hooda I.N.C.9. Sonipat Jitender Singh I.N.C.10. Gurgaon Inderjit Singh I.N.C.
Source:—Chief Electoral Officer, Haryana. *Elected in Bye Election

671
LIST OF ELECTED MEMBERS OF HARYANA VIDHAN SABHA

672

673
ELECTIONS Names of Elected Members of Haryana Vidhan Sabha in General Elections, 2009
No. 33.3
Sr. No. Name of Assembly
Constituency Names of the Elected Members
DISTRICT AMBALA 1. Naraingarh Ram Kishan Gujjar 2. Mullana (S.C.) Rajbir Singh Barara 3. Ambala Cantt. Anil Vij 4. Ambala City Venod Kumar Sharma
DISTRICT PANCHKULA 5. Panchkula Devender Kumar Bansal 6. Kalka Pardeep Chaudhary
DISTRICT YAMUNANAGAR 7. Jagadhri Akram Khan 8. Radaur Dr. Bishan Lal Saini 9 Yamunanagar Dilbagh Singh
10. Sadhaura (S.C.) Raj Pal Bhukhri DISTRICT KURUKSHETRA
11. Shahabad (S.C.) Anil Dhantori 12. Thanesar Ashok Kumar Arora 13. Pehowa Harmohinder Singh Chattha 14. Ladwa Sher Singh Barshami
DISTRICT KAITHAL 16. Kalayat Ram Pal Majra 17. Kaithal Randeep Singh Surjewala 18. Guhla (S.C.) Phool Singh Kheri 19. Pundri Sultan Singh
DISTRICT KARNAL 20. Indri Dr. Ashok Kashyap 21 Nilokheri (S.C.) Mamu Ram
22. Karnal Sumita Singh 23. Gharaunda Narender Sangwan 24. Assandh Zile Ram Sharma

674
ELECTIONS Names of Elected Members of Haryana Vidhan Sabha in General Elections, 2009
No. 33.3 (Contd.) Sr. No. Name of Assembly Constituency Names of the Elected Members
DISTRICT PANIPAT 24. Panipat (Rural) Om Parkash Jain 25. Panipat (Urban) Balbir Pal Shah 26. Samalkha Dharma Singh Chhokar 27. Israna (S.C.) Krishan Pal Panwar
DISTRICT SONIPAT 28. Kharkhuoda (S.C.) Jaiveer Valmiki 29. Ganaur Pandit Kuldeep Sharma 30. Sonipat Kavita Jain 31. Rai Jai Tirath 32. Baroda Sri Krishan Hooda 33. Gohana Jagbir Singh Malik
DISTRICT ROHTAK 34. Garhi Sampla Kiloi Bhupinder Singh Hooda 35. Rohtak Bharat Bhushan Batra 36. Meham Anand Singh Dangi 37. Kalanaur (S.C.) Shakuntla Khatak
DISTRICT JHAJJAR 38. Beri Dr. Raghuvir Singh Kadian 39. Jhajjar (S.C.) Geeta Bhukkal Matanhail 40. Badli Naresh Kumar Badli 41. Bahadurgarh Rajender Singh Joon
DISTRICT FARIDABAD 42. Faridabad Anand Kaushik 43. Ballabhgarh Sharda Rathore 44. Badkhal Mahender Partap Singh 45. Faridabad N.I.T. Shiv Charan Lal Sharma 46. Prithula Raghubir Singh Tewatia 47. Tigoan Krishan Pal Gurjar
DISTRICT GURGAON 48. Badshahpur Dharam Paul 49. Sohna Dharambir Singh

675
ELECTIONS Names of Elected Members of Haryana Vidhan Sabha in General Elections, 2009
No. 33.3 (Contd.) Sr. No. Name of Assembly Constituency Names of the Elected Members
50. Gurgaon Sukhbir Kataria 51. Pataudi (S.C.) Ganga Ram
DISTRICT REWARI 52. Kosli Rao Yadvendra Singh 53. Bawal (S.C.) Rameshwar Dayal Rajoria 54. Rewari Capt. Ajay Singh Yadav
DISTRICT MAHENDRAGARH 55. Mahendragarh Rao Dan Singh 56. Ateli Anita Yadav 57. Narnaul Rao Narinder Singh 58. Nangal Chaudhry Bahadur Singh
DISTRICT BHIWANI 59. Badhra Col. Raghbir Singh 60. Dadri Sat Pal Sangwan 61. Bhiwani Ghanshyam Dass Garg 62. Tosham Kiran Choudhry 63. Loharu Master Dharampal Obra 64. Bawani Khera (S.C.) Ram Kishan Fauji
DISTRICT JIND 65. Narwana (S.C.) Pirithi Singh Nambardar 66. Uchana Kalan Om Parkash Chautala 67. Jind Dr. Hari Chand Middha 68. Julana Parminder Singh Dhull 69. Safidon Kali Ram Patwari
DISTRICT HISAR 70. Barwala Ram Niwas Ghorela 71. Narnaund Saroj 72. Hansi Vinod Bhayana 73. Hisar Savitri Jindal 74. Adampur Renuka Bishnoi* 75. Nalwa Prof. Sampat Singh 76. Uklana (S.C.) Naresh Selwal

676
ELECTIONS Names of Elected Members of Haryana Vidhan Sabha in General Elections, 2009
No. 33.3 (Concld.) Sr. No. Name of Assembly Constituency Names of the Elected Members
DISTRICT FATEHABAD 77. Tohana Sardar Param Vir Singh 78. Ratia (S.C.) Jarnail Singh* 79. Fatehabad Prahlad Singh Gillan Khera
DISTRICT SIRSA
80. Kalanwali (S.C.) Charanjeet Singh Rori 81. Ellenabad Abhey Singh Chautala* 82. Sirsa Gopal Kanda 83. Rania Bhai Krishan Lal Kamboj 84. Dabwali Dr. Ajay Singh Chautala
DISTRICT PALWAL
85. Hodal (S.C.) Jagdish Nayar 86. Palwal Subash Chaudhary 87. Hathin Jaleb Khan
DISTRICT MEWAT
88. Nuh Aftab Ahmed 89. Punhana Mohmad Iliyas 90. Ferozepur Jhirka Naseem Ahmed
* Elected in Bye Election. Source:—Secretary, Haryana Vidhan Sabha.

677
ELECTIONS Number of Electors and Votes Polled in Haryana Vidhan Sabha Elections, 2009
No. 33.4 District Number of Electors Number of votes polled Percentage of Votes polled
to number of Electors 1 2 3 4
Ambala 6,44,506 4,77,421 74.08 Panchkula 2,66,564 1,77,361 66.54Yamunanagar 6,23,202 4,90,178 78.65Kurukshetra 5,20,085 4,01,749 77.25Kaithal 6,04,346 4,79,137 79.28Karnal 7,91,806 5,66,810 71.58Panipat 5,42,626 3,97,523 73.26Sonipat 7,71,798 5,05,696 65.52Rohtak 5,96,159 4,04,715 67.89Jhajjar 5,47,112 3,56,325 65.13Faridabad 7,96,786 4,97,575 62.45Palwal 4,27,224 3,19,568 77.80Gurgaon 7,69,739 4,81,350 62.53Mewat 3,57,724 2,60,834 72.91Rewari 5,15,597 3,58,239 69.48Mahendragarh 5,29,648 3,85,112 72.71Bhiwani 8,94,702 6,26,105 69.98Jind 7,23,050 5,62,505 77.80Hisar 9,52,856 7,19,538 75.51Fatehabad 5,12,366 4,11,661 80.35Sirsa 7,29,069 6,14,008 84.22All Districts 1,31,16,965 94,93,410 72.38
Source :—Chief Electoral Officer, Haryana. Note :— Some of the Assembly Constituencies being inter-district, the figures have been included in the district in which
major part of the Assembly Constituency falls.

678
ELECTIONS Number of Electors and Votes Polled in Haryana during 2009
General Elections to Lok Sabha No. 33.5
Name of Parliamentary
Constituency
Number of Electors Number of Votes polled Percentage of votes polled to
number of Electors
1 2 3 4
Ambala (S.C.) 12,64,907 8,66,622 68.51
Kurukshetra 11,66,684 8,75,454 75.04
Karnal 12,16,977 8,11,029 66.64
Sonipat 10,99,978 7,12,258 64.75
Rohtak 12,74,972 8,35,925 65.56
Faridabad 11,03,046 6,24,937 56.66
Gurgaon 12,44,437 7,56,236 60.77
Bhiwani-Mahendragarh 12,12,513 8,64,392 71.29
Hisar 11,94,689 8,28,461 69.35
Sirsa (S.C.) 13,09,507 9,81,239 74.93
Total 1,20,87,710 81,56,553 67.48 Source :—Chief Electoral Officer, Haryana.

679
ELECTIONS
Number of Lok Sabha and Vidhan Sabha Seats (Statewise) No. 33.6 State/Union Territory Lok Sabha Seats Vidhan Sabha Seats
1977, 1980 & 1984 1987, 1989, 1999, 2004 & 2009 1977 1987 2004 & 2009 1 2 3 4 5 6
Andhra Pradesh 42 42 294 294 294Arunachal Pradesh — 2 — 40 60Assam 14 14 126 126 126Bihar 54 40 324 324 243Jharkhand — 14 — — 81Goa — 2 — 40 40Gujarat 26 26 182 182 182Haryana 10 10 90 90 90Himachal Pradesh 4 4 68 68 68Jammu and Kashmir 6 6 76 76 87Karnataka 28 28 224 224 224Kerala 20 20 140 140 140Madhya Pradesh 40 29 320 320 230Chhattisgarh — 11 — — 90Maharashtra 48 48 288 288 288Manipur 2 2 60 60 60Meghalaya 2 2 60 60 60Mizoram — 1 — 40 40Nagaland 1 1 60 60 60Orissa 21 21 147 147 147Punjab 13 13 117 117 117Rajasthan 25 25 200 200 200Sikkim 1 1 32 32 32Tamilnadu 39 39 234 234 234Tripura 2 2 60 60 60Uttar Pradesh 85 80 425 425 403Uttrakhand — 5 — — 70West Bengal 42 42 294 294 294Union Territories— A. and N. Island 1 1 — — —Chandigarh 1 1 — — —Dadra & Nagar Haveli 1 1 — — —Daman & Diu 1 1 — — —Delhi 7 7 56* 56* 70*Lakshadweep 1 1 — — —Pondicherry 1 1 30 30 30Total 538 543 3,907 4,027 4,120* Metropolitan Council Constituencies. Sources:—Chief Electoral Officer, Haryana.

681
SECTION XXXIV REGISTRATION
This section contains data on the number of registration offices, number of registrations of property, aggregate value of property transferred and total receipts from them to the Government.
The data have been obtained from the Inspector General of Registration, Haryana.

682

683
REGISTRATION
Number and Description of Registered Documents and Value of Property Transferred in Haryana
No. 34.1 Number of registration of property
Immovable Property Year/District Number of
Registration Offices Compulsory Optional Total
Movable Property
Grand total
1 2 3 4 5 6 7
1966-67 40 70,087 341 70,428 4,845 75,273
1970-71 45 85,821 31 85,852 9,072 94,924
1975-76 52 92,235 239 92,474 10,034 1,02,508
1980-81 71 1,67,825 15 1,67,840 18,158 1,85,998
1985-86 88 2,09,953 90 2,10,043 22,005 2,32,048
1990-91 103 2,76,756 1,130 2,77,886 1,04,644 3,82,530
1995-96 101 2,49,456 248 2,49,704 38,851 2,88,555
2000-01 112 3,29,100 1,642 3,30,742 31,992 3,62,734
2005-06 113 5,47,978 1,812 5,49,790 45,622 5,95,412
2006-07 113 4,90,098 3,126 4,93,224 43,632 5,36,856
2007-08 114 4,85,470 3,611 4,89,081 47,538 5,36,619
2008-09(P) 117 4,54,781 4,030 4,58,811 50,510 5,09,321
Ambala 6 16,207 -- 16,207 2,329 18,536
Panchkula 6 5,896 25 5,921 2,061 7,982
Yamunanagar 6 18,660 -- 18,660 1,732 20,392
Kurukshetra 6 18,106 -- 18,106 2,434 20,540
Kaithal 7 22,965 -- 22,965 1,741 24,706
Karnal 9 22,900 -- 22,900 3,951 26,851
Panipat 5 18,190 -- 18,190 1,932 20,122
Sonipat 4 22,384 941 23,325 2,499 25,824
Rohtak 4 24,972 -- 24,972 2,708 27,680
Jhajjar 4 21,197 -- 21,197 2,623 23,820
Faridabad 2 38,918 2,139 41,057 3,226 44,283
Palwal 3 20,728 246 20,974 1,527 22,501
Gurgaon 4 36,752 -- 36,752 2,970 39,722
Mewat 5 10,532 -- 10,532 537 11,069
Rewari 4 14,547 -- 14,547 2,083 16,630
Mahendragarh 5 14,130 -- 14,130 1,808 15,938
Bhiwani 9 28,128 -- 28,128 4,156 32,284
Jind 7 19,965 -- 19,965 1,960 21,925
Hisar 9 30,889 434 31,323 3,174 34,497
Fatehabad 6 18,971 11 18,982 2,206 21,188
Sirsa 6 29,744 234 29,978 2,853 32,831
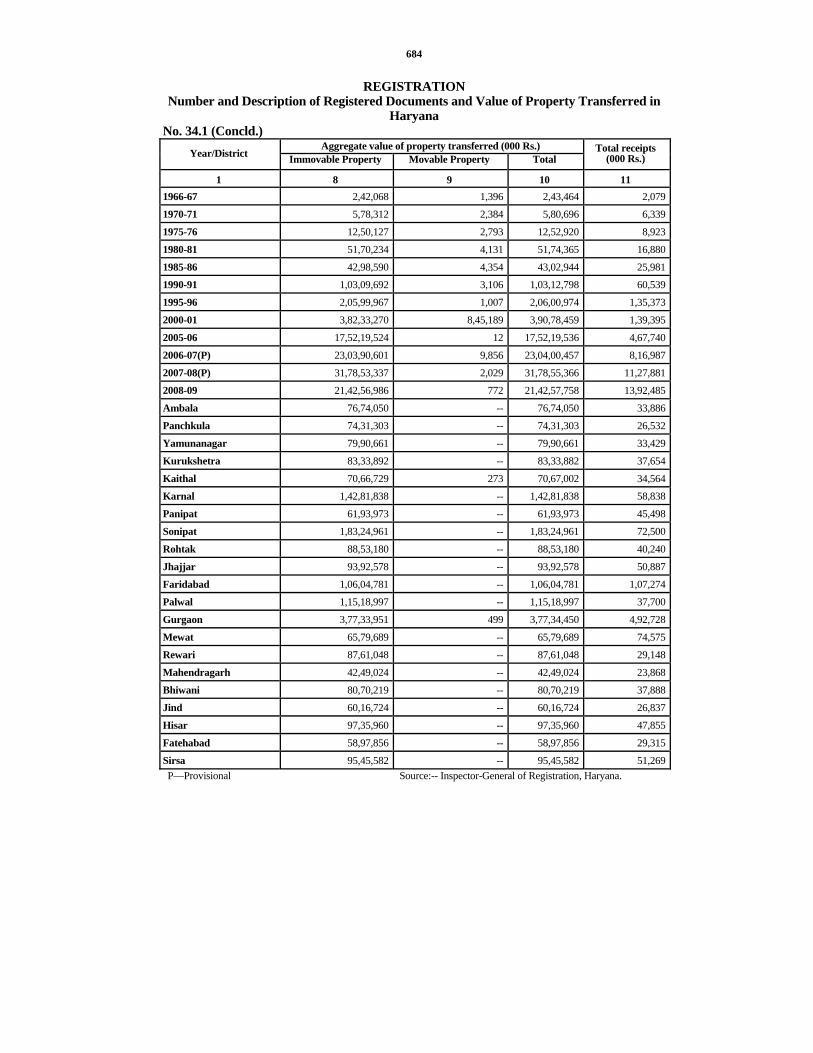
684
REGISTRATION Number and Description of Registered Documents and Value of Property Transferred in
Haryana No. 34.1 (Concld.)
Aggregate value of property transferred (000 Rs.) Year/District Immovable Property Movable Property Total
Total receipts (000 Rs.)
1 8 9 10 11 1966-67 2,42,068 1,396 2,43,464 2,079
1970-71 5,78,312 2,384 5,80,696 6,339
1975-76 12,50,127 2,793 12,52,920 8,923
1980-81 51,70,234 4,131 51,74,365 16,880
1985-86 42,98,590 4,354 43,02,944 25,981
1990-91 1,03,09,692 3,106 1,03,12,798 60,539
1995-96 2,05,99,967 1,007 2,06,00,974 1,35,373
2000-01 3,82,33,270 8,45,189 3,90,78,459 1,39,395
2005-06 17,52,19,524 12 17,52,19,536 4,67,740
2006-07(P) 23,03,90,601 9,856 23,04,00,457 8,16,987
2007-08(P) 31,78,53,337 2,029 31,78,55,366 11,27,881
2008-09 21,42,56,986 772 21,42,57,758 13,92,485
Ambala 76,74,050 -- 76,74,050 33,886
Panchkula 74,31,303 -- 74,31,303 26,532
Yamunanagar 79,90,661 -- 79,90,661 33,429
Kurukshetra 83,33,892 -- 83,33,882 37,654
Kaithal 70,66,729 273 70,67,002 34,564
Karnal 1,42,81,838 -- 1,42,81,838 58,838
Panipat 61,93,973 -- 61,93,973 45,498
Sonipat 1,83,24,961 -- 1,83,24,961 72,500
Rohtak 88,53,180 -- 88,53,180 40,240
Jhajjar 93,92,578 -- 93,92,578 50,887
Faridabad 1,06,04,781 -- 1,06,04,781 1,07,274
Palwal 1,15,18,997 -- 1,15,18,997 37,700
Gurgaon 3,77,33,951 499 3,77,34,450 4,92,728
Mewat 65,79,689 -- 65,79,689 74,575
Rewari 87,61,048 -- 87,61,048 29,148
Mahendragarh 42,49,024 -- 42,49,024 23,868
Bhiwani 80,70,219 -- 80,70,219 37,888
Jind 60,16,724 -- 60,16,724 26,837
Hisar 97,35,960 -- 97,35,960 47,855
Fatehabad 58,97,856 -- 58,97,856 29,315
Sirsa 95,45,582 -- 95,45,582 51,269P—Provisional Source:-- Inspector-General of Registration, Haryana.

685
SECTION XXXV MISCELLANEOUS
Information contained in this section is as follows:—
Tables 35.1 to 35.3— In the first table information regarding Indian Currency in circulation for different years has been given. This is followed by data regarding India’s Foreign Exchange Reserves. The Third table gives an account of India’s Foreign Trade.
Table 35.4—shows the information regarding number of houses completed/allotted by the Housing Board, Haryana according to their economic strata.
Table 35.5—shows the number of Post Offices, Telegraph Offices, Telephone Exchanges, etc. of Haryana. This information has been collected from Post Master General/ Chief General Manager, Telecommunications, Haryana Circle, Ambala.
Tables 35.6 to 35.19 give the number of Government Employees Basic pay Rangewise, total emoluments rangewise, sexwise and districtwise as on 31st March, 2010 in Haryana. Information is collected and issued by Director of Economic and Statistical Analysis Haryana.
Tables 35.20 to 35.25 give the information regarding seating capacity in the Technical Institutes, Government Industrial Training and Vocational Education Institutes for Boys and Girls in the state of Haryana. The data for these tables have been obtained from Industrial Training and Vocational Education and Technical Education Departments.
Table 35.26 shows districtwise information of Enterprises, Establishments and Employment in Haryana according to Final Results of Economic Census, 2005. Tables 35.27 to 35.30 show the Statewise final results of Economic Census, 2005. The information of these Tables has been furnished by the Central Statistical Organisation, Government of India.
Table 35.31 contains comparative statistics of Haryana and India.

686

687
MISCELLANEOUS
Money Supply with the Public in India
No. 35.1 (Crore `) Currency with the Public Last Friday Money
Supply (3+8) Total (4+5+6–7)
Notes in circulation (a)
Circulation of ` coin (b)
Circulation of small coins
Cash in hand with
banks 1 2 3 4 5 6 7
1966-67 4,949 3,197 2,976 199 112 901970-71 7,374 4,371 4,173 247 137 1861980-81 23,424 13,426 13,688 333 286 8811990-91 93,015 53,171 53,784 936 685 2,2342000-01 3,79,450 2,09,550 2,12,851 4,053 1,300 8,6542005-06 8,26,375 4,13,119 4,21,922 6,190 2,564 17,5572007-08 11,55,837 5,68,410 5,81,577 7,656 1,567 22,3902008-09 12,53,184 6,66,364 6,81,099 8,487 1,567 24,790January, 2008 10,52,836 5,44,309 5,57,338 7,502 1,549 22,080February, 2008 10,68,495 5,54,348 5,66,297 7,579 1,558 21,085March, 2008 11,55,837 5,68,410 5,81,577 7,656 1,567 22,390April, 2008 11,09,240 5,89,438 6,01,629 7,722 1,597 21,510May, 2008 11,14,124 6,02,598 6,15,694 7,818 1,567 22,482June, 2008 11,08,173 6,04,182 6,18,211 7,882 1,567 23,477July, 2008 11,06,346 6,02,885 6,16,330 7,946 1,567 22,959August, 2008 11,13,474 5,86,708 6,01,704 8,057 1,567 24,620September, 2008 11,43,422 5,86,146 6,03,489 8,088 1,567 26,998October, 2008 11,32,198 6,10,860 6,28,848 8,164 1,567 27,719November, 2008 11,18,260 6,18,987 6,35,845 8,220 1,567 26,646December, 2008 11,28,712 6,26,550 6,41,579 8,274 1,567 24,870January, 2009 11,54,859 6,33,804 6,49,226 8,350 1,567 25,339February, 2009 11,86,610 6,50,120 6,65,243 8,417 1,567 25,108March, 2009 12,53,184 6,66,364 6,81,099 8,487 1,567 24,790April, 2009 12,55,372 6,87,283 7,04,302 8,553 1,567 27,140May, 2009 12,66,909 6,95,101 7,14,410 8,644 1,567 29,520June, 2009 12,47,480 6,90,766 7,10,537 8,741 1,567 30,079Note— Banks include Commercial and Co-operative Banks. (a) Net of the return of about ` 43 crores of Indian Notes from Pakistan up to April, 1985. (b) Estimated. (c) Excluding balances held in I.M.F. Account No. 1, Reserve Bank of India Employees Provident Fund, Pension Fund and Co-operative Guarantee Fund, the amount collected under the Additional Emoluments (compulsory Deposit) Act, 1974 and the compulsory Deposit Scheme (Income Tax Payers) Act. (d) Due to rounding off the figures, constituent items may not add up to the totals shown. (e) Scheduled commercial banks time deposits include ` 17,945 crore on account of proceeds arising from Resurgent India Bonds (RIBs) since August 28th, 1998

688
MISCELLANEOUS
Money Supply with the Public in India
No. 35.1 (Concld.) (Crore `) Currency with the Public
Last Friday Total (9+10) Net Demand
deposit with bank
Other deposits with Reserve Bank
(c)
Post Office Saving Bank
deposits
Time deposits with banks (e)
Total Post Office
deposits
1 8 9 10 11 12 13 1966-67 1,752 1,711 41 — — —1970-71 3,003 2,943 60 990 3,646 1,1841980-81 9,998 9,587 411 2,334 32,350 6,6321990-91 39,844 39,170 674 — 1,72,936 —2000-01 1,69,899 1,66,270 3,630 — 9,33,771 —2005-06 4,13,256 4,06,388 6,869 — 19,03,170 —2007-08 5,87,427 5,78,372 9,054 — 28,62,046 —2008-09 5,86,820 5,81,247 5,573 — 35,10,835 —January, 2008 5,08,527 5,03,767 4,760 — 27,51,524 —February, 2008 5,14,147 5,09,138 5,009 — 28,13,408 —March, 2008 5,87,427 5,78,372 9,054 — 28,62,046 —April, 2008 5,19,801 5,13,617 6,184 — 29,28,370 —May, 2008 5,11,526 5,05,311 6,216 — 29,81,598 —June, 2008 5,03,991 4,99,047 4,944 — 29,98,992 —July, 2008 5,03,461 4,98,357 5,104 — 30,42,676 —August, 2008 5,26,767 5,21,515 5,251 — 31,12,732 —September, 2008 5,57,276 5,51,818 5,459 — 31,40,123 —October, 2008 5,21,337 5,16,301 5,037 — 32,25,770 —November, 2008 4,99,274 4,94,335 4,939 — 32,70,610 —December, 2008 5,02,162 4,89,661 12,500 — 33,15,318 —January, 2009 5,21,055 5,14,468 6,587 — 34,08,651 —February, 2009 5,36,490 5,30,514 5,976 — 34,68,070 —March, 2009 5,86,820 5,81,247 5,573 — 35,10,835 —April, 2009 5,68,089 5,58,372 9,717 — 36,30,613 —May, 2009 5,71,,808 5,67,086 4,722 — 36,68,456 —June, 2009 5,56,715 5,47,102 9,613 — 36,87,487 —
Source :— Reserve Bank of India Bulletins (f) Monetary data revised in line with the new accounting standards and consistant with the methodology suggested by the working group on Money supply: Analytics and Methodology of compilation (June 1998) The revision is in respect of pension and provident funds with commercial banks which are classified as other demand and time liabilities and includes those banks which have reported such changes so far.

689
MISCELLANEOUS India's Foreign Exchange Reserves
No. 35.2 Year/Month S.D.R.'s (In millions) Gold (In lakh `) Foreign Exchange
(In lakh `) 1 2 3 4
At the end of— 1970-71 149 1,82,53 4,38,121975-76 203 1,82,53 14,91,701980-81 491 2,25,58 48,22,121985-86 115 2,74,28 73,84,351990-91 76 68,28,31 43,88,101995-96 56 1,56,58,45 5,84,45,872000-01 2 1,27,11,00 18,44,82,002005-06 2 2,56,74,00 64,73,27,002006-07 1 2,95,73,00 83,65,97,002007-08 11 4,01,24,00 119,602,300April, 2007 7 2,90,51,00 81,299,500May, 2007 1 2,81,47,00 81,744,000June, 2007 1 2,76,55,00 83,991,300July, 2007 8 2,78,50,00 88,868,000August, 2007 1 2,81,86,00 90,730,100September, 2007 1 2,92,75,00 95,358,100October, 2007 8 3,07,12,00 100,827,100November, 2007 2 3,31,51,00 105,016,500December, 2007 2 3,28,19,00 105,048,500January, 2008 6 3,62,36,00 111,708,000February, 2008 — 3,81,54,00 116,267,100March, 2008 11 4,01,24,00 119,602,300
Source :— Reserve Bank of India, Department of Economic Analysis & Policy, Central Office, Mumbai.

690
MISCELLANEOUS India's Foreign Trade
No. 35.3 (` in Crores) Year/Month Imports (–) Export (+) Balance of Trade
1 2 3 4 1966-67 2,078 1,157 (–)9211967-68 2,008 1,199 (–)8091970-71 1,634 1,535 (–)991975-76 5,265 4,036 (–)1,2291980-81 12,549 6,711 (–)5,8381985-86 19,658 10,895 (–)8,7631990-91 43,193 32,558 (–)10,6351995-96 1,22,678 1,06,353 (–)16,3252000-01 2,30,873 2,03,571 (–)27,3022005-06 6,60,409 4,56,418 (–)2,03,9912006-07 8,40,506 5,71,779 (–)2,68,7272007-08 10,12,312 6,55,864 (–)3,56,4482008-09 13,74,435 8,40,755 (–)5,33,680April, 2008 1,21,335 73,883 (–)47,452May, 2008 1,24,031 78,717 (–)45,314June, 2008 1,23,967 82,133 (–)41,834July, 2008 1,35,477 81,523 (–)53,954August, 2008 1,43,940 76,254 (–)67,686September, 2008 1,41,865 71,941 (–)69,924October, 2008 1,25,868 68,754 (–)57,114November, 2008 1,15,091 54,699 (–)60,392December, 2008 94,625 65,015 (–)29,610January, 2009 89,015 62,844 (–)26,171February, 2009 74,198 58,822 (–)15,376March, 2009 85,022 66,169 (–)18,853April, 2009 93,855 58,822 (–)35,033May, 2009 96,822 55,416 (–)41,406June, 2009 1,05,888 61,969 (–)43,919July, 2009 96,347 64,330 (–)32,017August, 2009 1,09,533 69,066 (–)40,467September, 2009 1,03,546 65,916 (–)37,630October, 2009 1,02,759 61,639 (–)41,120
Source :— Director General Commercial intelligenic & Statistics.

691
MISCELLANEOUS Number of houses allotted by the Housing Board, Haryana according to
their economic strata No. 35.4
Different categories of houses allotted Year/District Economically weaker section
Lower income group
Middle income group
High income group
Others
1 2 3 4 5 6 1975-76 510 192 231 — —1980-81 1,234 820 847 — —1985-86 — 393 334 85 —1990-91 810 553 372 88 6551995-96 — 28 48 22 42000-01 — 5,064 26 8 —2005-06 — 330 — — 2042008-09 112 427 — — 6372009-10 362 414 172 100 11082010-11 280 570 424 292 140Ambala — — — — —Panchkula — — — — 140Yamunanagar — — — — —Kurukshetra — — — — —Kaithal — — — — —Karnal — — — — —Panipat — — — — —Sonipat 22 178 216 152 —Rohtak — — — — —Jhajjar — — — — —Faridabad — 248 — — —Gurgaon 258 — — — —Rewari — — — — —Mahendragarh — — — — —Bhiwani — 144 208 140 —Jind — — — — —Hisar — — — — —Sirsa — — — — —
Source :— Housing Board, Haryana.
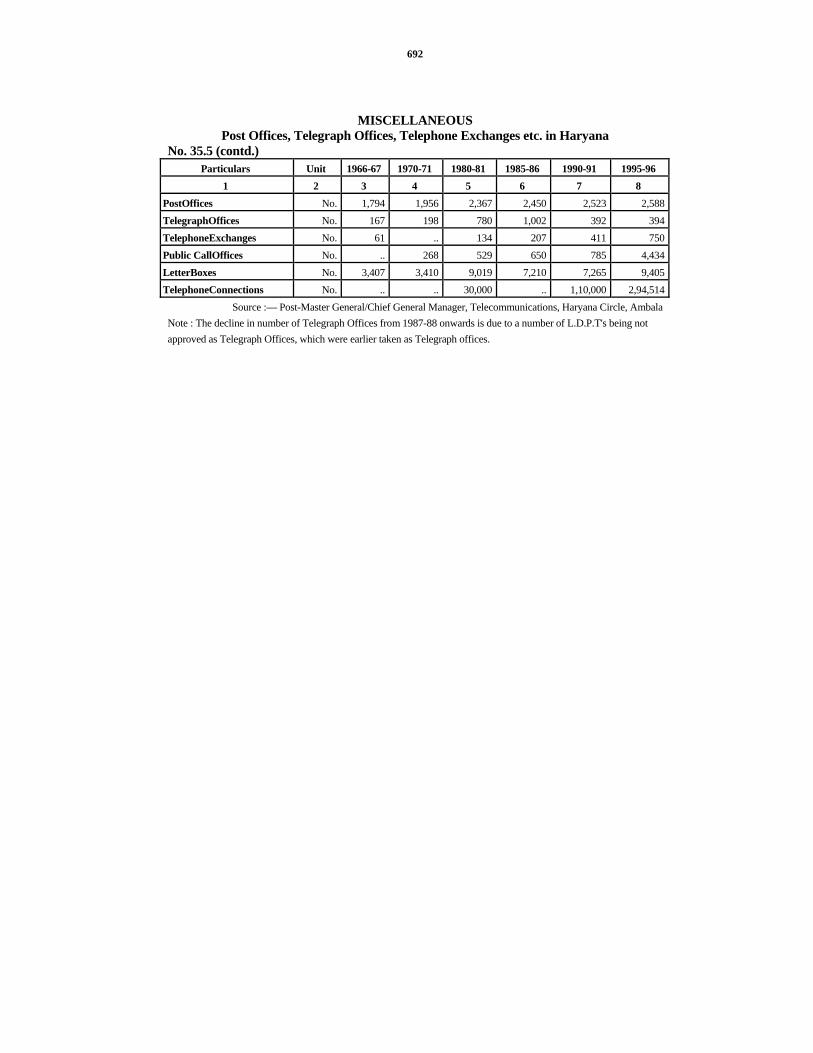
692
MISCELLANEOUS Post Offices, Telegraph Offices, Telephone Exchanges etc. in Haryana
No. 35.5 (contd.) Particulars Unit 1966-67 1970-71 1980-81 1985-86 1990-91 1995-96
1 2 3 4 5 6 7 8 PostOffices No. 1,794 1,956 2,367 2,450 2,523 2,588TelegraphOffices No. 167 198 780 1,002 392 394TelephoneExchanges No. 61 .. 134 207 411 750Public CallOffices No. .. 268 529 650 785 4,434LetterBoxes No. 3,407 3,410 9,019 7,210 7,265 9,405TelephoneConnections No. .. .. 30,000 .. 1,10,000 2,94,514
Source :— Post-Master General/Chief General Manager, Telecommunications, Haryana Circle, Ambala Note : The decline in number of Telegraph Offices from 1987-88 onwards is due to a number of L.D.P.T's being not approved as Telegraph Offices, which were earlier taken as Telegraph offices.

693
MISCELLANEOUS Post Offices, Telegraph Offices, Telephone Exchanges etc. in Haryana
No. 35.5 (Concld.) Particulars Unit 2000-01 2005-06 2008-09 2009-10 2010-11
1 2 9 10 11 12 13 PostOffices No. 2,653 2,646 2,653(P) 2,655 2,661TelegraphOffices No. 394 . . . . . . . .TelephoneExchanges No. 905 1,116 1,285 . . . .Public CallOffices No. 15,740 35,016 26,273 NA NALetterBoxes No. 9,590 8,950 8,941(P) 8,949 8,980TelephoneConnections No. 7,94,194 10,98,074 8,39,816 NA NA
Source :— Post-Master General/Chief General Manager, Telecommunications, Haryana Circle, Ambala Note : The decline in number of Telegraph Offices from 1987-88 onwards is due to a number of L.D.P.T's being not approved as Telegraph Offices, which were earlier taken as Telegraph offices.

694
MISCELLANEOUS Districtwise Employees of Haryana Government
No. 35.6 (As on 31st March) District 1967 1971 1976 1981 1985 1990 1995
1 2 3 4 5 6 7 8 Ambala 11,555 15,085 17,437 21,393 26,269 23,773 22,539Panchkula† — — — — — — —Yamunanagar# — — — — — 8,092 11,141Kurukshetra* — — 9,722 14,058 15,699 10,896 11,123Kaithal — — — — — 7,750 11,336Karnal 17,153 19,420 19,061 22,175 24,955 19,615 22,019Panipat — — — — — 7,851 8,635Sonipat* — — 7,903 11,387 12,909 12,068 16,849Rohtak 16,555 19,882 19,661 21,255 26,238 30,888 30,374Jhajjar@@ — — — — — — —Faridabad** — — — 13,598 15,585 17,081 18,432Palwal++ — — — — — — —Gurgaon 13,263 17,400 19,547 12,123 14,987 18,020 19,638Mewat## — — — — — — —Rewari# — — — — — 8,302 10,582Mahendragarh 7,127 7,632 10,470 13,933 15,560 10,852 12,044Bhiwani* — — 12,391 14,081 16,324 20,619 21,481Jind 4,428 5,684 9,829 11,389 13,801 15,345 16,006Hisar 18,142 20,872 15,067 19,079 24,959 30,122 35,083Fatehabad@@ — — — — — — —Sirsa@ — — 5,952 8,638 11,829 13,258 14,246Chandigarh and outside Haryana
9,162 9,360 12,161 14,723 15,392 18,781 19,435
Total 97,385 1,15,335 1,59,201 1,97,832 2,34,507 2,73,313 3,00,963

695
MISCELLANEOUS Districtwise Employees of Haryana Government
No. 35.6 (Concld) (As on 31st March) District 2000 2005 2009 2010
1 9 10 11 12 Ambala 19,454 18,103 18,477 18,670Panchkula† 7,089 7,450 8,144 8,644Yamunanagar# 11,536 11,451 12,168 12,407Kurukshetra* 12,099 11,933 13,434 13,555Kaithal 12,537 11,733 13,310 12,683Karnal 22,344 22,178 20,919 20,744Panipat 9,913 10,513 11,137 11,158Sonipat* 18,346 17,906 18,751 18,341Rohtak 19,871 18,882 18,233 17,818Jhajjar@@ 11,455 12,209 12,465 12,486Faridabad** 20,074 19,058 12,525 13,431Palwal++ — — 6,351 6,803Gurgaon 20,028 20,350 18,029 17,997Mewat## — — 7,628 6,712Rewari# 11,974 11,350 11,978 11,794Mahendragarh 11,686 12,390 10,687 12,647Bhiwani* 25,208 24,001 24,806 24,805Jind 17,167 17,003 17,056 17,252Hisar 26,276 25,092 22,903 24,393Fatehabad@@ 9,381 10,023 11,901 12,337Sirsa@ 15,062 15,070 16,188 15,545Chandigarh and outside Haryana 19,015 17,080 16,059 15,799Total 3,20,515 3,13,775 3,23,149 3,26,021
Source :—Department of Economic & Statistical Analysis, Haryana. * These Districts were not in existence before 1973 and thus the figures are included in Karnal, Rohtak and Hisar respectively. ** Information prior to 1980 is included in district Gurgaon. @ Information prior to 1975 is included in district Hisar. # These districts came into existence on 1-11-1989. † This district came into existence on 15-8-1995. @@ These districts came into existence on 15-7-1997. ## This district came in existance on 4.4.2005. ++ This district came in existance on13.8.2008.

696
MISCELLANEOUS Classwise Number of Haryana Government Employees as on 31st March
No. 35.7 Year Class I Class II Class III Class IV Adhoc Contingency paid, work
charged and Contract Basis
Total
1 2 3 4 5 6 7 8 1967 392 1,641 66,876 17,079 .. 11,397 97,3851971 569 2,156 84,259 20,672 .. 7,679 1,15,3351976 885 3,057 1,13,171 27,688 .. 14,400 1,59,2011980 1,160 4,853 1,29,175 32,412 .. 19,665 1,87,2651985 1,645 6,628 1,56,284 45,256 .. 24,694 2,34,5071990 2,038 8,307 1,82,141 53,524 .. 27,303 2,73,3131991 2,106 8,688 1,83,577 54,220 .. 29,449 2,78,0401992 2,252 8,733 1,85,191 54,507 .. 32,861 2,83,5441993 2,516 9,801 1,88,886 56,102 .. 36,417 2,93,7221994 2,515 10,471 1,90,280 60,569 .. 35,726 2,99,5611995 2,484 10,284 1,90,890 61,452 .. 35,853 3,00,9631996 2,612 10,613 1,95,714 63,849 .. 37,007 3,09,7951997 2,658 10,555 1,99,766 66,566 .. 35,575 3,15,1201998 2,610 10,146 1,98,761 67,012 .. 35,261 3,13,7901999 2,748 10,235 2,00,793 67,195 .. 35,501 3,16,4722000 2,752 10,374 2,02,018 66,986 .. 38,385 3,20,5152005 2,796 15,042 1,92,671 64,090 227 38,949 3,13,7752006 2,980 15,512 1,88,502 63,850 123 40,373 3,11,3402007 3,102 16,078 1,86,609 63,198 67 48,191 3,17,2452008 3,460 17,553 1,87,259 60,560 42 58,616 3,27,4902009 3,863 18,503 1,79,782 56,406 74 64,521 3,23,1492010 4,000 19,373 1,79,300 55,358 90 67,900 3,26,021
Source :—Department of Economic & Statistical Analysis, Haryana. Note :— The information of Adhoc employees is included in column 7 from 1967 to 2001

697
MISCELLANEOUS Distribution of Haryana Government Employees as on 31st March, 2010 according to
Basic pay ranges and classes No. 35.8
Gazetted Non-Gazetted Basic pay Ranges
(in `) Class I Class II Class III Class
IV
Adhoc Contingency paid
Work Charged
Contract Basis
Grand Total
(2 to 9)
Percentage to the total
1 2 3 4 5 6 7 8 9 10 11 Upto 6050 2 — 551 1,211 15 43,095 350 7,148 52,372 16.06 6051 to 6600 — — 119 2,804 — 569 31 421 3,944 1.21 6601 to 7700 — — 2,496 9,913 5 347 19 387 13,167 4.04 7701 to 8000 — — 3,931 7,880 8 8 6 1,293 13,126 4.03 8001 to 11500 4 22 36,709 30,967 9 388 182 7,311 75,592 23.19 11501 to 14000 13 61 32,978 1,907 6 45 3 5,257 40,270 12.35 14001 to 16500 26 940 37,373 392 4 36 1 840 39,616 12.15 16501 to 20500 60 2,376 38,068 253 1 2 1 48 40,809 12.52 20501 to 22500 139 4,040 15,638 31 1 — — 7 19,856 6.09 22501 to 26000 359 6,331 8,203 0 0 — — 20 14,913 4.57 26001 to 30000 645 3,367 2,473 0 36 — — 3 6,524 2.00 30000 to 33500 584 881 502 — 4 — — — 1,971 0.60 33501 to 40000 638 436 219 — — — — — 1,293 0.40 40001 to 46100 418 110 18 — — — — — 546 0.17 46101 to 47000 148 14 7 — — — — 18 187 0.06 47001 to 47500 170 21 5 — -- — — 5 201 0.06 47501 to 54000 359 312 1 — 1 — — 40 713 0.22 54001 & Above 435 462 9 — — — — 15 921 0.28 Total 4,000 19,373 1,79,300 55,358 90 44,490 593 22,817 3,26,021 100.00
Source :—Department of Economic & Statistical Analysis, Haryana.
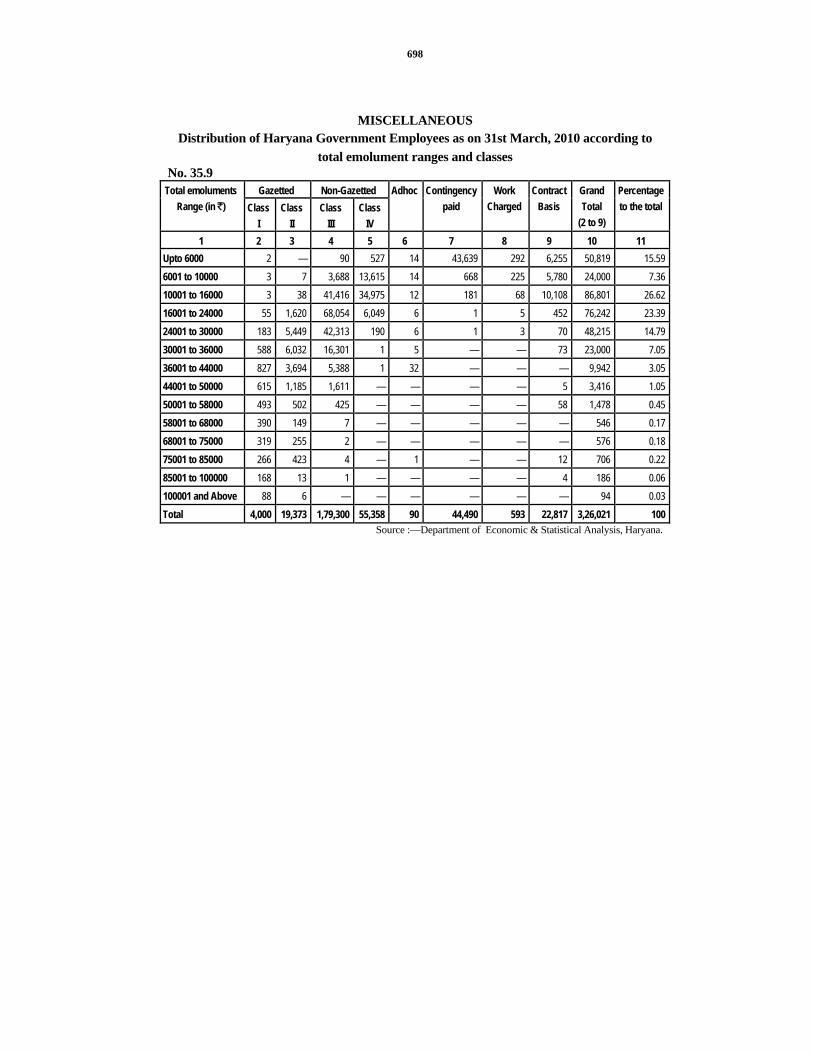
698
MISCELLANEOUS Distribution of Haryana Government Employees as on 31st March, 2010 according to
total emolument ranges and classes No. 35.9
Gazetted Non-Gazetted Total emoluments Range (in `) Class
I Class
II Class
III Class
IV
Adhoc Contingency paid
Work Charged
Contract Basis
Grand Total
(2 to 9)
Percentage to the total
1 2 3 4 5 6 7 8 9 10 11 Upto 6000 2 — 90 527 14 43,639 292 6,255 50,819 15.59 6001 to 10000 3 7 3,688 13,615 14 668 225 5,780 24,000 7.36 10001 to 16000 3 38 41,416 34,975 12 181 68 10,108 86,801 26.62 16001 to 24000 55 1,620 68,054 6,049 6 1 5 452 76,242 23.39 24001 to 30000 183 5,449 42,313 190 6 1 3 70 48,215 14.79 30001 to 36000 588 6,032 16,301 1 5 — — 73 23,000 7.05 36001 to 44000 827 3,694 5,388 1 32 — — — 9,942 3.05 44001 to 50000 615 1,185 1,611 — — — — 5 3,416 1.05 50001 to 58000 493 502 425 — — — — 58 1,478 0.45 58001 to 68000 390 149 7 — — — — — 546 0.17 68001 to 75000 319 255 2 — — — — — 576 0.18 75001 to 85000 266 423 4 — 1 — — 12 706 0.22 85001 to 100000 168 13 1 — — — — 4 186 0.06 100001 and Above 88 6 — — — — — — 94 0.03 Total 4,000 19,373 1,79,300 55,358 90 44,490 593 22,817 3,26,021 100
Source :—Department of Economic & Statistical Analysis, Haryana.
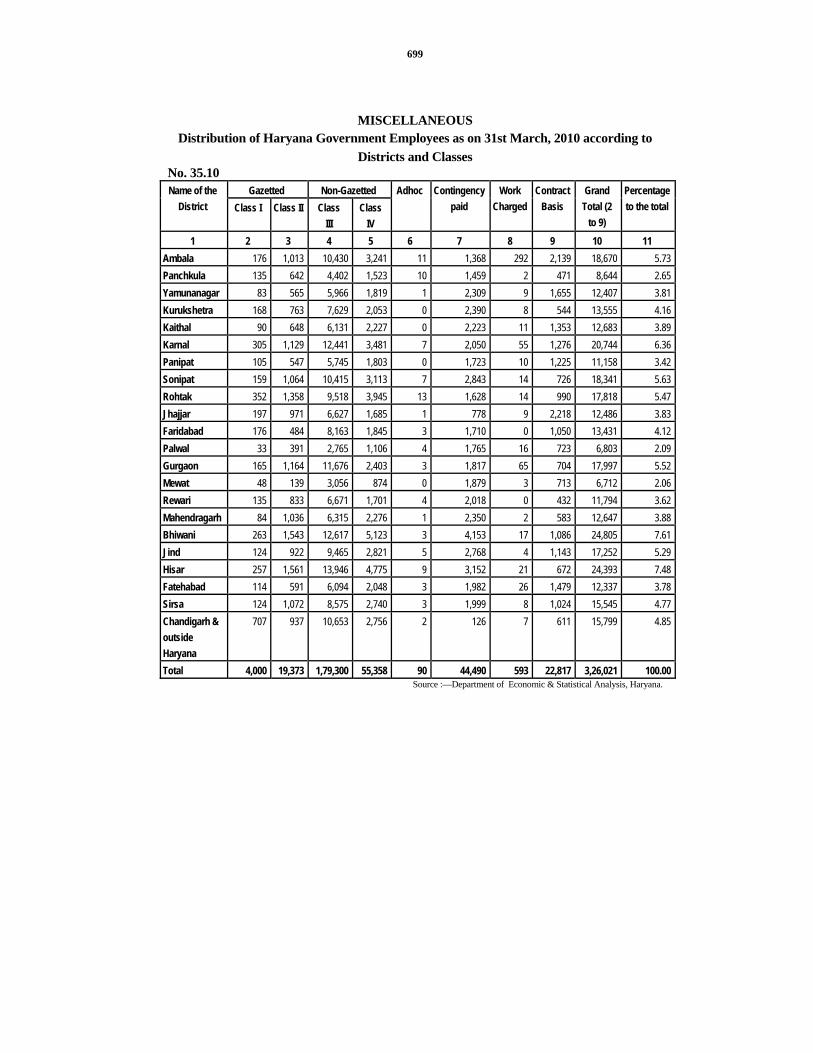
699
MISCELLANEOUS Distribution of Haryana Government Employees as on 31st March, 2010 according to
Districts and Classes No. 35.10
Gazetted Non-Gazetted Name of the District Class I Class II Class
III Class
IV
Adhoc Contingency paid
Work Charged
Contract Basis
Grand Total (2
to 9)
Percentage to the total
1 2 3 4 5 6 7 8 9 10 11 Ambala 176 1,013 10,430 3,241 11 1,368 292 2,139 18,670 5.73 Panchkula 135 642 4,402 1,523 10 1,459 2 471 8,644 2.65 Yamunanagar 83 565 5,966 1,819 1 2,309 9 1,655 12,407 3.81 Kurukshetra 168 763 7,629 2,053 0 2,390 8 544 13,555 4.16 Kaithal 90 648 6,131 2,227 0 2,223 11 1,353 12,683 3.89 Karnal 305 1,129 12,441 3,481 7 2,050 55 1,276 20,744 6.36 Panipat 105 547 5,745 1,803 0 1,723 10 1,225 11,158 3.42 Sonipat 159 1,064 10,415 3,113 7 2,843 14 726 18,341 5.63 Rohtak 352 1,358 9,518 3,945 13 1,628 14 990 17,818 5.47 Jhajjar 197 971 6,627 1,685 1 778 9 2,218 12,486 3.83 Faridabad 176 484 8,163 1,845 3 1,710 0 1,050 13,431 4.12 Palwal 33 391 2,765 1,106 4 1,765 16 723 6,803 2.09 Gurgaon 165 1,164 11,676 2,403 3 1,817 65 704 17,997 5.52 Mewat 48 139 3,056 874 0 1,879 3 713 6,712 2.06 Rewari 135 833 6,671 1,701 4 2,018 0 432 11,794 3.62 Mahendragarh 84 1,036 6,315 2,276 1 2,350 2 583 12,647 3.88 Bhiwani 263 1,543 12,617 5,123 3 4,153 17 1,086 24,805 7.61 Jind 124 922 9,465 2,821 5 2,768 4 1,143 17,252 5.29 Hisar 257 1,561 13,946 4,775 9 3,152 21 672 24,393 7.48 Fatehabad 114 591 6,094 2,048 3 1,982 26 1,479 12,337 3.78 Sirsa 124 1,072 8,575 2,740 3 1,999 8 1,024 15,545 4.77 Chandigarh & outside Haryana
707 937 10,653 2,756 2 126 7 611 15,799 4.85
Total 4,000 19,373 1,79,300 55,358 90 44,490 593 22,817 3,26,021 100.00 Source :—Department of Economic & Statistical Analysis, Haryana.

700
MISCELLANEOUS Distribution of Haryana Government Employees as on 31st March 2010 according to
Departments and Districts No. 35.11 (Contd.)
District Sr. No.
Department Ambala Panchkula Yamunanagar Kurukshetra Kaithal Karnal Panipat
1 2 3 4 5 6 7 8 9 1. Advocate General — — — — — — —2. Administrator General
and official trustee and Treasurer Charitable Endowments
— — — — — — —
3. Agriculture 158 28 130 166 118 332 1164. Animal Husbandry &
Dairying 332 114 186 274 258 433 2315. Archaeology — — — — — — —6. Architecture — — — — — — —7. Archives 5 — — — — — —8. Ayush 94 73 83 173 101 146 839. Civil Aviation — — — — — — —10. Civil Secretariat — — — — — — —11. Chief Electrical Inspector — — — — — — —12. Consolidation — — — — — — —13. Co-operation 42 22 33 89 41 120 5514. Economic and Statistical
Analysis 21 14 17 17 14 15 1215. Education 6,019 3,000 5,098 5,243 4,859 5,884 3,77816. Elections 10 9 9 12 10 11 1017. Employment 16 7 13 14 13 22 1718. Excise and Taxation 184 108 111 87 76 97 12119. Financial Commissioner — — — — — — —20. Fisheries 25 20 23 39 20 32 1921. Food and Supplies 145 35 62 120 115 117 6322. Forest and Wild Life 90 236 206 186 90 75 65

701
MISCELLANEOUS Distribution of Haryana Government Employees as on 31st March 2010 according to
Departments and Districts No. 35.11 (Contd.)
District
Pawal Sonipat Rohtak Jhajjar Faridabad Gurgaon Mewat Rewari
Sr. No. Department
10 11 12 13 14 15 16 17 1. Advocate General — — — — — — — —2. Administrator General and
official trustee and Treasurer Charitable Endowments — — — — — — — —
3. Agriculture 44 259 151 83 83 143 16 704. Animal Husbandry &
Dairying 64 361 335 286 103 160 155 2045. Archaeology — — — — — — — —6. Architecture — — — — — — — —7. Archives — — 4 — — 4 — —8. Ayush 76 115 127 145 51 116 38 799. Civil Aviation — — — — — — — —10. Civil Secretariat — — — — — — — —11. Chief Electrical Inspector — — — — 8 7 — —12. Consolidation — — 121 — — — — —13. Co-operation 20 87 68 48 21 79 31 3614. Economic and Statistical
Analysis 4 12 19 13 15 10 6 1215. Education 2,447 6,641 3,752 4,786 4,221 5,240 2,784 4,73016. Elections 6 13 10 5 9 9 8 617. Employment 8 27 39 13 21 21 6 718. Excise and Taxation 49 156 86 91 255 220 26 9819. Financial Commissioner — — — — — — — —20. Fisheries 8 41 24 20 24 29 30 2421. Food and Supplies 17 76 54 35 50 68 21 4722. Forest and Wild Life 61 109 130 98 66 61 72 108
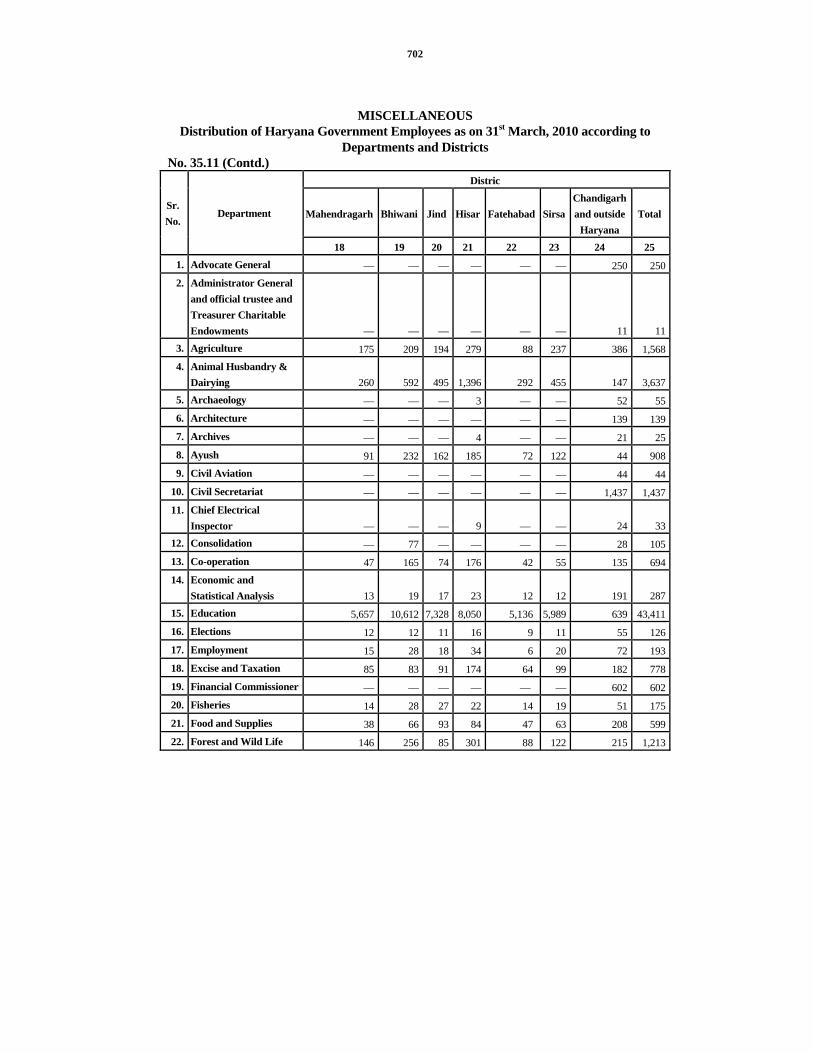
702
MISCELLANEOUS Distribution of Haryana Government Employees as on 31st March, 2010 according to
Departments and Districts No. 35.11 (Contd.)
Distric
Mahendragarh Bhiwani Jind Hisar Fatehabad SirsaChandigarh and outside
Haryana Total
Sr. No.
Department
18 19 20 21 22 23 24 25 1. Advocate General — — — — — — 250 2502. Administrator General
and official trustee and Treasurer Charitable Endowments — — — — — — 11 11
3. Agriculture 175 209 194 279 88 237 386 1,5684. Animal Husbandry &
Dairying 260 592 495 1,396 292 455 147 3,6375. Archaeology — — — 3 — — 52 556. Architecture — — — — — — 139 1397. Archives — — — 4 — — 21 258. Ayush 91 232 162 185 72 122 44 9089. Civil Aviation — — — — — — 44 44
10. Civil Secretariat — — — — — — 1,437 1,43711. Chief Electrical
Inspector — — — 9 — — 24 3312. Consolidation — 77 — — — — 28 10513. Co-operation 47 165 74 176 42 55 135 69414. Economic and
Statistical Analysis 13 19 17 23 12 12 191 28715. Education 5,657 10,612 7,328 8,050 5,136 5,989 639 43,41116. Elections 12 12 11 16 9 11 55 12617. Employment 15 28 18 34 6 20 72 19318. Excise and Taxation 85 83 91 174 64 99 182 77819. Financial Commissioner — — — — — — 602 60220. Fisheries 14 28 27 22 14 19 51 17521. Food and Supplies 38 66 93 84 47 63 208 59922. Forest and Wild Life 146 256 85 301 88 122 215 1,213

703
MISCELLANEOUS Distribution of Haryana Government Employees as on 31st March, 2010 according to
Departments and Districts No. 35.11 (Contd.)
District Sr. No. Department Ambala Panchkula Yamunanagar Kurukshetra Kaithal Karnal Panipat Palwal 1 2 3 4 5 6 7 8 9 10
23. Health and Medical 833 643 506 783 665 990 783 268 24. Home Guards 29 64 20 12 17 20 15 5 25. Hospitality — — — — — — — — 26. Industries and
Commerce 26 12 50 21 18 24 32 13 27. Industrial Training and
Vocational Education 211 62 110 97 140 133 121 83 28. Institutional Finance
and Credit Control — — — — — — — —
29. Irrigation 376 54 360 461 752 891 391 228 30. Labour 22 20 23 15 — 11 49 1 31. Land Records — — — — — — — — 32. Law and Legislative — — — — 14 — — — 33. Lotteries — — — — — — — — 34. Urban Local Bodies — — — — — — — — 35. Local Funds Accounts — — — 14 — — — — 36. Panchayat 106 52 101 128 130 204 110 86 37. Panchayati Raj 45 23 28 31 36 36 24 0 38. Police 3,995 1,185 1,181 1,409 1,159 5,319 1,585 831 39. Prison 215 — — 80 43 312 26 24 40. Printing and Stationery 9 259 3 4 5 58 5 5 41. Prosecution 45 30 36 31 23 52 40 0 42. P.W.D.(B&R) 713 682 261 336 314 787 247 206

704
MISCELLANEOUS Distribution of Haryana Government Employees as on 31st March, 2010 according to
Departments and Districts No. 35.11 (Contd.)
District Sonipat Rohtak Jhajjar Faridabad Gurgaon Mewat Rewari
Sr. No. Department
11 12 13 14 15 16 17 23. Health and Medical 1,257 3,684 713 657 629 152 59324. Home Guards 23 16 16 18 22 8 1325. Hospitality — — — — — — —26. Industries and
Commerce 44 26 28 45 24 12 2027. Industrial Training
and Vocational Education 269 275 118 117 137 60 75
28. Institutional Finance and Credit Control — — — — — — —
29. Irrigation 377 1,302 313 473 164 212 56530. Labour 17 30 11 72 203 — 1031. Land Records — — — — — — —32. Law and Legislative — — — — — — —33. Lotteries — — — — — — —34. Urban Local Bodies — — — — — — —35. Local Funds Accounts — 23 — 18 — — —36. Panchayat 179 109 125 55 94 78 12237. Panchayati Raj 39 38 34 17 38 19 3338. Police 1,935 2,099 1,456 2,993 5,274 681 1,17639. Prison 105 150 — 130 268 — 4140. Printing and
Stationery 4 9 3 9 5 0 441. Prosecution 43 43 28 42 33 16 4342. P.W.D.(B&R) 372 843 293 300 707 160 179

705
MISCELLANEOUS Distribution of Haryana Government Employees as on 31st March, 2010 according to
Departments and Districts No. 35.11 (Contd.)
District Sr. No. Department
Mahendragarh Bhiwani Jind Hisar Fatehabad Sirsa Chandigarh and outside
Haryana
Total
18 19 20 21 22 23 24 25 23. Health and
Medical 152 1,523 984 1,327 559 490 436 18,35924. Home Guards 11 32 17 21 10 24 38 44625. Hospitality — — — — — — 276 27626. Industries and
Commerce 19 34 32 30 19 22 151 68927. Industrial
Training and Vocational Education 163 112 72 271 70 163 221 2,997
28. Institutional Finance and Credit Control — — — — — — 12 12
29. Irrigation 480 2,134 692 1,558 576 797 701 13,62930. Labour — 9 — 15 — 11 99 61731. Land Records — — — — — — 34 3432. Law and
Legislative — — — — — — 155 16933. Lotteries — — — — — — 27 2734. Urban Local
Bodies — — — — — — 115 11535. Local Funds
Accounts — 20 — 19 — — 164 25836. Panchayat 137 265 213 44 136 137 85 2,61037. Panchayati Raj 25 44 35 201 25 31 41 84338. Police 822 1,362 1,174 2,691 1,213 1,568 3,218 43,49539. Prison 101 123 88 307 — 100 53 2,14240. Printing and
Stationery 5 5 11 8 — 4 261 67141. Prosecution 28 46 38 53 37 39 46 79242. P.W.D.(B&R) 225 436 312 779 163 211 340 8,660

706
MISCELLANEOUS Distribution of Haryana Government Employees as on 31st March, 2010 according to
Departments and Districts No. 35.11 (Contd.)
District Sr. No.
Department Ambala Panchkula Yamunanagar Kurukshetra Kaithal Karnal Panipat
1 2 3 4 5 6 7 8 9 43. P.W.D. (Public Health) 1,275 404 631 569 422 461 54644. Public Relation 46 21 29 48 38 50 3645. Haryana Public Service
Commission — — — — — — —46. Rehabilitation 8 — — 5 — 7 647. Haryana Raj Bhawan — — — — — — —48. Science & Technology — — — — — — —49. Sports & Youth Welfare 25 36 21 29 14 29 1450. Small Savings — — — — — — —51. Social Justice &
Empowerment 12 13 13 15 19 32 4752. State Vigilance Bureau — — — — — — —53. Haryana Staff Selection
Commission — — — — — — —54. Supplies and Diposal — — — — — — —55. Special Enquiry Agency — — — — — — —56. Technical Education 286 34 — — — 153 —57. Tourism — — — — — — 3158. Town & Country
Planning 24 57 12 26 11 18 3259. Transport 1,059 15 813 849 820 975 61860. Treasury &Accounts 44 31 31 35 38 60 3261. Urban Estates 156 20 — — — — —62. Haryana Vidhan Sabha — — — — — — —63. Welfare of Scheduled
Castes and Backward Classes 21 19 17 27 17 32 17

707
MISCELLANEOUS Distribution of Haryana Government Employees as on 31st March, 2010 according to
Departments and Districts No. 35.11 (Contd.)
District Palwal Sonipat Rohtak Jhajjar Faridabad Gurgaon Mewat Rewari Mahendragarh
Sr. No
Department 10 11 12 13 14 15 16 17 18
43. P.W.D. (Public Health) 515 1,191 864 749 220 841 438 558 917 44. Public Relation 21 52 67 33 23 31 26 35 30 45. Haryana Public
Service Commission — — — — — — — — — 46. Rehabilitation — — 7 6 11 9 — 4 — 47. Haryana Raj Bhawan — — — — — — — — — 48. Science & Technology — — — — — — — — — 49. Sports & Youth
Welfare 6 299 51 16 25 40 — 17 14 50. Small Savings — — — — — — — — — 51. Social Justice &
Empowerment 1 28 22 15 25 20 11 18 14 52. State Vigilance
Bureau — — 68 — — 80 — — — 53. Haryana Staff
Selection Commission — — — — — — — — —
54. Supplies and Diposal — — — — — — — — — 55. Special Enquiry
Agency — — — — — — — — — 56. Technical Education 89 120 — 136 102 128 — — 121 57. Tourism — — — — — — — — — 58. Town & Country
Planning — 28 25 17 29 75 8 18 11 59. Transport — 1,142 930 714 975 968 — 660 629 60. Treasury &Accounts 10 34 40 24 37 50 — 22 34 61. Urban Estates — — — — 28 — — — — 62. Haryana Vidhan
Sabha — — — — — — — — — 63. Welfare of Scheduled
Castes and Backward Classes 11 43 60 27 25 18 20 33 31

708
MISCELLANEOUS Distribution of Haryana Government Employees as on 31st March, 2010 according to
Departments and Districts No. 35.11 (Contd.)
District
Bhiwani Jind Hisar Fatehabad Sirsa Chandigarh and outside
Haryana
Total Sr. No
Department
19 20 21 22 23 24 25 43. P.W.D. (Public Health) 1,440 891 1,418 521 1,019 176 15,55144. Public Relation 58 55 54 42 37 351 1,16245. Haryana Public Service
Commission — — — — — 116 11646. Rehabilitation 8 — 10 — — 44 12547. Haryana Raj Bhawan — — — — — 92 9248. Science & Technology — — — — — 12 1249. Sports & Youth Welfare 52 29 34 14 24 74 85750. Small Savings — — — — — 11 1151. Social Justice & Empowerment 19 23 25 10 18 79 47852. State Vigilance Bureau — — 50 — — 162 36053. Haryana Staff Selection
Commission — — — — — 69 6954. Supplies and Diposal — — — — — 49 4955. Special Enquiry Agency — — — — — 16 1656. Technical Education — — 266 — 259 93 1,69857. Tourism — — — — — 31 6258. Town & Country Planning 21 20 46 10 21 80 58959. Transport 1,017 959 1,194 875 787 2,075 18,07460. Treasury &Accounts 15 40 16 33 35 83 73461. Urban Estates — — 25 — — 20 24962. Haryana Vidhan Sabha — — — — — 272 27263. Welfare of Scheduled Castes and
Backward Classes 46 49 33 23 29 82 669

709
MISCELLANEOUS Distribution of Haryana Government Employees as on 31st March, 2010 according to
Departments and Districts No. 35.11 (Contd.)
District Sr. No.
Department Ambala Panchkula Yamunanagar Kurukshetra Kaithal Karnal Panipat
1 2 3 4 5 6 7 8 9 64. Commissioners/Deputy
Commissioners 325 151 259 279 275 327 230 65. Distt. & Sessions Judges 352 188 206 244 188 379 91 66. Horticulture 19 33 14 33 22 79 23 67. Mines and Geology 7 15 6 4 — — 5 68. Electronics — — — — — — — 69. Rural Development — 3 — — 12 — — 70. Environment — — — 18 — — — 71. Women and Child Development 1,241 839 1,692 1,511 1,765 2,005 1,417 72. Renewable Energy Sources 4 3 4 5 3 5 5 73. Others — 10 9 16 8 11 10 Total 18,670 8,644 12,407 13,555 12,683 20,744 11,158
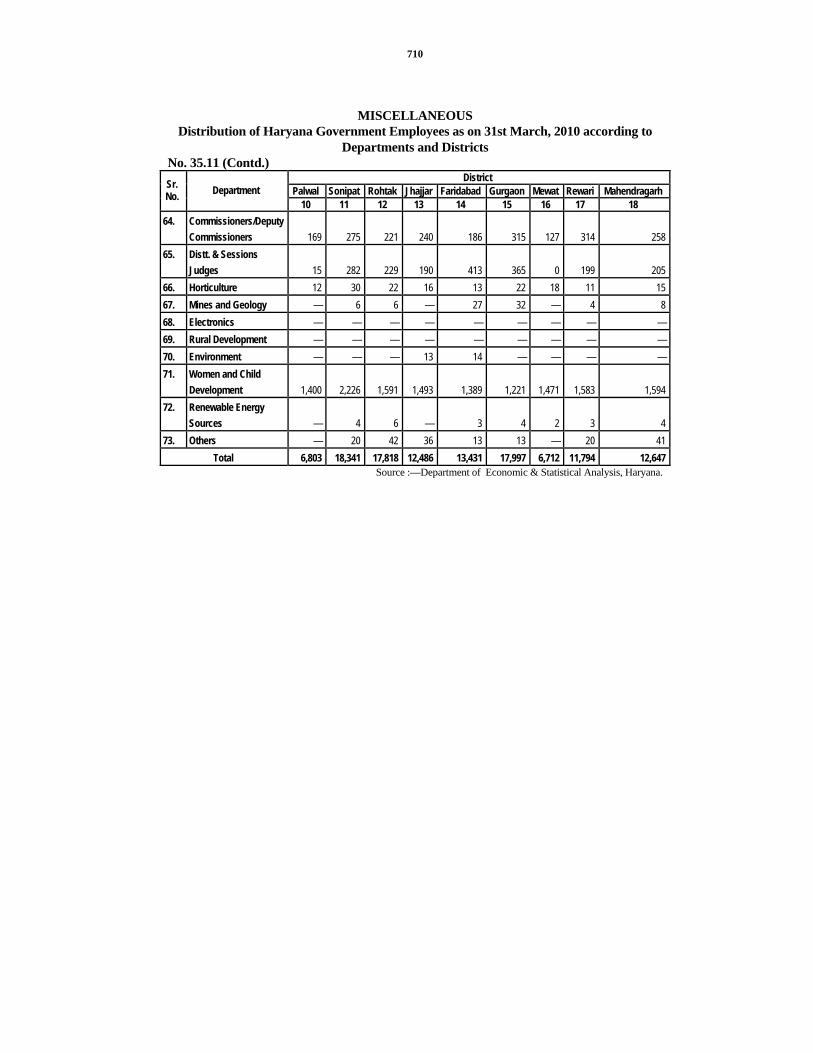
710
MISCELLANEOUS Distribution of Haryana Government Employees as on 31st March, 2010 according to
Departments and Districts No. 35.11 (Contd.)
District Palwal Sonipat Rohtak Jhajjar Faridabad Gurgaon Mewat Rewari Mahendragarh Sr.
No. Department 10 11 12 13 14 15 16 17 18
64. Commissioners/Deputy Commissioners 169 275 221 240 186 315 127 314 258
65. Distt. & Sessions Judges 15 282 229 190 413 365 0 199 205
66. Horticulture 12 30 22 16 13 22 18 11 15 67. Mines and Geology — 6 6 — 27 32 — 4 8 68. Electronics — — — — — — — — — 69. Rural Development — — — — — — — — — 70. Environment — — — 13 14 — — — — 71. Women and Child
Development 1,400 2,226 1,591 1,493 1,389 1,221 1,471 1,583 1,594 72. Renewable Energy
Sources — 4 6 — 3 4 2 3 4 73. Others — 20 42 36 13 13 — 20 41
Total 6,803 18,341 17,818 12,486 13,431 17,997 6,712 11,794 12,647 Source :—Department of Economic & Statistical Analysis, Haryana.

711
MISCELLANEOUS Distribution of Haryana Government Employees as on 31st March, 2010 according to
Departments and Districts No. 35.11 (Concld.)
Districts Bhiwani Jind Hisar Fatehabad Sirsa Chandigarh
and outside Haryana
Total
Sr. No.
Department
19 20 21 22 23 24 25 64. Commissioners/Deputy
Commissioners 457 439 300 380 461 28 5,84765. Distt. & Sessions Judges 268 214 280 202 152 — 4,64766. Horticulture 24 31 42 30 28 56 58167. Mines and Geology 12 3 7 — 3 85 23068. Electronics — — — — — 10 1069. Rural Development — — — — — 49 6470. Environment — — — — — 31 7671. Women and Child Development 2,806 2,212 2,476 1,488 1,854 112 33,98672. Renewable Energy Sources 5 4 4 3 5 35 11173. Others 33 20 33 28 12 — 375
Total 24,805 17,252 24,393 12,337 15,545 15,799 3,26,021Source :—Department of Economic & Statistical Analysis, Haryana.

712
MISCELLANEOUS Distribution of Haryana Government Employees as on 31st March, 2010 according to
different classes and departments No. 35.12 Sr. No.
Department Class I Class II Class III Class IV
1 2 3 4 5 6 1. Advocate General 101 8 84 392. Administrator General and Official Trustee
and Treasurer Charitable Endowments 1 1 7 23. Agriculture 55 274 2,113 9474. Animal Husbandry & Dairying 728 80 3,068 3,2225. Archaeology 1 4 25 256. Architecture 14 9 91 237. Archives 1 5 23 88. Ayush 9 506 788 1109. Civil Aviation 6 1 17 1810 Civil Secretariat 76 119 884 35811 Chief Electrical Inspector 5 4 23 1412 Consolidation 2 3 173 4413 Co-operation 8 30 1,162 21414 Economic & Statistical Analysis 3 64 299 7915 Education 256 12,968 65,219 9,35516 Elections 2 10 153 5017 Employment 14 35 259 11118 Excise and Taxation 59 225 1,491 73119 Financial Commissioner 52 75 339 13620 Fisheries 5 28 234 25021 Food & Supply 20 77 1,002 45022 Forest & Wild Life 32 52 1,918 74823 Health & Medical 1,143 1,224 10,186 4,35924 Home Guards 5 12 284 11325 Hospitality 1 3 72 86
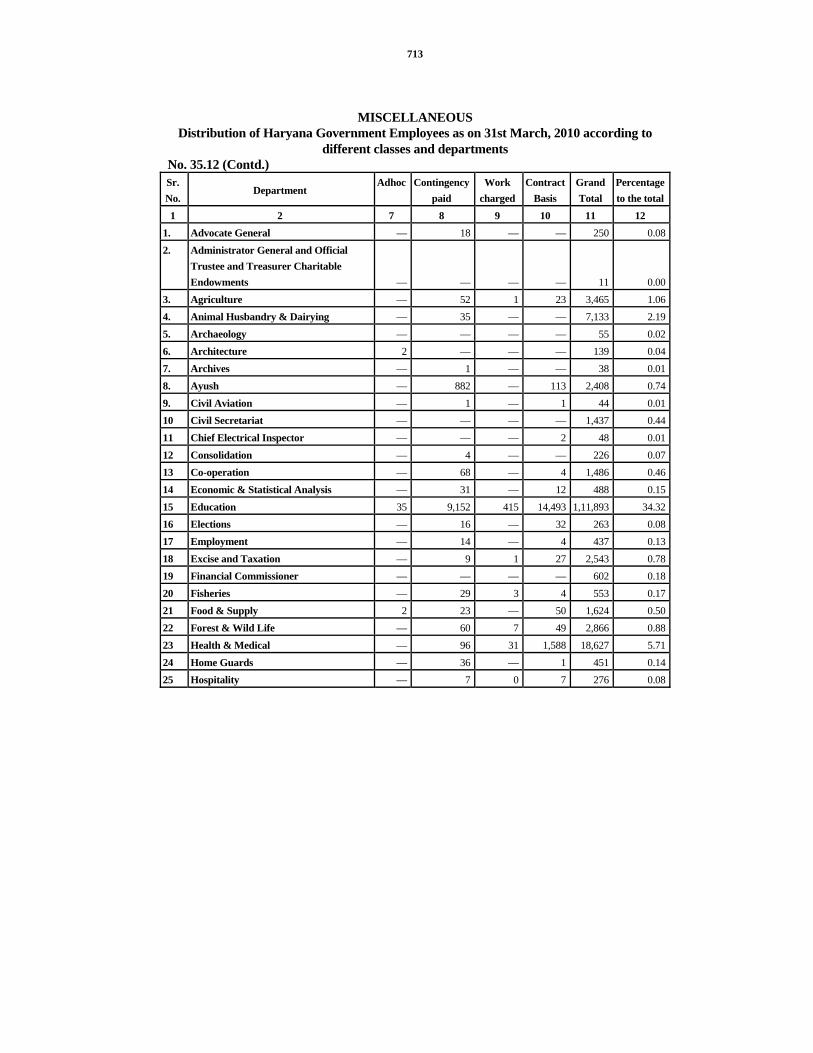
713
MISCELLANEOUS Distribution of Haryana Government Employees as on 31st March, 2010 according to
different classes and departments No. 35.12 (Contd.) Sr. No.
Department Adhoc Contingency
paid Work
charged Contract
Basis Grand Total
Percentage to the total
1 2 7 8 9 10 11 12 1. Advocate General — 18 — — 250 0.082. Administrator General and Official
Trustee and Treasurer Charitable Endowments — — — — 11 0.00
3. Agriculture — 52 1 23 3,465 1.064. Animal Husbandry & Dairying — 35 — — 7,133 2.195. Archaeology — — — — 55 0.026. Architecture 2 — — — 139 0.047. Archives — 1 — — 38 0.018. Ayush — 882 — 113 2,408 0.749. Civil Aviation — 1 — 1 44 0.0110 Civil Secretariat — — — — 1,437 0.4411 Chief Electrical Inspector — — — 2 48 0.0112 Consolidation — 4 — — 226 0.0713 Co-operation — 68 — 4 1,486 0.4614 Economic & Statistical Analysis — 31 — 12 488 0.1515 Education 35 9,152 415 14,493 1,11,893 34.3216 Elections — 16 — 32 263 0.0817 Employment — 14 — 4 437 0.1318 Excise and Taxation — 9 1 27 2,543 0.7819 Financial Commissioner — — — — 602 0.1820 Fisheries — 29 3 4 553 0.1721 Food & Supply 2 23 — 50 1,624 0.5022 Forest & Wild Life — 60 7 49 2,866 0.8823 Health & Medical — 96 31 1,588 18,627 5.7124 Home Guards — 36 — 1 451 0.1425 Hospitality — 7 0 7 276 0.08

714
MISCELLANEOUS Distribution of Haryana Government Employees as on 31st March, 2010 according to
different classes and departments No. 35.12 (Contd.) Sr. No. Department Class I Class II Class III Class IV
1 2 3 4 5 6
26. Industries and Commerce 32 19 425 181
27. Industrial Training & Vocational Education 32 100 1,649 636
28. Institutional Finance & Credit Control — 1 9 1
29. Irrigation 154 320 5,810 7,420
30. Labour 27 68 330 126
31. Land Records — 4 24 6
32. Law and Legislative 14 19 48 26
33. Lotteries — 1 10 5
34. Urban Development 3 9 73 30
35. Local Funds Accounts 4 33 199 22
36. Panchayat 7 146 2,068 425
37. Panchayati Raj 24 112 563 78
38. Police 101 226 40,865 2,254
39. Prison 34 37 1,866 229
40. Printing & Stationery 1 6 358 302
41. Prosecution 23 257 361 104
42. P.W.D. (B &R) 91 211 3,145 5,380
43. P.W.D. (Public Health) 76 189 5,557 9,443
44. Public Relations 9 67 477 408
45. Haryana Public Service Commission 14 7 56 20
46. Rehabilitation 1 6 78 35
47. Haryana Raj Bhawan 3 4 39 44
48. Science & Technology 1 2 6 3
49. Sports & Youth Welfare 4 288 304 216

715
MISCELLANEOUS Distribution of Haryana Government Employees as on 31st March, 2010 according to
different classes and departments No. 35.12 (Contd.)
Adhoc Contin-gency paid
Work charged
Contract Basis
Grand Total
Percentage to the total Sr. No. Department
7 8 9 10 11 12 26. Industries and Commerce — 38 1 6 702 0.22 27. Industrial Training & Vocational
Education 6 57 18 582 3,080 0.94 28. Institutional Finance & Credit
Control — 1 — — 12 0.00 29. Irrigation — 16 14 123 13,857 4.25 30. Labour — 1 — 66 618 0.19 31. Land Records — — — —- 34 0.01 32. Law and Legislative — 1 — 61 169 0.05 33. Lotteries — 10 — 1 27 0.01 34. Urban Development — — — — 115 0.04 35. Local Funds Accounts — — — — 258 0.08 36. Panchayat 4 37 — 9 2,696 0.83 37. Panchayati Raj — 21 — 45 843 0.26 38. Police — 755 — 125 44,326 13,60 39. Prison — — — — 2,166 0.66 40. Printing & Stationery — 7 — 2 676 0.21 41. Prosecution — 20 5 22 792 0.24 42. P.W.D. (B &R) — 9 2 28 8,866 2.72 43. P.W.D. (Public Health) 11 24 11 755 16,066 4.93 44. Public Relations 2 108 7 105 1,183 0.36 45. Haryana Public Service Commission — — — 19 116 0.04 46. Rehabilitation — 5 — — 125 0.04 47. Haryana Raj Bhawan — — — 2 92 0.03 48. Science & Technology — — — — 12 0.00 49. Sports & Youth Welfare — 3 — 48 863 0.26
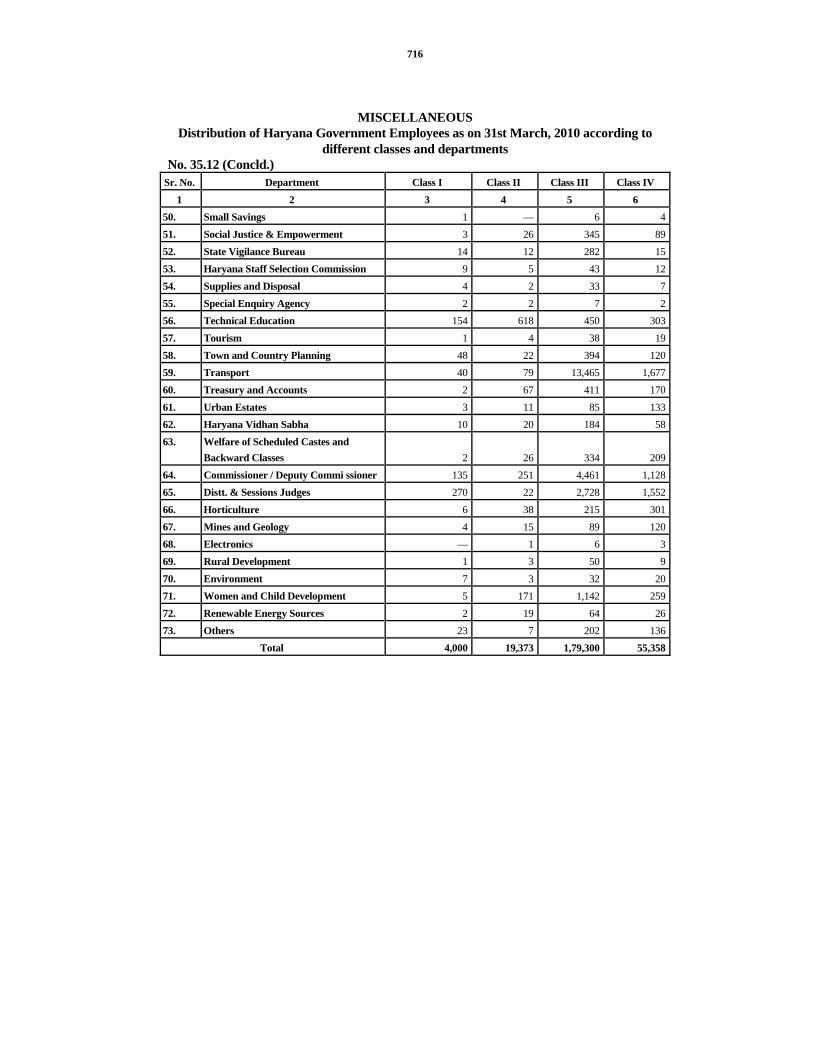
716
MISCELLANEOUS Distribution of Haryana Government Employees as on 31st March, 2010 according to
different classes and departments No. 35.12 (Concld.)
Sr. No. Department Class I Class II Class III Class IV 1 2 3 4 5 6
50. Small Savings 1 — 6 451. Social Justice & Empowerment 3 26 345 8952. State Vigilance Bureau 14 12 282 1553. Haryana Staff Selection Commission 9 5 43 1254. Supplies and Disposal 4 2 33 755. Special Enquiry Agency 2 2 7 256. Technical Education 154 618 450 30357. Tourism 1 4 38 1958. Town and Country Planning 48 22 394 12059. Transport 40 79 13,465 1,67760. Treasury and Accounts 2 67 411 17061. Urban Estates 3 11 85 13362. Haryana Vidhan Sabha 10 20 184 5863. Welfare of Scheduled Castes and
Backward Classes 2 26 334 20964. Commissioner / Deputy Commi ssioner 135 251 4,461 1,12865. Distt. & Sessions Judges 270 22 2,728 1,55266. Horticulture 6 38 215 30167. Mines and Geology 4 15 89 12068. Electronics — 1 6 369. Rural Development 1 3 50 970. Environment 7 3 32 2071. Women and Child Development 5 171 1,142 25972. Renewable Energy Sources 2 19 64 2673. Others 23 7 202 136
Total 4,000 19,373 1,79,300 55,358

717
MISCELLANEOUS Distribution of Haryana Government Employees as on 31st March, 2010 according to
different classes and departments No. 35.12 (Concld.)
Adhoc Contingency Paid
Work-Charged
Contract Basis
Grand Total
Percentage to the total
Sr. No. Department
7 8 9 10 11 12 50. Small Savings — — — — 11 0.00 51. Social Justice & Empowerment 1 12 — 3 479 0.15 52. State Vigilance Bureau — 23 12 2 360 0.11 53. Haryana Staff Selection Commission — — — — 69 0.02 54. Supplies and Disposal — 3 — — 49 0.02 55. Special Enquiry Agency — — 2 1 16 0.00 56. Technical Education 22 113 12 115 1,787 0.55 57. Tourism — — — — 62 0.02 58. Town and Country Planning — — — 5 589 0.18 59. Transport — 108 26 2,679 18,074 5.54 60. Treasury and Accounts — 83 — 11 744 0.23 61. Urban Estates — — — 17 249 0.08 62. Haryana Vidhan Sabha — — — — 272 0.08 63. Welfare of Scheduled Castes and
Backward Classes — 103 — 6 680 0.21 64. Commissioner / Deputy Commi ssioner — 11 — 30 6,016 1.85 65. Distt. & Sessions Judges 4 23 15 48 4,662 1.43 66. Horticulture — 6 3 24 593 0.18 67. Mines and Geology — — — 2 230 0.07 68. Electronics — — — — 10 0.00 69. Rural Development — 1 — — 64 0.02 70. Environment — 1 — 13 76 0.02 71. Women and Child Development 1 32,353 7 1,448 35,386 10.85 72. Renewable Energy Sources — — — — 111 0.03 73. Others — 3 — 4 375 0.12 Total 90 44,490 593 22,817 3,26,021 100.00
Source :—Department of Economic & Statistical Analysis, Haryana. * Anganwari workers and helpers are included in these figures.

718
MISCELLANEOUS Haryana Government Employees belonging to Scheduled Castes, Backward Classes, Ex-
servicemen, Ad-hoc and Handicapped according to sex (As on 31st March, 2010)
No. 35.13 (Contd.) Scheduled Castes Backward Classes
Class Male Female Total Male Female Total
1 2 3 4 5 6 7 I 366 72 438 315 46 361II 1,736 612 2,348 2,132 633 2,765III 24,554 4,469 29,023 26,929 5,294 32,223IV 15,248 2,946 18,194 8,781 1,133 9,914Adhoc 12 36 48 12 0 12Contigency paid, work charged and Contract Basis 5,533 11,189 16,712 3,009 8,461 11,470Total 47,449 19,314 66,763 41,178 15,567 56,745

719
MISCELLANEOUS Haryana Government Employees belonging to Scheduled Castes, Backward Classes, Ex-
servicemen, Ad-hoc and Handicapped according to sex (As on 31st March, 2010)
No. 35.13 (Concld.) Ex-servicemen Handicapped
Male Female Total Male Female Total Class
8 9 10 11 12 13 I 29 — 29 42 5 47II 184 17 201 284 118 402III 2,939 251 3,190 1,819 445 2,264IV 622 44 666 699 65 764Adhoc 2 — 2 1 — 1Contigency paid, work charged and Contract Basis 188 34 222 73 363 436Total 3,964 346 4,310 2,918 996 3,914
Source :—Department of Economic & Statistical Analysis, Haryana.

720
MISCELLANEOUS Religionwise Number of Haryana Government Employees as on 31st March, 2010
No. 35.14 Religion Class I Class II Class III Class IV Adhoc Contingency
paid, work charged and
Contract Basis
Total
Serial No.
1 2 3 4 5 6 7 8 1. Hindu 3,878 18,710 1,71,462 53,444 87 64,211 3,11,7922. Muslim 21 80 1,859 814 1 1,029 3,8043. Sikh 100 569 5,831 1,047 2 2,572 10,1214. Christian 1 4 114 34 — 33 1865. Others — 10 34 19 — 55 118Total 4,000 19,373 1,79,300 55,358 90 67,900 3,26,021
Source :—Department of Economic & Statistical Analysis, Haryana.
721
Number of Haryana Government Employees according to Departments and Sex

722

723
MISCELLANEOUS Distribution of Haryana Government Employees as on 31st March, 2010 according to
different departments and sex No. 35.15 (Contd.)
Class I Class II Class III Sr. No.
Department Male Female Total Male Female Total Male Female Total
1 2 3 4 5 6 7 8 9 10 11 1. Advocate General 88 13 101 6 2 8 68 16 842. Administrator General and
Official Trustee and Treasurer Charitable Endowments 1 0 1 1 0 1 6 1 7
3. Agriculture 54 1 55 265 9 274 1967 146 21134. Animal Husbandry &
Dairying 698 30 728 71 9 80 2946 122 30685. Archaeology 1 0 1 4 0 4 22 3 256. Architecture 11 3 14 6 3 9 60 31 917. Archives 0 1 1 4 1 5 21 2 238. Ayush 8 1 9 390 116 506 398 390 7889. Civil Aviation 6 0 6 1 0 1 14 3 1710. Civil Secretariat 66 10 76 91 28 119 693 191 88411. Chief Electrical Inspector 5 0 5 4 0 4 21 2 2312. Consolidation 2 0 2 3 0 3 170 3 17313. Co-operation 7 1 8 27 3 30 1052 110 116214. Economic & Statistical
Analysis 3 0 3 55 9 64 231 68 29915. Education 179 77 256 8573 4395 12968 39736 25483 6521916. Elections 1 1 2 10 0 10 136 17 15317. Employment 11 3 14 24 11 35 220 39 25918. Excise and Taxation 52 7 59 206 19 225 1347 144 149119. Financial Commissioner 44 8 52 50 25 75 284 55 33920. Fisheries 5 0 5 27 1 28 198 36 23421. Food & Supply 15 5 20 67 10 77 916 86 100222. Forest & Wild Life 30 2 32 51 1 52 1831 87 191823. Health & Medical 881 262 1143 827 397 1224 5164 5022 1018624. Home Guards 5 0 5 10 2 12 267 17 28425. Hospitality 1 0 1 3 0 3 71 1 72
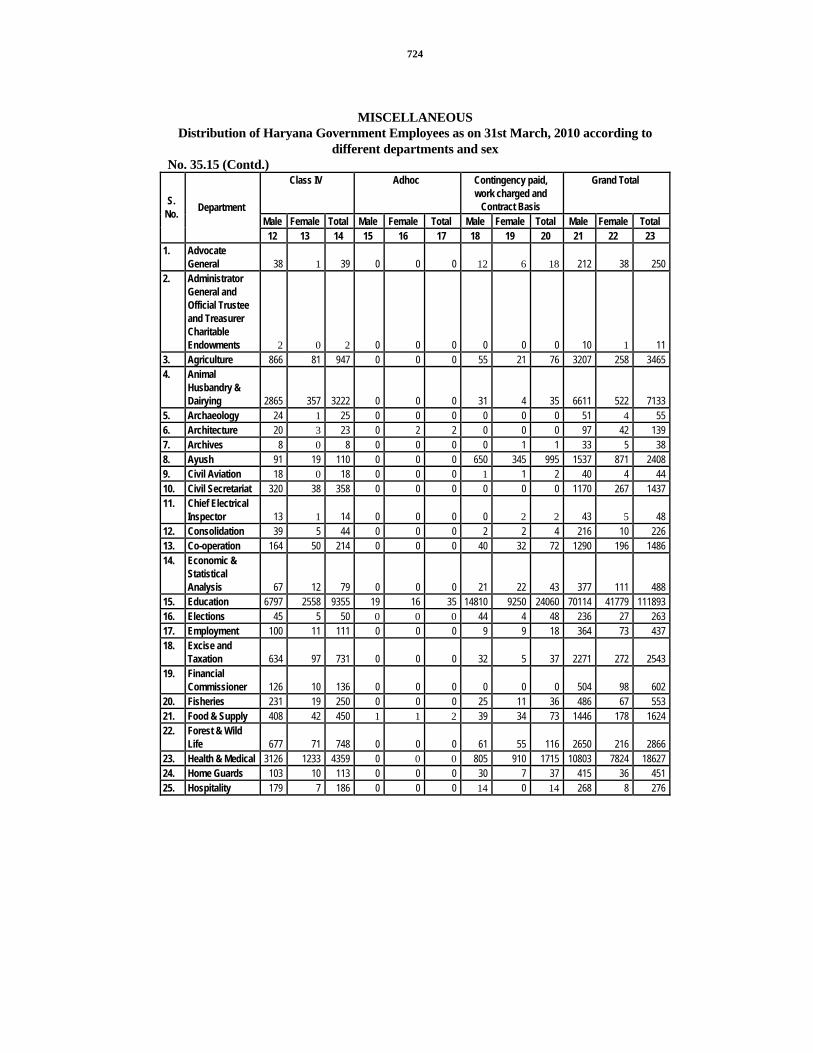
724
MISCELLANEOUS Distribution of Haryana Government Employees as on 31st March, 2010 according to
different departments and sex No. 35.15 (Contd.)
Class IV Adhoc Contingency paid, work charged and
Contract Basis
Grand Total
Male Female Total Male Female Total Male Female Total Male Female Total
S. No. Department
12 13 14 15 16 17 18 19 20 21 22 23 1. Advocate
General 38 1 39 0 0 0 12 6 18 212 38 250 2. Administrator
General and Official Trustee and Treasurer Charitable Endowments 2 0 2 0 0 0 0 0 0 10 1 11
3. Agriculture 866 81 947 0 0 0 55 21 76 3207 258 3465 4. Animal
Husbandry & Dairying 2865 357 3222 0 0 0 31 4 35 6611 522 7133
5. Archaeology 24 1 25 0 0 0 0 0 0 51 4 55 6. Architecture 20 3 23 0 2 2 0 0 0 97 42 139 7. Archives 8 0 8 0 0 0 0 1 1 33 5 38 8. Ayush 91 19 110 0 0 0 650 345 995 1537 871 2408 9. Civil Aviation 18 0 18 0 0 0 1 1 2 40 4 44 10. Civil Secretariat 320 38 358 0 0 0 0 0 0 1170 267 1437 11. Chief Electrical
Inspector 13 1 14 0 0 0 0 2 2 43 5 48 12. Consolidation 39 5 44 0 0 0 2 2 4 216 10 226 13. Co-operation 164 50 214 0 0 0 40 32 72 1290 196 1486 14. Economic &
Statistical Analysis 67 12 79 0 0 0 21 22 43 377 111 488
15. Education 6797 2558 9355 19 16 35 14810 9250 24060 70114 41779 111893 16. Elections 45 5 50 0 0 0 44 4 48 236 27 263 17. Employment 100 11 111 0 0 0 9 9 18 364 73 437 18. Excise and
Taxation 634 97 731 0 0 0 32 5 37 2271 272 2543 19. Financial
Commissioner 126 10 136 0 0 0 0 0 0 504 98 602 20. Fisheries 231 19 250 0 0 0 25 11 36 486 67 553 21. Food & Supply 408 42 450 1 1 2 39 34 73 1446 178 1624 22. Forest & Wild
Life 677 71 748 0 0 0 61 55 116 2650 216 2866 23. Health & Medical 3126 1233 4359 0 0 0 805 910 1715 10803 7824 18627 24. Home Guards 103 10 113 0 0 0 30 7 37 415 36 451 25. Hospitality 179 7 186 0 0 0 14 0 14 268 8 276

725
MISCELLANEOUS Distribution of Haryana Government Employees as on 31st March, 2010 according to
different departments and sex No. 35.15 (Contd.)
Gazetted Non-Gazetted Class I Class II Class III
Sr. No
Department Male Female Total Male Female Total Male Female Total
1 2 3 4 5 6 7 8 9 10 11 26. Industries and
Commerce 32 0 32 14 5 19 348 77 42527. Industrial Training &
Vocational Education 30 2 32 73 27 100 1447 202 164928. Institutional Finance &
Credit Control 0 0 0 1 0 1 8 1 929. Irrigation 154 0 154 316 4 320 5477 333 581030. Labour 20 7 27 54 14 68 272 58 33031. Land Records 0 0 0 3 1 4 20 4 2432. Law and Legislative 8 6 14 14 5 19 40 8 4833. Lotteries 0 0 0 1 0 1 9 1 1034. Urban Local Bodies 3 0 3 9 0 9 61 12 7535. Local Funds Accounts 4 0 4 33 0 33 156 43 19936. Panchayat 6 1 7 136 10 146 1928 140 206837. Panchayati Raj 24 0 24 112 0 112 545 18 56338. Police 98 3 101 207 19 226 38760 2105 4086539. Prisons 29 5 34 36 1 37 1764 102 186640. Printing & Stationery 1 0 1 5 1 6 337 21 35841. Prosecution 22 1 23 247 10 257 341 20 36142. P.W.D. (B &R) 91 0 91 208 3 211 2940 205 314543. P.W.D. (Public Health) 76 0 76 184 5 189 5391 166 555744. Public Relations 9 0 9 48 19 67 413 64 47745. Haryana Public Service
Commission 13 1 14 5 2 7 48 8 5646. Rehabilitation 1 0 1 6 0 6 66 12 7847. Haryana Raj Bhawan 3 0 3 4 0 4 39 0 3948. Science & Technology 1 0 1 2 0 2 5 1 649. Sports & Youth Welfare 2 2 4 247 41 288 231 73 304

726
MISCELLANEOUS Distribution of Haryana Government Employees as on 31st March, 2010 according to
different departments and sex No. 35.15 (Contd.)
Non-Gazetted
Class IV Adhoc
Contingency paid, work charged and
Contract Basis Grand Total
Male Female Total Male Female Total Male Female Total Male Female Total
Sr. No
Department
12 13 14 15 16 17 18 19 20 21 22 23 26. Industries and
Commerce 152 29 181 0 0 0 33 12 45 579 123 702 27. Industrial Training &
Vocational Education 563 73 636 5 1 6 503 154 657 2621 459 3080 28. Institutional Finance &
Credit Control 1 0 1 0 0 0 0 1 1 10 2 12 29. Irrigation 6954 466 7420 0 0 0 133 20 153 13034 823 13857 30. Labour 98 28 126 0 0 0 56 11 67 500 118 618 31. Land Records 5 1 6 0 0 0 0 0 0 28 6 34 32. Law and Legislative 25 1 26 0 0 0 48 14 62 135 34 169 33. Lotteries 4 1 5 0 0 0 9 2 11 23 4 27 34. Urban Local Bodies 29 1 30 0 0 0 0 0 0 102 13 115 35. Local Funds Accounts 21 1 22 0 0 0 0 0 0 214 44 258 36. Panchayat 346 79 425 4 0 4 30 16 46 2450 246 2696 37. Panchayati Raj 67 11 78 0 0 0 47 19 66 795 48 843 38. Police 2059 195 2254 0 0 0 786 94 880 41910 2416 44326 39. Prisons 210 19 229 0 0 0 0 0 0 2039 127 2166 40. Printing & Stationery 254 48 302 0 0 0 6 3 9 603 73 676 41. Prosecution 94 10 104 0 0 0 32 15 47 736 56 792 42. P.W.D. (B &R) 4992 388 5380 0 0 0 38 1 39 8269 597 8866 43. P.W.D. (Public Health) 9018 425 9443 11 0 11 778 12 790 15458 608 16066 44. Public Relations 383 25 408 2 0 2 189 31 220 1044 139 1183 45. Haryana Public Service
Commission 18 2 20 0 0 0 13 6 19 97 19 116 46. Rehabilitation 31 4 35 0 0 0 2 3 5 106 19 125 47. Haryana Raj Bhawan 43 1 44 0 0 0 2 0 2 91 1 92 48. Science & Technology 3 0 3 0 0 0 0 0 0 11 1 12 49. Sports & Youth Welfare 186 30 216 0 0 0 39 12 51 705 158 863

727
MISCELLANEOUS Distribution of Haryana Government Employees as on 31st March, 2010 according to
different departments and sex No. 35.15 (Concld.)
Gazetted Non-Gazetted
Class I Class II Class III Sr. No. Department
Male Female Total Male Female Total Male Female Total 1 2 3 4 5 6 7 8 9 10 11
50. Small Savings 1 0 1 0 0 0 6 0 651. Social Justice &
Empowerment 3 0 3 18 8 26 295 50 34552. State Vigilance Bureau 14 0 14 12 0 12 269 13 28253. Haryana Staff Selection
Commission 8 1 9 5 0 5 41 2 4354. Supplies and Disposal 4 0 4 2 0 2 26 7 3355. Special Enquiry Agency 2 0 2 2 0 2 6 1 756. Technical Education 134 20 154 477 141 618 368 82 45057. Tourism 1 0 1 4 0 4 30 8 3858. Town and Country
Planning 43 5 48 17 5 22 344 50 39459. Transport 37 3 40 77 2 79 13285 180 1346560. Treasury and Accounts 2 0 2 56 11 67 351 60 41161. Urban Estates 3 0 3 10 1 11 68 17 8562. Haryana Vidhan Sabha 10 0 10 18 2 20 161 23 18463. Welfare of Scheduled
Castes and Backward Classes 0 2 2 24 2 26 190 144 334
64. Commissioner / Deputy Commissioner 126 9 135 242 9 251 4160 301 4461
65. Distt. & Sessions Judges 208 62 270 22 0 22 2216 512 272866. Horticulture 6 0 6 38 0 38 197 18 21567. Mines and Geology 4 0 4 14 1 15 79 10 8968. Electronics 0 0 0 1 0 1 5 1 669. Rural Development 1 0 1 2 1 3 37 13 5070. Environment 4 3 7 2 1 3 29 3 3271. Women and Child
Development 1 4 5 23 148 171 421 721 114272. Renewable Energy
Sources 2 0 2 19 0 19 60 4 6473. Others 21 2 23 6 1 7 198 4 202
Total 3436 564 4000 13832 5541 19373 141327 37973 179300

728
MISCELLANEOUS Distribution of Haryana Government Employees as on 31st March, 2010 according to
different departments and sex No. 35.15 (Concld.)
Non-Gazetted Class IV
Adhoc Contingency paid, work charged and Contract
Basis
Grand Total
Male Female Total Male Female Total Male Female Total Male Female Total
Sr. No. Department
12 13 14 15 16 17 18 19 20 21 22 23 50. Small Savings 4 0 4 0 0 0 0 0 0 11 0 11 51. Social Justice &
Empowerment 68 21 89 0 1 1 12 3 15 396 83 479 52. State Vigilance
Bureau 13 2 15 0 0 0 34 3 37 342 18 360 53. Haryana Staff
Selection Commission 11 1 12 0 0 0 0 0 0 65 4 69
54. Supplies and Disposal 6 1 7 0 0 0 3 0 3 41 8 49
55. Special Enquiry Agency 2 0 2 0 0 0 3 0 3 15 1 16
56. Technical Education 256 47 303 15 7 22 178 62 240 1428 359 1787 57. Tourism 17 2 19 0 0 0 0 0 0 52 10 62 58. Town and Country
Planning 104 16 120 0 0 0 5 0 5 513 76 589 59. Transport 1475 202 1677 0 0 0 2809 4 2813 17683 391 18074 60. Treasury and
Accounts 152 18 170 0 0 0 60 34 94 621 123 744 61. Urban Estates 112 21 133 0 0 0 17 0 17 210 39 249 62. Haryana Vidhan
Sabha 54 4 58 0 0 0 0 0 0 243 29 272 63. Welfare of Scheduled
Castes and Backward Classes 112 97 209 0 0 0 57 52 109 383 297 680
64. Commissioner / Deputy Commissioner 965 163 1128 0 0 0 34 7 41 5527 489 6016
65. Distt. & Sessions Judges 1487 65 1552 4 0 4 70 16 86 4007 655 4662
66. Horticulture 285 16 301 0 0 0 28 5 33 554 39 593 67. Mines and Geology 119 1 120 0 0 0 0 2 2 216 14 230 68. Electronics 3 0 3 0 0 0 0 0 0 9 1 10 69. Rural Development 7 2 9 0 0 0 1 0 1 48 16 64 70. Environment 19 1 20 0 0 0 11 3 14 65 11 76 71. Women and Child
Development 232 27 259 0 1 1 21 33787 33808 698 34688 35386 72. Renewable Energy
Sources 25 1 26 0 0 0 0 0 0 106 5 111 73. Others 133 3 136 0 0 0 5 2 7 363 12 375
Total 48178 7180 55358 61 29 90 22773 45127 67900 229607 96414 326021 Source :—Department of Economic & Statistical Analysis, Haryana.

729
MISCELLANEOUS District and Sexwise distribution of Haryana Government Employees
as on 31st March, 2010 No. 35.16
Gazetted Class I Class II
Sr. No. District
Male Female Total Male Female Total 1 2 3 4 5 6 7 8
1. Ambala 144 32 176 676 337 1,0132. Panchkula 102 33 135 329 313 6423. Yamunanagar 74 9 83 406 159 5654. Kurukshetra 136 32 168 563 200 7635. Kaithal 73 17 90 491 157 6486. Karnal 232 73 305 756 373 1,1297. Panipat 85 20 105 378 169 5478. Sonipat 137 22 159 740 324 1,0649. Rohtak 298 54 352 801 557 1,35810. Jhajjar 176 21 197 713 258 97111. Faridabad 140 36 176 284 200 48412 Palwal 32 1 33 320 71 39113. Gurgaon 139 26 165 681 483 1,16414. Mewat 46 2 48 124 15 13915. Rewari 118 17 135 699 483 83316. Mahendragarh 76 8 84 927 109 1,03617. Bhiwani 236 27 263 1,175 368 1,54318. Jind 116 8 124 682 240 92219. Hisar 220 37 257 1,121 440 1,56120. Fatehabad 106 8 114 440 151 59121. Sirsa 116 8 124 758 314 1,07222. Chandigarh and outside Haryana 634 73 707 768 169 937
Total 3,436 564 4,000 13,832 5,541 19,373

730
MISCELLANEOUS District and Sexwise distribution of Haryana Government Employees as on
31st March, 2010 No. 35.16
Non-Gazetted Class III Class IV
Adhoc
Male Female Total Male Female Total Male Female Total
Sr. No.
District
9 10 11 12 13 14 15 16 17 1. Ambala 8,019 2,411 10,430 2,874 367 3,241 9 2 112. Panchkula 3,037 1,365 4,402 1,366 157 1,523 2 8 103. Yamunanagar 4,777 1,189 5,966 1,646 173 1,819 1 — 14. Kurukshetra 5,572 2,057 7,629 1,844 209 2,053 — — —5. Kaithal 4,920 1,211 6,131 1,934 293 2,227 — — —6. Karnal 9,803 2,638 12,441 3,088 393 3,481 2 5 77. Panipat 4,547 1,198 5,745 1,625 178 1,803 — — —8. Sonipat 7,560 2,855 10,415 2,692 421 3,113 7 — 79. Rohtak 7,353 2,165 9,518 3,042 903 3,945 12 1 1310. Jhajjar 5,152 1,475 6,627 1,413 272 1,685 1 — 111. Faridabad 6,227 1,936 8,163 1,561 284 1,845 1 2 312 Palwal 2,397 368 2,765 1,010 96 1,106 3 1 413. Gurgaon 9,231 2,445 11,676 2,162 241 2,403 1 2 314. Mewat 2,777 279 3,056 831 43 874 — — —15. Rewari 5,304 1,367 6,671 1,521 180 1,701 4 — 416. Mahendragarh 5,653 662 6,315 2,087 189 2,276 1 — 117. Bhiwani 9,798 2,819 12,617 4,411 712 5,123 2 1 318. Jind 7,550 1,915 9,465 2,428 393 2821 4 1 519. Hisar 10,984 2,963 13,946 3,924 851 4,775 6 3 920. Fatehabad 4,790 1,304 6,094 1,786 262 2,048 2 1 321. Sirsa 6,698 1,877 8,575 2,455 285 2,740 3 — 322. Chandigarh and outside
Haryana 9,179 1,474 10,653 2,478 278 2,756 — 2 2Total 1,41,327 37,973 1,79,300 48,178 7,180 55,358 61 29 90

731
MISCELLANEOUS District and Sexwise distribution of Haryana Government Employees as on
31st March, 2010 No. 35.16 (Concld.)
Non-Gazetted Contingency paid
Male Female Total Sr. No.1 District
18 19 20 1. Ambala 120 1,248 1,3682. Panchkula 488 971 1,4593. Yamunanagar 500 1,809 2,3094. Kurukshetra 708 1,682 2,3905. Kaithal 385 1,838 2,2236. Karnal 111 1,939 2,0507. Panipat 272 1,451 1,7238. Sonipat 368 2,475 2,8439. Rohtak 77 1,551 1,62810. Jhajjar 484 294 77811. Faridabad 251 1,459 1,71012 Palwal 348 1,417 1,76513. Gurgaon 494 1,323 1,81714. Mewat 424 1,455 1,87915. Rewari 295 1,723 2,01816. Mahendragarh 510 1,840 2,35017. Bhiwani 1,039 3,114 4,15318. Jind 437 2,331 2,76819. Hisar 469 2,683 3,15220. Fatehabad 410 1,572 1,98221. Sirsa 154 1,845 1,99922. Chandigarh and outside Haryana 96 30 126Total 8,440 36,050 44,490

732
MISCELLANEOUS District and Sexwise distribution of Haryana Government Employees
as on 31st March, 2010 No. 35.16 (Concld.)
Non-Gazetted Work charged Contract Basis
Grand Total
Male Female Total Male Female Total Male Female Total Sr.
No.1 District
21 22 23 24 25 26 27 28 29 1. Ambala 166 126 292 1,218 921 2,139 13,226 5,444 18,6702. Panchkula — 2 2 282 189 471 5,606 3,038 8,6443 Yamunanagar 6 3 9 1,056 599 1,655 8,466 3,941 12,4074. Kurukshetra 7 1 8 300 244 544 9,130 4,425 13,5555. Kaithal 7 4 11 903 450 1,353 8,713 3,970 12,6836. Karnal 27 28 55 687 589 1,276 14,706 6,038 20,7447. Panipat 9 1 10 652 573 1,225 7,568 3,590 11,1588. Sonipat 10 4 14 436 290 726 11,950 6,391 18,3419. Rohtak 11 3 14 621 369 990 12,215 5,603 17,81810. Jhajjar 5 4 9 591 1,627 2,218 8,535 3,951 12,48611. Faridabad — — — 535 515 1,050 8,999 4,432 13,43112 Palwal 11 5 16 530 193 723 4,651 2,152 6,80313. Gurgaon 40 25 65 557 147 704 13,305 4,692 17,99714. Mewat 3 — 3 604 109 713 4,809 1,903 6,71215. Rewari — — — 388 44 432 8,329 3,465 11,79416. Mahendragarh 2 — 2 470 113 583 9,726 2,921 12,64717. Bhiwani 16 1 17 755 331 1,086 17,432 7,373 24,80518. Jind 4 — 4 789 354 1,143 12,010 5,242 17,25219. Hisar 14 7 21 502 170 672 17,239 7,154 24,39320. Fatehabad 26 — 26 916 563 1,479 8,476 3,861 12,33721. Sirsa 6 2 8 661 363 1,024 10,851 4,694 15,54522. Chandigarh
and outside Haryana 7 — 7 503 108 611 13,665 2,134 15,799
Total 377 216 593 13,956 8,861 22,817 2,29,607 96,414 3,26,021 Source :—Department of Economic & Statistical Analysis, Haryana.

733
MISCELLANEOUS Wage Bill and Monthly Wage per employee of Haryana Government Employees**
No. 35.17
Estimated Annual Expenditure (` in crores) Monthly wage per employee
(In `) Year Basic Pay Dearness
Allowance Interim Relief
Total Wage Bill (2+3+4)
For Gazetted Staff
For Non- Gazetted
Staff 1 2 3 4 5 6 7
1967-68 17.50 9.19 — 26.69 742 2201970-71 22.40 13.31 — 35.71 754 2461975-76 33.97 43.22* — 77.19 1,062 3871980-81 130.85 23.06 — 153.91 1,441 6221985-86 171.71 145.96 — 317.67 2,262 1,0551987-88 392.71 51.00 — 443.71 3,146 1,3791988-89 395.35 91.68 — 487.03 3,557 1,5831989-90 413.73 139.05 — 552.78 3,978 1,7441990-91 426.92 185.96 — 612.88 4,321 1,9101991-92 439.37 264.45 — 703.82 4,890 2,1841992-93 457.32 374.09 — 831.41 5,575 2,4991993-94 466.40 451.56 17.34 935.30 6,133 2,7571994-95 477.68 542.05 32.05 1,051.78 6,691 3,1101995-96 496.03 668.69 122.03 1,286.75 7,801 3,7111996-97 509.38 800.16 135.53 1,445.07 8,571 4,0501997-98 1,662.53 207.85 — 1,870.38 11,323 5,3031998-99 1,683.26 387.15 — 2,070.41 12,636 5,8041999-00 1,713.88 617.04 — 2,330.92 14,216 6,5062000-01 1,731.30 705.56 — 2,436.86 15,027 6,8532001-02 1,739.64 791.61 — 2,531.25 15,752 7,2042002-03 1,728.22 898.71 — 2,626.93 16,535 7,5862003-04 2606.94@ 364.97 — 2,971.91 18,934 8,5622004-05 2676.50@ 555.38 — 3,231.88 19,058 9,1462005-06 2666.58@ 553.32 — 3,219.90 19,225 9,2072006-07 2688.47@ 786.37 — 3,474.84 20,839 9,9812007-08 2858.00@ 1,171.86 — 4,030.07 22,970 11,5422008-09 4,454.61 735.01 — 5,189.62 30,053 15,3582009-10 4,648.34 1,289.91 — 5,938.25 31,435 15,829
Source :—Economic & Statistical Analysis Department, Haryana. * Includes Ad-hoc Relief and Additional Dearness Allowance. ** Excluding Contingency Paid and contract Basis Employees. Note :—Wage Bill does not include House Rent Allowance and Medical Allowance.

734
MISCELLANEOUS Estimated Expenditure on Basic Pay of Haryana Government Employees
during the year 2009-10 No. 35.18
Basic Pay Range(In `)
Total employees (excluding contin-
gency Paid and contract Basis)
Mid Value@ of the Basic Pay
Monthly Basic Pay(`)
Annual Ex-penditure on Basic Pay (`)
Percentage of Total
Expenditure
1 2 3 4 5 6 Upto 6050 2,129 5,275 1,12,30,475 13,47,65,700 0.296051 to 6600 2,954 6,326 1,86,85,527 22,42,26,324 0.486601 to 7700 12,433 7,151 8,89,02,167 1,06,68,25,998 2.307701 to 8000 11,825 7,851 9,28,32,163 1,11,39,85,950 2.408001 to 11500 67,893 9,751 66,19,90,697 7,94,38,88,358 17.0911501 to 14000 34,968 12,751 44,58,59,484 5,35,03,13,808 11.5114001 to 16500 38,736 15,251 59,07,43,368 7,08,89,20,416 15.2516501 to 20500 40,759 18,501 75,40,61,880 9,04,87,42,554 19.4720501 to 22500 19,849 21,501 42,67,63,425 5,12,11,61,094 11.0222501 to 26000 14,893 24,251 36,11,62,697 4,33,39,52,358 9.3226001 to 30000 6,521 28,001 18,25,91,261 2,19,10,95,126 4.7130001 to 33500 1,971 31,751 6,25,80,236 75,09,62,826 1.6233501 to 40000 1,293 36,751 4,75,18,397 57,02,20,758 1.2340001 to 46100 546 43,051 2,35,05,573 28,20,66,876 0.6146101 to 47000 169 46,551 78,67,035 9,44,04,414 0.2047001 to 47500 196 47,251 92,61,098 11,11,33,176 0.2447501 to 54000 673 50,751 3,41,55,087 40,98,61,038 0.8854001 and Above 906 59,501 5,39,07,453 64,68,89,436 0.39
Total 2,58,714 — 3,87,36,18,018 46,48,34,16,210 100.00Source :—Department of Economic & Statistical Analysis, Haryana.
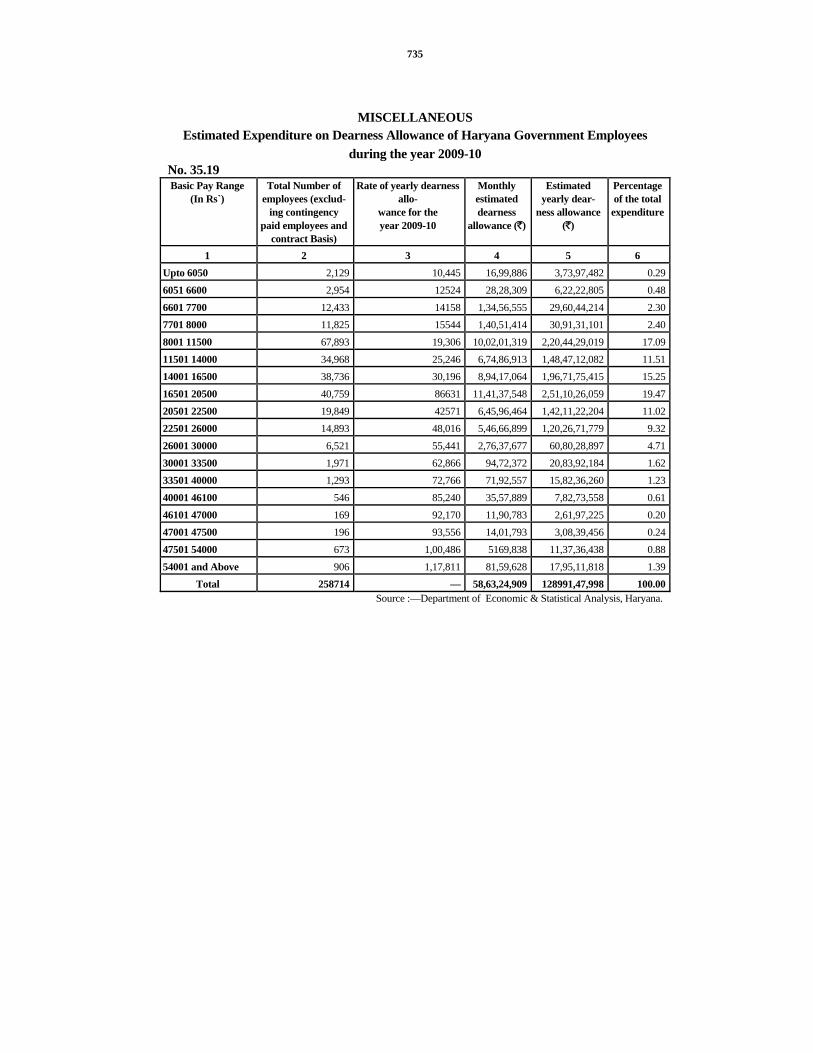
735
MISCELLANEOUS Estimated Expenditure on Dearness Allowance of Haryana Government Employees
during the year 2009-10 No. 35.19 Basic Pay Range
(In Rs`) Total Number of
employees (exclud- ing contingency
paid employees and contract Basis)
Rate of yearly dearnessallo-
wance for the year 2009-10
Monthly estimated dearness
allowance (`)
Estimated yearly dear-
ness allowance (`)
Percentage of the total
expenditure
1 2 3 4 5 6 Upto 6050 2,129 10,445 16,99,886 3,73,97,482 0.296051 6600 2,954 12524 28,28,309 6,22,22,805 0.486601 7700 12,433 14158 1,34,56,555 29,60,44,214 2.307701 8000 11,825 15544 1,40,51,414 30,91,31,101 2.408001 11500 67,893 19,306 10,02,01,319 2,20,44,29,019 17.0911501 14000 34,968 25,246 6,74,86,913 1,48,47,12,082 11.5114001 16500 38,736 30,196 8,94,17,064 1,96,71,75,415 15.2516501 20500 40,759 86631 11,41,37,548 2,51,10,26,059 19.4720501 22500 19,849 42571 6,45,96,464 1,42,11,22,204 11.0222501 26000 14,893 48,016 5,46,66,899 1,20,26,71,779 9.3226001 30000 6,521 55,441 2,76,37,677 60,80,28,897 4.7130001 33500 1,971 62,866 94,72,372 20,83,92,184 1.6233501 40000 1,293 72,766 71,92,557 15,82,36,260 1.2340001 46100 546 85,240 35,57,889 7,82,73,558 0.6146101 47000 169 92,170 11,90,783 2,61,97,225 0.2047001 47500 196 93,556 14,01,793 3,08,39,456 0.2447501 54000 673 1,00,486 5169,838 11,37,36,438 0.8854001 and Above 906 1,17,811 81,59,628 17,95,11,818 1.39
Total 258714 — 58,63,24,909 128991,47,998 100.00Source :—Department of Economic & Statistical Analysis, Haryana.
736
Number of Seats in Technical Institutes in Haryana

737
MISCELLANEOUS Number of Seats in Technical Institutions in Haryana
No. 35.20 1966-67 1967-68 1970-71 1975-76
Name of Institution Diploma Diploma Diploma Diploma
1 2 3 4 5 National Institute of Technology, Kurukshetra 250 250 250 250Chhotu Ram State College of Engineering Murthal (Sonipat)
— — — —
Government Polytechnic, Ambala City 300 300 240 240Government Polytechnic, Jhajjar 180 180 120 120Haryana Polytechnic Nilokheri, Karnal 300 300 240 240C.R.Polytechnic , Rohtak 120 120 90 120Government Polytechnic, Sirsa 180 180 120 120Kalpana Chawla Govt. Polytechnic for Women, Ambala City
— — 60 90
Y.M.C.A. Institute of Engineering Faridabad — — 120 120Vaish Technical Institute, Rohtak 60 60 60 120Government Polytechnic, Sonipat — — — —Jind Institute of Technology, Jind — — — —Hindu College of Pharmacy, Sonipat — — — —Gandhi College of Pharmacy, Karnal — — — —Lord Shiva College of Pharmacy, Sirsa — — — —Bhagat Phul Singh College of Education, Khanpur Kalan (Sonipat)
— — — —
Anupama College of Engineering, Gurgaon — — — —Govt. Polytechnic for Women, Sirsa — — — —Government Institute of Management and Pharmacy Adampur (Hisar)
— — — —
Seth Jai Parkash Polytechnic, Damla (Yamunanagar)
— — — —

738
MISCELLANEOUS Number of Seats in Technical Institutions in Haryana
No. 35.20 (Contd.) 1980-81 1985-86 1990-91 1995-96 2000-01 2005-06 2006-07 Diploma Diploma Diploma Diploma Diploma Diploma Diploma Name of Institution
6 7 8 9 10 11 12 National Institute of Technology, Kurukshetra
300 268 456 456 327 555 555
Chhotu Ram State College of Engineering Murthal (Sonipat)
— — 165 240 240 400 473
Government Polytechnic, Ambala City
330 330 330 320 386 486 555
Government Polytechnic, Jhajjar 135 135 195 225 308 462 420Haryana Polytechnic Nilokheri, Karnal
300 300 330 345 402 462 480
C.R.Polytechnic , Rohtak 120 120 120 180 264 330 300Government Polytechnic, Sirsa 140 155 155 170 176 399 340Kalpana Chawla Govt. Polytechnic for Women, Ambala City
90 90 90 180 250 375 345
Y.M.C.A. Institute of Engineering Faridabad
120 145 120 150 180 420 513
Vaish Technical Institute, Rohtak 120 180 300 300 418 451 420Government Polytechnic, Sonipat 60 60 120 150 220 330 390Jind Institute of Technology, Jind — — — — 340 540 582Hindu College of Pharmacy, Sonipat 120 120 120 100 120 120 120Gandhi College of Pharmacy, Karnal — 120 — 120 186 186 180Lord Shiva College of Pharmacy, Sirsa
— 60 60 60 126 192 180
Bhagat Phul Singh College of Education, Khanpur Kalan (Sonipat)
— 60 100 130 172 395 340
Anupama College of Engineering, Gurgaon
— — — — 140 165 177
Govt. Polytechnic for Women, Sirsa — 30 30 135 209 286 260Government Institute of Management and Pharmacy Adampur (Hisar)
— 30 60 150 239 309 285
Seth Jai Parkash Polytechnic, Damla (Yamunanagar)
— — 110 170 253 462 420

739
MISCELLANEOUS Number of Seats in Technical Institutions in Haryana
No. 35.20 (Contd.) 1966-67 1967-68 1970-71 1975-76
Name of Institution Diploma Diploma Diploma Diploma
1 2 3 4 5 Government Polytechnic , Uttawar, (Faridabad) — — — —Government Polytechnic, Hisar — — — —BRCM College of Engineering & Technology Behal, Bhiwani — — — —Technological Institute of Textile and Science, Bhiwani (Degree) — — — —Govt. Polytechnic, Narnaul — — — —Govt. Polytechnic, Manesar — — — —Dehat Vikas College of Pharmacy Tigaon (Faridabad) — — — —Hindu College of Engineering, Sonipat — — — —Hindu Institute of Technology, Sonipat — — — —Government Polytechnic for Women, Faridabad. — — — —M. M. EVgineering College, Mulana (Ambala) (Degree) — — — —S. J. P. Mukand Lal Institute of Engineering & Technology, Radaur (Degree)
— — — —
Vaish College of Engineering, Rohtak (Degree) — — — —B. D. S. Medical College, Rohtak — — — —Hotel Management Cattering & Nutrition Institute, Panipat — — — —P.D. Mamorial Polytechnic Institute, Aurangabad, Bahadurgarh (Rohtak)
— — — —

740
MISCELLANEOUS Number of Seats in Technical Institutions in Haryana
No. 35.20 (Contd.) 1980-81 1985-86 1990-91 1995-96 2000-01 2005-06 2006-07 Diploma Diploma Diploma Diploma Diploma Diploma Diploma Name of Institution
6 7 8 9 10 11 12 Government Polytechnic , Uttawar, (Faridabad)
— — — 75 103 287 265
Government Polytechnic, Hisar — — — 60 220 465 460BRCM College of Engineering & Technology Behal, Bhiwani
— — — — 190 300 360
Technological Institute of Textile and Science, Bhiwani (Degree)
— — — 130 160 360 410
Govt. Polytechnic, Narnaul — — — 90 132 286 320Govt. Polytechnic, Manesar — — — 60 44 220 200Dehat Vikas College of Pharmacy Tigaon (Faridabad)
— — — 60 60 60 60
Hindu College of Engineering, Sonipat
— — — — 210 210 231
Hindu Institute of Technology, Sonipat
— — — 160 253 363 420
Government Polytechnic for Women, Faridabad.
— — — 120 176 264 240
M. M. EVgineering College, Mulana (Ambala) (Degree)
— — — 180 480 540 594
S. J. P. Mukand Lal Institute of Engineering & Technology, Radaur (Degree)
— — — 180 430 510 750
Vaish College of Engineering, Rohtak (Degree)
— — — 60 180 360 600
B. D. S. Medical College, Rohtak — — — — 70 60 60Hotel Management Cattering & Nutrition Institute, Panipat
— — — — 44 44 40
P.D. Mamorial Polytechnic Institute, Aurangabad, Bahadurgarh (Rohtak)
— — — — 231 462 420

741
MISCELLANEOUS Number of Seats in Technical Institutions in Haryana
No. 35.20 (Contd.) 1966-67 1967-68 1970-71 1975-76
Name of Institution Diploma Diploma Diploma Diploma
1 2 3 4 5 B.M. Institute of Technology, Sonipat — — — — Ch. Charan Singh Haryana Agricultural University, Hisar
— — — —
Career Institute of Technology and Management, Faridabad
— — — —
Apeejay College of Engineering, Sohna — — — —Al-Falah School of Engineering and Technology, Dhounj (Faridabad)
— — — —
Institute of Technology & Management, Gurgaon — — — —Shri Krishna Institute of Engineering & Technology, Kurukshetra
— — — —
Shri Baba Mast Nath College of Engineering Asthal Bohar, Rohtak
— — — —
Lingya Institute of Engineering & Technology, Faridabad
— — — —
Dronacharya College of Engineering, Farukh Nagar (Gurgaon)
— — — —
Haryana College of Technology & Management, Kaithal
— — — —
Haryana Engineering College, Jagadhri (Yamunanagar)
— — — —
N.C. College of Engineering, Israna (Panipat) — — — —Technology Institute Bhanswal Kalan, Sonipat — — — —P.D. Memorial College of Engineering, Sarai Aurangabad
— — — —

742
MISCELLANEOUS Number of Seats in Technical Institutions in Haryana
No. 35.20 (Contd.) 1980-81 1985-86 1990-91 1995-96 2000-01 2005-06 2006-07 Diploma Diploma Diploma Diploma Diploma Diploma Diploma Name of Institution
6 7 8 9 10 11 12 B.M. Institute of Technology, Sonipat — — — — 220 360 396Ch. Charan Singh Haryana Agricultural University, Hisar
— — — — 25 67 71
Career Institute of Technology and Management, Faridabad
— — — — 280 540 630
Apeejay College of Engineering, Sohna
— — — — 270 420 462
Al-Falah School of Engineering and Technology, Dhounj (Faridabad)
— — — — 180 300 462
Institute of Technology & Management, Gurgaon
— — — — 310 340 561
Shri Krishna Institute of Engineering & Technology, Kurukshetra
— — — — 300 300 330
Shri Baba Mast Nath College of Engineering Asthal Bohar, Rohtak
— — — — 180 180 318
Lingya Institute of Engineering & Technology, Faridabad
— — — — 340 720 792
Dronacharya College of Engineering, Farukh Nagar (Gurgaon)
— — — — 270 330 429
Haryana College of Technology & Management, Kaithal
— — — — 340 420 462
Haryana Engineering College, Jagadhri (Yamunanagar)
— — — — 330 420 462
N.C. College of Engineering, Israna (Panipat)
— — — — 370 450 531
Technology Institute Bhanswal Kalan, Sonipat
— — — — 66 242 180
P.D. Memorial College of Engineering, Sarai Aurangabad
— — — — 260 600 642
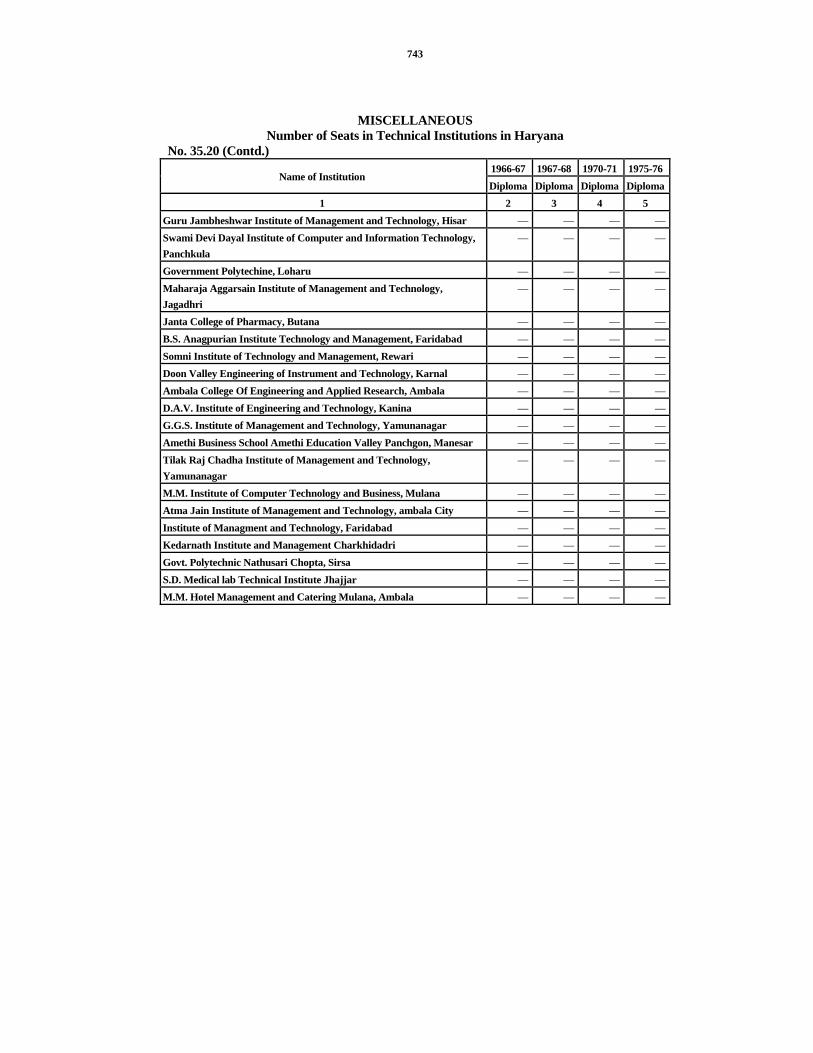
743
MISCELLANEOUS Number of Seats in Technical Institutions in Haryana
No. 35.20 (Contd.) 1966-67 1967-68 1970-71 1975-76
Name of Institution Diploma Diploma Diploma Diploma
1 2 3 4 5 Guru Jambheshwar Institute of Management and Technology, Hisar — — — —Swami Devi Dayal Institute of Computer and Information Technology, Panchkula
— — — —
Government Polytechine, Loharu — — — —Maharaja Aggarsain Institute of Management and Technology, Jagadhri
— — — —
Janta College of Pharmacy, Butana — — — —B.S. Anagpurian Institute Technology and Management, Faridabad — — — —Somni Institute of Technology and Management, Rewari — — — —Doon Valley Engineering of Instrument and Technology, Karnal — — — —Ambala College Of Engineering and Applied Research, Ambala — — — —D.A.V. Institute of Engineering and Technology, Kanina — — — —G.G.S. Institute of Management and Technology, Yamunanagar — — — —Amethi Business School Amethi Education Valley Panchgon, Manesar — — — —Tilak Raj Chadha Institute of Management and Technology, Yamunanagar
— — — —
M.M. Institute of Computer Technology and Business, Mulana — — — —Atma Jain Institute of Management and Technology, ambala City — — — —Institute of Managment and Technology, Faridabad — — — —Kedarnath Institute and Management Charkhidadri — — — —Govt. Polytechnic Nathusari Chopta, Sirsa — — — —S.D. Medical lab Technical Institute Jhajjar — — — —M.M. Hotel Management and Catering Mulana, Ambala — — — —
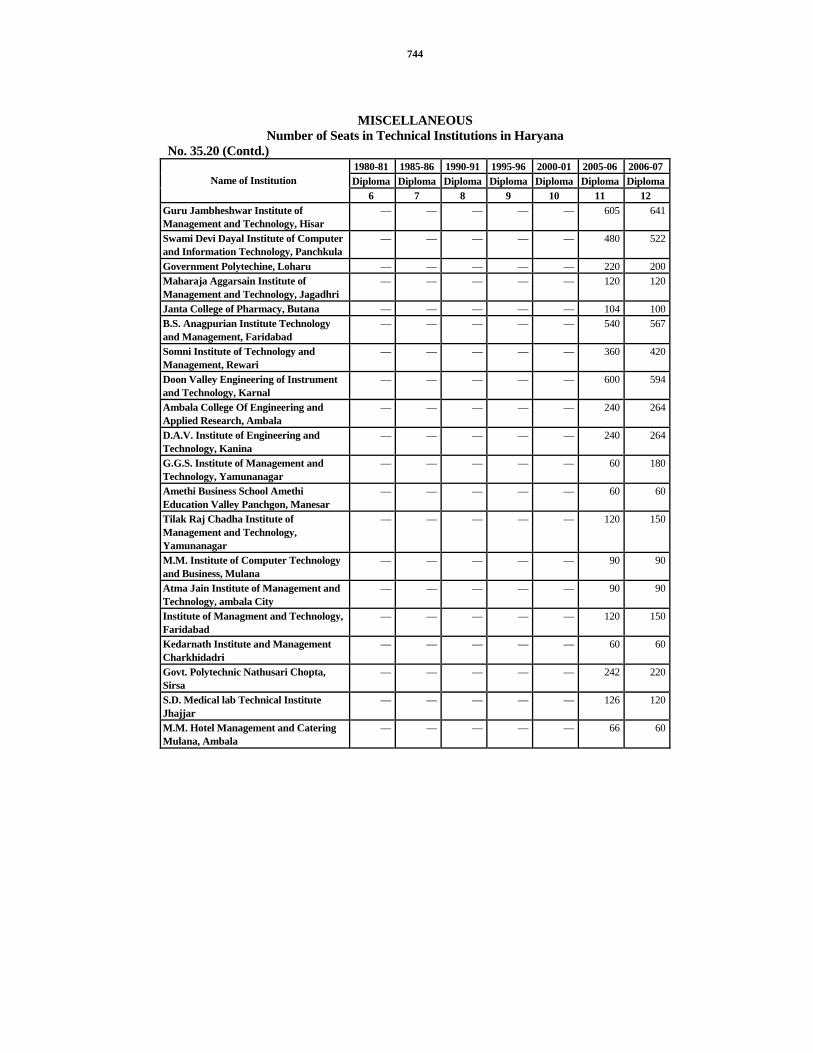
744
MISCELLANEOUS Number of Seats in Technical Institutions in Haryana
No. 35.20 (Contd.) 1980-81 1985-86 1990-91 1995-96 2000-01 2005-06 2006-07 Diploma Diploma Diploma Diploma Diploma Diploma DiplomaName of Institution
6 7 8 9 10 11 12 Guru Jambheshwar Institute of Management and Technology, Hisar
— — — — — 605 641
Swami Devi Dayal Institute of Computer and Information Technology, Panchkula
— — — — — 480 522
Government Polytechine, Loharu — — — — — 220 200Maharaja Aggarsain Institute of Management and Technology, Jagadhri
— — — — — 120 120
Janta College of Pharmacy, Butana — — — — — 104 100B.S. Anagpurian Institute Technology and Management, Faridabad
— — — — — 540 567
Somni Institute of Technology and Management, Rewari
— — — — — 360 420
Doon Valley Engineering of Instrument and Technology, Karnal
— — — — — 600 594
Ambala College Of Engineering and Applied Research, Ambala
— — — — — 240 264
D.A.V. Institute of Engineering and Technology, Kanina
— — — — — 240 264
G.G.S. Institute of Management and Technology, Yamunanagar
— — — — — 60 180
Amethi Business School Amethi Education Valley Panchgon, Manesar
— — — — — 60 60
Tilak Raj Chadha Institute of Management and Technology, Yamunanagar
— — — — — 120 150
M.M. Institute of Computer Technology and Business, Mulana
— — — — — 90 90
Atma Jain Institute of Management and Technology, ambala City
— — — — — 90 90
Institute of Managment and Technology, Faridabad
— — — — — 120 150
Kedarnath Institute and Management Charkhidadri
— — — — — 60 60
Govt. Polytechnic Nathusari Chopta, Sirsa
— — — — — 242 220
S.D. Medical lab Technical Institute Jhajjar
— — — — — 126 120
M.M. Hotel Management and Catering Mulana, Ambala
— — — — — 66 60

745
MISCELLANEOUS Number of Seats in Technical Institutions in Haryana
No. 35.20 (Contd.) 1966-67 1967-68 1970-71 1975-76 Name of Institution Diploma Diploma Diploma Diploma
1 2 3 4 5 Doronacharya Institute of Management & Technology, Kurukshetra
— — — —
Bhiwani Institute of Technology & Science Bhiwani
— — — —
Jan Nayak Ch. Devi Lal Memorial College of Engg., Sirsa
— — — —
Devi Lal Memorial Engg. College, Panniwala Mota (Sirsa)
— — — —
Management Studies, Faridabad — — — —MR DAV Institute of Management Studies, Rohtak
— — — —
Hindu Institute of Management, Sonipat — — — —JVM GGR Institute of Computer Application Charkhi Dadri, Bhiwani
— — — —
GVM Girl College, Sonipat — — — —Satnam Ji Institute of Management & Technology, Sirsa
— — — —
N.C. Institute of Computer Sciences Israna, Panipat
— — — —
Haryana Institute of Management & Technology Jagadhri, Yamunanagar
— — — —
M.M. Institute Management & Technology, Fatehabad
— — — —
Swami Devi Dayal Institute of Computer Sciences, Barwala, Pkl.
— — — —
Kamra Institute of Information & Technology, Bhondsi (Gurgaon)
— — — —
Shri Baba Mast Nath Institute of Management, Studied & Research Asthal Bohar, Rohtak
— — — —
National Institute of Finance Management, Faridabad
— — — —
National Power Training Institute, Faridabad — — — —M.M. College of Pharmacy, Mullana (Ambala) Shri Baba Mast Nath Institute of Pharmaceutical
— — — —
Sciences & Research, Asthal Boharm, Rohtak — — — —Rajendra Institute of Technology & Sciences, Sirsa
— — — —
B.S. Anangpuria Institute of Pharmacy, — — — —Jan Nayak Ch. Devi Lal Memorail Diploma Pharmacy, Sirsa
— — — —

746
MISCELLANEOUS Number of Seats in Technical Institutions in Haryana
No. 35.20 (Contd.) 1980-81 1985-86 1990-91 1995-96 2000-01 2005-06 2006-07 Diploma Diploma Diploma Diploma Diploma Diploma Diploma Name of Institution
6 7 8 9 10 11 12 Doronacharya Institute of Management & Technology, Kurukshetra
— — — — — 120 120
Bhiwani Institute of Technology & Science Bhiwani
— — — — — 360 373
Jan Nayak Ch. Devi Lal Memorial College of Engg., Sirsa
— — — — — 350 330
Devi Lal Memorial Engg. College, Panniwala Mota (Sirsa)
— — — — — 390 420
Management Studies, Faridabad — — — — — 120 120 MR DAV Institute of Management Studies, Rohtak — — — — — 120 180 Hindu Institute of Management, Sonipat — — — — — 100 100 JVM GGR Institute of Computer Application Charkhi Dadri, Bhiwani
— — — — — 60 30
GVM Girl College, Sonipat — — — — — 120 105 Satnam Ji Institute of Management & Technology, Sirsa
— — — — — 60 60
N.C. Institute of Computer Sciences Israna, Panipat
— — — — — 120 120
Haryana Institute of Management & Technology Jagadhri, Yamunanagar
— — — — — 60 60
M.M. Institute Management & Technology, Fatehabad
— — — — — 60 60
Swami Devi Dayal Institute of Computer Sciences, Barwala, Pkl.
— — — — — 60 60
Kamra Institute of Information & Technology, Bhondsi (Gurgaon)
— — — — — 60 300
Shri Baba Mast Nath Institute of Management, Studied & Research Asthal Bohar, Rohtak
— — — — — 60 60
National Institute of Finance Management, Faridabad
— — — — — 60 60
National Power Training Institute, Faridabad — — — — — 60 60 M.M. College of Pharmacy, Mullana (Ambala) Shri Baba Mast Nath Institute of Pharmaceutical
— — — — — 60 60
Sciences & Research, Asthal Boharm, Rohtak — — — — — 60 60 Rajendra Institute of Technology & Sciences, Sirsa
— — — — — 60 60
B.S. Anangpuria Institute of Pharmacy, — — — — — 60 180 Jan Nayak Ch. Devi Lal Memorail Diploma Pharmacy, Sirsa
— — — — — 60 60

747
MISCELLANEOUS Number of Seats in Technical Institutions in Haryana
No. 35.20 (Concld.) 1966-67 1967-68 1970-71 1975-76
Name of Institution Diploma Diploma Diploma Diploma
1 2 3 4 5 Lord Shiva College of Pharmacy, Sirsa — — — —
B.P. College of Engg., Bali Barahamanan, Gohana — — — —
Manav Rachana College of Engg., Faridabad — — — —
M. Institute of Management , Mulana — — — —
Gurgaon Institute of Technology & Management, Gurgaon — — — —
Jan Nayak Ch. Devi Lal Memorial Polytechnic, Sirsa — — — —
S.D.D. Institute of Pharmacy, Barwala — — — —
Yashvir Memorial Technical Institute, Bhanbheri, Jind. — — — —
Bharat Institute of Pharmacy Babain, Kurukshetra — — — —
M.D. University, Rohtak — — — —
Kurukshetra University, Kurukshetra — — — —
Gurgaon Institute & Technology Mgt. Gurgaon — — — —
Gold Field Instt. of Tech Mgt. Chhaissa, Ballabgarh — — — —
Ram Gopal College of Pharmacy Village Sultanpur, Gurgaon — — — —
RKSD College of Pharmacy, Kaithal — — — —
BITS College of Pharmacy, Village Sarai Ghogri, Babain Kurukshetra
— — — —
Krishna Edu. Trust Kurukshetra — — — —
Seth Harbaksh Lohiya Jai Ram Mahila Poly. Kurukshetra — — — —
PDM Insititute of Engineering Karsindhu Safidon, Jind — — — —
College of Pharmacy Mullana, Ambala — — — —
Nayak Ch, Devi Lal Diploma College of Pharmacy, Sirsa — — — —
Hindu College of Pharmacy Sonipat — — — —
Janta Poly. Buttana — — — —

748
MISCELLANEOUS Number of Seats in Technical Institutions in Haryana
No. 35.20 (Concld.) 1975-76 1980-81 1985-86 1990-91 1995-96 2000-01 2005-06 2006-07 Diploma Diploma Diploma Diploma Diploma Diploma Diploma Diploma Name of Institution
5 6 7 8 9 10 11 12 Lord Shiva College of Pharmacy, Sirsa — — — — — — 60 60 B.P. College of Engg., Bali Barahamanan, Gohana
— — — — — — 240 264
Manav Rachana College of Engg., Faridabad
— — — — — — 240 516
M. Institute of Management , Mulana — — — — — — 120 120 Gurgaon Institute of Technology & Management, Gurgaon
— — — — — — 240 450
Jan Nayak Ch. Devi Lal Memorial Polytechnic, Sirsa
— — — — — — 264 240
S.D.D. Institute of Pharmacy, Barwala — — — — — — 60 60 Yashvir Memorial Technical Institute, Bhanbheri, Jind.
— — — — — — 88 160
Bharat Institute of Pharmacy Babain, Kurukshetra
— — — — — — 60 60
M.D. University, Rohtak — — — — — — 395 419 Kurukshetra University, Kurukshetra — — — — — — 320 380 Gurgaon Institute & Technology Mgt. Gurgaon
— — — — — — 240 —
Gold Field Instt. of Tech Mgt. Chhaissa, Ballabgarh
— — — — — — 240 260
Ram Gopal College of Pharmacy Village Sultanpur, Gurgaon
— — — — — — 60 60
RKSD College of Pharmacy, Kaithal — — — — — — 40 60 BITS College of Pharmacy, Village Sarai Ghogri, Babain Kurukshetra
— — — — — — 240 300
Krishna Edu. Trust Kurukshetra — — — — — — 240 240 Seth Harbaksh Lohiya Jai Ram Mahila Poly. Kurukshetra
— — — — — — 240 240
PDM Insititute of Engineering Karsindhu Safidon, Jind
— — — — — — 240 360
College of Pharmacy Mullana, Ambala — — — — — — 240 — Nayak Ch, Devi Lal Diploma College of Pharmacy, Sirsa
— — — — — — 60 —
Hindu College of Pharmacy Sonipat — — — — — — 60 60 Janta Poly. Buttana — — — — — — 132 240
Source :— Director, Technical Education, Haryana.
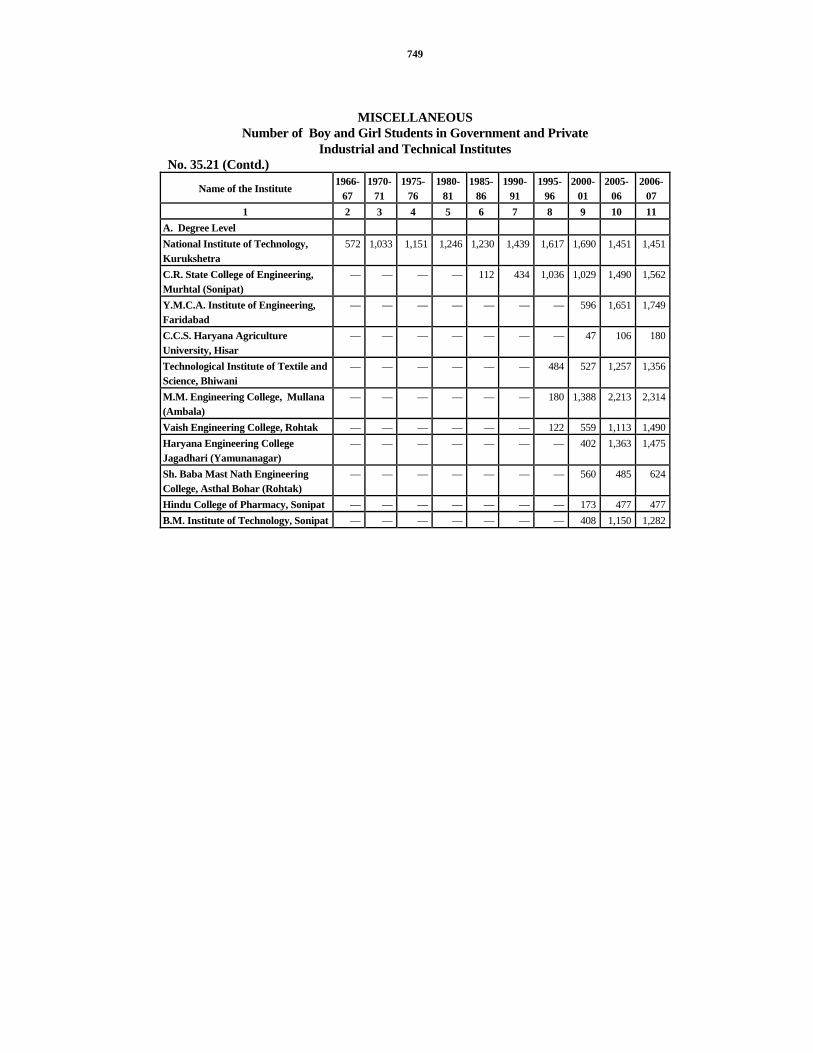
749
MISCELLANEOUS Number of Boy and Girl Students in Government and Private
Industrial and Technical Institutes No. 35.21 (Contd.)
Name of the Institute 1966-
67 1970-
71 1975-
76 1980-
81 1985-
86 1990-
91 1995-
96 2000-
01 2005-
06 2006-
07 1 2 3 4 5 6 7 8 9 10 11
A. Degree Level National Institute of Technology, Kurukshetra
572 1,033 1,151 1,246 1,230 1,439 1,617 1,690 1,451 1,451
C.R. State College of Engineering, Murhtal (Sonipat)
— — — — 112 434 1,036 1,029 1,490 1,562
Y.M.C.A. Institute of Engineering, Faridabad
— — — — — — — 596 1,651 1,749
C.C.S. Haryana Agriculture University, Hisar
— — — — — — — 47 106 180
Technological Institute of Textile and Science, Bhiwani
— — –– –– –– –– 484 527 1,257 1,356
M.M. Engineering College, Mullana (Ambala)
— — — — — — 180 1,388 2,213 2,314
Vaish Engineering College, Rohtak — — — — — — 122 559 1,113 1,490Haryana Engineering College Jagadhari (Yamunanagar)
— — — — — — — 402 1,363 1,475
Sh. Baba Mast Nath Engineering College, Asthal Bohar (Rohtak)
— — — — — — — 560 485 624
Hindu College of Pharmacy, Sonipat — — — — — — — 173 477 477B.M. Institute of Technology, Sonipat — — — — — — — 408 1,150 1,282

750
MISCELLANEOUS Number of Boy and Girl Students in Government and Private
Industrial and Technical Institutes No. 35.21 (Contd.)
Name of the Institute 1966-
67 1970-
71 1975-
76 1980-
81 1985-
86 1990-
91 1995-
96 2000-
01 2005-
06 2006-
07 1 2 3 4 5 6 7 8 9 10 11
Haryana College of Technology & Management, Kaithal
— — — — — — — 399 1,513 1,609
Jind Institute of Engineering Technology, Jind
— — — — — — — 744 1,210 1,473
N.C. College of Engineering, Israna (Panipat)
— — — — — — — 663 1,966 2,429
P.D. Memorial Engineering College Sarai, Aurangabad (Bahadurgarh)
— — — — — — — 415 1,504 1,521
Institute of Technology and Management, HUDA (Gurgaon)
— — — — — — — 520 1,340 1,500
A.P.J. College of Engineering, Sohna
— — — — — — — 755 1,560 1,560
Dronacharya College of Engineering, Gurgaon
— — — — — — — 360 1,329 1,452
RKSD College of Pharmacy, Kaithal
— — — — — — — — 126 191
Carrier Institute of Technology & Management, Faridabad
— — — — — — — 840 1,501 1,894
Lingaya Institute of Management and Technology, Faridabad
— — — — — — — 608 2,037 2,244
Anupma Engineering College, Gurgaon
— — — — — — — 360 29 78

751
MISCELLANEOUS Number of Boy and Girl Students in Government and Private
Industrial and Technical Institutes No. 35.21 (Contd.)
Name of the Institute 1966-
71 1970-
71 1975-
76 1980-
81 1985-
86 1990-
91 1995-
96 2000-
01 2005-
06 2006-
07 1 2 3 4 5 6 7 8 9 10 11
B.R.C.M. College of Engineering & Technology Behal Bhiwani
— — — — — — — 119 938 1042
Seth Jai Parkash Mukand Lal Institute of Engineering & Technology, Radaur (Yamunanagar)
— — — — — — — 1,241 1,974 1,974
Shri Krishan Institute of Engineering & Technology, Kurukshetra
— — — — — — — 485 1,104 1,143
Al-Flah School of Engineering, Dhounj (Faridabad)
— — — — — — — 475 936 920
M.M. Institute of Computer Technology & Business Management, Mulana
— — — — — — — 40 261 291
Haryana Hindu Engineering College, Sonipat
— — — — — — — — 772 820
B. Diploma Level Govt. Polytechnic, Ambala City 855 370 672 763 955 824 930 839 1,134 1,377Govt. Polytechnic, Jhajjar 381 158 339 376 381 429 648 716 1,077 1,271Haryana Polytechnic, Nilokheri (Karnal)
796 379 657 833 861 855 886 958 1,287 1,444
Govt. Polytechnic, Sirsa 392 186 336 381 392 442 438 471 976 1,396Govt. Institute of Engineering, Sonipat 81 88 138 212 170 390 505 484 790 1,021
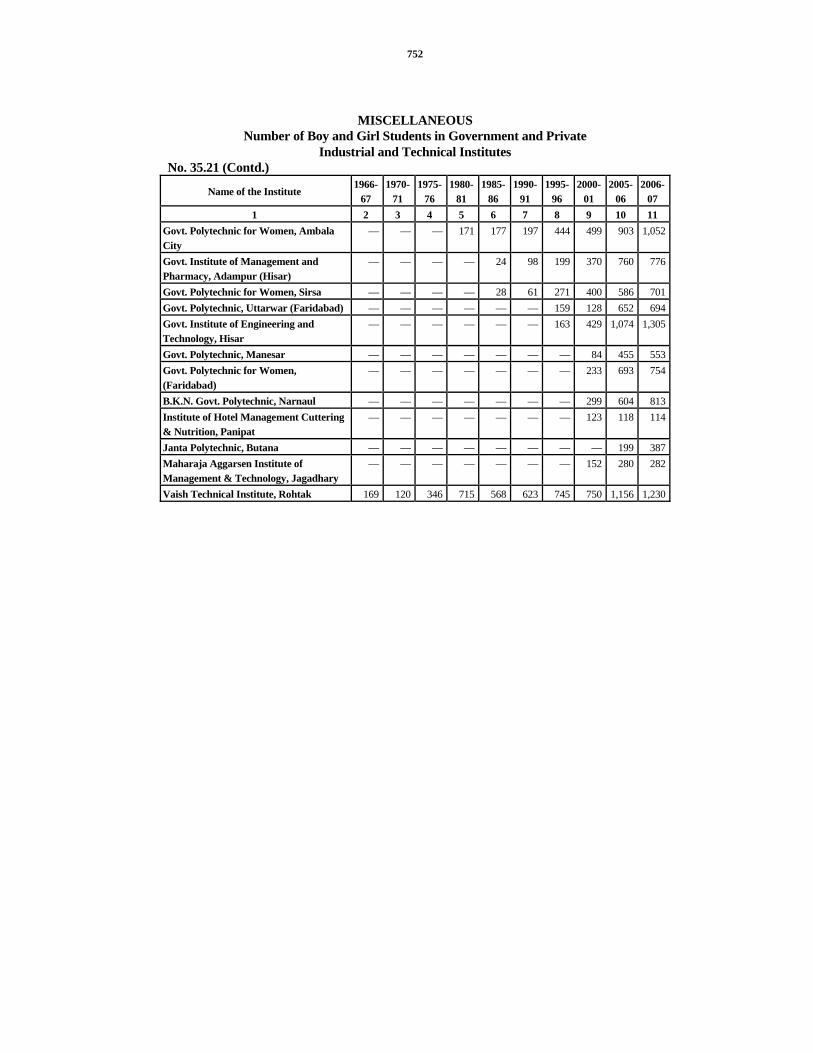
752
MISCELLANEOUS Number of Boy and Girl Students in Government and Private
Industrial and Technical Institutes No. 35.21 (Contd.)
Name of the Institute 1966-
67 1970-
71 1975-
76 1980-
81 1985-
86 1990-
91 1995-
96 2000-
01 2005-
06 2006-
07 1 2 3 4 5 6 7 8 9 10 11
Govt. Polytechnic for Women, Ambala City
— — — 171 177 197 444 499 903 1,052
Govt. Institute of Management and Pharmacy, Adampur (Hisar)
— — — — 24 98 199 370 760 776
Govt. Polytechnic for Women, Sirsa — — — — 28 61 271 400 586 701Govt. Polytechnic, Uttarwar (Faridabad) — — — — — — 159 128 652 694Govt. Institute of Engineering and Technology, Hisar
— — — — — — 163 429 1,074 1,305
Govt. Polytechnic, Manesar — — — — — — — 84 455 553Govt. Polytechnic for Women, (Faridabad)
— — — — — — — 233 693 754
B.K.N. Govt. Polytechnic, Narnaul — — — — — — — 299 604 813Institute of Hotel Management Cuttering & Nutrition, Panipat
— — — — — — — 123 118 114
Janta Polytechnic, Butana — — — — — — — — 199 387Maharaja Aggarsen Institute of Management & Technology, Jagadhary
— — — — — — — 152 280 282
Vaish Technical Institute, Rohtak 169 120 346 715 568 623 745 750 1,156 1,230

753
MISCELLANEOUS Number of Boy and Girl Students in Government and Private
Industrial and Technical Institutes No. 35.21 (Contd.)
Name of the Institute 1966-
67 1970-
71 1975-
76 1980-
81 1985-
86 1990-
91 1995-
96 2000-
01 2005-
06 2006-
07 1 2 3 4 5 6 7 8 9 10 11
C.R. Polytechnic, Rohtak 166 131 352 688 457 310 500 649 854 891Seth Jai Parkash Polytechnic, Damla (Yamunanagar)
— — — — — 346 476 813 1,219 1,352
Bhagat Phool Singh Women Polytechnic, Khanpur Kalan (Sonipat)
— — — — 101 143 204 183 182 370
Janta College of Pharmacy, Butana — — — 134 95 — 46 120 289 170Hindu College of Pharmacy, Sonipat — — — 271 244 240 168 209 477 477Lord Shiva College of Pharmacy, Sirsa — — — — 108 — 98 300 416 519Dehat Vikas College of Pharmacy, Tigaon
— — — — — — — 184 407 534
Hindu Institute of Technology, Sonipat — — — — — — — 566 886 1,277Gandhi College of Pharmacy, Karnal — — — — 202 — — 309 390 408P.D. Memorial Polytechnic Sarai, Aurangabad (Jhajjar)
— — — — — — — 415 1,250 1,274
Pandit B.D. Sharma PGIMS, Rohtak — — — — — — — 120 122 99Govt. Polytechnic, Loharu — — — — — — — 80 572 652

754
MISCELLANEOUS Number of Boy and Girl Students in Government and Private
Industrial and Technical Institutes No. 35.21 (Contd.)
Name of the Institute 1966-
67 1970-
71 1975-
76 1980-
81 1985-
86 1990-
91 1995-
96 2000-
01 2005-
06 2006-
07 1 2 3 4 5 6 7 8 9 10 11
Technical Institute Gurukul Bhainswal Kalan
— — — — — — — 116 462 492
somany Institute of Technology and Management, Rewari
— — — — — — — — 1,054 1,187
Doon Valley Engineering of Instrument and Technology Karnal
— — — — — — — — 1,441 1,441
Ambala, College of Engineering and Applied Research, Ambala
— — — — — — — — 237 237
DAV Institute of Engineering & Technology, Kanina
— — — — — — — — 331 256
Atma Nand Jain Institute of Management and Technology, ambala City
— — — — — — — — 185 190
B.S. Anagpurian Institute Technology and Management, Faridabad
— — — — — — — — 1,648 1,520
Institute of Managment and Technology Ballabgarh, Faridabad
— — — — — — — — 160 128
Kedarnath Institute and Management Charkhi Dadri
— — — — — — — — 117 115

755
MISCELLANEOUS Number of Boy and Girl Students in Government and Private
Industrial and Technical Institutes No. 35.21 (Contd.)
Name of the Institute 1966-
67 1970-
71 1975-
76 1980-
81 1985-
86 1990-
91 1995-
96 2000-
01 2005-
06 2006-
07 1 2 3 4 5 6 7 8 9 10 11
G.G.S. Institute of Management and
Technology, Yamunanagar — — — — — — — — 218 120
Amethi Business School Amethi EducationValley Panchgoi, Manesar
— — — — — — — — 148 105
Tilak Raj Chadha Institute of Management & Tech., Y.Nagar
— — — — — — — — 301 357
H.I.M.T., Rohtak — — — — — — — — 56 57Guru Jambheshwar Management and Technical Institute, Hisar
— — — — — — — — 485 3,095
Swami Devi Dayal Institute of Computer and I.T. Institute, Pkl.
— — — — — — — — 221 303
Govt. Polytechnic, Nathusari Chopta, Sirsa
— — — — — — — — 548 596
S.D. Medical lab Technical Institute Jhajjar
— — — — — — — — 80 93
M.M. Hotel Management and Catering Mulana, Ambala
— — — — — — — — 377 415
Bhiwani Institute of Technology & Sciences, Bhiwani
— — — — — — — — 193 202

756
MISCELLANEOUS Number of Boy and Girl Students in Government and Private Industrial
and Technical Institutes No. 35.21 (Contd.)
Name of the Institute 1966-
67 1970-
71 1975-
76 1980-
81 1985-
86 1990-
91 1995-
96 2000-
01 2005-
06 2006-
07 1 2 3 4 5 6 7 8 9 10 11
Jan Nayak Ch. Devi Lal Memorial College of Engg., Sirsa
— — — — — — — — 662 952
Devi Lal Memorial Engg. College, Paniwala Mota, Sirsa
— — — — — — — — 588 626
D.A.V. Institute of Menagement Studies, Faridabad
— — — — — — — — 357 420
Institute of Management & Technology, Faridabad
— — — — — — — — 121 128
MR DAV Institute of Management Studies, Rohtak
— — — — — — — — 111 191
Hindu Institute of Management, Sonipat
— — — — — — — — 233 231
JVMGGR Institute of Computer Application, Charkhi-Dadri (Bhiwani)
— — — — — — — — 30 41
GVM Girls College, Sonipat — — — — — — — — 86 61Shah Satnam Ji Institute of Management & Technology, Sirsa
— — — — — — — — 62 62
N.C. Institute of Computer Science, Israna (Panipat)
— — — — — — — — 89 59

757
MISCELLANEOUS Number of Boy and Girl Students in Government and Private
Industrial and Technical Institutes No. 35.21 (Contd.)
Name of the Institute 1966-
67 1970-
71 1975-
76 1980-
81 1985-
86 1990-
91 1995-
96 2000-
01 2005-
06 2006-
07 1 2 3 4 5 6 7 8 9 10 11
Haryana Institute of Management Technology, Jagadhri, Yamunanagar
— — — — — — — — 80 80
MM Institute of Management & Technology, Fatehabad
— — — — — — — — 13 13
Kamra Institute of Information Technology, Bhondsi, Gurgaon
— — — — — — — — 68 239
Sh. Baba Mast Nath Institute of Management Studies & Research, Asthal Bohar, Rohtak
— — — — — — — — 104 114
National Institute of Finance Management, Faridabad
— — — — — — — — 42 42
National Power Training Institute, Faridabad
— — — — — — — — 62 62
Shri Baba Mast Nath Institute of Pharma ceutical Sciences & Research, Asthal Bohar, Rohtak
— — — — — — — — 60 114
Rajendra Institute of Technology & Sciences, Sirsa
— — — — — — — — 235 246
Jan Nayak Ch. Devi Lal Memorial College of Pharmacy, Sirsa
— — — — — — — — 115 252
Bhawani Shankar Anangpuria Institute of Pharmacy, Faridabad
— — — — — — — — 78 60

758
MISCELLANEOUS Number of Boy and Girl Students in Government and Private Industrial
and Technical Institutes No. 35.21 (Contd.)
Name of the Institute 1966-
67 1970-
71 1975-
76 1980-
81 1985-
86 1990-
91 1995-
96 2000-
01 2005-
06 2006-
07 1 2 3 4 5 6 7 8 9 10 11
B.P. Engineering, College, Gohana — — — — — — — — 158 234 S.D.D. Institute of Engg. & Technology Goalpura, Barwala, Panchkula
— — — — — — — — 517 517
Yashvir Memorial Institute of Technology Bhanbhori, Jind
— — — — — — — — 150 150
Janta Polytechnic, Buttana — — — — — — — — 109 —
PDM Institute of Engg. & Technology Safidon, Jind
— — — — — — — — 60 590
Gurgaon Instt. of Tech. & Mgt. Gurgaon
— — — — — — — — 240 243
Gold Field Instt of Tech. & Mgt., Ballabgarh
— — — — — — — — 240 264
RKSD College of Pharmacy, Kaithal — — — — — — — — 126 191 Manav Rachna Engg. College, Faridabad
— — — — — — — — 404 947
Instt. of Law & Mgt. Studies, Faridabad
— — — — — — — — 437 437
Daronacharya IMT, Kurukshetra — — — — — — — — 214 245 Jan Nayak Ch. Devi Lal Diploma College of Pharmacy, Sirsa
— — — — — — — — 60 252
SDD Instt. of Pharmacy Barwala, Panchkula
— — — — — — — — 60 60
Bharat Instt. of Pharmacy Babain, Kurukshetra
— — — — — — — — 60 60

759
MISCELLANEOUS Number of Boy and Girl Students in Government and Private
Industrial and Technical Institutes No. 35.21 (Concld.)
Name of the Institute 1966-
67 1970-
71 1975-
76 1980-
81 1985-
86 1990-
91 1995-
96 2000-
01 2005-
06 2006-
07 1 2 3 4 5 6 7 8 9 10 11
Jan Nayak Ch. Devi Lal Poly., Sirsa — — — — — — — — 60 658BITS College of Poly., Bhiwani — — — — — — — — 240 396Shri Krishna Edu. Trust, Kurukshetra — — — — — — — — 240 529Sh. Harbaksh Lohia Jai Ram Mahila Poly., Kurukshetra
— — — — — — — — 386 208
M. M. Pharmacy College, Mullana, Ambala
— — — — — — — — 60 119
MDU, Rohtak — — — — — — — — 395 365Ram Gopal College of Pharmacy, Vill.Sultanpur, Gurgaon
— — — — — — — — 60 60
Hindu College of Pharmacy, Sonipat — — — — — — — — 60 60Hindu Instt. of Mgt. Technology, Rohtak — — — — — — — — 56 57
Source :— Director, Technical Education, Haryana.
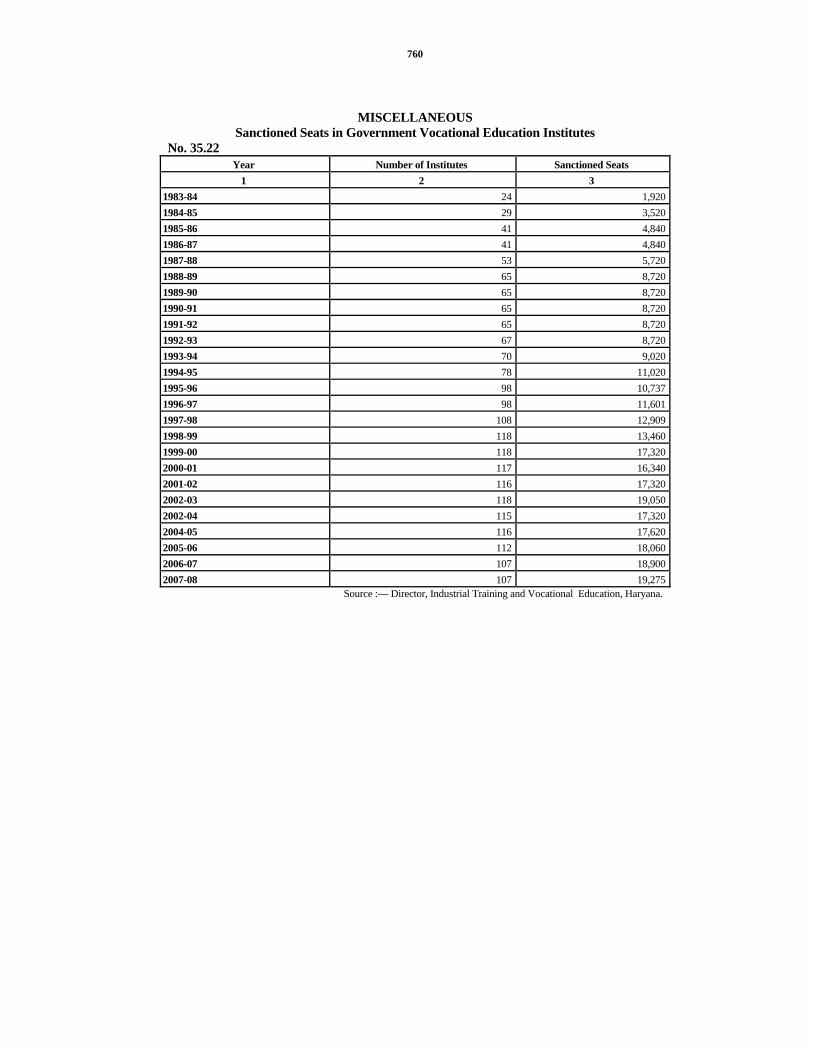
760
MISCELLANEOUS Sanctioned Seats in Government Vocational Education Institutes
No. 35.22 Year Number of Institutes Sanctioned Seats
1 2 3 1983-84 24 1,9201984-85 29 3,5201985-86 41 4,8401986-87 41 4,8401987-88 53 5,7201988-89 65 8,7201989-90 65 8,7201990-91 65 8,7201991-92 65 8,7201992-93 67 8,7201993-94 70 9,0201994-95 78 11,0201995-96 98 10,7371996-97 98 11,6011997-98 108 12,9091998-99 118 13,4601999-00 118 17,3202000-01 117 16,3402001-02 116 17,3202002-03 118 19,0502002-04 115 17,3202004-05 116 17,6202005-06 112 18,0602006-07 107 18,9002007-08 107 19,275
Source :— Director, Industrial Training and Vocational Education, Haryana.

761
MISCELLANEOUS Sanctioned Seats in Government Industrial Training Institutes
No. 35.23 (Contd.) Sr. No.
Name and Location of Institute 1966-67 1967-68 1975-76 1980-81
1 2 3 4 5 6 AMBALA
1. Industrial Training Institute, Ambala City 556 556 664 696 2. Industrial Training Institute, Ambala Cantt. — — — 120 3. Industrial Training Institute, Barara — — — —
YAMUNANAGAR 4. Industrial Training Institute, Yamunanagar 664 664 772 680 5. Industrial Training Institute, Sadaura — — — —
KURUKSHETRA 6. Industrial Training Institute, Kurukshetra — — — — 7. Industrial Training Institute, Shahbad 60 60 60 60
KAITHAL 8. Industrial Training Institute, Kaithal 344 344 260 340 9. Industrial Training Institute, Pundri — — — 64
KARNAL 10. Industrial Training Institute, Karnal 528 528 452 496 11. Industrial Training Institute, Balah — — — — 12. Industrial Training Institute, Nissing — — — —
PANIPAT 13. Industrial Training Institute, Panipat 388 388 368 380
SONIPAT 14. Industrial Training Institute, Sonipat 536 536 624 680 15. Industrial Training Institute, Ganaur — — — — 16. Industrial Training Institute, Gohana — — — 260 17 Industrial Training Institute, Butana — — — —
ROHTAK 18. Industrial Training Institute, Rohtak 708 708 776 776 19. Industrial Training Institute, Hasangarh 248 248 — 256 20. Industrial Training Institute, Maham — — — 128 21. Industrial Training Institute, Bahadurgarh — — — 32
FARIDABAD 22. Industrial Training Institute, Faridabad 264 264 544 376

762
MISCELLANEOUS Sanctioned Seats in Government Industrial Training Institutes
No. 35.23 (Contd.) Sr. No.
Name and Location of Institute 1985-86
1990-91
1995-96
2000-01
2005-06
2006-07
2007-08
1 2 7 8 9 10 11 12 13 AMBALA
1. Industrial Training Institute, Ambala City
712 716 732 732 720 704 720
2. Industrial Training Institute, Ambala Cantt.
108 108 120 136 136 136 120
3. Industrial Training Institute, Barara 64 64 64 64 64 64 64 YAMUNANAGAR
4. Industrial Training Institute, Yamunanagar
680 708 776 792 808 804 900
5. Industrial Training Institute, Sadaura — — — 60 60 44 92 KURUKSHETRA
6. Industrial Training Institute, Kurukshetra
48 48 108 108 108 108 124
7. Industrial Training Institute, Shahbad 28 28 28 28 28 28 28 KAITHAL
8. Industrial Training Institute, Kaithal 340 348 440 424 424 424 460 9. Industrial Training Institute, Pundri 60 48 48 48 48 48 48
KARNAL 10. Industrial Training Institute, Karnal 528 612 660 644 708 708 748 11. Industrial Training Institute, Balah — — 80 92 92 60 96 12. Industrial Training Institute, Nissing — — — — 92 92 120 13. Industrial Training Institute, Panipat 348 380 412 364 412 412 424
SONIPAT 14. Industrial Training Institute, Sonipat 648 704 800 784 784 784 820 15. Industrial Training Institute, Ganaur 44 48 44 108 108 108 188 16. Industrial Training Institute, Gohana 184 200 228 228 228 228 228 17. Industrial Training Institute, Butana — — — 52 48 48 112
ROHTAK 18. Industrial Training Institute, Rohtak 704 672 688 688 688 720 640 19. Industrial Training Institute, Hasangarh 232 228 244 244 244 244 256 20. Industrial Training Institute, Maham 80 136 192 192 192 192 208 21. Industrial Training Institute,
Bahadurgarh 32 32 32 108 124 124 172
FARIDABAD 22. Industrial Training Institute, Faridabad 500 584 656 640 620 620 612

763
MISCELLANEOUS
Sanctioned Seats in Government Industrial Training Institutes No. 35.23 (Concld.) S.No. Name and Location of Institute 1966-67 1967-68 1975-76 1980-81
1 2 3 4 5 6 23. Industrial Training Institute, Nagina — — — 48 24. Industrial Training Institute, Pali — — — — GURGAON 25. Industrial Training Institute, Gurgaon 548 548 604 676 26. Industrial Training Institute, Ferozepur
Jhirka — — — 48
27. Industrial Training Institute, Hathin — — — 64 28. Industrial Training Institute, Palwal 320 320 296 360 29. Industrial Training Institute, Sohna 60 60 60 60 REWARI 30. Industrial Training Institute, Rewari — — — — 31. Industrial Training Institute, Kund
Manethi — — — —
MAHENDRAGARH 32. Industrial Training Institute,
Mahendragarh 260 260 260 330
33. Industrial Training Institute, Narnaul 360 360 276 384 BHIWANI 34. Industrial Training Institute, Bhiwani 440 440 324 324 JIND 35. Industrial Training Institute, Jind — — 62 60 36. Industrial Training Institute, Narwana 276 276 284 360 HISAR 37. Industrial Training Institute, Hisar 624 624 38. Industrial Training Institute, Adampar — — 592 740 39. Industrial Training Institute, Nalwa — — — — 40. Industrial Training Institute, Hansi 60 60 — — 41. Industrial Training Institute, Barwala — — 60 60 SIRSA 42. Industrial Training Institute, Sirsa 548 548 — — 43. Industrial Training Institute, Nathusari
Chopta — — 352 384
44. Industrial Training Institute, Chotala — — — 260 PANCHKULA 45 Industrial Training Institute, Kalka at
Bitna — —
FATEHABAD 46 Industrial Training Institute, Tohana — — — — 47 Industrial Training Institute, Bhoria
Khera — — — —

764
MISCELLANEOUS Sanctioned Seats in Government Industrial Training Institutes
No. 35.23 (Concld.) S.No.
Name and Location of Institute 1985-86
1990-91
1995-96
2000-01
2005-06
2006-07
2007-08
1 2 7 8 9 10 11 12 13 23. Industrial Training Institute, Nagina 80 144 184 165 168 168 168 24. Industrial Training Institute, Pali 44 28 44 28 28 28 28
GURGAON 25. Industrial Training Institute, Gurgaon 612 672 764 716 720 704 696 26. Industrial Training Institute, Ferozepur
Jhirka 156 212 240 234 224 224 244
27. Industrial Training Institute, Hathin 120 168 212 212 212 212 232 28. Industrial Training Institute, Palwal 340 376 392 392 392 392 392 29. Industrial Training Institute, Sohna 112 112 112 80 96 112 144
REWARI 30. Industrial Training Institute, Rewari 88 76 200 184 200 312 216 31. Industrial Training Institute, Kund
Manethi 48 48 76 76 76 76 108
MAHENDRAGARH 32. Industrial Training Institute,
Mahendragarh 332 360 392 408 408 424 440
33. Industrial Training Institute, Narnaul 260 376 408 376 392 376 424 BHIWANI
34. Industrial Training Institute, Bhiwani 324 404 420 468 468 468 564 JIND
35. Industrial Training Institute, Jind 76 60 88 220 244 212 312 36. Industrial Training Institute, Narwana 344 376 392 408 408 504 408
HISAR 37. Industrial Training Institute, Hisar 636 708 748 708 724 788 800 38. Industrial Training Institute, Adampar 96 188 228 228 228 228 272 39. Industrial Training Institute, Nalwa 132 176 176 176 176 192 208 40. Industrial Training Institute, Hansi 64 64 180 164 196 196 212 41. Industrial Training Institute, Barwala — — — 73 32 32 128
SIRSA 42. Industrial Training Institute, Sirsa 414 424 440 472 472 536 444 43. Industrial Training Institute, Nathusari
Chopta 108 92 92 92 124 108 156
44. Industrial Training Institute, Chotala — — — 64 64 124 152 PANCHKULA
45. Industrial Training Institute, Kalka at Bitna
— — — 44 76 76 88
FATEHABAD 46. Industrial Training Institute, Tohana 96 80 96 112 112 112 164 47. Industrial Training Institute, Bhoria
Khera — — — 60 124 124 144
Source :— Director, Industrial Training and Vocational Education, Haryana.

765
MISCELLANEOUS
Number of Girl Students on Rolls in Government Industrial Training Institutes (Women Wing) in Haryana
No. 35.24 (As on 31st March) Name of the Institute 1966-67 1970-71 1980-81 1990-91
1 2 3 4 5 1 . Industrial Training Institute
(Women Wing), Ambala City 118 150 117 199*
2. Industrial Training Institute (Women Wing), Chhachhrauli
29 24 30 35
3. Industrial Training Institute (Women Wing), Gurgaon
62 45 58 72
4. Industrial Training Institute (Women Wing), Rewari
32 48 54 54
5. Industrial Training Institute (Women Wing), Palwal
34 24 35 28
6. Industrial Training Institute (Women Wing), Pundri
13 40 36 33
7. Industrial Training Institute (Women Wing), Jind
61 58 61 54
8. Industrial Training Institute (Women Wing), Kurukshetra
— — 12 36
9. Industrial Training Institute (Women Wing), Hisar
59 55 36 106
10. Industrial Training Institute (Women Wing), Bhiwani
37 57 54 94*
11. Industrial Training Institute (Women Wing), Hansi
31 33 36 42

766
MISCELLANEOUS Number of Girl Students on Rolls in Government Industrial Training Institutes
(Women Wing) in Haryana No. 35.24 (Contd.) (As on 31st March)
Name of the Institute 1995-96 2000-01 2005-06 2006-07 2007-08 1 6 7 8 9 10
1. Industrial Training Institute (Women Wing), Ambala City
249 220 224 224 208
2. Industrial Training Institute (Women Wing), Chhachhrauli
33 36 32 32 32
3. Industrial Training Institute (Women Wing), Gurgaon
92 96 128 128 112
4. Industrial Training Institute (Women Wing), Rewari
51 61 84 84 132
5. Industrial Training Institute (Women Wing), Palwal
— — — — —
6. Industrial Training Institute (Women Wing), Pundri
36 32 32 32 32
7. Industrial Training Institute (Women Wing), Jind
122 84 96 96 96
8. Industrial Training Institute (Women Wing), Kurukshetra
35 29 32 32 32
9. Industrial Training Institute (Women Wing), Hisar
75 96 80 80 80
10. Industrial Training Institute (Women Wing), Bhiwani
93 74 96 96 96
11. Industrial Training Institute (Women Wing), Hansi
28 26 64 64 48
* Includes Teacher Training Course.
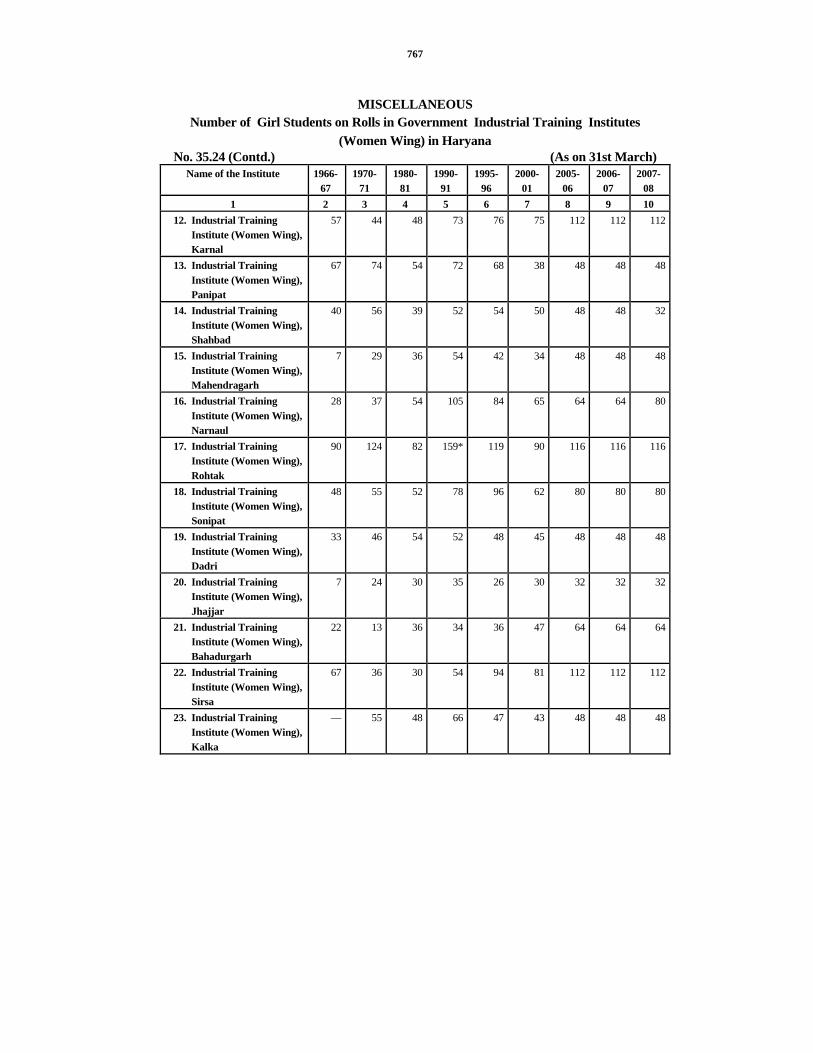
767
MISCELLANEOUS
Number of Girl Students on Rolls in Government Industrial Training Institutes (Women Wing) in Haryana
No. 35.24 (Contd.) (As on 31st March) Name of the Institute 1966-
67 1970-
71 1980-
81 1990-
91 1995-
96 2000-
01 2005-
06 2006-
07 2007-
08 1 2 3 4 5 6 7 8 9 10
12. Industrial Training Institute (Women Wing), Karnal
57 44 48 73 76 75 112 112 112
13. Industrial Training Institute (Women Wing), Panipat
67 74 54 72 68 38 48 48 48
14. Industrial Training Institute (Women Wing), Shahbad
40 56 39 52 54 50 48 48 32
15. Industrial Training Institute (Women Wing), Mahendragarh
7 29 36 54 42 34 48 48 48
16. Industrial Training Institute (Women Wing), Narnaul
28 37 54 105 84 65 64 64 80
17. Industrial Training Institute (Women Wing), Rohtak
90 124 82 159* 119 90 116 116 116
18. Industrial Training Institute (Women Wing), Sonipat
48 55 52 78 96 62 80 80 80
19. Industrial Training Institute (Women Wing), Dadri
33 46 54 52 48 45 48 48 48
20. Industrial Training Institute (Women Wing), Jhajjar
7 24 30 35 26 30 32 32 32
21. Industrial Training Institute (Women Wing), Bahadurgarh
22 13 36 34 36 47 64 64 64
22. Industrial Training Institute (Women Wing), Sirsa
67 36 30 54 94 81 112 112 112
23. Industrial Training Institute (Women Wing), Kalka
— 55 48 66 47 43 48 48 48

768
MISCELLANEOUS
Number of Girl Students on Rolls in Government Industrial Training Institutes (Women Wing) in Haryana
No. 35.24 (Concld.) (As on 31st March) Name of the Institute 1966-67 1970-71 1980-81 1990-91 1995-96 2000-
01 2005-
06 2006-
07 2007-
08 1 2 3 4 5 6 7 8 9 10
24. Industrial Training Institute (Women Wing), Tohana
— 50 54 34 32 32 32 32 48
25. Industrial Training Institute (Women Wing), Naraingarh
— — 34 54 53 47 48 48 48
26. Industrial Training Institute (Women Wing), Tosham
— — 54 54 54 39 64 64 48
27. Industrial Training Institute (Women Wing), Samalkha
— — 50 35 36 26 48 48 48
28. Industrial Training Institute (Women Wing), Saket
— — — 17 20 36 32 32 32
29. Industrial Training Institute (Women Wing), Faridabad
— — — — 48 50 48 48 48
30. Industrial Training Institute (Women Wing), Kaithal
–– –– –– –– — 23 52 52 68
31. Industrial Training Institute (Women Wing), Adampur
–– –– –– –– — 26 32 32 52
32. Industrial Training Institute (Women Wing), Makraulikalan
–– –– –– –– — 47 48 48 —
Source :— Director, Industrial Training and Vocational Education, Haryana.

769
MISCELLANEOUS
Sanctioned Seats under Craftsman Training Scheme for Girls in Haryana during 2007-08
No. 35.25 (Contd.) Sr. No. District/Name of the School Sanctioned Seats 2007-08
1 2 3 FARIDABAD
1. National Modern Cutting and Tailoring Mahila Industrial Training Centre, Ballabgarh
32
2. S.O.S. Helmut Kutin Industrial Training Centre, Faridabad 32 AMBALA
1. M.M.S.D. Industrial Training Centre, Ambala Cantt. 48 2. Army Industrial Training Centre, Ambala Cantt. 160
YAMUNANAGAR 1. Industrial Training CentreWomen League, Yamunanagar 144 2. Sainik Pariwar Bhawan Industrial Training Centre, Chhachhrauli 48 3. Kasturba Gandhi Industrial Training Centre, Radaur 48
KARNAL 1. Ladies Industrial Home Industrial Training Centre, Karnal 96
KURUKSHETRA 1. Raja Devi Multipurpose College for Women Industrial Training
Centre, Bherian Closed
KAITHAL 1. M.R. Aggarwal Industrial Training Centre, Kaithal 48

770
MISCELLANEOUS
Sanctioned Seats under Craftsman Training Scheme for Girls in Haryana during 2007-08
No. 35.25 (Concld.) Sr. No.
District/Name of the School Sanctioned Seats 2007-08
1 2 3 ROHTAK
1. Vishwakarma Industrial Training Centre, Rohtak 64 2. Sainik Parivar Bhawan Industrial Training Centre, Rohtak 104
JHAJJAR Sainik Parivar Bhawan Industrial Training Centre, Jhajjar 104
SONIPAT 1. Samaj Kalyan Sabha Industrial Training Centre, Gohana 32 2. Anup Niketan Industrial Training Centre Garhi Kundel,
Sonipat 16
BHIWANI 1. Sainik Parivar Bhawan Industrial Training Centre, Charkhi
Dadri 48
RIWARI 1. Sainik Parivar Bhawan Industrial Training Centre, Rewari 48
PANCHKULA 1. Sainik Parivar Bhawan Industrial Training Centre,
Panchkula 20
2 I.T.B.P. Ramgarh, Panchkula Closed HISAR
1. Sainik Parivar Bhawan Industrial Training Centre, Hisar 48 JIND
1. Sainik Parivar Bhawan Industrial Training Centre, Jind 32 2. C. R. Kisan Industrial Training Centre, Jind 336
Source :— Director, Industrial Training and Vocational Education, Haryana.
771
Districtwise Final Results of Economic Census 2005 in Haryana

772

773
MISCELLANEOUS District-wise Distribution of Establishments and Employment in Haryana
Final Results of Economic Census 2005 No. 35.26
Establishments All Establishments Agricultural District
Rural Urban Combined Rural Urban Combined 1 2 3 4 5 6 7
Ambala 24,189 21,481 45,670 1,738 459 2,197Panchkula 9,422 6,957 16,379 526 30 556Yamunanagar 20,920 24,382 45,302 1,006 548 1,554Kurukshetra 22,404 17,584 39,988 3,595 157 3,752Kaithal 43,099 14,305 57,404 16,548 356 16,904Karnal 28,733 20,806 49,539 3,519 295 3,814Panipat 19,532 23,218 42,750 774 303 1,077Sonipat 20,093 18,737 38,830 1,476 362 1,838Rohtak 15,943 23,992 39,935 2,953 736 3,689Jhajjar 14,272 10,197 24,469 734 97 831Faridabad 21,991 58,245 80,236 2,187 1,027 3,214Gurgaon 38,576 27,536 66,112 4,079 101 4,180Rewari 18,240 10,545 28,785 1,500 128 1,628Mahendragarh 18,852 9,229 28,081 1,310 26 1,336Bhiwani 27,460 15,962 43,422 2,362 118 2,480Jind 25,445 16,592 42,037 2,645 623 3,268Hisar 29,379 23,551 52,930 1,648 393 2,041Fatehabad 35,368 12,262 47,630 15,844 320 16,164Sirsa 24,032 20,367 44,399 3,968 374 4,342Haryana State 2005 4,57,950 3,75,948 8,33,898 68,412 6,453 74,865Haryana State 1998 2,37,420 2,95,397 5,32,817 13,354 5,310 18,664Haryana State 1990 2,08,715 2,48,405 4,57,120 13,625 5,790 19,415

774
MISCELLANEOUS District-wise Distribution of Establishments and Employment in Haryana
Final Results of Economic Census 2005 No. 35.26 (Contd.)
Establishments
Non-Agricultural Own Account Establishments Establishments (with one or
more hired workers) District
Rural Urban Combined Rural Urban Combined Rural Urban Combined 1 8 9 10 11 12 13 14 15 16
Ambala 22,451 21,022 43,473 17,446 13,493 30,939 6,743 7,988 14,731 Panchkula 8,896 6,927 15,823 6,799 3,999 10,798 2,623 2,958 5,581 Yamunanagar 19,914 23,834 43,748 16,047 16,365 32,412 4,873 8,017 12,890 Kurukshetra 18,809 17,427 36,236 17,391 11,091 28,482 5,013 6,493 11,506 Kaithal 26,551 13,949 40,500 35,309 9,010 44,319 7,790 5,295 13,085 Karnal 25,214 20,511 45,725 22,188 14,107 36,295 6,545 6,699 13,244 Panipat 18,758 22,915 41,673 14,545 12,547 27,092 4,987 10,671 15,658 Sonipat 18,617 18,375 36,992 14,836 11,204 26,040 5,257 7,533 12,790 Rohtak 12,990 23,256 36,246 13,043 16,114 29,157 2,900 7,878 10,778 Jhajjar 13,538 10,100 23,638 10,520 6,642 17,162 3,752 3,555 7,307 Faridabad 19,804 57,218 77,022 10,913 25,205 36,118 11,078 33,040 44,118 Gurgaon 34,497 27,435 61,932 24,231 15,205 39,436 14,345 12,331 26,676 Rewari 16,740 10,417 27,157 12,887 4,867 17,754 5,353 5,678 11,031 Mahendragarh 17,542 9,203 26,745 13,010 5,928 18,938 5,842 3,301 9,143 Bhiwani 25,098 15,844 40,942 20,182 10,634 30,816 7,278 5,328 12,606 Jind 22,800 15,969 38,769 20,455 11,261 31,716 4,990 5,331 10,321 Hisar 27,731 23,158 50,889 22,817 15,369 38,186 6,562 8,182 14,744 Fatehabad 19,524 11,942 31,466 28,927 7,447 36,374 6,441 4,815 11,256 Sirsa 20,064 19,993 40,057 17,928 10,129 28,057 6,104 10,238 16,342 Haryana State 2005 3,89,538 3,69,495 7,59,033 3,39,474 2,20,617 5,60,091 1,18,476 1,55,331 2,73,807 Haryana State 1998 2,24,066 2,90,087 5,14,153 1,82,740 1,99,744 3,82,484 54,680 95,653 1,50,333 Haryana State 1990 1,95,090 2,42,615 4,37,705 1,64,733 1,70,192 3,34,925 43,982 78,213 1,22,195

775
MISCELLANEOUS District-wise Distribution of Establishments and Employment in Haryana
Final Results of Economic Census 2005 No.35.26 (Contd.)
Establishments With Permises Without Permises District
Rural Urban Combined Rural Urban Combined 1 17 18 19 20 21 22
Ambala 21,366 19,495 40,861 2,823 1,986 4,809Panchkula 8,177 6,129 14,306 1,245 828 2,073Yamunanagar 17,905 21,516 39,421 3,015 2,866 5,881Kurukshetra 18,971 15,878 34,849 3,433 1,706 5,139Kaithal 36,959 12,844 49,803 6,140 1,461 7,601Karnal 25,743 18,306 44,049 2,990 2,500 5,490Panipat 17,231 21,087 38,318 2,301 2,131 4,432Sonipat 18,122 17,663 35,785 1,971 1,074 3,045Rohtak 13,628 20,860 34,488 2,315 3,132 5,447Jhajjar 12,348 9,299 21,647 1,924 898 2,822Faridabad 18,514 51,430 69,944 3,477 6,815 10,292Gurgaon 32,616 24,792 57,408 5,960 2,744 8,704Rewari 15,460 8,980 24,440 2,780 1,565 4,345Mahendragarh 14,528 8,257 22,785 4,324 972 5,296Bhiwani 23,560 13,631 37,191 3,900 2,331 6,231Jind 21,365 14,841 36,206 4,080 1,751 5,831Hisar 25,352 20,622 45,974 4,027 2,929 6,956Fatehabad 31,393 10,850 42,243 3,975 1,412 5,387Sirsa 21,299 18,517 39,816 2,733 1,850 4,583Haryana State 2005 3,94,537 3,34,997 7,29,534 63,413 40,951 1,04,364Haryana State 1998 2,12,290 2,71,637 4,83,927 25,130 23,760 48,890Haryana State 1990 1,81,434 2,24,331 4,05,765 27,281 24,074 51,355
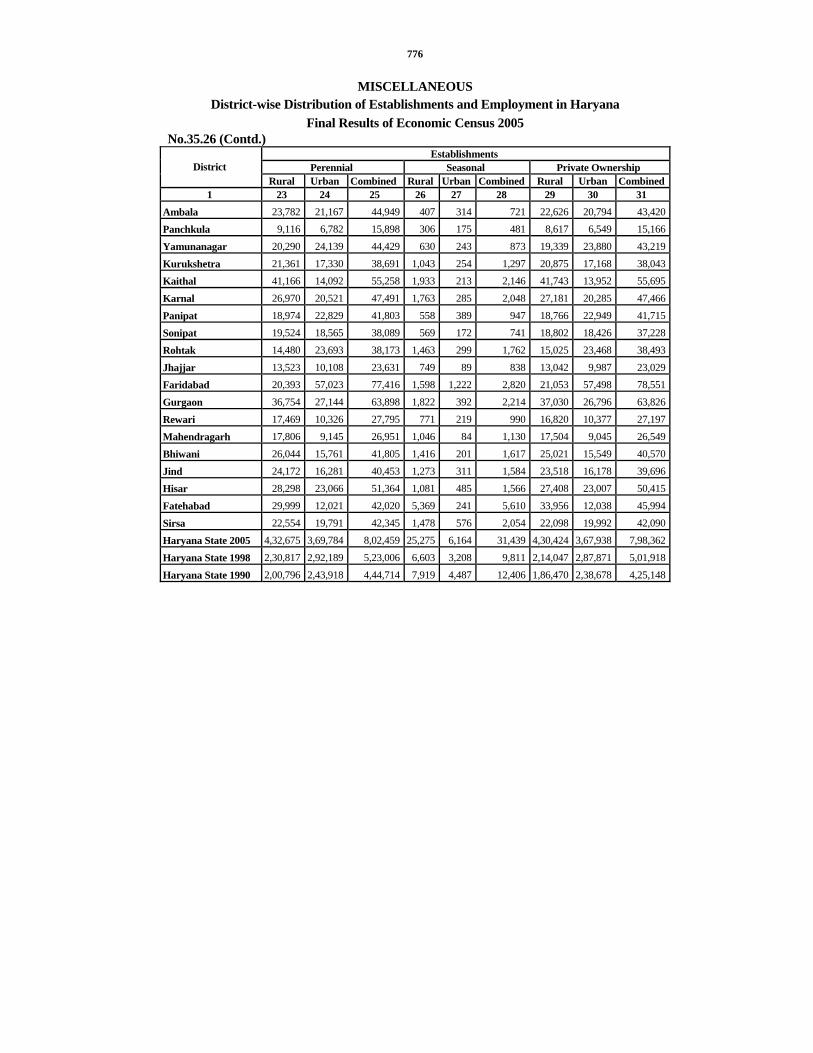
776
MISCELLANEOUS District-wise Distribution of Establishments and Employment in Haryana
Final Results of Economic Census 2005 No.35.26 (Contd.)
Establishments Perennial Seasonal Private Ownership District
Rural Urban Combined Rural Urban Combined Rural Urban Combined1 23 24 25 26 27 28 29 30 31
Ambala 23,782 21,167 44,949 407 314 721 22,626 20,794 43,420
Panchkula 9,116 6,782 15,898 306 175 481 8,617 6,549 15,166
Yamunanagar 20,290 24,139 44,429 630 243 873 19,339 23,880 43,219
Kurukshetra 21,361 17,330 38,691 1,043 254 1,297 20,875 17,168 38,043
Kaithal 41,166 14,092 55,258 1,933 213 2,146 41,743 13,952 55,695
Karnal 26,970 20,521 47,491 1,763 285 2,048 27,181 20,285 47,466
Panipat 18,974 22,829 41,803 558 389 947 18,766 22,949 41,715
Sonipat 19,524 18,565 38,089 569 172 741 18,802 18,426 37,228
Rohtak 14,480 23,693 38,173 1,463 299 1,762 15,025 23,468 38,493
Jhajjar 13,523 10,108 23,631 749 89 838 13,042 9,987 23,029
Faridabad 20,393 57,023 77,416 1,598 1,222 2,820 21,053 57,498 78,551
Gurgaon 36,754 27,144 63,898 1,822 392 2,214 37,030 26,796 63,826
Rewari 17,469 10,326 27,795 771 219 990 16,820 10,377 27,197
Mahendragarh 17,806 9,145 26,951 1,046 84 1,130 17,504 9,045 26,549
Bhiwani 26,044 15,761 41,805 1,416 201 1,617 25,021 15,549 40,570
Jind 24,172 16,281 40,453 1,273 311 1,584 23,518 16,178 39,696
Hisar 28,298 23,066 51,364 1,081 485 1,566 27,408 23,007 50,415
Fatehabad 29,999 12,021 42,020 5,369 241 5,610 33,956 12,038 45,994
Sirsa 22,554 19,791 42,345 1,478 576 2,054 22,098 19,992 42,090
Haryana State 2005 4,32,675 3,69,784 8,02,459 25,275 6,164 31,439 4,30,424 3,67,938 7,98,362
Haryana State 1998 2,30,817 2,92,189 5,23,006 6,603 3,208 9,811 2,14,047 2,87,871 5,01,918
Haryana State 1990 2,00,796 2,43,918 4,44,714 7,919 4,487 12,406 1,86,470 2,38,678 4,25,148
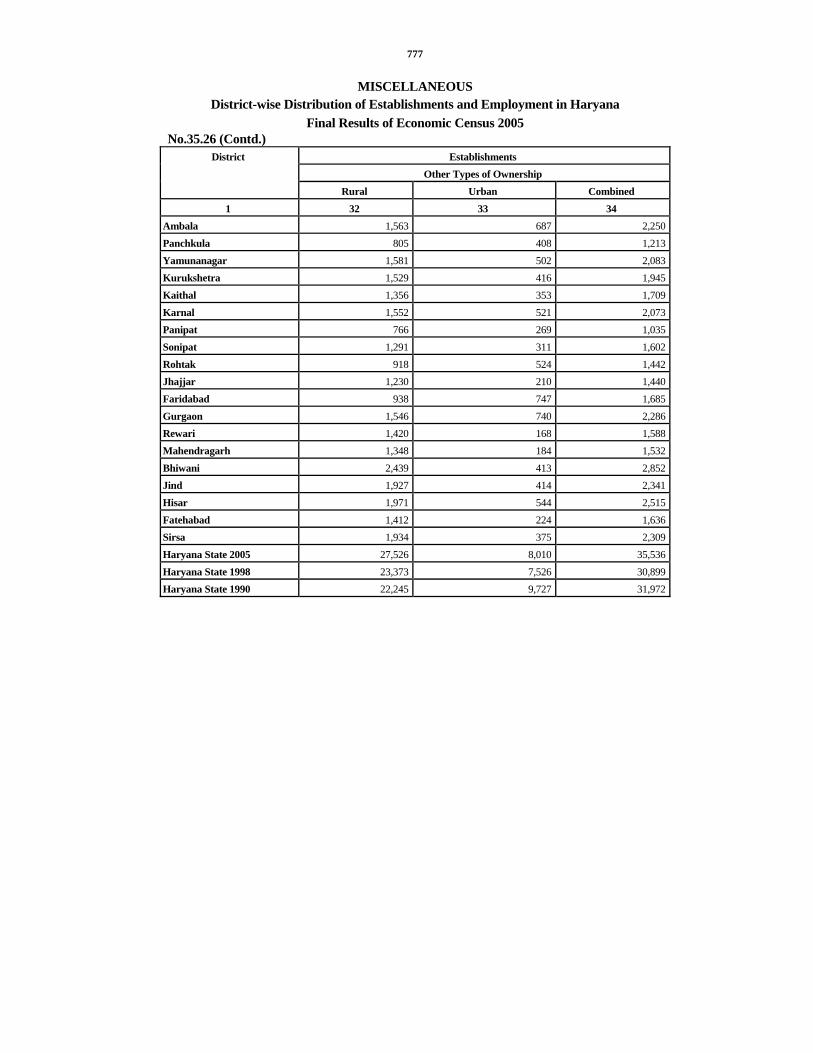
777
MISCELLANEOUS District-wise Distribution of Establishments and Employment in Haryana
Final Results of Economic Census 2005 No.35.26 (Contd.)
Establishments Other Types of Ownership
District
Rural Urban Combined 1 32 33 34
Ambala 1,563 687 2,250Panchkula 805 408 1,213Yamunanagar 1,581 502 2,083Kurukshetra 1,529 416 1,945Kaithal 1,356 353 1,709Karnal 1,552 521 2,073Panipat 766 269 1,035Sonipat 1,291 311 1,602Rohtak 918 524 1,442Jhajjar 1,230 210 1,440Faridabad 938 747 1,685Gurgaon 1,546 740 2,286Rewari 1,420 168 1,588Mahendragarh 1,348 184 1,532Bhiwani 2,439 413 2,852Jind 1,927 414 2,341Hisar 1,971 544 2,515Fatehabad 1,412 224 1,636Sirsa 1,934 375 2,309Haryana State 2005 27,526 8,010 35,536Haryana State 1998 23,373 7,526 30,899Haryana State 1990 22,245 9,727 31,972

778
MISCELLANEOUS District-wise Distribution of Establishments and Employment in Haryana
Final Results of Economic Census 2005 No.35.26 (Contd.)
Establishments Employment in all
Establishments Total (Including unpaid workers)
Without Power With Power/Fuel Total
District
Rural Urban Combined Rural Urban Combined Rural Urban Combined 1 35 36 37 38 39 40 41 42 43
Ambala 16,919 15,039 31,958 7,270 6,442 13,712 48,035 60,323 1,08,358 Panchkula 6,464 4,583 11,047 2,958 2,374 5,332 17,943 37,339 55,282 Yamunanagar 14,376 14,701 29,077 6,544 9,681 16,225 43,131 76,054 1,19,185 Kurukshetra 15,733 13,220 28,953 6,671 4,364 11,035 44,744 43,971 88,715 Kaithal 33,674 10,787 44,461 9,425 3,518 12,943 84,573 35,324 1,19,897 Karnal 21,084 15,224 36,308 7,649 5,582 13,231 55,520 53,541 1,09,061 Panipat 14,075 16,157 30,232 5,457 7,061 12,518 57,296 77,013 1,34,309 Sonipat 13,657 11,597 25,254 6,436 7,140 13,576 81,071 50,457 1,31,528 Rohtak 11,447 16,866 28,313 4,496 7,126 11,622 32,566 60,372 92,938 Jhajjar 8,510 6,657 15,167 5,762 3,540 9,302 53,025 39,944 92,969 Faridabad 15,308 34,404 49,712 6,683 23,841 30,524 58,411 2,17,826 2,76,237 Gurgaon 25,574 17,931 43,505 13,002 9,605 22,607 1,50,462 1,06,842 2,57,304 Rewari 12,389 8,081 20,470 5,851 2,464 8,315 51,259 26,907 78,166 Mahendragarh 11,725 7,065 18,790 7,127 2,164 9,291 36,168 20,464 56,632 Bhiwani 17,661 10,900 28,561 9,799 5,062 14,861 59,880 41,797 1,01,677 Jind 18,374 11,982 30,356 7,071 4,610 11,681 51,999 38,938 90,937 Hisar 19,169 16,264 35,433 10,210 7,287 17,497 65,563 60,493 1,26,056 Fatehabad 27,792 9,749 37,541 7,576 2,513 10,089 73,487 28,676 1,02,163 Sirsa 17,344 13,876 31,220 6,688 6,491 13,179 46,327 57,076 1,03,403 Haryana State 2005 3,21,275 2,55,083 5,76,358 1,36,675 1,20,865 2,57,540 11,11,460 11,33,357 22,44,817 Haryana State 1998 1,77,239 2,17,158 3,94,397 60,181 78,239 1,38,420 5,95,203 9,63,804 15,59,007 Haryana State 1990 1,59,841 1,88,572 3,48,413 48,874 59,833 1,08,707 5,24,335 8,28,899 13,53,234

779
MISCELLANEOUS District-wise Distribution of Establishments and Employment in Haryana
Final Results of Economic Census 2005 No.35.26 (Contd.)
Employment in all Establishments Total (Including unpaid workers)
Male District
Rural Urban Combined 1 44 45 46
Ambala 41,431 54,159 95,590Panchkula 14,614 33,067 47,681Yamunanagar 38,022 70,372 1,08,394Kurukshetra 36,896 40,456 77,352Kaithal 63,492 32,972 96,464Karnal 48,192 48,050 96,242Panipat 47,932 70,061 1,17,993Sonipat 64,713 44,507 1,09,220Rohtak 26,293 53,309 79,602Jhajjar 37,880 37,002 74,882Faridabad 46,293 1,99,467 2,45,760Gurgaon 1,27,290 94,656 2,21,946Rewari 44,598 24,699 69,297Mahendragarh 31,307 19,454 50,761Bhiwani 49,055 37,915 86,970Jind 42,711 35,369 78,080Hisar 54,184 54,529 1,08,713Fatehabad 51,820 26,567 78,387Sirsa 37,082 52,613 89,695Haryana State 2005 9,03,805 10,29,224 19,33,029Haryana State 1998 4,98,924 8,81,448 13,80,372Haryana State 1990 4,47,337 7,64,573 12,11,910

780
MISCELLANEOUS District-wise Distribution of Establishments and Employment in Haryana
Final Results of Economic Census 2005 No.35.26 (Contd.)
Employment in all Establishments Employment in all
Establishments
Total (Including unpaid workers) Hired workers in Establish-
ments only
Female Children Total
District
Rural Urban Combined Rural Urban Combined Rural Urban Combined1 47 48 49 50 51 52 53 54 55
Ambala 5,800 5,935 11,735 804 229 1,033 22,389 35,873 58,262Panchkula 3,018 4,178 7,196 311 94 405 8,154 30,044 38,198Yamunanagar 4,727 5,482 10,209 382 200 582 22,089 49,204 71,293Kurukshetra 7,412 3,428 10,840 436 87 523 19,023 24,145 43,168Kaithal 17,916 2,105 20,021 3,165 247 3,412 24,170 19,072 43,242Karnal 6,418 4,939 11,357 910 552 1,462 24,001 30,673 54,674Panipat 8,969 6,331 15,300 395 621 1,016 35,529 50,927 86,456Sonipat 14,948 5,449 20,397 1,410 501 1,911 58,053 29,860 87,913Rohtak 6,019 6,883 12,902 254 180 434 14,197 33,557 47,754Jhajjar 13,484 2,809 16,293 1,661 133 1,794 37,332 28,336 65,668Faridabad 10,062 17,522 27,584 2,056 837 2,893 40,137 1,72,261 2,12,398Gurgaon 19,178 11,522 30,700 3,994 664 4,658 1,08,035 78,739 1,86,774Rewari 6,349 1,819 8,168 312 389 701 32,818 17,062 49,880Mahendragarh 4,513 977 5,490 348 33 381 19,081 10,927 30,008Bhiwani 9,568 3,531 13,099 1,257 351 1,608 29,759 24,187 53,946Jind 8,452 3,293 11,745 836 276 1,112 23,001 18,976 41,977Hisar 10,137 5,299 15,436 1,242 665 1,907 32,820 32,502 65,322Fatehabad 18,753 1,908 20,661 2,914 201 3,115 21,990 14,121 36,111Sirsa 8,364 4,028 12,392 881 435 1,316 19,603 32,460 52,063Haryana State 2005 1,84,087 97438 2,81,525 23,568 6,695 30,263 5,92,181 7,32,926 13,25,107Haryana State 1998 87,574 75,285 1,62,859 8,705 7,071 15,776 3,30,328 6,03,990 9,34,318Haryana State 1990 76,998 64,326 1,41,324 . . . . . . 2,89,172 5,15,679 8,04,851
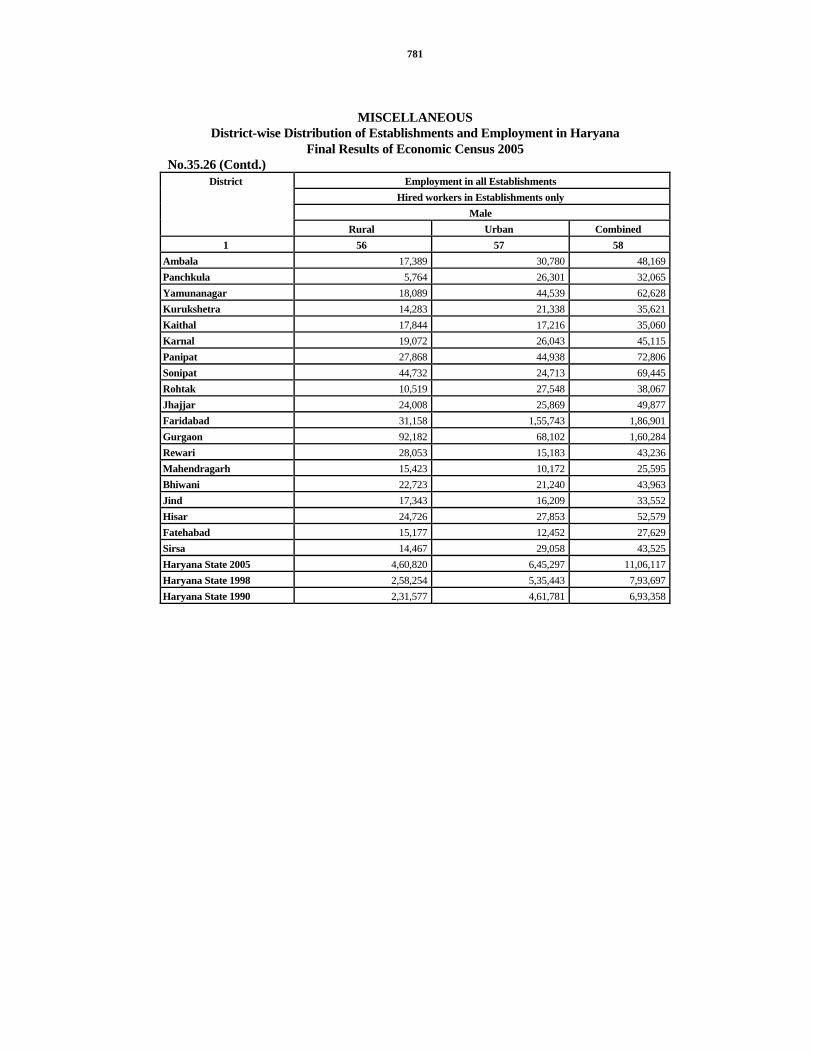
781
MISCELLANEOUS District-wise Distribution of Establishments and Employment in Haryana
Final Results of Economic Census 2005 No.35.26 (Contd.)
Employment in all Establishments Hired workers in Establishments only
Male
District
Rural Urban Combined 1 56 57 58
Ambala 17,389 30,780 48,169Panchkula 5,764 26,301 32,065Yamunanagar 18,089 44,539 62,628Kurukshetra 14,283 21,338 35,621Kaithal 17,844 17,216 35,060Karnal 19,072 26,043 45,115Panipat 27,868 44,938 72,806Sonipat 44,732 24,713 69,445Rohtak 10,519 27,548 38,067Jhajjar 24,008 25,869 49,877Faridabad 31,158 1,55,743 1,86,901Gurgaon 92,182 68,102 1,60,284Rewari 28,053 15,183 43,236Mahendragarh 15,423 10,172 25,595Bhiwani 22,723 21,240 43,963Jind 17,343 16,209 33,552Hisar 24,726 27,853 52,579Fatehabad 15,177 12,452 27,629Sirsa 14,467 29,058 43,525Haryana State 2005 4,60,820 6,45,297 11,06,117Haryana State 1998 2,58,254 5,35,443 7,93,697Haryana State 1990 2,31,577 4,61,781 6,93,358

782
MISCELLANEOUS District-wise Distribution of Establishments and Employment in Haryana
Final Results of Economic Census 2005 No.35.26 (Concld.)
Employment in all Establishments Hired workers in Establishments only
Female Children District
Rural Urban Combined Rural Urban Combined 1 59 60 61 62 63 64
Ambala 4,390 4,905 9,295 610 188 798Panchkula 2,115 3,656 5,771 275 87 362Yamunanagar 3,675 4,479 8,154 325 186 511Kurukshetra 4,551 2,736 7,287 189 71 260Kaithal 5,332 1,657 6,989 994 199 1,193Karnal 4,262 4,126 8,388 667 504 1,171Panipat 7,445 5,468 12,913 216 521 737Sonipat 12,585 4,689 17,274 736 458 1,194Rohtak 3,589 5,850 9,439 89 159 248Jhajjar 12,110 2,374 14,484 1,214 93 1,307Faridabad 7,753 15,882 23,635 1,226 636 1,862Gurgaon 13,890 10,116 24,006 1,963 521 2,484Rewari 4,542 1,539 6,081 223 340 563Mahendragarh 3,565 752 4,317 93 3 96Bhiwani 6,577 2,745 9,322 459 202 661Jind 5,254 2,533 7,787 404 234 638Hisar 7,447 4,147 11,594 647 502 1,149Fatehabad 5,988 1,514 7,502 825 155 980Sirsa 4,770 3,094 7,864 366 308 674Haryana State 2005 1,19,840 82,262 2,02,102 11,521 5,367 16,888Haryana State 1998 68,965 64,485 1,33,450 3,109 4,062 7,171Haryana State 1990 57,595 53,898 1,11,493 . . . . . .
Source :- Econonmic and Statistical Analysis Department, Haryana Note :- Number of Criedren were included in Males/Females during 1990

783
State-wise final Results of Economic Census 2005 in India

784

785
MISCELLANEOUS Statewise Number of Establishments (Non-agricultural and Agricultural)
(Final Results of Economic Census 2005) No. 35.27
Rural Urban Combined
State/Union Territory Total establi-
shments
Non- agricul-
tural estabil-
shments
Agricu- establi-
shments
Total establi-
shments
Non- agricul-
tural establi-
shments
Agricu- ltural
establi- shments
Total establi-
shments
Non- agricul-
tural establi-
shments
Agricu- ltural
establi- shments
1 2 3 4 5 6 7 8 9 10 Andra Pardesh 2847796 1898099 949697 1149697 1116897 32289 3996982 3014996 981986 Arunachal Pradesh 18799 18457 342 9935 9881 54 28734 28338 396 Assam 681670 641873 39797 302023 299354 2669 983693 941227 42466 Bihar 835487 805730 29757 389165 383949 5216 1224652 1189679 34973 Goa 36850 34604 2246 36665 36254 411 73515 70858 2657 Gujarat 1362986 685687 677299 1063036 1029384 33652 2426022 1715071 710951 Haryana 457950 389538 68412 375948 369495 6453 833898 759033 74865 Himachal Pradesh 215248 203489 11759 52525 52270 255 267773 255759 12014 Jammu and Kashmir 183118 180966 2152 141790 141357 433 324908 322323 2585 Karnataka 1590152 1212773 377379 948722 935499 13223 2538874 2148272 390602 Kerala 2101075 1310235 790840 702753 613459 89294 2803828 1923694 880134 Madhya Pradesh 918701 845908 72793 816561 804900 11661 1735262 1650808 84454 Maharashtra 2110191 1530197 579994 2115121 2091094 24027 4225312 3621291 604021 Manipur 57581 51830 5751 47151 44609 2542 104732 96439 8293 Meghalaya 55122 52183 2939 28085 27652 433 83207 79835 3372 Mizoram 18016 13617 4399 29714 23331 6383 47730 36948 10782 Nagaland 19970 18977 993 15608 15324 284 35578 34301 1277 Orissa 1446735 1264662 182073 383563 373340 10223 1830298 1638002 192296 Punjab 499251 444304 54947 572415 565917 6498 1071666 1010221 61445 Rajasthan 1216060 985177 230883 745405 730527 14878 1961465 1715704 245761 Sikkim 13700 11465 2235 5662 5644 18 19362 17109 2253

786
MISCELLANEOUS Statewise Number of Establishments (Non-agricultural and Agricultural)
(Final Results of Economic Census 2005) No. 35.27 (Concld.)
Rural Urban Combined
State/Union Territory
Total establi-
shments
Non- agricul-
tural establi-
shments
Agricu- ltural
establi- shments
Total establi-
shments
Non- agricul-
tural establi-
shments
Agricu- ltural
establi- shments
Total establi-
shments
Non- agricul-
tural establi-
shments
Agricu- ltural
establi- shments
1 2 3 4 5 6 7 8 9 10 Tamilnadu 2727624 1687093 1040531 1705767 1652705 53062 4433391 3339798 1093593 Tripura 138860 129146 9714 50563 49807 756 189423 178953 10470 Uttar Pradesh 2204893 1973363 231530 1815717 1790097 25620 4020610 3763460 257150 Uttrakhand 198736 168735 30001 126421 124542 1879 325157 293277 31880 Jharkhand 295816 287613 8203 195556 190570 4986 491372 478183 13189 Chhatisgarh 437639 353607 84032 199666 196060 3606 637305 549667 87638 West Bengal 2772415 2559850 212565 1432325 1416745 15580 4204740 3976595 228145 A. & N. Islands 9141 9062 79 4347 4307 40 13488 13369 119 Chandigarh 7671 6910 761 57134 56476 658 64805 63386 1419 Dadra & Nagar Haveli
5440 5339 101 3090 3059 31 8530 8398 132
Delhi 26380 25803 577 731363 728650 2713 757743 754453 3290 Daman & Diu 6219 5832 387 3959 3758 201 10178 9590 588 Lakshadweep 1963 1630 333 1219 1102 117 3182 2732 450 Pondicherry 16811 13313 3498 32763 31924 839 49574 45237 4337 Total 25536066 19827067 5708999 16290923 15919939 370984 41826989 35747006 6079983
Source :— Central Statistical Organisation, Government of India. (Economic Census 2005—All India Report)

787
MISCELLANEOUS Statewise Number of Establishments and own Account Establishments
(Final Results of Economic Census 2005) No. 35.28
Rural Urban Combined
State/Union Territory
Total Establi- shments
Own Account Establi- shments
Establi- shments
with hired
workers
Total Establi- shments
Own Account Establi- shments
Establish-ments
with hiredworkers
Total Establi- shments
Own Account Establi- shments
Establi- shments
with hired
workers 1 2 3 4 5 6 7 8 9 10
Andhra Pradesh
2847796 2058793 789003 1149186 585180 564006 3996982 2643973 1353009
Arunachal Pradesh
18799 9332 9467 9935 5070 4865 28734 14402 14332
Assam 681670 478710 202960 302023 159029 142994 983693 637739 345954Bihar 835487 595651 239836 389165 225139 164026 1224652 820790 403862Goa 36850 21163 15687 36665 17661 19004 73515 38824 34691Gujarat 1362986 965857 397129 1063036 566735 496301 2426022 1532592 893430Haryana 457950 339474 118476 375948 220617 155331 833898 560091 273807Himachal Pradesh
215248 148647 66601 52525 32322 20203 267773 180969 86804
Jammu and Kashmir
183118 122181 60937 141790 85019 56771 324908 207200 117708
Karnataka 1590152 1107693 482459 948722 510179 438543 2538874 1617872 921002Kerala 2101075 1599654 501421 702753 407861 294892 2803828 2007515 796313Madhya Pradesh
918701 664863 253838 816561 503734 312827 1735262 1168597 566665
Maharashtra 2110191 1441708 668483 2115121 1077624 1037497 4225312 2519332 1705980Manipur 57581 46198 11383 47151 37451 9700 104732 83649 21083Meghalaya 55122 24094 31028 28085 12988 15097 83207 37082 46125Mizoram 18016 10885 7131 29714 21135 8579 47730 32020 15710Nagaland 19970 11333 8637 15608 7407 8201 35578 18740 16838Orissa 1446735 1054577 392158 383563 235470 148093 1830298 1290047 540251Punjab 499251 334874 164377 572415 305850 266565 1071666 640724 430942Rajasthan 1216060 759310 456750 745405 412706 332699 1961465 1172016 789449Sikkim 13700 8590 5110 5662 2667 2995 19362 11257 8105

788
MISCELLANEOUS Statewise Number of Establishments and own Account Establishments
(Final Results of Economic Census 2005) No.35.28 (Concld.)
Rural Urban Combined
State/Union Territory
Total Establi- shments
Own Account Establi- shments
Establi- shments
with hired
workers
Total Establi- shments
Own Account Establi- shments
Establish- ments
with hired workers
Total Establi- shments
Own Account Establi- shments
Establi- shments
with hired workers
1 2 3 4 5 6 7 8 9 10 Tamilnadu 2727624 1908804 818820 1705767 835772 869995 4433391 2744576 1688815 Tripura 138860 106594 32266 50563 35438 15125 189423 142032 47391 Uttar Pradesh 2204893 1704263 500630 1815717 1140341 675376 4020610 2844604 1176006 West Bengal 2772415 2001329 771086 1432325 760407 671918 4204740 2761736 1443004 Uttrakhand 198736 146303 52433 126421 74426 51995 325157 220729 104428 Jharkhand 295816 144488 151328 195556 90349 105207 491372 234837 256535 Chattisgarh 437639 251479 186160 199666 103532 96134 637305 355011 282294 A. & N. Islands 9141 4452 4689 4347 1451 2896 13488 5903 7585 Chandigarh 7671 6114 1557 57134 39098 18036 64805 45212 19593 Dadra & Nagar Haveli
5440 2859 2581 3090 1144 1946 8530 4003 4527
Delhi 26380 15744 10636 731363 297922 433441 757743 313666 444077 Daman & Diu 6219 3084 3135 3959 2454 1505 10178 5538 4640 Lakshadweep 1963 848 1115 1219 457 762 3182 1305 1877 Pondicherry 16811 10239 6572 32763 15226 17537 49574 25465 24109 Total 25536066 18110187 7425879 16290923 8829861 7461062 41826989 26940048 14886941
Source :— Central Statistical Organisation, Government of India. (Economic Census 2005—All India Report)
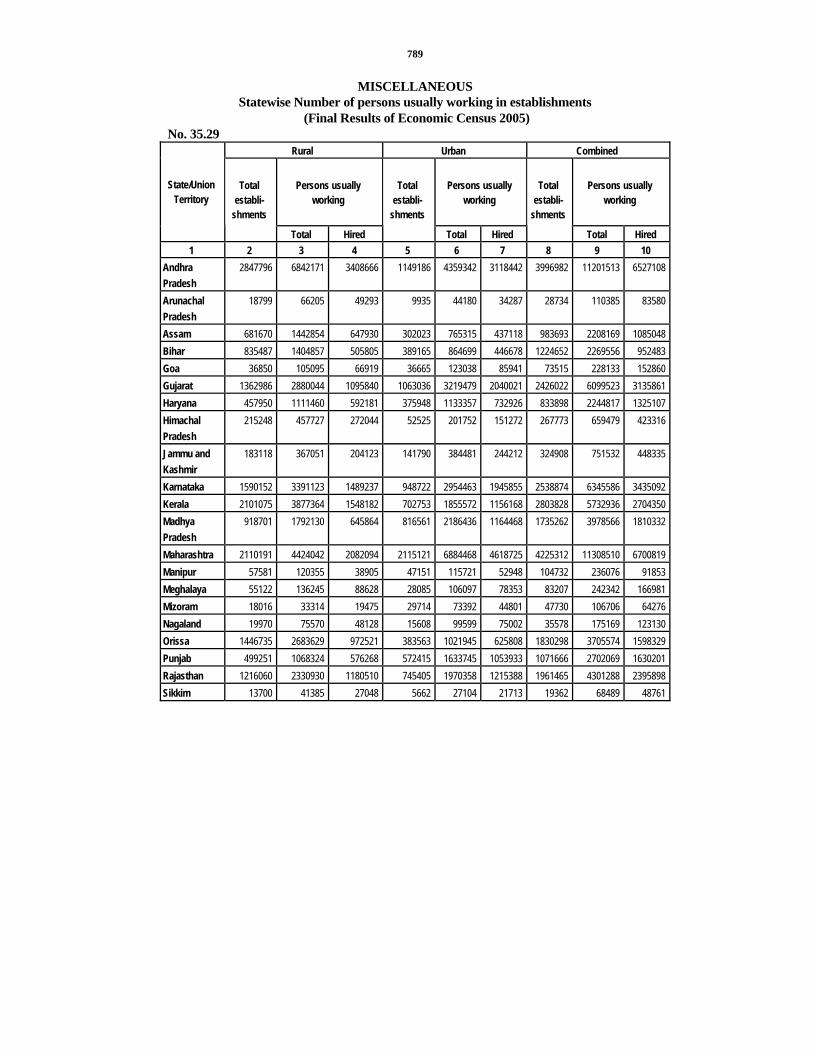
789
MISCELLANEOUS Statewise Number of persons usually working in establishments
(Final Results of Economic Census 2005) No. 35.29
Rural Urban Combined
Persons usually working
Persons usually working
Persons usually working
State/Union Territory
Total establi-
shments
Total Hired
Total establi-
shments
Total Hired
Total establi-
shments
Total Hired 1 2 3 4 5 6 7 8 9 10
Andhra Pradesh
2847796 6842171 3408666 1149186 4359342 3118442 3996982 11201513 6527108
Arunachal Pradesh
18799 66205 49293 9935 44180 34287 28734 110385 83580
Assam 681670 1442854 647930 302023 765315 437118 983693 2208169 1085048 Bihar 835487 1404857 505805 389165 864699 446678 1224652 2269556 952483 Goa 36850 105095 66919 36665 123038 85941 73515 228133 152860 Gujarat 1362986 2880044 1095840 1063036 3219479 2040021 2426022 6099523 3135861 Haryana 457950 1111460 592181 375948 1133357 732926 833898 2244817 1325107 Himachal Pradesh
215248 457727 272044 52525 201752 151272 267773 659479 423316
Jammu and Kashmir
183118 367051 204123 141790 384481 244212 324908 751532 448335
Karnataka 1590152 3391123 1489237 948722 2954463 1945855 2538874 6345586 3435092 Kerala 2101075 3877364 1548182 702753 1855572 1156168 2803828 5732936 2704350 Madhya Pradesh
918701 1792130 645864 816561 2186436 1164468 1735262 3978566 1810332
Maharashtra 2110191 4424042 2082094 2115121 6884468 4618725 4225312 11308510 6700819 Manipur 57581 120355 38905 47151 115721 52948 104732 236076 91853 Meghalaya 55122 136245 88628 28085 106097 78353 83207 242342 166981 Mizoram 18016 33314 19475 29714 73392 44801 47730 106706 64276 Nagaland 19970 75570 48128 15608 99599 75002 35578 175169 123130 Orissa 1446735 2683629 972521 383563 1021945 625808 1830298 3705574 1598329 Punjab 499251 1068324 576268 572415 1633745 1053933 1071666 2702069 1630201 Rajasthan 1216060 2330930 1180510 745405 1970358 1215388 1961465 4301288 2395898 Sikkim 13700 41385 27048 5662 27104 21713 19362 68489 48761

790
MISCELLANEOUS Statewise Number of persons usually working in establishments
(Final Results of Economic Census 2005) No.35.29 (Concld.)
Rural Urban Combined
Persons usually working
Persons usually working
Persons usually working
State/Union Territory
Total establi-
shments
Total Hired
Total establi-
shments
Total Hired
Total establi-
shments
Total Hired 1 2 3 4 5 6 7 8 9 10
Tamilnadu 2727624 5311084 2365468 1705767 4751886 3021840 4433391 10062970 5387308 Tripura 138860 259910 107910 50563 125798 73185 189423 385708 181095 Uttar Pradesh 2204893 4082391 1393504 1815717 4062698 1970344 4020610 8145089 3363848 West Bengal 2772415 5543240 2400467 1432325 4489010 2964582 4204740 10032250 5365049 Uttrakhand 198736 393801 191904 126421 344068 210565 325157 737869 402469 Jharkhand 295816 599954 370530 195556 552532 386702 491372 1152486 757232 Chattisgarh 437639 945854 470976 199666 569313 370762 637305 1515167 841738 A. & N. Islands 9141 29337 21133 4347 23877 20594 13488 53214 41727 Chandigarh 7671 12616 4050 57134 237956 180666 64805 250572 184716 Dadra & Nagar 5440 47803 43587 3090 19138 16558 8530 66941 60145 Haveli Delhi 26380 70063 42341 731363 3486324 2633734 757743 3556387 2676075 Daman & Diu 6219 51128 44911 3959 11292 6945 10178 62420 51856 Lakshadweep 1963 6731 5164 1219 5237 4458 3182 11968 9622 Pondicherry 16811 63564 48342 32763 131098 101516 49574 194662 149858 Total 25536066 52069351 23069948 16290923 48834770 31306510 41826989 100904121 54376458
Source :— Central Statistical Organisation, Government of India. (Economic Census 2005—All India Report)

791
MISCELLANEOUS Statewise establishment with selected characteristies
(Final results of Economic census 2005) No.35.30
Rural State/Union Territory
Seasonal Without Premises
Without Power/Fuel
Under Private Ownership
1 2 3 4 5 Andhra Pradesh 340313 839242 2177160 2699152Arunachal Pradesh 691 929 11048 14510Assam 23166 183645 593960 626708Bihar 38131 96832 667970 792753Jharkhand 17465 42726 224693 269208Goa 5472 11941 18620 35041Gujarat 68184 281845 1003061 1305121Haryana 25275 63413 321275 430424Himachal Pradesh 8721 24319 119278 178804Jammu and Kashmir 5788 9394 138312 155008Karnataka 241912 204166 1257925 1432985Kerala 82903 223783 1722167 2046685Madhya Pradesh 59199 120358 765575 813122Chhatisgarh 90028 140939 364617 372693Maharashtra 193573 405421 1640791 1905809Manipur 2390 14935 43007 54467Meghalaya 2454 10194 35094 42135Mizoram 266 1305 13794 12302Nagaland 671 645 15651 16464Orissa 187064 446484 1195359 1334027Punjab 16282 51615 334844 461857

792
MISCELLANEOUS Statewise establishment with selected characteristies
(Final results of Economic census 2005) No.35.30 (Contd.)
Rural State/Union Territory
Seasonal Without Premises
Without Power/Fuel
Under Private Ownership
1 2 3 4 5 Rajasthan 85671 213115 876331 1090636Sikkim 1459 1802 10341 11652Tamilnadu 87533 310019 2207657 2565574Tripura 2974 43355 109145 124616Uttar Pradesh 130989 264017 1783763 2112531Uttrakhand 12624 24049 145390 175942West Bengal 151962 1004759 2294508 2625560A. & N. Islands 707 1325 6206 7817Chandigarh 26 3153 3985 7593Delhi 459 6155 17566 25840Dadra & Nagar Haveli 126 963 2437 4941Daman & Diu 528 1440 1934 6030Lakshadweep 162 541 1166 1588Pondicherry 672 2332 12573 14650Total 1885840 5051156 20137203 23774245
MISCELLANEOUS Statewise establishment with selected characteristies

793
(Final results of Economic census 2005) No.35.30 (Contd.)
Urban Combined State/Union Territory Seasonal
Without Premises
Without Power/Fuel
Under Private
OwnershipSeasonal
Without Premises
Without Power/Fuel
Under Private
Ownership
1 6 7 8 9 10 11 12 13 Andhra Pradesh 31779 232378 752050 1113336 372092 1071620 2929210 3812488Arunachal Pradesh
156 799 6869 9088 847 1728 17917 23598
Assam 3818 81022 251959 294047 26984 264667 845919 920755Bihar 4912 31803 317296 378493 43043 128635 985266 1171246Jharkhand 3668 21050 152380 190110 21133 63776 377073 459318Goa 3464 9136 19596 35507 8936 21077 38216 70548Gujarat 19265 261028 629028 1042525 87449 542873 1632089 2347646Haryana 6164 40951 255083 367938 31439 104364 576358 798362Himachal Pradesh 351 2370 33229 47559 9072 26689 152507 226363Jammu and Kashmir
2939 5888 106057 135704 8727 15282 244369 290712
Karnataka 36514 101059 691513 903093 278426 305225 1949438 2336078Kerala 23163 93384 504015 679411 106066 317167 2226182 2726096Madhya Pradesh 20515 94864 636387 794848 79714 215222 1401962 1607970Chhatisgarh 5099 38552 154396 191683 95127 179491 519013 564376Maharashtra 46879 315742 1470722 2053182 240452 721163 3111513 3958991Manipur 1125 9693 37154 46123 3515 24628 80161 100590Meghalaya 778 4331 19035 25693 3232 14525 54129 67828Mizoram 313 4051 23521 26258 579 5356 37315 38560Nagaland 186 211 11942 14896 857 856 27593 31360Orissa 7408 77156 297368 364831 194472 523640 1492727 1698858Punjab 11583 62360 365902 560706 27865 113975 700746 1022563
MISCELLANEOUS
Statewise establishment with selected characteristies (Final results of Economic census 2005)
No.35.30 (Concld.) Urban Combined
State/Union Territory Seasonal
Without Premises
Without Power/Fuel
Under Private
OwnershipSeasonal
Without Premises
Without Power/Fuel
Under Private
Ownership
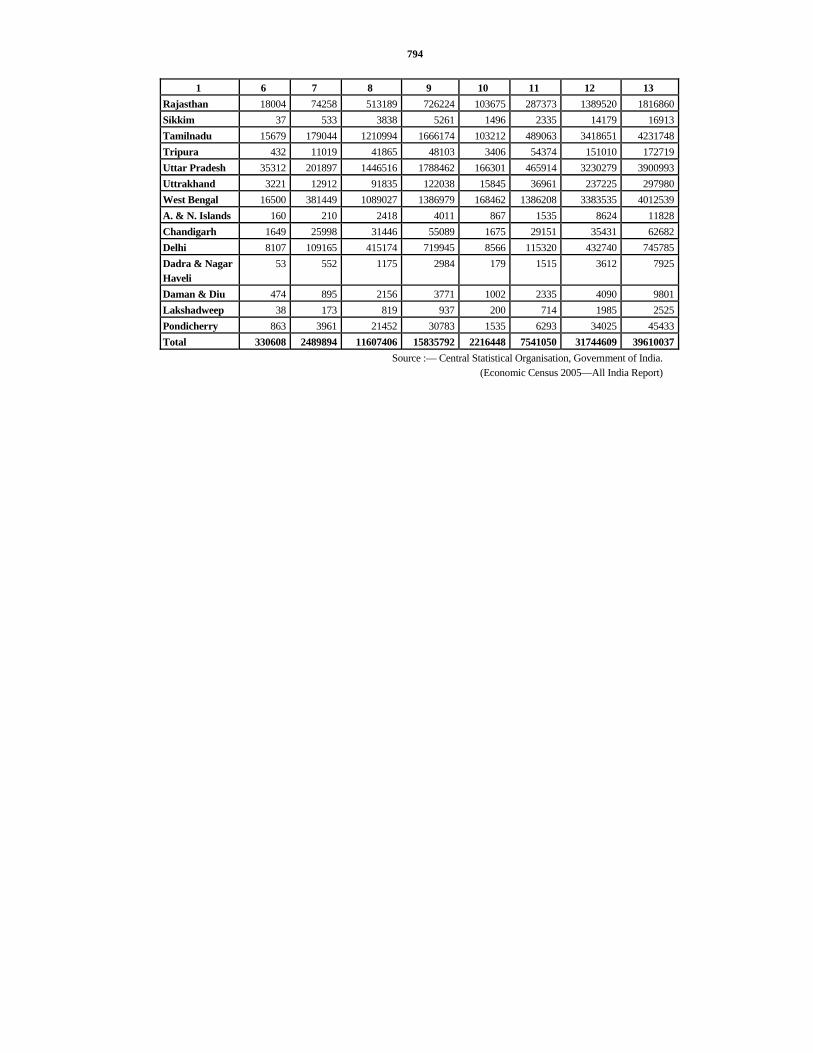
794
1 6 7 8 9 10 11 12 13 Rajasthan 18004 74258 513189 726224 103675 287373 1389520 1816860Sikkim 37 533 3838 5261 1496 2335 14179 16913Tamilnadu 15679 179044 1210994 1666174 103212 489063 3418651 4231748Tripura 432 11019 41865 48103 3406 54374 151010 172719Uttar Pradesh 35312 201897 1446516 1788462 166301 465914 3230279 3900993Uttrakhand 3221 12912 91835 122038 15845 36961 237225 297980West Bengal 16500 381449 1089027 1386979 168462 1386208 3383535 4012539A. & N. Islands 160 210 2418 4011 867 1535 8624 11828Chandigarh 1649 25998 31446 55089 1675 29151 35431 62682Delhi 8107 109165 415174 719945 8566 115320 432740 745785Dadra & Nagar Haveli
53 552 1175 2984 179 1515 3612 7925
Daman & Diu 474 895 2156 3771 1002 2335 4090 9801Lakshadweep 38 173 819 937 200 714 1985 2525Pondicherry 863 3961 21452 30783 1535 6293 34025 45433Total 330608 2489894 11607406 15835792 2216448 7541050 31744609 39610037
Source :— Central Statistical Organisation, Government of India. (Economic Census 2005—All India Report)

795
MISCELLANEOUS Comparative Statistics of Haryana and India
No. 35.31 Magnitude
Item Unit Ref. Year Haryana India
1 2 3 4 5 1. Area and Population—
(a) Geographical area 000 sq.km. 2011 Census 44 3,287(b) Total Population Lakhs 2011Census 254 12,102(c) Density of Population Per Sq.Km. 2011 Census 573 382(d) Sex Ratio Females/000Males 2011 Census 877 940
2. Per Capita Income— At Current Prices Rs. 2010-11 94,660 53,331At constant (2004-05) Prices Rs. 2010-11 59,221 35,993
3. Agriculture— (a) Total Cropped Area 000 Hect. 2008-09 65,00 1,95,104
Net area sown 000 Hect. 2008-09 35,76 1,41,364(b) Land Utilisation
(i). Forests Percentage to total area 2008-09 0.89 22.78(ii). Area not available for
cultivation ,, 2008-09 13.11 14.17
(iii). Other Uncultivated Land
,, 2008-09 1.67 8.67
(iv). Fallow Lands ,, 2008-09 2.52 8.13(v). Net Area sown ,, 2008-09 81.81 46.25
(c) Irrigated area (i). Gross irrigated area 000 Hect. 2008-09 55,44 88,419(ii). Percentage of gross irrigated
area to total cropped area Percent 2008-09 85,29 45,32
(iii). Net area irrigated 000 Hect. 2008-09 28.77 63,196(iv). Percentage of net irrigated area
to net area sown Percent 2008-09 80.45 44.70
(d) Area under Wheat 000 Hect. 2009-10 24,88 28,457(e) Production of Wheat 000 M.T. 2009-10 10,488 80,804(f) Yield rate of Wheat Kg./Hect. 2009-10 4,215 2,839(g) Livestock population Lakh Nos. 2007 Census 91 52.97
P—Provisional Estimates. Q—Quick Estimates

796
MISCELLANEOUS Comparative Statistics of Haryana and India
No.35.31 (Concld.) Magnitude
Item Unit Ref. Year Haryana India
1 2 3 4 5 4. Education—
(a) Literacy rate Percentage 2011 Census 76.4 74.4(b) No. of Schools and Colleges for General
Education
(i). Primary/Pre-Primary 000Nos. 2009-10 7 8,23(ii). Middle 000Nos. 2009-10 3 3,00(iii). High & Sr. Secondary 000Nos. 2009-10 6 1,65(iv). Colleges (Art, Science and Commerce) Nos. 2009-10 168 11,458
(c) Enrolment (i). Primary (I—V) 000Nos. 2009-10 21,97 13,35,26(ii). Middle (VI—VIII) 000Nos. 2009-10 12,44 5,43,60(iii). High & Sr. Secondary 000Nos. 2009-10 9,68 3,94,43(iv). Colleges (General Higher Education) 000Nos. 2009-10 3,53 1,55,53
5. Banking — (a) Scheduled Commercial Bank Office Nos. March,2011 262.3 89,110(b) Deposits Crores Rs. March,2011 1,297.21 54,26,510(c) Credits Crores Rs. March,2011 92,773 40,76,868
6. Power— (a) Electricity Generated** M.K.W.H. 2008-09 17,531 7,41,167(b) Total Consumption M.K.W.H. 2008-09 19,291 5,27,564(c) No. of villages electrified 000 Nos. 31-3-09 7 496(d) Annual per Capita Con-sumption of Electricity
(utilities only) K.W.H. 2008-09 784 457
** Including share from jointly owned projects.
797
SECTION XXXVI SELECTED INDICATORS

798

799
SELECTED INDICATORS
Decennial Population Growth Rate No. 36.1
1991-2001** Census 2001-2011** Census District Total Urban Rural Total Urban Rural
1 2 3 4 5 6 7 Ambala 25.78 24.92 28.48 12.06 41.32 (-)3.82
Panchkula 50.91 87.43 24.88 19.32 47.15 (-)2.99
Yamunanagar 29.19 41.92 19.02 16.56 20.30 14.30
Kurukshetra 23.32 39.82 25.04 16.81 29.43 12.35
Kaithal 21.02 52.09 8.94 13.39 28.45 9.77
Karnal 23.06 29.92 19.72 18.22 34.98 12.17
Panipat 38.58 87.06 23.06 24.33 41.03 12.95
Sonipat 22.39 52.66 12.15 15.71 40.55 7.37
Rohtak 21.00 30.00 13.41 12.61 34.96 0.55
Jhajjar 23.06 96.20 12.73 8.73 24.54 4.23
Faridabad 48.56 70.22 28.10 31.75 34.53 22.00
Palwal * * * 25.49 48.18 20.11
Gurgaon 44.87 58.57 41.37 73.93 236.45 (-)15.82
Mewat * * * 37.94 109.13 32.16
Rewari 25.34 43.04 19.14 17.09 69.94 5.65
Mahendragarh 19.16 29.53 17.69 13.43 21.29 12.21
Bhiwani 22.49 37.56 22.42 14.32 19.30 13.16
Jind 21.36 45.93 18.89 11.95 25.81 8.42
Hisar 27.11 38.91 23.82 13.38 38.91 4.46
Fatehabad 24.76 38.07 24.06 16.79 26.16 14.79
Sirsa 23.59 53.48 15.56 15.98 18.40 9.21
Haryana State 28.43 50.82 21.12 19.90 44.25 10.00*Districts were not in existence. Source :— Census Department, Haryana. ** According to the district boundaries as on 1-1-2000.

800
SELECTED INDICATORS Density of Population per Sq. Km.
No. 36.2 1991* Census 2001 Census District
Total Urban Rural Total Urban Rural 1 2 3 4 5 6 7
Ambala 512 4,134 346 644 5,165 437
Panchkula 346 2,414 234 522 4,525 305
Yamunanagar 456 3,248 315 589 4,610 385
Kurukshetra 437 2,519 351 540 3,521 415
Kaithal 337 1,422 296 408 2,162 342
Karnal 411 4,327 315 506 5,622 381
Panipat 551 3,939 402 763 7,369 474
Sonipat 493 3,238 406 603 4,943 466
Rohtak 445 6,563 307 539 8,532 358
Jhajjar 390 1,824 346 480 4,154 383
Faridabad 687 3,230 394 1,020 5,498 505
Gurgaon 414 2,168 344 612 3,438 495
Rewari 386 3,021 332 480 4,322 403
Mahendragarh 367 2,823 327 428 3,657 376
Bhiwani 243 3,821 205 298 5,256 255
Jind 363 5,083 305 440 7,417 355
Hisar 304 4,540 235 386 6,307 291
Fatehabad 255 3,485 217 318 4,812 265
Sirsa 211 1,868 171 261 2,868 197
Haryana State 372 4,194 287 478 4,776 350 Source :— Census Department, Haryana.
* Adjusted figures according to the boundaries of the districts as on 1-1-2000.

801
SELECTED INDICATORS Working Force** as Percentage to Total Population
No. 36.3 (Percentage)
1991 Census 2001 Census District Total Urban Rural Total Urban Rural
1 2 3 4 5 6 7 Ambala 27.95 26.77 28.60 31.99 32.64 31.64
Panchkula 31.42 31.91 31.15 38.13 33.58 41.79
Yamunanagar 27.87 27.57 28.02 32.31 29.51 34.00
Kurukshetra 28.73 27.30 29.18 37.36 30.00 39.96
Kaithal 31.11 27.95 31.66 39.32 30.01 41.56
Karnal 29.42 28.50 29.73 35.74 31.46 37.29
Panipat 30.17 30.25 30.14 39.57 36.13 41.91
Sonipat 32.09 27.15 33.30 40.89 29.84 44.59
Rohtak 30.27 27.67 31.50 39.47 29.91 44.63
Jhajjar 30.88 26.68 31.57 44.17 33.10 47.32
Faridabad 30.34 29.97 30.68 35.80 31.00 41.83
Gurgaon 32.06 28.05 33.08 37.92 32.14 39.58
Rewari 27.79 27.99 27.75 43.59 30.14 46.50
Mahendragarh 31.01 26.33 31.67 43.31 31.21 45.19
Bhiwani 32.47 26.52 33.71 42.76 30.39 45.65
Jind 32.42 26.87 33.57 43.87 30.46 47.28
Hisar 33.22 29.09 34.51 43.30 32.66 47.02
Fatehabad 32.32 28.06 33.13 45.03 31.09 48.01
Sirsa 34.45 28.61 36.02 42.59 32.06 46.34
Haryana State 31.00 28.32 31.87 39.62 31.49 42.93 Source :— Census Department, Haryana.
**Main and Marginal workers.

802
SELECTED INDICATORS Percentage of Cultivators, Agricultural Labourers, Agricultural Workers and Non-
Agricultural Workers to Total Working Force No. 36.4
(Percentage) Cultivators Agricultural Labourers Agricultural
Workers Non-Agricultural
Workers District 1991 2001 1991 2001 1991 2001 1991 2001
1 2 3 4 5 6 7 8 9 Ambala 21.43 16.34 19.21 13.03 40.64 29.36 59.36 70.64
Panchkula 20.75 16.88 8.66 6.08 29.41 22.97 70.59 77.03
Yamunanagar 25.33 17.44 23.64 16.19 48.97 33.63 51.03 66.37
Kurukshetra 31.82 23.70 26.97 22.73 58.79 46.43 41.21 53.57
Kaithal 43.93 40.28 23.02 22.57 66.94 62.84 33.06 37.16
Karnal 30.84 26.57 28.24 23.70 59.08 50.27 40.92 49.73
Panipat 28.24 23.38 18.27 14.38 46.51 37.76 53.49 62.24
Sonipat 34.65 36.26 17.54 16.71 52.19 52.97 47.81 47.03
Rohtak 35.41 38.62 14.99 12.25 50.40 50.87 49.60 49.13
Jhajjar 42.14 45.63 12.97 11.54 55.12 57.17 44.88 42.83
Faridabad 24.91 23.72 11.00 10.46 35.91 34.18 64.09 65.82
Gurgaon 34.76 31.09 11.88 9.20 46.64 40.29 53.36 59.71
Rewari 36.57 44.43 10.73 13.32 47.30 57.75 52.70 42.25
Mahendragarh 40.08 54.71 8.45 11.08 48.53 65.80 51.47 34.20
Bhiwani 47.01 52.40 11.09 11.50 58.10 63.90 41.90 36.10
Jind 45.06 50.02 18.15 16.43 63.21 66.45 36.79 33.55
Hisar 43.87 43.53 18.76 15.15 62.62 58.67 37.38 41.33
Fatehabad 42.63 44.46 26.70 22.85 69.33 67.31 30.67 32.69
Sirsa 38.16 37.43 24.77 23.84 62.93 61.26 37.07 38.74
Haryana State 35.85 36.03 17.57 15.26 53.42 51.29 46.58 48.71Source :— Census Department, Haryana.
Note : — 1.Total working force includes Main and Marginal Workers. 2. Agricultural Workers include Cultivators and Agricultural Labourers.

803
SELECTED INDICATORS Position of Weaker Sections in Haryana
No. 36.5
Scheduled Castes as percentage to total Population
Agricultural Labourers as percentage to total Agricultural
Workers District
1991 2001 1991 2001 1 2 3 4 5
Ambala 25.18 25.09 47.27 44.36Panchkula 17.52 15.51 29.45 26.51Yamunanagar 24.96 24.53 48.28 48.13Kurukshetra 19.77 20.52 45.88 48.96Kaithal 21.44 21.55 34.39 35.91Karnal 20.64 20.99 47.80 47.14Panipat 16.45 15.79 39.29 38.08Sonipat 18.17 18.09 33.61 31.54Rohtak 18.75 19.10 29.74 24.08Jhajjar 17.77 17.79 23.54 20.18Faridabad 16.06 14.16 30.64 30.60Gurgaon 13.59 11.32 25.48 22.83Rewari 19.30 18.87 22.69 23.07Mahendragarh 15.46 16.32 17.42 16.85Bhiwani 18.97 19.61 19.09 18.00Jind 19.56 19.82 28.72 24.72Hisar 21.36 21.99 29.95 25.81Fatehabad 26.70 27.43 38.51 33.95Sirsa 26.65 26.65 39.36 38.91Haryana State 19.75 19.35 32.89 29.76
Source :— Census Department, Haryana.

804
SELECTED INDICATORS Number of Workers per lakh of population employed in Registered Factories
No. 36.6 Year/District Number of workers per lakh of population
1 2 1966 7991967 8141970 9001975 9761980 1,3691985 1,5451990 1,6671995 2,3922000 2,4932005 2,7172008 3,3202009 3,5062010(P) 3,086Ambala 1,336Panchkula 2,194Yamunanagar 3,367Kurukshetra 405Kaithal 253Karnal 1,887Panipat 4,102Sonipat 2,779Rohtak 1676Jhajjar 2,694Faridabad 1,165Palwal 434Gurgaon 1652Mewat 110Rewari 2,931Mahendragarh 461Bhiwani 797Jind 987Hisar 763Fatehabad 409Sirsa 529
Source :— Labour Commissioner, Haryana. *Based on estimated population of census 2011. P—Provisional.

805
SELECTED INDICATORS Percentage of Area Sown more than once to Net Area Sown
No. 36.7
Year/District Percentage of area sown more than
once to net area sown1 2 1966-67 34.41970-71 39.01975-76 50.41980-81 51.61985-86 55.01990-91 65.61995-96 66.62000-01 73.42005-06 82.52008-09 81.82009-10(P) 78.9Ambala 56.8Panchkula 62.5Yamunanagar 72.8Kurukshetra 88.0Kaithal 88.1Karnal 97.5Panipat 98.9Sonipat 94.1Rohtak 60.0Jhajjar 41.7Faridabad 86.5Palwal 82.7Gurgaon 39.3Mewat 61.7Rewari 51.6Mahendragarh 77.5Bhiwani 92.5Jind 96.2Hisar 82.5Fatehabad 85.3Sirsa 73.7P—Provisional Source :— Director of Land Records, Haryana.

806
SELECTED INDICATORS Percentage of Gross Area Irrigated to Gross Area Sown
No. 36.8 Year/District Percentage of gross area irrigated
to gross area sown1 2
1966-67 37.71970-71 45.01975-76 50.11980-81 60.61985-86 65.71990-91 71.61995-96 78.22000-01 85.42004-05 84.62005-06 83.82008-09 85.32009-10(P) 87.3Ambala 91.3Panchkula 64.1Yamunanagar 93.5Kurukshetra 100.0Kaithal 99.7Karnal 99.7Panipat 100.0Sonipat 98.3Rohtak 87.5Jhajjar 81.9Faridabad 100.0Palwal 94.7Gurgaon 88.9Mewat 59.0Rewari 78.1Mahendragarh 56.3Bhiwani 56.4Jind 95.1Hisar 89.1Fatehabad 98.3Sirsa 96.5P—Provisional Source :— Director of Land Records, Haryana.

807
SELECTED INDICATORS
Percentage of Gross Area Sown Under Foodgrain Crops to Total Cropped Area No. 36.9
District 1970-71 1975-
76 1980-
81 1985-
86 1990-
91 1995-
96 2000-
01 2005-
06 2008-
09 2009-10
1 2 3 4 5 6 7 8 9 10 11 Ambala 75.11 72.22 73.09 70.18 77.58 74.59 57.92 78.15 82.09 83.82Panchkula * * * * * 77.65 84.10 76.60 83.19 84.10Yamunanagar * * * * 61.54 59.74 64.45 67.12 75.40 75.88Kurukshetra * 80.97 83.51 84.02 82.94 79.66 84.73 81.73 86.72 82.40Kaithal * * * * 83.91 85.57 89.26 88.89 88.88 89.87Karnal 80.15 77.67 80.89 83.24 85.91 87.73 87.15 87.46 87.80 88.87Panipat * * * * 81.18 82.39 82.50 84.13 87.38 87.25Sonipat * 77.44 78.56 78.15 79.38 82.28 84.63 81.48 87.31 87.64Rohtak 82.00 82.37 78.32 75.37 68.68 70.45 77.49 70.54 83.22 84.46Jhajjar * * * * * * 81.65 67.83 79.45 79.57Faridabad * * 81.23 75.74 72.72 77.70 77.25 71.37 72.75 73.68Palwal * * * * * * * * 73.89 76.63Gurgaon 82.79 84.19 81.36 75.74 67.86 70.51 78.27 70.41 78.43 80.00Mewat * * * * * * * 65.05 65.99 68.44Rewari * * * * 61.81 53.15 61.64 51.71 57.61 58.39Mahendragarh 84.84 86.24 80.86 77.83 69.09 53.37 58.69 52.93 62.29 55.30Bhiwani * 85.51 73.56 78.04 75.40 67.55 66.08 56.83 59.38 60.03Jind 79.94 77.77 74.85 76.54 69.26 69.09 78.27 74.64 80.64 79.36Hisar 71.10 65.09 54.61 54.70 54.83 55.82 56.45 52.37 57.27 56.50Fatehabad * * * * * * 61.89 63.29 66.18 67.54Sirsa * 64.45 57.46 54.93 52.61 46.88 48.61 45.27 50.75 52.77Haryana State 78.03 77.26 77.55 72.19 68.92 67.30 71.03 66.24 71.09 71.51 Source :— Director of Land Records, Haryana. P— Provisional *Districts were not in existence.

808
SELECTED INDICATORS
Percentage of Gross Area Sown Under Commercial Crops to Total Cropped Area No. 36.10
District 1970-71 1980-81 1985-86 1990-91 1995-96 2000-01 2005-06 2008-09 2009-10 1 2 3 4 5 6 7 8 9 10
Ambala 11.58 13.38 14.07 7.39 10.89 9.25 10.28 6.60 5.60Panchkula * * * * 7.22 6.67 9.57 6.81 8.21Yamunanagar * * * 25.38 26.23 23.87 21.46 14.60 13.38Kurukshetra * 6.09 5.55 5.68 9.94 6.34 7.56 6.28 7.14Kaithal * * * 5.14 4.76 2.15 1.90 3.74 1.87Karnal 8.37 5.32 4.43 3.45 3.28 3.01 3.32 2.81 2.44Panipat * * * 5.01 4.40 3.42 4.51 2.30 2.80Sonipat * 9.35 9.35 7.65 8.08 4.77 7.32 2.76 2.36Rohtak 9.52 9.09 14.33 21.47 23.88 17.30 24.22 15.59 11.96Jhajjar * * * * * 11.87 25.83 16.77 15.09Faridabad * 6.31 9.11 11.07 7.96 4.57 4.89 2.61 2.35Palwal * * * * * * * 3.90 3.00Gurgaon 7.21 7.10 12.11 21.06 21.25 11.20 20.08 12.78 12.48Mewat * * * * * * 19.09 17.62 16.59Rewari * * * 26.86 39.92 29.84 42.18 34.57 34.38Mahendragarh 2.71 6.38 11.40 21.07 41.50 29.89 40.69 37.55 35.56Bhiwani * 12.35 8.73 13.61 25.30 2.31 30.85 28.42 24.57Jind 9.88 10.65 12.86 16.14 21.51 10.97 14.89 34.37 11.24Hisar 14.66 29.90 30.97 33.20 35.93 3.27 35.40 80.59 31.24Fatehabad * * * * * 3.00 27.09 91.58 23.01Sirsa * 27.63 30.26 35.86 44.14 3.81 38.71 111.10 34.55Haryana State 10.15 13.96 15.08 19.15 23.62 18.31 22.36 38.19 17.58 Source :—Director of Land Records, Haryana. P—Provisional *Districts were not in existence. Note :— Commercial Crops include oil-seeds, cotton, sugarcane, tobacoo, chillies and other condiments and spices.

809
SELECTED INDICATORS Percentage of Net Area Irrigated to Net Area Sown
No. 36.11
District 1966-
67 1970-
71 1975-
76 1980-81 1985-
86 1990-
91 1995-
96 2000-
01 2005-06 2008-
09 2009-10(P)
1 2 3 4 5 6 7 8 9 10 11 12 Ambala 13.4 21.1 30.6 40.6 46.6 56.8 76.1 90.4 89.6 86.3 85.6Panchkula * * * * * * 40.5 45.5 20.8 33.3 66.7Yamunanagar * * * * * 72.6 79.8 87.2 88.7 100.0 92.00Kurukshetra * * 71.4 76.2 94.3 95.9 99.3 99.3 100.7 100.7 100.7Kaithal * * * * * 98.4 98.5 99.5 99.0 99.5 99.5Karnal 45.2 70.4 75.0 89.5 91.6 98.6 100.0 98.9 99.5 98.9 100.0Panipat * * * * * 97.3 98.9 98.9 100.0 100.0 100.0Sonipat * * 69.4 73.0 77.2 99.1 98.8 100.0 97.3 96.1 99.3Rohtak 42.9 43.9 51.7 59.8 59.1 69.1 68.7 89.4 93.0 76.1 80.0Jhajjar * * * * * * * 82.2 65.2 75.5 74.2Faridabad * * * 47.9 55.2 50.2 74.2 76.3 84.8 97.3 97.3Palwal * * * * * * * * * 85.6 90.4Gurgaon 26.9 32.2 31.7 38.3 39.2 51.8 32.3 42.6 76.5 92.8 84.5Mewat * * * * * * * * 59.6 63.6 62.6Rewari * * * * * 72.3 72.6 82.9 87.9 75.2 86.5Mahendragarh 10.5 11.4 16.9 31.4 26.5 43.9 65.4 78.4 22.4 80.8 83.4Bhiwani * * 21.3 31.7 31.6 39.8 55.0 55.0 71.1 31.0 54.5Jind 42.4 46.1 59.2 66.8 78.9 95.5 88.0 94.4 94.9 88.3 97.1Hisar 45.6 43.6 67.1 65.0 69.8 80.3 77.2 86.9 72.5 70.2 80.4Fatehabad * * * * * * * 96.3 94.2 94.6 99.1Sirsa * * 41.7 72.6 62.9 71.4 82.3 90.2 86.0 86.8 93.9Haryana State 37.3 43.0 48.4 59.2 62.2 72.7 77.0 83.9 82.3 80.5 86.4 Source :— Director of Land Records, Haryana. P— Provisional *Districts were not in existence.

810
SELECTED INDICATORS Gross Value from Agriculture per hectare at Current Prices
No. 36.12 (In `) District 1970-71 1975-76 1980-81 1985-86 1990-91
1 2 3 4 5 6 Ambala 1,629 3,125 5,641 9,155 15,303
Panchkula * * * * *
Yamunanagar * * * * 19,799
Kurukshetra * 3,966 7,620 11,054 20,917
Kaithal * * * * 16,451
Karnal 2,260 3,688 7,032 11,763 23,768
Panipat * * * * 16,191
Sonipat * 2,930 5,671 8,289 16,050
Rohtak 1,698 2,041 3,968 5,317 11,585
Jhajjar * * * * *
Faridabad * * 4,323 6,382 12,289
Palwal * * * * *
Gurgaon 1,114 1,947 4,141 5,510 11,297
Mewat * * * * *
Rewari * * * * 13,121
Mahendragarh 745 1,510 2,841 4,489 11,024
Bhiwani * 1,394 2,783 4,421 9,781
Jind 1,419 2,293 4,956 8,567 15,506
Hisar 1,306 2,318 4,476 7,196 16,199
Fatehabad * * * * *
Sirsa * 1,954 3,722 6,035 13,866
Haryana State 1,491 2,389 4,696 7,327 14,574

811
SELECTED INDICATORS Gross Value from Agriculture per hectare at Current Prices
No. 36.12 (Concld.) (In `) District 1995-96 2000-01 2005-06 2007-08 (P) 2008-09 (P)
1 7 8 9 10 11 Ambala 27,953 43,903 59,597 88,571 93,581
Panchkula 15,875 28,315 66,046 80,667 89,973
Yamunanagar 34,449 49,922 67,493 100,981 114,343
Kurukshetra 38,482 56,248 71,887 99,926 102,411
Kaithal 33,430 50,537 75,685 96,651 105,772
Karnal 34,951 64,805 88,003 136,073 144,778
Panipat 33,571 61,861 81,319 118,729 147,102
Sonipat 28,977 42,766 76,851 116,203 117,911
Rohtak 17,405 32,709 41,181 58,292 71,397
Jhajjar * 29,608 35,364 50,748 58,946
Faridabad 22,562 40,613 55,886 90,414 126,166
Palwal * * * * 94,447
Gurgaon 19,254 31,787 37,929 87,484 97,898
Mewat * * 39,529 61,455 72,071
Rewari 18,868 31,075 36,589 51,521 62,363
Mahendragarh 18,742 27,063 33,147 45,350 56,437
Bhiwani 17,244 24,246 34,480 50,540 60,874
Jind 23,589 43,415 62,393 83,600 115,548
Hisar 27,186 43,260 45,043 73,764 92,785
Fatehabad * 50,672 58,294 96,350 111,151
Sirsa 29,248 42,290 50,660 77,967 91,110
Haryana State 25,718 41,323 53,998 80,924 93,906 Source :— Department of Economic and Statistical Analysis, Haryana.
*Districts were not in existence. P— Provisional

812
SELECTED INDICATORS Gross Value of Agricultural Output Per Capita (Rural) At current prices
No. 36.13 (In `)
District 1970-71 1975-76 1980-
81 1985-
86 1990-
91 1995-96 2000-01 2005-06 2007-08
(P) 2008-
09 (P)
1 2 3 4 5 6 7 8 9 10 11 Ambala 527 933 1,485 2,024 3,104 5,629 8,430 11,076 15,533 16,126Panchkula * * * * * 2,824 3,650 5,485 6,389 6,938Yamunanagar * * * * 4,578 8,075 10,685 12,529 18,652 20,238Kurukshetra * 1,588 2,543 3,434 5,960 10,450 13,923 16,094 21,201 21,597Kaithal * * * * 5,053 9,558 13,152 18,331 22,702 24,244Karnal 884 1,231 2,332 3,522 5,734 8,278 13,198 17,222 25,189 25,257Panipat * * * * 4,133 6,547 10,129 11,690 17,322 20,819Sonipat * 775 1,247 1,793 2,949 5,809 7,895 10,800 16,404 16,534Rohtak 563 691 1,165 1,406 3,053 4,474 7,611 8,754 12,299 14,355Jhajjar * * * * * * 6,301 7,531 12,216 15,839Faridabad * * 1,219 1,562 2,540 4,564 6,783 7,545 11,500 13,935Palwal * * * * * * * * * 12,232Gurgaon 383 565 987 1,317 2,239 3,449 4,713 5,995 11,306 12,251Mewat * * * * * * * 5,557 7,763 9,019Rewari * * * * 3,180 4,344 6,135 6,585 9,143 10,840Mahendragarh 351 516 889 1,227 2,879 4,568 5,932 6,459 8,748 10,746Bhiwani * 895 1,465 1,951 4,117 5,965 8,470 10,756 15,239 17,654Jind 625 915 1,679 2,332 4,180 6,657 11,534 14,032 18,198 25,341Hisar 861 1,112 2,057 2,941 6,134 8,890 11,170 11,288 19,349 23,884Fatehabad * * * * * * 16,814 18,017 28,752 32,452Sirsa * 1,534 2,631 3,695 7,261 15,343 19,218 22,146 33,462 38,390Haryana State 643 950 1,675 2,300 4,199 7,056 9,838 11,707 17,146 19,540
Source :— Department of Economic and Statistical Analysis, Haryana. *Districts were not in existence. P—Provisional

813
SELECTED INDICATORS Foodgrains as Percentage of Gross Value of Agricultural Output—At current prices
No. 36.14 (Percentage)
District 1970-71 1975-76 1980-81 1985-86 1990-91 1995-96 2000-01 2005-06 2007-
08(P) 2008-09(P)
1 2 3 4 5 6 7 8 9 10 11 Ambala 57.65 50.36 50.09 46.60 64.83 62.71 67.65 59.31 63.70 64.70Panchkula * * * * * 62.69 54.76 32.70 41.07 44.29Yamunanagar * * * * 42.18 42.97 47.43 29.60 49.50 52.10Kurukshetra * 69.19 30.07 22.80 68.84 72.57 76.71 68.73 71.13 71.43Kaithal * * * * 77.20 79.77 83.12 85.47 82.51 81.88Karnal 74.00 62.98 33.54 22.53 78.36 78.48 78.07 77.56 80.59 75.88Panipat * * * * 68.90 75.00 73.82 68.34 67.99 76.59Sonipat * 52.19 48.39 40.56 57.51 67.15 63.52 63.17 69.33 68.00Rohtak 64.01 53.99 49.78 41.57 46.79 50.93 57.58 52.85 58.95 66.68Jhajjar * * * * * * 66.87 55.66 61.19 62.62Faridabad * * 40.95 36.13 49.81 61.48 62.21 56.29 60.24 45.77Palwal * * * * * * * * * 70.63Gurgaon 71.02 65.13 45.41 39.87 44.28 50.50 56.20 43.33 36.58 36.09Mewat * * * * * * * 48.66 52.43 47.39Rewari * * * * 46.09 35.40 45.72 38.08 42.34 41.79Mahendragarh 66.97 72.04 38.12 40.67 43.75 35.00 41.60 38.24 43.87 45.15Bhiwani * 67.96 47.88 43.99 52.47 46.93 48.34 37.16 44.25 50.33Jind 63.29 62.82 41.39 35.29 56.08 62.16 73.33 68.94 64.90 74.49Hisar 52.72 48.89 60.70 50.87 41.01 44.61 50.74 49.31 49.50 54.10Fatehabad * * * * * * 57.61 57.76 60.62 60.25Sirsa * 49.45 48.01 71.56 40.66 36.57 46.57 40.46 45.60 49.17Haryana State 63.79 59.17 44.33 37.66 53.60 55.20 61.38 56.95 59.72 61.60
Source :— Department of Economic and Statistical Analysis, Haryana. *Districts were not in existence. P-Provisional

814
SELECTED INDICATORS Non-Foodgrains as Percentage of Gross Value of Agricultural Output At current prices
No. 36.15 (Percentage)
District 1970-71 1975-76 1980-81 1985-86 1990-91 1995-96 2000-01 2005-06 2007-08
(P) 2008-09
(P) 1 2 3 4 5 6 7 8 9 10 11
Ambala 42.35 49.64 49.91 53.40 35.17 37.29 32.35 40.69 36.30 35.30Panchkula * * * * * 37.31 45.24 67.30 58.93 55.71Yamunanagar * * * * 57.82 57.03 52.57 70.40 50.50 47.90Kurukshetra * 30.81 69.93 77.20 31.16 27.43 23.29 31.27 28.87 28.57Kaithal * * * * 22.80 20.23 16.88 14.53 17.49 18.12Karnal 26.00 37.02 66.46 77.47 21.64 21.52 21.93 22.44 19.41 24.12Panipat * * * * 31.10 25.00 26.18 31.66 32.01 23.41Sonipat * 47.81 51.61 58.44 42.49 32.85 36.48 36.83 30.67 32.00Rohtak 35.99 46.01 50.22 58.43 53.21 49.07 42.42 47.15 41.05 33.32Jhajjar * * * * * * 33.13 44.34 38.81 37.38Faridabad * * 59.05 63.87 50.19 38.52 37.79 43.71 39.76 54.23Palwal * * * * * * * * * 29.37Gurgaon 28.98 34.87 54.59 60.13 55.72 49.50 43.80 56.67 63.42 63.91Mewat * * * * * * * 51.34 47.57 52.61Rewari * * * * 53.91 64.60 54.28 61.92 57.66 58.21Mahendragarh 33.03 27.96 61.88 59.33 56.25 65.00 58.40 61.76 56.13 54.85Bhiwani * 32.04 52.12 56.01 47.53 53.07 51.66 62.84 55.75 49.67Jind 36.71 37.18 58.61 64.71 43.92 37.84 26.67 31.06 35.10 25.51Hisar 47.28 51.11 39.30 49.13 58.99 55.39 49.26 50.69 50.50 45.90Fatehabad * * * * * * 42.39 42.24 39.38 39.75Sirsa * 50.55 51.99 28.44 59.34 63.43 53.43 59.54 54.40 50.83Haryana State 36.21 40.83 55.67 62.34 46.40 44.80 38.62 43.05 40.28 38.40
Source :— Department of Economic and Statistical Analysis, Haryana. *Districts were not in existence. P—Provisional

815
SELECTED INDICATORS Fertilizer Consumption in terms of Nutrients
No. 36.16 (In Tonnes) District 1966-67 1970-71 1975-76 1980-81 1985-86 1990-91
1 2 3 4 5 6 7 Ambala 1,938 9,780 12,053 29,735 39,479 28,533Panchkula * * * * * *Yamunanagar * * * * * 26,275Kurukshetra * * 22,821 49,864 72,368 48,299Kaithal * * * * * 55,976Karnal 4,484 31,410 17,867 51,118 66,849 50,172Panipat * * * * * 44,282Sonipat * * 4,668 11,589 20,251 19,656Rohtak 1,837 5,584 4,279 8,553 19,348 27,533Jhajjar * * * * * *Faridabad * * * 7,142 12,476 20,889Palwal * * * * * *Gurgaon 1,443 5,278 4,943 4,255 8,078 12,274Mewat * * * * * *Rewari * * * * * 12,074Mahendragarh 424 1,122 4,182 5,059 10,495 13,791Bhiwani * * 1,018 2,591 5,344 12,497Jind 318 3,064 4,955 14,052 25,139 45,394Hisar 2,903 13,822 9,848 23,122 45,894 97,828Fatehabad * * * * * *Sirsa * * 10,281 23,743 46,466 70,819Haryana State 13,347 70,060 96,915 2,30,823 3,72,187 5,86,292

816
SELECTED INDICATORS Fertilizer Consumption in terms of Nutrients
No. 36.16 (Concld.) (In Tonnes) District 1995-96 2000-01 2005-06 2009-10 2010-11 (P)
1 8 9 10 11 12 Ambala 29,813 32,464 46,597 55,540 56,155
Panchkula * 5,092 6,645 7,275 5,101
Yamunanagar 33,768 44,858 59,467 76,483 70,391
Kurukshetra 52,946 64,714 76,664 101,197 97,309
Kaithal 56,766 74,733 81,921 84,678 85,273
Karnal 74,812 120,976 131,548 120,658 116,216
Panipat 32,469 45,540 60,190 43,731 47,982
Sonipat 49,297 67,451 75,374 86,031 86,560
Rohtak 43,733 31,260 38,106 55,467 56,179
Jhajjar * 19,128 25,944 19,578 20,841
Faridabad 30,096 34,655 53,756 31,805 18,442
Palwal * * * 53,429 60,443
Gurgaon 23,821 25,694 30,401 16,714 16,647
Mewat * * * 24,688 22,547
Rewari 18,291 20,389 27,261 50,841 45,960
Mahendragarh 21,820 24,882 26,521 25,608 31,877
Bhiwani 22,025 33,724 43,300 55,396 59,063
Jind 37,136 62,250 77,554 101,856 102,503
Hisar 111,317 63,906 84,474 108,190 112,000
Fatehabad * 62,032 75,991 98,509 103,536
Sirsa 85,677 96,547 106,957 138,014 142,597
Haryana State 723,787 930,295 1,128,671 1,355,688 1357,622 Source :— Director of Agriculture, Haryana.
*Districts were not in existence. P— Provisional

817
SELECTED INDICATORS
Per Capita Value Added by Manufacturing (Regd.) (at current prices) No. 36.17 (In `) District 1970-71 1975-76 1980-81 1985-86 1990-91 1995-96 2000-01 2003-04
1 2 3 4 5 6 7 8 9 Ambala 111.80 282.21 337.64 618.23 962.52 337.72 429.95 969.64Panchkula * * * * * 4,675.20 2,417.79 2,460.24Yamunanagar * * * * 2,120.06 1,985.49 1,933.37 3,306.23Kurukshetra * 7.91 23.31 52.13 204.28 374.22 555.85 771.74Kaithal * * * * 51.63 341.92 250.05 329.29Karnal 7.42 34.95 29.78 393.85 611.43 735.12 1,580.70 2,439.88Panipat * * * * 1,080.24 669.51 2,177.67 3,561.63Sonipat * 97.69 318.09 462.58 1,025.92 1,122.25 1,121.31 3,739.16Rohtak 33.01 53.58 57.68 308.37 273.87 2,340.09 1,989.60 1,370.15Jhajjar * * * * * * 4,434.36 6,069.43Faridabad * * 1,860.48 2,641.58 3,599.48 5,899.44 9,213.58 11,226.79Gurgaon 198.62 972.91 80.05 692.37 1,636.29 11,460.65 13,214.40 32,459.93Rewari * * * * 1,087.80 3,030.43 6,603.69 14,803.62Mahendragarh 1.82 2.46 9.99 155.84 456.27 0.54 — —Bhiwani * 38.66 103.85 158.51 261.88 295.69 462.56 330.76Jind 0.52 1.01 26.95 92.23 193.40 213.53 179.42 259.31Hisar 22.20 26.54 71.87 118.23 160.29 1,412.53 3,361.01 5,764.95Fatehabad * * * * * * 665.54 536.26Sirsa * 20.16 27.98 14.60 169.08 134.61 383.48 240.86Haryana State 58.23 117.82 238.14 468.96 900.02 2,151.13 3,296.25 5,925.94P— Provisional Source :— Department of Economic and Statistical Analysis, Haryana. *Districts were not in existence.
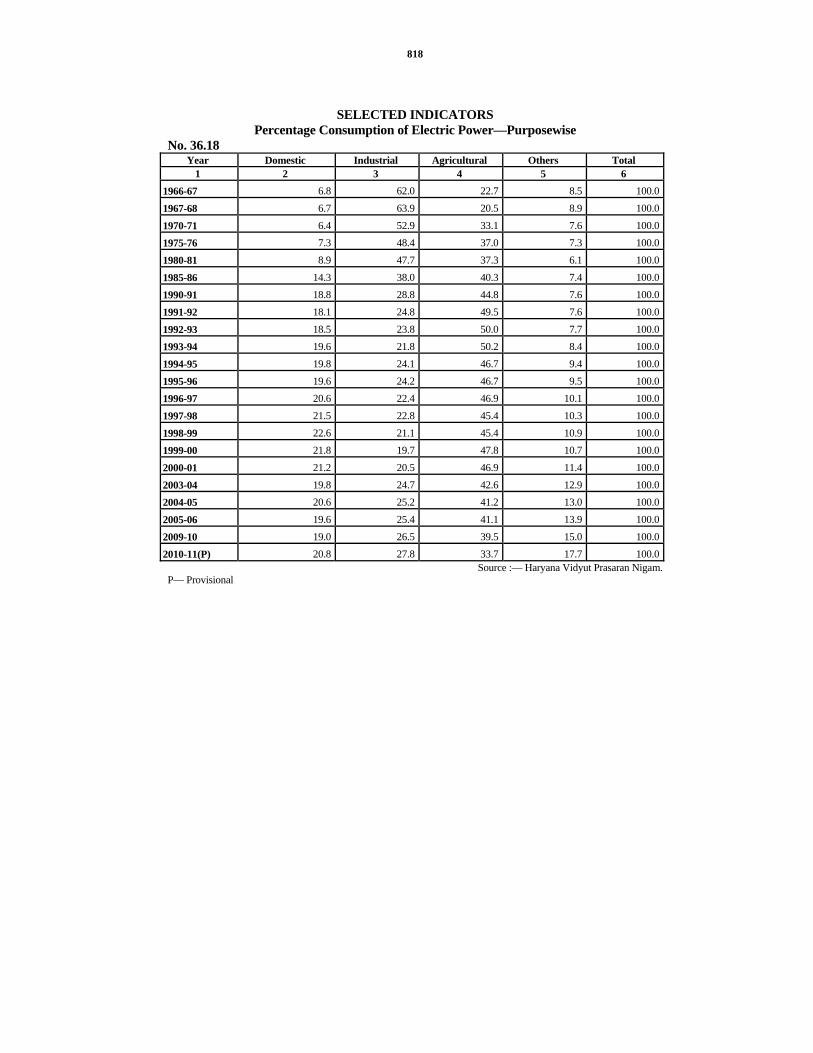
818
SELECTED INDICATORS Percentage Consumption of Electric Power—Purposewise
No. 36.18 Year Domestic Industrial Agricultural Others Total
1 2 3 4 5 6 1966-67 6.8 62.0 22.7 8.5 100.0
1967-68 6.7 63.9 20.5 8.9 100.0
1970-71 6.4 52.9 33.1 7.6 100.0
1975-76 7.3 48.4 37.0 7.3 100.0
1980-81 8.9 47.7 37.3 6.1 100.0
1985-86 14.3 38.0 40.3 7.4 100.0
1990-91 18.8 28.8 44.8 7.6 100.0
1991-92 18.1 24.8 49.5 7.6 100.0
1992-93 18.5 23.8 50.0 7.7 100.0
1993-94 19.6 21.8 50.2 8.4 100.0
1994-95 19.8 24.1 46.7 9.4 100.0
1995-96 19.6 24.2 46.7 9.5 100.0
1996-97 20.6 22.4 46.9 10.1 100.0
1997-98 21.5 22.8 45.4 10.3 100.0
1998-99 22.6 21.1 45.4 10.9 100.0
1999-00 21.8 19.7 47.8 10.7 100.0
2000-01 21.2 20.5 46.9 11.4 100.0
2003-04 19.8 24.7 42.6 12.9 100.0
2004-05 20.6 25.2 41.2 13.0 100.0
2005-06 19.6 25.4 41.1 13.9 100.0
2009-10 19.0 26.5 39.5 15.0 100.0
2010-11(P) 20.8 27.8 33.7 17.7 100.0Source :— Haryana Vidyut Prasaran Nigam.
P— Provisional

819
SELECTED INDICATORS Metalled (Surfaced) Roads per 100 sq. Kms. of Area
No. 36.19 (Kilometre)
District 1966-
67 1970-
71 1975-761980-81 1985-
86 1990-91 1995-96 2000-
01 2005-
06 2009-
10 2010- 11(P)
1 2 3 4 5 6 7 8 9 10 11 12 Ambala 14.18 17.20 40.28 49.63 57.36 67.59 66.04 69.44 70.52 76.49 80.37
Panchkula * * * * * * * 62.36 69.15 63.14 66.93
Yamunanagar * * * * * 52.33 60.48 61.26 65.38 65.78 66.57
Kurukshetra * * 34.14 46.28 54.00 78.88 82.25 65.88 63.39 73.66 76.93
Kaithal * * * * * 42.77 44.09 54.16 54.34 64.78 77.94
Karnal 9.77 13.59 33.50 41.98 52.19 54.09 55.77 43.38 44.13 55.75 63.61
Panipat * * * * * 58.04 58.95 82.18 76.74 58.43 70.82
Sonipat * * 36.55 42.88 46.73 53.72 74.30 49.06 53.35 58.34 66.78
Rohtak 13.29 21.31 32.86 38.30 41.63 43.10 41.08 54.33 46.36 54.84 58.40
Jhajjar * * * * * * * 48.26 50.22 59.92 72.46
Faridabad * * * 44.74 54.50 54.87 56.63 56.21 54.49 69.86 71.47
Palwal * * * * * * * * * * 60.82
Gurgaon 15.28 21.86 41.30 50.22 54.82 60.33 61.27 61.32 60.10 55.58 57.17
Mewat * * * * * * * * * 41.47 50.99
Rewari * * * * * 61.39 62.54 62.20 61.54 61.66 63.61
Mahendragarh 11.97 18.11 39.86 47.34 50.60 54.49 56.09 50.83 49.82 53.34 54.34
Bhiwani * * 31.30 35.99 36.69 37.88 37.28 41.54 42.11 48.61 50.79
Jind 9.14 10.33 30.93 32.37 36.57 40.13 41.56 42.52 43.23 38.37 41.41
Hisar 9.54 14.78 26.79 33.29 41.90 44.94 51.33 46.47 47.20 50.53 54.43
Fatehabad * * * * * * * 58.02 57.72 50.55 60.32
Sirsa * * 20.59 29.77 34.21 36.88 38.49 38.88 39.47 41.97 52.53
Haryana State 11.42 16.68 32.89 39.92 45.54 48.75 51.04 51.93 52.05 54.74 60.82 Source :—Department of Economic and Statistical Analysis, Haryana.
`*Districts were not in existence. P— Provisional

820
SELECTED INDICATORS Regulated Markets per Lakh Hectares of Net Area Sown
No. 36.20 District 1970-71 1980-81 1985-86 1990-91 1995-96 2000-01 2005-06 2008-09 2009-10
1 2 3 4 5 6 7 8 9 10 Ambala 2 5 5 6 5 6 5 5 5Panchkula * * * * 1 9 13 13 13Yamunanagar * * * 5 5 6 6 6 6Kurukshetra * 4 4 5 5 5 5 5 5Kaithal * * * 3 4 4 3 3 3Karnal 2 3 3 5 4 5 5 5 5Panipat * * * 3 6 5 5 5 5Sonipat * 2 2 2 1 2 2 2 2Rohtak 1 2 2 2 2 2 2 2 2Jhajjar * * * * * 1 1 1 1Faridabad * 2 3 3 3 3 5 5 5Palwal * * * * * * * 4 4Gurgaon 2 4 4 4 4 4 3 5 5Mewat * * * * * * * 4 4Rewari * * * 2 2 2 2 2 2Mahendragarh 2 2 2 3 3 3 3 3 3Bhiwani * 2 2 2 2 2 2 2 2Jind 3 3 3 3 2 2 3 3 3Hisar 1 2 2 2 2 2 2 2 2Fatehabad * * * * * 3 3 3 3Sirsa * 1 1 2 2 2 2 2 2Haryana State 2 2 3 3 3 3 3 3 3
Source :—Department of Economic and Statistical Analysis, Haryana. *Districts were not in existence.

821
SELECTED INDICATORS Percentage of School-going children
No. 36.21 Age Group 6—11 Age Group 11—14 Age Group 14—17
Year/District Boys Girls Total Boys Girls Total Boys Girls Total
1 2 3 4 5 6 7 8 9 10 1966-67 80.7 34.7 58.9 56.2 16.3 37.3 25.9 6.3 16.71967-68 80.7 34.4 58.7 61.9 18.3 41.2 26.7 7.4 17.61970-71 83.0 38.0 61.6 67.4 20.9 45.3 33.9 10.0 22.61975-76 91.4 47.4 70.5 65.2 23.0 45.2 38.2 12.3 26.01980-81 99.1 54.7 77.7 65.2 26.3 46.9 26.6 9.4 18.61985-86 99.8 71.5 86.2 72.5 35.8 55.3 24.8 10.4 18.11990-91 97.3 76.1 86.7 78.6 50.5 65.2 36.6 18.8 28.11995-96 95.2 88.6 92.6 70.4 55.4 63.3 32.9 19.8 27.42000-01 78.1 79.8 78.9 66.9 61.0 64.2 . . . . . .2001-02 75.96 76.95 76.42 65.13 58.65 62.11 . . . . . .2003-04 81.11 79.85 80.52 74.54 68.25 71.60 . . . . . .2004-05 89.9 89.9 87.4 88.7 80.43 73.70 77.28 . . . .Ambala 67.4 61.7 64.4 88.66 98.39 93.32 . . . . . . Panchkula 65.9 62.9 64.5 76.53 75.08 75.86 . . . . . .Yamunanagar 71.4 66.2 70.9 67.76 56.30 62.34 . . . . . .Kurukshetra 90.1 83.6 87.1 75.23 65.90 70.83 . . . . . .Kaithal 88.2 122.3 104.4 64.55 56.58 60.85 . . . . . .Karnal 92.1 83.2 87.7 76.29 80.87 78.44 . . . . . .Panipat 57.3 60.2 59.1 51.66 54.86 59.27 . . . . . .Sonipat 107.1 114.5 110.6 159.48 129.74 145.80 . . . . . .Rohtak 67.3 71.2 69.2 62.40 59.67 61.13 . . . . . .Jhajjar 43.2 95.3 94.2 69.52 73.24 71.24 . . . . . .Faridabad 125.1 113.6 119.7 85.24 74.39 80.28 . . . . . .Gurgaon 115.08 87.4 102.2 96.27 73.27 85.47 . . . . . .Rewari 71.9 66.2 79.0 76.88 78.02 77.43 . . . . . .Mahendragarh 110.8 108.8 109.8 64.75 72.64 68.54 . . . . . .Bhiwani 103.7 100.4 102.2 78.29 76.78 77.58 . . . . . .Jind 101.2 104.6 102.8 88.20 82.63 85.64 . . . . . .Hisar 68.2 70.0 69.1 88.81 74.28 82.08 . . . . . .Fatehabad 71.6 71.2 71.4 67.85 57.79 63.09 . . . . . .Sirsa 79.9 73.1 77.6 75.07 67.57 71.52 . . . . . .
Source :— Director Public Instructions, Haryana. Note :— Data of age group 14–17 is not available.

822
SELECTED Percentage of School-going Children in various Age Groups
No. 36.22 1980-81 1985-86 1990-91 1995-96
District 6— 11 11—14 14—17 6—
11 11—14 14—17 6— 11 11—14 14—
17 6— 11 11—14 14—
17 1 2 3 4 5 6 7 8 9 10 11 12 13
Ambala 75.2 53.4 19.4 90.2 60.7 19.5 83.6 63.6 30.1 59.2 46.7 17.3
Panchkula * * * * * * * * * * * *
Yamunanagar * * * * * * 83.5 69.1 23.9 79.0 60.2 30.2
Kurukshetra 81.6 42.6 14.7 80.8 45.9 15.4 107.6 66.2 24.2 85.4 62.1 28.7
Kaithal * * * * * * 80.5 69.1 23.2 113.2 55.2 21.2
Karnal 78.5 47.0 18.9 81.8 50.3 16.4 92.5 59.3 25.5 98.9 65.9 28.2
Panipat * * * * * * 82.2 53.7 23.0 78.8 48.0 23.6
Sonipat 85.5 50.9 25.0 91.8 70.2 26.3 103.9 78.2 34.9 139.0 97.1 36.3
Rohtak 83.0 57.3 21.6 93.8 67.6 21.6 71.5 79.6 35.2 84.0 63.5 27.7
Jhajjar * * * * * * * * * * * *
Faridabad 80.1 48.8 19.6 82.5 54.1 17.8 64.7 59.2 29.8 80.0 53.0 26.3
Gurgaon 78.4 46.0 17.1 90.4 57.6 17.2 111.4 62.4 30.7 89.0 62.9 23.0
Rewari * * * * * * 116.2 90.8 41.7 91.1 86.4 37.2
Mahendragarh 93.1 60.0 24.1 96.7 70.8 23.5 124.2 80.5 33.4 119.7 80.2 27.9
Bhiwani 78.9 45.4 18.1 94.1 58.1 18.8 78.2 77.7 35.6 100.8 76.2 30.3
Jind 63.6 36.5 16.1 85.1 46.5 15.5 88.8 66.9 24.1 99.9 64.5 21.0
Hisar 67.0 36.9 15.3 73.7 43.2 14.3 78.5 52.4 21.6 86.9 55.5 27.8
Fatehabad * * * * * * * * * * * *
Sirsa 70.2 33.0 12.3 77.7 39.5 11.4 80.7 44.6 16.3 83.9 46.8 21.2
Haryana State 77.7 46.9 18.6 86.2 55.3 18.1 86.7 65.2 28.1 92.6 63.3 27.4

823
SELECTED Percentage of School-going Children in various Age Groups
No. 36.22 (Contd.) 2000-01 2003-04 2004-05
District 6—11 11—14 14—17 6—11 11—14 14—17 6—11 11—14 14—17
1 14 15 16 17 18 19 20 21 22 Ambala 63.1 62.7 . . 63.70 64.18 . . 64.4 93.32 . .Panchkula 62.3 69.2 . . 66.71 76.86 . . 64.5 75.86 . .Yamunanagar 61.5 61.8 . . 60.50 64.97 . . 70.9 62.34 . .Kurukshetra 82.5 65.9 . . 80.87 73.44 . . 87.1 70.83 . .Kaithal 87.8 56.5 . . 82.34 50.80 . . 104.4 60.85 . .Karnal 73.3 63.8 . . 82.08 76.63 . . 87.7 78.44 . .Panipat 58.0 50.0 . . 50.30 47.61 . . 59.1 59.27 . .Sonipat 96.0 95.0 . . 104.35 141.92 . . 110.6 145.80 . .Rohtak 65.5 58.7 . . 69.29 63.00 . . 69.2 61.13 . .Jhajjar 60.0 64.6 . . 79.28 68.00 . . 94.2 71.24 . .Faridabad 95.7 67.1 . . 93.01 74.75 . . 119.7 80.28 . .Gurgaon 88.8 59.7 . . 98.69 50.90 . . 102.2 85.47 . .Rewari 72.5 71.7 . . 82.65 74.08 . . 79.0 77.43 . .Mahendragarh 92.8 64.8 . . 89.23 73.41 . . 109.8 68.54 . .Bhiwani 91.0 78.4 . . 94.82 78.13 . . 102.2 77.58 . .Jind 95.6 67.8 . . 93.81 79.64 . . 102.8 85.64 . .Hisar 64.7 55.8 . . 69.57 77.86 . . 69.2 82.08 . .Fatehabad 59.5 46.3 . . 69.22 59.86 . . 71.4 63.09 . .Sirsa 74.1 55.5 . . 74.64 71.79 . . 77.6 71.52 . .Haryana State 78.9 64.2 . . 80.52 71.60 . . 88.7 77.28 . .
Source :—Director, Secondary Education, Haryana. * Including in old district boundaries.
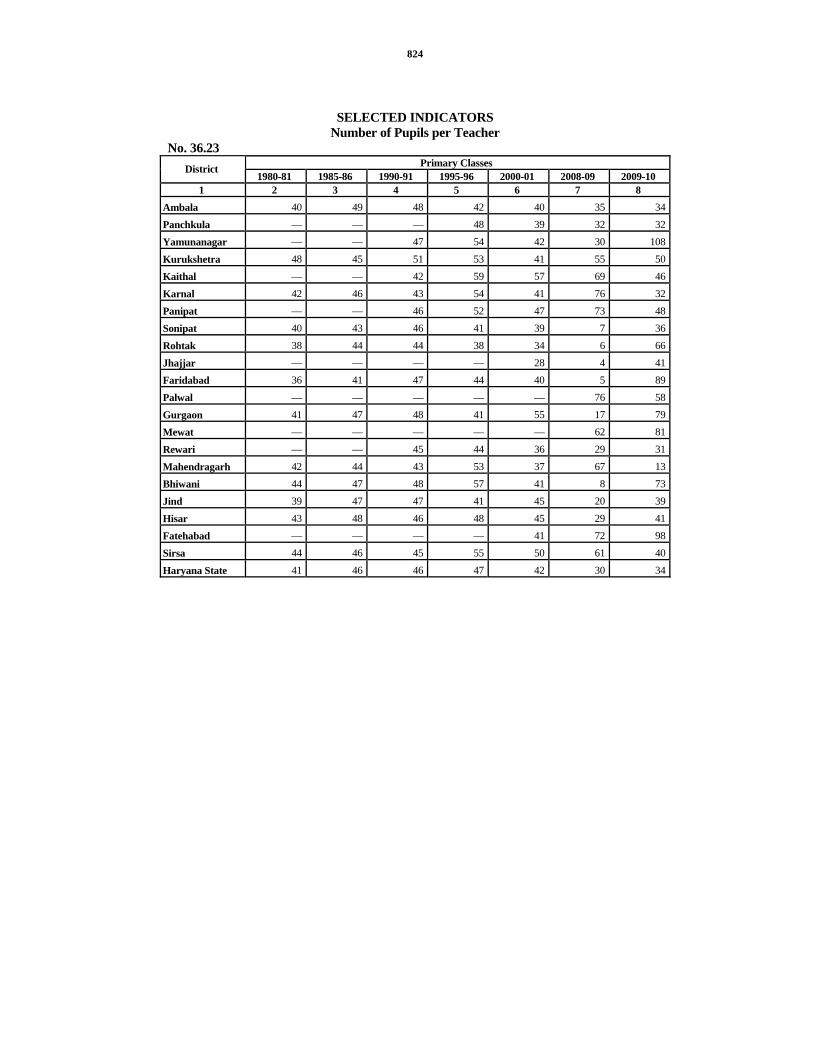
824
SELECTED INDICATORS Number of Pupils per Teacher
No. 36.23 Primary Classes District
1980-81 1985-86 1990-91 1995-96 2000-01 2008-09 2009-10 1 2 3 4 5 6 7 8
Ambala 40 49 48 42 40 35 34
Panchkula — — — 48 39 32 32
Yamunanagar — — 47 54 42 30 108
Kurukshetra 48 45 51 53 41 55 50
Kaithal — — 42 59 57 69 46
Karnal 42 46 43 54 41 76 32
Panipat — — 46 52 47 73 48
Sonipat 40 43 46 41 39 7 36
Rohtak 38 44 44 38 34 6 66
Jhajjar — — — — 28 4 41
Faridabad 36 41 47 44 40 5 89
Palwal — — — — — 76 58
Gurgaon 41 47 48 41 55 17 79
Mewat — — — — — 62 81
Rewari — — 45 44 36 29 31
Mahendragarh 42 44 43 53 37 67 13
Bhiwani 44 47 48 57 41 8 73
Jind 39 47 47 41 45 20 39
Hisar 43 48 46 48 45 29 41
Fatehabad — — — — 41 72 98
Sirsa 44 46 45 55 50 61 40
Haryana State 41 46 46 47 42 30 34
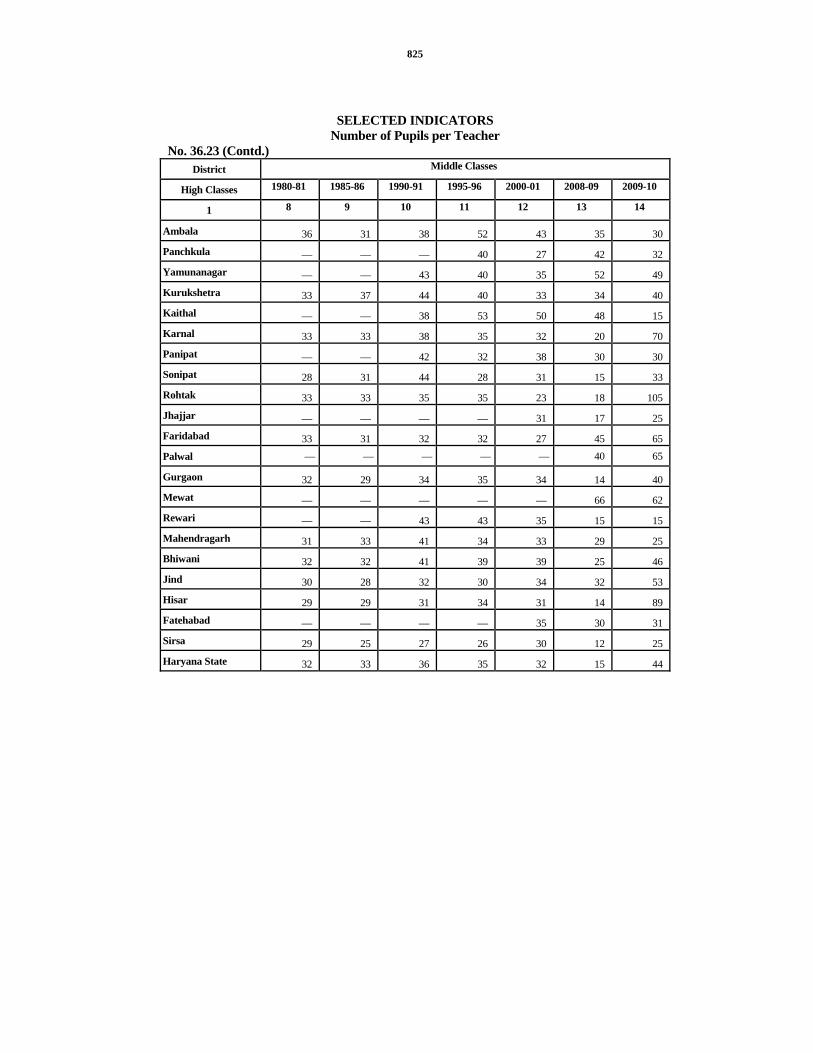
825
SELECTED INDICATORS Number of Pupils per Teacher
No. 36.23 (Contd.) District Middle Classes
High Classes 1980-81 1985-86 1990-91 1995-96 2000-01 2008-09 2009-10
1 8 9 10 11 12 13 14
Ambala 36 31 38 52 43 35 30
Panchkula — — — 40 27 42 32
Yamunanagar — — 43 40 35 52 49
Kurukshetra 33 37 44 40 33 34 40
Kaithal — — 38 53 50 48 15
Karnal 33 33 38 35 32 20 70
Panipat — — 42 32 38 30 30
Sonipat 28 31 44 28 31 15 33
Rohtak 33 33 35 35 23 18 105
Jhajjar — — — — 31 17 25
Faridabad 33 31 32 32 27 45 65
Palwal — — — — — 40 65
Gurgaon 32 29 34 35 34 14 40
Mewat — — — — — 66 62
Rewari — — 43 43 35 15 15
Mahendragarh 31 33 41 34 33 29 25
Bhiwani 32 32 41 39 39 25 46
Jind 30 28 32 30 34 32 53
Hisar 29 29 31 34 31 14 89
Fatehabad — — — — 35 30 31
Sirsa 29 25 27 26 30 12 25
Haryana State 32 33 36 35 32 15 44
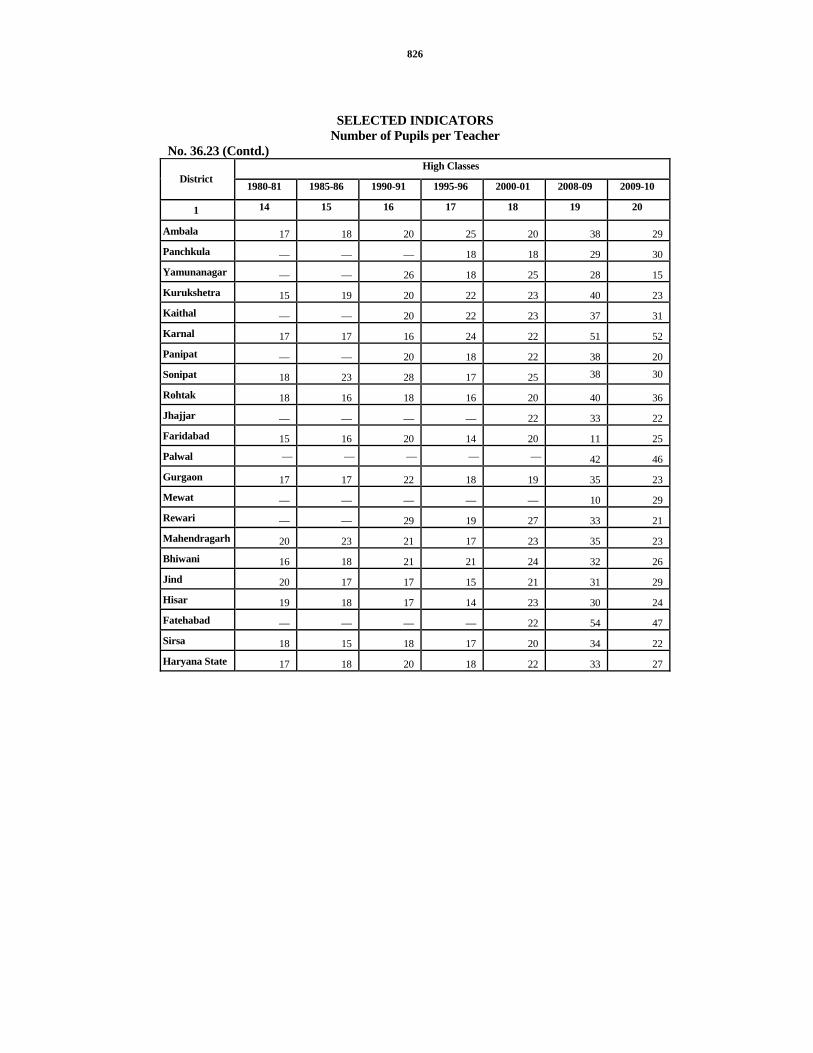
826
SELECTED INDICATORS Number of Pupils per Teacher
No. 36.23 (Contd.) High Classes
District 1980-81 1985-86 1990-91 1995-96 2000-01 2008-09 2009-10
1 14 15 16 17 18 19 20
Ambala 17 18 20 25 20 38 29
Panchkula — — — 18 18 29 30
Yamunanagar — — 26 18 25 28 15
Kurukshetra 15 19 20 22 23 40 23
Kaithal — — 20 22 23 37 31
Karnal 17 17 16 24 22 51 52
Panipat — — 20 18 22 38 20
Sonipat 18 23 28 17 25 38 30
Rohtak 18 16 18 16 20 40 36
Jhajjar — — — — 22 33 22
Faridabad 15 16 20 14 20 11 25
Palwal — — — — — 42 46
Gurgaon 17 17 22 18 19 35 23
Mewat — — — — — 10 29
Rewari — — 29 19 27 33 21
Mahendragarh 20 23 21 17 23 35 23
Bhiwani 16 18 21 21 24 32 26
Jind 20 17 17 15 21 31 29
Hisar 19 18 17 14 23 30 24
Fatehabad — — — — 22 54 47
Sirsa 18 15 18 17 20 34 22
Haryana State 17 18 20 18 22 33 27
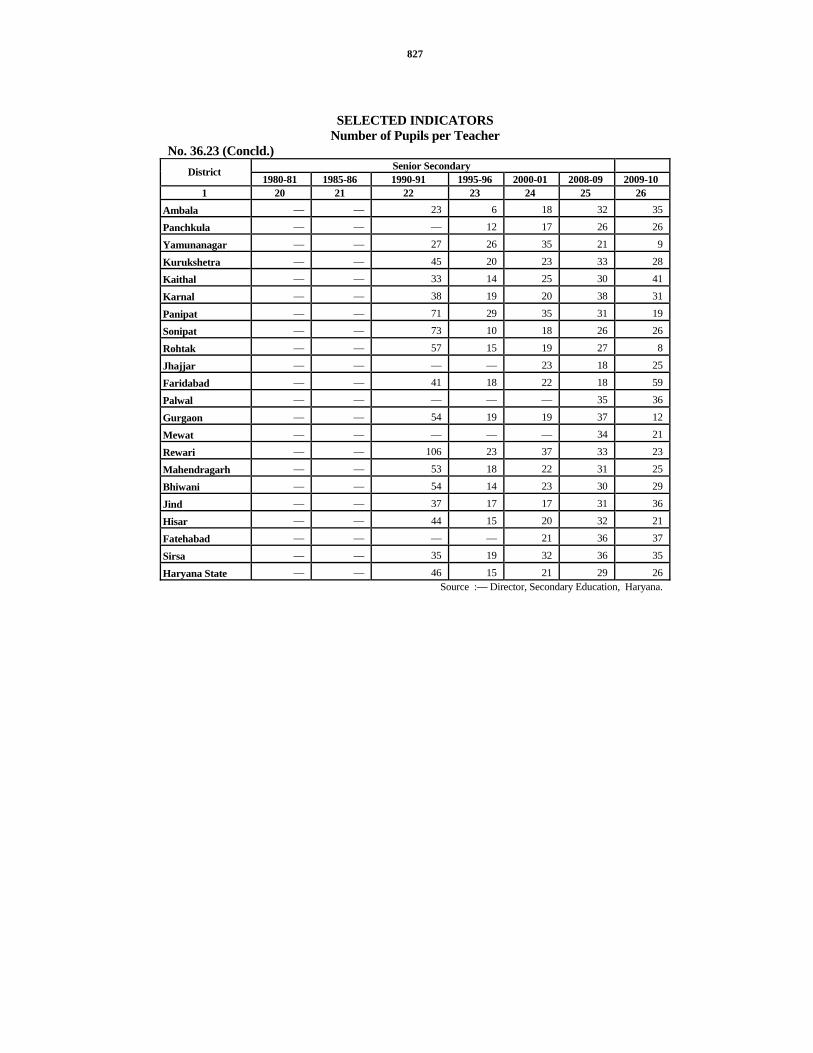
827
SELECTED INDICATORS Number of Pupils per Teacher
No. 36.23 (Concld.) Senior Secondary District
1980-81 1985-86 1990-91 1995-96 2000-01 2008-09 2009-10 1 20 21 22 23 24 25 26
Ambala — — 23 6 18 32 35
Panchkula — — — 12 17 26 26
Yamunanagar — — 27 26 35 21 9
Kurukshetra — — 45 20 23 33 28
Kaithal — — 33 14 25 30 41
Karnal — — 38 19 20 38 31
Panipat — — 71 29 35 31 19
Sonipat — — 73 10 18 26 26
Rohtak — — 57 15 19 27 8
Jhajjar — — — — 23 18 25
Faridabad — — 41 18 22 18 59
Palwal — — — — — 35 36
Gurgaon — — 54 19 19 37 12
Mewat — — — — — 34 21
Rewari — — 106 23 37 33 23
Mahendragarh — — 53 18 22 31 25
Bhiwani — — 54 14 23 30 29
Jind — — 37 17 17 31 36
Hisar — — 44 15 20 32 21
Fatehabad — — — — 21 36 37
Sirsa — — 35 19 32 36 35
Haryana State — — 46 15 21 29 26 Source :— Director, Secondary Education, Haryana.
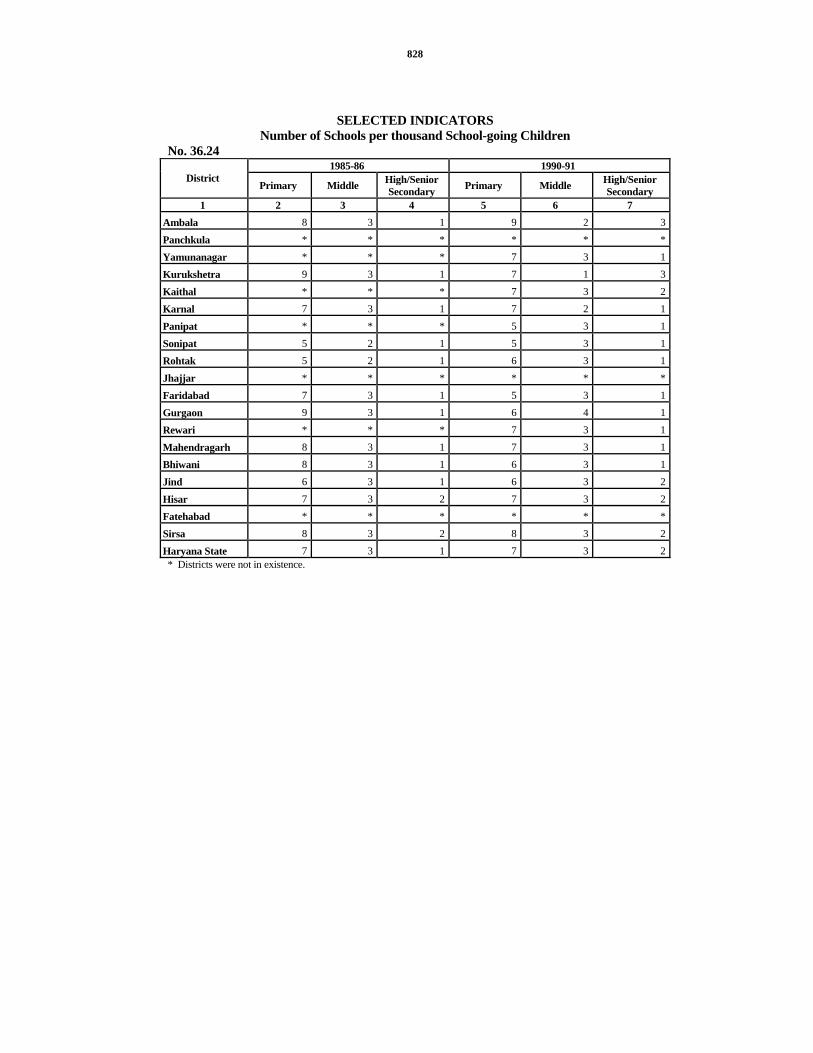
828
SELECTED INDICATORS Number of Schools per thousand School-going Children
No. 36.24 1985-86 1990-91
District Primary Middle High/Senior
Secondary Primary Middle High/Senior Secondary
1 2 3 4 5 6 7 Ambala 8 3 1 9 2 3
Panchkula * * * * * *
Yamunanagar * * * 7 3 1
Kurukshetra 9 3 1 7 1 3
Kaithal * * * 7 3 2
Karnal 7 3 1 7 2 1
Panipat * * * 5 3 1
Sonipat 5 2 1 5 3 1
Rohtak 5 2 1 6 3 1
Jhajjar * * * * * *
Faridabad 7 3 1 5 3 1
Gurgaon 9 3 1 6 4 1
Rewari * * * 7 3 1
Mahendragarh 8 3 1 7 3 1
Bhiwani 8 3 1 6 3 1
Jind 6 3 1 6 3 2
Hisar 7 3 2 7 3 2
Fatehabad * * * * * *
Sirsa 8 3 2 8 3 2
Haryana State 7 3 1 7 3 2* Districts were not in existence.

829
SELECTED INDICATORS Number of Schools per thousand School-going Children
No. 36.24 (Concld.) 1995-96 2000-01 2004-05
District Primary Middle
High/Senior Secondary
Primary MiddleHigh/Senior Secondary
Primary Middle High/Senior Secondary
1 8 9 10 11 12 13 14 15 16 Ambala 9 5 2 7 9 2 8 3 2Panchkula 7 5 2 8 11 3 10 13 3Yamunanagar 8 3 1 7 7 2 7 14 3Kurukshetra 9 3 2 7 12 2 8 6 3Kaithal 3 3 1 4 8 2 7 9 2Karnal 7 3 1 6 12 2 4 9 2Panipat 5 3 1 4 8 2 4 9 3Sonipat 5 3 2 5 7 3 6 8 3Rohtak 6 3 2 4 11 3 4 12 3Jhajjar * * * 6 12 3 5 12 3Faridabad 6 3 1 5 12 3 5 13 4Gurgaon 9 4 2 5 12 3 6 3 5Rewari 8 3 1 8 8 2 8 8 2Mahendragarh 7 3 2 8 13 3 7 11 3Bhiwani 7 2 1 6 6 3 6 13 3Jind 6 3 2 4 9 3 5 9 3Hisar 5 4 2 4 13 3 5 10 3Fatehabad * * * 6 12 3 6 10 3Sirsa 8 4 3 5 10 3 6 10 3Haryana State 7 3 2 5 10 3 7 8 3
Source :— Director Public Instructions, Haryana.

830
SELECTED INDICATORS Percentage of Literacy
No. 36.25 2001 Census 2011 Census (P) District
Total Male Female Total Male Female 1 2 3 4 5 6 7
Ambala 75.31 82.31 67.39 82.89 88.47 76.64
Panchkula 74.00 80.87 65.65 83.44 88.65 77.48
Yamunanagar 71.63 78.82 63.39 78.93 85.06 71.99
Kurukshetra 69.88 78.06 60.61 76.70 83.46 69.18
Kaithal 59.02 69.15 47.31 70.56 79.33 60.69
Karnal 67.74 76.29 57.97 76.44 83.73 68.29
Panipat 69.17 78.50 57.97 77.46 85.45 68.23
Sonipat 72.79 83.06 60.68 80.83 89.40 70.88
Rohtak 73.72 83.23 62.59 80.37 88.42 71.19
Jhajjar 72.38 83.27 59.65 80.83 89.44 70.96
Faridabad 76.29 85.14 65.53 83.04 89.94 75.17
Palwal 59.19 75.10 40.76 70.32 82.60 56.40
Gurgaon 78.51 87.97 67.49 84.44 90.27 77.64
Mewat 43.51 61.18 23.89 56.14 72.98 37.58
Rewari 75.25 88.45 60.83 82.23 92.92 70.54
Mahendragarh 69.89 84.72 54.08 78.87 91.28 65.25
Bhiwani 67.45 80.26 53.00 76.74 87.39 64.80
Jind 62.12 73.82 48.51 72.73 82.49 61.58
Hisar 64.83 76.57 51.08 73.24 82.79 62.31
Fatehabad 57.98 68.22 46.53 69.13 78.10 59.29
Sirsa 60.55 70.05 49.93 70.35 78.64 61.16
Haryana State 67.91 78.49 55.73 76.64 85.38 66.77Source :— Director of Census Operations, Haryana.

831
NUMBER OF SEATS PER LAKH OF POPULATION FOR TECHNICAL TRAINING

832

833
SELECTED INDICATORS Number of seats per lakh of population for Technical Training
No. 36.26 1980-81 1990-91 1995-96 District
Diploma Craftsman Diploma Craftsman Diploma Craftsman 1 2 3 4 5 6 7
Ambala 30 99 39 113 55 100
Panchkula * * * * — —
Yamunanagar * * 17 94 18 82
Kurukshetra@ 23 30 72 25 62 19
Kaithal * * — 50 — 52
Karnal 23 67 64 78 45 73
Panipat * * — 64 13 43
Sonipat 29 112 53 98 37 124
Rohtak 29 87 43 84 37 56
Jhajjar * * * * * *
Faridabad 12 81 10 94 24 77
Gurgaon+ –– 92 — 111 5 99
Rewari * * — 20 — 39
Mahendragarh –– 72 — 142 12 102
Bhiwani –– 36 — 51 10 32
Jind –– 39 — 57 — 44
Hisar –– 50 5 78 10 68
Fatehabad * * * * * *
Sirsa 20 92 21 73 35 51
Haryana State 15 70 20 79 23 65@ Degree may be read in place of Diploma in Kurukshetra district for all the years. Note :- Information relates to Government Institutions only. * Districts were not in existence. + Includesn information of Mewat district.

834
SELECTED INDICATORS Number of seats per lakh of population for Technical Training
No. 36.26 (Concld.) 2000-2001 2005-06 2006-07 2007-08
District Diploma Craftsman Diploma Craftsman Diploma Craftsman Diploma Craftsman
1 8 9 10 11 12 13 14 15 Ambala 63 125 80 107 96 104 213 124Panchkula — 26 12 30 11 29 177 31Yamunanagar 35 95 34 84 38 81 99 92Kurukshetra@ 80 17 60 24 58 23 171 25Kaithal — 57 — 52 4 53 9 78Karnal 46 65 48 72 46 68 104 74Panipat 5 46 6 48 4 47 4 46Sonipat 65 94 97 73 129 88 143 101Rohtak 61 153 78 147 80 142 171 153Jhajjar 61 4 95 23 121 22 322 36Faridabad 15 51 17 41 25 44 43 53Gurgaon 3 92 16 73 11 51 22 60Rewari — 33 — 43 7 55 9 53Mahendragarh 16 112 34 102 29 101 56 111Bhiwani 6 46 35 43 35 43 98 47Jind — 60 25 57 29 61 76 65Hisar 30 104 36 91 61 94 131 103Fatehabad — 7 — 30 7 30 105 39Sirsa 67 59 113 63 107 71 128 68Haryana State 24 64 41 64 47 64 102 72
Source :— Director of Industrial Training and Vocational Education, Haryana and Director of Technical Education, Haryana.

835
SELECTED INDICATORS Number of Hospitals per five lakh of Population
No. 36.27
District As on 31-12-
70
As on 31-12-
75
As-on 31-12-80
As on 31-12-
85
1990-91
1995-96
2000-01 2005-06@
2008-09 2009-10
1 2 3 4 5 6 7 8 9 10 11 Ambala 4 5 7 5 5 4 4 2 2 2Panchkula * * * * * * 3 2 1 1Yamunanagar * * * * 4 3 3 2 1 3Kurukshetra * 2 2 2 1 1 1 1 1 3Kaithal * * * * 1 1 1 1 1 2Karnal 2 3 2 2 1 1 1 1 1 2Panipat * * * * 2 2 2 1 2 2Sonipat * 3 1 1 –– 1 1 1 1 2Rohtak 3 4 4 4 3 2 4 3 1 2Jhajjar * * * * * * 1 1 1 3Faridabad * * * * 2 2 1 1 1 1Palwal * * * * * * * * * *Gurgaon 3 4 4 4 2 2 2 2 2 2Mewat * * * * * * * 1 2 1Rewari * * * * 2 1 1 1 1 2Mahendragarh 3 4 2 2 1 1 1 1 1 2Bhiwani * 5 6 6 5 4 3 2 1 4Jind 2 3 3 3 2 2 2 1 1 3Hisar 3 4 5 4 4 3 4 2 1 3Fatehabad * * * * * * 1 1 1 3Sirsa * 3 3 2 2 1 1 1 1 3Haryana State 3 4 4 3 2 2 2 1 1 3
Source :—Director-General of Health Services, Haryana. * Districts were not in existence. @ Information relates to Govt. Institutions only

836
SELECTED INDICATORS Number of Beds per lakh of Population**
No. 36.28 District 1966 1970 1975 1980 1985 1990-
91 1995-
96 2000-
01 2005- 06@
2009- 10@
2010-11@
1 2 3 4 5 6 7 8 9 10 11 12 Ambala 68 87 81 72 67 82 79 68 48 45 44Panchkula * * * * * * — 65 59 55 54Yamunanagar * * * * * 58 55 52 38 37 36Kurukshetra * * 27 23 30 39 38 33 31 32 31Kaithal * * * * * 34 33 32 29 — 27Karnal 33 35 43 36 42 44 46 36 33 32 31Panipat * * * * * 42 35 34 28 26 25Sonipat * * 24 28 27 32 41 29 27 26 26Rohtak 71 82 142 134 124 113 103 202 159 53 150Jhajjar * * * * * * * 21 28 32 32Faridabad * * * 71 70 49 48 37 30 23 37Palwal * * * * * * * * * * 23Gurgaon 47 61 56 35 38 37 35 27 34+ 22 40Mewat * * * * * * * * * 34 19Rewari * * * * * 32 36 32 35 38 37Mahendragarh 35 45 42 37 34 44 42 39 36 34 33Bhiwani * * 152 189 179 131 114 70 59 56 55Jind 10 29 51 52 61 76 70 63 37 35 35Hisar 71 81 92 85 88 83 81 87 46 43 42Fatehabad * * * * * * * 33 30 28 28Sirsa * * 33 35 34 42 38 35 28 28 28Haryana State 53 64 69 69 69 65 62 52 41 40 40* Districts were not in existence. Source :—Director-General of Health Services, Haryana. ** Based on estimated population. Note :—Information prior to the year 1990-91 relates to 31st December. @ Information relates to Govt. Instritutions only + Includes information of Mewat district.

837
SELECTED INDICATORS Number of Family Welfare Centres per lakh of Population
No. 36.29 (As on 31st March) 1980-81 1985-86 1990-91 1995-96
District Number Per lakh of population
Number Per lakh of population
Number Per lakh of population
Number Per lakh of population
1 2 3 4 5 6 7 8 9 Ambala 15 1 15 1 19 1 8 1Panchkula * * * * * * * *Yamunanagar * * * * * * 8 1Kurukshetra 10 1 10 1 12 1 6 1Kaithal * * * * * * 7 1Karnal 13 1 13 1 13 1 8 1Panipat * * * * * * 5 1Sonipat 7 1 8 1 8 1 9 1Rohtak 15 1 15 1 16 1 14 1Jhajjar * * * * * * * *Faridabad 8 1 9 1 11 1 13 1Gurgaon 9 1 10 1 11 1 12 1Rewari * * * * * * 5 1Mahendragarh 13 1 13 1 15 1 11 1Bhiwani 8 1 9 1 9 1 8 1Jind 9 1 11 1 11 1 10 1Hisar 16 1 16 1 17 1 18 1Fatehabad * * * * * * * *Sirsa 7 1 7 1 7 1 7 1Haryana State 130 1 136 1 149 1 149 1* Included in old district boundaries.

838
SELECTED INDICATORS Number of Family Welfare Centres per lakh of Population
No. 36.29 (Concld.) (As on 31st March) 2000-01 2005-06 2006-07 2007-08
District Number Per lakh of population
Number Per lakh of population
Number Per lakh of population
Number Per lakh of population
1 10 11 12 13 14 15 16 17 Ambala 5 1 8 1 5 1 5 1Panchkula 3 1 3 1 2 1 2 1Yamunanagar 8 1 8 1 6 1 6 1Kurukshetra 6 1 5 1 3 1 3 1Kaithal 7 1 6 1 4 1 4 1Karnal 8 1 7 1 6 1 6 1Panipat 5 1 5 1 4 1 4 1Sonipat 9 1 8 1 6 1 6 1Rohtak 9 1 10 1 8 1 8 1Jhajjar 5 1 5 1 3 1 3 1Faridabad 13 1 10 1 8 1 8 1Palwal -- -- -- -- -- -- -- --Gurgaon 12 1 12 1 8 1 8 1Mewat -- -- -- -- -- -- -- --Rewari 5 1 6 1 5 1 5 1Mahendragarh 11 1 10 1 8 1 8 1Bhiwani 8 1 9 1 7 1 7 1Jind 10 1 9 1 6 1 6 1Hisar 10 1 10 1 8 1 8 1Fatehabad 8 1 7 1 5 1 5 1Sirsa 7 1 7 1 5 1 5 1Haryana State 149 1 145 1 107 1 107 1
Source :—Director-General of Health Services, Haryana.

839
SELECTED INDICATORS Percentage of Problem Villages provided with safe drinking water supply
No. 36.30 (As on 31st March) Number of Problem
villages Percentage of Problem villages provided with safe drinking
water supply District 1989 1991 1981 1989 1990 1991 1992
1 2 3 4 5 6 7 8 Ambala 1,052 644 37.6 86.0 98.8 99.8 100.0Yamunanagar * 432 * * 97.0 99.3 100.0Kurukshetra 374 176 7.7 57.0 92.0 98.9 100.0Kaithal * 219 * * 77.2 86.3 100.0Karnal 299 137 4.3 85.6 97.1 98.5 100.0Panipat * 166 * * 94.6 97.0 100.0Sonipat 293 205 4.5 70.0 88.3 95.1 100.0Rohtak 435 476 23.0 92.0 91.8 95.4 100.0Faridabad 314 314 8.4 99.4 100.0 100.0 100.0Gurgaon 662 662 23.3 99.1 99.8 100.0 100.0Rewari * 400 * * 99.8 100.0 100.0Mahendragarh 713 360 44.8 99.2 100.0 100.0 100.0Bhiwani 421 421 61.1 100.0 100.0 100.0 100.0Jind 342 293 18.5 95.0 98.6 100.0 100.0Hisar 464 464 40.7 96.1 99.4 100.0 100.0Sirsa 317 317 34.4 97.5 99.7 100.0 100.0Haryana State 5,686 5,686 31.8 90.7 97.0 98.7 100.0
Source :—Economic and Statistical Analysis Department, Haryana. * Districts were not in existence. Note :—All the villages have been provided with safe drinking water supply by 31-3-1992.

840
SELECTED INDICATORS Number of Persons per Bank
No. 36.31 (In 00)
District 1975-76 1980-81 1985-86 1990-91 1995-96 2000-01 2005-06 2009-10@
2010-11@
1 2 3 4 5 6 7 8 9 10 Ambala 117 93 99 155 94 101 98 78 73Panchkula * * * * * 82 69 50 44Yamunanagar * * * * 119 116 111 106 96Kurukshetra 198 138 166 110 135 146 140 99 88Kaithal * * * * 176 165 172 128 113Karnal 139 111 121 125 144 136 130 109 95Panipat * * * * 111 121 120 103 99Sonipat 171 137 148 151 163 162 161 111 95Rohtak 174 140 124 132 126 101 104 87 81Jhajjar * * * * * 172 180 121 105Faridabad * * 105 111 134 153 159 113 102Palwal * * * * * * * 171 155Gurgaon 152 169 115 120 129 125 118 52 45Mewat * * * * * * * 311 303Rewari * * * * 126 133 131 103 93Mahendragarh 247 177 138 135 162 168 185 149 136Bhiwani 200 116 136 124 135 147 157 144 131Jind 251 207 209 179 192 200 207 160 139Hisar 188 160 171 155 157 158 153 125 119Fatehabad * * * * * 177 167 124 111Sirsa 210 127 129 110 117 124 133 113 108Haryana State 171 127 132 130 135 138 134 107 97
Source :—Department of Economic and Statistical Analysis, Haryana. * Included in old district boundaries. Note :— Based on estimated mid financial year population. @ Based on 2011 census population.

841
SELECTED INDICATORS
Per Capita Deposits of Scheduled Commercial Banks No. 36.32
March, 2010 March, 2011 District Total Deposits
(Rs. crore) Per Capita@ Deposits (Rs.)
Total Deposits (Rs. crore)
Per Capita@ Deposits (Rs.)
1 2 3 4 5 Ambala 5106 4492 5898 5188Panchkula 14532 26002 16374 29297Yamunanagar 3556 2929 4041 3398Kurukshetra 2877 2984 3201 3320Kaithal 1474 1374 1568 1462Karnal 4181 2776 4818 3199Panipat 3604 2996 4213 3503Sonipat 4779 3229 5365 3625Rohtak 5046 4766 5953 5623Jhajjar 2616 2734 3118 3258Faridabad 12919 7181 14408 8009Palwal 1237 1189 1494 1436Gurgaon 31135 20564 38883 25681Mewat 580 532 793 728Rewari 2931 3271 3715 4146Mahendragarh 1432 1554 1755 1904Bhiwani 2588 1589 3051 1873Jind 1605 1205 1897 1424Hisar 4072 2336 5243 3008Fatehabad 1246 1323 1531 1626Sirsa 2060 1591 2407 1859Haryana State 109577 4322 129721 5117* Included in old district boundries. Source :—Banking Statistics. Note :—Total may not tally due to rounding off. @ Based on final population of census 2011.
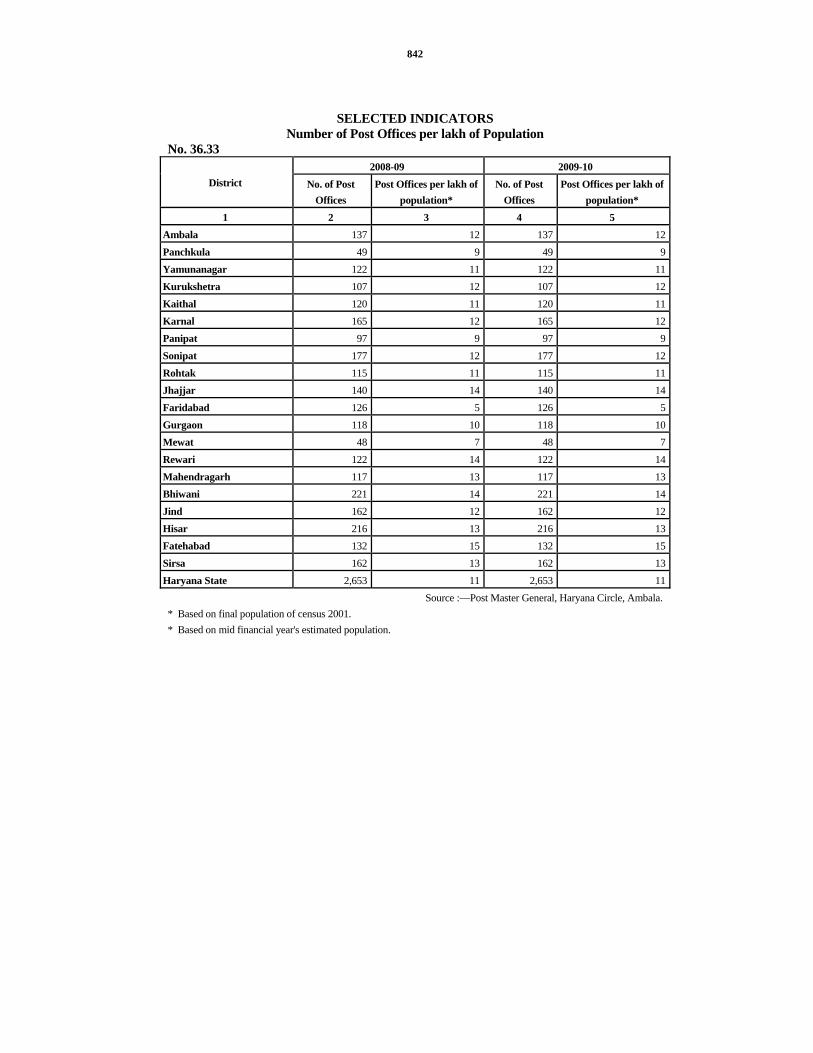
842
SELECTED INDICATORS Number of Post Offices per lakh of Population
No. 36.33 2008-09 2009-10
District No. of Post Offices
Post Offices per lakh of population*
No. of Post Offices
Post Offices per lakh of population*
1 2 3 4 5 Ambala 137 12 137 12Panchkula 49 9 49 9Yamunanagar 122 11 122 11Kurukshetra 107 12 107 12Kaithal 120 11 120 11Karnal 165 12 165 12Panipat 97 9 97 9Sonipat 177 12 177 12Rohtak 115 11 115 11Jhajjar 140 14 140 14Faridabad 126 5 126 5Gurgaon 118 10 118 10Mewat 48 7 48 7Rewari 122 14 122 14Mahendragarh 117 13 117 13Bhiwani 221 14 221 14Jind 162 12 162 12Hisar 216 13 216 13Fatehabad 132 15 132 15Sirsa 162 13 162 13Haryana State 2,653 11 2,653 11
Source :—Post Master General, Haryana Circle, Ambala. * Based on final population of census 2001. * Based on mid financial year's estimated population.
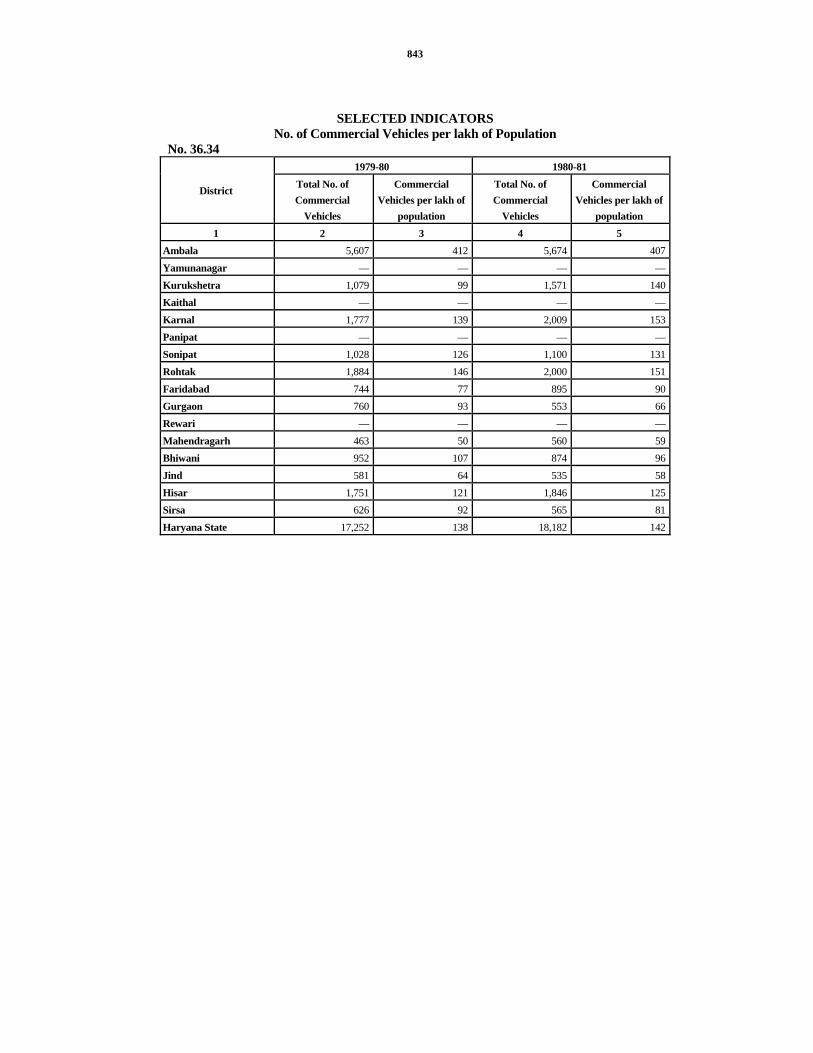
843
SELECTED INDICATORS No. of Commercial Vehicles per lakh of Population
No. 36.34 1979-80 1980-81
District Total No. of Commercial
Vehicles
Commercial Vehicles per lakh of
population
Total No. of Commercial
Vehicles
Commercial Vehicles per lakh of
population 1 2 3 4 5
Ambala 5,607 412 5,674 407Yamunanagar — — — —Kurukshetra 1,079 99 1,571 140Kaithal — — — —Karnal 1,777 139 2,009 153Panipat — — — —Sonipat 1,028 126 1,100 131Rohtak 1,884 146 2,000 151Faridabad 744 77 895 90Gurgaon 760 93 553 66Rewari — — — —Mahendragarh 463 50 560 59Bhiwani 952 107 874 96Jind 581 64 535 58Hisar 1,751 121 1,846 125Sirsa 626 92 565 81Haryana State 17,252 138 18,182 142

844
SELECTED INDICATORS No. of Commercial Vehicles per lakh of Population
No. 36.34 (Concld.) 1985-86 1990-91 1992-93 1993-94
District
Total No. of Commercial
Vehicles
Commercial Vehicles per
lakh of population
Total No. of Commercial
Vehicles
Commercial Vehicles per
lakh of population
Total No. of Commercial
Vehicles
Commercial Vehicles per
lakh of population
Total No. of
Commercial
Vehicles
Commercial
Vehicles per
lakh of populat
ion 1 6 7 8 9 10 11 12 13
Ambala 8,846 553 9,332 871 9,947 857 4,582 388 Yamunanagar — — 1,968 244 2,754 322 3,014 346 Kurukshetra 1,880 147 431 68 1,728 259 1,989 293 Kaithal — — 1,665 195 1,719 202 2,268 261 Karnal 3,811 254 4,807 540 5,494 597 4,609 415 Panipat — — 2,247 293 2,560 296 2,650 368 Sonipat 1,630 170 4,374 413 4,875 621 6,199 549 Rohtak 4,587 358 7,095 454 8,074 430 3,770 237 Faridabad 2,193 193 7,669 622 14,054 916 18,705 1,191 Gurgaon 1,687 175 5,745 532 5,603 470 9,509 779 Rewari — — 1,446 229 1,124 174 1,510 229 Mahendragarh 846 78 828 123 1,026 145 987 137 Bhiwani 2,136 205 2,899 249 2,973 251 3,198 264 Jind 867 81 1,966 199 2,555 255 1,912 187 Hisar 3,280 193 3,817 205 2,140 112 6,923 353 Sirsa 1,064 133 2,044 232 2,586 275 2,691 280 Haryana State 32,827 224 58,333 361 69,212 405 74,516 426
Source :—State Transport Commissioner, Haryana. Note :— Districtwise breakup of Commercial Vehicles is not available from 1994-95 onwards.

845
SELECTED INDICATORS STATE-WISE INDICATORS
No. 36.35
State/Union Territory
Per capita income at
current prices, 2010-11(Q) (Rs.) (Base 2004-05)
Factory employment 1997-
98 (P) (000 Nos.)
Net Value Added by manufacture factory sector
1997-98 (Rs. Crores)
No. of beds (all types) per lakh of population (31-12-1998)
Percentage of Literacy 2001
1 2 3 4 5 6 Andhra Pradesh 60,458 1,209 11,579 103 60.50Arunachal Pradesh
51,405(P) . . . . 172## 54.30
Assam 30,569 155 1,268 68# 63.30Bihar 20,069 275 9,283 43## 47Chhatisgarh 44,097 . . . . . . 64.70Delhi . . . . . . . . 81.70Gujarat 63,961(P) 881 14,387 180+ 69.10Goa 132,719(P) 28 881 310 82Haryana 94,680 316 4,724 59 67.90Himachal Pradesh 58,493 69 1,155 146 76.50Jammu and Kashmir
33,056 43 207 119++ 55.50
Jharkhand 29,786 . . . . . . 53.60Karnataka 59,763 628 8,647 111 66.60Kerala 69,627 360 3,251 338 90.90Madhya Pradesh 27,250(P) 467 8,567 43## 63.70Maharashtra 83,471 1,476 33,792 188* 76.90Manipur 29,684 4 93 103 70.50Meghalaya 50,483 7 92 145 62.60Mizoram 45,982(P) . . . . 181 88.80Nagaland . . 5 27 128 66.60Orissa 36,923 180 3,754 48 63.10Punjab 67,473 459 4,688 109 69.70Rajasthan 39,967 294 5,514 73 60.40Sikkim 81,159 . . . . 172 68.80Tamilnadu 72,993 1,285 13,501 106$ 73.50Tripura 38,493 9 106 64 73.20Uttrakhand 68,292 . . . . . . 71.60Uttar Pradesh 26,051 774 14,365 52$$ 56.30West Bengal 41,219(P) 834 9,727 90 68.60Union Territories . . 224 6,343 1,376 . .All India 53,331 10,001 155,947 93 64.80Q= Quick Estimates. P=Provisional . .— Not Available Note :— Totals may not tally due to rounding off. # Relates to 31st December, 1991 $ Relates to 31st December, 1990 ## Relates to 31st December, 1992 ++ Relates to 31st December, 1989

846
SELECTED INDICATORS STATE-WISE INDICATORS
No. 36.35 Road Length (Kms.)
State/Union Territory
Per 100 Sq. Kms. of area
(2007-08)
Per lakh of population @@
(2007-08)
Enrolment of school going
children in class I—V as on 30-9-2009 (Lakh No.)
Percentage of villages
electrified as on 31-3-2009
No. of irrigation
pump-sets and tubwells
energized as on 31-3-2006
(000) 1 7 8 9 10 11
Andhra Pradesh 125.44 418.83 71 100.0 2441Arunachal Pradesh 19.70 1376.79 2 56.8 --Assam 293.65 782.52 29 78.6 4Bihar 127.57 128.30 139 61.3 271Chhatisgarh 55.06 319.88 32 95.6 130Delhi 1993.19 174.34 17 100.0 26Gujarat 74.80 258.94 66 99.7 825Goa 285.49 662.22 1 100.0 8Haryana 67.24 122.98 22 100.0 468Himachal Pradesh 65.20 550.39 6 98.2 10Jammu and Kashmir 10.04 198.30 13 98.2 10Jharkhand 21.99 58.09 55 31.1 10Karnataka 133.19 443.88 55 99.9 1509Kerala 526.87 605.77 24 100.0 461Madhya Pradesh 53.77 241.12 118 96.4 1340Maharashtra 72.57 206.83 104 88.3 2623Manipur 73.91 698.05 4 85.8 --Meghalaya 43.87 388.89 5 59.3 --Mizoram 29.21 634.85 1 80.6 --Nagaland 134.53 1027.36 2 64.4 --Orissa 138.34 543.20 45 62.6 75Punjab 89.71 169.07 25 100.0 930Rajasthan 50.11 265.72 88 69.2 784Sikkim 26.40 316.92 8 94.4 --Tamilnadu 139.33 274.12 62 100.0 1886Tripura 302.62 908.99 4 57.2 3Uttrakhand 17.03 431.51 11 96.5 18Uttar Pradesh 532.27 149.53 25 88.3 845West Bengal 238.61 243.43 100 97.3 114Union Territories 75.37 204.62 — 94.5 13All India 96.57 277.32 1,357 83.6 14804
Source :—Central Statistical Organisation, Govt. of India. ** Less than thousand @@ On estimated mid year population. $$ Relates to 31st December, 1996. + Relates to 31st December, 1995.
ERRATA STATISTICAL ABSTRACT OF HARYANA – 2010-11
Page No. Column Line For Read

847
33 2 22 25353091 25353081 201 2 8 8524.90 6524.90 201 2 10 8556.79 9256.79 201 7 12 13590.66 31590.66 203 4 20 4534.41 9534.41 210 5 7 42798 42498 327 5 22 186284 186824 364 14 11 4,464.75 41.67 420 8 25 212.6 262.6 526 11 8 1,70,02,23,030 17,00,23,030 533 5 6 20.77 20.73 559 4 15 (+)190.00 (+) 200.00 608 2 12 700 608 3 12 666 608 4 12 700 608 5 12 660 608 2 23 712 608 3 23 684 608 4 23 712 608 5 23 679 608 2 24 707 608 3 24 682 608 4 24 707 608 5 24 676
Printed at : Haryana Government Press, Panchkula