B2B Data Providers Company India | B2B Database | B2B Lead Generation

This webinar will begin shortly
Statista presents: Why Software is also eating the B2B world
1
Instead of browsing through different online sources, the data you need is only one click away – or maybe two.
Our comprehensive data helps you to make better business decisions.
Statista is always aiming to develop innovative products to make your
research as efficient and convenient as possible.
We assess technical innovation and its transformational power from
different angles to provide a comprehensive overview to you.
Our 100 data analysts and 200 specialist editors guarantee reliable data adhering to scientific standards.
With more than 1 million statistics, 80,000 topics and 22,500 sources we
offer a high variety of data as a single source of truth.

2

354 353
276
209 209 206 199 197 191 185
Apple PetroChina ChevronExxonMobil
Royal Dutch Shell
IBM ICBCMicrosoft China Mobile
Nestle
Company valuation in Million USD, September 30th, 2011
How did the world look like back then …
3

Company valuation in Million USD, April 12th, 2021
These days, the highest valued companies are predominantly B2C software companies …
2.233
1.930 1.891
1.698
1.536
889754
649 611 608
FacebookApple TeslaMicrosoft TencentSaudi Aramco
Amazon Alphabet Berkshire Hathaway
Alibaba
4

… and the way people use media has changed dramatically …Time spent with digital vs. traditional media in the U.S. 2011–2022
Source: Statista, eMarketer; ID 565628
150
200
250
300
350
400
450
500
2011 2012 2013 2014 2015 2016 2017 2018 2019 2020 2021* 2022*
Tim
e in
min
ute
s
Digital Traditional
5

… as the shopping behaviour in the B2C space has.Worldwide e-commerce share of retail sales 2015–2023
Source: Statista, eMarketer; ID 534123
7,4%8,6%
10,4%
12,2%
14,1%
16,1%
18,1%
20%
22%
0%
5%
10%
15%
20%
25%
2015 2016 2017 2018 2019 2020* 2021* 2022* 2023*
Sh
are
of
e-r
eta
il sa
les
6

WHY SOFTWARE IS ALSO EATING THE B2B WORLD
7
April 2021
Presented by

Your expert for today‘s webinar
Peter KautzMD Statista Q
▪ Leading the data-driven Project business
▪ Passionate about figures and assessing trends and impact in B2B markets (“counting containers”)
▪ Believer in digital business models –e.g. founder of mymoria - the leading digital funeral home
Speaker Introduction
8

What do we offer
Statista presents: Software is also eating the B2B world
9
Instead of browsing through different online sources, the data you need is only one click away – or maybe two.
Our comprehensive data helps you to make better business decisions.
Statista is always aiming to develop innovative products to make your
research as efficient and convenient as possible.
We assess technical innovation and its transformational power from
different angles to provide a comprehensive overview to you.
Our 100 data analysts and 200 specialist editors guarantee reliable data adhering to scientific standards.
With more than 1 million statistics, 80,000 topics and 22,500 sources we
offer a high variety of data as a single source of truth.

Why Software is also eating the B2B World?
10
B2B Markets
Digital Acceleration
Client Access in B2B Markets
Workforce Transformation
a. Client Expectationb. Platforms
a. Artificial Intelligenceb. Big Data and Analyticsc. 5G enabled services
a. Manage remote workb. Tech modernization
01
02
03
04
Chance or challenge?
05
Submityour questions via the chat window for the Q&A
happening at the end of the webinar.
You will receive an email with the answers next week.

11 Statista // 22. April 2021

The sum of B2B markets is about two times bigger than all B2C markets combined
12
B2B vs. B2C markets value in the United States in USD
B2C Market size ($) B2B Market size ($) ~2x
B2
B M
ark
ets
01

Typically within B2B Markets companies …
13
… sell complex products and services …
… that are purchased by clients through a systematic purchase process …
… involving multiple stakeholders, such as end users, evaluators and purchase managers.
B2
B M
ark
ets
01

Why Software is also eating the B2B World?
14
B2B Markets
Digital Acceleration
Client Access in B2B Markets
Workforce Transformation
a. Client Expectationb. Platforms
a. Artificial Intelligenceb. Big Data and Analyticsc. 5G enabled services
a. Manage remote workb. Tech modernization
01
02
03
04
Chance or challenge?
05
Submityour questions via the chat window for the Q&A
happening at the end of the webinar.
You will receive an email with the answers next week.

B2B focused individuals have gotten used to digital convenience …
of B2B buyer expect B2C buying behavior
> 80%
Source: Lumoa, Unsplash
B2B customers expect B2C-like usability in purchasing process
15
B2
B C
lie
nt
Ex
pe
cta
tio
n0
2

… like their mobile …
of B2B buyers perform searches mobile, from which 25% even buy
mobile
> 91%
Source: Frost & Sullivan, Unsplash
B2B customers expect B2C-like usability in purchasing process
16
02
B2
B C
lie
nt
Ex
pe
cta
tio
n0
2
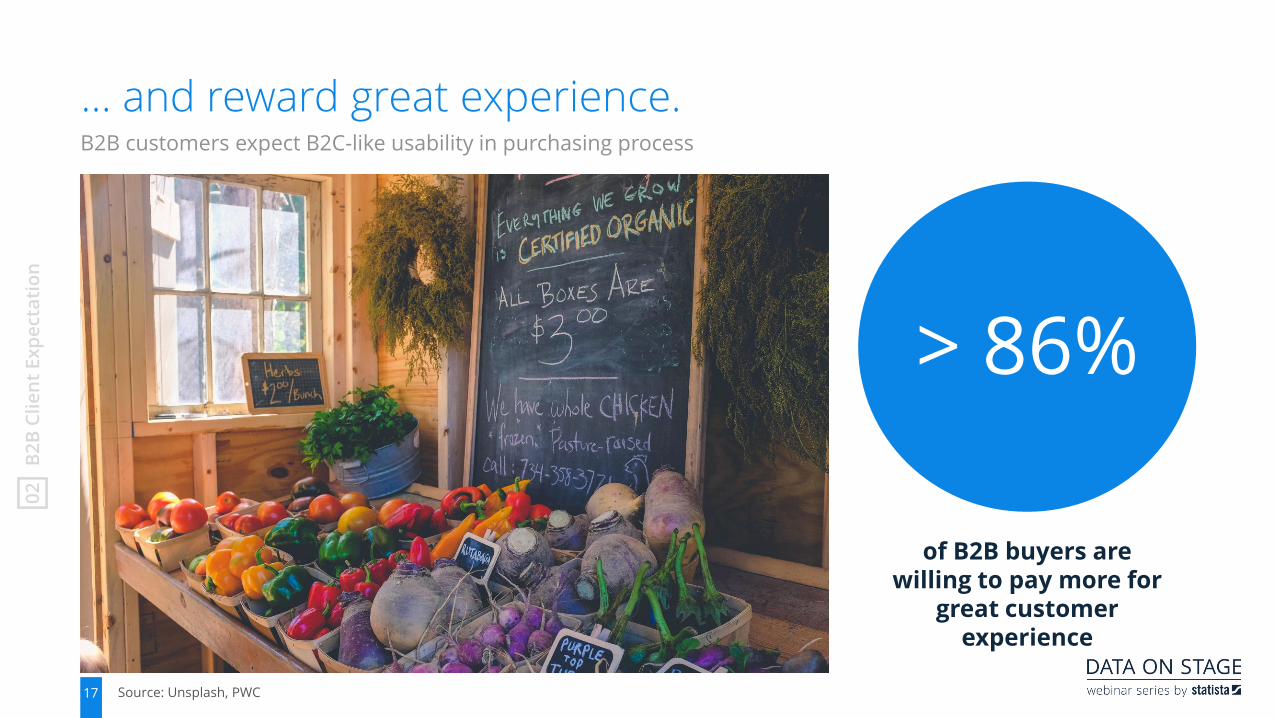
… and reward great experience. B2B customers expect B2C-like usability in purchasing process
of B2B buyers are willing to pay more for
great customer experience
> 86%
Source: Unsplash, PWC17
02
B2
B C
lie
nt
Ex
pe
cta
tio
n0
2
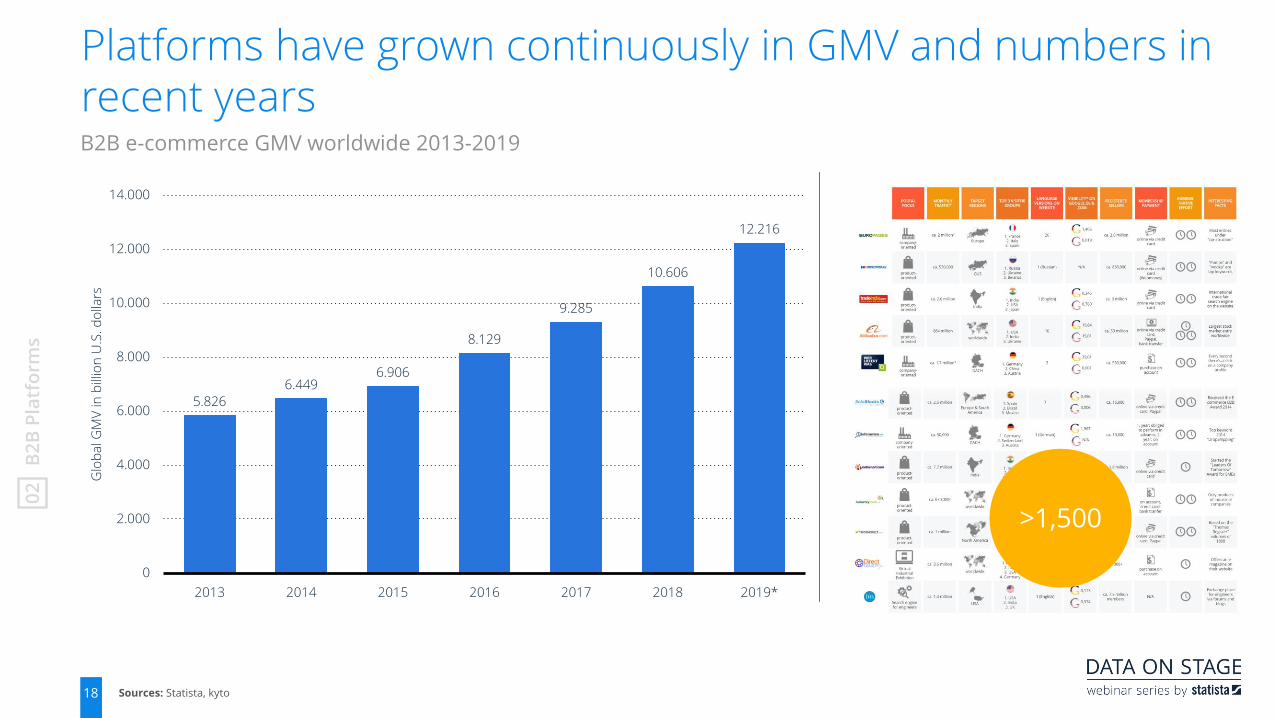
Platforms have grown continuously in GMV and numbers in recent yearsB2B e-commerce GMV worldwide 2013-2019
5.826
6.4496.906
8.129
9.285
10.606
12.216
0
2.000
4.000
6.000
8.000
10.000
12.000
14.000
2013 2014 2015 2016 2017 2018 2019*
Glo
ba
l GM
V in
bill
ion
U.S
. d
olla
rs
Sources: Statista, kyto
>1,500
18
B2
B P
latf
orm
s0
2

Platforms can relate to online marketplaces or a common software backbone, e.g. in eCommerce …Case Example: Shopify (GMV per Quarter in USD)
19
Next stop: B2B!
Source: marketplacepulse
B2
B P
latf
orm
s0
2

Why Software is also eating the B2B World?
20
B2B Markets
Digital Acceleration
Client Access in B2B Markets
Workforce Transformation
a. Client Expectationb. Platforms
a. Artificial Intelligenceb. Big Data and Analyticsc. 5G enabled services
a. Manage remote workb. Tech modernization
01
02
03
04
Chance or challenge?
05
Submityour questions via the chat window for the Q&A
happening at the end of the webinar.
You will receive an email with the answers next week.

Artificial intelligence software market revenue worldwide 2018-2025, by region
Note(s): Worldwide; 2018
Further information regarding this statistic can be found on page 8.Source(s): Tractica; ID 721747
0
20
40
60
80
100
120
140
2018 2019* 2020* 2021* 2022* 2023* 2024* 2025*
Re
ven
ue
in b
illio
n U
.S. d
olla
rs
North America Europe Asia-Pacific Latin America Middle East and Africa
3
The Artificial Intelligence market is expected to grow by a factor of 6 between 2020 and 2025
Art
ific
ial In
tell
ige
nce
03

26,1%
14,5%13,6%
12,5%11,5%
8,2% 7,7%
5,4%
0%
5%
10%
15%
20%
25%
30%
China North America United Arab
Emirates
Kingdom of
Saudi Arabia
Southern
Europe
GCC Egypt Latin America
Sh
are
of
AI co
ntr
ibu
tio
n t
o G
DP
Note(s): Worldwide; 2018
Further information regarding this statistic can be found on page 54.Source(s): PwC; Bahrain FinTech Bay; ID 10423256
Artificial Intelligence will likely see increases due to easier applications with tremendous successShare of projected AI contribution to GDP 2030 by region
Art
ific
ial In
tell
ige
nce
03

Note(s): Worldwide; 2010 to 2019
Further information regarding this statistic can be found on page 74.Source(s): CB Insights; The Economic Times; ID 87535230
Acquisitions of AI startup companies worldwide 2010–2019
The GAFAM group is leading the private efforts to reach AI dominance by growing through acquisitions
8 9 10
2535 39
78
120
166
231
0
50
100
150
200
250
2010 2011 2012 2013 2014 2015 2016 2017 2018 2019
Nu
mb
er
of
acq
uis
itio
ns
Art
ific
ial In
tell
ige
nce
03

Note(s): Worldwide; March 26 to April 5, 2019; 1872 respondents
Further information regarding this statistic can be found on page 56.Source(s): McKinsey; ID 10859088
Worldwide workforce changes from adopting AI in companies 2019, by industry
The impact of AI for the workforce is two-sided
8%
2%
1%
2%
4%
1%
1%
15%
21%
19%
16%
13%
12%
12%
12%
11%
9%
6%
5%
10%
12%
8%
23%
14%
15%
21%
6%
13%
11%
10%
15%
1%
4%
3%
4%
1%
6%
6%
3%
2%
2%
32%
20%
38%
18%
37%
40%
26%
39%
48%
44%
48%
36%
0% 10% 20% 30% 40% 50% 60% 70% 80%
Automotive and assembly
Telecom
Infrastructure
Retail
Financial services
Professional services
High tech
Pharma and medical products
Consumer packaged goods
Travel, transport, and logistics
Electric power and natural gas
Healthcare systems and services
Decrease by >10% Decrease by 3-10% Increase by 3-10% Increase by >10% Little or no change*
Art
ific
ial In
tell
ige
nce
03

Companies will scale their data infrastructure to stay competitiveForecast revenue big data market worldwide 2011-2027
Note(s): Worldwide; 2014 to 2018
Further information regarding this statistic can be found on page 8.Source(s): Wikibon; SiliconANGLE; ID 254266
7,612,25
19,6 18,322,6
28
35
42
49
56
64
70
77
84
90
96
103
0
20
40
60
80
100
120
2011 2012 2013 2014 2015 2016 2017 2018*2019*2020*2021*2022*2023*2024*2025*2026*2027*
Ma
rke
t vo
lum
e in
bill
ion
U.S
. d
olla
rs
7
Big
Da
ta &
An
aly
tics
03

Note(s): United Kingdom, EU; 2018 and 2019
Further information regarding this statistic can be found on page 85.Source(s): European Commission; IDC; ID 113501443
Data economy's impact on GDP in EU and UK 2018–2025
Impact of data economy on overall GDP in the European Union (EU) in 2018, 2019, and 2025
2,6% 2,8%3,4%
4,2%
6,2%
0%
1%
2%
3%
4%
5%
6%
7%
2018 2019 2025 Challenge 2025 Baseline 2025 High Growth
Sh
are
of
GD
P
03
Big
Da
ta &
An
aly
tics
03

Bright future of 5G: boom of investment & adaptation all around the globe
27
5G expansion map around the globe
Notes: *commercial services are generally available to customers over a live 5G network. ** the operator has started actual construction/ installation/ deployment and maybe plotting the network in some locations.Source(s): GSA, GSMA
Launched*
Investing
Deploying/ have deployed**
5G
En
ab
led
Se
rvic
es
03
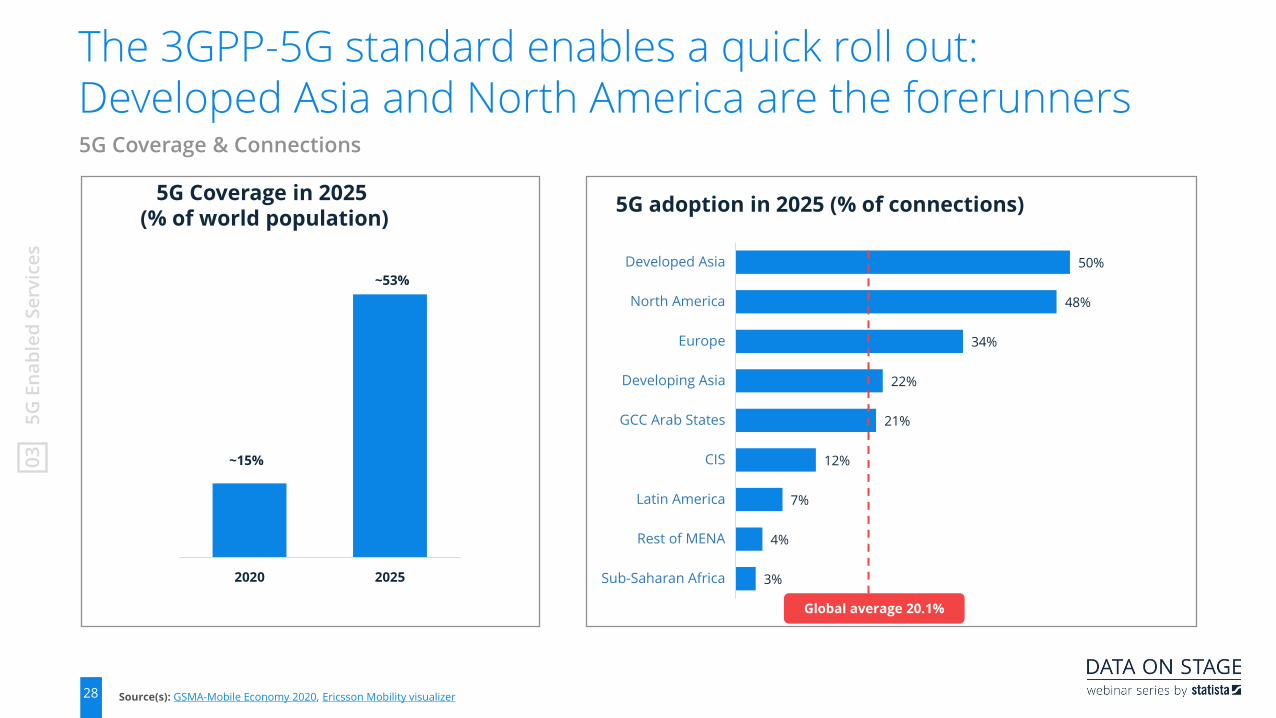
50%
48%
34%
22%
21%
12%
7%
4%
3%
Developed Asia
North America
Europe
Developing Asia
GCC Arab States
CIS
Latin America
Rest of MENA
Sub-Saharan Africa
The 3GPP-5G standard enables a quick roll out:Developed Asia and North America are the forerunners
28
5G Coverage & Connections
Source(s): GSMA-Mobile Economy 2020, Ericsson Mobility visualizer
Global average 20.1%
5G adoption in 2025 (% of connections)
2020 2025
~53%
~15%
5G Coverage in 2025(% of world population)
5G
En
ab
led
Se
rvic
es
03

The next technological revolution offers huge potential as 5G ecosystem expands – especially in B2B
29
Use cases enabled across industry sectors by evolving 5G features*
Note(s): *Expected future progress estimated by PWC & Economic forum, the forecasts and situation as of January 2020 Source(s): PWC & Economic Forum
Speed: 1–5 Gbps
Latency: <20ms
Speed: 10 Gbps
Latency: <10ms
Reliability 99.99%
Latency: <5ms
Reliability 99.99%
Latency: <1ms
Reliability >10 year battery
Devices: up to 1m/km²
Fleet & inventory management &
tracking
Autonomous cars
Expected economic value $13.2 trillion until 2035*
Enhanced mobile Broad
band
2019
Smart home
2020
Consumer AR/VR(Retail)
Smart Factory (Real-Time
Remote Control)
2022
AR/VR in Healthcare
2023
Real time banking
2024
Widespread IoT (Smart cities & agricultures)
20252021
5G
En
ab
led
Se
rvic
es
03

Why Software is also eating the B2B World?
30
B2B Markets
Digital Acceleration
Client Access in B2B Markets
Workforce Transformation
a. Client Expectationb. Platforms
a. Artificial Intelligenceb. Big Data and Analyticsc. 5G enabled services
a. Manage remote workb. Tech modernization
01
02
03
04
Chance or challenge?
05
Submityour questions via the chat window for the Q&A
happening at the end of the webinar.
You will receive an email with the answers next week.

Great shift to work remotely will accelerate success of digital first companiesRemote Work
of employees are expecting to work
remotely permanently
31%
Source: Unsplash, Wikibon31
Ma
na
ge
Re
mo
te W
ork
04

Employees value the great benefits of working remotelyBenefits to remote work 2020
Note(s): Australia, Canada, United Kingdom, United States; January 30 - February 10, 2020; 21 years and older; 3000+; Adult professionals who work remotely or have the option to work remotely and are in roles with digital output
Further information regarding this statistic can be found on page 8.Source(s): GitLab; ID 1111396
18%
23%26% 26%
34%36%
33% 32%
53%
19%
15%18%
25%
32%34% 33%
43%
50%
17% 16%13%
22%
28%
33%36%
50%
56%
22% 21% 21%
30%28%
32%
43%
39%
50%
0%
10%
20%
30%
40%
50%
60%
Reduced office
politics
Able to live where
you want to live
Freedom to
travel/relocate
Improved health
(mental, physical,
spiritual, etc.)
Reduced
anxiety/stress
Able to care for
family, pets,
aging/sick relatives,
etc.
Cost of savings Lack of commute Flexible scheduling
Sh
are
of
resp
on
de
nts
USA UK Canada Australia
32
Ma
na
ge
Re
mo
te W
ork
04

More and more companies face this trend and invest in software to orchestrate remote workB2B tech spending forecast in 2021, by products and services
Note(s): Worldwide; September 2020; 907 respondents; majority of respondents come from the United States
Further information regarding this statistic can be found on page 8.Source(s): TrustRadius; ID 1192744
64%53%
41% 38% 36% 33% 33% 32% 29% 27% 23% 21% 20% 18% 18% 14%
26%35%
40% 43% 45% 45% 42% 52%48% 46%
43% 50% 46%62% 55%
40%
7% 8% 15% 12% 14% 14% 14%11%
13% 18% 25% 22%22%
15%20%
22%
3% 3% 4% 7% 6% 6% 11% 6% 9% 9% 10% 6% 12% 5% 7%23%
0%
20%
40%
60%
80%
100%
120%
Sh
are
of
resp
on
de
nts
Spend more Spend the same Spend less N/A
33
04
Ma
na
ge
Re
mo
te W
ork
04

Tech modernization bares great chances for strong companies to scale their businesses in various areas Selective areas of technology modernization
SecurityTech Debt
Auto-mation
▪ GrafiK : Bild einer B2B Firma
Plattform-as-a-service
(Cloud)
Micro-services
34
Tech
Mo
de
rniz
ati
on
04

Source(s): Statista TMO35
Cloud Migration will continue to grow exponentiallyDevelopment of Platform-as-a-service revenue in Million USD
13,694 18,00024,774
34,00045,336
60,460
79,000
101,000
125,000
149,207
2016 2017 2018 20242019 2020 2021 2022 2023 2025
04
Tech
Mo
de
rniz
ati
on

Security will be crucial in times of increasing remote workSpending on information security products and services worldwide 2016-2024
Note(s): Worldwide; 2016 to 2019
Further information regarding this statistic can be found on page 8.Source(s): IDC; Statista; ID 640141
75,582,9
96,3
118,1125,2
174,7
0
20
40
60
80
100
120
140
160
180
200
2016 2017 2018 2019 2020* 2024*
Ma
rke
t in
bill
ion
U.S
. d
olla
rs
36
04
Tech
Mo
de
rniz
ati
on

Why Software is also eating the B2B World?
37
B2B Markets
Digital Acceleration
Client Access in B2B Markets
Workforce Transformation
a. Client Expectationb. Platforms
a. Artificial Intelligenceb. Big Data and Analyticsc. 5G enabled services
a. Manage remote workb. Tech modernization
01
02
03
04
Chance or challenge?
05
Submityour questions via the chat window for the Q&A
happening at the end of the webinar.
You will receive an email with the answers next week.
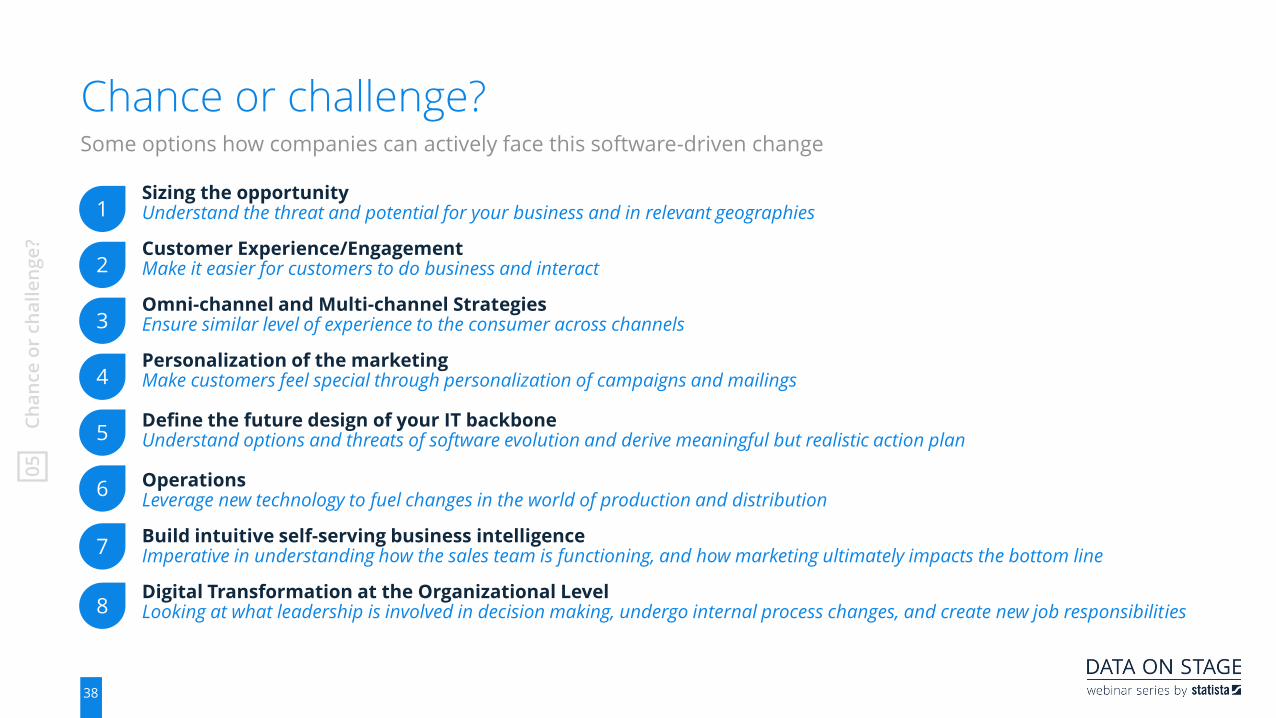
Sizing the opportunityUnderstand the threat and potential for your business and in relevant geographies
Customer Experience/Engagement Make it easier for customers to do business and interact
Omni-channel and Multi-channel StrategiesEnsure similar level of experience to the consumer across channels
Personalization of the marketingMake customers feel special through personalization of campaigns and mailings
Define the future design of your IT backboneUnderstand options and threats of software evolution and derive meaningful but realistic action plan
OperationsLeverage new technology to fuel changes in the world of production and distribution
Build intuitive self-serving business intelligenceImperative in understanding how the sales team is functioning, and how marketing ultimately impacts the bottom line
Digital Transformation at the Organizational LevelLooking at what leadership is involved in decision making, undergo internal process changes, and create new job responsibilities
Chance or challenge?
38
1
2
3
4
5
6
7
8
Some options how companies can actively face this software-driven change
Ch
an
ce o
rch
all
en
ge
?0
5

Key take aways
What can you take away from this session?
39
• Software has a huge impact on how people live and consume and hence has largely transformed the B2C world
• We are all humans – expectation and behavior also drives business decisions
• Maturing technology, such as AI, Big Data or Platform as a service has a high potential to also disrupt B2B value chains and markets
• Covid-19 was an accelerator for remote work which rewards agile companies – also in B2B
• B2B companies need realize and thoroughly assess the threats and opportunities of software to successfully manage the coming decade of tech transformation

Time to ask your questions!
40
• Please use the chat window to ask your questions now.• If you have more questions coming up after the webinar, kindly send them to [email protected].• In the next days, you will receive all answers via Email, alongside today‘s presentation.
E-MAIL E-MAIL
Peter KautzMD Statista Q
CONTACT US
Pia VanhoefenSenior Event Marketing Manager
Thank you for joining our webinar today!
Please see our website for more information about Statista.
Coming up nextDate: May 19, 2021Topic: Smart MobilitySpeaker: Niels Terfehr & Maria Andrades Sanchez
You will receive today‘s presentation and the Q&As next week via Email.

Why Software is also eating the B2B World?
42
B2B Markets
Digital Acceleration
Client Access in B2B Markets
Workforce Transformation
a. Client Expectationb. Platforms
a. Artificial Intelligenceb. Big Data and Analyticsc. 5G enabled services
a. Manage remote workb. Tech modernization
01
02
03
04
Chance or challenge?
05
Submityour questions via the chat window for the Q&A
happening at the end of the webinar.
You will receive an email with the answers next week.