Station Models How Meteorologist can look at a lot of cities’ data at once!
37
Station Models How Meteorologist can look at a lot of cities’ data at once!
-
Upload
janel-barker -
Category
Documents
-
view
219 -
download
1
Transcript of Station Models How Meteorologist can look at a lot of cities’ data at once!

Station ModelsHow Meteorologist can look at a lot of cities’ data
at once!


Temp
Temperature information in degrees Fahrenheit.
70No LABEL: ex 70 degrees Fahrenheit

Temp
dewpt
Dew Point Temperature in degrees Fahrenheit.
No LABEL: ex 70 degrees Fahrenheit with a Dp of 60 degrees Fahrenheit
70
60

Total amount of cloud
graphic depiction of percentage of the sky covered by clouds

no clouds
about 10%
about 25%
about 40%
about 50%
about 60%
about 75%
about 80%
completely overcast
sky obscured

What is the present weather?
The current weather is very important.
A detailed set of symbols provides weather descriptions.
Found here!

100 different symbols provide details about the PRESENT
WEATHER.

Samples of present weather symbols.
fog
haze
thunderstorm
, drizzle
lightning
rain
* snow
slight rain showers
. ice or snow pellets
cloud development not observed

Intensity of Weather Conditions
Sometimes to show higher/lower intensity more/less of the same
symbol is used

Wind direction
A staff is rotated around the station.
Remember, winds are identified as the direction FROM which they come. This would be a (WNW) west northwest wind or about 290º.

Wind Speed
Attached to the staff are symbols for speed.

The coding for the wind speed symbols can be generalized as:
half staff about 5 knots note, it is not on the end of the wind direction
staff
full staff about 10 knots
these are additive for the total amounts
three full staffs=30 knots

pressure
Current Barometric Pressure
Always is shown as a 3 digit number. They represent the tens, ones and
tenths place.
Ex. 1013.4 mb = 134

Barometric Pressure is VERY important!
average barometric pressure at sea level is 1013.25 mb.
current barometric pressure is reported to the nearest TENTH
BUT, they don’t want to waste space

average barometric pressure at sea level is 1013.25 mb.
barometric pressure varies around this value
1013.3
somewhat higher
somewhat lower
+ about 30 = 1043
- about 30 = 983

average barometric pressure at sea level is 1013.25 mb.
barometric pressure varies around this value
they do not PRINT the beginning number or numbers
they, also, do not PRINT the decimal point, but report to the
nearest TENTH
1013.3 ---- 13.3 x 133

How would each of these pressures be recorded on a station model?
1014.9 mb
1010.5 mb
1000.3 mb
987.6 mb
1010 mb
1000 mb

How would each of these pressures be recorded on a station model?
1014.9 mb
1010.5 mb
1000.3 mb
987.6 mb
1010 0 mb
1000 0 mb
149
105
003
879
100
000

From the three numbers, you must INTERPRET whether the preceding
value is
10
or
9
Which would make the value most realistic?

What the value on the station model represents:
GREATER than 5, place a 9 before it.
LESS THAN or EQUAL to 5, place a 10 before it
and add a decimal between the last two digits
GREATER than 5, place a 9 before it.
and add a decimal between the last two digits
999
999.9 mb

What the value on the station model represents:
GREATER than 5, place a 9 before it.
LESS THAN or EQUAL to 5, place a 10 before it
and add a decimal between the last two digits
842 GREATER than 5, place a 9 before it.
and add a decimal between the last two digits
984.2 mb

What the value on the station model represents:
GREATER than 5, place a 9 before it.
LESS THAN or EQUAL to 5, place a 10 before it
and add a decimal between the last two digits
731 GREATER than 5, place a 9 before it.
and add a decimal between the last two digits
973.1 mb

What the value on the station model represents:
GREATER than 5, place a 9 before it.
LESS THAN or EQUAL to 5, place a 10 before it
and add a decimal between the last two digits
600 GREATER than 5, place a 9 before it.
and add a decimal between the last two digits
960.0 mb

What the value on the station model represents:
GREATER than 5, place a 9 before it.
LESS THAN or EQUAL to 5, place a 10 before it
and add a decimal between the last two digits
599 LESS THAN or EQUAL to 5, place a 10 before it
and add a decimal between the last two digits
1059.9 mb

What the value on the station model represents:
GREATER than 5, place a 9 before it.
LESS THAN or EQUAL to 5, place a 10 before it
and add a decimal between the last two digits
406 LESS THAN or EQUAL to 5, place a 10 before it
and add a decimal between the last two digits
1040.6 mb

What the value on the station model represents:
GREATER than 5, place a 9 before it.
LESS THAN or EQUAL to 5, place a 10 before it
and add a decimal between the last two digits
024 LESS THAN or EQUAL to 5, place a 10 before it
and add a decimal between the last two digits
1002.4 mb

What the value on the station model represents:
GREATER than 5, place a 9 before it.
LESS THAN or EQUAL to 5, place a 10 before it
and add a decimal between the last two digits
000 LESS THAN or EQUAL to 5, place a 10 before it
and add a decimal between the last two digits
1000.0 mb

Therefore, the LARGEST barometric pressure represented on a station model is 1059.9mb
and is recorded on a station model as 599

And the SMALLEST barometric pressure represented on a station model is 960.0 mb
and is recorded as 600
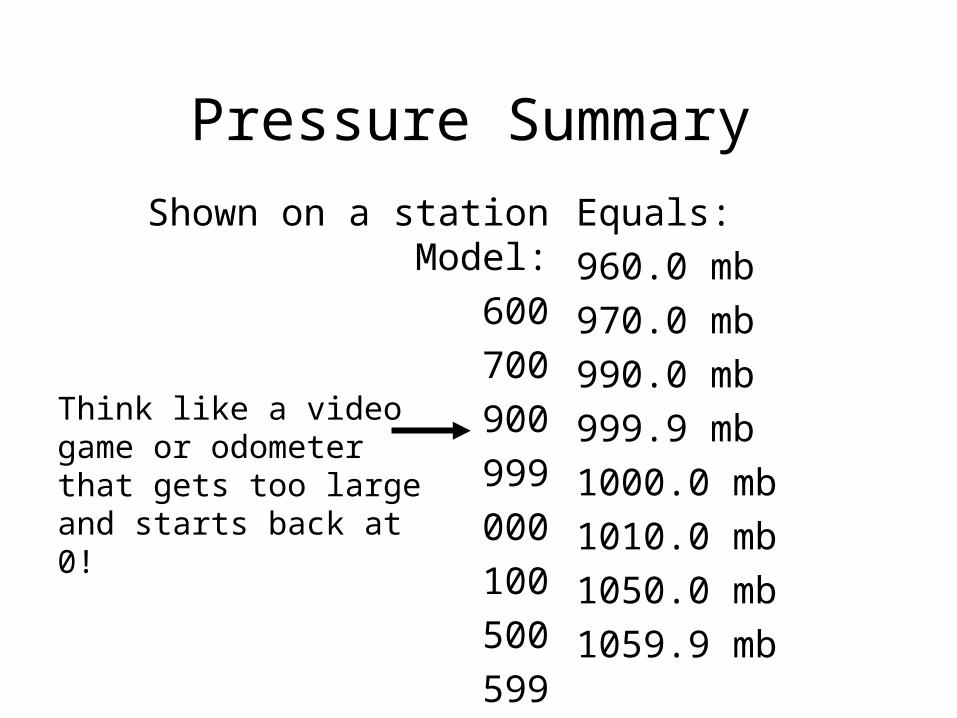
Pressure Summary
Shown on a station Model:
600
700
900
999
000
100
500
599
Equals:
960.0 mb
970.0 mb
990.0 mb
999.9 mb
1000.0 mb
1010.0 mb
1050.0 mb
1059.9 mb
Think like a video game or odometer that gets too large and starts back at 0!

Not only is the pressure itself important, but so is the way the pressure has been changing.
So, more information may be given and must be coded.

Pressure trend
change
How much the pressure has changed
The pattern and amount of change in the past three hours
Again, reported in TENTHS without the decimal or label
+ it is higher now than in the past
- it is lower now than in the past

How would the following barometric trends be recorded on a station model?
Over the past 3 hours, the pressure has been steadily increasing at a rate of
1.2 mb 1mb
0.9 mb

steadily increasing means
a “+” symbol
followed by the ones and tenths place (no decimal or label)
then the symbol
1.2 mb = +12/1mb = +10/
0.9 mb = +09/

Other info:Visibility Amount of precip.
Amount of precipitation is plotted in inches to the
nearest hundredth of an inch.
Visibility is given in miles and fractions

Temperature= 45FDewpoint= 32FWind NE at 20 knotsOvercastVisibility= 1.5 milesRain ShowersPressure Now= 997.3 mbPressure 3 hrs. ago= 1000.2mbBarometer FallingPrecipitation in last 6 hrs.= .53 in.
Draw a Station Model for These Conditions:
©S. Kluge 2007
Back to the Station Model