Static and Dynamic Analysis at Ning - sklar.com : david sklar
28
Transcript of Static and Dynamic Analysis at Ning - sklar.com : david sklar

What?
• Static analysis: what can you learn from
looking at the source code?
• Dynamic analysis: what can you learn
from looking at the running code?
• Both: understand what your application is
doing and can do

Why?
• Ning’s “Your Own Social Network”
application is ~206kloc and growing
• Developers on 4 continents
• Enforce code standards, check
deprecated usage, monitor performance,
evaluate API change impact

Static #1: Text Munching
• Regexes or pattern matching to look
for good/bad things in code
• Works nicely in unit tests

Static #2: Tokenizer
• More PHP-aware version of text munching
• Also useful in unit tests or standalone code
analysis projects

Tokenizer Example
• Where does the code write to the
filesystem?
• Step 1: Find function calls (with tokenizer)
• Step 2: Find which ones do writes (with
human)

AST Detour
• http://pecl.php.net/parse_tree
• http://trac2.assembla.com/php-ast
• http://www.phpcompiler.org/

Static #3: Opcode Dump
• PHP has its own virtual machine
• vld extension shows you the opcodes that
your PHP code is turned in to
• http://www.derickrethans.nl/vld.php
• In general fewer opcodes → better
performance

Opcode Dump Example
• What’s the difference between:
isset($fruit['peaches'])
and
array_key_exists('peaches', $fruit)
?

Dynamic #1: Profiling
• Xdebug provides bountiful profiling
information
• http://www.xdebug.org/

Xdebug Configuration
• Enable xdebug
• Turn on profiling (or trigger)
• Set output directory and filename pattern
zend_extension=/full/path/to/xdebug.so
xdebug.profiler_enable=0
xdebug.profiler_enable_trigger=1
xdebug.profiler_output_dir=/tmp
xdebug.profiler_output_name=prof.%H.%R.%u.out

Files can be large…
% ls -l
-rw-r--r-- 1 daemon daemon 4746558 May 7 17:52
prof.localhost._index_php_profiles_friend_list_XDEBUG_PR
OFILE=1.1210182719_781004.out
% wc –l p*
338909
prof.localhost._index_php_profiles_friend_list_XDEBUG_PR
OFILE=1.1210182719_781004.out

View with Kcachegrind…
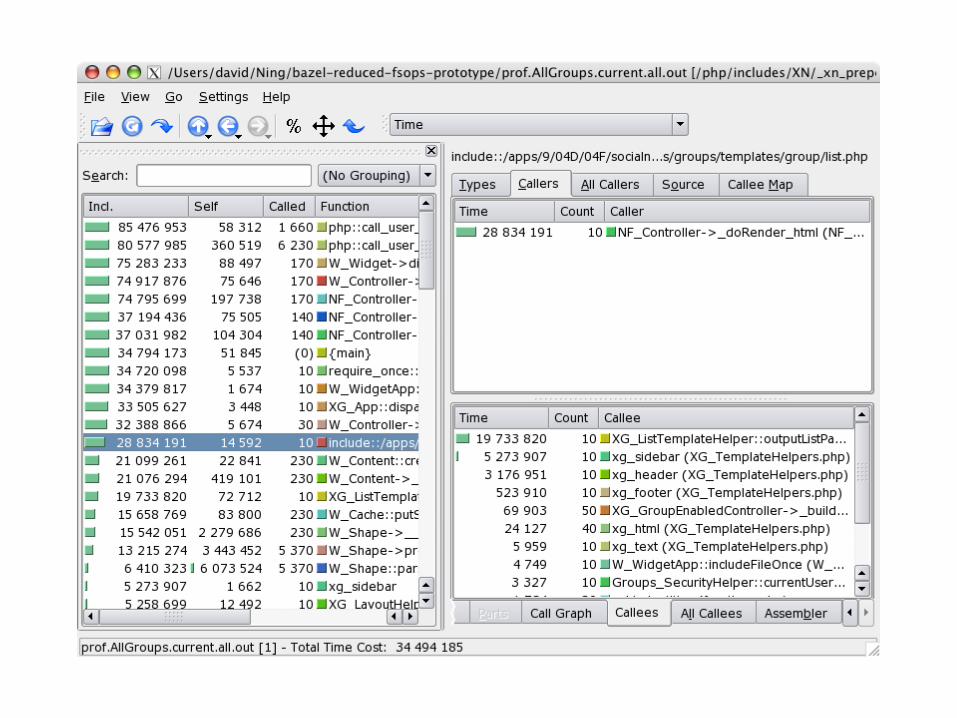

Viewing Tools
• Kcachegrind: Linux, OS X, Windows,
Cygwin
(http://kcachegrind.sourceforge.net/)
• WinCacheGrind: Windows
(http://sourceforge.net/projects/wincachegrind/)
• Webgrind: All
(http://code.google.com/p/webgrind/)
• ct_annotate: All (@see valgrind)

Dynamic #2: Function Traces
• Xdebug again!
• Each function entry/exit recorded

Easy to parse/analyze
• One line on entering a stack frame, one on
leaving. Fields are tab-delimited:
Line
Type
Field
1 2 3 4 5 6 7 8 9 10
Entry
Frame
Level
Frame
Number
0 = Entry
Time Memory
Function
0 =
internal,
1 = user-
defined
Included
filefile line
Exit 1 = Exit

Function Trace Example
• Stack traces wherever a file is included

Dynamic #3: strace/truss
• Strace on linux, truss on solaris
• (ktrace on os x)

strace example
• Parsing entire strace output to get syscall
census
• Files can (familiar refrain) be large
truss example
• Use fancy truss options (library names,
function name prefixes) to find when
certain PHP functions are invoked.
ltrace
• ltrace on linux is a “library call tracer”
• Performance overhead significant, hasn’t
been as useful

Dynamic #4: DTrace
• DTrace’s capabilities are Mighty and
Numerous
• No special setup (other than installing
DTrace + provider)
• No* production performance impact
• PHP Provider: http://pecl.php.net/dtrace
• Solaris, Leopard

DTrace Example #1
• Flow between PHP functions and system
functions

DTrace Example #2
• What’s everything* that happens when PHP
does something simple?
• (*everything = PHP scripts, PHP internals,
libc, syscalls, kernel)

systemtap
• systemtap is a Linux tool that allows for
user-written in-kernel profiling scripts
similar to DTrace

Summary
• Static: Pattern matching, tokenizer,
opcode analysis
• Dynamic: Profiling, function traces, strace,
truss, dtrace
• Slides, etc.: http://www.sklar.com/blog/

Come Work at !
• Build the software that powers > 460,000
social networks
• PHP, REST, JSON, XML, APIs, C, Ruby,
Python, Apache, and friends
• Work in Palo Alto, CA (or not)
• Visit us in the Exhibit Hall
• http://jobs.ning.com – [email protected]