static-content.springer.com10.1007... · Web viewSupplementary Information Prognostic Metabolite...
15
Supplementary Information Prognostic Metabolite Biomarkers for Soft Tissue Sarcomas Discovered by Mass Spectrometry Imaging Sha Lou 1 , Benjamin Balluff 1,2 , Arjen H.G. Cleven 3 , Judith V.M.G. Bovée 3 , Liam A. McDonnell 1,3,4* Authors’ affiliations 1 Center for Proteomics and Metabolomics, Leiden University Medical Center, Leiden, The Netherlands 2 Maastricht MultiModal Molecular Imaging institute M4I), Maastricht University, Maastricht, The Netherlands 3 Department of Pathology, Leiden University Medical Center, Leiden, The Netherlands 4 Fondazione Pisana per la Scienza ONLUS, Pisa, Italy * Corresponding author Corresponding authors and reprint requests: Dr. Liam A. McDonnell Center for Proteomics and Metabolomics Leiden University Medical Center Einthovenweg 20 2333 ZC Leiden The Netherlands E-mail: [email protected] 1
Transcript of static-content.springer.com10.1007... · Web viewSupplementary Information Prognostic Metabolite...

Supplementary Information
Prognostic Metabolite Biomarkers for Soft Tissue Sarcomas Discovered by Mass
Spectrometry Imaging
Sha Lou1, Benjamin Balluff1,2, Arjen H.G. Cleven3, Judith V.M.G. Bovée3, Liam A.
McDonnell1,3,4*
Authors’ affiliations
1 Center for Proteomics and Metabolomics, Leiden University Medical Center, Leiden, The
Netherlands
2 Maastricht MultiModal Molecular Imaging institute M4I), Maastricht University,
Maastricht, The Netherlands
3 Department of Pathology, Leiden University Medical Center, Leiden, The Netherlands
4 Fondazione Pisana per la Scienza ONLUS, Pisa, Italy
* Corresponding author
Corresponding authors and reprint requests: Dr. Liam A. McDonnellCenter for Proteomics and MetabolomicsLeiden University Medical CenterEinthovenweg 202333 ZC LeidenThe NetherlandsE-mail: [email protected]: +31 71 526 8744Fax: +31 71 526 6907
1

Table of contents
Supplementary Figure 1. Data distribution of assigned mass………………………………3
Supplementary Figure 2. MALDI-FTICR-MSI data of AMP, ADP and ATP……………..4
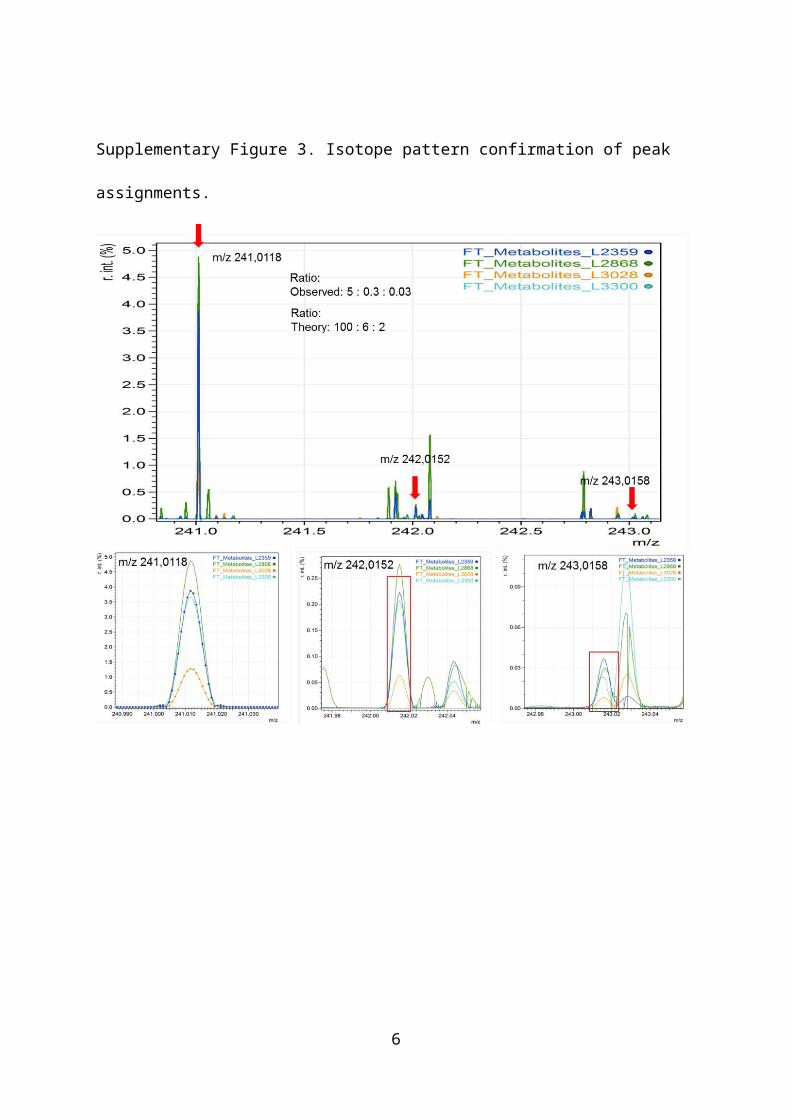
Supplementary Figure 3. Isotope pattern confirmation of peak assignments………………5
Supplementary Figure 4. Comparison of MALDI-ToF and MALDI-FTICR spectra……...6
Supplementary Figure 5. Example MS images of with and without TIC normalization…..7
Supplementary Figure 6. Overview of metabolite ions detected by SAM with FDR <5%...8
Supplementary Table 1. ClinProTools setting for quality control………………………….9
Supplementary Table 2. Dataset inclusion criteria…………………………………………10
Supplementary Table 3. Parameters for mass spectral processing in MATLAB…………..11
2
Supplementary Figure 1. Data distribution of m/z 240.88.
3

Supplementary Figure 2. MALDI-FTICR-MSI experimental data of AMP, ADP and ATP.
Note datasets not recalibrated (improved mass accuracy could be obtained by recalibrating on
AMP, ADP and ATP).
4

Supplementary Figure 3. Isotope pattern confirmation of peak assignments.
5
Supplementary Figure 4. Comparison of MALDI-ToF and MALDI-FTICR spectra obtained
from sequential tissue sections. a) and b) show the total mass spectra obtained from the
MALDI-ToF and MALDI-FTICR respecitively. c) – h) show close ups of the regions of the
prognostic metabolites reported here (indicated with colored bars).
6

Supplementary Figure 5. Example MS images with and without TIC normalization. (a-c)/(g-
i) are TIC normalized MS images (indicated with a T); (d-f)/(j-l) are the original images prior
to TIC normalization, and which showed similar visualizations. The images are of the
prognostic metabolite ions reported here, namely m/z 241.03, m/z 180.94 and m/z 160.87.
(a) (b) (c)
(e) (f)
(g) (h) (i)
(j) (k) (l)
(d)
7

Supplementary Figure 6. Overview of the five metabolite ions detected by SAM analysis with
FDR <5%. Upon Kaplan-Meier analysis two of the ions had P values greater than 0.05
(marked in red). Only those metabolite ions that were found to be associated with survival by
SAM and Kaplan-Meier analysis were included in the main manuscript.
8

Supplementary Table 1. ClinProTools’ setting for quality control.
Parameter SettingResolution 3000Baseline
SubtractionTop Hat Baseline
10% Minimal Baseline WidthMass Range 100-1000Null spectra Exclusion Enable
Recalibration1000ppm Maximal Peak Shift
10% Match to Calibration PeaksExclude not Recalibratable Spectra
9

Supplementary Table 2. Datasets inclusion criteria.
Sample selection criteria
Viable area 60%Sample source Primary tumorsConsistent diagnosis Yes
MSI quality control
Excluded spectra %) <40%Measurement bias Randomized measurement sequence
Histology evaluation
The integrity of the tissue section
>= 70% 1
1) several sections (mainly bone sarcoma samples) did not survive the tissue wash to remove
excess matrix or the histological staining procedure.
10

Supplementary Table 3. Parameters for spectra processing in MATLAB.
Phase Parameter ValuePeak picking on sample spectra for alignment
Spectrum to use Mean TICKaiser smoothing window [data points] 25Resampling rate [Da] 0.01M/z block [Da] 20
Baseline subtraction TopHat with filter width 100,000
Minimum signal-to-noise 5Minimum half peak width 0.03Number of reference peaks 5 (equally weight)
Peak clustering tolerance [ppm]1500(m/z 0-200);800(m/z 200-500);600(m/z 500-1000)
Minimum peak detection rate 98%Alignment
Width of pulses msalign function) [Da] 0.05Maximum shift [Da] [-0.3,0.3]Resampling rate [Da] 0.01
Peak picking on global mass spectrumSpectrum to use Basepeak spectrumSmoothing window [data points] 15 (lowess)TopHat baseline subtraction width [data points] 100000
Minimum signal-to-noise 0.4% of base peakRead-out of data and processing
Use intensity or area of peaks AreaSpectrum normalization TICRemove extreme mass spectra according to TIC 1% highest and 1% lowest
Offset for spatial arrangement of samples [px] 10
11