static-content.springer.com10.1007... · Web [email protected] Table S1 Review of the gaseous...
15
Supporting Information for: Characteristics of Ammonia Gas and Fine Particulate Ammonium from Two Distinct Urban Areas: Osaka, Japan and Ho Chi Minh City, Vietnam Duong Huu Huy a,b *, Le Tu Thanh b , To Thi Hien b , Kazushi Noro a and Norimichi Takenaka a a Department of Applied Chemistry, Graduate School of Engineering, Osaka Prefecture University, 1–1 Gakuen– cho, Naka–ku, Sakai–shi, Osaka 599–8531, Japan b Faculty of Environmental Science, University of Science, Vietnam National University–Ho Chi Minh City, 227 Nguyen Van Cu Street, District 5, Ho Chi Minh City, Vietnam *Corresponding author: Tel.: (+81) (0) 72 254 9322, email: [email protected]
Transcript of static-content.springer.com10.1007... · Web [email protected] Table S1 Review of the gaseous...

Supporting Information for:
Characteristics of Ammonia Gas and Fine Particulate Ammonium from Two Distinct Urban Areas: Osaka, Japan
and Ho Chi Minh City, Vietnam
Duong Huu Huya,b*, Le Tu Thanhb, To Thi Hienb, Kazushi Noroa and Norimichi Takenakaa
a Department of Applied Chemistry, Graduate School of Engineering, Osaka Prefecture University, 1–1 Gakuen–cho, Naka–ku, Sakai–shi, Osaka 599–8531,
Japan
b Faculty of Environmental Science, University of Science, Vietnam National University–Ho Chi Minh City, 227 Nguyen Van Cu Street, District 5, Ho Chi Minh
City, Vietnam
*Corresponding author: Tel.: (+81) (0) 72 254 9322, email: [email protected]
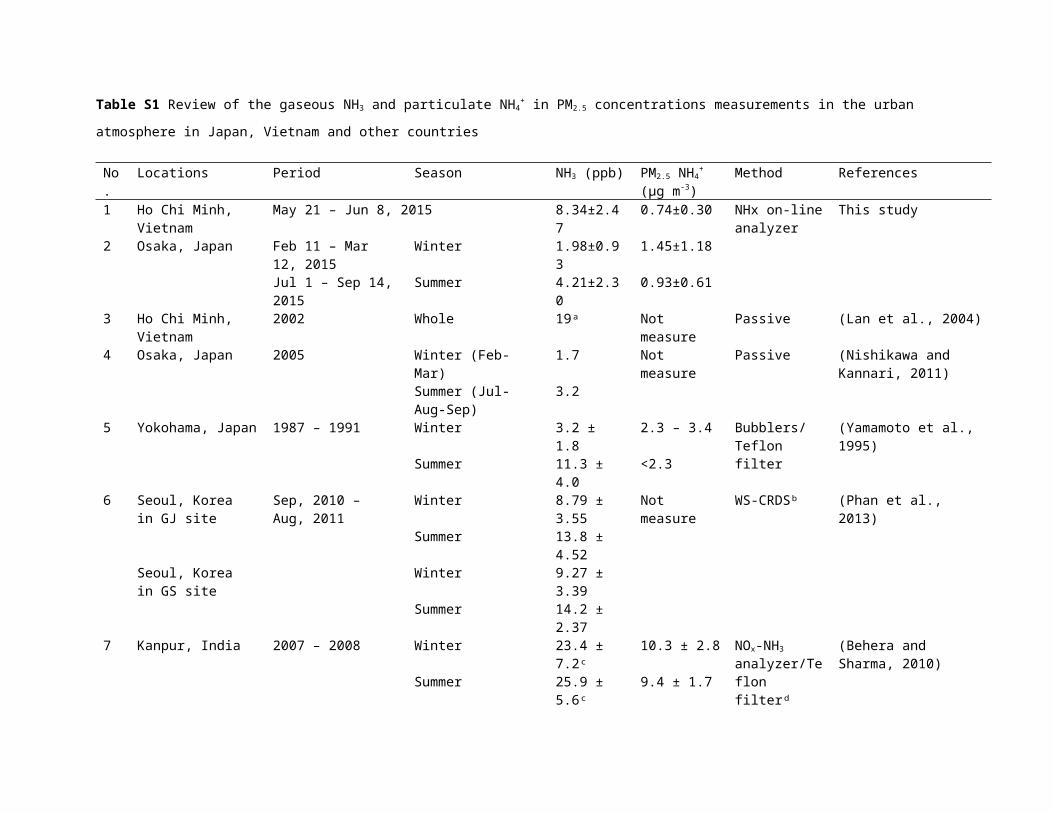
Table S1 Review of the gaseous NH3 and particulate NH4+ in PM2.5 concentrations measurements in the urban atmosphere in Japan, Vietnam and other countries
No.
Locations Period Season NH3 (ppb) PM2.5 NH4+
(µg m-3)Method References
1 Ho Chi Minh, Vietnam
May 21 – Jun 8, 2015 8.34±2.47 0.74±0.30 NHx on-line analyzer
This study
2 Osaka, Japan Feb 11 – Mar 12, 2015 Winter 1.98±0.93 1.45±1.18Jul 1 – Sep 14, 2015 Summer 4.21±2.30 0.93±0.61
3 Ho Chi Minh, Vietnam
2002 Whole 19ᵃ Not measure Passive (Lan et al., 2004)
4 Osaka, Japan 2005 Winter (Feb-Mar) 1.7 Not measure Passive (Nishikawa and Kannari, 2011)Summer (Jul-Aug-Sep) 3.2
5 Yokohama, Japan 1987 – 1991 Winter 3.2 ± 1.8 2.3 – 3.4 Bubblers/Teflon filter
(Yamamoto et al., 1995)Summer 11.3 ± 4.0 <2.3
6 Seoul, Koreain GJ site
Sep, 2010 – Aug, 2011 Winter 8.79 ± 3.55 Not measure WS-CRDSᵇ (Phan et al., 2013)Summer 13.8 ± 4.52
Seoul, Koreain GS site
Winter 9.27 ± 3.39Summer 14.2 ± 2.37
7 Kanpur, India 2007 – 2008 Winter 23.4 ± 7.2ᶜ 10.3 ± 2.8 NOx-NH3 analyzer/Teflon filterᵈ
(Behera and Sharma, 2010)Summer 25.9 ± 5.6ᶜ 9.4 ± 1.7
8 Shanghai, China 2013 – 2014 Winter 5.0 ± 3.2 Not measure DOASᵉ (Wang et al., 2015)Summer 9.1 ± 4.7
9 Barcelona, Spain May 6 – Sep 7, 2011 (Background)
Summer 2.9 ± 1.3 Not measure AiRRmonia instrument
(Pandolfi et al., 2012)
May 13 – Jun 28, 2011 (Traffic)
Summer 7.5 ± 2.8
10 Manchester, UK 2004 – 2005 Winter 2.4 Not measure QCLASᶠ (Whitehead et al., 2007)Summer 3.0
11 Rome, Italy 2001 – 2002 (Traffic) Winter 25.3 ± 3.9ᶜ Not measure Annular Denuder
(Perrino et al., 2002)Summer 24.1 ± 4.2ᶜ
2001 – 2002 (Background)
Winter 4.8 ± 0.4ᶜSummer 5.7 ± 1.4ᶜ
12 Atlanta, GA, US 2004 1.24 ± 0.62 1.78 ± 1.11 Denuder/Teflon filter
(Edgerton et al., 2007)North Birmingham, AL, US
2.44 ± 1.74 1.58 ± 1.03
Gulfport, MS, US 0.56 ± 0.33 1.10 ± 0.93Pensacola, FL, US 0.75 ± 0.45 1.07 ± 0.72
13 Atlanta, GA, US Jul – Dec, 2007 1.35 ± 1.19 1.71 (Saylor et al., 2010)14 Houston, TX, US Feb 12 – Mar 1, 2010 Winter 2.42 ± 1.16 Not measure EC-QCL- based (Gong et al., 2011)
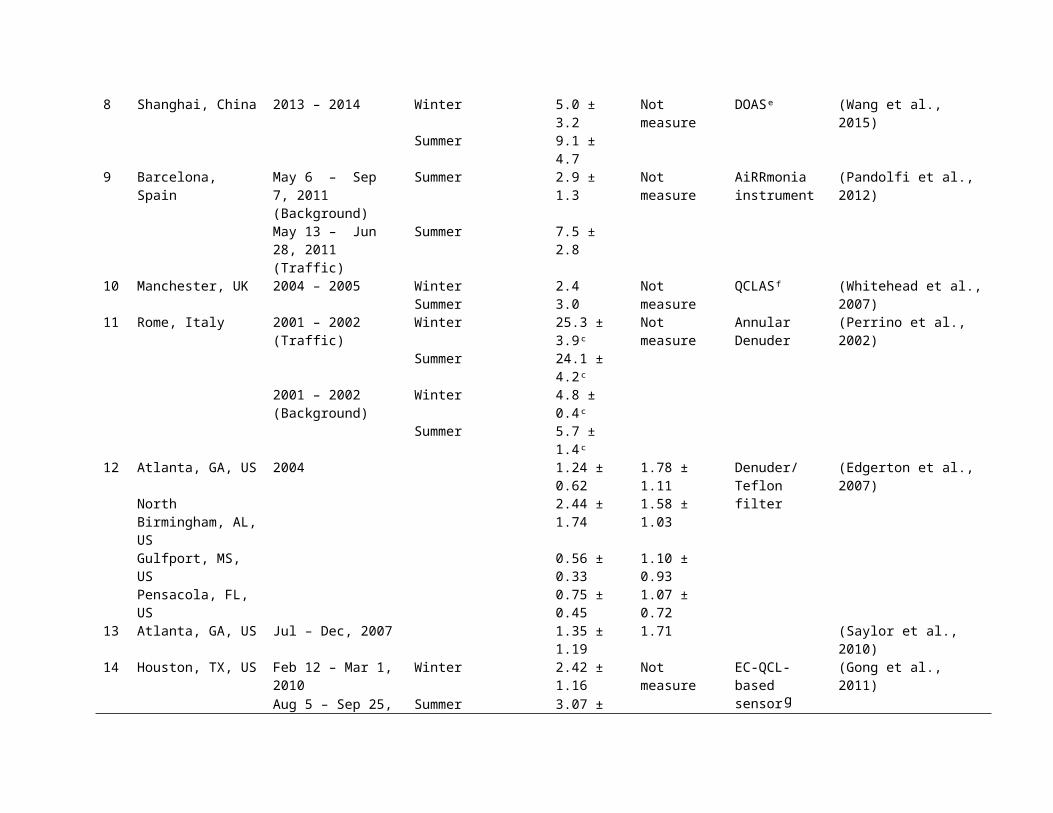
sensorᶢAug 5 – Sep 25, 2010 Summer 3.07 ± 2.87
Notes: ᵃ Estimation from the reported result; ᵇ WS-CRDS, Wavelength Scanned-Cavity Ring Down Spectroscopy; ᶜ Calculation from original data with unit of
µg m-3; ᵈ NH3 measured by NOx-NH3 analyzer and NH4+ in PM2.5 collected on Teflon filter and analyzed by ion chromatography; ᵉ DOAS, Differential optical
absorption spectroscopy; ᶠ QCLAS, Aerodyne quantum cascade laser absorption spectrometer; ᶢ EC-QCL, External cavity quantum cascade laser-based sensor.

Table S2 Summary of several NO plumes measured at the Osaka urban area during February and March 2015
Plumes ∆NH3/∆NO (mol/mol) Regression fits Correlation coefficients (R2)
12/2 0.30 Y = 0.22 X + 0.99 0.6414/2 0.86 Y = 0.61 X + 0.75 0.5215/2 0.55 Y = 0.53 X + 1.41 0.4616/2-1 0.077 Y = 0.07 X + 0.58 0.8716/2-2 0.78 Y = 0.96 X – 0.55 0.8924/2 0.057 Y = 0.038 X + 2.2 0.6525/2-1 0.36 Y = 0.25 X + 2.5 0.4525/2-2 0.24 Y = 0.22 X + 1.5 0.9226/2 0.1 Y = 0.12 X + 2.7 0.55Average 0.37 ± 0.30
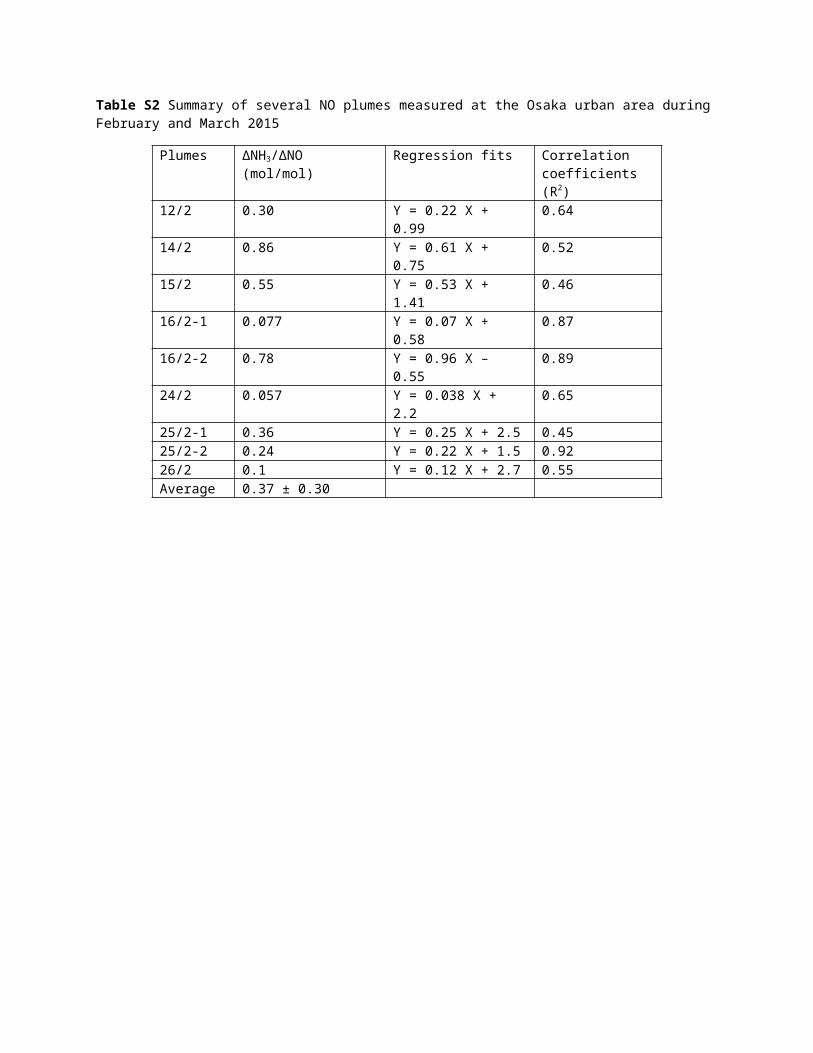
Fig. S1 Sampling locations in Osaka, Japan (left) and Ho Chi Minh City, Vietnam (right). Sampling points

Fig. S2 Time series concentrations of NH3 gas (top panel) and PM2.5NH4+ (bottom panel) measured at the urban
Osaka site over the periods February and March 2015 (green line) and July, August and September 2015 (red line)

Fig. S3 Time series concentrations of NH3 gas (top panel) and PM2.5NH4+ (bottom panel) measured at the urban
HCMC site over the period 21 May – 8 June 2015
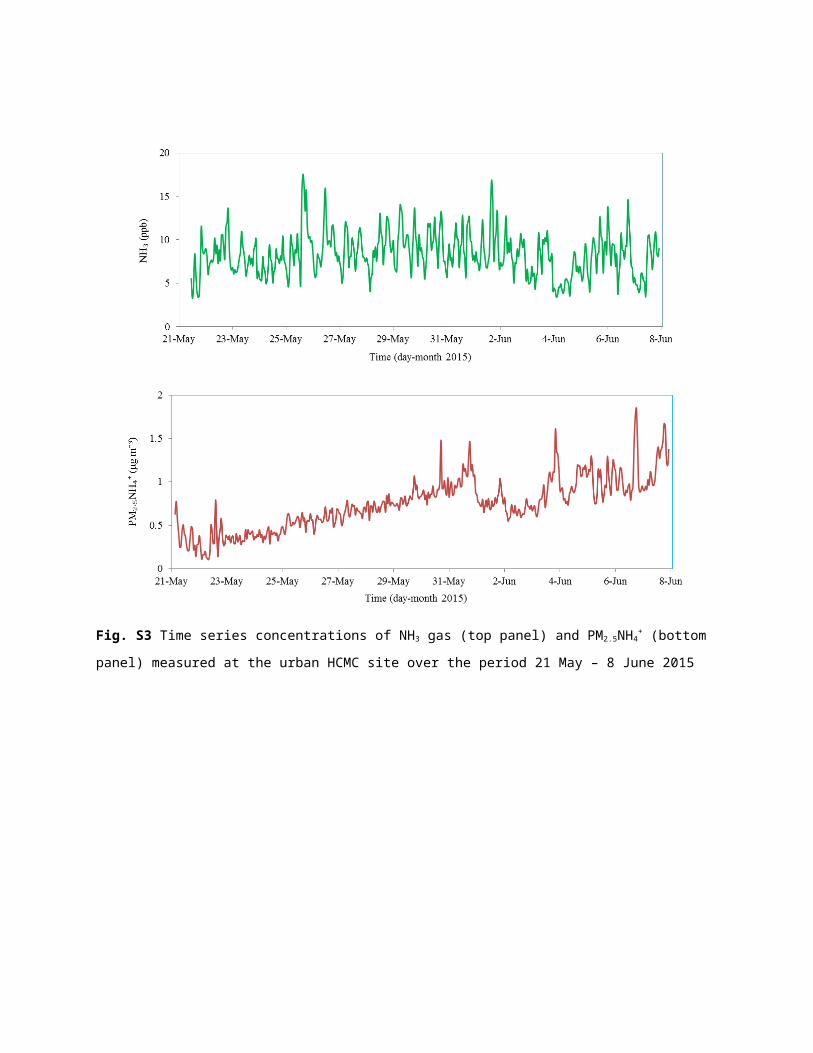
Fig. S4 Correlation between PM2.5NH4+ and PM2.5 mass concentrations measured at the urban Osaka site (left panel),
and at the urban HCMC site (right panel)

Fig. S5 Diurnal variations of SO2, NO, traffic intensity, relative humidity (RH), temperature (Temp.), Ozone, Solar radiation (SR), wind speed (WS) and Planetary boundary layer height (PBL) measured at the urban Osaka site over the periods February and March 2015 (left panels) and July, August and September 2015 (right panels). Solid symbols represent the average concentrations. Top and bottom whiskers show one standard deviation (± SD) calculated from the average concentrations. Note that the planetary boundary layer heights with 3h resolution were achieved from the United State National Oceanic and Atmospheric Administration (NOAA) Real-time Environmental Application and Display System (READY)
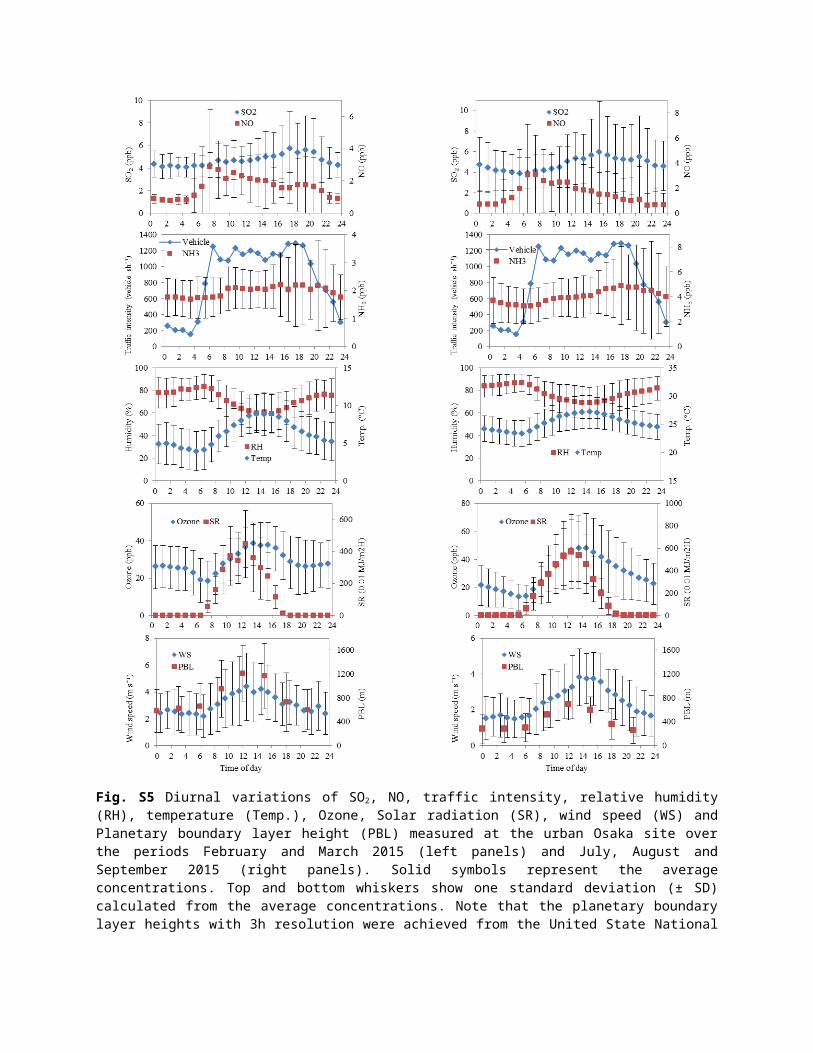
Fig. S6 Diurnal variations of NOx, Solar radiation (SR), O3, Planetary boundary layer height (PBL), Wind speed
(WS), Relative humidity (RH) and Temperature measured at the urban HCMC site over the period 21 May – 8 June
2015. Solid symbols represent the average concentrations. Top and bottom whiskers show one standard deviation (±
SD) calculated from the average concentrations. Note that the planetary boundary layer heights with 3h resolution
were achieved from the United State National Oceanic and Atmospheric Administration (NOAA) Real-time
Environmental Application and Display System (READY)

(a)
(b)
Fig. S7 Impacts of temperature and relative humidity on the ammonium particle fractions measured at the urban
Osaka site (a) and at the urban HCMC site (b)

References
Behera, S.N., Sharma, M., 2010. Investigating the potential role of ammonia in ion chemistry of fine particulate
matter formation for an urban environment. Science of The Total Environment 408, 3569-3575.
Edgerton, E.S., Saylor, R.D., Hartsell, B.E., Jansen, J.J., Alan Hansen, D., 2007. Ammonia and ammonium
measurements from the southeastern United States. Atmospheric Environment 41, 3339-3351.
Gong, L., Lewicki, R., Griffin, R., Flynn, J., Lefer, B., 2011. Atmospheric ammonia measurements in Houston, TX
using an external-cavity quantum cascade laser-based sensor. Atmospheric Chemistry and Physics 11, 9721-9733.
Lan, T.T.N., Nishimura, R., Tsujino, Y., Imamura, K., Warashina, M., Hoang, N.T., Maeda, Y., 2004. Atmospheric
Concentrations of Sulfur Dioxide, Nitrogen Oxides, Ammonia, Hydrogen Chloride, Nitric Acid, Formic and Acetic
Acids in the South of Vietnam Measured by the Passive Sampling Method. Analytical Sciences 20, 213-217.
Nishikawa, Y., Kannari, A., 2011. Atmospheric Concentration of Ammonia, Nitrogen Dioxide, Nitric Acid, and
Sulfur Dioxide by Passive Method within Osaka Prefecture and Their Emission Inventory. Water Air Soil Pollut
215, 229-237.
Pandolfi, M., Amato, F., Reche, C., Alastuey, A., Otjes, R.P., Blom, M.J., Querol, X., 2012. Summer ammonia
measurements in a densely populated Mediterranean city. Atmos Chem Phys 12, 7557-7575.
Perrino, C., Catrambone, M., Di Menno Di Bucchianico, A., Allegrini, I., 2002. Gaseous ammonia in the urban area
of Rome, Italy and its relationship with traffic emissions. Atmospheric Environment 36, 5385-5394.
Phan, N.-T., Kim, K.-H., Shon, Z.-H., Jeon, E.-C., Jung, K., Kim, N.-J., 2013. Analysis of ammonia variation in the
urban atmosphere. Atmos Environ 65, 177-185.
Saylor, R.D., Edgerton, E.S., Hartsell, B.E., Baumann, K., Hansen, D.A., 2010. Continuous gaseous and total
ammonia measurements from the southeastern aerosol research and characterization (SEARCH) study. Atmospheric
Environment 44, 4994-5004.
Wang, S., Nan, J., Shi, C., Fu, Q., Gao, S., Wang, D., Cui, H., Saiz-Lopez, A., Zhou, B., 2015. Atmospheric
ammonia and its impacts on regional air quality over the megacity of Shanghai, China. Scientific Reports 5, 15842.
Whitehead, J.D., Longley, I.D., Gallagher, M.W., 2007. Seasonal and Diurnal Variation in Atmospheric Ammonia
in an Urban Environment Measured Using a Quantum Cascade Laser Absorption Spectrometer. Water, Air, and Soil
Pollution 183, 317-329.
Yamamoto, N., Nishiura, H., Honjo, T., Ishikawa, Y., Suzuki, K., 1995. A long-term study of atmospheric ammonia
and particulate ammonium concentrations in Yokohama, Japan. Atmospheric Environment 29, 97-103.