Statewide General Obligation Bond Sales Practices
35
Thomas A. Schweich Missouri State Auditor http://auditor.mo.gov STATEWIDE General Obligation Bond Sales Practices Report No. 2013-116 November 2013
Transcript of Statewide General Obligation Bond Sales Practices

Thomas A. SchweichMissouri State Auditor
http://auditor.mo.gov
STATEWIDE
General Obligation BondSales Practices
Report No. 2013-116
November 2013

CITIZENS SUMMARY
November 2013
Thomas A. SchweichMissouri State Auditor
When authorized by state law, Missouri's local governments, such as schooldistricts and municipalities, may borrow money to finance capital and otherprojects by issuing general obligation (GO) bonds, which are guaranteed bythe "full faith and credit" of the issuer since the entity can levy a general taxto make GO bond repayments.
In a competitive bond sale, the local government typically uses a financialadvisor to help structure the bond issue, then requests fixed bids fromunderwriting firms to purchase its bonds, and the bonds are sold to theunderwriter offering the lowest true interest cost bid.
In a negotiated sale, the local government selects an underwriter before thesale date and before the terms of the sale are fully determined. Theunderwriter also usually acts as the financial advisor, helping structure thebond issue. The entity and the underwriter may negotiate the underwriter'scompensation and interest rate on the bonds, and the underwriter purchasesthe bonds and resells them to investors.
School districts and other local governments incur unnecessary borrowingcosts when issuing GO bonds through negotiated sales rather thancompetitive bond sales. As noted in our three previous audits on this topic,local governments in Missouri continue to significantly favor negotiatedsales. Between 2008 and 2011, an annual average of 88 percent of Missouriissues have been sold through negotiated sale, compared to a nationalaverage of 53 percent. Six of the eight surrounding states require all or mostlocal entities to use competitive sales, but the majority of Missouri localgovernments have no restrictions on the method of sale for GO bonds.
While not all of the 538 GO bonds in our analysis population would meetthe criteria for a competitive sale, a significant portion would. Theoretically,local governments could have potentially saved as much as $43 million overthe life of bonds issued during the 4-year analysis period if competitivesales had been used. The increased borrowing costs are the result of a lackof competition as well as an inherent conflict of interest betweenunderwriters who provide financial advice and the local government. Anunderwriter's incentive is to have the bonds carry a higher interest rate tomake the bonds more attractive to investors, while an issuer's incentive is tokeep interest rates low to minimize borrowing costs.
In September 2013, the Financial Industry Regulatory Authority fined aMissouri municipal underwriting firm $200,000 for providing improper giftsto local government clients who utilize the firm's services, including over$183,500 worth of professional sports tickets. This firm was involved in 258bond issues in our analysis population, with 254 (99 percent) of those issuesbeing negotiated sales.
Findings in the audit of the General Obligation Bond Sales Practices
Background
General Obligation BondSales

Many local government officials lack an understanding of the bond issuanceprocess and the expertise to evaluate and negotiate bond pricing proposal,and no state agency is charged with providing assistance or authoritativeguidance to local entities regarding debt issuance. Training and guidance isinstead being provided by underwriters. We continue to recommend thatlocal governments and the General Assembly require the use of independentfinancial advisors, ensure local governments receive guidance on debtissuance, and require the use of competitive sales in appropriatecircumstances.
All reports are available on our Web site: auditor.mo.gov
Because of the compound nature of this audit report, no overall rating is provided.

1
2
Background ....................................................................................................4Scope and Methodology.................................................................................5
General Obligation Bond Sales ......................................................................8
A Bond Analysis Data..............................................................................15B Technical Advisor Biographies ............................................................25C Bond Analysis Methodology................................................................26D Local Governments Interviewed ..........................................................29E GFOA Resources..................................................................................31F GFOA Method of Sale Matrix..............................................................32
State Auditor's Report
Introduction
General Obligation Bond Sales PracticesTable of Contents
Management AdvisoryReport - State Auditor'sFindings
Appendixes

THOMAS A. SCHWEICHMissouri State Auditor
2
Honorable Jeremiah W. (Jay) Nixon, Governorand
Members of the General AssemblyJefferson City, Missouri
We audited general obligation bond practices within the state because of the importance of localgovernments incurring the lowest possible costs associated with the issuance of bonds. Missouri localgovernments issued approximately $4.4 billion in general obligation bonds during the 4 years endingDecember 31, 2011. This audit focused on general obligation bonds sold by school districts, cities,counties and other local governments pursuant to Section 108.170, RSMo. The objectives of our auditwere to:
1. Determining the extent to which the negotiated method of sale has been used compared tothe competitive method.
2. Determining the financial impact of the use of negotiated sales.
3. Determining the reasons why competitive sales have not been used more often byMissouri local governments.
4. Follow up on recommendations made in previous statewide audits of General ObligationBond Sales Practices.
As noted in previous audits, we found Missouri's local governments have continued to significantly favorthe negotiated sales method of issuing general obligation bonds. An analysis of $3.1 billion of bondsissued during the 4 years ending December 31, 2011, disclosed average interest cost savings of $88,000per issue could be achieved if bond issues had been sold competitively. Public school administrators andother local government officials have continued to use negotiated bond sales and incurred unnecessaryborrowing costs because (1) state law has not required public school districts and municipalities toconduct competitive sales of general obligation bonds and to obtain independent financial advisoryservices, and (2) the bond issuance process is complex, and local users often do not have sufficientknowledge of the process. In addition, recommendations from our previous reports have not beenimplemented.

3
We conducted our audit in accordance with the standards applicable to performance audits contained inGovernment Auditing Standards, issued by the Comptroller General of the United States. Those standardsrequire that we plan and perform our audit to obtain sufficient, appropriate evidence to provide areasonable basis for our findings and conclusions based on our audit objectives. We believe that theevidence obtained provides such a basis.
Thomas A. SchweichState Auditor
The following auditors participated in the preparation of this report:
Deputy State Auditor: Harry J. Otto, CPADirector of Audits: John Luetkemeyer, CPAAudit Manager: Robert Showers, CPA, CGAPIn-Charge Auditor: Gayle GarrisonAudit Staff: Wayne Kauffman, MBA

4
General Obligation Bond Sales PracticesIntroduction
Our audit focuses on sales practices for general obligation (GO) bonds bylocal governments, including, but not limited to, school districts andmunicipalities.
When authorized by state law, Missouri's local governments may borrowmoney to finance capital and other projects by issuing GO bonds. Therepayment of these bonds obligates taxpayers for many years and requiresthe levy of taxes to fund repayments. Local governments including cities,counties, school districts, and special districts can issue various types ofbonds including, but not limited to, GO, revenue, special assessment, andtax increment financing. Each of these bond types is repaid using differentrevenue streams and provides local governments useful financing optionsunder different circumstances. However, only GO bonds are guaranteed bythe "full faith and credit" of the issuer since the entity has the authority tolevy a general tax to make GO bond repayments. Because of the strength ofthis guaranty, GO bonds are also typically highly rated by bond ratingservices such as Moody's Investors Service, Fitch Ratings, and Standard andPoor's Rating Service. In addition, Missouri school districts may enroll theirbonds in the Missouri Health and Education Facility (MOHEFA) directdeposit state payment intercept program, which allows school districts totake advantage of the state's higher credit rating. As a result, GO bonds areconsidered desirable investments among conservative investors and aregenerally highly marketable.
In a competitive bond sale, a local government typically uses a financialadvisor to help structure the bond issue, then requests fixed bids fromunderwriting firms to purchase its bonds. The bonds are sold by the entity tothe underwriter offering the lowest true interest cost (TIC)1 bid, with bidsbeing evaluated by the financial advisor. In a negotiated sale, an underwriteris selected in advance of the sale date and before the terms of the sale arefully determined. For the vast majority of negotiated sales in Missouri theunderwriter acts as the financial advisor for the local government; helpingstructure the bond issue, before then becoming the underwriter for the issue.The entity and underwriter then may negotiate the underwriter'scompensation and the interest rates on the bonds. Shortly after negotiationsare completed (if any), the underwriter purchases the bonds from the entityand resells the bonds to investors.
1TIC is the "best practice" measure recommended for determining the interest cost of
municipal bond issuance. It is the interest rate that sets the present value of interest andprincipal payments equal to the proceeds from the issue. Bill Simonsen and Mark Robbins,"Measuring Municipal Borrowing Costs: How Missing Cost Information Biases Interest RateCalculations," Public Budget & Finance, Vol. 22., No. 1., Spring 2002, pp 31-45.
Background
General Obligation Bond Sales PracticesIntroduction

5
General Obligation Bond Sales PracticesIntroduction
School District$3,58981%
City/Village/Town$3738%
State/County$1343%
Fire District$1213%Other
$2035%
Local governments issued $4.4 billion in GO bonds statewide from January2008 through December 2011. As shown in Figure 2, school districts issued3.6 billion, or approximately 81 percent, of that amount.
Source: Bloomberg Finance L.P. and State Auditor's office (SAO) bond registration data.
In preparing for this review, we reviewed published literature on the topic oflocal government bond sales, and specifically on competitive versusnegotiated sales. Much of the research reviewed is cited in the body of thisreport.
To analyze and quantify the differences between competitive and negotiatedbond sales, we obtained the help of technical advisors. Dr. Bill Simonsenand Dr. Mark Robbins of the University of Connecticut, Department ofPublic Policy. The technical advisors have published research articles on thetopic of public bond sales and public finance. For additional information onthe technical advisors, see Appendix B.
Most public entities in Missouri issuing general obligation debt are requiredto register each issue with the SAO. To determine an overall population ofGO bonds to analyze, we obtained the SAO bond registration database forall bonds issued between January 2008 and December 2011. Our databaseof bonds for that time frame included 795 bonds totaling $4.1 billion. Toensure our overall population included all bonds relevant to this review, weobtained a list of Missouri local government bond sales from BloombergFinance L.P. and compared it to the bonds in the SAO database. Weidentified 12 additional GO bonds not required to be registered with theSAO2 totaling $339 million. We added those bonds to our database to come
2In accordance with Section 108.300, RSMo, registration is not required when bonds are
issued by any county of the first classification or city or school district having a population ofover sixty-five thousand inhabitants, as established by the last United States census. Inaddition, provisions of Section 108.240, RSMo, do not specifically include library or nursinghome districts.
Issuer type
Figure 2: Percentage of Missouri GOBond Dollars by Type of Issuer (inmillions) - 2008 through 2011
Scope andMethodology

6
General Obligation Bond Sales PracticesIntroduction
up with an overall population of 807 bonds, totaling approximately $4.4billion.
We also verified the accuracy of the overall population data by comparingdata recorded in the SAO bond registration system to copies of the officialbond statements available on the Electronic Municipal Market Accesssystem maintained by the Municipal Securities Rulemaking Board or byreviewing copies of bond transcripts maintained by the SAO. Whileperforming this data verification, we documented additional information ineach bond record to allow for further data analysis. The overall populationdata was provided to the technical advisors who used the data to perform astatistical analysis. The population of bonds was reduced to a total of 538bonds, worth approximately $3.1 billion, for analysis. See Appendix A forthe list of bonds used in the analysis, as well as an explanation of whatbonds were excluded.
To ensure all relevant costs of issuance had been considered in our analysis,we obtained and included financial advisor cost information on allcompetitively sold issues in our test population. The technical advisorsadjusted the TIC rates of those issues accordingly.
The technical advisors tested additional methodological concerns andaddressed those concerns in accordance with prevailing standards ofempirical public policy analysis. They determined analysis results to bestatistically significant. For a more technical discussion of the methodologyused by technical advisors, see Appendix C.
To further validate the methodology used by technical advisors, wecontacted the University of Missouri's Truman School of Public Affairs torequest a staff professor evaluate the analyses performed by the technicaladvisors. The professor concluded the technical advisors used widelyaccepted methods and tests. The professor further stated the studies'estimates that competitive sales result in 23.5 to 24.2 lower basis points thanfor negotiated sales and the present value savings can be viewed withconfidence. See Appendix C for additional information on the methodologyreview.
To obtain an understanding of the services provided by underwriters duringcompetitive and negotiated bond sales, we conducted interviews withrepresentatives of four leading bond underwriters in the state. We ensuredthe underwriters interviewed provided services in competitive andnegotiated sales and to a wide variety of local governments. We alsodiscussed the role of independent financial advisors in the competitiveprocess with three financial advisors that provided services to Missouri localgovernments.

7
General Obligation Bond Sales PracticesIntroduction
To identify potential issues faced by issuers of public debt and to understandwhat factors contribute to the choices they make, we met withrepresentatives of 14 school districts and 1 city. We selected locations fromour analysis population of bonds to ensure the entities had been recentlyinvolved in several bond issues and included both competitive andnegotiated sale methods. See Appendix D for a listing of locations visitedalong with the bonds issued by the entities. We contacted representatives ofthe Department of Elementary and Secondary Education, the MissouriAssociation of School Administrators, the Missouri Association of SchoolBusiness Officials, the MOHEFA, and the Missouri Municipal League toidentify any guidance provided or made available to local governments.
To document best practices in the issuance of public debt, we obtainedpublications issued by the Government Finance Officers Association(GFOA). See Appendix E for a summary of the publications reviewed.
We reviewed state laws of Missouri's eight surrounding states to determinehow the GO bond sale laws in those states compared to Missouri. Wespecifically reviewed whether other states' laws restricted the method of saleof GO bonds. We also compared Missouri laws relevant to public debtissuance with the laws in the states of Kentucky, Tennessee and New Yorkthat provide local governments additional guidance or restrictions regardingthe issuance of debt.

8
General Obligation Bond Sales PracticesManagement Advisory Report - State Auditor's Finding
School districts and other local governments incur unnecessary borrowingcosts when issuing general obligation (GO) bonds by heavily favoringnegotiated sales rather than selling bonds through a competitive sale. Thiscondition has occurred because state law does not require the use of acompetitive process when issuing GO debt at the local level, and becauselocal officials have not been provided sufficient guidance regarding bondsale methods and are not required to obtain independent financial advisoryservices. Having an underwriter serve in the dual capacity of financialadvisor and underwriter, which normally occurs when bonds are soldthrough negotiated sale, creates a conflict of interest which is not in the bestinterests of the local government and results in increased borrowing costs.
As noted in our previous three audits on this topic,3 local governments inMissouri continue to significantly favor the use of negotiated sales. Ouranalysis of 538 GO bond issues by Missouri local governments during the 4years ending December 31, 2011 showed only 50 issues (9.3 percent) weresold through competitive sale. Figure 1 below shows the percentage ofbonds issued by method of sale nationally and for Missouri issues from2001 through 2011. During this time period, an average of 88 percent ofMissouri issues have been sold through negotiated sale, compared to anational average of 53 percent.
Source: Bloomberg Finance L.P. and State Auditor's office (SAO) bond registration data.
Local governments often incur unnecessary interest costs as a result of thebonds not being sold through competitive sale. Our analysis of 538 GObonds issued by Missouri local governments totaling approximately $3.1
3Special Review of Bonds Issued by Political Subdivisions, May 1995, report number 95-44;
Audit of General Obligation Bond Sales Practices, January 2001, report number 2001-04;and General Obligation Bond Sales Practices Follow-Up, December 2005, report number2005-101.
General ObligationBond Sales
General Obligation Bond Sales PracticesManagement Advisory ReportState Auditor's Findings
Sales methods
Figure 1: Percentage of GO BondIssues by Method of Sale - Missouriand Nationwide
Interest costs
0%
20%
40%
60%
80%
100%
2001 2002 2003 2004 2005 2006 2007 2008 2009 2010 2011
National Negotiated Missouri Negotiated
National Competitive Missouri Competitive

9
General Obligation Bond Sales PracticesManagement Advisory Report - State Auditor's Finding
billion issued during the 4 years ending December 31, 2011, disclosed theaverage bond issue in the population was approximately $5.8 million, had a12-year repayment schedule, and will incur an estimated $88,148 inunnecessary interest costs over the life of the bond. The regression analysisperformed by the technical advisors disclosed local governments incurredinterest rates4 that were approximately 23.5 basis points5 higher onnegotiated sales than were paid on competitive sales. The figure belowdescribes estimated savings that would likely have occurred if localgovernments had chosen the competitive sale method. Calculations wereperformed for bond principal amounts totaling $2, $5.8, and $10 million.
Estimated Savings for Issues Sold Through Competitive Bidding
Amount of Sale $ 2,000,000 5,800,000 10,000,000Savings potential6 $ 30,743 88,148 150,067Annual savings $ 2,561 7,345 12,506
Collectively, the potential interest savings statewide is significant. While notall of the GO bonds in our population would meet the criteria for acompetitive sale (see Appendix F), a significant portion would.Theoretically, potential interest cost savings could approach $43 million7
over the life of bonds issued during the 4 year analysis period.
Missouri law does not require GO bond sales by school districts,municipalities, and other political subdivisions to be issued throughcompetitive sale. As a result, local governments utilized the negotiated salesmethod in over 90 percent of the GO bond issues in our analysis population.
Missouri law requires competitive sales of GO bonds for the Missouri Boardof Fund Commissioners, joint fire departments, consolidated librarydistricts, urban library districts, water conservancy districts, and watersheddistricts. All other entity types are allowed to sell GO bonds using eithercompetitive or negotiated sales in accordance with Section 108.170, RSMo.
Our review of Missouri's eight surrounding states indicates Iowa, Kentucky,Oklahoma and Tennessee laws require all, or most, local entities to usecompetitive sales. Arkansas and Kansas statutes require most entities to usecompetitive sales, while other entities may choose the method of sale.
4Interest rates were measured using the TIC rate of each issue.
5One basis point is 1/100 of one percent; the average interest rate of negotiated sales in our
analysis was 3.157 percent, while the average interest rate for competitive sales was 2.922, adifference of .235 percentage points.6
Calculated assuming a 12-year repayment schedule with equal principal payments andsemi-annual interest payments. These characteristics are considered typical for the populationanalyzed.7
Calculated by multiplying average issue savings of $88,148 by 488 negotiated bond sales inour population (see Appendix A).
Other state laws

10
General Obligation Bond Sales PracticesManagement Advisory Report - State Auditor's Finding
Illinois and Nebraska laws do not require bonds to be sold by competitivesale. According to Bloomberg municipal bond data, 76 percent of the bondsissued in the 6 states that restrict the method of sale have been soldcompetitively from 2005 through 2011. Comparatively, only 15 percent ofthe GO bonds issued in Missouri, Illinois and Nebraska, which do notrestrict the method of sale, have been issued by competitive sale.
Our analysis concludes increased competition leads to lower interest costs.According to our analysis, each bid received on a competitive bond saleresulted in a 3.9 basis point reduction in the interest rate paid on the bondissue. The number of bids received on competitive sales in our analysispopulation averaged 7.6 bids per issue, with 40 percent of the competitivesales in our analysis population receiving 9 bids or more.
According to Government Finance Officers Association (GFOA)8 guidance,the primary advantages of issuing GO bonds competitively include (1) opencompetition provides some assurance that bonds have been sold at thelowest interest rates, and (2) competition promotes the appearance of anopen and fair process. Guidance further states competitive sales of issuanceswith standard debt structures, such as GO bonds, and local governmentswith good credit ratings (greater than an A rating) can produce veryfavorable interest rates. Changing state law to require local governments toutilize the competitive sale method for highly rated GO bond issues wouldresult in reduced borrowing costs at the local level. GFOA guidance onfactors to consider when making a bond sales method decision isdocumented at Appendix F.
The increased borrowing costs incurred by local governments utilizing thenegotiated sale method are a result of the inherent conflict of interest thatexists between underwriters who provide financial advice and the localgovernment. The role of an underwriter is to purchase bonds from the issuerand sell them to investors. An underwriter's incentive is to have the bondscarry a higher interest rate to make the bonds more attractive to investors,while an issuer's incentive is to keep interest rates low to minimizeborrowing costs. As a result, the underwriter cannot objectively representthe interests of both parties during negotiated sales. For this reason, it isimportant that local governments do not rely on the underwriter of the bondissue to also provide financial advisory services.
The majority of issuers do not obtain independent financial advice. Officialsfrom eight of the thirteen local governments interviewed that usednegotiated sales stated they did not consider the use of a competitive sale,which indicates the underwriters who provided their financial advice were
8A Practitioner's Guide To Effective Debt Management: Competitive v. Negotiated: How to
Choose the Method of Sale for Tax-Exempt Bonds, GFOA, 1994, p. 3.
Competition
Conflicts of interest
Independent advice

11
General Obligation Bond Sales PracticesManagement Advisory Report - State Auditor's Finding
not presenting all options available. In the event a negotiated sale is used, anindependent financial advisor can still provide value to the issuer by helpingevaluate the underwriter's pricing of the bonds and fees. However, ourreview of Missouri bond data shows independent financial advisors arerarely used during negotiated bond sales. Of the 355 different localgovernments issuing GO bonds via a negotiated sale during the 4 yearsending December 31, 2011, only 16 hired independent financial advisors tohelp negotiate bond terms with underwriters.
Based on information presented in our prior GO bond sales report, officialsin the City of Grandview stated they now recognize that a conflict of interestexists when independent financial advice is not obtained. As a result, theCity of Grandview now requires the use of competitive sales on all bondissues. However, based on interviews with other local government officials,not all of them recognize that a conflict exists, or if they do it is notconsidered significant. Local government officials cite trust and familiaritywith the underwriter as the primary reasons for not hiring an independentfinancial advisor. Local governments also cited the potential cost of anindependent financial advisor as a barrier. Underwriters who providefinancial advice often market their financial advice as being "free,"however, their compensation is rolled into the bond financing and istypically less transparent. In contrast, the cost of an independent financialadvisor would need to be separately approved by the entity's governingbody.
The Financial Industry Regulatory Authority (FINRA) fined a Missourimunicipal underwriting firm $200,000 in September 2013 for providingimproper gifts to local government clients who utilized the firm's services.According to the FINRA report, in 598 instances the firm provided 2,143professional sports tickets, with a value of $183,546, to its local governmentclients. A firm member also offered the tickets to potential clients at aMissouri School Board Association conference, where the firm was anexhibitor, according to the FINRA report. This firm was involved in 258 ofthe 538 bond issues (48 percent) in our analysis population, with 254 (99percent) of those issues being sold through negotiated sale.
According to GFOA literature,9 to minimize conflicts of interest andpromote objectivity, local governments should avoid selecting a firm toserve both as financial advisor and underwriter of a bond issue. In addition,GFOA guidance states the independent financial advisor's ability to providean objective and informed review is essential to the process.
9J.B. Kurish and Patricia Tigue, An Elected Official's Guide to Debt Issuance, 2d ed, GFOA,
Chicago, IL, 2005, p. 23.
Underwriter sanctions

12
General Obligation Bond Sales PracticesManagement Advisory Report - State Auditor's Finding
Although the bond issuance process is complex and requires knowledge ofbond markets, financial calculations and legal requirements, no state agencyis charged with providing assistance or authoritative guidance to localentities regarding debt issuance. Interviews with local governments,underwriters and other stakeholders determined local officials are notfamiliar with best practices published by leading authorities, instead theseofficials rely on underwriters to guide them through the process. In addition,training on the bond issuance process is provided at various administrators'association meetings, and is often taught by representatives of theunderwriting firms.
Based on interviews with local government finance officials, there is a clearlack of understanding of the bond issuance process. Eight of the thirteenlocal governments that used the negotiated sale method were not aware aconflict of interest existed, had not implemented procedures to mitigate theconflict of interest, or believed that the conflict of interest did not apply totheir entity's negotiated bond sales. In addition, one school official indicatedthe district did not realize it could hire a financial advisor and also did notknow the initial fees and costs offered by an underwriter in a negotiated salecould be negotiated. A school official from another district believed thedistrict had used a financial advisor to competitively issue all bond issues;however, half of the district's bond issuances were sold by negotiated saledirectly to the district's underwriter. Finally, a school official from a thirddistrict believed the district's bonds had been competitively sold when, infact, they were sold to the district's underwriter using a negotiated sale.
Many local government officials lack the expertise to evaluate and negotiatebond pricing proposals from underwriters. Officials from eleven of thethirteen local governments interviewed stated they relied on comparativesale data provided by the underwriter to evaluate the negotiated bondpricing proposal. However, based on our review of comparable bond dataprovided to the interviewed local governments, the majority of the data didnot provide TIC information to evaluate the comparable bonds. One localgovernment official interviewed was provided data from two comparablebonds, but the official did not recognize that the TIC for the sales presentedwere approximately 100 basis points (or 1 percentage point) lower than theprice proposed. In addition, we noted bonds presented as comparable thatwere issued more than one week apart, had different tax exempt statuses,were debt issues other general obligation debt, and had very different callfeatures. One underwriter provided comparable sale information after thebonds had been sold, long after the information could be used to evaluatethe proposal.
Our review of the bond related laws of the eight states surrounding Missouriprovide varying levels of requirements, advisory guidance, and oversight forbonds issued by local entities.
Local government guidanceand training
Issuer understanding of process
Issuer expertise
Other state laws

13
General Obligation Bond Sales PracticesManagement Advisory Report - State Auditor's Finding
In addition to laws that require competitive sales, we noted states withadditional requirements designed to ensure debt is issued responsibly. Forexample, Tennessee created a state-level bond authority to provideassistance, guidance, and oversight to local governments and to collect bonddata. The Tennessee State Funding Board is part of the State Comptroller'soffice, and is authorized to establish policies and procedures for theadministration of state laws concerning bond and note issues by counties,municipalities, and utility districts. The board is also authorized to collectbond data from local governments and develop model bond policies for useby local governments. In some cases, the issuing entity is not authorized toborrow money unless it first obtains approval from the State Funding Board.Similarly, New York's Office of State Comptroller reviews public debtissuances to ensure the sales method is appropriate.
In addition, Kentucky's Department of Local Government providesoversight of local public debt and has a state debt officer who providesadvice and conducts training to help local governments obtain the lowestinterest costs on public debt.
GFOA guidance10 states that even large local governments cannot beexpected to have adequate in-house expertise to successfully structure andmarket bonds. The level of expertise and experience required to adequatelynegotiate a bond sale is also listed as one of the key negative aspects ofissuing bonds through a negotiated sale. Providing local governments accessto state-level, independent guidance would help ensure officials are moreinformed about the bond issuance process and will help ensure the bestinterests of the public is served.
While our current audit is the most comprehensive because it analyzes 4years of general obligation issues, each of our three previous audits ofstatewide GO bond sales practices concluded the use of the negotiated salesmethod resulted in increased borrowing costs for the issuer. Our 2005 audit,concluded that, on average, competitively sold bonds achieved borrowingcost savings of approximately $78,000 per bond issue over bonds soldthrough negotiated sale, an amount that is comparable with our currentestimate.
Prior recommendations to the General Assembly included revising Section108.170, RSMo, to require (1) the use of a competitively selected financialadvisor, who is independent of the bond sale, when issuing public debt, (2)local governments to use the competitive method of sale for GO bond issueswith a credit rating of "A" or higher, (3) the use of a competitively selectedunderwriter, when appropriate, for necessary negotiated sales. We also
10James C. Joseph, Debt Issuance and Management: A Guide for Smaller Governments,
GFOA, Chicago, IL, 1994, p. 37.
Status of priorrecommendations

14
General Obligation Bond Sales PracticesManagement Advisory Report - State Auditor's Finding
recommended the Department of Elementary and Secondary Education(DESE) provide guidance to public school entities regarding the preferreduse of competitive bond sales and the use of independent financial advisors.
As of April 2013, none of the above recommendations had beenimplemented. According to a DESE official, the department does not have aposition on the matter of school districts issuing GO bonds through thecompetitive or negotiated sale methods and the decision is made at the localdistrict's discretion.
School district and other local governments:
1.1 Obtain the services of a financial advisor who is independent fromthe underwriting function, regardless of the method of sale used.
1.2 Utilize the competitive method of sale when issuing GO bonds,particularly when the issuing entity maintains a credit rating of 'A'or higher.
The Missouri General Assembly revise Section 108.170, RSMo, and otherlaws as applicable to:
1.3 Require local governments to use financial advisors that areindependent of the bond sale.
1.4 Require local governments to use the competitive method of salewhen issuing GO bonds when the issuing entity maintains a creditrating of 'A' or higher.
1.5 Designate a state agency to develop authoritative guidanceregarding debt issuance at the local level, and provide guidance tolocal officials to ensure public debt decisions are in the bestinterests of the issuing entity.
Recommendations

15
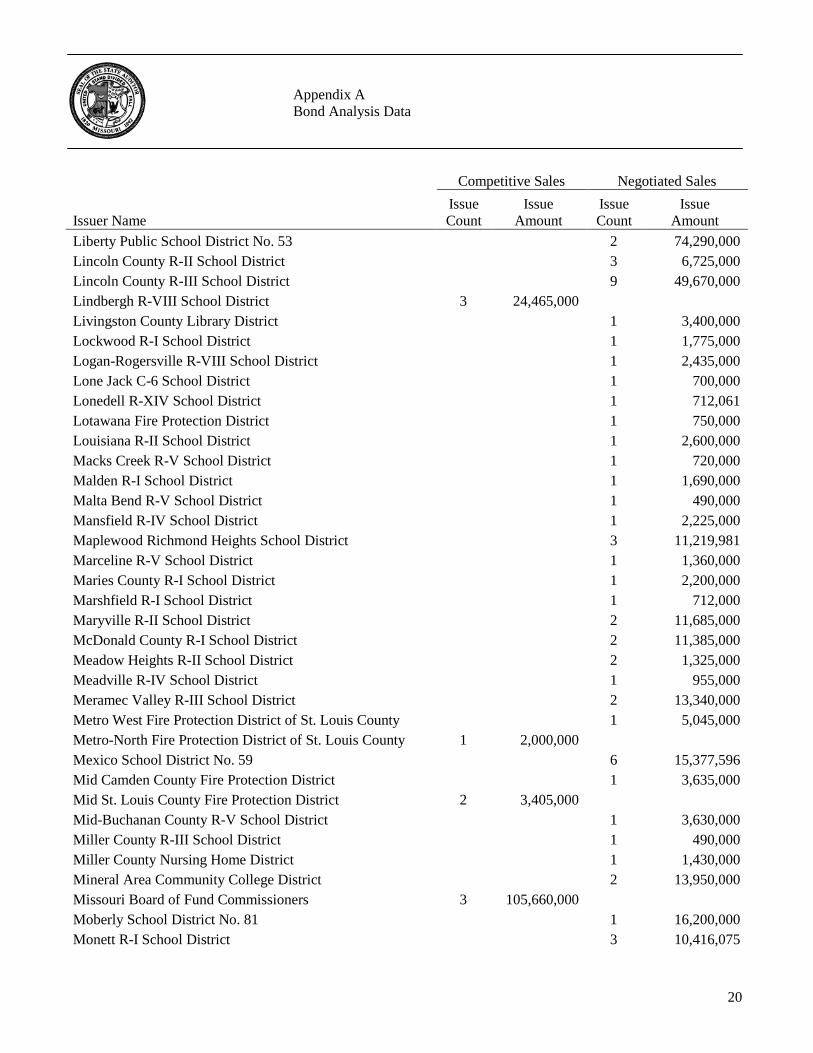
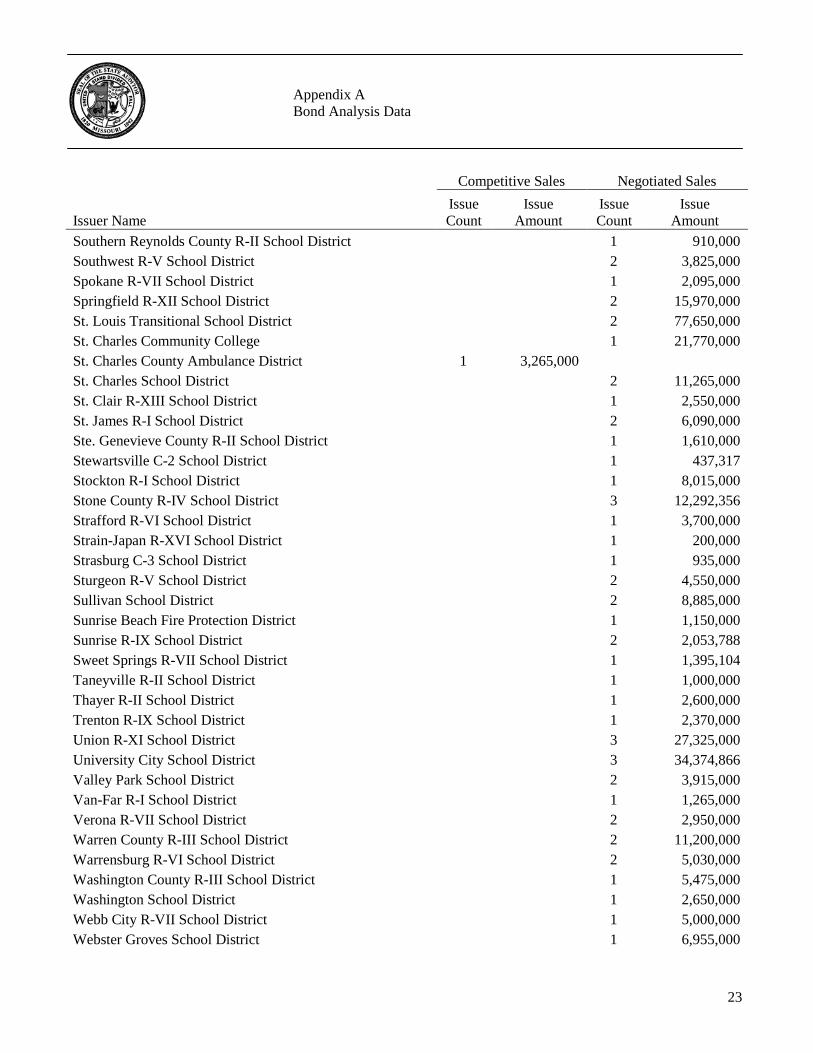
Appendix ABond Analysis Data
The table below lists the bonds used by the technical advisors (seeAppendix B) in their analysis of general obligation bond sales in the state.The data includes 538 of the 807 bonds issued between January 2008 andDecember 2011. The data was obtained from the SAO bond registrationdata and Bloomberg Finance L.P. As recommended by the technicaladvisors, the analysis excluded 228 bonds with unusual financing structures(for example bonds subsidized with federal stimulus funding, issued withcapital appreciation components, and issued by neighborhood improvementdistricts), 35 short-term bonds with maturities less than 3 years, 5 taxablebonds, and 1 bond with inconsistent borrowing costs as compared to theremainder of the population.
Competitive Sales Negotiated Sales
Issuer NameIssueCount
IssueAmount
IssueCount
IssueAmount
Adair County R-II School District 1 $ 560,000
Advance R-IV School District 1 1,500,000
Arcadia Valley R-II School District 1 4,462,825
Archie R-V School District 1 1,000,000
Ash Grove R-IV School District 3 3,599,735
Aurora R-VIII School District 1 3,980,000
Avenue City R-IX School District 2 2,175,000
Bayless Consolidated School District 1 6,840,000
Belton School District No. 124 3 16,285,000
Bismarck R-V School District 2 2,220,000
Black Jack Fire Protection District 1 $ 2,500,000 1 2,949,998
Blair Oaks R-II School District 2 10,325,000
Bloomfield R-XIV School District 1 839,168
Blue Eye R-V School District 1 2,200,000
Bolivar R-I School District 1 2,975,000
Boone County 2 521,000
Boonville R-I School District 3 13,045,000
Branson R-IV School District 1 9,150,000
Brentwood School District 1 6,780,000
Brookfield R-III School District 3 4,945,000
Brunswick R-II School District 1 615,000
Butler R-V School District 1 6,145,000
Camdenton R-III School District 1 3,950,000
Cameron R-I School District 1 2,130,000
Campbell R-II School District 1 1,950,000
Canton R-V School District 1 1,085,081
Appendix A
Bond Analysis Data

16
Appendix ABond Analysis Data
Competitive Sales Negotiated Sales
Issuer NameIssueCount
IssueAmount
IssueCount
IssueAmount
Cape Girardeau County R-II School District 1 4,785,000
Cape Girardeau School District No. 63 3 26,380,000
Carl Junction R-I School District 3 17,535,000
Carthage R-IX School District 1 4,060,000
Cass County 1 10,000,000
Cass County R-II School District 2 36,675,000
Central Cass County Fire Protection District 1 510,000
Central Jackson County Fire Protection District 1 5,000,000
Central R-III School District 4 14,219,049
Central St Charles County Fire and Rescue District 1 6,125,000
Chadwick R-I School District 1 825,000
Chaffee R-II School District 1 1,065,000
Christian County R-III School District 2 3,306,000
City of Avondale 1 165,000
City of Ballwin 1 3,695,000
City of Bellefontaine Neighbors 1 5,500,000
City of Belton 2 18,730,000
City of Blue Springs 2 6,030,000
City of Burlington Junction 1 250,000
City of Carl Junction 1 4,500,000
City of Chesterfield 1 5,255,000
City of Clayton 1 3,950,000
City of Des Peres 1 6,170,000
City of Fair Grove 1 500,000
City of Ferguson 1 8,000,000
City of Gasconade 1 245,000
City of Grain Valley 1 6,940,000
City of Grandview 2 7,550,000
City of Greenwood 1 1,285,000
City of Kansas City 1 40,000,000 2 87,190,000
City of Kirkwood 1 4,185,000
City of Lake St. Louis 1 7,230,000
City of Lake Winnebago 2 460,000
City of Lee's Summit 1 12,000,000
City of Lilbourn 1 175,000
City of Lone Jack 1 999,000

17
Appendix ABond Analysis Data
Competitive Sales Negotiated Sales
Issuer NameIssueCount
IssueAmount
IssueCount
IssueAmount
City of Maryville 1 4,220,000
City of Northwoods 1 2,500,000
City of Oak Grove 2 9,025,000
City of Owensville 1 1,185,000
City of Raymore 1 2,515,000
City of Richmond 1 2,355,000
City of Rock Hill 2 5,250,000
City of Springfield 1 3,335,000
City of St. James 2 7,400,000
City of St. Peters 3 23,670,000 1 3,790,000
City of Weatherby Lake 1 1,280,000
City of Webb City 1 5,895,000
City of Webster Groves 1 13,000,000
City of Woodson Terrace 1 1,040,000
Clark County R-I School District 1 2,250,000
Clarksburg C-2 School District 1 600,000
Clay County R-I School District 2 6,165,000
Clayton School District 2 24,750,000
Clearwater R-I School District 1 1,005,000
Clever R-V School District 1 2,000,000
Clinton County R-III School District 2 7,695,000
Cole Camp R-I School District 1 1,420,000
Cole County R-I School District 2 5,520,788
Cole County R-V School District 2 4,084,793
Columbia School District 4 61,625,000 1 48,275,000
Community Fire Protection District of St. Louis County 1 2,680,000
Community R-VI School District 2 3,025,000
Concordia R-II School District 1 750,000
Cooper County Fire Protection District 1 1,280,000
Cooper County R-IV School District 1 315,000
Cottleville Community Fire Protection District 1 3,120,000
Crawford County R-I School District 1 500,000
Crawford County R-II School District 1 5,000,000
Crocker R-II School District 1 1,065,000
Crystal City School District No. 47 3 4,655,000
Davis R-XII School District 1 200,000

18
Appendix ABond Analysis Data
Competitive Sales Negotiated Sales
Issuer NameIssueCount
IssueAmount
IssueCount
IssueAmount
Delta R-V School District 1 2,600,000
DeSoto School District No. 73 2 6,786,056
Dexter R-XI School District 2 8,775,000
Drexel R-IV School District 1 1,280,000
Dunklin R-V School District 2 13,960,000
El Dorado Springs R-II School District 1 1,850,000
Eldon R-I School District 2 11,800,000
Eminence R-I School District 1 200,000
Eureka Fire Protection District 1 3,600,000
Excelsior Springs School District No. 40 2 6,810,000
Fair Play R-II School District 1 1,270,000
Farmington R-VII School District 1 8,545,000
Fayette R-III School District 1 1,750,000
Festus R-VI School District 1 11,925,000
Florissant Valley Fire Protection District 1 2,685,000
Fordland R-III School District 1 1,465,000
Fort Osage Fire Protection District 1 2,500,000
Fort Osage R-I School District 2 20,985,000
Fort Zumwalt School District 2 4,799,950
Francis Howell R-III School District 4 78,530,000
Fulton Public School District No. 58 3 15,377,575
Galena R-II School District 1 1,750,000
Gasconade County R-II School District 1 7,100,000
Grain Valley R-V School District 4 12,565,000
Grandview C-4 School District 4 20,405,000
Grandview R-II School District 3 8,668,822
Green City R-I School District 1 813,811
Greene County R-II School District 2 7,955,000
Greene County R-III School District 2 8,452,000
Greenfield R-IV School District 1 750,000
Greenville R-II School District 1 4,000,000
Halfway R-III School District 1 1,500,000
Hallsville R-IV School District 1 2,120,000
Hancock Place School District 4 19,235,000
Hannibal School District No. 60 2 10,065,000
Harrisburg R-VIII School District 2 3,505,000

19
Appendix ABond Analysis Data
Competitive Sales Negotiated Sales
Issuer NameIssueCount
IssueAmount
IssueCount
IssueAmount
Hartville R-II School District 1 1,440,000
Henry County R-I School District 2 2,071,246
Hermitage R-IV School District 1 900,000
Hickman Mills C-1 School District 2 24,650,000
Hickory County R-I School District 1 1,150,000
Higbee R-VIII School District 1 1,200,000
Hillsboro R-III School District 3 14,765,449
Holcomb R-III School District 1 400,000
Holden R-III School District 1 2,715,000
Hollister R-V School District 1 2,518,938
Humansville R-IV School District 1 1,300,000
Independence School District 4 89,095,000
Jackson County C-2 School District 2 29,385,000
Jackson County R-IV School District 2 113,945,000
Jackson County R-VII School District 2 57,235,000
Jefferson Co R-VII School District 2 11,000,000
Jefferson County C-6 School District 2 17,060,000
Jennings School District 1 5,600,000
Johnson County R-VII School District 1 620,000
Junior College District of East Central Missouri 1 9,800,853
Kearney Fire and Rescue Protection District 1 3,500,000
Kennett School District No. 39 1 7,000,000
King City R-I School District 1 871,940
Kingston K-14 School District 2 1,590,000
Kingsville R-I School District 1 1,475,000
Kirbyville R-VI School District 1 1,315,000
Kirksville R-III School District 2 21,355,000
Kirkwood R-VII School District 1 4,980,000
La Monte R-IV School District 1 835,000
La Plata R-II School District 1 2,050,000
Ladue School District 1 2,245,000
Lafayette County C-1 School District 1 2,875,000
Lakeland R-III School District 2 3,330,000
Lawrence County R-IX School District 1 4,350,000
Lawson R-XIV School District 1 1,800,000
Lebanon R-III School District 1 6,490,000
20
Appendix ABond Analysis Data
Competitive Sales Negotiated Sales
Issuer NameIssueCount
IssueAmount
IssueCount
IssueAmount
Liberty Public School District No. 53 2 74,290,000
Lincoln County R-II School District 3 6,725,000
Lincoln County R-III School District 9 49,670,000
Lindbergh R-VIII School District 3 24,465,000
Livingston County Library District 1 3,400,000
Lockwood R-I School District 1 1,775,000
Logan-Rogersville R-VIII School District 1 2,435,000
Lone Jack C-6 School District 1 700,000
Lonedell R-XIV School District 1 712,061
Lotawana Fire Protection District 1 750,000
Louisiana R-II School District 1 2,600,000
Macks Creek R-V School District 1 720,000
Malden R-I School District 1 1,690,000
Malta Bend R-V School District 1 490,000
Mansfield R-IV School District 1 2,225,000
Maplewood Richmond Heights School District 3 11,219,981
Marceline R-V School District 1 1,360,000
Maries County R-I School District 1 2,200,000
Marshfield R-I School District 1 712,000
Maryville R-II School District 2 11,685,000
McDonald County R-I School District 2 11,385,000
Meadow Heights R-II School District 2 1,325,000
Meadville R-IV School District 1 955,000
Meramec Valley R-III School District 2 13,340,000
Metro West Fire Protection District of St. Louis County 1 5,045,000
Metro-North Fire Protection District of St. Louis County 1 2,000,000
Mexico School District No. 59 6 15,377,596
Mid Camden County Fire Protection District 1 3,635,000
Mid St. Louis County Fire Protection District 2 3,405,000
Mid-Buchanan County R-V School District 1 3,630,000
Miller County R-III School District 1 490,000
Miller County Nursing Home District 1 1,430,000
Mineral Area Community College District 2 13,950,000
Missouri Board of Fund Commissioners 3 105,660,000
Moberly School District No. 81 1 16,200,000
Monett R-I School District 3 10,416,075

21
Appendix ABond Analysis Data
Competitive Sales Negotiated Sales
Issuer NameIssueCount
IssueAmount
IssueCount
IssueAmount
Moniteau County R-I School District 2 8,155,000
Moniteau County R-VI School District of Tipton 1 5,465,000
Monroe City R-I School District 1 1,200,000
Mt. Vernon R-V School District 2 4,495,000
New Bloomfield R-III School District 4 6,490,000
New Franklin R-I School District 2 1,775,000
New Haven School District 1 2,800,000
New Madrid County R-I School District 1 4,175,000
Newburg R-II School District 1 990,000
Nixa R-II School District 3 10,887,934
Norborne R-VIII School District 2 920,000
Normandy School District 4 31,500,000
North Callaway County R-I School District 1 1,870,000
North Kansas City School District No. 74 3 38,415,000
North Nodaway County R-VI School District 1 650,000
North Platte County R-I School District 1 3,750,882
North Shelby School District 1 486,330
North St. Francois County R-I School District 6 26,522,529
Northeast Nodaway County R-V School District 1 965,000
Northeast Randolph County R-IV School District 1 970,000
Northwest R-I School District of Jefferson County 3 22,260,000
Oak Grove R-VI School District 2 20,000,000
Oak Ridge R-VI School District 1 1,270,000
Odessa R-VII School District 2 16,000,000
Oran R-III School District 1 1,690,000
Orchard Farm R-V School District 1 9,000,000
Orrick R-XI School District 1 2,400,000
Osage County R-II School District 2 4,380,000
Osborn R-0 School District 1 510,000
Otterville R-VI School District 1 410,000
Ozark R-VI School District 4 24,320,000
Palmyra R-I School District 1 7,000,000
Paris R-II School District 1 720,000
Park Hill School District 2 14,595,000
Parkway C-2 School District 3 93,780,000
Pattonsburg R-II School District 1 905,000

22
Appendix ABond Analysis Data
Competitive Sales Negotiated Sales
Issuer NameIssueCount
IssueAmount
IssueCount
IssueAmount
Pattonville Fire Protection District 4 18,000,000
Pettis County R-V School District 1 790,000
Pierce City R-VI School District 2 4,375,000
Pike County R-III School District 1 5,000,000
Pilot Grove C-4 School District 1 1,030,000
Platte County R-III School District 4 27,415,000
Pleasant Hill R-III School District 3 11,900,000
Pleasant Hope R-VI School District 1 900,000
Polo R-VII School District 1 1,290,000
Princeton R-V School District 2 2,495,000
Purdy R-II School District 1 1,600,000
Putnam Co R-I School District 2 2,810,023
Puxico R-VIII School District 1 2,160,000
Ralls County R-II School District 1 2,650,000
Rich Hill R-IV School District 2 2,695,000
Ritenour School District 3 34,955,000
Riverview Fire Protection District 1 3,000,000
Riverview Gardens School District 2 10,089,921
Robertson Fire Protection District 3 6,275,000
Rock Port R-II School District 1 2,029,046
Rockwood R-VI School District 2 83,800,000 3 67,315,000
Roscoe C-1 School District 1 235,000
Santa Fe R-X School District 1 1,900,000
Schuyler Co R-I School District 1 2,405,000
Scott City R-I School District 1 2,410,000
Scott County Central School District 2 2,275,000
Shawnee R-III School District 1 425,000
Sherwood Cass R-VIII School District 1 2,890,000
Sikeston R-VI School District 1 3,190,000
Silex R-I School District 2 1,980,000
Slater School District 2 1,581,119
Smithville Area Fire Protection District 1 2,500,000
Smithville R-II School District 1 6,500,000
Sni-Valley Fire Protection District of Jackson County 2 3,900,000
South Metropolitan Fire Protection District of Cass County 1 5,690,000
Southern Boone County R-I School District 4 12,645,000
23
Appendix ABond Analysis Data
Competitive Sales Negotiated Sales
Issuer NameIssueCount
IssueAmount
IssueCount
IssueAmount
Southern Reynolds County R-II School District 1 910,000
Southwest R-V School District 2 3,825,000
Spokane R-VII School District 1 2,095,000
Springfield R-XII School District 2 15,970,000
St. Louis Transitional School District 2 77,650,000
St. Charles Community College 1 21,770,000
St. Charles County Ambulance District 1 3,265,000
St. Charles School District 2 11,265,000
St. Clair R-XIII School District 1 2,550,000
St. James R-I School District 2 6,090,000
Ste. Genevieve County R-II School District 1 1,610,000
Stewartsville C-2 School District 1 437,317
Stockton R-I School District 1 8,015,000
Stone County R-IV School District 3 12,292,356
Strafford R-VI School District 1 3,700,000
Strain-Japan R-XVI School District 1 200,000
Strasburg C-3 School District 1 935,000
Sturgeon R-V School District 2 4,550,000
Sullivan School District 2 8,885,000
Sunrise Beach Fire Protection District 1 1,150,000
Sunrise R-IX School District 2 2,053,788
Sweet Springs R-VII School District 1 1,395,104
Taneyville R-II School District 1 1,000,000
Thayer R-II School District 1 2,600,000
Trenton R-IX School District 1 2,370,000
Union R-XI School District 3 27,325,000
University City School District 3 34,374,866
Valley Park School District 2 3,915,000
Van-Far R-I School District 1 1,265,000
Verona R-VII School District 2 2,950,000
Warren County R-III School District 2 11,200,000
Warrensburg R-VI School District 2 5,030,000
Washington County R-III School District 1 5,475,000
Washington School District 1 2,650,000
Webb City R-VII School District 1 5,000,000
Webster Groves School District 1 6,955,000

24
Appendix ABond Analysis Data
Competitive Sales Negotiated Sales
Issuer NameIssueCount
IssueAmount
IssueCount
IssueAmount
Wellington-Napoleon R-IX School District 2 2,382,041
Wellsville Middletown R-I School District 1 1,460,000
Wentzville R-IV School District 1 8,540,000 3 81,108,677West County EMS & Fire Protection District of St. Louis
County 3 16,980,000
West Nodaway County R-I School District 1 1,200,000
West Peculiar Fire Protection District 2 2,815,000
West St. Francois County R-IV School District 2 4,320,000
Wheatland R-II School District 1 700,000
Windsor C-1 School District 4 33,105,000
Winfield R-IV School District 2 7,665,000
Worth County R-III School District 1 520,000
Wright City R-II School District 7 17,125,023
Grand Total 50 $ 501,717,575 488 $ 2,621,766,171

25
Appendix BTechnical Advisor Biographies
The technical advisors are involved in public finance research and educationand have published numerous research articles on the topic. Much of theirwork has specifically addressed the cost differences that exist betweencompetitive and negotiated sales.
Bill Simonsen is a Professor in the Department of Public Policy at theUniversity of Connecticut and Director of its Master of PublicAdministration (MPA) program. Simonsen's research and writing focuseson public sector financial management and policy and has two main themes(1) ways to aid public management decisions about municipal bond sales,and (2) processes that improve the ways that citizen preferences can be usedin public decisions. His research on municipal bonds covers such topics asinterest rate calculations, use of competitive or negotiated sale types, bondstructuring and sizing, understanding decision making in the bond saleprocess, debt policies, and emerging bond markets. His research on citizenpreferences focuses on innovative, deliberative, and realistic ways thatcitizen input can be elicited and used in public decisions. He frequentlycollaborates with his colleague Mark Robbins, also at the University ofConnecticut.
Simonsen's work has been published widely in public finance, publicadministration and related journals. His work has appeared in journals suchas Public Administration Review; American Review of PublicAdministration; Public Budgeting and Finance; Municipal Finance Journal;Journal of Public Budgeting, Accounting and Financial Management; UrbanAffairs Review; State and Local Government Review; Publius: The Journalof Federalism, Journal of Urban Affairs and the Social Science Journal. Hisbook chapters include a study of the State of Oregon budgeting practices inBudgeting in the States. His book with Mark Robbins, Citizen Participationin Resource Allocation examines current and historical methods ofinvolving citizens in public budgeting processes. Simonsen has been on theeditorial boards for both the Municipal Finance Journal and PublicBudgeting and Finance.
Mark Robbins is the Department Head and a Professor of Public Policy atthe University of Connecticut. He conducts research and teaches in the areaof public budgeting and finance. His research focuses on public preferencesfor taxing and spending, and on public debt. Mark works closely with BillSimonsen and their work together has appeared in numerous scholarlyjournals. He also serves as technical adviser to the Government FinanceOfficer's Association's Debt Committee, sits on the Commission for PeerReview and Accreditation for the National Association of Schools of PublicAffairs and Administration, and is on the Government Accounting StandardBoard's Government Accounting Standards Advisory Council representingthe Association for Budgeting and Financial Management. Robbins receivedhis Master's degree from the University of Oregon, and his Ph.D. fromSyracuse University's Maxwell School.
Appendix B
Technical Advisor Biographies

26
Appendix CBond Analysis Methodology
The purpose of this appendix is to provide additional detail of themethodology used by the technical advisors. The advisors prepared thedetailed methodology and, therefore it is somewhat technical in nature.
Using ordinary least squares regression, the advisors concluded that, onaverage, with all other factors being equal, competitive bidding carriedborrowing costs that were approximately 23.5 basis points lower than thosesold without such bidding. For the average sale amount of $5.8 million thesavings provides debt service savings of $88,148 over the life of the bond.The following narrative provides information that explains the advisors'review methods and how they addressed selection bias and other variables.
The analysis eliminated short-term bonds and other bonds with unusualcharacteristics. The eliminated bonds included bonds maturing in less than 3years, bonds that were not "plain vanilla" GO issues (such as Qualified ZoneAcademy Bonds, Build America Bonds, Neighborhood ImprovementBonds, and others), taxable bonds, and one bond with "outlier"characteristics regarding borrowing costs. The original overall population of807 bonds was reduced to an analysis population of 538 bonds.
To account for the possibility of selection bias, as issuers might select thesale type non-randomly, a Hausman test was performed. The test, whichfactored for whether or not the bond was partially or fully refunded as aninstrument, did not reveal the need for selection correction. Whether or notthe bond is a refunding bond has been used in past studies as aninstrument.11
Previous research and economic theory were reviewed. Factors other thanthe method of sale that could affect borrowing costs were identified. Tostatistically control for the other factors ordinary least squares regressionwas used to observe the effect that the decision to pursue competitive salesmakes on borrowing costs. The table below presents the variables used inthe analysis and their definitions.
11Peter Brucato and Jun Peng, "Another Look at the Effect of Method of Sale on the Interest
Cost in the Municipal Bond Market: A Certification Model," Public Budgeting and Finance,Vol. 23., No. 1., March 2003, pp 73-95. Tatyana Guzman and Temirlan Moldogaziev,"Which Bonds Are More Expensive? The Cost Differentials by Debt Issue Purpose and theMethod of Sale: An Empirical Analysis," Public Budgeting and Finance, Vol. 32., No. 3.,Fall 2012, pp 79-101.
Appendix C
Bond Analysis Methodology
Analysis population
Consideration ofselection bias
Analysis method

27
Appendix CBond Analysis Methodology
Variables Considered During Analysis
Variable Variable Definition
Method of sale 1 if sale is competitive, 0 if negotiated
Experience Number of sales by the issuer since June200512
Callable 1 if the bond is callable, 0 if not
Bank qualified 1 if the bond is bank qualified, 0 if not
Bond Buyer GO Index The Bond Buyer GO index for the week ofthe sale
Ratings A series of indicator variables representingthe bond ratings. The Moody's rating is used.If there is no Moody's rating, the Standardand Poor's rating is used. The base case is norating or unreported rating
Volatility The standard deviation of the Bond BuyerGO Index for the prior month
Yield ratio The ratio of the Bond Buyer One-Year NoteIndex and the Bond Buyer GO Index
Insured 1 if the bond is insured, 0 if not
Natural log-years to maturity The natural logarithm of the years to bondmaturity
Natural log-bond amount The natural logarithm of the amount of thebond
School 1 if the issuer is a school, 0 if not
Time counter A time counter by quarter of the year
Quarters A series of indicator variables representingthe year and quarter that the bond was issued
Two analysis models were used to analyze the test population. The firstmodel included competitive sale as the variable of interest to determine theimpact of sales method on interest costs. The second model included thenumber of bids as the variable of interest to determine the incrementalimpact of each additional bid on interest costs. The results of both modelsshow similar patterns in the results. Both models were subjected to anadditional data result set that factors in controls for time, which are
12The prior audit data went through May 2005.
Multiple analysismodels were applied

28
Appendix CBond Analysis Methodology
considered important due to the effects of the financial collapse during thetime period under analysis.
The present value of the cost difference between bond issues sold bycompetitive versus negotiated means was calculated to describe themagnitude of the effects revealed in the analysis. The calculation is based onassumptions that the debt matures in 12 years (about the average for bondsales in the sample), debt service has equal principal payments, and interestpayments occur every 6 months. Cost savings were calculated for sales of$2 million, $5.8 million (approximately the average for the bond sales in thesample) and $10 million. The expected interest savings were calculatedusing the 23.45 basis point saving estimate calculated as part of the bondanalysis. This saving estimate is provided by the preferred analysis results,which used method of sale as the independent variable and was adjusted fortime controls. The results are shown in the table below.
Estimated Savings for Issues Sold Through Competitive Bidding
Amount of Sale $ 2,000,000 5,800,000 10,000,000
Savings (undiscounted) $ 30,743 88,148 150,067
Savings (discounted) $ 24,477 70,346 119,730
The SAO provided documentation of the analysis performed by the advisorsto the University of Missouri for an evaluation of the methodology. JudithStallmann, Professor of Agricultural Economics, Rural Sociology andTruman School of Public Affairs performed the evaluation. The professorhas published research in national publications and is familiar with thestatistical techniques used by the advisors.
The professor reviewed various aspects of the methodology, including thenumber of competitive and negotiated sales, potential sample selection bias,and the control variables. The professor concluded the numbers of bonds foreach method of sale were sufficient to obtain reliable estimates, preliminarytesting correctly addressed the possibility of selection sample bias, ordinaryleast squares was an appropriate methodology to be used to estimate theimpact of type of issue on the basis points, and the control variables and testresults under several analysis applications provide confidence in theestimates.
Estimated savings usinganalysis results
Methodology approved byan independent professor

29
Appendix DLocal governments Interviewed
The table below documents the local governments contacted as part of ourfieldwork and any of their bond issues included in our analysis. We visitedthe local governments to identify potential issues faced and to understandfactors contributing to choices made. We selected the entities from ouranalysis population of entities that completed bond issues during the 4 yearsending December 31, 2011. To ensure a diverse mix of bond issuers, webased selections on geographic location, sales method, entity type, and bondcharacteristics.
Political Subdivision
BondRegistration
NumberType of
SaleAmount of
IssueDate ofIssue
TIC Rate(Percent)
Boonville R-I School District 25164 Negotiated $ 2,855,000 1/29/2008 3.775
25293 Negotiated 4,320,000 2/18/2009 2.815
25923 Negotiated 5,870,000 12/13/2011 2.928
Carthage R-IX School District 25298 Negotiated 4,060,000 2/15/2009 2.070
City of Grandview 25371 Competitive 3,300,000 7/29/2009 1.325
25748 Competitive 4,250,000 11/23/2010 1.591
Cole County R-V School District 25487 Negotiated 3,240,000 1/27/2010 2.738
25644 Negotiated 844,790 7/29/2010 3.595
Columbia School District 25186 Competitive 30,015,000 4/1/2008 4.364
25347 Competitive 4,875,000 5/5/2009 3.185
25510 Competitive 8,305,000 2/23/2010 1.671
25726 Competitive 18,430,000 10/12/2010 1.502
25852 Negotiated 48,275,000 6/1/2011 4.004
Fulton Public School District No.58
25163 Competitive 3,550,000 1/24/2008 2.976
25467 Competitive 7,500,000 12/16/2009 2.888
25574 Competitive 4,327,570 6/24/2010 3.875
Grandview C-4 School District 25238 Negotiated 8,410,000 6/25/2008 3.235
25248 Negotiated 1,500,000 7/31/2008 4.608
25300 Negotiated 4,000,000 2/18/2009 3.260
25623 Negotiated 6,495,000 7/14/2010 2.534
Greene County R-III SchoolDistrict
25202 Negotiated 4,990,000 5/1/2008 3.429
25602 Negotiated 3,462,000 6/15/2010 4.015
Marshfield R-I School District 25609 Negotiated 712,000 6/15/2010 3.808
North Callaway County R-ISchool District
25292 Negotiated 1,870,000 2/12/2009 2.727
Rockwood R-VI School District 25234 Competitive 70,000,000 6/24/2008 3.905
25307 Negotiated 32,945,000 2/24/2009 1.895
25488 Negotiated 24,465,000 1/28/2010 2.831
25714 Competitive 13,800,000 9/29/2010 1.586
25879 Negotiated 9,905,000 7/27/2011 1.280
Appendix D
Local Governments Interviewed

30
Appendix DLocal governments Interviewed
Bond Issued By
BondRegistration
NumberType of
SaleAmount of
IssueDate ofIssue
TIC Rate(Percent)
Warrensburg R-VI School District 25409 Negotiated 1,510,000 9/15/2009 3.155
25671 Negotiated 3,520,000 8/9/2010 2.341
Webb City R-VII School District 25214 Negotiated 5,000,000 5/15/2008 4.192
Wentzville R-IV School District 25278 Competitive 8,540,000 12/30/2008 4.840
25381 Negotiated 30,623,677 8/4/2009 5.581
25828 Negotiated 7,950,000 3/30/2011 3.249
25907 Negotiated 42,535,000 10/6/2011 2.870
Wright City R-II School District 25213 Negotiated 2,735,000 5/28/2008 3.167
25352 Negotiated 2,700,000 5/13/2009 4.199
25422 Negotiated 310,020 10/1/2009 2.705
25554 Negotiated 1,400,000 6/3/2010 3.419
25802 Negotiated 3,730,000 2/3/2011 2.076
25824 Negotiated 5,250,000 3/8/2011 2.951
25951 Negotiated 1,000,000 12/29/2011 2.243

31
Appendix EGFOA Resources
Our research identified valuable best practices resources and other guidancepublished by the GFOA. A full listing of GFOA best practices guidance,other advisories, and publications are available at www.gfoa.org. Otherorganizations and authors publish similar resources and technical papers,which are generally available for download or purchase by localgovernments. Several of the GFOA debt management resources are listedbelow, most of which are available at no cost:
BOOKS A Practitioner's Guide To Effective Debt Management: Competitive
v. Negotiated: How to Choose the Method of Sale for Tax-ExemptBonds (1994)
An Elected Official's Guide to Debt Issuance (2005) Debt Issuance and Management - A Guide for Smaller
Governments (1994)
BEST PRACTICES Analyzing and Issuing Refunding Bonds (1995 and 2010) Costs of Issuance Incurred in a Publicly Offered Debt Transaction
(2013) Debt Management Policy (1995, 2003 and 2012) Expenses Charged by Underwriters in Negotiated Sales (1996, 2010
and 2012) Issuer's Role in Selection of Underwriter's Counsel (1998, 2009) Issuing Taxable Debt by U.S. State and Local Governments (1998
and 2012) Managing Build America and other Direct Subsidy Bonds (2010
and 2012) Pricing Bonds in a Negotiated Sale (1996, 2000, and 2010) Selecting and Managing the Method of Sale of State and Local
Government Bonds (1994 and 2007) Selecting Bond Counsel (1998 and 2008) Selecting Financial Advisors (2008) Selecting Underwriters for Negotiated Bond Sales (2008)
ADVISORIES Evaluating the Use of Pension Obligation Bonds (1997, 2005) Need for Considerable Caution in Regard to OPEB Bonds (2007) Understanding the Issuer's Role in Secondary Market Securitization
of Tax-Exempt Obligations (1993, 1996, 2005) Underwriter Disclaimers in Official Statements (2000) Using Variable Rate Debt Instruments (1997 and 2010) revised Use of Debt-Related Derivatives Products and the Development of a
Derivatives Policy (1995, 2003, 2005 and 2010) revised
Appendix E
GFOA Resources

32
Appendix FGFOA Method of Sale Matrix
The table below is a reproduction of a GFOA document intended to provideguidance to issuers of public debt. It presents the conditions which favorcompetitive and negotiated sale methods.
Competitive Negotiated
Debt StructurePledged Revenues General Obligation or Strong System
RevenueProject Supported Revenues
Security Structure (forRevenue Bonds)
Conventional Resolution and CashFlow: Rate Covenant and Coverage
Unusual or Weak Covenants;Subordinate Debt
Debt Instrument Traditional Serial and Term, FullCoupon Bonds
Use of Innovative Structuring,Derivative Products, Structure toAttract Particular Investors (e.g.Discount Bonds), etc.
Credit QualityRating 'A' or better Below Single 'A'Outlook Stable Weak but Improving, or Under
Stress
Issuer CharacteristicsType of Organization Broad-Based General Purpose
BorrowerSpecial Purpose, IndependentAuthority
Frequency of Issuance Regular Borrower in Public Market New or Infrequent IssuerMarket Awareness Active Secondary Market with
Broad Investor BaseLittle or No Institutional Awarenessof Issuer; Historical Antipathy
Investor Comfort Well-Known, Stable Issuer Issuer Experiencing SignificantFinancial, Legal or Other Problems
Market ConditionsInterest Rates Stable; Predictable Market Volatile or Declining MarketSupply and Demand Strong Investor Demand, Good
Liquidity, Light Forward CalendarOversold Market, Heavy Supply
Policy ConsiderationsParticipation in Sale ofBonds
Broad Market Participation DesiredSale of Bonds
Desire to Direct Business to DBE1 orLocal/Regional Firms
Stimulation of InvestorInterest
Broad Market Participation Desiredfor Purchase of Bonds
Desire to Direct Business toLocal/Regional Investors
1 Disadvantaged Business Enterprise
Source: A Practitioner's Guide to Effective Debt Management: Competitive v. Negotiated: How to Choose the Method of Sale for Tax-Exempt Bonds, GFOA, 1994, p. 3.
Appendix F
GFOA Method of Sale Matrix