Statewide Forecast Results for Electricity and Natural Gas...
37
California Energy Commission IEPR Workshop CALIFORNIA ENERGY DEMAND (CED) 2011 REVISED STAFF FORECAST Fb 23 2012 10 00 Statewide Forecast Results for Electricity and Natural Gas February 23, 2012 — 10:00 am and Methods Chris Kavalec Demand Analysis Office [email protected] / 916-654-5184 DATE RECD. DOCKET 12-IEP-1B FEB 23 2012 FEB 23 2012
Transcript of Statewide Forecast Results for Electricity and Natural Gas...
California Energy Commission
IEPR Workshop
CALIFORNIA ENERGY DEMAND (CED) 2011REVISED STAFF FORECAST
F b 23 2012 10 00
Statewide Forecast Results for Electricity and Natural Gas
February 23, 2012 — 10:00 am
and Methods
Chris Kavalec Demand Analysis Office
[email protected] / 916-654-5184
DATE RECD.
DOCKET12-IEP-1B
FEB 23 2012
FEB 23 2012
California Energy Commission
CED 2011 Revised ForecastAgenda• Agenda– Statewide results for electricity and natural
gas including discussion of methodologygas including discussion of methodology– Electric Vehicle Forecast
C ti /Effi i– Conservation/Efficiency – Self-generation
R lt f 5 j l i– Results for 5 major planning areas
2

California Energy Commission
Planning Areas for Electricity
• LA Department of Water and Power (LADWP) • Pacific Gas and Electric (PG&E)• Southern California Edison (SCE)• San Diego Gas and Electric (SDG&E)
S t M i i l Utilit Di t i t (SMUD)• Sacramento Municipal Utility District (SMUD) • Burbank/Glendale• PasadenaPasadena• Imperial Irrigation District
3

California Energy Commission
Planning Areas for Natural Gas
• Pacific Gas and Electric (PG&E)• Southern California Gas (SCG)( )• San Diego Gas and Electric (SDG&E)• Other
4

California Energy Commission
Demand Forecast: Key Outputs
• Electricity and natural gas consumptionp
• Electricity sales and net energy for loadload
• Peak demandE i b• Energy savings by source
• Private supply (self-generation)
5

California Energy Commission
Demand Forecast: Key Inputs
• Survey data (UECs, saturations)• Econ-demo assumptionsEcon demo assumptions• Energy prices
QFER l d t• QFER sales data• Program data (efficiency, self-gen)
6

California Energy Commission
Demand Forecast Methodology
Individual sector models for: • Residential • Commercial • Industrial • Agricultural • Transportation communications andTransportation, communications, and
utilities (TCU) and street lightingSummary and peak modelsSu a y a d pea ode s
7

California Energy Commission
Demand Forecast StructureGENERAL ECONOMIC AND DEMOGRAPHIC ACTIVITY
RESIDENTIAL COMMERCIAL INDUSTRIAL AGRICULTURE / WATER PUMPING
Floorspace Model Urban
Water Pumping
Dairy and Livestock
Crop Production
Thermal Processes
Motors, Lighting, HVAC
Housing Model
Energy Energy
ENERGY DEMAND FORECAST SUMMARY MODEL
Energy Model
Energy Model
PEAK DEMAND AND HOURLY LOAD FORECAST MODEL
ANNUAL ENERGY AND PEAK ELECTRIC FORECAST AND ANNUAL
7
ANNUAL ENERGY AND PEAK ELECTRIC FORECAST AND ANNUAL NATURAL GAS FORECAST
California Energy Commission
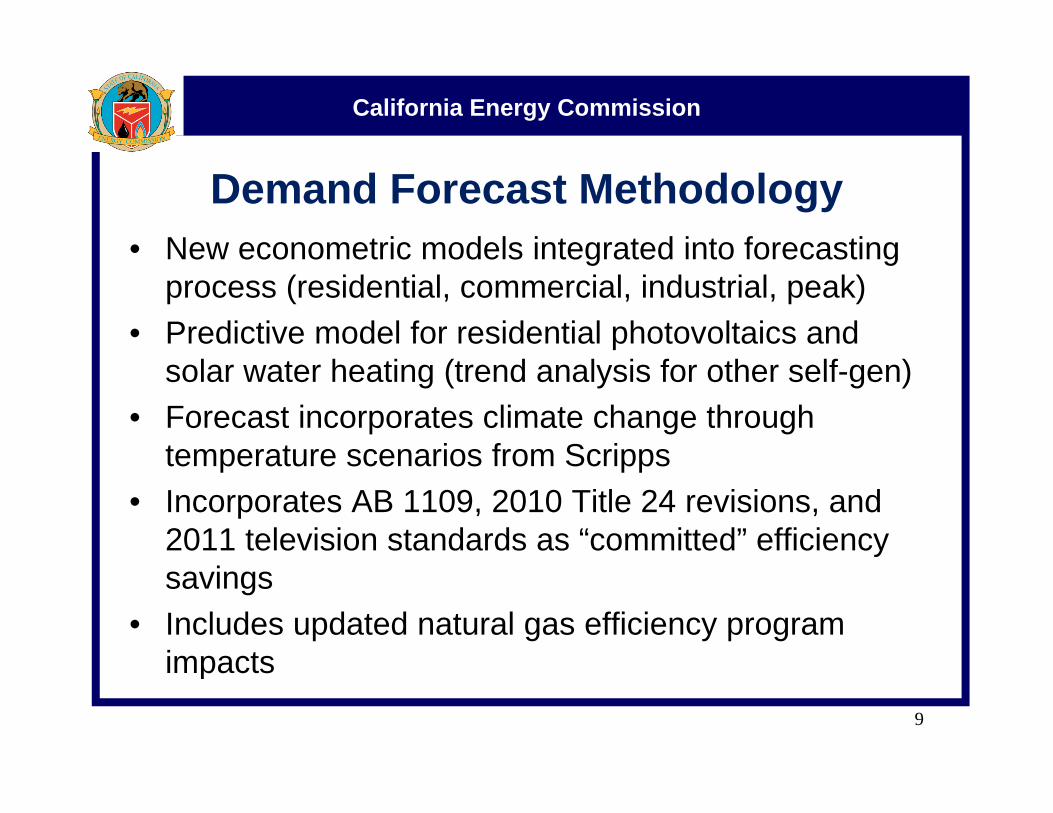
Demand Forecast Methodology• New econometric models integrated into forecastingNew econometric models integrated into forecasting
process (residential, commercial, industrial, peak)• Predictive model for residential photovoltaics and
solar water heating (trend analysis for other self-gen)• Forecast incorporates climate change through
temperature scenarios from Scrippstemperature scenarios from Scripps• Incorporates AB 1109, 2010 Title 24 revisions, and
2011 television standards as “committed” efficiency savings
• Includes updated natural gas efficiency program impactsimpacts
9

California Energy Commission
Integration of Econometric Models
• Electricity price elasticities for residential and industrial models made consistent with
l ti iti ti t d i dielasticities estimated in corresponding econometric models
• Weather adjustment commercial end use• Weather adjustment commercial end use electricity consumption results made consistent with coefficient for cooling degree days estimated in commercial econometric model
10
California Energy Commission
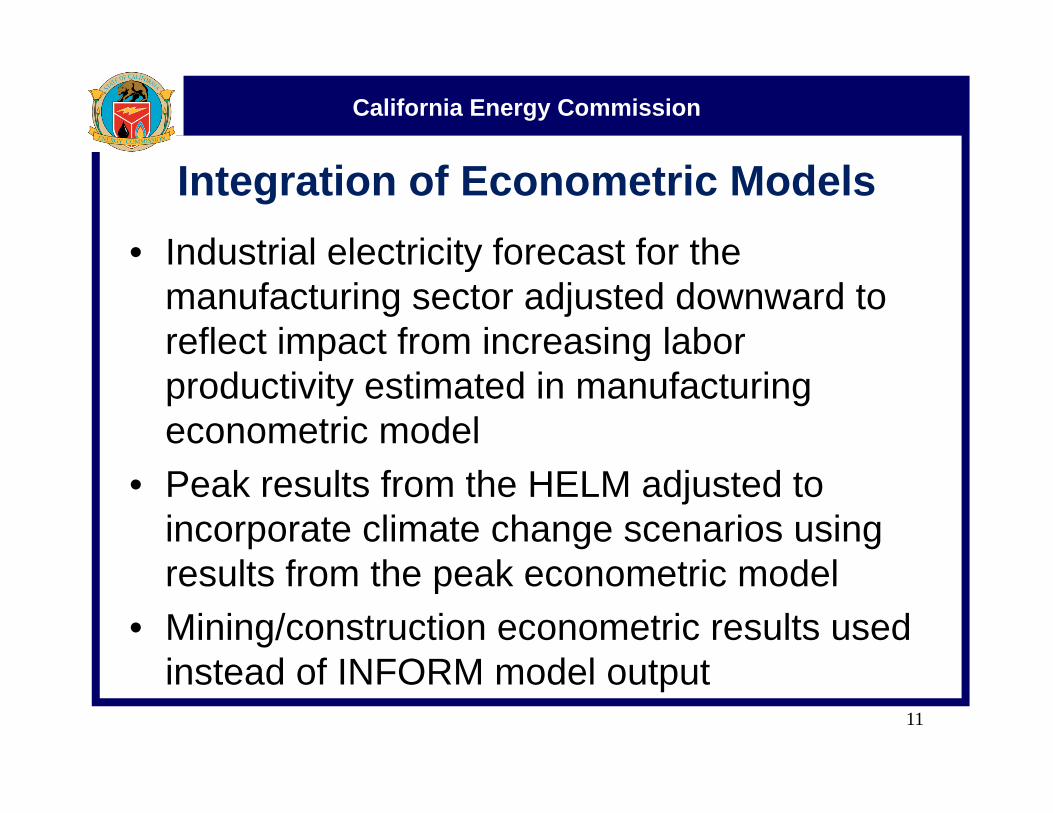
Integration of Econometric Models • Industrial electricity forecast for the• Industrial electricity forecast for the
manufacturing sector adjusted downward to reflect impact from increasing labor p gproductivity estimated in manufacturing econometric model
• Peak results from the HELM adjusted to incorporate climate change scenarios using
lt f th k t i d lresults from the peak econometric model• Mining/construction econometric results used
i t d f INFORM d l t tinstead of INFORM model output11

California Energy Commission
Climate Change Adjustment• Econometric peak model used for adjustment; re-
estimated to include annual maximum of average daily temperatures instead of annual maximum ofdaily temperatures instead of annual maximum of maximum daily temperatures
• Scripps provided 8 temperature scenarios; staff chose a “mid” and a “high” temperature increase for mid and high cases
• Low demand case included no climate changeLow demand case included no climate change adjustment
• Staff used long-term trend (1990-2020) from scenarios to calculate annual maximum average631
12

California Energy Commission
Three Demand Scenarios• Scenarios are based on October 2011 economic projections• High case: High econ-demo growth (Global Insight “Optimistic”),
lower electricity rates, low (committed) efficiency program andlower electricity rates, low (committed) efficiency program and self-generation impacts
• Mid case: Mid economic growth (Economy.Com “Base”), mid electricity rates, mid efficiency program and self-gen impactselectricity rates, mid efficiency program and self gen impacts
• Low case: Low econ-demo growth (Economy.Com “Protracted Slump” combined with “Lower Long-term Growth” scenarios), high electricity rates, high efficiency program and self-gen g e ect c ty ates, g e c e cy p og a a d se geimpacts
13

California Energy Commission
Changes from Preliminary Forecast
• Economic/demographic projections updated (October 2011)
• Econometric models re-estimated• Climate change formulation led to higher
impacts on peak• Revised (lower) electric vehicle forecast• Incorporation of television standards
14

California Energy Commission
Summary of Results• Lower starting point for consumption vs. CED 2009;
slightly lower growth 2011-2020 in mid scenario• Slightly lower consumption growth 2011-2022 in all
three scenarios vs preliminary 2011 forecastthree scenarios vs. preliminary 2011 forecast because of television standards, lower electric vehicle forecast, and slightly lower income growth
• Mid and high case peak demand growth higher than CED 2009 because of climate change impacts
• Peak lower in mid and low cases vs preliminary 2011• Peak lower in mid and low cases vs. preliminary 2011 forecast because of lower starting point. Peak is higher in high demand case vs. preliminary because of higher climate change impacts
15

California Energy Commission
Statewide Electricity ConsumptionAverage annual growth 2011-2022: 1.7 percent in
hi h 1 0% i lhigh case, 1.0% in low case
16

California Energy Commission
Statewide Electricity ConsumptionAverage annual growth 2011-2020: 1.17% in revised
id 1 26% i li i id 1 20% i CED 2009mid, 1.26% in preliminary mid, 1.20% in CED 2009
17

California Energy Commission
Statewide Electricity SalesAverage annual growth 2011-2022: 1.65 percent in
hi h 0 9% i lhigh case, 0.9% in low case
18

California Energy Commission
Statewide Electricity SalesAverage annual growth 2011-2020: 1.10% in revised
id 1 19% i li i id 1 20% i CED 2009mid, 1.19% in preliminary mid, 1.20% in CED 2009
19

California Energy Commission
Statewide Non-Coincident PeakAverage annual growth 2011-2022: 1.9% in high
1 0% i lcase, 1.0% in low case
20
California Energy Commission
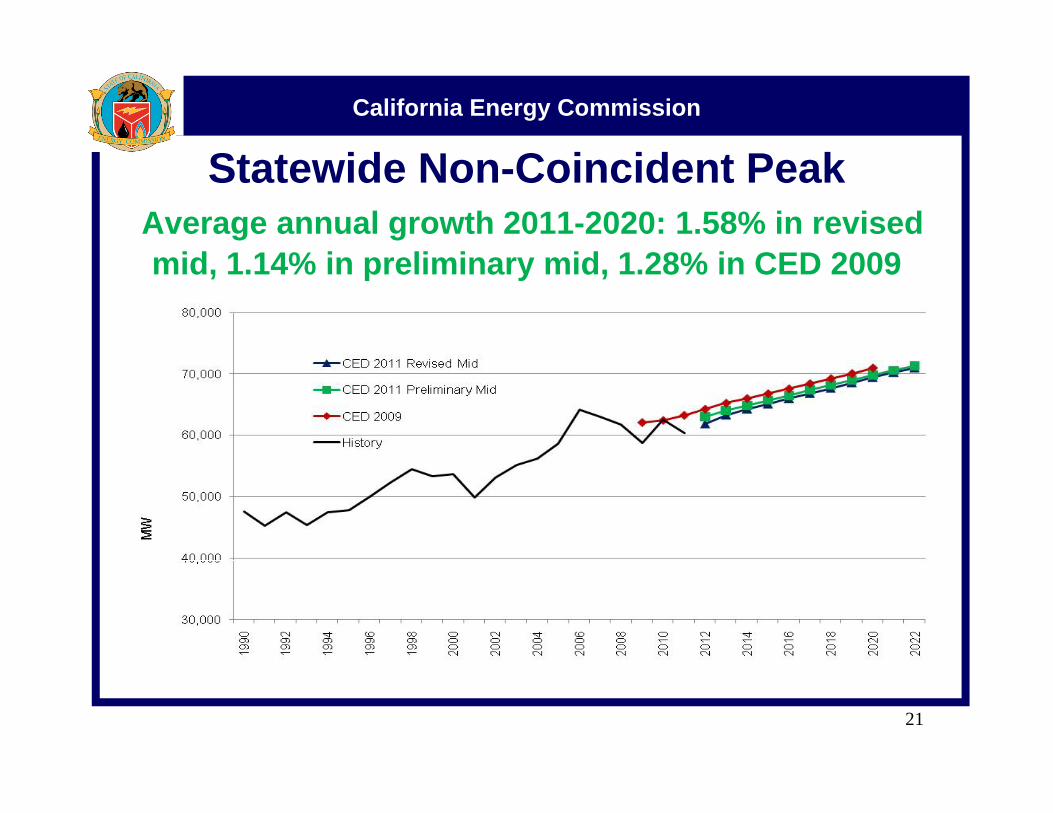
Statewide Non-Coincident PeakAverage annual growth 2011-2020: 1.58% in revised
id 1 14% i li i id 1 28% i CED 2009mid, 1.14% in preliminary mid, 1.28% in CED 2009
21
California Energy Commission
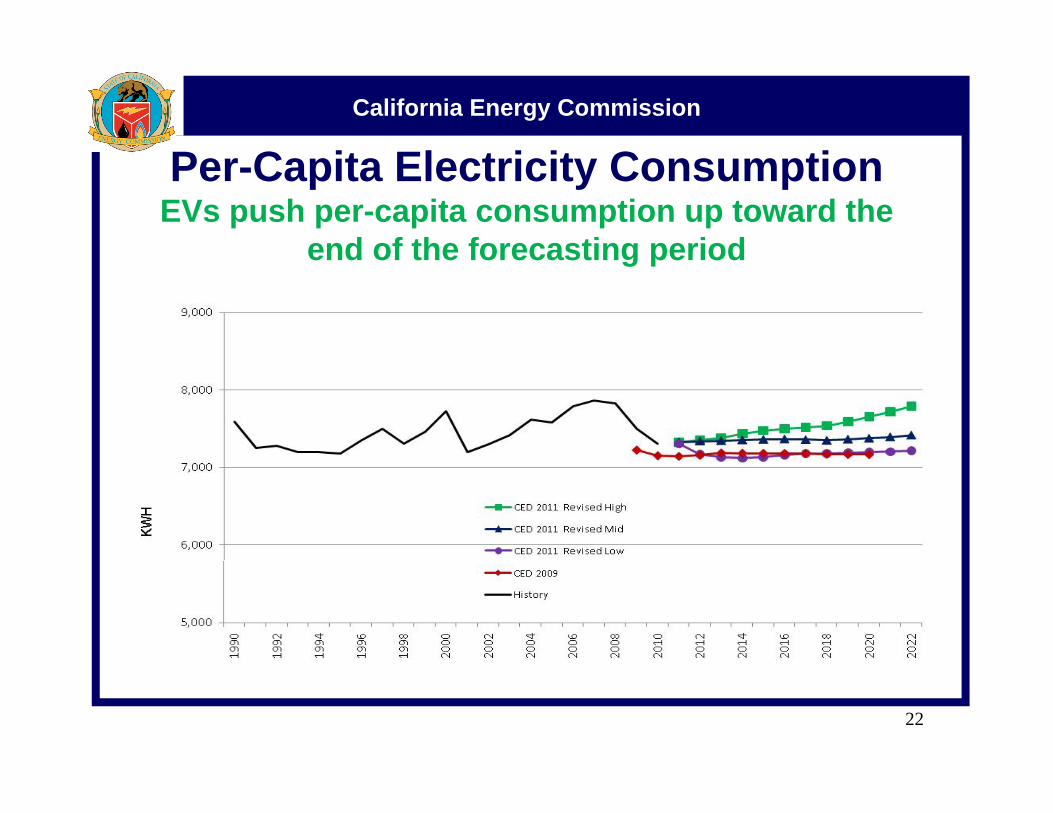
C CPer-Capita Electricity ConsumptionEVs push per-capita consumption up toward the
end of the forecasting periodend of the forecasting period
22

California Energy Commission
Per-Capita Electricity ConsumptionPer-capita consumption up 270 KWh vs. preliminary
in 2011 because of population adjustmentin 2011 because of population adjustment
23
California Energy Commission
Statewide Electricity Forecast: Sectors
• For the three main economic sectors in the mid case, average annual growth is fastest in residential (1.77% average for 2011-2022), followed by commercial (1.4%) and industrial (0.14%)
• In high scenario fastest growth is in industrial sector• In high scenario, fastest growth is in industrial sector• In revised forecast mid case, average annual
residential growth 2011-2020 is 1.56%, compared to 1.79% in preliminary forecast and 1.9% in CED 2009
24

California Energy Commission
Statewide Electricity Forecast: Sectors
• In revised forecast mid case, average annual commercial growth 2011-2020 is 1.44%, compared to 1 48% in preliminary forecast and 1 2% in CED 20091.48% in preliminary forecast and 1.2% in CED 2009
• In revised forecast mid case, average annual industrial consumption growth 2011-2020 is 0.26%, p gcompared to 0.30% in preliminary forecast and 0.44% in CED 2009
• Average annual consumption growth in• Average annual consumption growth in TCU/streetlighting and agricultural sectors is slightly less than 1 percent
25
California Energy Commission
End-User Natural Gas Forecast
• By planning area: PG&E, SCG, SDG&E, and other
• Does not include natural gas used by utilities or others for electric generation
• Forecast produced with same models as electricityU d t d t l ffi i• Updated natural gas efficiency program impacts
26
California Energy Commission
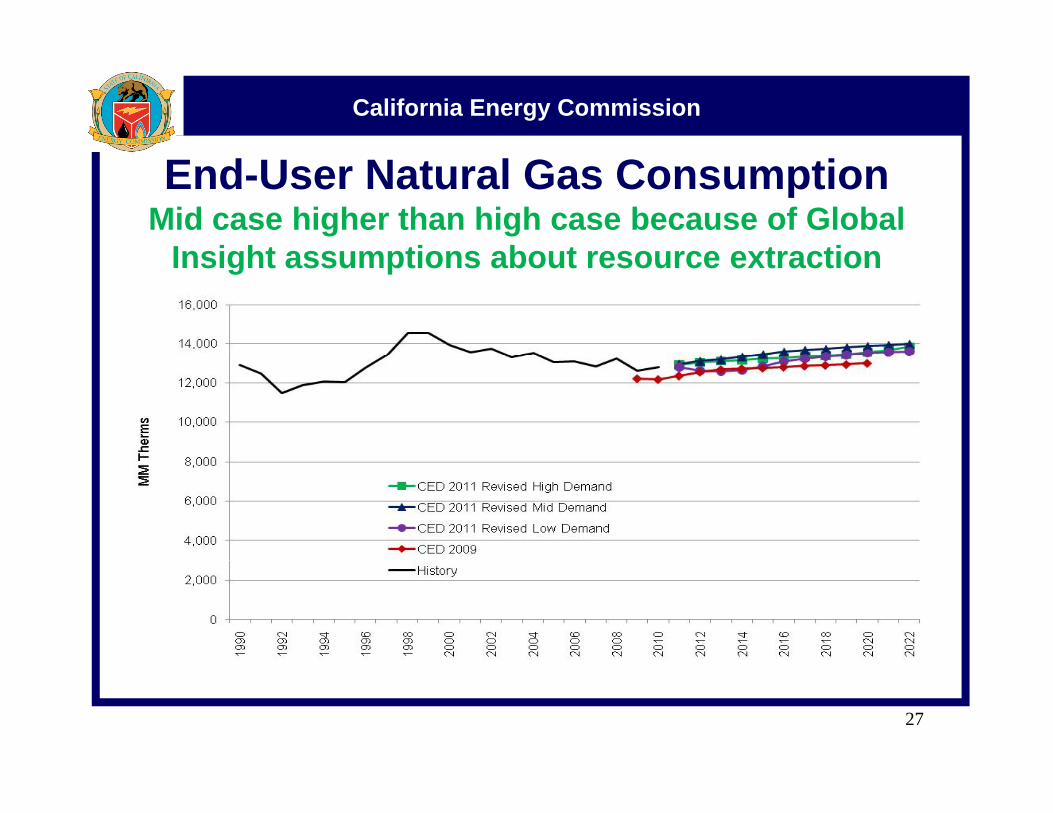
End-User Natural Gas ConsumptionMid case higher than high case because of Global
Insight assumptions about resource extractionInsight assumptions about resource extraction
27
California Energy Commission
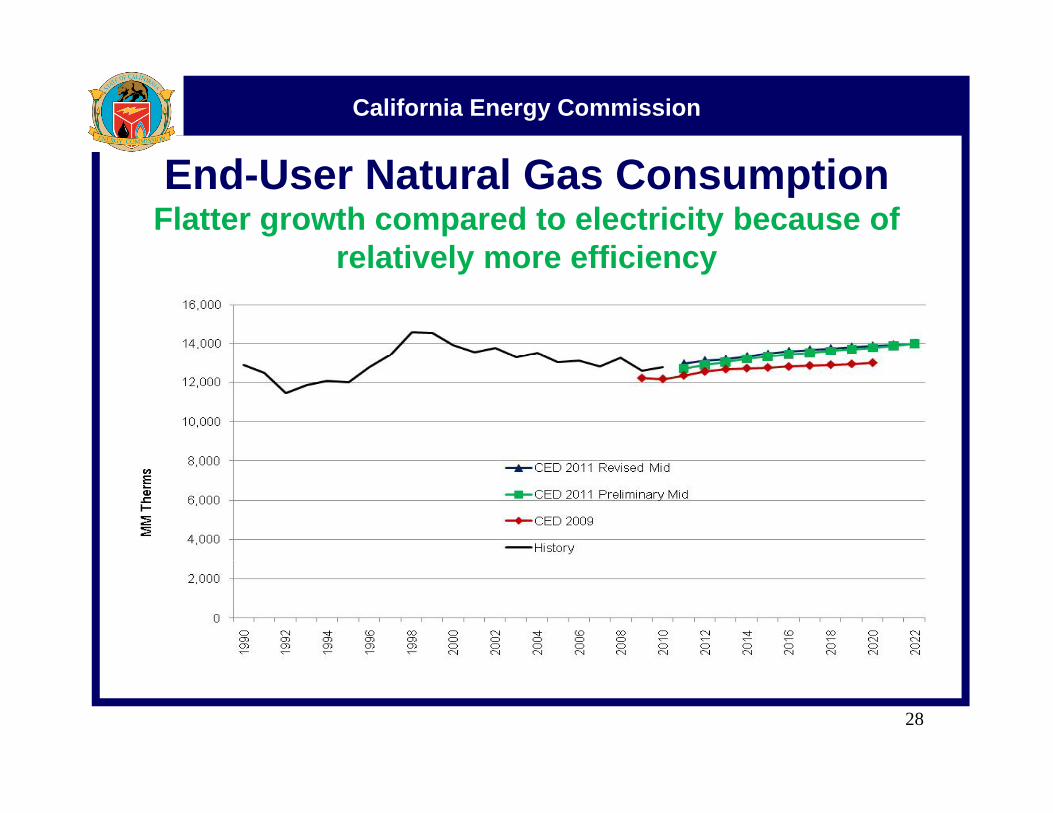
End-User Natural Gas ConsumptionFlatter growth compared to electricity because of
relatively more efficiencyrelatively more efficiency
28

California Energy Commission
Key Input: State Household PopulationDownward adjustment of 1.6 million in 2010j
29
California Energy Commission
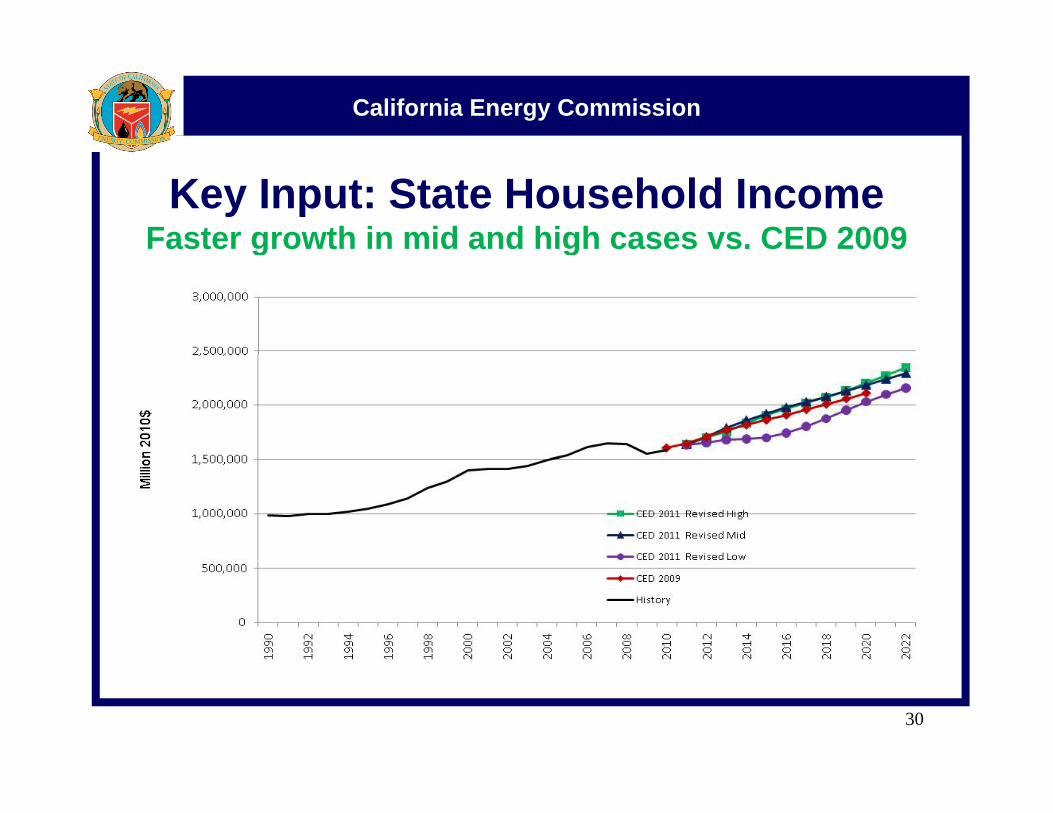
Key Input: State Household Income Faster growth in mid and high cases vs. CED 2009g g
30
California Energy Commission
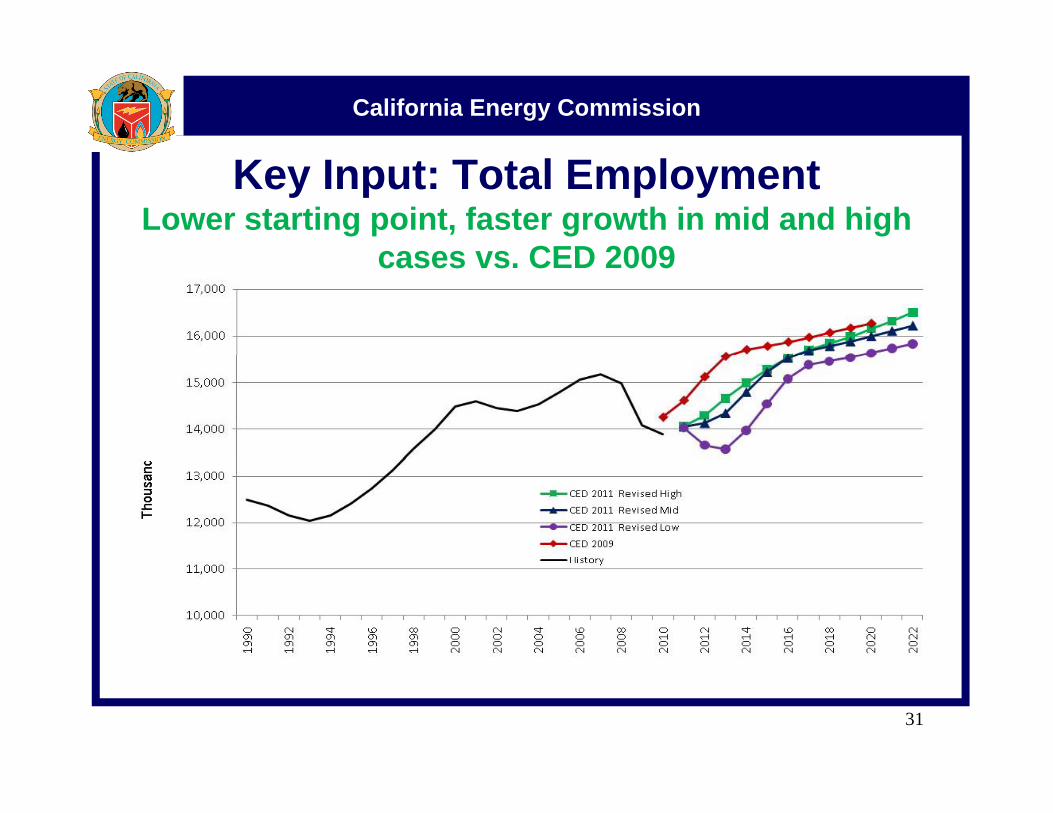
Key Input: Total Employment Lower starting point, faster growth in mid and high
cases vs CED 2009cases vs. CED 2009
31

California Energy Commission
Cli t Ch I t P kClimate Change Impacts on Peak Demand
A n n u a l Ma x im u mA ve ra g e 6 3 1 (°F ),
M id De m a n d S ce n a r io
A n n u a l M ax im u m A ve ra g e 6 3 1 (°F ),
Hig h D e m a nd S ce n a r io
P e a k Im p a ct, M id S c en a r io
(MW )
P e a k Im p a ct, H ig h S ce n a rio
(MW )
L A D W P 2 0 1 5 84 .0 84 .2 3 5 5 4 2 0 2 0 84 .5 85 .0 8 3 1 3 1 2 0 2 2 84 .7 85 .2 1 0 5 1 6 5
P G E 2 0 1 5 86 .0 86 .1 1 1 4 1 4 3 2 0 2 0 86 .4 86 .6 2 7 7 3 4 9 2 0 2 2 86 .6 86 .8 3 4 8 4 4 0
S C E 2 0 1 5 86 .2 86 .3 1 2 1 1 7 1 2 0 2 0 86 6 87 0 2 9 3 4 2 1 2 0 2 0 86 .6 87 .0 2 9 3 4 2 1
2 0 2 2 86 .8 87 .2 3 6 8 5 3 3S D G E 2 0 1 5 78 .6 78 .6 2 7 2 8
2 0 2 0 79 .0 79 .1 6 6 7 0 2 0 2 2 79 .2 79 .3 8 4 8 8
S MU D 2 0 1 5 85 .4 85 .6 1 3 2 3 2 0 2 0 85 .7 86 .2 3 1 5 7 2 0 2 2 85 .9 86 .5 3 9 7 2
S tat e 2 0 1 5 - - - - 3 1 6 4 3 0 2 0 2 0 - - - - 7 6 8 1 ,0 5 6 2 0 2 2 - - - - 9 6 5 1 ,3 3 4
32

California Energy Commission
CED 2011 R i d PCED 2011 Revised vs. Pure Econometric Forecast
• Econometric forecasts slightly higher at statewide level
• Differences come from aggregate vs. disaggregate approaches and accounting for
ffi iefficiency• Goal is to explicitly account for efficiency in
t i d l f b tt ieconometric models for better comparison
33

California Energy Commission
Consumption: CED 2011 Revised vs. Pure Econometric Forecast (Mid Case)
Econometric 1% higher in 2022
34
California Energy Commission
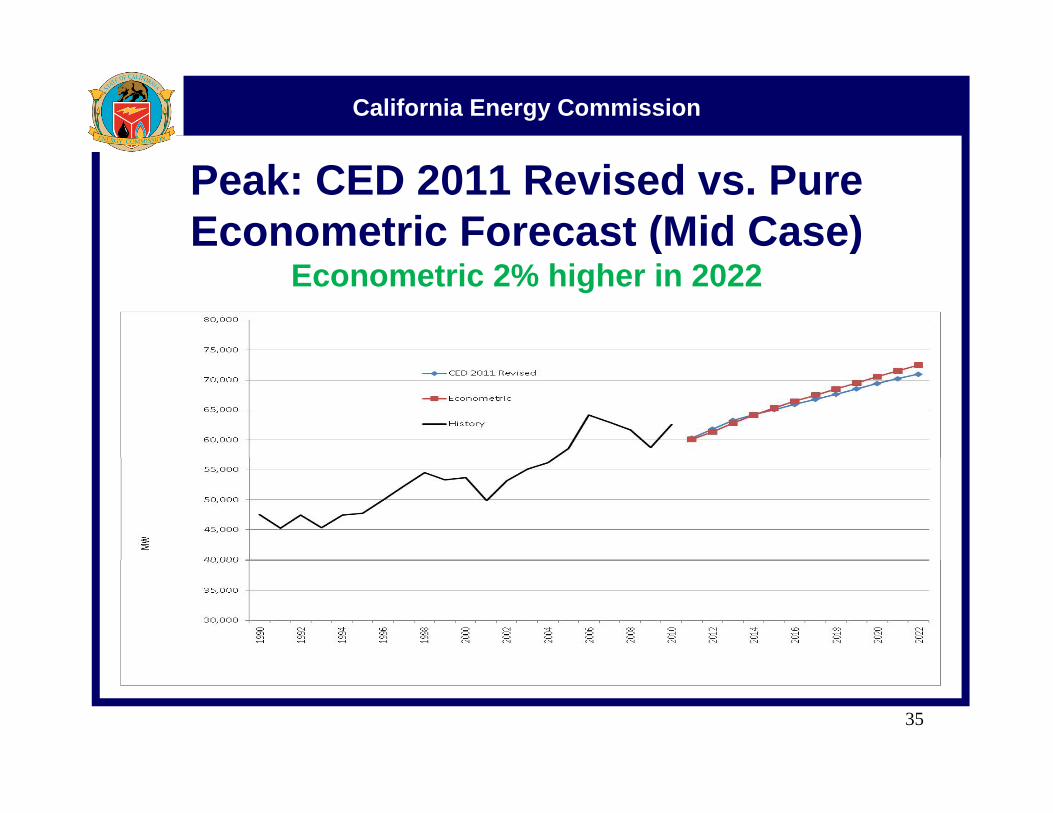
Peak: CED 2011 Revised vs. Pure Econometric Forecast (Mid Case)( )
Econometric 2% higher in 2022
35

California Energy Commission
Electric Vehicles
• Used high and low scenarios from Plug-in Electric Vehicle Collaborative500 000 EV th d i 2020 i l 1• 500,000 EVs on the road in 2020 in low case, 1 million in high case
• Staff extrapolated to 2022, distributed to planningStaff extrapolated to 2022, distributed to planning areas based on DMV data
• Mid case is average of high and low• Lower forecast than CED 2009 (and preliminary) by
1,600 GWh in mid case (2022)
36

California Energy Commission
Electric Vehicle ConsumptionMost of the growth is in last few years of forecastg y
37