STATEMENT TO THE SUBCOMMITTEE ON SPACE, · PDF file1 STATEMENT TO THE SUBCOMMITTEE ON SPACE,...
20
1 STATEMENT TO THE SUBCOMMITTEE ON SPACE, SCIENCEAND COMPETITIVENESS OF THE UNITED STATES SENATE Hearing on “Data or Dogma? Promoting Open Inquiry in the Debate Over the Magnitude of Human Impact on Climate Change” 8 December 2015 Judith A. Curry Georgia Institute of Technology [email protected] I thank the Chairman and the Committee for the opportunity to offer testimony today on ‘Data or Dogma? Promoting Open Inquiry in the Debate on Climate Change.’ I am Professor and former Chair of the School of Earth and Atmospheric Sciences at the Georgia Institute of Technology. As a climate scientist, I have devoted 30 years to conducting research on a variety of topics including climate dynamics of the Arctic, climate dynamics of extreme weather events, and reasoning about climate uncertainty. As president of Climate Forecast Applications Network LLC, I have been working with decision makers on climate impact assessments, assessing and developing climate adaptation strategies, and developing subseasonal climate forecasting strategies to support adaptive management and tactical adaptation. Over the past decade, I have become increasingly concerned about the integrity of climate research, which is being compromised by the politicization of the science. My research on understanding the dynamics of uncertainty at the climate science-policy interface has led me to conclude these dynamics are not operating in a manner that is healthy for either the science or the policy process. My testimony focuses on the following issues of central relevance to the state of climate science: • Consensus, uncertainty and disagreement • Unsettled climate science: the importance of natural climate variability • Scenarios for the 21 st century climate • The broken contract between climate science and society Consensus, uncertainty and disagreement Under the auspices of the Intergovernmental Panel on Climate Change (IPCC), the international climate community has worked for more than 20 years to establish a scientific consensus on human-caused climate change. The IPCC consensus about dangerous anthropogenic climate change is portrayed as nearly total among scientists with prominence in the field of climate science, and the IPCC consensus has been endorsed by the relevant national and international science academies and scientific societies. The IPCC consensus building process arguably played a useful role in the early synthesis of the scientific knowledge. However, I have argued that the ongoing process to negotiate a scientific consensus has had the unintended consequence of oversimplifying both the problem and its solution, introducing biases into the both the science and related decision making processes.
Transcript of STATEMENT TO THE SUBCOMMITTEE ON SPACE, · PDF file1 STATEMENT TO THE SUBCOMMITTEE ON SPACE,...

1
STATEMENT TO THE SUBCOMMITTEE ON SPACE, SCIENCEAND COMPETITIVENESS
OF THE UNITED STATES SENATE
Hearing on
“Data or Dogma? Promoting Open Inquiry in the Debate Over the Magnitude of Human Impact on Climate Change”
8 December 2015
Judith A. Curry
Georgia Institute of Technology [email protected]
I thank the Chairman and the Committee for the opportunity to offer testimony today on ‘Data or Dogma? Promoting Open Inquiry in the Debate on Climate Change.’ I am Professor and former Chair of the School of Earth and Atmospheric Sciences at the Georgia Institute of Technology. As a climate scientist, I have devoted 30 years to conducting research on a variety of topics including climate dynamics of the Arctic, climate dynamics of extreme weather events, and reasoning about climate uncertainty. As president of Climate Forecast Applications Network LLC, I have been working with decision makers on climate impact assessments, assessing and developing climate adaptation strategies, and developing subseasonal climate forecasting strategies to support adaptive management and tactical adaptation. Over the past decade, I have become increasingly concerned about the integrity of climate research, which is being compromised by the politicization of the science. My research on understanding the dynamics of uncertainty at the climate science-policy interface has led me to conclude these dynamics are not operating in a manner that is healthy for either the science or the policy process. My testimony focuses on the following issues of central relevance to the state of climate science:
• Consensus, uncertainty and disagreement • Unsettled climate science: the importance of natural climate variability • Scenarios for the 21st century climate • The broken contract between climate science and society
Consensus, uncertainty and disagreement Under the auspices of the Intergovernmental Panel on Climate Change (IPCC), the international climate community has worked for more than 20 years to establish a scientific consensus on human-caused climate change. The IPCC consensus about dangerous anthropogenic climate change is portrayed as nearly total among scientists with prominence in the field of climate science, and the IPCC consensus has been endorsed by the relevant national and international science academies and scientific societies. The IPCC consensus building process arguably played a useful role in the early synthesis of the scientific knowledge. However, I have argued that the ongoing process to negotiate a scientific consensus has had the unintended consequence of oversimplifying both the problem and its solution, introducing biases into the both the science and related decision making processes.
2
A scientist’s job is to critically evaluate evidence and challenge and reassess conclusions drawn from the evidence. Disagreement and minority perspectives have an important and respected role to play in advancing science, as a mean for testing ideas and pushing the knowledge frontier forward. How then, and why, have climate scientists come to a scientific consensus about a very complex scientific problem that the scientists themselves acknowledge has substantial and fundamental uncertainties? Climate scientists have become entangled in an acrimonious political debate that has polarized the scientific community and has resulted in political attacks on scientists on both sides of the debate. A scientist’s ‘side’ is often defined by factors that are exogenous to the actual scientific debate. Scientific controversies surrounding evidence of climate change have become a proxy for political battles over whether and how to react to climate change. Therefore, ‘winning’ a scientific debate means attaining a privileged position in political battle, hence providing motivation for defending the scientific consensus. The quality of both scientific and policy debate has suffered as a consequence. A climate scientist making a statement about uncertainty or degree of doubt in the climate debate is categorized as a denier or a ‘merchant of doubt,’ whose motives are assumed to be ideological or motivated by funding from the fossil fuel industry. My own experience in publicly discussing concerns about how uncertainty is characterized by the IPCC has resulted in my being labeled as a ‘climate heretic’1 that has turned against my colleagues. There is enormous pressure for climate scientists to conform to the so-called consensus. This pressure comes not only from politicians, but from federal funding agencies, universities and professional societies, and scientists themselves who are green activists and advocates. Reinforcing this consensus are strong monetary, reputational, and authority interests. As a result, I have become very concerned about the integrity of climate science. In the last 5 years, I have published a series of papers that address the inadequacies that I see in how climate scientists address the issue of uncertainty, and provide ways forward for improved reasoning about the complex problems in climate science:
• Climate science and the uncertainty monster2 • Reasoning about climate uncertainty3 • Nullifying the climate null hypothesis4 • Climate science: no consensus on consensus5
How to deal with the politicization of climate science is less obvious, but I regard it as highly important to shine some light on these problems. On my blog Climate Etc. at judithcurry.com, under the tags of ‘Ethics6’, ‘Consensus7’ and ‘Sociology of Science8’, I have written a series of essays on biases, the problems of advocacy and partisanship among climate scientists, conflicts of interest, and suppressions of climate inquiry.
1 http://www.scientificamerican.com/article/climate-heretic/ 2 http://journals.ametsoc.org/doi/pdf/10.1175/2011BAMS3139.1 3 http://www.climateaccess.org/sites/default/files/Curry_Reasoning%20about%20climate%20uncertainty.pdf 4 http://onlinelibrary.wiley.com/doi/10.1002/wcc.141/abstract?userIsAuthenticated=false&deniedAccessCustomisedMessage= 5 http://curryja.files.wordpress.com/2012/10/consensus-paper-revised-final.doc 6 http://judithcurry.com/category/ethics/ 7 http://judithcurry.com/category/consensus/ 8 http://judithcurry.com/category/sociology-of-science/

3
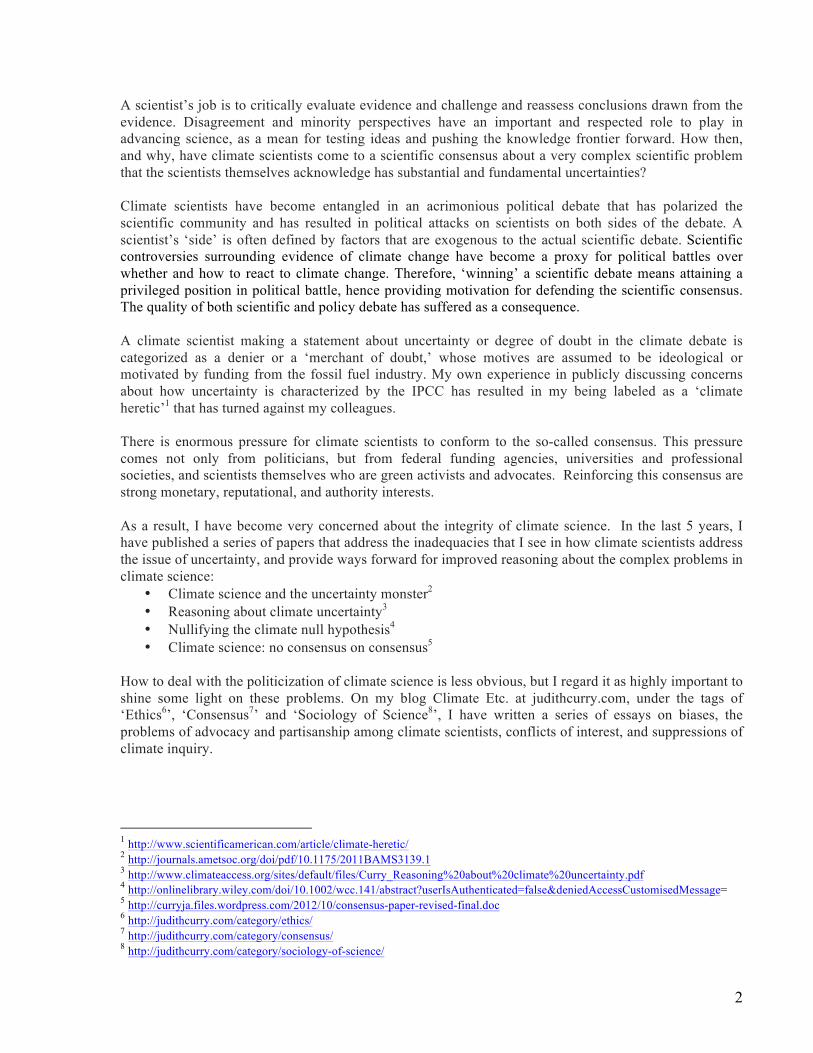
Unsettled climate science Anthropogenic climate change is a theory in which the basic mechanism is well understood, but whose magnitude is highly uncertain owing to feedback processes. Scientists agree that surface temperatures have increased overall since 1880, humans are adding carbon dioxide to the atmosphere, and carbon dioxide and other greenhouse gases have a warming effect on the planet. However there is considerable disagreement about the most consequential issues: whether the warming has been dominated by human causes versus natural variability, how much the planet will warm in the 21st century, and whether warming is ‘dangerous’. Why do climate scientists disagree? The historical data is sparse and inadequate. There is disagreement about the value of different classes of evidence, notably the value of global climate models. There is disagreement about the appropriate logical framework for linking and assessing the evidence in this complex problem. Scientists disagree over assessments of areas of ambiguity and ignorance. And finally, belief polarization resulting from politicization of the science and the IPCC’s consensus building process contributes substantially to the disagreement among scientists. What is causing the warming? The key conclusion of the 2013 IPCC AR5 Report9 is that it is extremely likely that more than half of the warming since 1950 has been caused by humans, and climate model simulations indicate that all of this warming has been caused by humans. Global surface temperature anomalies since 1850 are shown below.
Figure 1: Global surface temperature anomalies from the UK HadCRUT4 dataset http://www.cru.uea.ac.uk/cru/data/temperature/HadCRUT4.pdf
If the warming since 1950 was caused by humans, what caused the warming during the period 1910 – 1945? The period 1910-1945 comprises over 40% of the warming since 1900, but is associated with only 10% of the carbon dioxide increase since 1900. Clearly, human emissions of greenhouse gases played little role in causing this early warming. The mid-century period of slight cooling from 1945 to 1975 – referred to as the ‘grand hiatus’, also has not been satisfactorily explained.
9 https://www.ipcc.ch/pdf/assessment-report/ar5/wg1/WG1AR5_SPM_FINAL.pdf

4
Apart from these unexplained variations in 20th century temperatures, there is evidence that the global climate has been warming overall for the past 200 years, or even longer. While historical data becomes increasingly sparse in the 19th century, the Berkeley Earth Surface Temperature Project has assembled the available temperature data over land, back to 1750:
Figure 2: Global land surface temperature anomalies since 1750, smoothed with a 10 year filter10.
The Berkeley Earth analysis shows a warming trend back to 1800, with considerable variability around the turn of the 19th century. Some of this variability around the turn of the 19th century can be attributed to large volcanic eruptions; this was also the time of the Dalton solar activity minimum (1791-1825). Paleoclimate reconstructions of Northern Hemisphere climate – such as from tree rings and boreholes – indicate that overall warming may have occurred for the past 300-400 years.11 Humans contributed little if anything to this early global warming. What is the global warming hiatus, and why does it matter? The warming hiatus, or ‘pause’, reflects a slowdown of the rate of warming in the early 21st century, relative to the rapid rate of warming in the last quarter of the 20th century. The 2013 IPCC AR5 Report12 made the following statement: “the rate of warming over the past 15 years . . . is smaller than the rate calculated since 1951”. The significance of a reduced rate of warming since 1998 is that during this period, 25% of human emissions of carbon dioxide have occurred. Most significantly, the observed rate of warming in the early 21st century was slower than climate model predictions. The growing discrepancy between climate model predictions and the observations has raised serious questions about the climate models that are being used as the basis for national and international energy and climate policies. 10 Rohde et al., Geoinfor Geostat: An Overview 2013, 1:1 http://dx.doi.org/10.4172/2327-4581.1000101 11 http://www.climatechange2013.org/report/reports-graphic/ch5-graphics/, Figure 5.7 12 https://www.ipcc.ch/pdf/assessment-report/ar5/wg1/WG1AR5_SPM_FINAL.pdf

5
There has been a raging debate in recent months surrounding a new global temperature data set published by NOAA.13 The new data set finds more warming in recent decades than other global surface temperature data sets. Media headlines touted the conclusion that science now shows that the recent hiatus in warming never existed. Other headlines accused NOAA of fiddling with the climate data to erase the warming hiatus. As NOAA’s new land temperature data set did not become publicly available until last month, independent scientists have not yet had the chance to fully assess or understand the new data set. The differences during the recent hiatus period between the new NOAA surface temperature data set and the other data sets is illustrated below.
Figure 3: Global surface temperature anomalies since 1995, for four different data sets. Figure courtesy of Robert Rohde of the Berkeley Earth Surface Temperature Project
The new NOAA temperatures (red curve) are somewhat colder prior to 2007, and warmer since 2012. The largest discrepancies with other data sets are in the ocean data. Scientists are working to understand the reasons for these discrepancies. The trend of the new NOAA dataset of 0.1oC per decade for the period 1998-2014 is more than 50% larger than the trend of some of the other data sets. However, even the larger NOAA trend is at the bottom of the IPCC AR5 climate model projections for the early 21st century warming of 0.11 to 0.43 oC per decade14. The warming hiatus is most clearly revealed in the global satellite data sets of lower atmospheric temperature (Figure 4). Scientists disagree on the reasons for the discrepancies between the variations of surface temperature and the lower atmospheric temperatures. The presence of El Nino and La Nina events compounds the difficulty in interpreting trends.
13 http://www.sciencemag.org/content/early/2015/06/03/science.aaa5632.full 14 https://www.ipcc.ch/pdf/assessment-report/ar5/wg1/WG1AR5_Chapter11_FINAL.pdf

6
Figure 4: Lower atmospheric temperature anomalies determined from satellite, for two different analyses. Figure courtesy of Roy Spencer, University of Alabama Huntsville.
The U.S. media touted 2014 as the ‘warmest year’ in the historical record; however, given the uncertainties in the analyses, 2014 was in a statistical tie with 2010 and 2005. The UK dataset HadCRU, with perhaps a more realistic assessment of uncertainties, found 2014 to rank among the top 10 warmest years, all of which are since 1998. While the recent decade is the warmest in history, the ties for warmest year further reflect a plateau in the warming. Scientists working with the global surface temperature datasets have predicted an 85% probability that 2015 will be the warmest year on record.15 Declarations of ‘warmest year’ are already being made, before the end of the year, presumably to support the current UN climate negotiations in Paris. However, scientists working with the satellite data of lower atmospheric temperatures do not foresee 2015 as being among the warmest years. Scientists continue to investigate the reasons for discrepancies among the data sets. It will likely be 5 years into the future before we have the perspective to identify whether the warming hiatus has ended with a resumption of a more rapid rate of warming, or whether the warming in 2015 from the large El Nino event will be followed by several cool years, as is often the case following El Nino events. The oceans: sea ice and sea level rise Among the greatest public concerns about climate change are sea level rise and melting of the polar ice. However, unless the recent changes are put in context with historical variations and an understanding of natural variability, it is easy to erroneously infer that any recent change is caused by humans.
15 http://berkeleyearth.org/berkeley-earth-temperature-update/

7
Sea ice The IPCC AR5 SPM16 reports the following trends in sea ice:
“[T]he annual Arctic sea ice extent decreased over the period 1979–2012: the rate of this decrease was very likely between 3.5 and 4.1% per decade “It is very likely that the annual Antarctic sea ice extent increased at a rate of between 1.2 and 1.8% per decade between 1979 and 2012.
Below are satellite observations of sea ice variability through early December 2015.
Figure 5. Sea ice extent anomalies from 1979 to present. Source: http://arctic.atmos.uiuc.edu/cryosphere/IMAGES/seaice.anomaly.arctic.png, http://arctic.atmos.uiuc.edu/cryosphere/IMAGES/seaice.anomaly.antarctic.png
With regards to the most recent sea ice variability: since 2013, Arctic sea ice is recovering from its summertime minima during the period 2007-2012. Notably, Arctic sea ice volume (a metric that combines both horizontal extent and ice thickness) shows a continuing increase since 2012.17 During 2014, Antarctic sea ice set a wintertime maximum record; whereas during 2015, the Antarctic sea ice extent has declined owing to the El Nino event. Regarding the causes of the recent variations in sea ice, the AR5 Chapter 1018 states:
“Anthropogenic forcings are very likely to have contributed to Arctic sea ice loss since 1979. There is low confidence in the scientific understanding of the observed increase in Antarctic sea ice extent since 1979, due to the incomplete and competing scientific explanations for the causes of change and low confidence in estimates of internal variability.” “Arctic temperature anomalies in the 1930s were apparently as large as those in the 1990s and 2000s. There is still considerable discussion of the ultimate causes of the warm temperature anomalies that occurred in the Arctic in the 1920s and 1930s.”
16 https://www.ipcc.ch/pdf/assessment-report/ar5/wg1/WG1AR5_SPM_FINAL.pdf 17 http://psc.apl.washington.edu/wordpress/wpcontent/uploads/schweiger/ice_volume/BPIOMASIceVolumeAnomalyCurrentV2.1.png 18 https://www.ipcc.ch/pdf/assessment-report/ar5/wg1/WG1AR5_Chapter10_FINAL.pdf

8
The IPCC AR5 states that the increase in Antarctic sea ice is not understood and is not simulated correctly by climate models. Further, Arctic surface temperature anomalies in the 1930’s were nearly as large as the recent temperature anomalies, and hence the IPCC uses the weak phrase ‘contributed to’ in reference to anthropogenic influences on Arctic sea ice. A recent paper by Swart et al.19 emphasized that internal climate variability can mask or enhance human-induced sea-ice loss on timescales ranging from years to decades or even a century. A recent paper by Zhang20 clarifies the natural fluctuations that influence Arctic sea ice loss – heat transported by the Atlantic and Pacific, and wind patterns over the Arctic that drive sea ice out from the central Arctic, where it melts in the North Atlantic. In particular, the recent cooling in the high latitudes of the North Atlantic is associated with the current recovery of the sea ice in the Atlantic sector. Wyatt and Curry (2014) interpret the multi-decadal natural variability component of the Arctic sea ice in context of a ‘stadium wave’.21 The stadium wave is a hypothesized low-frequency climate signal propagating across the Northern Hemisphere, whose tempo is set by the multidecadal component of Atlantic Ocean variability – the Atlantic Multidecadal Oscillation. Sea ice in the Eurasian Arctic shelf region, where sea ice is uniquely exposed to open ocean in the Northern Hemisphere, bridges communication between the ocean and atmosphere that sustains propagation of the hemispheric signal. Ocean-ice-atmosphere coupling spawns a sequence of positive and negative feedbacks that convey persistence and quasi-oscillatory features to the signal. Further stabilizing the system are anomalies of co-varying Pacific-centered atmospheric circulations. The stadium wave hypothesis suggests that a transition to recovery of the natural variability component of the sea ice extent has begun in the European Arctic sector, and that the recovery will reach its maximum extent circa 2040. Clearly, there is a lot going on with respect to variability in Arctic and Antarctic sea ice that cannot be explained solely by warming from human-caused greenhouse gases. Climate models do not simulate correctly the ocean heat transport and its variations. Scientists do not agree on the explanation for the increasing Antarctic sea ice extent, and the key issue as to whether human-caused warming is the dominant cause of the recent Arctic sea ice loss remains unresolved. Nevertheless, the IPCC AR5 concluded:
• “[I]t is very likely that the Arctic sea ice cover will continue to shrink and thin all year round during the 21st century. It is also likely that the Arctic Ocean will become nearly ice-free in September before the middle of the century (medium confidence).”
More convincing arguments regarding causes of recent sea ice variations in both hemispheres are required before placing any confidence in projections of future changes in Arctic sea ice cover.
19 Swart et al 2015 Influence of internal variability on Arctic sea-ice trends, Nature climate Change, 5, Pages: 86–89 DOI:
doi:10.1038/nclimate2483 20 Zhang, R. 2015. Mechanisms for low-frequency variability of summer Arctic sea ice extent, Proceedings of the National Academy
of Sciences, doi:10.1073/pnas.1422296112 21 Wyatt, MG and JA Curry, 2013: Role for Eurasian Arctic shelf sea ice in a secularly varying hemispheric climate signal
during the 20th century. Climate Dynamics, http://curryja.files.wordpress.com/2013/10/stadium-wave1.pdf

9
Sea level rise The IPCC AR5 SPM22 makes the following statements regarding global sea level rise:
“Over the period 1901–2010, global mean sea level rose by 0.19 [0.17 to 0.21] m” [about 7-8 inches] “It is very likely that the mean rate of global averaged sea level rise was 1.7 [1.5 to 1.9] mm yr–1 between 1901 and 2010 . . . and 3.2 [2.8 to 3.6] mm yr–1 between 1993 and 2010. It is likely that similarly high rates occurred between 1920 and 1950.”
The rate of global mean sea level rise as portrayed in the IPCC AR5 is shown in Figure 6 below.
Figure 6. 18-year trends of global mean sea level rise estimated at 1-year intervals. The time is the start date of the 18-year period, and the shading represents the 90% confidence. The estimate from satellite altimetry is also given, with the 90% confidence given as an error bar. [AR5 WGI Figure 3.14] 23
The IPCC AR5 then concludes:
“It is very likely that there is a substantial contribution from anthropogenic forcings to the global mean sea level rise since the 1970s.”
Global sea level has been rising for the past several thousand years. The key issue is whether the rate of sea level rise is accelerating owing to anthropogenic global warming. It is seen that the rate of rise during 1920-1950 was comparable to, if not larger than, the value in recent years (a period contributing less than 10% of the human caused CO2 emissions since 1900). Hence the data does not seem to support the IPCC’s conclusion of a substantial contribution from anthropogenic forcings to the global mean sea level rise since the 1970s.
22 https://www.ipcc.ch/pdf/assessment-report/ar5/wg1/WG1AR5_SPM_FINAL.pdf 23 https://www.ipcc.ch/publications_and_data/ar4/wg1/en/spm.html

10
The IPCC AR5 then makes the following projections regarding sea level rise:
“Under all RCP scenarios the rate of sea level rise will very likely exceed that observed during 1971–2010 due to increased ocean warming and increased loss of mass from glaciers and ice sheets.”
“For RCP8.5, the rise by the year 2100 is 0.52 to 0.98 m [20 to 38 inches], with a rate during 2081–2100 of 8 to16 mm/yr (medium confidence). These ranges are derived from CMIP5 climate projections in combination with process-based models and literature assessment of glacier and ice sheet contributions.”
So, for a warming since 1900 that is approaching 1 oC, we have been unable to identify an unambiguous signal of human-caused sea level rise that exceeds the signal from natural variability (as evidenced by the large rates of sea level rise from 1920 to 1950). The extreme emissions scenario (RCP8.5) projects a sea level increase of 20 to 38 inches by the end of the 21st century; for the more realistic emissions scenario RCP6.0, the projected sea level rise is 13 to 25 inches. These projections were obtained using the same climate models that are arguably running too hot in their temperature projections, perhaps by a factor of two. The largest concern about a potential catastrophic sea level rise is the possible collapse of the West Antarctic Ice Sheet (WAIS). The IPCC AR5 decided that there was insufficient evidence to make an assessment any more precise than the sea level rise contribution from WAIS “would not exceed several tenths of a metre” by the end of the 21st century. A recent paper in Nature24 predicts that WAIS instability will most likely contribute 10 cm sea level rise by the end of the 21st century but is extremely unlikely to contribute more than 30 cm. A recent paper25 published by NASA scientists found that overall mass gains of the Antarctic ice sheet exceed losses, and that the growing accumulation of snow over Antarctic is decreasing global sea level by 0.23 mm/yr. This finding is in contrast to the IPCC AR5 conclusion that Antarctica was adding 0.27 mm/yr to sea level rise. The issues surrounding the current and potential future contributions of Antarctica to sea level rise continue to be debated. The essential issue regarding sea level rise is that any dangers are local. Global warming (whether natural or anthropogenic) is only one factor that influences local sea level rise: other factors are geological sinking/rising, ground water withdrawal, and river and coastal engineering. Nearly all locales where sea level rise is regarded as dangerous have rates of sea level rise that far exceed the global rate of 3 mm/yr – U.S. examples26 are the Louisiana coast (9.03 mm/yr) and Chesapeake Bay (6.02 mm/yr), and Bangladesh sea level is rising at a rate of 10.7 mm/yr27. A recent study by New Zealand scientists28 found that 18 of 29 atoll islands in the tropical Pacific have actually grown over the past 60 years, in the presence of rising sea levels.
24 http://www.nature.com/articles/doi:10.1038/nature16147 25 http://www.ingentaconnect.com/content/igsoc/jog/pre-prints/content-ings_jog_15j071 26 http://tidesandcurrents.noaa.gov/sltrends/sltrends.html 27 http://www.sciencedirect.com/science/article/pii/S0921818113002191 28 http://www.crossref.org/iPage?doi=10.1130%2FG36555.1

11
Summary Anthropogenic climate change is a theory in which the basic mechanism is well understood, but whose potential magnitude is highly uncertain. What does the preceding analysis imply for IPCC’s ‘extremely likely’ attribution of anthropogenically caused warming since 1950?
1. After expecting a global mean surface temperature increase of 0.2 oC per decade in the early decades of the 21st century based on climate model simulations and statements in the 2007 IPCC AR4 Report29, the rate of warming since 1998 is only 0.065 oC per decade (HadCRUT4 data set) or 0.1 oC per decade (new NOAA data set).
2. There have been large magnitude variations in global/hemispheric climate on timescales of 30 years, which are the same duration as the late 20th century warming. The IPCC does not have convincing explanations for previous 30 year periods in the 20th century, notably the warming 1910-1945 and the grand hiatus 1945-1975.
3. There is a secular warming trend at least since 1800 (and possibly as long as 400 years), that cannot be explained by CO2, and is only partly explained by volcanic eruptions.
The combination of these three points substantially reduces the confidence that we should place in the IPCC’s attribution of warming since 1950 to human causes. With regards to the multidecadal variations, a recent paper by Tung and Zhou30 argue that a natural multidecadal oscillation of an average period of 70 years with significant amplitude of 0.3–0.4°C is superimposed on the secular warming trend, which accounts for 40% of the observed warming since the mid-20th century. Tung and Zhou identify this oscillation with the Atlantic Multidecadal Oscillation (AMO), although the stadium wave31 suggests a more complex multidecadal signal. The stadium wave provides a common explanation for both the mid 20th century warming hiatus (1945-1975) and the 21st century warming hiatus (since 1998). These oscillations are strongly reflected also in Arctic temperatures, Arctic sea ice extent and Greenland melting. What could be the cause of a 200 – 400 year period of secular warming? The obvious places to look are to the sun and the ocean. Ocean circulation patterns influence climate also on century to millennial time scales. Sun-climate connections are receiving renewed interest, as evidenced by the National Academies Workshop Report “The Effects of Solar Variability on Earth’s Climate”.32 Understanding and explaining the climate variability over the past 400 years, prior to 1950, has received far too little attention. Without this understanding, we should place little confidence in the IPCC’s explanations of warming since 1950 – it is too easy to get the ‘right’ answer for the wrong reasons. Whither the 21st century climate? The IPCC has made dire predictions that we can expect 4 oC or more of warming by the end of the 21st century if carbon dioxide emissions are not reduced. The climate models making these predictions are the same models that predicted too much warming in the early 21st century, and do not reproduce the warming from 1910-1945 or the mid 20th century grand hiatus. Further, the global climate models cannot predict future major volcanic eruptions or solar cycles, and do not adequately predict the long-term oscillations in the ocean. 29 https://www.ipcc.ch/publications_and_data/ar4/wg1/en/spm.html 30 Tung, KK and J Zhou, 2013: Using data to attribute episodes of warming and cooling in instrumental records. PNAS
http://www.pnas.org/content/early/2013/01/22/1212471110.abstract 31 Wyatt, MG and JA Curry 2014: Role for Eurasian Arctic shelf sea ice in a secularly varying hemispheric climate signal during
the 20th century. Climate Dynamics, 42, 2763-2782. http://judithcurry.com/2013/10/10/the-stadium-wave/ 32 http://www.nap.edu/read/13519/chapter/1#xi

12
Arguments for lower values of climate sensitivity to CO2 Human-caused warming depends not only on increases in greenhouse gases but also on how ‘sensitive’ the climate is to these increases. Climate sensitivity is defined as the global surface warming that occurs when the concentration of carbon dioxide in the atmosphere doubles. If climate sensitivity is high, then we can expect substantial warming in the coming century as emissions continue to increase. If climate sensitivity is low, then future warming will be substantially lower. The equilibrium climate sensitivity (ECS) is defined as the change in global mean surface temperature that is caused by a doubling of the atmospheric CO2 concentration, allowing sufficient time for the climate to equilibrate. Table 1 compares the values of ECS determined by: the IPCC AR4 (2007)33, the IPCC AR5 (2013)34, the CMIP5 climate models cited in the IPCC AR5 (2013)35, the observational analysis of Lewis and Curry (2014)36 and the update by Lewis (2015)37 with lower aerosol forcing, and the US IWG38 (used to determine the social cost of carbon). Table 1: Values of equilibrium climate sensitivity (ECS) (oC) Best Estimate 5th pctile 95th pctile
IPCC AR4 (2007) 3.0 1.5 - IPCC AR5 (2013) - 1.0 6.0* CMIP5 models (2013) 3.22 2.1 4.7 Lewis & Curry (2014) 1.64 1.05 4.05 Lewis (2015) 1.45 1.05 2.2 US IWG 3.0 1.72 7.14
* 90th pctile There are marked differences between the values of ECS determined by the IPCC AR5 versus the AR4. The nominal lower bound (5th percentile) has dropped from 1.5 oC (AR4) to 1.0 oC (AR5). The AR5 finds values of ECS exceeding 6oC to be very unlikely (90th percentile), whereas the AR4 did not have sufficient confidence to identify an upper bound at this confidence level. It is also significant that the AR5 does not cite a ‘best estimate’, whereas the AR4 cites a best estimate of 3 oC. The stated reason for not citing a best estimate in the AR5 is the substantial discrepancy between observation-based estimates of ECS (lower), versus estimates from climate models (higher). Lewis and Curry (2014) found values of ECS approximately half that determined from the CMIP5 climate models. Using an observation-based energy balance approach, our calculations used the same data (including uncertainties) for changes in greenhouse gases, aerosols and other drivers of climate change given by the IPCC AR5. Our range for ECS is much narrower, with far lower upper limits, than reported by the IPCC AR5. Recent papers by Skeie et al39 and Masters40 also find comparably low values of ECS.
33 https://www.ipcc.ch/publications_and_data/ar4/wg1/en/spm.html 34 https://www.ipcc.ch/pdf/assessment-report/ar5/wg1/WG1AR5_SPM_FINAL.pdf 35 http://www.climatechange2013.org/images/uploads/WGIAR5_WGI-12Doc2b_FinalDraft_Chapter09.pdf 36 Lewis, N. and J.A. Curry, (2014) The implications for climate sensitivity of AR5 forcing and heat uptake. Climate Dynamics
http://link.springer.com/article/10.1007%2Fs00382-014-2342-y#page-1 37 http://judithcurry.com/2015/03/19/implications-of-lower-aerosol-forcing-for-climate-sensitivity/ 38 https://www.whitehouse.gov/sites/default/files/omb/inforeg/scc-tsd-final-july-2015.pdf 39 Skeie, R. B., T. Berntsen, M. Aldrin, M. Holden, and G. Myhre, 2014. A lower and more constrained estimate of climate
sensitivity using updated observations and detailed radiative forcing time series. Earth System Dynamics, 5, 139–175. 40 Masters, T., 2013. Observational estimates of climate sensitivity from changes in the rate of ocean heat uptake and comparison
to CMIP5 models. Climate Dynamics, doi:101007/s00382-013-1770-4

13
The latest research suggests even lower values of the equilibrium climate sensitivity. The greatest uncertainty in ECS estimates is accounting for the effects of small aerosol particles in the atmosphere, which have a cooling effect on the climate (partially counteracting the greenhouse warming). A new paper by Stevens41 constrains the impact of aerosols on climate to be significantly smaller than assumed in the IPCC AR5. Nicholas Lewis has re-run the calculations used in Lewis and Curry (2014) using aerosol impact estimates in line with Stevens’ paper.42 Most significantly, the upper bound (95th percentile) is lowered to 2.2 oC (Table 1). At the recent international Workshop on Earth’s Climate Sensitivity,43 concerns were raised about the upper end of the Lewis and Curry sensitivity being too low, owing to uncertainties in ocean heat uptake. Many of the climate model simulations used for the AR5 (CMIP5) are using values of aerosol forcing that are now known to be far too high. Climate model simulations that are re-assessed and re-calibrated to account for smaller values of aerosol forcing can be used to clarify the upper bound of ECS. In a presentation at the Workshop, IPCC lead author Bjorn Stevens44 argued for an upper bound to ECS of 3.5 oC based on analyses of climate models. Research continues to assess the methods used to estimate climate sensitivity. However, the reduced estimates of aerosol cooling lead inescapably to reductions in the estimated upper bound of climate sensitivity. The discrepancy between observational and climate model-based estimates of climate sensitivity is substantial and of significant importance to policymakers – equilibrium climate sensitivity, and the level of uncertainty in its value, is a key input into the economic models that drive cost-benefit analyses and estimates of the social cost of carbon. In spite of the IPCC AR5 assessment (where a ‘best value’ was not given) and this recent research on climate sensitivity, economists calculating the social cost of carbon and the impacts of emissions reductions on climate continue to use the ‘best value’ of ECS = 3 oC determined by the 2007 IPCC AR4 Report. A particularly egregious example of this is the US Social Cost of Carbon,45 prepared by the InterAgency Working Group (IWG). In May 2013, the IWG produced an updated social cost of carbon model. However, the IWG did not update the equilibrium climate sensitivity (ECS) employed in the models, and this decision was reaffirmed by the IWG in July 2015. The values of ECS used by the US IWG (Table 1) have lower and upper bounds that are indefensible in context of the IPCC values and most particularly in light of the recent research. The 95th percentile value is of particular importance, since the tail values of ECS drive the social cost of carbon. In summary, there is a great deal of uncertainty in the values of climate sensitivity, and this is an active area of research. There is growing evidence in the published literature and recent assessments and workshops that a sensitivity of 1.0 oC is the appropriate lower bound to use in a 5 to 95 percentile range, and there is decreasing support for values of equilibrium climate sensitivity above 3.5oC. Not only are the US IWG sensitivity values much higher than values suggested by the latest research, but the US IWG values are indefensible even in context of both the IPCC AR4 and AR5 reports. The end result is that misleading values of the social cost of carbon being used to drive U.S. climate and energy policy. 41 Stevens, B (2015) Rethinking the lower bound on aerosol forcing. J. Climate,
http://journals.ametsoc.org/doi/abs/10.1175/JCLI-D-14-00656.1 42 Lewis, N, (2015) Implications of lower aerosol forcing for climate sensitivity. http://judithcurry.com/2015/03/19/implications-
of-lower-aerosol-forcing-for-climate-sensitivity/ 43 http://www.mpimet.mpg.de/en/science/the-atmosphere-in-the-earth-system/ringberg-workshop/ringberg-2014.html 44 http://www.mpimet.mpg.de/fileadmin/atmosphaere/WCRP_Grand_Challenge_Workshop/Ringberg_2015/Talks/Stephens_24032015.pdf 45 https://www.whitehouse.gov/sites/default/files/omb/inforeg/scc-tsd-final-july-2015.pdf

14
Climate change in the 21st century Chapter 11 of the IPCC AR5 Report46 focused on near term climate change, through 2035. Figure 7 compares climate model projections with recent observations of global surface temperature anomalies.
Figure 7. Comparison of CMIP5 climate model simulations of global surface temperature anomalies with observations through 2014 (HadCRUT4). Updated from Figure 11.25 of the IPCC AR5, to include observations through 2014. http://www.climate-lab-book.ac.uk/comparing-cmip5-observations/
The observed global temperatures for the past decade are at the bottom bound of the 5-95% envelope of the CMIP5 climate model simulations. Overall, the trend in the climate model simulations is substantially larger than the observed trend over the past 15 years. Regarding projections for the period 2015-2035, the 5-95% range for the trend of the CMIP5 climate model simulations is 0.11°C–0.41 °C per decade. The IPCC then cites ‘expert judgment’ as the rationale for lowering the projections (indicated by the red hatching in Figure 7):
“However, the implied rates of warming over the period from 1986–2005 to 2016–2035 are lower as a result of the hiatus: 0.10°C–0.23°C per decade, suggesting the AR4 assessment was near the upper end of current expectations for this specific time interval.”
This lowering of the projections relative to the results from the raw CMIP5 model simulations was done based on expert judgment that some models are too sensitive to anthropogenic forcing. Multi-decadal ocean oscillations play a dominant role in determining climate on decadal timescales. The Atlantic Multidecadal Oscillation (AMO) is currently in its warm phase, with a shift to the cool phase expected to occur sometime in the 2020’s.47 Climate models, even when initialized with ocean data, have a difficult time simulating the amplitude and phasing of the ocean oscillations. In a paper that I coauthored, we found that most of CMIP5 climate models, when initialized with ocean data, show some skill out to 10 years in simulating the AMO.48 Tung and Zhou49 argue that not taking the AMO into account in predictions of future warming under various forcing scenarios may run the risk of over-estimating the warming for the next two to three decades, when the AMO is likely in its cool phase. 46 https://www.ipcc.ch/pdf/assessment-report/ar5/wg1/WG1AR5_Chapter11_FINAL.pdf 47 http://www.wyattonearth.net/images/9Wyatt_Curry_2013_author-version_manuscript.pdf 48 http://webster.eas.gatech.edu/Papers/Kim_et_al.2012_GRL.pdf 49 Tung, KK and J Zhou, 2013: Using data to attribute episodes of warming and cooling in instrumental records. PNAS
http://www.pnas.org/content/early/2013/01/22/1212471110.abstract

15
Projections for the year 2100 Climate model projections of global temperature change at the end of the 21st century are driving international negotiations on CO2 emissions reductions, under the auspices of the UN Framework Convention on Climate Change (UNFCCC).50 Figure 8 shows climate model projections of 21st century warming. RCP8.5 reflects an extreme scenario of increasing emissions of greenhouse gases, whereas RCP2.6 is a scenario where emissions peak around 2015 and are rapidly reduced thereafter.
Figure 8: Figure SPM.7 of the IPCC AR5 WG1. CMIP5 multi-model simulated time series from 1950 to 2100 for change in global annual mean surface temperature relative to 1986–2005. Time series of projections and a measure of uncertainty (shading) are shown for scenarios RCP2.6 (blue) and RCP8.5 (red). Black (grey shading) is the modelled historical evolution using historical reconstructed forcings. The mean and associated uncertainties averaged over 2081−2100 are given for all RCP scenarios as colored vertical bars.
Under the RCP8.5 scenario, the CMIP5 climate models project continued warming through the 21st century that is expected to surpass the ‘dangerous’ threshold of 2°C warming as early as 2040. It is important to note that the CMIP5 simulations only consider scenarios of future greenhouse gas emissions – they do not include consideration of scenarios of future volcanic eruptions, solar variability or long-term oscillations in the ocean. Russian scientists51 argue that we can expect a Grand Solar Minima (contributing to cooling) to peak mid 21st century. While the near-term temperature projections were lowered relative to the CMIP5 simulations (Figure 7), the IPCC AR5 SPM52 states with regards to extended-range warming:
“The likely ranges for 2046−2065 do not take into account the possible influence of factors that lead to the assessed range for near-term (2016−2035) global mean surface temperature change that is lower than the 5−95% model range, because the influence of these factors on longer term projections has not been quantified due to insufficient scientific understanding.”
50 http://unfccc.int/2860.php 51 Abdussamatov, H 2013: Current long-term negative energy balance of the earth leads to the new little ice age. Journal of Geology and
Geophysics http://omicsgroup.org/journals/grand-minimum-of-the-total-solar-irradiance-leads-to-the-little-ice-age-2329-6755.1000113.pdf 52 https://www.ipcc.ch/pdf/assessment-report/ar5/wg1/WG1AR5_SPM_FINAL.pdf, Table SPM.2

16
There is a troubling internal inconsistency in the IPCC AR5 WG1 Report: the AR5 assesses substantial uncertainty in climate sensitivity and substantially lowered their projections for 2016-2035 relative to the climate model projections, versus the projections out to 2100 that use climate models that are clearly running too hot. Even more troubling is that the IPCC WG3 report – Mitigation of Climate Change – conducted its entire analysis assuming a ‘best estimate’ of equilibrium climate sensitivity to be 3.0 oC. The IPCC AR5 declined to select a ‘best estimate’ for equilibrium climate sensitivity, owing to discrepancies between climate model estimates and observational estimates (that are about half the magnitude of the climate model estimates). Hence the CMIP5 models produce warming that is nominally twice as large as the lower values of climate sensitivity would produce. No account is made in these projections of 21st century climate change for the substantial uncertainty in climate sensitivity that is acknowledged by the IPCC. Impact of reductions in CO2 emissions The current negotiations in Paris under the auspices of the UNFCCC COP21 are aimed at reducing emissions so as to avoid ‘dangerous’ human interference with climate change.53 The definition of ‘dangerous’ has been rather arbitrarily set at 2oC warming since pre-industrial times.54 The world’s nations have recently submitted to the UNFCCC their Intended Nationally Determined Contributions (INDCs).55 Economists are beginning to assess the impact that these INDCs will have on the climate by the end of the 21st century. Danish economist Bjorn Lomborg recently published a paper56 that assesses the impact of the climate policies implemented by 2030, and assuming these policies are extended out to 2100. Lomborg concluded that an optimistic estimate (assuming the targets are actually met) is that these emissions reductions would prevent 0.17 oC of warming by the end of the 21st century. Lomborg’s estimate is consistent with a statement in the “MIT Energy and Climate Outlook 2015”57 that projected about 0.2 oC less warming by the end of the 21st century. The second, longer-term reduction commitments (e.g. 80% reduction in both U.S. and EU emissions by 2050) were not included in Lomborg’s analysis, because he regarded promises of what will happen in 2050 to be not as much actual policies but political hand waving. The International Energy Agency has issued a report58 that estimated that full implementation of the path set by the global INDCs would be consistent with a global average temperature increase of 2.7oC by 2100. Other estimates59 range higher, up 3.5 oC, although none of these estimates are documented in detail or published in a refereed journal. The bottom line is that all of these estimates from climate models are far from achieving the desired objective of keeping the warming below 2 oC. All of these estimates are being conducted using the MAGICC climate model,60 which allows specification of the value of equilibrium climate sensitivity. MAGICC’s default value of ECS is 3 oC, and this number has become so ingrained that you see many analyses that do not even cite the value of ECS that was used.
53 https://unfccc.int/resource/docs/convkp/conveng.pdf 54 http://www.wbgu.de/en/special-reports/sr-1995-co2-reduction/ 55 http://unfccc.int/focus/indc_portal/items/8766.php 56 Lomborg, B, 2015: Impact of Current Climate Proposals, Global Policy http://onlinelibrary.wiley.com/doi/10.1111/1758-5899.12295/full 57 http://globalchange.mit.edu/research/publications/other/special/2015Outlook 58 http://www.iea.org/media/news/WEO_INDC_Paper_Final_WEB.PDF 59 http://www.climatescoreboard.com 60 http://www.cgd.ucar.edu/cas/wigley/magicc/

17
Of particular note is a recent paper by Japanese economists Yoichi Kaya, Mitsutune Yamaguchi and Keigo Akimoto entitled “The uncertainty of climate sensitivity and its implications for the Paris negotiations”.61 The key conclusion from their paper:
“The outcome of our model shows global total emissions under major countries’ INDCs in 2030 will not be on track to attain the 2 C target if climate sensitivity is 3 C. On the other hand, if climate sensitivity is 2.5 C, and if we allow a temporal overshoot of 580 ppmCO2-eq, that the 2 C target is still within reach”.
If ECS is even lower, below 2 oC, then it is even easier to stay below the 2 oC ‘danger’ level. Further, for lower values of ECS, the planned emissions reductions will have an even smaller impact on temperatures in 2100. Policy makers meeting in Paris seem not to realize that there is large uncertainty in the values of equilibrium climate sensitivity, and that there is growing evidence in support of lower values. Summary The IPCC’s projections of 21st century climate change explicitly assume that CO2 is the control knob on global climate. Climate model projections of the 21st century climate are not convincing because of:
• Failure to predict the early 21st century hiatus in surface warming • Inability to simulate the patterns and timing of multidecadal ocean oscillations • Lack of account for future solar variations and solar indirect effects on climate • Apparent oversensitivity to increases in greenhouse gases
There is growing evidence that climate models are running too hot and that climate sensitivity to CO2 is on the lower end of the range provided by the IPCC – this is acknowledged in the IPCC AR5. Nevertheless, these lower values of climate sensitivity are not accounted for in IPCC’s projections of temperature at the end of the 21st century or in estimates of the impact on temperatures of reducing CO2 emissions. While there is increasing evidence that the threat from human caused warming in the 21st century is overstated, the level of uncertainty is such that the possibly of dangerous human caused climate change remains. However, if the threat is not overstated by the IPCC, there are major shortfalls in solutions proposed by the UN, whereby proposed emissions reductions, even if actually successfully implemented, are insufficient to prevent what they regard as dangerous climate change. The broken social contract between climate science and society Working through Congress, the public has been generous with its funding for climate and the related sciences. However, recent stresses have frayed the fabric of the social contract between climate scientists and society.62 Unfortunately, many climate scientists have responded by resorting to advocacy, both for increasing funding levels and for specific policies related to energy and climate. Even worse, too many climate scientists have abandoned any pretense at nonpartisanship and objectivity. Scientists advocating for CO2 emissions reductions is becoming the default, expected position for climate scientists; an example is this Huffington Post editorial “Curry Advocates Against Action on Climate 61 Kaya et al. 2015: The uncertainty of climate sensitivity and its implication for the Paris negotiations. Sustainability Science
http://link.springer.com/article/10.1007/s11625-015-0339-z?wt_mc=internal.event.1.SEM.ArticleAuthorOnlineFirst 62 Hooke, W. 2015: Reaffirming the social contract between science and society. https://eos.org/opinions/reaffirming-the-social-
contract-between-science-and-society

18
Change”63 that was signed by five climate scientists. This op-ed was a response to my arguments for values of climate sensitivity being on the low end of the IPCC spectrum. I am neither advocating for or against ‘action’ in terms of reducing CO2 emissions. My writings on the policy response to climate change64 address frameworks for decision making under deep uncertainty, including robust decision making and the concepts of resilience and anti-fragility. In their efforts to promote their ‘cause,’ the scientific establishment behind the global warming issue has been drawn into the trap of seriously understating the uncertainties associated with the climate problem. This behavior risks destroying science’s reputation for honesty and objectivity – without this objectivity and honesty, scientists become regarded as merely another lobbyist group. The biases of individuals are not an impediment to scientific progress if scholarly institutions work to counteract the errors and flaws of scientific research. A fair process of peer review and vigorous post-publication peer debate will quickly identify the most obvious errors and biases. Researchers having different perspectives (including their values and political identities) will conduct their own research and obtain opposing results, and the field will gradually sort out the truth. This system works unless the institutions that support science – the professional societies that publish journals, organize conference and confer honors – are themselves biased. Nearly all of the relevant professional societies have issued policy statements about climate change, including statements such as ‘Human-Induced Climate Change Requires Urgent Action’65 and ‘call to support actions that will reduce the emissions.’66 Even more egregious is overt advocacy by journal editors, notably Marcia McNutt (editor of Science), who recently published this statement in an opinion piece in Science67: “The time for debate has ended. Action is urgently needed.” Such official statements from the professional societies provide journal editors with a license to reject papers that challenge the consensus. An even more insidious problem is when there is not a critical mass of scientists who think differently or who shrink from speaking up because they expect ostracism in response. Minority perspectives on climate science are effectively being squeezed out of the universities, and dissenting individuals choose to join the private sector, retire, join think tanks, or switch research topics. Climate science that dissents from the consensus is increasingly being relegated to retired professors and self-supported individuals from other fields, who are asking important questions that aren’t ‘relevant’ to government research funding priorities. While concerns about the behaviors and motives of scientists and the institutions that support science are well founded, the other side of the social contract is at least equally problematical. President Obama’s administration is using climate science to support his political agenda, and is actively discouraging disagreement through consensus enforcement, e.g. “Call Out The Climate Deniers.”68 So under the current administration, the social contract for climate science seems to be: support the consensus and promote alarmism, and you will receive plenty of research funding. The potential for federal funding to bias science is discussed in this recent report.69 From my perspective, here is how research funding motivates what is going on. ‘Success’ to individual researchers, particularly
63 http://www.huffingtonpost.com/michael-e-mann/judith-curry-climate-change_b_6000636.html 64 https://curryja.files.wordpress.com/2015/04/house-science-testimony-apr-15-final.pdf 65 http://sciencepolicy.agu.org/files/2013/07/AGU-Climate-Change-Position-Statement_August-2013.pdf 66 http://www.aps.org/policy/statements/15_3.cfm 67 http://www.sciencemag.org/content/349/6243/7.full 68 https://www.barackobama.com/climate-change-deniers/#/ 69 http://object.cato.org/sites/cato.org/files/pubs/pdf/working-paper-29.pdf

19
at the large state universities, is driven by research dollars – big lab spaces, high salaries, institutional prestige, and career advancement. At the Program Manager level within a funding agency, ‘success’ is reflected in growing the size of their program (e.g. more funding) and having some high profile results (e.g. press releases). At higher levels, Divisional administrators are competing for budget dollars against the other Divisions; tying their research to a national policy priority helps in this competition. At the agency level, ‘success’ is reflected in growing, or at least preserving, the agency’s budget. Aligning yourself, your program, your agency with the current political imperatives is a key to ‘success’. It is very difficult to obtain federal research funding for dissenting science. Difficulty in the peer review process is only part of the problem. One problem is reflected in an email70 I recently received from a scientist employed at NASA:
“I was at a small meeting of NASA-affiliated scientists and was told by our top manager that he was told by his NASA boss that we should not try to publish papers contrary to the current global warming claims, because he (the NASA boss) would then have a headache countering the “undesirable” publicity”.
I hesitate somewhat to call out the NASA leadership here, since I think the bigger problems are with the NOAA leadership. The biggest problem, however, is that the call for proposals from the federal funding agencies (notably NASA and NOAA) make an implicit assumption of the dominance of human caused global warming in the topics for which they are requesting research proposals. Something is clearly wrong with the current contract between climate scientists and society that is biasing the science and breeding scientists who are advocates, partisans and alarmist. And the taxpayer foots the bill. How can we press the ‘reset button’ on all this? First, we need to recognize that the politically driven push to manufacture a premature consensus on human caused climate change is biasing climate research, and in particular is resulting in the relative neglect of research on natural climate variability. Until we have a better understanding and predictive capability of natural climate variability, we don’t have a strong basis for predicting the climate in the decades or century to come. Second, we need to break the ‘knowledge monopoly’71 in climate science – the IPCC. As a result of this knowledge monopoly, there is insufficient intellectual and political diversity in assessments about climate change. To break this monopoly, we need to identify new frameworks for encouraging, publishing and publicizing independent ideas and assessments. And finally, we need to find ways to fund a broader spectrum of research that challenges the politically preferred outcomes.
70 http://judithcurry.com/2015/10/12/conflicts-of-interest-in-climate-science-part-ii/ 71 https://www.esri.ie/publications/regulating-knowledge-monopolies-the-case-of-the-ipcc/

20
Short Biography Judith Curry Professor, School of Earth and Atmospheric Sciences Georgia Institute of Technology Atlanta, GA 30332-0349 [email protected] Dr. Judith Curry is Professor and former Chair of the School of Earth and Atmospheric Sciences at the Georgia Institute of Technology and President of Climate Forecast Applications Network (CFAN). Dr. Curry received a Ph.D. in atmospheric science from the University of Chicago in 1982. Prior to joining the faculty at Georgia Tech, she held faculty positions at the University of Colorado, Penn State University and Purdue University. Dr. Curry’s research interests span a variety of topics in climate; current interests include climate dynamics of the Arctic; climate dynamics of extreme weather events; cloud microphysics; and reasoning about climate uncertainty. She is a prominent public spokesperson on issues associated with the integrity of climate science, and is proprietor the weblog Climate Etc. judithcurry.com. Dr. Curry has recently served on the NASA Advisory Council Earth Science Subcommittee, the DOE Biological and Environmental Research Advisory Committee, the National Academies Climate Research Committee and the Space Studies Board, and the NOAA Climate Working Group. Dr. Curry is a Fellow of the American Meteorological Society, the American Association for the Advancement of Science, and the American Geophysical Union. . For more information:
http://curry.eas.gatech.edu/ http://www.cfanclimate.com/ http://judithcurry.com/about/