STATEMENT TO THE ENVIRONMENT AND … & Public Works 1 David R. Legates, 3 June 2014 STATEMENT TO THE...
25
Environment & Public Works 1 David R. Legates, 3 June 2014 STATEMENT TO THE ENVIRONMENT AND PUBLIC WORKS COMMITTEE OF THE UNITED STATES SENATE David R. Legates, Ph.D., C.C.M. University of Delaware 3 June 2014 I am a Professor of Climatology at the University of Delaware and I served as the Delaware State Climatologist from 2005 to 2011. I also am an adjunct faculty member in the Department of Agricultural Economics & Statistics and the Physical Ocean Science and Engineering Program. I received a B.A. in Mathematics and Geography, a M.S. in Geography, and a Ph.D. in Climatology, all from the University of Delaware. I served on the faculty of the University of Oklahoma and Louisiana State University before returning to the University of Delaware in 1999. I was part of the US delegation that negotiated a protocol for the first climate data exchange program with the Soviet Union in 1990. I am recognized as a Certified Consulting Meteorologist by the American Meteorological Society and was the recipient of the 2002 Boeing Autometric Award in Image Analysis and Interpretation by the American Society of Photogrammetry and Remote Sensing. I would like to thank the Chair and the Committee for the privilege to offer my views and my thirty years of experience on climate change from the perspective of a climatologist. My expertise lies in statistical methods in climatology, particularly as it relates to the hydrologic cycle – precipitation and soil moisture. For my dissertation, I developed the first digital and gridded global precipitation and air temperature dataset that specifically incorporates biases arising from the precipitation gage measurement process. This database is still used today in climatology as a standard against which climate model-derived fields and regional assessments are compared. I also have published several important articles that discuss the impact of precipitation variability on soil moisture in regional and global studies. In the following discussion, I will address the potential impact of climate change on agriculture and relay some of my pressing concerns that are related to the treatment of climate scientists who do not agree with the anthropogenic global warming disaster scenarios.
Transcript of STATEMENT TO THE ENVIRONMENT AND … & Public Works 1 David R. Legates, 3 June 2014 STATEMENT TO THE...
Environment & Public Works 1 David R. Legates, 3 June 2014
STATEMENT TO THE ENVIRONMENT AND PUBLIC WORKS COMMITTEE
OF THE UNITED STATES SENATE
David R. Legates, Ph.D., C.C.M.
University of Delaware
3 June 2014
I am a Professor of Climatology at the University of Delaware and I served as the Delaware State
Climatologist from 2005 to 2011. I also am an adjunct faculty member in the Department of
Agricultural Economics & Statistics and the Physical Ocean Science and Engineering Program.
I received a B.A. in Mathematics and Geography, a M.S. in Geography, and a Ph.D. in
Climatology, all from the University of Delaware. I served on the faculty of the University of
Oklahoma and Louisiana State University before returning to the University of Delaware in
1999. I was part of the US delegation that negotiated a protocol for the first climate data
exchange program with the Soviet Union in 1990. I am recognized as a Certified Consulting
Meteorologist by the American Meteorological Society and was the recipient of the 2002 Boeing
Autometric Award in Image Analysis and Interpretation by the American Society of
Photogrammetry and Remote Sensing.
I would like to thank the Chair and the Committee for the privilege to offer my views and my
thirty years of experience on climate change from the perspective of a climatologist. My
expertise lies in statistical methods in climatology, particularly as it relates to the hydrologic
cycle – precipitation and soil moisture. For my dissertation, I developed the first digital and
gridded global precipitation and air temperature dataset that specifically incorporates biases
arising from the precipitation gage measurement process. This database is still used today in
climatology as a standard against which climate model-derived fields and regional assessments
are compared. I also have published several important articles that discuss the impact of
precipitation variability on soil moisture in regional and global studies. In the following
discussion, I will address the potential impact of climate change on agriculture and relay some of
my pressing concerns that are related to the treatment of climate scientists who do not agree with
the anthropogenic global warming disaster scenarios.
Environment & Public Works 2 David R. Legates, 3 June 2014
1. Global Warming and Agricultural Impacts
One of the important questions raised by the response of increasing atmospheric carbon dioxide
concentrations is the possible impacts on agriculture, aquaculture, and commercial/recreational
fishing. Considering that CO2 is food for plants and animals, this is seen as a positive and any
potential negative effects are minimal. But if global surface air temperatures do rise for any
reason, this will undoubtedly increase the length of the growing season which, in turn, will
enhance the amount and diversity of crops that can be grown. Moreover, it will allow for more
areas of the planet to be farmed, primarily in the Northern Hemisphere, thereby increasing crop
productivity. Billions of acres of land in northern Canada and Russia could become cultivable.
The limiting factor, however, is the moisture availability to plants as agriculture in much of the
world is restricted by water availability both from precipitation and surface/groundwater
reserves.
A discussion of the possible results of soil moisture availability in a warmer world depends on a
complicated interaction of two factors – changes in the precipitation climatology and increases in
evapotranspiration (the combined effect of soil evaporation and plant transpiration). The impacts
of these two factors are opposite in sign; precipitation, when it occurs, is likely to increase but
the potential for evapotranspiration also is likely to increase, both due to the increase in the
saturation vapor pressure as a function of increasing air temperature. The question then is which
dominates – does the increase in precipitation compensate for the increase in the
evapotranspiration demand or does the increase in air temperature reduce soil moisture reserves
such that droughts will become more likely? Complicating this discussion is the fact that
atmospheric circulation changes may affect the patterns of precipitation so that some areas may
become more drought-prone while others may become less so. Pinpointing the exact
geographical areas for which drought/increased rainfall are likely to occur lie far beyond
our technology for the foreseeable future.
To answer the questions, climatologists employ two methods. In one, historical patterns and
trends over the last century are extrapolated to provide a forecast of what might happen in the
future. From the demise of the Little Ice Age – a relatively cold period between about 1300 and
1850 A.D. (Soon et al. 2003) that is concomitant with decreased solar output – to the late 1990s,
Environment & Public Works 3 David R. Legates, 3 June 2014
air temperatures increased about 0.6°C (~1.1°F). We can use this rising trend in air temperature
to make prognostications as to what we might expect from a warming world in the future. The
second method involves climate models – mathematical/statistical representations of the climate
system. These models are used to simulate future climate scenarios from which patterns of
climate change are inferred. We will examine the results using both of these methods.
1.1 Historical Patterns and Trends in Drought
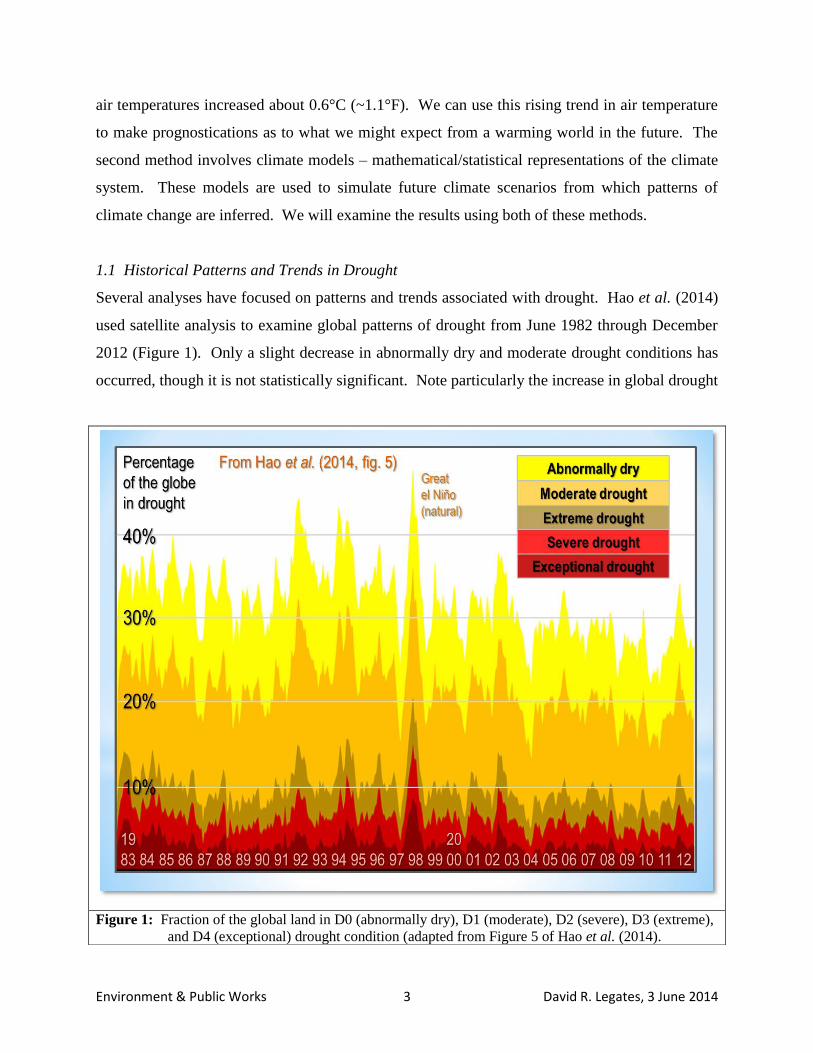
Several analyses have focused on patterns and trends associated with drought. Hao et al. (2014)
used satellite analysis to examine global patterns of drought from June 1982 through December
2012 (Figure 1). Only a slight decrease in abnormally dry and moderate drought conditions has
occurred, though it is not statistically significant. Note particularly the increase in global drought
Figure 1: Fraction of the global land in D0 (abnormally dry), D1 (moderate), D2 (severe), D3 (extreme),
and D4 (exceptional) drought condition (adapted from Figure 5 of Hao et al. (2014).
Environment & Public Works 4 David R. Legates, 3 June 2014
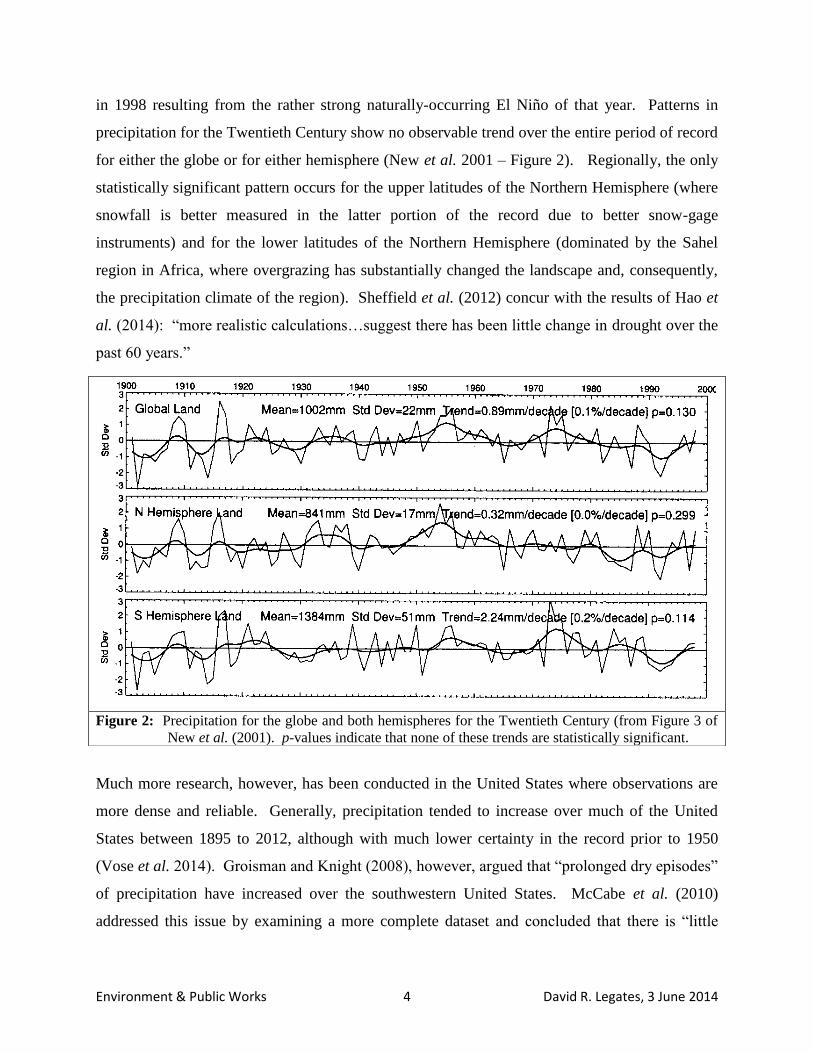
in 1998 resulting from the rather strong naturally-occurring El Niño of that year. Patterns in
precipitation for the Twentieth Century show no observable trend over the entire period of record
for either the globe or for either hemisphere (New et al. 2001 – Figure 2). Regionally, the only
statistically significant pattern occurs for the upper latitudes of the Northern Hemisphere (where
snowfall is better measured in the latter portion of the record due to better snow-gage
instruments) and for the lower latitudes of the Northern Hemisphere (dominated by the Sahel
region in Africa, where overgrazing has substantially changed the landscape and, consequently,
the precipitation climate of the region). Sheffield et al. (2012) concur with the results of Hao et
al. (2014): “more realistic calculations…suggest there has been little change in drought over the
past 60 years.”
Much more research, however, has been conducted in the United States where observations are
more dense and reliable. Generally, precipitation tended to increase over much of the United
States between 1895 to 2012, although with much lower certainty in the record prior to 1950
(Vose et al. 2014). Groisman and Knight (2008), however, argued that “prolonged dry episodes”
of precipitation have increased over the southwestern United States. McCabe et al. (2010)
addressed this issue by examining a more complete dataset and concluded that there is “little
Figure 2: Precipitation for the globe and both hemispheres for the Twentieth Century (from Figure 3 of
New et al. (2001). p-values indicate that none of these trends are statistically significant.
Environment & Public Works 5 David R. Legates, 3 June 2014
evidence of long-term positive trends in dry event length in the southwestern United States.” We
concluded that El Niño and La Niña events and the Pacific Decadal Oscillation are largely
responsible for the variability in trends in dry event length in the southwestern United States.
Station network limitations and the treatment of missing data adversely affected the results of
Groisman and Knight (2008).
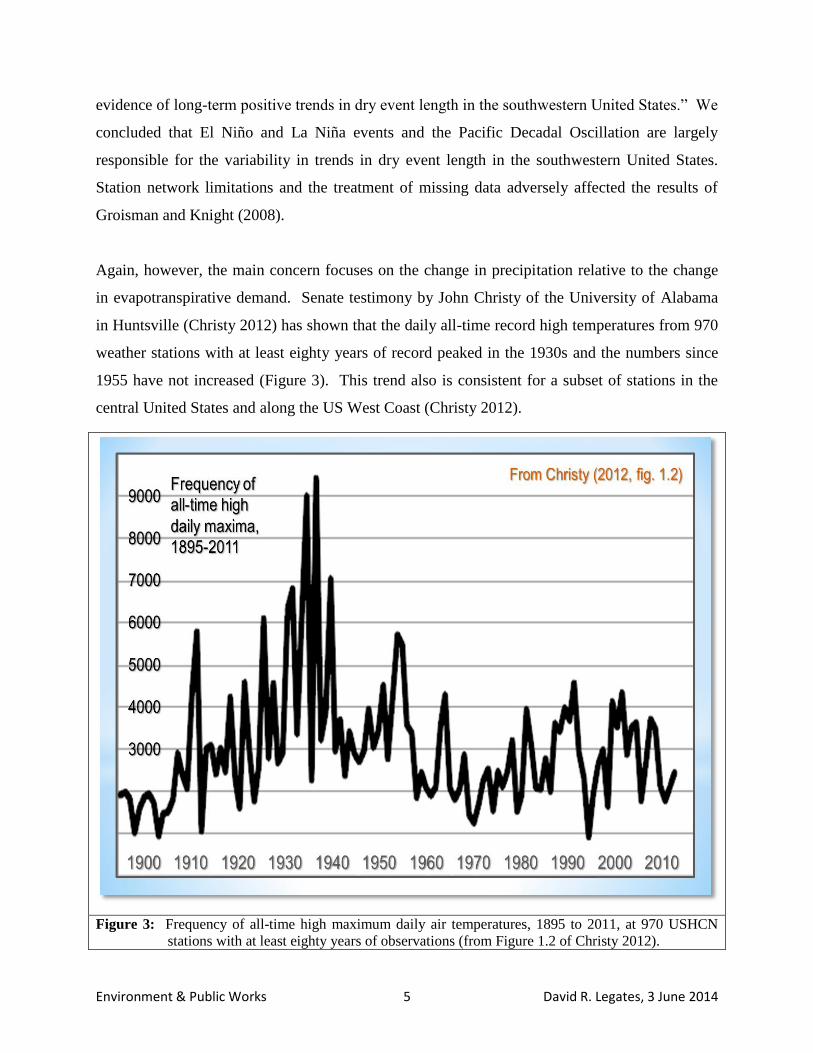
Again, however, the main concern focuses on the change in precipitation relative to the change
in evapotranspirative demand. Senate testimony by John Christy of the University of Alabama
in Huntsville (Christy 2012) has shown that the daily all-time record high temperatures from 970
weather stations with at least eighty years of record peaked in the 1930s and the numbers since
1955 have not increased (Figure 3). This trend also is consistent for a subset of stations in the
central United States and along the US West Coast (Christy 2012).
Figure 3: Frequency of all-time high maximum daily air temperatures, 1895 to 2011, at 970 USHCN
stations with at least eighty years of observations (from Figure 1.2 of Christy 2012).
Environment & Public Works 6 David R. Legates, 3 June 2014
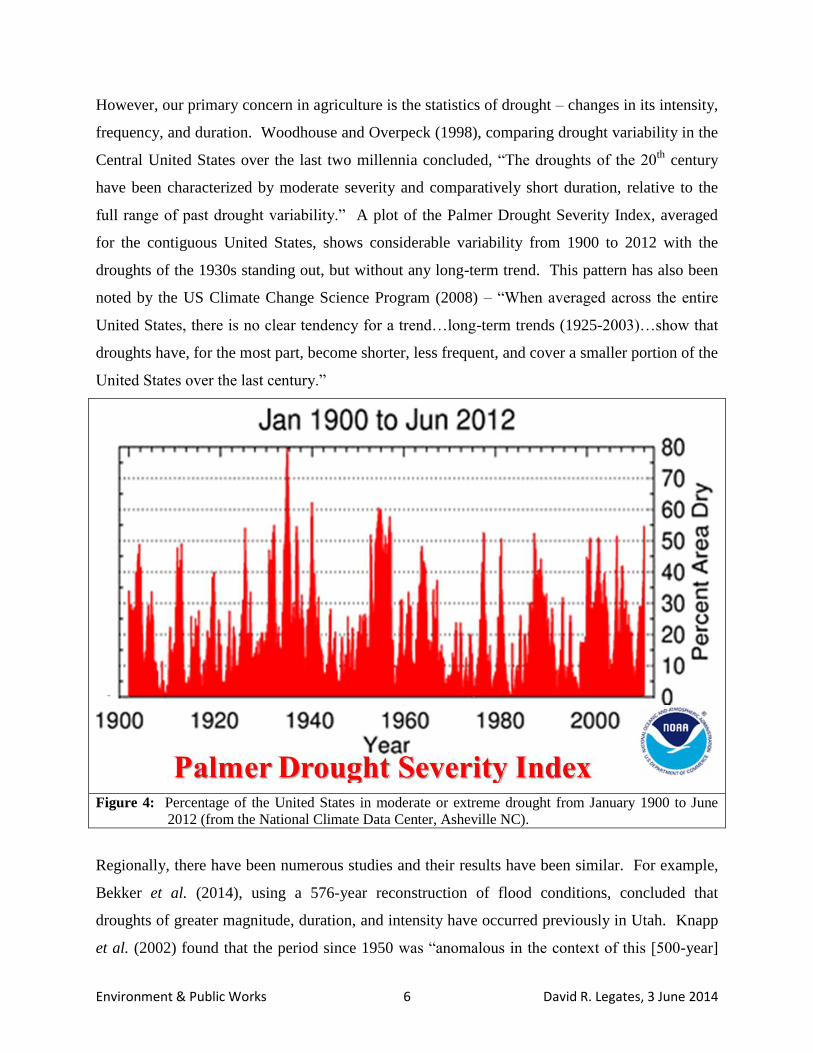
However, our primary concern in agriculture is the statistics of drought – changes in its intensity,
frequency, and duration. Woodhouse and Overpeck (1998), comparing drought variability in the
Central United States over the last two millennia concluded, “The droughts of the 20th
century
have been characterized by moderate severity and comparatively short duration, relative to the
full range of past drought variability.” A plot of the Palmer Drought Severity Index, averaged
for the contiguous United States, shows considerable variability from 1900 to 2012 with the
droughts of the 1930s standing out, but without any long-term trend. This pattern has also been
noted by the US Climate Change Science Program (2008) – “When averaged across the entire
United States, there is no clear tendency for a trend…long-term trends (1925-2003)…show that
droughts have, for the most part, become shorter, less frequent, and cover a smaller portion of the
United States over the last century.”
Figure 4: Percentage of the United States in moderate or extreme drought from January 1900 to June
2012 (from the National Climate Data Center, Asheville NC).
Regionally, there have been numerous studies and their results have been similar. For example,
Bekker et al. (2014), using a 576-year reconstruction of flood conditions, concluded that
droughts of greater magnitude, duration, and intensity have occurred previously in Utah. Knapp
et al. (2002) found that the period since 1950 was “anomalous in the context of this [500-year]
Environment & Public Works 7 David R. Legates, 3 June 2014
record for having no notable multiyear drought events.” For the Idaho, Montana, and Wyoming
region, Wise (2010) argued that “the instrumental record (i.e., since the late 1800s) does not
contain a drought of the extent seen in the mid-1600s.” Gray et al. (2004) found that dry
conditions in the Sixteenth Century (i.e., during the Little Ice Age) were greater in magnitude
and duration than anything seen in the Twentieth Century for the same region.
Andreadis and Lettenmaier (2006) concluded that Midwestern droughts “have, for the most part,
become shorter, less frequent, less severe, and cover a smaller portion of the country over the last
century.” Even the Special Report of the IPCC (IPCC 2012) concluded “…In some regions
droughts have become less frequent, less intense, or shorter, for example, in Central North
America.” Indeed, NOAA scientists (NOAA 2013) concluded that the 2012 Central Great Plains
drought “resulted mostly from natural variations in weather.”
In the Eastern United States, Pederson et al. (2012) concluded that recent droughts are not
unprecedented over the last 346 years, with more frequent droughts occurring between 1696 and
1820 A.D. during the colder conditions of the Little Ice Age. Indeed, Quiring (2004) concurred
that “…the recent growing-season moisture anomalies that occurred during 2002 and 2003 can
only be considered rare events if they are evaluated with respect to the relatively short
instrumental record (1895-2003)” and that condition during the 16th
Century were longer and
more severe.
My overall conclusion is that droughts in the United States are more frequent and more
intense during colder periods. Thus, the historical record does not warrant a claim that
global warming is likely to negatively impact agricultural activities.
1.2 Model-derived Trends and Patterns of Drought
Global climate models (or General Circulation Models – GCMs) are only as good as their ability
to simulate precipitation. They are descriptions of the full three-dimensional structure of the
Earth's climate and often are used in a variety of applications, including the investigation of the
possible role of various climate forcing mechanisms and the simulation of past and future
climates. There are, however, several important issues to remember with GCMs. First, they are
Environment & Public Works 8 David R. Legates, 3 June 2014
limited by our incomplete understanding of the climate system and how the various atmospheric,
land surface, oceanic, and ice components interact with one another. They are further limited by
our ability to transform this incomplete understanding into mathematical representations. We
may have a general feel for the complex interrelationships between the atmosphere and the
oceans, for example, but expressing this understanding in a set of mathematical equations is
much more difficult. Second, GCMs are limited by their own spatial and temporal resolutions.
Computational complexity and finite restrictions on computing power reduce GCM simulations
to coarse generalities. As a result, many small-scale features, which may have significant impact
on the local, regional, or even global climate, are not represented. Thus, we must recognize that
GCMs, at best, can only present a gross thumbnail sketch. Regional assessments over areas
encompassing many GCM grid cells are the finest scale resolution that can be expected. It is
inappropriate, and grossly misleading, to select results from a single grid cell and apply it locally.
It cannot be over emphasized that GCM representations of the climate can be evaluated at a
spatial resolution no finer than large regional areas, seldom smaller than a region defined by a
square several hundred miles (at least several GCM grid cells) on a side. Even the use of "nested
grid models" (models which take GCM output and resolve it to finer scale resolutions) does not
overcome this limitation, since results from the GCM simulation drives such models and no
mechanism is available to feedback the results of such finer-scale models to the GCM.
Another limitation in GCMs is that given the restrictions in our understanding of the climate
system and its computational complexity, some known phenomena are simply not reproduced in
climate models. Hurricanes and most other forms of severe weather (e.g., nor'easters,
thunderstorms, and tornadoes) simply cannot be represented in a GCM owing to the coarse
spatial resolution. Other more complex phenomena resulting from interactions among the
elements that drive the climate system may be limited or even not simulated at all. Such
indicators should be flags that something fundamental is lacking in the GCM. These phenomena
should be produced in the model as a result of our specification of climate interactions and
driving mechanisms; their absence indicates a fundamental flaw in our understanding of the
climate system, our mathematical representation of the process, the spatial and temporal
limitations imposed by finite computational power, or a combination of the above.
Environment & Public Works 9 David R. Legates, 3 June 2014
An assessment of the efficacy of any climate model, therefore, must focus on the ability of the
model to simulate present climate conditions. If a model cannot simulate what we know to be
true, then it is unlikely that model prognostications of climate change are believable. However, a
word of caution is warranted. It is common practice to “tune” climate models so that they better
resemble present conditions. This is widely acceptable, because many parameters in GCMs
cannot be specified directly and their values must be determined through empirical trial-and-
error. However, this raises the concern that a GCM may adequately simulate the present climate,
not because the model correctly represents the processes that drive the climate; but rather,
because it has been tuned to do so. Thus, the model may appear to provide a good simulation of
the climate, when in fact the model may poorly simulate climate change mechanisms. In other
words, a GCM may provide an adequate simulation of the present-day climate conditions,
but it does so for the wrong reasons. Model efficacy in simulating present-day conditions,
therefore, is not a guarantee that model-derived climate change scenarios will be reasonable. To
address this question, modelers often employ simulations of past climates, such as the Holocene
or the Pleistocene, to see if the model provides the kind of climate that we can infer existed
during such epochs. Of course, our knowledge of pre-historical climate conditions is tenuous
and extremely crude, which limits the utility of such evaluations.
A final limitation in climate modeling is that in the climate system, everything is interconnected.
In short, anything you do wrong in a climate model will adversely affect the simulation of every
other variable. The most problematic variable is precipitation. Precipitation requires moisture in
the atmosphere and a mechanism to cause it to condense (causing the air to rise over mountains,
by surface heating, as a result of weather fronts, or by cyclonic rotation). Any errors in
representing the atmospheric moisture content or precipitation-causing mechanisms will result in
errors in the simulation of precipitation. Thus, GCM simulations of precipitation will be affected
by limitations in the representation and simulation of topography, since mountains force air to
rise and condense to produce orographic (mountain-induced) precipitation (e.g., the coastal
mountain ranges of Washington and Oregon). Incorrect simulations of air temperature also will
adversely affect the simulation of precipitation since the ability of the atmosphere to store
moisture is directly related to its temperature. If winds, air pressure, and atmospheric circulation
are inadequately represented, then precipitation will be adversely affected since the atmospheric
Environment & Public Works 10 David R. Legates, 3 June 2014
flow of moisture that may condense into precipitation will be incorrect. Plant transpiration and
soil evaporation also provide moisture for precipitation; therefore, errors in the simulation of soil
moisture conditions will adversely affect the simulation of precipitation. Simulation of clouds
solar energy reaching the ground will affect estimates of surface heating which adversely affects
the simulation of precipitation. Even problems in simulating oceanic circulation or sea ice
concentrations will affect weather patterns, which affect precipitation simulations.
Equally important is the fact that inaccuracies in simulating precipitation, in turn, will adversely
affect the simulation of virtually every other climate variable. Condensation releases heat to the
atmosphere and forms clouds, which reflect energy from the sun and trap heat from the Earth’s
surface – both of which affect the simulation of air temperature. As a result, this can affect the
simulation of winds, air pressure, and atmospheric circulation. Since winds drive the circulation
of the upper layers of the ocean, the simulation of ocean circulation also is affected. Air
temperature conditions also contribute to the model simulation of sea ice formation, which would
be adversely affected. Precipitation is the only source of soil moisture; hence, inadequate
simulations of precipitation will adversely affect soil moisture conditions and land surface
hydrology. Vegetation also responds to precipitation availability so that the entire representation
of the biosphere can be adversely affected. Clearly, the interrelationships among the various
components that comprise the climate system make climate modeling difficult. Keep in mind,
however, that it is not just the long-term average and seasonal variations that are of interest.
Demonstrating that precipitation is highest over the tropical rainforests and lowest in the
subtropical deserts is not enough. Climate change is likely to manifest itself in small regional
fluctuations. Moreover, we also are interested in intra-annual (year-to-year) variability. Much of
the character of the earth's climate is in how it varies over time. A GCM that simulates
essentially the same conditions year after year clearly is missing an important component of the
earth's climate. Thus, the evaluation of climate change prognostications using GCMs must be
made in light of the model’s ability to represent the holistic nature of the climate and its
variability. In sum, the simulation of precipitation, and subsequently soil moisture, is
adversely affected by inaccuracies in the simulation of virtually every other climate
variable while, in turn, inaccuracies in simulating precipitation adversely affect virtually
every other variable in the model.
Environment & Public Works 11 David R. Legates, 3 June 2014
It should be noted that GCMs are not weather prediction models. Their utility is not in
predicting, for example, whether it will rain in southern England on the morning of July 14,
2087. Rather, we are interested in determining whether the probability of precipitation will be
substantially different from what it is today – in both the frequency and intensity of precipitation
events. In general, we want to know whether the summer of 2087 is likely to be wetter or drier
than present conditions, and by how much. As such, GCMs are only used appropriately to
address the likelihood of changes over large spatial and temporal scales -- assessing changes for
specific dates or locations are beyond the scope of GCM utility.
But this is my biggest concern. If a climate model simulates an increase in precipitation for the
near or distant future, I want to know why. In particular, I want to verify that it is because a
specific precipitation-producing mechanism has changed. Are there more tropical storms or
nor’easters simulated? More frontal precipitation? Is there more convective activity from
surface heating that leads to more rising air? Or has the atmospheric circulation changed such
that orographic precipitation is enhanced?
Unfortunately, this is where over-reliance on GCMs forecasts can betray us. In these models,
precipitation is produced almost exclusively from a single mechanism – surface convection – and
is often termed “popcorn precipitation” since it occurs over large regions and relatively
frequently (see Zolina 2014)). When models are averaged over seasons, the classic pattern of
global precipitation emerges with a moist equatorial region, decreased precipitation in the
Subtropics, and increased precipitation in mid-latitudes that tapers off with colder temperatures
toward the poles. While this may appear correct in the aggregate, it has achieved its apparent
success without properly simulating the mechanisms that create precipitation in the real world.
How possibly, therefore, can the models make accurate prognostications of precipitation when
they do not simulate correctly the mechanisms that drive precipitation? And if precipitation is
not modeled properly, how then can soil moisture estimates be used to prepare farmers for an
uncertain future?
Environment & Public Works 12 David R. Legates, 3 June 2014
Stephens et al. (2010) identifies this problem with three state-of-the-art climate models and
numerical weather prediction models. Using high resolution CloudSat observations over the
oceans (where precipitation is more uniform spatially), they demonstrate that the differences
between the models and the observations are much greater than observational and averaging
errors. They conclude “the general tendency is for models to produce precipitation that is far too
frequent, especially in midlatitudes” (i.e., the United States). Note that tropical precipitation is
largely convective (although some stratiform precipitation does occur – Janowiak et al. 1995) but
that in midlatitudes, precipitation arises from a variety of mechanisms. Instead of simulating
frontal passages and organized weather systems, the models exhibit “popcorn precipitation”
where it rains far too often. As a consequence of having it rain too frequently, the intensity of
modeled precipitation is that when it occurs, its intensity is much lower than observed. Thus, the
total precipitation is reasonable but its distribution (frequency and intensity) is grossly in error.
Even models that have spatial resolutions as fine as 7-14 km (4.4-8.8 mi) exhibit these problems.
When averaged to seasonal averages for the globe, the models do remarkably well. However,
they achieve this level of success for the wrong reasons. Regionally, the GCMs “tend to produce
too much precipitation over the tropical oceans and too little in midlatitudes”. Moreover, this is
where soil moisture is greatly affected – models that rain too frequently with lighter amounts will
necessarily overestimate soil moisture conditions because soil moisture responds not just to the
amount of precipitation but is very dependent on its timing.
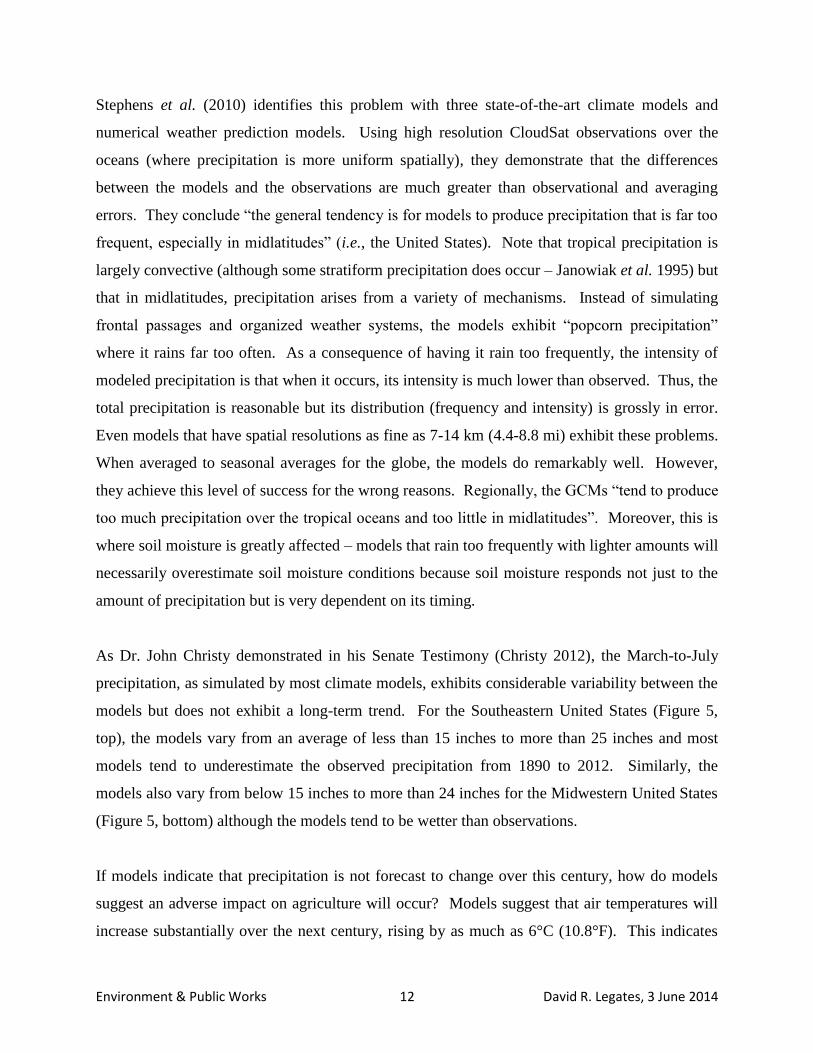
As Dr. John Christy demonstrated in his Senate Testimony (Christy 2012), the March-to-July
precipitation, as simulated by most climate models, exhibits considerable variability between the
models but does not exhibit a long-term trend. For the Southeastern United States (Figure 5,
top), the models vary from an average of less than 15 inches to more than 25 inches and most
models tend to underestimate the observed precipitation from 1890 to 2012. Similarly, the
models also vary from below 15 inches to more than 24 inches for the Midwestern United States
(Figure 5, bottom) although the models tend to be wetter than observations.
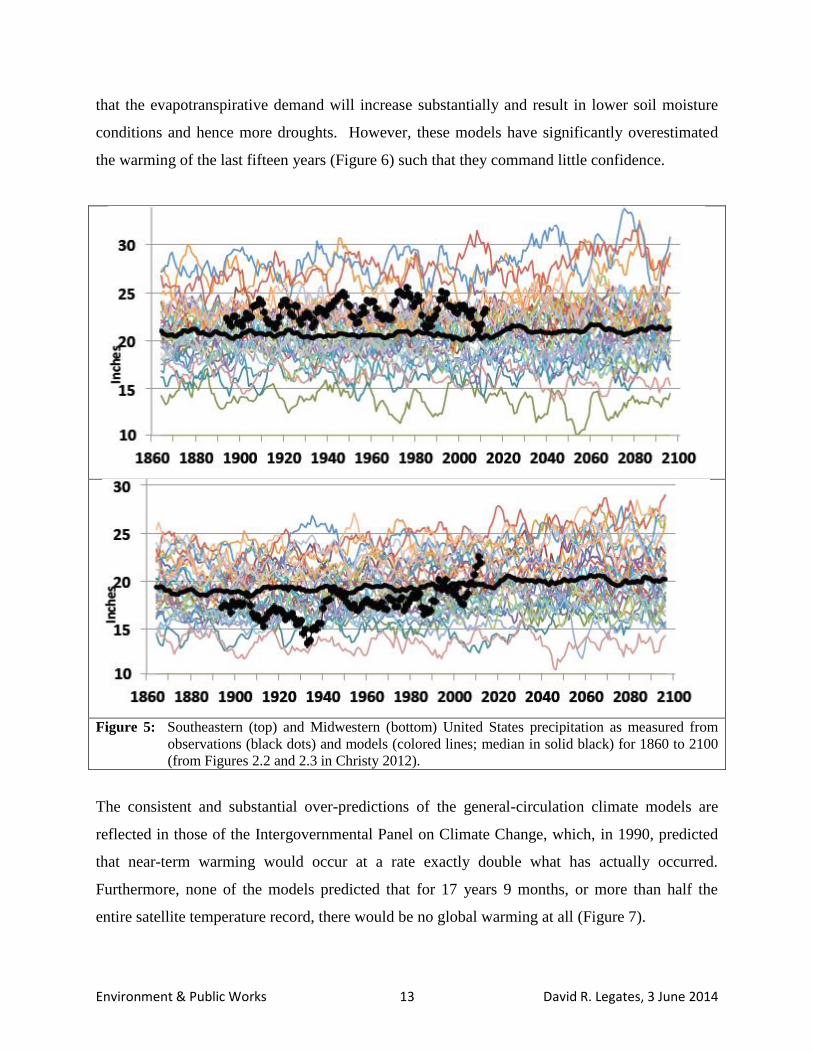
If models indicate that precipitation is not forecast to change over this century, how do models
suggest an adverse impact on agriculture will occur? Models suggest that air temperatures will
increase substantially over the next century, rising by as much as 6°C (10.8°F). This indicates
Environment & Public Works 13 David R. Legates, 3 June 2014
that the evapotranspirative demand will increase substantially and result in lower soil moisture
conditions and hence more droughts. However, these models have significantly overestimated
the warming of the last fifteen years (Figure 6) such that they command little confidence.
Figure 5: Southeastern (top) and Midwestern (bottom) United States precipitation as measured from
observations (black dots) and models (colored lines; median in solid black) for 1860 to 2100
(from Figures 2.2 and 2.3 in Christy 2012).
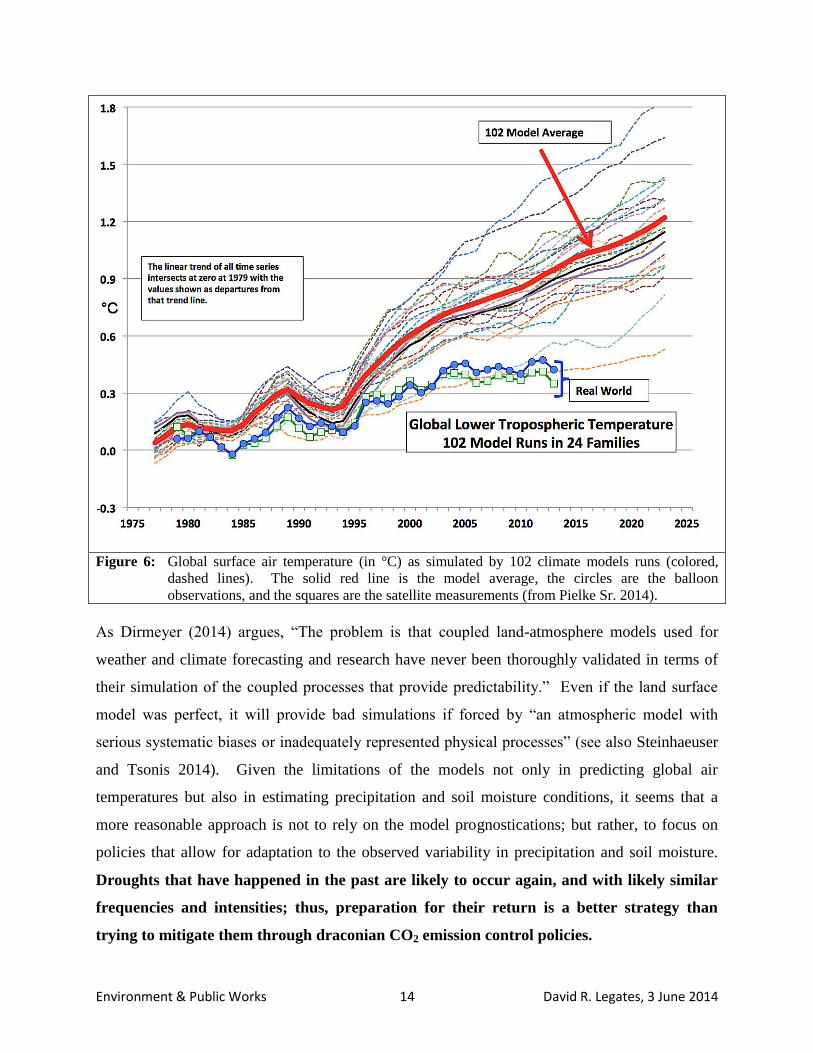
The consistent and substantial over-predictions of the general-circulation climate models are
reflected in those of the Intergovernmental Panel on Climate Change, which, in 1990, predicted
that near-term warming would occur at a rate exactly double what has actually occurred.
Furthermore, none of the models predicted that for 17 years 9 months, or more than half the
entire satellite temperature record, there would be no global warming at all (Figure 7).
Environment & Public Works 14 David R. Legates, 3 June 2014
Figure 6: Global surface air temperature (in °C) as simulated by 102 climate models runs (colored,
dashed lines). The solid red line is the model average, the circles are the balloon
observations, and the squares are the satellite measurements (from Pielke Sr. 2014).
As Dirmeyer (2014) argues, “The problem is that coupled land-atmosphere models used for
weather and climate forecasting and research have never been thoroughly validated in terms of
their simulation of the coupled processes that provide predictability.” Even if the land surface
model was perfect, it will provide bad simulations if forced by “an atmospheric model with
serious systematic biases or inadequately represented physical processes” (see also Steinhaeuser
and Tsonis 2014). Given the limitations of the models not only in predicting global air
temperatures but also in estimating precipitation and soil moisture conditions, it seems that a
more reasonable approach is not to rely on the model prognostications; but rather, to focus on
policies that allow for adaptation to the observed variability in precipitation and soil moisture.
Droughts that have happened in the past are likely to occur again, and with likely similar
frequencies and intensities; thus, preparation for their return is a better strategy than
trying to mitigate them through draconian CO2 emission control policies.
Environment & Public Works 15 David R. Legates, 3 June 2014
Figure 7: Monthly global mean surface air temperature anomalies monitored by satellite (RSS),
August 1996 to April 2014. For 213 months, or more than half the entire satellite
record, the least-squares linear-regression (thick bright blue line) has been zero.
1.3 The Scientific Method versus Post-Normal Science
The scientific method has long been the ‘gold standard’ among scientists. It is the empirical
evidence that separates science from mythology and is the key to finding scientific truth (Legates
et al. 2013). Indeed, it is the evaluation of theories with observations that have trumped appeals
to authority or consensus or the longevity of a theory (Legates et al. 2014). As Legates et al.
(2013) argued, “results from climate models are often erroneously posited as observations
themselves or even data and even when they diverge considerably from the real observations,
they are used to drive theory construction…results from climate models should be used with
extreme care and not be taught as scientific fact.”
As a response to policy-making when a ‘solution’ is demanded immediately and the facts are
obscured by error, widely divergent views exist, models are inherently uncertain, Post-Normal
Science emerges where ‘science by consensus’ reigns. It has been strongly argued that even in
its early days, the Intergovernmental Panel on Climate Change abandoned the scientific method
in favor of this new paradigm (Saloranta 2001, Legates et al. 2013). This inherently morphs the
role of the scientist from an impartial observer and seeker of the truth to one who dons the hat of
Environment & Public Works 16 David R. Legates, 3 June 2014
an advocate. This is where the so-called ‘consensus arguments’ arise where an appeal to some
very large percentage of scientists appears to give credibility to a particular viewpoint. Most of
these consensuses are contrived (see Legates et al. 2014) and serve to push an agenda that
diverges widely from truth-seeking. The scientific method has been abandoned by many in the
climate change discussion with an appeal to the masses through an imaginary consensus of
scientists. This has greatly undermined both the quest for truth in this debate and the respect the
general public has for scientists who advocate for anthropogenic global warming disaster
scenarios.
2. The Silencing of the Dissenters
In my Senate Testimony in 2003 regarding the so-called “Hockey Stick” graph of global air
temperature (Legates 2003), I concluded with the statement
I’m sorry that a discussion that is best conducted among scientists has made its
way to a United States Senate committee. But hopefully it has become evident
that a healthy scientific debate is being compromised and that only by bringing
this discussion into the light can it be properly addressed.
At that time, an attack had been made on the scientific process. Editors at two journals were
harassed to the extent that an abrogation of their commitment to reviewer confidentiality had
been demanded of them. One of the journals, Climate Research, was threatened with an
organized boycott and the Director of its parent organization, who first evaluated the situation
and exonerated the managing editor, recanted in the face of this boycott. The newly appointed
Senior Editor had moved to bar two scientists from future publication in Climate Research –
without a hearing and without even an accusation of fraud or plagiarism.
I would like to provide you with an update on how the state of science has progressed in the
intervening eleven years as it regards climate change. In 2009, a release of documents from the
University of East Anglia in the United Kingdom (known colloquially as ‘ClimateGate’) shed
light on how the scientific process was being subverted. With respect to me personally, I learned
that in 2001, I had been denied publication of an important rebuttal due to collusion between an
author and an editor. In the Second Assessment Report (SAR) of the IPCC, the phrase “balance
Environment & Public Works 17 David R. Legates, 3 June 2014
of evidence suggests a discernible human influence on global climate” had been inserted, and
that five separate statements to the contrary had been removed by a single author. Dr. Robert E.
Davis and I examined the citations given in support by Dr. Ben Santer, Dr. Thomas Wigley, and
their colleagues. We had found that the statistic they used to make their conclusions was
seriously flawed and published our results. Wigley and his colleagues published a rebuttal and
we were denied a response since “we did not add anything significant to the discussion.” I
assumed we had not done enough to sway an impartial editor.
But in an e-mail, Dr. Wigley explained how he had engineered his rebuttal and suggested it be
used as a template for others. He indicated he had contacted the editor, complained that any such
publication criticizing his research should have been cleared by him first, and the two agreed that
his rebuttal would be treated as a new submission and any response Davis and I made were to be
squelched by the editor. We had always suspected such events might have occurred but it took
the ClimateGate documents to provide the proof.
But these issues were to pale in comparison to what was about to happen. On December 16,
2009, I received a letter that, due to the ClimateGate revelations and pursuant to the Delaware
Freedom of Information Act (FOIA), Greenpeace requested my “email correspondence and
financial and conflict-of-interest disclosures” that were “in the possession of or generated by the
Office of the Delaware State Climatologist” from January 1, 2000 regarding ‘global climate
change’ and containing any of 22 additional keywords.
The Delaware FOIA statute is fairly terse with respect to the University. It simply states that the
University of Delaware is exempt from State FOIA except for the conduct of the Board of
Trustees of the University and documents relating to the expenditure of public funds. Although
during my tenure as the State Climatologist, the Office obtained no funds from either the State or
the University – I provided goodwill climate services to the State on behalf of the University –
and I had conducted no business that could be construed as climate change related. Technically,
nothing should have been produced.
Environment & Public Works 18 David R. Legates, 3 June 2014
Shortly after receiving the request from Greenpeace, I met with the University Vice President
and General Counsel, Mr. Lawrence White. He summarily informed me that I was required to
turn over not just documents related to the State Climate Office and what Greenpeace requested,
but ALL documents that I had in my possession relating to ‘global climate change’ – whether or
not they were produced through the State Climate Office. I was told that as a faculty member, I
must comply with the request of a senior University official.
On January 26, 2010, Mr. White received a letter from the Competitive Enterprise Institute (CEI)
making a nearly identical request of three other faculty members who had contributed to the
Intergovernmental Panel on Climate Change. One of those faculty members was from my own
department (Dr. Frederick E. Nelson) and had an office down the hall from me. Mr. White sent
me an e-mail containing this FOIA request and indicated “this one will probably be answered
with a short ‘no’.” After a follow-up letter by CEI on February 3, Mr. White finally responded
that “because the information you seek does not relate to the expenditure of public funds, the
University respectfully declines your records request.”
I subsequently met with Mr. White to obtain an explanation as to why I was being treated
differently. He explained to me that I did not understand the law. As he sees it, even though the
law may not require the University to produce e-mails and documents, the law does not prohibit
him from requiring me to produce them for his perusal and potential release to Greenpeace. As
such, I was again instructed to turn over all the documentation he requested to him ASAP.
At that point, I sought outside legal counsel. On February 9, 2010 and after questions raised by
my lawyer, Mr. White agreed to a ‘do-over’. After further review, Mr. White indicated in a letter
to CEI that he wished to retract his email to them and “reconsider the substance of your FOIA
request” because his initial response “did not take sufficient account of the legal analysis
required under the Act.” Mr. White indicated to CEI and to my lawyer that their FOIA would be
handled in a manner identical to my Greenpeace FOIA.
In a telephone conversation between me and the Dean of the College of Earth, Ocean, and
Environment, I subsequently was told that as a University faculty member, Mr. White
Environment & Public Works 19 David R. Legates, 3 June 2014
represented both me and the University. She insisted that he worked for me, was indeed working
in my best interest in this instance, and that I must follow all of his instructions. I objected and
indicated that I felt I was being treated differently from other faculty members and that treatment
was simply unfair. Finally, she concluded that because I had hired my own lawyer, the College
would no longer support me and she ceased communicating with me on this matter.
Shortly after our discussion, the Deputy Dean informed me that the Dean had decided that she
wanted me to resign as the Delaware State Climatologist so he could take over that role.
Subsequently, I was removed as the State Climatologist. I also was removed as co-Director of
the Delaware Environmental Observing System (an observational network I had spent nearly a
decade to develop), as faculty advisor to the Student Chapter of the American Meteorological
Society, and from all my committee assignments within my department. The Chair of the
Department attempted to remove me from several grants that I had obtained. I have since been
restricted from serving on any departmental committees.
In a discussion with my colleague, Dr. Frederick Nelson, I learned that he had met with one of
Mr. White’s assistants’. Dr. Nelson related to me that she shared all she could about my FOIA
discussions but then left the meeting without providing instructions regarding his FOIA. He
subsequently sent a follow-up email to both her and Mr. White asking for specifics of what he
was to produce. As of July 2012, he had yet to hear back from either of them. He has since
retired from the University.
On June 20, 2011 – 472 days or exactly 1 year and 3.5 months – I again heard from Mr. White.
He had now hired a 3rd
year law student to go through the materials I had provided to him over a
year earlier. But why the delay and now the sudden flurry of activity? Less than a month earlier,
on May 25, 2011, the Virginia Supreme Court had ruled on the case between Attorney General
Ken Cuccinelli and the University of Virginia that emails by former professor Dr. Michael Mann
and in the University of Virginia’s possession must be turned over to the Attorney General’s
Office. Interestingly, all this began as a result of a CEI FOIA of Dr. Mann that followed a
similar Greenpeace FOIA on Dr. Patrick Michaels – a former faculty member at the University
of Virginia. The American Association of University Professors (AAUP) and several
Environment & Public Works 20 David R. Legates, 3 June 2014
professional organizations including the American Meteorological Society and the American
Geophysical Union (of which both Dr. Michaels and I are members) vehemently protested the
FOIA request. The AAUP stressed to the University of Virginia that “we urge you to use every
legal avenue at your disposal to resist providing the information demanded in the [civil
investigative demand]” arguing that “documents and e-mail communications that were part of an
ongoing scientific discussion might be taken out of that context, and used to create an impression
of wrongdoing.” They concluded that “it is the University’s obligation to protect academic
freedom by seeing that legal tools such as this…are not used to intimidate scientists whose
methods or conclusions are controversial.”
Interestingly, Dr. Joan DelFattore, president of the AAUP Chapter at the University of Delaware
had recently published an article on academic freedom at the University of Delaware. Citing her
appreciation for having a general council (i.e., Mr. White) who understands the importance of
academic freedom, she wrote:
“It is also useful to consider that once an administration silences any speech, it
may be assumed that the university is endorsing whatever speech it fails to
suppress. A university’s real interest lies in fostering the exchange of divergent
views on the understanding that the university itself does not necessarily endorse
any of them and certainly does not endorse all of them.”
I therefore decided to elicit her assistance through the AAUP. While her comments sounded
laudable, her response to me was that FOIA matters “would not fall within the scope of the
AAUP”. This, of course, is in direct contrast to the stance taken by the AAUP in the Cuccinelli
vs. University of Virginia where the AAUP President, Cary Nelson, wrote:
“We are urging the University of Virginia to…publicly [resist] the threat to
scholarly communication and academic freedom represented by the concerted
effort to obtain faculty emails…Whatever people may think of climate research,
the climate for academic freedom must not be allowed to deteriorate. If scientists
think every email they send may be subject to a politically motivated attack, it
will create a chilling effect on their discourse and hurt scientific research.’”
Environment & Public Works 21 David R. Legates, 3 June 2014
Indeed, the AAUP defended Dr. Mann at the University of Virginia but refused to become
involved in my similar case at the University of Delaware, citing that they stood firmly behind
Mr. White’s actions.
Finally, on July 22, 2011, I was provided a list of what Mr. White had decided to release to
Greenpeace – pending my permission. Mr. White further reiterated that he was indeed treating
the subjects of the CEI FOIA in an identical manner. Communication I had with Dr. Nelson and
the response by the 3rd
year law student to my query – she indicated I was the only faculty
member whose documents were being examined – suggests otherwise. If I am being singled out
for my views – punish the ‘skeptics’ while protecting the ‘believers’ as happened by the
disparate treatment at the University of Virginia regarding Drs. Mann and Michaels – then
doesn’t that make the entire discussion of academic freedom at the University of Delaware by
Dr. DelFattore into a lie? Again, Dr. DelFattore wrote that “once an administration silences any
speech, it may be assumed that the university is endorsing whatever speech it fails to suppress.”
On this topic I cannot agree more.
Mr. White wrote “if you object to the release on any of these documents, then I would inform the
groups requesting this information that there are some documents in Dr. Legates’ custody that
we have not produced and that they should direct further questions about the documents to you.”
I am puzzled as to why I have the right to object to the release of any documents. If Mr. White’s
interpretation of FOIA as it pertains to the university is correct, then why should I or any other
faculty member be allowed to object to their release? Doesn’t the law trump my protests? But if
he has decided to release documents outside of the FOIA just because he can, as he explained to
me at the outset, then the University has unfairly targeted me. On this there can be no middle
ground.
Through my attorney, I subsequently requested several questions be answered by Mr. White.
Until my letter, I had not indicated to Mr. White that I had been in contact with Dr. Nelson
regarding his FOIA case. At this point, I informed Mr. White that I knew he had not asked Dr.
Nelson to produce any documents, despite the fact that on three occasions, Mr. White had
asserted he would treat all of us equally.
Environment & Public Works 22 David R. Legates, 3 June 2014
The next day, February 2, 2012, Mr. White responded to questions posed to him – not to the ones
contained in my letters but to questions he had already answered on August 2, 2011. Most
interesting is Mr. White’s response to question 1 of that exchange which explicitly addressed the
equal treatment of me and those targeted by the CEI FOIA request:
“Attached is a .pdf of an email exchange we had on February 10, 2010,
memorializing our agreement on how this matter would proceed. Term 5
provides: “Dr. Legates and the University of Delaware professors who are the
subject of the Competitive Enterprise Institute’s FOIA request (dated Feb. 3,
2010) will be subject to the same process—that is, they too will be required to
produce documents for your review—and they will be subject to the same legal
standard for determining whether and to what extent FOIA applies.”
On August 2, 2011, Mr. White had provided a short, one word response to that question –
“Confirmed.” But on February 2, 2012, his reply to the same question indicates he had
not been truthful:
“I have not yet dealt with FOIA requests directed at faculty members other than
Dr. Legates. I reiterate that, if and when additional documents are gathered
relating to other FOIA requests on this subject matter, you will be allowed to
review those documents before they are produced.”
In February of 2010, Mr. White had agreed that all parties would be subject to the same
procedures and insisted that he was proceeding in exactly the same manner with them.
Now, he asserts that “if and when additional documents are gathered” I will be allowed to
review those documents. Why should I have the right to look at the documents of others?
More importantly, two years had passed since CEI submitted its FOIA request and Mr.
White indicated that “I have not yet dealt with FOIA requests directed at faculty members
other than Dr. Legates.” This clearly indicates that he had no intent to honor his ‘do-
over’ request on February 9, 2010 – in essence, I will be treated differently than other
faculty because he has every right to treat me that way.
I have since become aware of a case that involved the University of Delaware in 1991. In the
Gottfredson/Blits federal arbitration case of 1991, the University of Delaware explicitly
Environment & Public Works 23 David R. Legates, 3 June 2014
conceded (and it was upheld by the arbiter) that the University’s review of research and teaching
notes would violate a faculty member’s academic freedom. The University’s Faculty Senate
Committee on Research that had investigated Professor Linda Gottfredson stated that, “the
Committee has never directed its attention to the content or method of any faculty member’s
research or teaching, and would oppose any attempt to restrict a colleague’s rights in these
protected areas” (i.e., areas of academic freedom and contract rights). In a meeting with the
Chief Budget Officer of the University, I learned that my faculty salary only includes my
teaching workload since FY2009 when that was transferred to state support. Thus, the only item
that could be covered by State funds (and hence covered under the State FOIA) was my teaching
materials since September 2008. No e-mails, no unfunded research, no service assignments were
covered. Mr. White’s actions violate a federal ruling to which the University has agreed to abide
by.
Thus, there were no documents that fell under the Greenpeace FOIA – nothing I did as Delaware
State Climatologist related to global climate change and none of my teaching duties were
accomplished as the Delaware State Climatologist. On April 8, 2014, my documents were
finally returned to me.
Thus, it appears that Mr. White arbitrarily decided to gather, examine, and potentially release
files to Greenpeace simply because he, acting as an officer of the University has chosen to harass
and try to silence me for deviating from ‘University-approved’ scientific views. I chose to resist
the release of these materials – not because I have anything to hide – but to protect my academic
freedom and the freedom of others and to reject the University’s attempts “to intimidate
scientists whose methods or conclusions are controversial,” as the AAUP argued at the
University of Virginia. If one faculty member can be bullied by a heavy-handed administration,
then certainly other faculty will be under attack in the future.
Over the years, I have applied for several federal grants. Two in particular, submitted to NASA
and the USDA (the latter involved using precipitation estimates by weather radar to enhance
agricultural planning which had nothing to do with climate change), were never reviewed. It is
not that I have received bad reviews; indeed, I have received no reviews at all. Program officers
Environment & Public Works 24 David R. Legates, 3 June 2014
refuse to provide reviews and even to respond by e-mail or telephone. My understanding is that
this is related to Anderegg et al. (2010) which often is used as a type of ‘black list’ to identify
“researchers unconvinced of anthropogenic global warming,” to use their terminology.
As existed in the case of Lysenkoism in the Soviet Union, a healthy scientific discussion is being
subverted for political and personal gain. With the recent case of Professor Lennart Bengtsson
and the story I have told here, scientists who deviate from the anthropogenic global warming
playbook are likely to be harassed, have grants and proposals rejected without review, be treated
more harshly than their peers, and be removed from positions of power and influence. I would
have hoped that in the past decade, the discussion has become more civil. Indeed, a civil
discussion can be had with some scientists that believe in the extreme scenarios of anthropogenic
global warming. But too many in places of prominence and with loud voices have made this a
war zone. Scientists like Bengtsson and myself have tenure or its equivalent and are somewhat
insulated from the extreme attacks. But young scientists quickly learn to ‘do what is expected of
them’ or at least remain quiet, lest they lose their career before it begins.
I leave you with this thought: When scientific views come under political attack, so too
does independent thinking and good policy-making because all require rational thought to
be effective.
Cited Literature
Andreadis, K.M., and D.P. Lettenmaier (2006). Trends in 20th Century drought over the continental
United States. Geophysical Research Letters, 33, L10403.
Bekker, M.F., R.J. DeRose, B.M. Buckley, R.K. Kjelgren, and N.S. Gill (2014). A 576-year Weber
River streamflow reconstruction from tree rings for water resource risk assessment in the
Wasatch Front, Utah. Journal of the American Water Resources Association, in press.
Christy, J.R. (2012). Testimony to the U.S. Senate Committee on Environment and Public Works,
August 1, 2012.
Dirmeyer, P.A. (2014). The cusp of major progress in predicting land-atmosphere interactions.
Gewex, February/May 2014, 15-18.
Gray, S.T., C.L. Fastie, S.T. Jackson, and J.L. Betancourt (2004). Tree-ring based reconstructions of
precipitation in the Bighorn Basin, Wyoming, since 1260 A.D. Journal of Climate, 17:3855-
3865.
Groisman, P.Ya., and R.W. Knight (2008). Prolonged dry episodes over the conterminous United
States: New tendencies emerging during the last 40 years. Journal of Climate, 21:1850-
1862.
Environment & Public Works 25 David R. Legates, 3 June 2014
Hao, Z., A. AghaKouchak, N. Nakhjiri, and A. Farahmand (2014). Global integrated drought
monitoring and prediction system. Scientific Data, doi:10.1038/sdata.2014.1, in press.
IPCC (2012). Managing the Risks of Extreme Events and Disasters to Advance Climate Change
Adaptation. Field et al. (eds.), Cambridge University Press, Cambridge UK, 582pp.
Janowiak, J.E., P.A. Arkin, P. Xie, M.L. Morrissey, and D.R. Legates (1995). An Examination of the
East Pacific ITCZ Rainfall Distribution. Journal of Climate, 8(11):2810–2823.
Knapp, P.A., H.D. Grissino-Mayer, and P.T. Soule (2002). Climatic regionalization and the spatio-
temporal occurrence of extreme single-year drought events (1500-1998) in the interior
Pacific Northwest, USA. Quaternary Research, 58:226-233.
Legates, D.R. (2003). Testimony to the U.S. Senate Environment and Public Works Committee,
July 29, 2003.
Legates, D.R., W. Soon, and W.M. Briggs (2013): “Learning and Teaching Climate Science: The
Perils of Consensus Knowledge Using Agnotology”. Science & Education, 22:2007–2017.
Legates, D.R., W. Soon, W.M. Briggs, and C. Monckton of Brenchley (2014), Climate Consensus and
‘Misinformation’: A Rejoinder to Agnotology, Scientific Consensus, and the Teaching and
Learning of Climate Change. Science & Education, forthcoming.
McCabe, G.J., D.R. Legates, and H.F. Lins (2010). Variability and trends in dry day frequency and
dry event length in the southwestern United States. Journal of Geophysical Research, 115,
D07108.
New, M., M. Todd, M. Hulme, and P.D. Jones (2001). Precipitation measurements and trends in the
Twentieth Century. International Journal of Climatology, 21:1899-1922.
NOAA (2013). An Interpretation of the Origins of the 2012 Central Great Plains Drought. NOAA
Drought Task Force, March 20, 2013.
Pederson, N., A.R. Bell, T.A. Knight, C. Leland, et al. (2012). A long-term perspective on a modern
drought in the American Southeast. Environmental Research Letters, 7, doi:10.1088/1748-
9326/7/1/014034.
Pielke, R.A. Sr. (2014). Testimony to the U.S. House Committee on Science, Space and
Technology, May 29, 2014.
Quiring, S.M. (2004). Growing-season moisture variability in the eastern USA during the last 800
years. Climate Research, 27:9-17.
Saloranta, T.M. (2001). Post-normal science and the global climate change issue. Climatic Change,
50:395-404.
Sheffield, J., E.F. Wood, and M.L. Roderick (2012). Little change in global drought over the past 60
years. Nature, 491:435-438.
Soon, W., S.L. Baliunas, C.D. Idso, S. Idso, and D.R. Legates (2003). Reconstructing climatic and
environmental changes of the past 1000 years: A reappraisal. Energy & Environment,
14(2/3):233-296.
Steinhaeuser, K., and A.A. Tsonis (2014). A climate model intercomparison at the dynamics level.
Climate Dynamics, 42:1665-1670.
Stephens, G.L., T. L’Ecuyer, R. Forbes, A. Gettlemen, et al. (2010). Dreary state of precipitation in
global models. Journal of Geophysical Research, 115, D24211, doi:10.1029/2010JD014532.
Vose, R.S., et al. (2014). Improved historical temperature and precipitation time series for U.S.
climate divisions. Journal of Applied Meteorology and Climatology, 53(5):1232-1251.
Wise, E.K. (2010). Tree ring record of streamflow and drought in the upper Snake River. Water
Resources Research, 46, doi:10.1029/2009WR009282.
Woodhouse, C.A., and J.T. Overpeck (1998). 2000 years of drought variability in the Central United
States. Bulletin of the American Meteorological Society, 79(12):2693-2714.
Zolina, O. (2014). Understanding hydroclimate extremes in a changing climate: Challenges and
perspectives. Gewex, February/May 2014, 18-22.