STATEMENT OF FINANCIAL POSITION INCOME STATEMENT … · N. Cutini W.M. & P.B. Desk F. Molaro...
84
STATEMENT OF FINANCIAL POSITION INCOME STATEMENT ANNUAL REPORT
Transcript of STATEMENT OF FINANCIAL POSITION INCOME STATEMENT … · N. Cutini W.M. & P.B. Desk F. Molaro...

STATEMENT OF FINANCIAL POSITIONINCOME STATEMENTANNUAL REPORT

INTESA SANPAOLOBANK LUXEMBOURG . . . . . . . . . 4
BOARD OF DIRECTORS . . . . . . . . . . . . . . . . . . . . . . . . . . . . . . . . 5
EXTERNAL AUDITOR . . . . . . . . . . . . . . . . . . . . . . . . . . . . . . . . . . 5
AUTHORIZED MANAGEMENT-MANAGEMENT BOARD . . . . . 5
EXECUTIVE COMMITTEE . . . . . . . . . . . . . . . . . . . . . . . . . . . . . . . 5
AUDIT COMMITTEE . . . . . . . . . . . . . . . . . . . . . . . . . . . . . . . . . . . . 5
OWNERSHIP STRUCTURE . . . . . . . . . . . . . . . . . . . . . . . . . . . . . . 6
ORGANISATIONAL CHART . . . . . . . . . . . . . . . . . . . . . . . . . . . . . 6
BOARD OF DIRECTORS’ REPORT . . . . . . . . . . . . . . . . . . . . . . . . 7
FINANCIALSTATEMENTS . . . . . . . . . . . . . . . 10
STATEMENT OF FINANCIAL POSITION . . . . . . . . . . . . . . . . . .11
INCOME STATEMENT . . . . . . . . . . . . . . . . . . . . . . . . . . . . . . . . . 13
STATEMENT OF PROFIT OR LOSS
AND OTHER COMPREHENSIVE INCOME . . . . . . . . . . . . . . . . 14
STATEMEMNT OF CHANGES IN EQUITY . . . . . . . . . . . . . . . . . 15
STATEMENT OF CASH FLOWS . . . . . . . . . . . . . . . . . . . . . . . . . 16

INDEPENDENT AUDITOR’SREPORT . . . . . . . . . . . . . . . . . . . . 75
FINANCIALSTATEMENTS . . . . . . . . . . . . . . . 10
STATEMENT OF FINANCIAL POSITION . . . . . . . . . . . . . . . . . .11
INCOME STATEMENT . . . . . . . . . . . . . . . . . . . . . . . . . . . . . . . . . 13
STATEMENT OF PROFIT OR LOSS
AND OTHER COMPREHENSIVE INCOME . . . . . . . . . . . . . . . . 14
STATEMEMNT OF CHANGES IN EQUITY . . . . . . . . . . . . . . . . . 15
STATEMENT OF CASH FLOWS . . . . . . . . . . . . . . . . . . . . . . . . . 16
NOTES TO THE FINANCIAL STATEMENTS . . . . 17

INTESA SAN PAOLOBANK LUXEMBOURG

ANNUAL REPORT 5
BOARD OF DIRECTORS CHAIRMAN OF THE BOARD Mr Frédéric GENET
VICE-CHAIRMAN Mr Walter AMBROGI
DIRECTORSMr Ferdinando ANGELETTI (Managing Director & CEO)Mr Massimo TORCHIANA (Deputy CEO)Mr Marco BERTOTTIMr Andrea FARAGALLI ZENOBIMr Paul HELMINGERMr Francesco INTROZZIMr Arthur PHILIPPEMr Christian SCHAACK
EXECUTIVE COMMITTEE CHAIRMANMr Ferdinando ANGELETTI
MEMBERSMr Francesco INTROZZIMr Massimo TORCHIANA
PERMANENT INVITEESMr Cristiano PATALOCCHIMr Paolo Enrico PERNICE
AUDIT COMMITTEE CHAIRMANMr Arthur PHILIPPE
MEMBERSMr Dario BERTONCINIMr Marco BERTOTTIMr Francesco CICCARELLIMr Christian SCHAACK
PERMANENT INVITEESMr Stefano BUSCAGLIAMs Silvia RUMI
EXTERNAL AUDITORKPMG, Luxembourg
AUTHORIZED MANAGEMENT- MANAGEMENT BOARD MANAGING DIRECTOR & CEOMr Ferdinando ANGELETTI
DEPUTY CEOMr Massimo TORCHIANA
CHIEF FINANCIAL OFFICERMr Paolo Enrico PERNICE
CHIEF RISK & COMPLIANCE OFFICER & CORPORATE AFFAIRSMr Cristiano PATALOCCHI
as of 31st December 2017

6 ANNUAL REPORT
OWNERSHIP STRUCTURE (as of 31st December 2017)
ORGANISATIONAL CHART (as of 31st December 2017)
Board of DirectorsExecutive
CommitteeAudit
Committee
Amsterdam BranchR. Farquhar-
Thomson
LegalA. Simms
Human Resources & Organization
S. Contino
Corporate & Financial InstitutionsA. Greppi
Wealth Management & Private BankingF. Angeletti (a.i.)
Financial Markets
M. Giubergia
Administration & OperationsP. Pernice (*)
CFO
Chief Risk & Compliance Officer & Corporate Affairs
C. Patalocchi (*)CRO
Human ResourcesS. Contino (a.i.)
OrganizationS. Contino (a.i.)
Financial Institutions
A. Greppi (a.i.)
Corporate Prod. Desks
A. Greppi (a.i)
International Network & Global
IndustriesA. Greppi (a.i.)
Italian DeskL. Checchinato
LuxGest A.M.N. Cutini
W.M. & P.B. DeskF. Molaro
Investment OfficersP. Squillante
CIO
Bonds DeskR. Duretto
Equities DeskF. Ulrich
Proprietary Portfolio Desk
M. Giubergia (a.i.)
MM & FX DeskG. Wandivinit
Sales DeskM. Blaskovits
IT & PMM. Ferrari
Clients Documentation
C. Ducrocq
OperationsD. Castellani
FinanceS. Piovesan
Corporate Affairs & General Secretariat
C. Patalocchi (a.i.)
Compliance OfficerS. Solito
CCO
Risk ManagementM. Pirard
Managing Director & CEO
F. Angeletti (*)
Management Board
Internal AuditF. Tefiku
(a.i.) = Ad Interim(*) Members of Authorized Management/Management Board approved by ECB.
Intesa Sanpaolo Group SpA
Intesa Sanpaolo Holding International S.A.
Intesa Sanpaolo Bank Luxembourg S.A.
Amsterdam Branch
Credit Analysis, Administration & Monitoring
P. Elia
Secretariat
Legal Entity Branch
100%
100%
100%
LuxGest Asset Management S.A.

ANNUAL REPORT 7
BOARD OF DIRECTORS’ REPORT (as at 31st December 2017)
DEVELOPMENT OF THE ACTIVITY
The year 2017 started with the inauguration of Donald Trump as 45th US president vowing to follow an “America first” policy, and marked some difference in the relationship with key international powers like Russia and China or less aligned countries like North Korea and Iran. European scenario was also dominated by important political events, first with the launch of Brexit process on March 29th, followed by political elections in the key EU countries of France, UK and Germany, with at times rather unexpected outcomes, and by the Catalonia independence referendum of October 1st and the subsequent suspension of autonomy followed by December local elections.
Around the world tensions were also visible in several areas, with North Korea intensification of nuclear tests, crisis in Venezuela and severance of diplomatic ties between Qatar and its Arab neighbors.
Against this backdrop of political uncertainties, the economic scenario was however characterized by rather constant positive trends on both Equity and Fixed Income markets around the world, which recorded the best performance in many years sustained by an ideal scenario of “synchronized global growth”, with no major economy in contraction for the first time since 2008 and a world GDP advancing in the region of 3.5%.
European economy also started to show signs of strength, with positive data on exports and capex, which helped to push the Eur exchange rate back to the levels of end 2015.
Liquidity remained abundant during the year with short term interest rates as well as most Eurozone Government and investment grade Corporate Bonds yields staying well below zero.
The generalized high liquidity and low interest rate environment, in particular in Europe, continued to put pressure on the ability of the banking sector to generate acceptable returns, while the increased attention of regulators towards treatment of non-performing loans required increased attention to capital requirements.
Despite the elements of weakness and risk indicated above, during 2017 Intesa Sanpaolo Bank Luxembourg S.A. (the “Bank”) achieved once again a positive performance, supported by the sizable capital increase and the implementation of its renewed business model concluded in 2017, which allowed to surpass the results achieved in the previous year.
More in detail at the end of 2017 the Bank successfully concluded the implementation of its 2014-2017 business plan with the finalization of few residual activities and further promoted a significant growth of its corporate lending activity. As a result the Bank achieved a more diversified balance sheet structure with a significantly reduced concentration on intra-group transactions as well as a larger contribution from the Corporate and Financial Institutions division to the overall revenues of the Bank, while at the same time maintaining and promoting its private/wealth management and its financial markets activities.
CORPORATE GOVERNANCE
The Bank is 100% owned by Intesa Sanpaolo Holding International S.A., Luxembourg is itself fully owned by Intesa Sanpaolo S.p.A. (“the Parent Company”).
As Parent Company of the Intesa Sanpaolo Banking Group, the Parent Company is responsible, pursuant to the Italian Consolidated Law on Banking, for the management and coordination of the companies belonging to the Banking Group and issues rules as required for the implementation of Bank of Italy instructions in the interest of the Group’s stability. The Group’s subsidiaries must comply with such rules.
For the purpose of application of such rules, the Parent Company has designed reporting procedures between it and its subsidiaries, through which the latter refer.
Intesa Sanpaolo Bank Luxembourg S.A. duly complies with the requirements and provisions set forth by its Parent Company, especially in terms of assessing effective and transparent financial reporting.
The Bank is an issuer under a EUR 70 billion medium term note issuance programme on the Luxembourg Stock Exchange under the guarantee of the Parent Company. The notes issued under this programme by the Bank are of a minimum quota of EUR 100,000.
Information on corporate governance and ownership structures in Italy is required under art. 123-bis of the Italian Consolidated Law on Banking. In compliance with this law, the Parent Company produces a separate report on this matter which can be viewed in the Governance section of the Intesa Sanpaolo website, at www.group.intesasanpaolo.com. The Intesa Sanpaolo Banking Group has also adopted a Corporate Governance Code available on the Borsa Italiana website (under Borsa Italiana/Rules/ Corporate Governance).
In Luxembourg, the Bank has chosen Luxembourg as its origin member country and therefore applies CSSF circular 12/552 as subsequently amended.
The Bank has drawn up a Corporate Governance Policy in accordance with the CSSF Circular 12/552 (as amended), which requires institutions to set out in writing governance central administration arrangements and the internal controls framework.
RISK CONTROL
The risk management process, developed in connection with local requirements and Parent Company guidelines, consists in the identification, analysis and mitigation of major risks of the Bank (compliance and reputational risk, market risks, liquidity risk, credit risk and operational risk). It includes different mitigating controls and structures.

8 ANNUAL REPORT
The Assets/Liabilities Committee monitors the financial risks incurred by the Bank. The Committee performs the supervision of the Bank’s investment strategies, assets/liabilities mismatching, interest rate risk, liquidity risk and the liquidity policy. Its main purpose is to ensure that the risk profiles remain at the sustainable limit fixed for the Bank.
The work of the Assets/Liabilities Committee is directly supported by the Risk Control Function.
The Compliance function identifies, assesses and controls the compliance risks by ensuring adherence to legal and regulatory requirements and ethical principles including AML.
Credit risk is mainly monitored by the Credit Department on a daily basis. A monthly report on Credit Risk is prepared by the Risk Control Function with periodical reporting of the risks to the governance bodies of the Bank.
The Legal Department monitors constantly the legal risks of the Bank and coordinates and monitors activities with external lawyers.
The Internal Audit function evaluates the effectiveness of the Bank’s risk management process and the Internal Control System. It performs various audit missions with relevant reporting of the results and residual risks of the different processes to the Bank’s Management and Corporate bodies.
SUBSIDIARIES AND BRANCHES
The Bank holds only one fully owned subsidiary, Lux Gest Asset Management S.A., Luxembourg, which is active as a management company for investment funds.
The Bank purchased the Intesa Sanpaolo S.p.A. Amsterdam Branch from the Group through a contribution in kind on 1 February 2016.
As a consequence, the Bank operates through its head-office located in Luxembourg-city and through its Branch located in Amsterdam at 31 December 2017.
PERSPECTIVES
As a subsidiary of Intesa Sanpaolo S.p.A., the Bank operates within the worldwide business strategy of the Intesa Sanpaolo Banking Group.
In 2017 the Bank set the base for a further strengthening of its capital base, as follows • approval of the capital increase (TIER 1 capital) of EUR
399,999,835.08 by issuing new shares (1,285,254) without nominal value, having the same rights and privileges of the existing ones;
• acceptance of the subscription of the new shares by the shareholder Intesa Sanpaolo Holding International and acceptance of the full payment by a contribution in cash for such new shares;
• approval of the raising of a Subordinated Loan (TIER 2 capital) of EUR 400,000,000 to be granted by the sole shareholder Intesa Sanpaolo Holding International S.A.
The above inclusion of the above mentioned TIER 1 capital increase in the regulatory capital and the subscription of the Subordinated Loan are still awaiting the relevant approvals from the supervisors, which are expected during the first quarter of 2018 and will allow the Bank to continue promoting the growth of the Corporate banking activity and of its corporate loan portfolio.
DEPOSIT GUARANTEE SCHEME AND RESOLUTION MECHANISM
The Luxembourg Government has transposed in national law the following two European directives on 18 December 2015:• 2014/59• 2014/49which respectively established:• a framework for the recovery and resolution of credit institutions
and investment firms; • a deposit guarantee scheme.
The introduction of the two above mentioned directives had a direct impact on the Bank, which was called to contribute to the Resolution Fund paying an amount of EUR 1,864,287 and to contribute to the FGDL paying an amount of EUR 95,631.
FINANCIAL ELEMENTS FOR 2017
Total assets as at 31 December 2017 stood at EUR 22.2 billion (31 December 2016: EUR 18.0 billion).
Loans and advances to credit institutions (including balances with central banks) amounted to EUR 10.080 billion as at 31 December 2017, showing an increase when compared to 31 December 2016 (EUR 8.4 billion). Loans and advances granted to customers other than credit institutions amounted to EUR 8.7 billion.
Financial assets held for trading are composed of derivative financial instruments measured at their fair value and amounted to EUR 134 million at 31 December 2017 (31 December 2016: EUR 25 million). Those are mainly composed of interest rate swaps and foreign exchange derivative contracts.
Financial assets designated at fair value through profit or loss, which amounted to EUR 12.3 million as at 31 December 2017 (31 December 2016: EUR 16.6 million), are composed of a financial debt instrument purchased to be kept in the Bank’s portfolio but measured at fair value.
Available-for-sale financial assets, which amounted to EUR 3.2 billion (31 December 2016: EUR 2.9 billion), are composed of sovereign debt securities (Italian, Spanish, French and Luxembourgish Government) for an amount of EUR 2.4 billion, debt securities issued by the European Investment Bank for an amount of EUR 0.2 billion and other bonds for an amount of EUR 0.6 billion.
Concerning liabilities, during 2016 Intesa Sanpaolo Bank Luxembourg S.A. participated in the LTRO mechanism with the Luxembourg Central Bank (“BCL”) for an amount of EUR 0.8 billion. To enter into such program, the Bank pledged in favour of the BCL part of its debt instruments kept in its available for sale portfolio which were eligible for such purpose.

ANNUAL REPORT 9
Deposits from customers amounted to EUR 6.6 billion at end of the year (31 December 2016: EUR 5.3 billion). The Bank also issued debt certificates for an amount of EUR 11.1 billion (31 December 2016: EUR 8.5 billion) composed as follows: – certificates of deposit: EUR 4.6 billion (mainly subscribed by
Intesa Sanpaolo Holding International S.A., the Bank’s local parent company);
– non-convertible bonds: EUR 6.5 billion, which are part of a European Commercial Paper program and of the European Medium Term Notes program described herein.
The net profit for the year amounts to EUR 135.5 million (2016: EUR 121.8 million), with a ROE equal to 6.89%. Net interest income amounts to EUR 135.7 million at the end of 2017 (end 2016: EUR 93.9 million). Interest income and expense reflects the corporate lending activity development.
Net fee and commission income is positive and amounts to EUR 51.0 million, showing a significant increase when compared to 2016 (EUR 44.6 million).
Net (un)realised losses on financial assets and liabilities held for trading amount to EUR (84.8) million as at 31 December 2017 (31 December 2016: loss of EUR 5 million). The higher loss compared to last year is mainly due to derivatives contracts unwinded during the year.
Net realised gains on financial assets and liabilities not at fair value through profit or loss amount to EUR 81.0 million as at 31 December 2017 (31 December 2016: gain of EUR 27.9 million) mainly thanks to gains of EUR 57.7 million realised on the sale of several AFS securities and gains of EUR 25.5 million realised on early redeemed intra-group loans as mentioned above.
Total administrative expenses amounted to EUR 38.3 million, higher than the previous year due to projects linked to the Bank new business development.
Provisions booked in relation to current income taxes are linked to the Amsterdam branch; the Luxembourg Head Quarter has not booked any provision in relation to current income taxes due to the fact that the Bank can neutralise its current income taxes by virtue of the application of local rules on the consolidation of taxable results with the ones generated by its direct shareholder in Luxembourg.
However, deferred tax assets and deferred tax liabilities generated by temporary differences have been booked as at 31 December 2017.
The net profit of the year available for distribution, including retained earnings (but excluding First Time Adoption “FTA”) amounts to EUR 135,514,523. The Board of Directors will propose the following allocation of the profit to the Annual General Meeting which will be held to approve the financial statements as at 31 December 2017:
Net profit of 2017 financial year EUR 135,474,318
Retained profit from previous year (excluding first time adoption) EUR 40,205
Amount attributable to shareholders EUR 135,514,523
Allocation to legal reserve EUR 6,773,716
Allocation to other reserves EUR 28,726,284
Dividend for the financial year EUR 100,000,000
Total EUR 135,500,000
Retained profit carried forward to the next financial year (excluding first time adoption) EUR 14,523
SUBSEQUENT EVENTS
The Bank is not aware of any adjusting or non-adjusting event that would have occurred between 31 December 2017 and the date when the present financial statements were authorised for submission by the Board of Directors to the Annual General Meeting of Shareholders.
MISCELLANEOUS
The Bank did not purchase own shares during the year 2017. No research and development costs have been sustained during the year 2017.
CONCLUSION
The Board of Directors is satisfied concerning the profits generated. It thanks the Authorised Management of the Bank for its activity and all the employees for their professional behaviour and the quality of the services provided to the Bank’s clients.
Luxembourg, 7 March 2018

FINANCIALSTATEMENTS
STATEMENT OF FINANCIAL POSITION 11 STATEMENT OF FINANCIAL POSITION 11
The accompanying notes form an integral part of the financial statements.
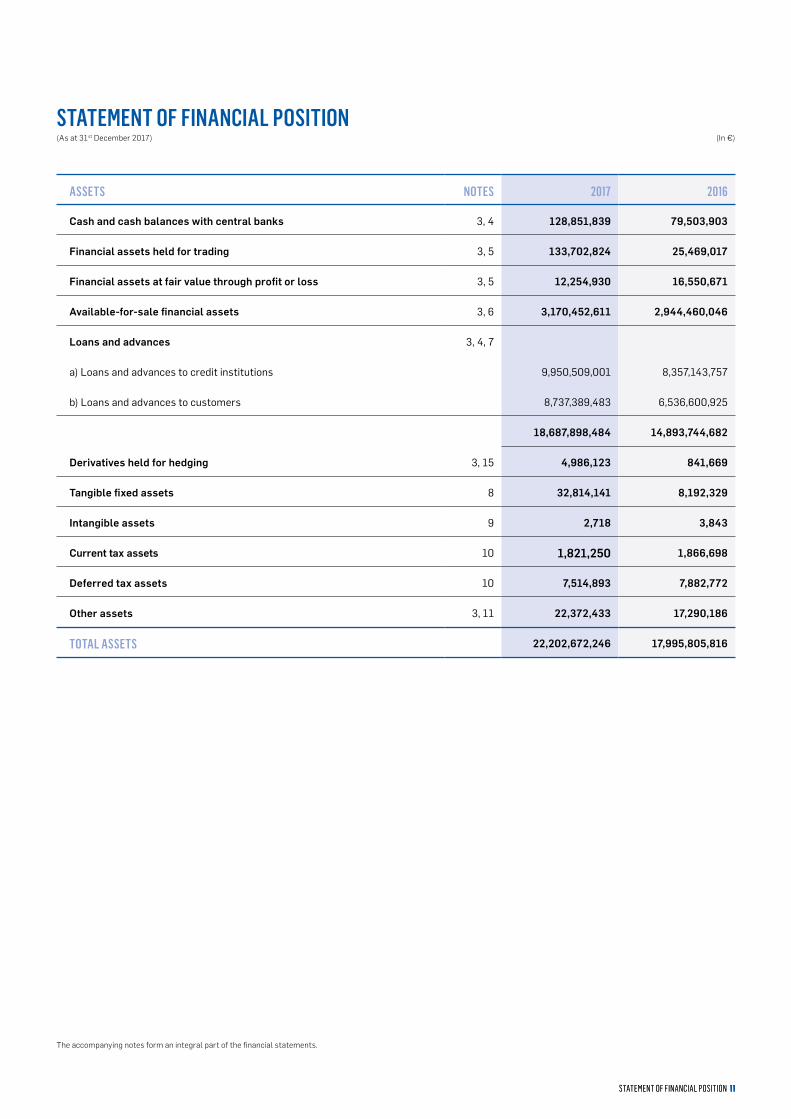
ASSETS NOTES 2017 2016
Cash and cash balances with central banks 3, 4 128,851,839 79,503,903
Financial assets held for trading 3, 5 133,702,824 25,469,017
Financial assets at fair value through profit or loss 3, 5 12,254,930 16,550,671
Available-for-sale financial assets 3, 6 3,170,452,611 2,944,460,046
Loans and advances 3, 4, 7
a) Loans and advances to credit institutions 9,950,509,001 8,357,143,757
b) Loans and advances to customers 8,737,389,483 6,536,600,925
18,687,898,484 14,893,744,682
Derivatives held for hedging 3, 15 4,986,123 841,669
Tangible fixed assets 8 32,814,141 8,192,329
Intangible assets 9 2,718 3,843
Current tax assets 10 1,821,250 1,866,698
Deferred tax assets 10 7,514,893 7,882,772
Other assets 3, 11 22,372,433 17,290,186
TOTAL ASSETS 22,202,672,246 17,995,805,816
(In €)
STATEMENT OF FINANCIAL POSITION(As at 31st December 2017)

12 STATEMENT OF FINANCIAL POSITION
The accompanying notes form an integral part of the financial statements.
(In €)
LIABILITIES AND EQUITY NOTES 2017 2016
Deposits from central banks 3, 12 1,314,049,823 1,316,971,256
Financial liabilities held for trading 3 28,069,191 88,695,094
Financial liabilities at fair value through profit or loss 3, 13 12,124,209 16,065,533
Financial liabilities measured at amortised cost 3, 14
a) Deposits from credit institutions 708,297,280 584,302,635
b) Deposits from customers 6,584,036,715 5,342,660,924
c) Debts evidenced by certificates 11,011,773,964 8,505,566,000
18,304,107,959 14,432,529,559
Derivatives held for hedging 3, 15 47,694,259 97,582,506
Provisions 16 1,679,138 2,544,075
Current tax liabilities 10 4,530,721 2,225,310
Deferred tax liabilities 10 15,605,772 9,819,036
Other liabilities 11 44,655,627 50,057,644
TOTAL LIABILITIES 19,772,516,699 16,016,490,013
Equity 17
Share capital 1,389,370,555 989,370,720
Share premium 7,720,692 7,720,692
Revaluation reserve 20,555,826 4,690,235
Other reserves and retained earnings 877,034,156 855,702,849
Net profit for the year 135,474,318 121,831,307
TOTAL EQUITY 2,430,155,547 1,979,315,803
TOTAL LIABILITIES AND EQUITY 22,202,672,246 17,995,805,816

STATEMENT OF FINANCIAL POSITION 13
The accompanying notes form an integral part of the financial statements.
(In €)
INCOME STATEMENTfor the year ended 31st December 2017
(In €) NOTES 2017 2016
CONTINUING OPERATIONS:
a) Interest income 246,397,102 217,050,066
b) Interest expenses (110,670,458) (123,081,174)
Net interest income 18 135,726,644 93,968,892
a) Fee and commission income 73,878,196 66,165,193
b) Fee and commission expenses (22,871,097) (21,541,885)
Net fee and commission income 19 51,007,099 44,623,308
Dividend income 20 585,971 916,093
Net (un)realised losses on financial assets and liabilities held for trading 21 (84,816,007) (5,185,722)
Net (un)realised losses on financial assets and liabilities at fair value
through profit or loss22 (469,232) (60,114)
Net realised gains on financial assets and liabilities not at fair value
through profit or loss23 81,042,559 27,877,144
a) Other operating income 3,548,244 1,546,129
b) Other operating expenses (9,474,208) (6,813,207)
Net other operating expenses 24 (5,925,964) (5,267,078)
Administrative expenses 25, 31 (38,270,724) (34,904,259)
Depreciation and amortisation 8, 9 (458,547) (613,078)
Provisions 16 --- (74,500)
Net impairment result on financial assets 26 99,316 2,775,931
Tax (expense) income related to profit from continuing operations 10 (3,046,797) (2,225,310)
NET PROFIT FOR THE YEAR 135,474,318 121,831,307

14 STATEMENT OF FINANCIAL POSITION
(In €) 2017 2016
NET PROFIT FOR THE YEAR 135,474,318 121,831,307
OTHER COMPREHENSIVE INCOME
Items that will not be reclassified to profit or loss
Tangible assets 24,513,535 ---
Deferred tax relating to items that will not be reclassified (6,638,265) ---
Items that are or may be reclassified to profit or loss
Net change in fair value on available-for-sale financial assets (2,950,475) (12,664,194)
Deferred tax relating to the components of other comprehensive income 940,796 3,700,478
OTHER COMPREHENSIVE INCOME FOR THE YEAR, NET OF TAX 15,865,591 (8,963,716)
TOTAL COMPREHENSIVE INCOME FOR THE YEAR 151,339,909 112,867,591
The accompanying notes form an integral part of the financial statements.
(In €)
STATEMENT OF PROFIT OR LOSS AND OTHER COMPREHENSIVE INCOMEfor the year ended 31st December 2017

STATEMENT OF FINANCIAL POSITION 15
RESERVES
Issued share capital
Share premium
Revaluation reserves
Legal reserve
Other reserves
Retained earnings
Total Reserve and
retained earnings
Profit of the year before
appropriation Total
Note 17 17 17 17 17 17
BALANCE AS AT 1ST DECEMBER 2016 535,091,520 --- 13,653,951 53,550,000 746,673,309 4,817,576 805,040,885 163,661,965 1,517,448,321
Total comprehensive income --- --- (8,963,716) --- --- --- --- 121,831,307 112,867,591
Transfers and appropriation of prior year’s profit --- --- --- --- 62,660,000 1,965 62,661,965 (62,661,965) ---
Amsterdam Branch Contribution in Kind 4,279,308 7,720,692 --- --- (12,000,000) --- (12,000,000) --- ---
Dividend for the financial year --- --- --- --- --- --- --- (101,000,000) (101,000,000)
Capital decrease --- --- --- --- --- --- --- --- ---
Capital increase 449,999,892 --- --- --- --- --- --- --- 449,999,892
BALANCE AS AT 31ST DECEMBER 2016 989,370,720 7,720,692 4,690,235 53,550,000 797,333,308 4,819,541 855,702,849 121,831,307 1,979,315,803
Total comprehensive income --- --- 15,865,591 --- --- --- --- 135,474,318 151,339,909
Transfers and appropriation of prior year’s profit --- --- --- 6,091,565 15,208,435 31,307 21,331,307 (21,331,307) ---
Dividend for the financial year --- --- --- --- --- --- --- (100,500,000) (100,500,000)
Capital decrease --- --- --- --- --- --- --- --- ---
Capital increase 399,999,835 --- --- --- --- --- --- --- 399,999,835
BALANCE AS AT 31ST DECEMBER 2017 1,389,370,555 7,720,692 20,555,826 59,641,565 812,541,743 4,850,848 877,034,156 135,474,318 2,430,155,547
The accompanying notes form an integral part of the financial statements.
(In €)
STATEMENT OF CHANGES IN EQUITYfor the year ended 31st December 2017
16 STATEMENT OF FINANCIAL POSITION
(In €) NOTES 2017 2016
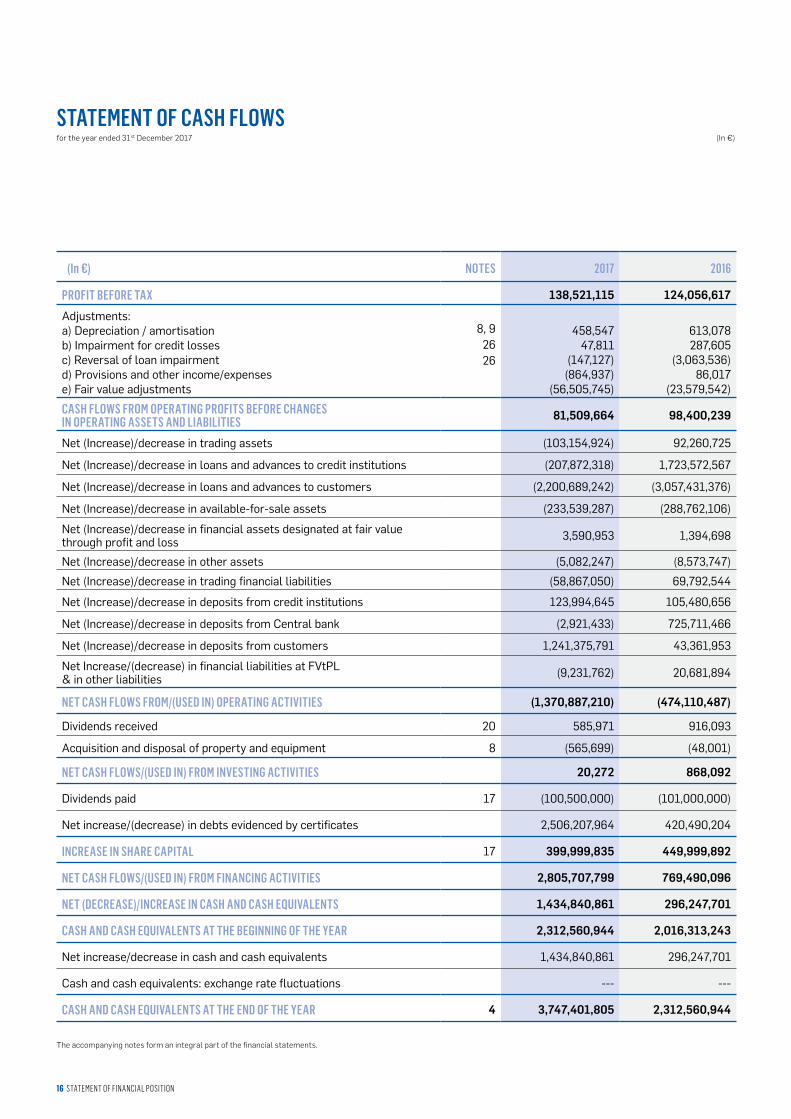
PROFIT BEFORE TAX 138,521,115 124,056,617
Adjustments:a) Depreciation / amortisationb) Impairment for credit lossesc) Reversal of loan impairmentd) Provisions and other income/expensese) Fair value adjustments
8, 92626
458,54747,811
(147,127)(864,937)
(56,505,745)
613,078287,605
(3,063,536)86,017
(23,579,542)
CASH FLOWS FROM OPERATING PROFITS BEFORE CHANGES IN OPERATING ASSETS AND LIABILITIES 81,509,664 98,400,239
Net (Increase)/decrease in trading assets (103,154,924) 92,260,725
Net (Increase)/decrease in loans and advances to credit institutions (207,872,318) 1,723,572,567
Net (Increase)/decrease in loans and advances to customers (2,200,689,242) (3,057,431,376)
Net (Increase)/decrease in available-for-sale assets (233,539,287) (288,762,106)
Net (Increase)/decrease in financial assets designated at fair value through profit and loss 3,590,953 1,394,698
Net (Increase)/decrease in other assets (5,082,247) (8,573,747)
Net (Increase)/decrease in trading financial liabilities (58,867,050) 69,792,544
Net (Increase)/decrease in deposits from credit institutions 123,994,645 105,480,656
Net (Increase)/decrease in deposits from Central bank (2,921,433) 725,711,466
Net (Increase)/decrease in deposits from customers 1,241,375,791 43,361,953
Net Increase/(decrease) in financial liabilities at FVtPL & in other liabilities (9,231,762) 20,681,894
NET CASH FLOWS FROM/(USED IN) OPERATING ACTIVITIES (1,370,887,210) (474,110,487)
Dividends received 20 585,971 916,093
Acquisition and disposal of property and equipment 8 (565,699) (48,001)
NET CASH FLOWS/(USED IN) FROM INVESTING ACTIVITIES 20,272 868,092
Dividends paid 17 (100,500,000) (101,000,000)
Net increase/(decrease) in debts evidenced by certificates 2,506,207,964 420,490,204
INCREASE IN SHARE CAPITAL 17 399,999,835 449,999,892
NET CASH FLOWS/(USED IN) FROM FINANCING ACTIVITIES 2,805,707,799 769,490,096
NET (DECREASE)/INCREASE IN CASH AND CASH EQUIVALENTS 1,434,840,861 296,247,701
CASH AND CASH EQUIVALENTS AT THE BEGINNING OF THE YEAR 2,312,560,944 2,016,313,243
Net increase/decrease in cash and cash equivalents 1,434,840,861 296,247,701
Cash and cash equivalents: exchange rate fluctuations --- ---
CASH AND CASH EQUIVALENTS AT THE END OF THE YEAR 4 3,747,401,805 2,312,560,944
(In €)
STATEMENT OF CASH FLOWSfor the year ended 31st December 2017
The accompanying notes form an integral part of the financial statements.

NOTES TO THE FINANCIAL STATEMENTSNOTES TO THE FINANCIAL STATEMENTS AS AT 31ST DECEMBER 2017

18 NOTES TO THE FINANCIAL STATEMENTS
NOTE 1 – GENERAL INFORMATIONIntesa Sanpaolo Bank Luxembourg S.A. (hereafter the “Bank” or “ISPBL”) was incorporated in Luxembourg on 2 June 1976 as a limited company under Luxembourg Law.
The Extraordinary General Meeting held on 5 October 2015 has changed the name of the Bank from “Société Européenne de Banque S.A.” to “Intesa Sanpaolo Bank Luxembourg S.A.”.
The main activities of the Bank are focused on corporate business, private banking and financial markets activities. Until 6 July 2008, the Bank provided services to investment funds such as central admin-istration, transfer agent and custodian. On 7 July 2008, following a decision of the Extraordinary Shareholders’ Meeting held on 25 June 2008, these activities were transferred for no consideration to another Luxembourg entity of the Intesa Sanpaolo Group. At the same date, private banking and corporate activities were transferred for no consideration from another Luxembourg entity of Intesa Sanpaolo Group to the Bank.
Since 31 December 2012, the Bank prepares consolidated financial statements according to the Transparency Law, as the Bank issues European Medium Term Notes on the Luxembourg stock market and fully controls the company Lux Gest Asset Management S.A. and until 31 March 2013 Intesa Sanpaolo Private Bank (Suisse) S.A.
On 1 February 2016, the Bank purchased the Intesa Sanpaolo S.p.A. Amsterdam Branch (the “Branch”) from the Group through a contribu-tion in kind. For that purpose, 13,750 shares have been issued to Intesa Sanpaolo S.p.A. consisting of EUR 4,279,308.01 to share capital and EUR 7,720,691.99 to share premium in exchange of the Branch.
On 22 September 2016, the Bank performed a capital increase of EUR 449,999,892.27 through the issuance of 1,445,911 shares integrally subscribed by Intesa Sanpaolo Holding International S.A. The sub-scribed capital of the Bank as at 31 December 2016 was therefore of EUR 989,370,720.28, composed of 3,178,983 shares (integrally subscribed).
On 26 October 2017, the Bank performed a capital increase of EUR 399,999,835.08 through the issuance of 1,285,254 shares integrally subscribed by Intesa Sanpaolo Holding International S.A. The sub-scribed capital of the Bank as at 31 December 2017 was therefore of EUR 1,389,370,555.36 composed of 4,464,237 shares (integrally subscribed).
As at 31 December 2017, 100% of the Bank share capital is owned by Intesa Sanpaolo Holding International S.A.
Intesa Sanpaolo Holding International S.A. is fully consolidated in the consolidated financial statements of Intesa Sanpaolo S.p.A. (hereaf-ter the “Group”). Intesa Sanpaolo S.p.A. produces consolidated finan-cial statements available for public use that comply with International Financial Reporting Standards (IFRS) as adopted by the European Union (EU).
The Bank co-operates to a significant extent with its ultimate Parent Company and other entities of the Intesa Sanpaolo Group.
These financial statements were authorised for submission to the Shareholders’ Annual General Meeting by the Bank’s Board of Directors on 16 February 2018.
The registered office of the Bank is: 19-21, boulevard Prince Henri in Luxembourg.
NOTE 2 – SIGNIFICANT ACCOUNTING POLICIES2.1 BASIS OF PREPARATIONThe financial statements are prepared on the historical cost basis except for financial instruments held for trading, for derivatives held for hedging, for financial instruments classified as available-for-sale and for financial assets and liabilities at fair value through profit or loss that are measured at fair value.
2.1.1 STATEMENT OF COMPLIANCEThe financial statements have been prepared in accordance with International Financial Reporting Standards issued by the International Accounting Standards Board (IASB) and the relative interpretations of the International Financial Reporting Interpretations Committee (IFRIC) as adopted for use in the European Union (“IFRS”) and with the going concern principle.
2.2 SIGNIFICANT ACCOUNTING JUDGEMENTS, ESTIMATES AND ASSUMPTIONS
In preparing the financial statements, the Board of Directors is required to make accounting judgements, estimates and assumptions that affect reported income, expenses, assets, liabilities and disclo-sure of contingent assets and liabilities. Use of available information and application of judgement are inherent in the formation of esti-mates. Actual results in the future could differ from such estimates and the differences may be material to the financial statements.
Estimates and underlying assumptions are reviewed on an ongoing basis. Revisions to accounting estimates are recognised in the period in which the estimates are revised and in any future periods affected.
The most significant use of judgements and estimates are as follows:
2.2.1 FAIR VALUE OF FINANCIAL INSTRUMENTS
Fair value is the price that would be received to sell an asset or paid to transfer a liability in an orderly transaction between market partic-ipants at the measurement date in the principal or, in its absence, the most advantageous market to which the Bank has access at that date. The fair value of a liability reflects its non-performance risk.
When available, the Bank measures the fair value of an instrument using the quoted price in an active market for that instrument. A mar-ket is regarded as active if transactions for the asset or liability take place with sufficient frequency and volume to provide pricing informa-tion on an on-going basis.
If there is not quoted price in an active market, then the Bank uses val-uation techniques that maximise the use of relevant observable inputs and minimise the use of unobservable inputs. The chosen valuation techniques incorporate all of the factors that market participants would take into account in pricing a transaction.

NOTES TO THE FINANCIAL STATEMENTS 19
The best evidence of the fair value of a financial instrument at initial recognition is normally the transaction price – i.e. the fair value of the consideration given or received. If the Bank determines that the fair value at initial recognition differs from the transaction price and the fair value is evidenced neither by a quoted price in an active market for an identical asset or liability nor is based on a valuation technique that uses only data from observable markets, then the financial instru-ment is initially measured at fair value, adjusted to defer the differ-ence between the fair value at initial recognition and the transaction price. Subsequently, that difference is recognised in profit or loss on an appropriate basis but no later than when the valuation is wholly supported by observable data or the transaction is closed out.
If an asset or a liability measured at fair value has a bid price and an ask price, then the Bank measures assets and long positions at a bid price and liabilities and short position at an ask price.
Portfolios of financial assets and financial liabilities that are exposed to market risk and credit risk that are managed by the Bank on the basis of the net exposure to either market risk or credit risk are meas-ured on the basis of a price that would be received to sell a net long position (or paid to transfer a net short position) for a particular risk exposure. Those portfolio-level adjustments are allocated to the indi-vidual assets and liabilities on the basis of the relative risk adjustment of each of the individual instruments in the portfolio.
The fair value of a demand deposit is not less than the amount payable on demand, discounted from the first date on which the amount could be required to be paid.
The Bank recognises transfers between levels of the fair value hier-archy as of the end of the reporting period during which the change has occurred.
2.2.2 IMPAIRMENT LOSSES ON LOANS AND ADVANCESThe Bank reviews its non-performing loans and advances at each reporting date to assess whether an allowance for impairment should be recorded in the statement of profit or loss. In particular, judge-ment by the Board of Directors is required in the estimation of the amount and timing of future cash flows when determining the level of allowance required. Such estimates are based on assumptions about a number of factors and actual results may differ, resulting in future changes to the allowance.
2.2.3 VALUATION OF UNQUOTED EQUITY INVESTMENTS (EXCEPT FOR INVESTMENTS IN SUBSIDIARIES)
Valuation of unquoted equity investments is normally based on one of the following:- recent arm’s length transactions;- current fair value of another instrument that is substantially the
same;- expected cash flows discounted at current rates applicable for
items with similar terms and risk characteristics; or- other valuation models.
The determination of the cash flows and discount factors for unquoted equity investments requires significant estimation. The Bank cali-brates the valuation techniques periodically and tests them for valid-ity using either prices from observable current market transactions in the same instrument of from other available observable market data.
2.2.4 IMPAIRMENT OF AVAILABLE-FOR-SALE EQUITY INVESTMENTSThe Bank treats available-for-sale equity investments as impaired when there has been a significant or prolonged decline in the fair
value below its cost or where other objective evidence of impair-ment exists. The determination of what is “significant” or “prolonged” requires judgement. The Bank treats “significant” generally as 20% or more and “prolonged” as greater than 6 months. In addition, the Bank evaluates other factors, including normal volatility in share price for quoted equities and the future cash flows and the discount factors for unquoted equities.
2.2.5 FUNCTIONAL PROPERTY VALUATIONThe Bank started evaluating its functional property at fair value as of 31 December 2017.
Estimating the fair value is a process involving a number of judge-ments and estimates regarding various inputs: the valuation tech-nique, in fact, is based on a model that uses unobservable inputs such as the estimated rental value, the hardcore yield, the rental period.
2.3 CHANGES IN ACCOUNTING POLICIES
Except for the changes below, the Bank has consistently applied accounting policies as set out in Note 2 (d) to all periods presented in these financial statements.
2.3.1 CHANGES TO THE ACCOUNTING STANDARD ON PROPERTYCompared to previous financial statements, in the Annual Report as at 31 December 2017, the Intesa Sanpaolo Group and the Bank have changed the accounting criteria for the disclosure and measurement of the following classes of tangible assets:- functional property and valuable art collections (governed by
IAS 16 “Property, Plant and Equipment);- property held for investment (governed by IAS 40 “Investment
property”).
More specifically, concerning Intesa Sanpaolo Bank Luxembourg S.A., the modifications:- impact its functional property located in Boulevard du Prince
Henri 19-21;- imply the switch from the cost model to revaluation model.
Since its inception, one of Intesa Sanpaolo’s priorities has been the full valorisation of its artistic heritage and property. This heritage consists of valuable works of art and buildings that are both historically and architecturally important.
In preparing the recently approved 2018-2021 Business Plan, Intesa Sanpaolo Group decided to continue re-assessing its artistic and prop-erty (both functional and investment) patrimony in order to align the book value to the current market value, thereby providing users of the financial reports with better information.
It is believed that in this way, and in line with IAS 8 that governs the cases when it is permissible to modify application of the accounting standard, it will be possible to provide reliable and more significant information on the effects of business management and, in a last anal-ysis, the Group’s overall capital-financial position and profit results.
As mentioned, the above amendment, applied from the current finan-cial statements, has led in particular to switch from the cost model to revaluation model.
Usually, voluntary changes to the accounting standards, such as those under discussion, require revaluation of initial balances and the provision of comparative information. However, IAS 8 introduces an
20 NOTES TO THE FINANCIAL STATEMENTS
exception to the usual treatment for this category: more specifically, paragraph 17 of the Standard states that a change in an accounting policy shall be dealt with as a revaluation in accordance with IAS 16 for a revaluation, without requiring any re-exposure of previous positions.
Consequently, in the light of the requirements of IAS 16 on the subject, revaluation of current values resulting from the change in accounting standard has produced capital effects attributable to positive reval-uation to be disclosed in net equity. Please also refer to note 8 for further information on the impact of the implementation of the fair value model on the building.
Considering that the change in the valuation criterion occurred with effect as at 31 December 2017, amortisation for 2017 has been cal-culated using the preceding cost criterion; therefore Intesa Sanpaolo Bank Luxembourg functional property has been amortised up to 31 December 2017. As of 2018, it will be valued using the criterion of revaluation according to IAS 16 and it will continue to be amortised for the useful life.
2.3.2 NEW CURRENTLY EFFECTIVE REQUIREMENTSThe Bank has adopted the following new standards and amendments to standards, including any consequential amendments to other standards, with a date of initial application of 1 January 2017:- Annual Improvements to IFRSs 2014-2016 Cycle;- Recognition of Deferred Tax Assets for Unrealised Losses
(Amendments to IAS 12);- Disclosure initiative (Amendments to IAS 7).
These changes did not to have a material impact on the Bank’s finan-cial statements.
2.3.3 STANDARDS ISSUED BUT NOT YET EFFECTIVEA number of new standards, amendments to standards and inter-pretations are effective for annual periods beginning after 1 January 2018, and earlier application is permitted; however, the Bank has not yet early adopted the following new or amended standards in prepar-ing these financial statements.
- IFRS 9 Financial instruments
Qualitative assessment
IFRS 9, published in July 2014, replaces the existing guidance in IAS 39 Financial Instruments: Recognition and Measurement. IFRS 9 includes revised guidance on the classification and measurement of financial instruments, including a new expected credit loss model for calculating impairment on financial assets, and the new general hedge accounting requirements. It also carries forward the guidance on recognition and derecognition of financial instruments from IAS 39.
IFRS 9 is effective for annual reporting periods beginning on or after 1 January 2018, with early adoption permitted.
The Bank has completed the process of evaluating the potential effect of this standard, jointly with its Head Quarter Intesa Sanpaolo S.p.A. Given the nature of the Bank’s operations, this standard will have a pervasive impact on the Bank’s financial statements.
During 2016 and 2017 qualitative and quantitave assessments have been performed to evaluate IFRS 9 impacts.
Beginning of 2017 the Bank, supported by its Head Quarter, informed CSSF that:
- A parallel run was undertaken starting from 30 June 2017;- No retrospective application will be made;- A debt securities assessment has been performed on a “instru-
ment by instrument” basis;- Bonds carried at Fair value through Other Comprehensive
income failing the Solely Payments of Principal and Interest (SPPI) test mainly refer to:
• Contractually linked instruments which will require the look through test on the underlying pool of financial instruments;
• Constant maturity rate bonds and assets with a structured rate of interest;
• Convertible bonds and leveraged inflation linked instruments; • Instruments whose deferred interest does not accrue addi-
tional interests.- In terms of hedge accounting, the Bank will continue on IAS 39
with carve-out.
With reference to the methodology used to estimate Expected Credit Losses, as at today the Intesa Sanpaolo Banking Group adopts the PD (Probability of Default) x LGD (Loss Given Default) approach for each performing loan portfolio (stages 1 and 2), using 12 month PDs / Lifetime PDs as well as LGDs, without including the so-called “down-turn” factors (no downturn LGDs).
The Group confirmed the adoption of the PD x LGD approach also in relation to the IFRS 9 implementation, even though some different considerations have been developed for specific portfolios or cases.
On the basis of analyses carried out so far, loss allowances on non performing instruments (stage 3) has shown no substantial changes with respect to IAS 39 measurement.
Moreover, the Group decided to include an “add-on” on methodology parameters (PD and LGD) to incorporate multiple scenario impacts on ECL (Expected Credit Losses) and staging calculation and it uses the most likely scenario plus an add-on also to include forward looking information.
Regarding non-trading equity instruments, IFRS 9 contains the pos-sibility to opt (irrevocable decision) for classification at FVTOCI (“Fair Value Through Other Comprehensive Income”). The changes in fair value are recorded in a reserve of net equity and no re-cycling to profit and loss is foreseen, not even in the event of disposal of the instrument. Only the income from dividends will be recorded in profit and loss.
The above mentioned faculty has the following characteristics: • It may be exercised at the level of individual instrument; • It may be exercised on initial disclosure of the instrument; • It is irrevocable; • The changes in fair value recorded in the specific net equity
reserve shall not be subsequently moved to profit (loss) in the period, not even in the event of disposal of the financial instrument.
The Bank has decided to apply that faculty to its participation in Luxgest Asset Management S.A.
Quantitative assessment
In terms of quantitative assessment, an estimation of the initial appli-cation of IFRS 9 has been performed.

NOTES TO THE FINANCIAL STATEMENTS 21
The total estimated adjustment to the opening balance of the Bank’s equity at 1 January 2018 amounts to EUR 21 million. The principal component of the estimated adjustment is the new IFRS 9 loss allow-ance calculated in relation to on balance sheet captions and off bal-ance sheet ones.
Classification – financial assetsIFRS 9 contains a new classification and measurement approach for financial assets that reflects the business model in which assets are managed and their cash flow characteristics.
IFRS 9 containes three principal classification categories for financial assets:- Measured at amortized cost;- FVOCI (“Fair Value through Other Comprehensive Income”);- FVTPL (“Fair Value through Profit and Loss”).
The standard eliminated the existing IAS 39 categories of held to maturity, loans and receivables and available for sale.
Under IFRS 9 derivative embedded in contracts where the host is a financial asset in the scope of the standard are never bifurcated. Instead, the hybrid financial instrument as a whole is assessed for classification.
Based on its assessment, the Bank does not believe that the new clas-sification requirements will have a material impact on its accounting for trade receivables, loans, investments in debt securities and invest-ments in equity securities that are managed on a fair value basis.
The following table presents IFRS 9 impacts in terms of financial instruments presentation as at 1 January 2018:
PER IAS 39 PER IFRS 9
CLASSIFI- CATION
CARRYING AMOUNT
FV P&L HFT FV P&L MANDATORY
FV P&L (FVO) FV OCI AMORTIZED COST
ASSETS
Loans & Advances
HFT --- --- --- --- --- ---
FV P&L (FVO) --- --- --- --- --- ---
AFS --- --- --- --- --- ---
L&R 18.657.830.018 --- --- --- --- 18.657.830.018
HTM --- --- --- --- --- ---
Debt securities
HFT --- --- --- --- --- ---
FV P&L (FVO) 12.254.930 --- --- 12.254.930 --- ---
AFS 3.169.512.120 --- --- --- 3.169.512.120 ---
L&R 30.068.466 --- --- --- --- 30.068.466
HTM --- --- --- --- --- ---
Equity instruments (excluding funds)
HFT --- --- --- --- --- ---
FV P&L (FVO) --- --- --- --- --- ---
AFS 940.491 --- --- 729.306 211.185 ---
Funds (collective investment undertakings)
HFT --- --- --- --- --- ---
FV P&L (FVO) --- --- --- --- --- ---
AFS --- --- --- --- --- ---
Trading derivatives HFT 133.702.824 --- 133.702.824 --- --- ---
TOTAL 22.004.308.849 --- 133.702.824 12.984.236 3.169.723.305 18.687.898.484
LIABILITIESTrading derivatives HFT 28.069.191 --- 28.069.191 --- --- ---
Financial liabilities measured at AC
19.618.157.782 --- --- --- --- 19.618.157.782
Financial liabilities measured at FV
12.124.209 --- --- 12.124.209 --- ---
TOTAL 19.658.351.182 --- 28.069.191 12.124.209 --- 19.618.157.782

22 NOTES TO THE FINANCIAL STATEMENTS
Impairment – financial assetsIFRS 9 replaces the “incurred loss” model in IAS 39 with a forward –looking “expected credit loss” (ECL) model. This will require consider-able judgement about how changes in economic factors affect ECLs, which will be determined on a probability-weighted basis.
The new impairment model will apply to financial assets measured at amortised cost or FVOCI, except for investments in equity instru-ments, and to contract assets.
Under IFRS 9, loss allowances will be measured on either of the fol-lowing basis:
- 12-month ECLs: these are ECLs that result from a possible default events within the 12 months after the reporting date;
- Lifetime ECLs: these are ECLs that result from all possible default events over the expected life of a financial instrument.
Lifetime ECL measurement applies if the credit risk of a financial assets at the reporting date has increased significantly since initial recognition and 12-month ECL measurement applies if it has not.
Based on the impairment methodology described, the Bank has estimated that application of IFRS 9’s impairment requirements at 1 January 2018 results in additional impairment losses as follows:
The following table presents, IFRS 9 impacts in terms of equity adjust-ments as at 1 January 2018:
EXPOSURE PER IAS 39
LOSS ALLOWANCE PER IAS 39 / IAS 37
LOSS ALLOWANCE
PER IFRS 9
STAGE 1%
STAGE 2%
STAGE 3%
Carrying amount (net of IAS 39 loss
allowance)
Total % (shall be 100,00%)
Debt securities at amortized cost 29,543,648 --- 45,103 100% --- --- 100,00%
Debt securities in AFS at FV OCI 3,169,512,120 --- 1,707,707 70% 30% --- 100,00%
Loans and advances at amortized cost 18,658,354,836 242,884 18,018,904 58% 42% --- 100,00%
Loans and advances in AFS at FV OCI --- --- --- --- --- --- 0,00%
Nominal amount
Off-balance sheet exposures 7,672,819,487 --- 1,594,970 54% 46% --- 100,00%
of which: loan commitments given - uncommitted 3,554,906,654 --- 10,264 81% 19% --- 100,00%
of which: loan commitments given - committed
3,734,678,250 --- 1,037,645 64% 36% --- 100,00%
of which: financial guarantees given
383,234,583 --- 547,062 34% 66% --- 100,00%
TOTAL 29,530,230,091 242,884 21,366,684 59% 41% ---
ESTIMATED IMPACT OF ADOPTION OF IFRS 9
(In €) AS REPORTED AT 31 DECEMBER 2017
ESTIMATEDADJUSTMENTS
DUE TOADOPTION OF
IFRS 9
ESTIMATEDADJUSTED
OPENINGBALANCE AT
1 JANUARY 2018
Reserves (including revaluation reserves) 892,739,134 21,366,684 914,105,818
Retained Earnings 4,850,848 --- 4,850,848
Share capital and premium 1,397,091,247 --- 1,397,091,247
TOTAL 2,294,681,229 21,366,684 2,316,047,913

NOTES TO THE FINANCIAL STATEMENTS 23
The following analysis provides further detail about this estimated impact at 1 January 2018.
Loans and advances at amortised cost
In general, the methodogical framework developed to calculate all the parameters used in the ECL formula is based on the one supporting the AIRB (“Advanced Internal Rating-Based”) model.
The Internal rating systems developed by ISP Group represent the base used to develop the IFRS 9 models and they have been adapted to fulfil the accounting principle requirements. In fact, risk parameters used to calculate ECL under IFRS 9 requirements are based on the “Point in time” approach, which gives the opportunity to capture all the available information of a counterparty.
It has been estimated that the application of IFRS 9’s impairment requirements at 1 January 2018 results in an increase of EUR 19.6 million over the impairment recognised under IAS 39.
The above published tabled shows that 58% of loans and advances were subject to 12-month ECL, while 42% to lifetime ECL. No loans and advances have been identified falling in stage 3 category.
Debt securities
The Bank monitors changes in credit risk by tracking published exter-nal credit ratings.
It has been estimated that the application of IFRS 9’s impairment requirements as at 1 January 2018 results in a increase in of EUR 1.7 million over the impairment recognised under IAS 39.
The above published table shows that 70% of debt securities were subject to 12-month ECL, while 30% to lifetime ECL.
IFRS 15 Revenue from Contracts with customers
IFRS 15 establishes a comprehensive framework for determining whether, how much and when revenue is recognised. It replaces exist-ing revenue recognition guidance, including IAS 18 Revenue, IAS 11 Construction Contracts and IAS 13 Customer Loyalty Programmes.
An entity shall apply this Standard to all contracts with customers, except the following:- Lease contacts within the scope of IFRS 16 Leases;- Insurance contracts within the scope of IFRS 4 Insurance
Contracts;- Financial instruments and other contractual rights or obliga-
tions within the scope of IFRS 9 Financial Instruments, IFRS 10 Consolidated Financial Statements, IFRS 11 Joint Arrangements, IAS 27 Separate Financial Statements and IAS 28 Investment in Associates and Joint Ventures: and
- Non-monetary exchanges between entities in the same line of business to facilitate sales to customers or potential customers.
The core principle of IFRS 15 is that an entity recognises revenue to depict the transfer of promised goods and services to customers in an amount that reflects the consideration to which the entity expects to be entitled in exchange for those goods or services. An entity rec-ognises revenue in accordance with the core principle by applying the following steps:
- Step 1: Identify the contract(s) with a customer;- Step 2: Identify the performance obligation of the contract;- Step 3: Determine the transaction price;- Step 4: Allocate the transaction price to the performance obli-
gations in the contract;- Step 5: Recognise revenue when (or as) the entity satisfies a
performance obligation.
During 2017 the Bank has performed a qualitative and quantitative assessment to identify any impact generated by IFRS 15 implemen-tation developing a dedicated gap analysis and evaluation of impacts.
The analysis has been developed based on the following steps:
1. Identification of accounts and amounts to be analysed: a. Goal: identification of main revenues in scope; b. Approach: selection of accounts that could be impacted by
the new framework;2. Documentation of the revenue recognition: a. Approach: Feed a proper check-list collecting all the infor-
mation related to accounts identified; 3. Identification of any potential issue to be analysed: a. Goal: analysis of potential issues; b. Approach: if issues were identified, information to be filled
in the check-list and;4. Identification of revenues which recognition may vary: a. Goal: determination of IFRS 15 impacts.
1. Identification of accounts and amounts to be analysedThe following captions have been taken into consideration to be analysed:
Fees and commission income- Commission income on guarantees given;- Commission income on commitments;- Commission income on credit structuration and syndication;- Commission income on collection of payment services;- Commission income on dealing in financial instruments;- Commission income on portfolio management;- Commission income on custody and administration of securities;- Commission income on depositary bank;- Commission income on placement of securities;- Commission income on factoring transactions;- Commission income on other services.
Other operating revenue- Brokerage profits.
2. Documentation of the revenue recognitionAll the relevant accounts identified have been analysed on the base of above listed five steps. Each step has been divided into specific ques-tions in oder to identify any important characteristic to be taken into consideration when implementing IFRS 15.
3. Identification of any issue to be analysedNo issues have been identified.
4. Identification of revenues for which recognition may varyNo changes in revenue recognition have been identified.
IFRS 15 is effective for annual reporting periods beginning on or after 1 January 2018, with early adoption permitted.
24 NOTES TO THE FINANCIAL STATEMENTS
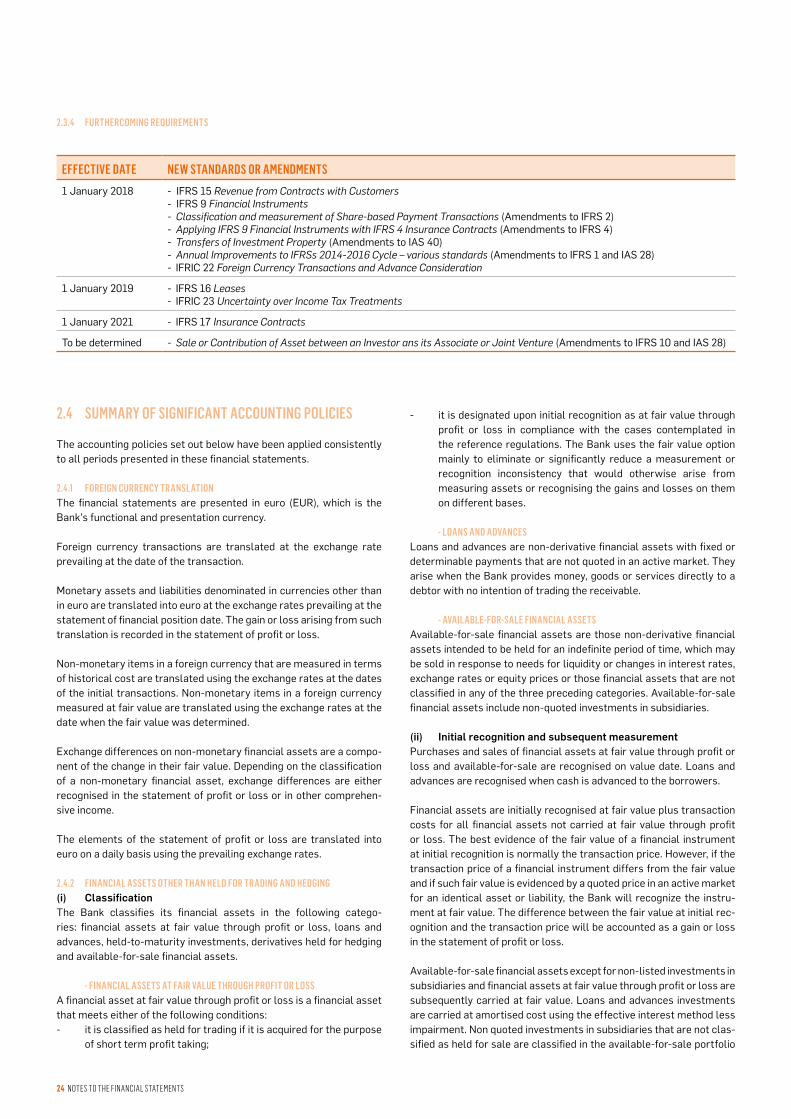
2.3.4 FURTHERCOMING REQUIREMENTS
2.4 SUMMARY OF SIGNIFICANT ACCOUNTING POLICIES
The accounting policies set out below have been applied consistently to all periods presented in these financial statements.
2.4.1 FOREIGN CURRENCY TRANSLATIONThe financial statements are presented in euro (EUR), which is the Bank’s functional and presentation currency.
Foreign currency transactions are translated at the exchange rate prevailing at the date of the transaction.
Monetary assets and liabilities denominated in currencies other than in euro are translated into euro at the exchange rates prevailing at the statement of financial position date. The gain or loss arising from such translation is recorded in the statement of profit or loss.
Non-monetary items in a foreign currency that are measured in terms of historical cost are translated using the exchange rates at the dates of the initial transactions. Non-monetary items in a foreign currency measured at fair value are translated using the exchange rates at the date when the fair value was determined.
Exchange differences on non-monetary financial assets are a compo-nent of the change in their fair value. Depending on the classification of a non-monetary financial asset, exchange differences are either recognised in the statement of profit or loss or in other comprehen-sive income.
The elements of the statement of profit or loss are translated into euro on a daily basis using the prevailing exchange rates.
2.4.2 FINANCIAL ASSETS OTHER THAN HELD FOR TRADING AND HEDGING(i) ClassificationThe Bank classifies its financial assets in the following catego-ries: financial assets at fair value through profit or loss, loans and advances, held-to-maturity investments, derivatives held for hedging and available-for-sale financial assets.
- FINANCIAL ASSETS AT FAIR VALUE THROUGH PROFIT OR LOSSA financial asset at fair value through profit or loss is a financial asset that meets either of the following conditions: - it is classified as held for trading if it is acquired for the purpose
of short term profit taking;
- it is designated upon initial recognition as at fair value through profit or loss in compliance with the cases contemplated in the reference regulations. The Bank uses the fair value option mainly to eliminate or significantly reduce a measurement or recognition inconsistency that would otherwise arise from measuring assets or recognising the gains and losses on them on different bases.
- LOANS AND ADVANCESLoans and advances are non-derivative financial assets with fixed or determinable payments that are not quoted in an active market. They arise when the Bank provides money, goods or services directly to a debtor with no intention of trading the receivable.
- AVAILABLE-FOR-SALE FINANCIAL ASSETSAvailable-for-sale financial assets are those non-derivative financial assets intended to be held for an indefinite period of time, which may be sold in response to needs for liquidity or changes in interest rates, exchange rates or equity prices or those financial assets that are not classified in any of the three preceding categories. Available-for-sale financial assets include non-quoted investments in subsidiaries.
(ii) Initial recognition and subsequent measurementPurchases and sales of financial assets at fair value through profit or loss and available-for-sale are recognised on value date. Loans and advances are recognised when cash is advanced to the borrowers.
Financial assets are initially recognised at fair value plus transaction costs for all financial assets not carried at fair value through profit or loss. The best evidence of the fair value of a financial instrument at initial recognition is normally the transaction price. However, if the transaction price of a financial instrument differs from the fair value and if such fair value is evidenced by a quoted price in an active market for an identical asset or liability, the Bank will recognize the instru-ment at fair value. The difference between the fair value at initial rec-ognition and the transaction price will be accounted as a gain or loss in the statement of profit or loss.
Available-for-sale financial assets except for non-listed investments in subsidiaries and financial assets at fair value through profit or loss are subsequently carried at fair value. Loans and advances investments are carried at amortised cost using the effective interest method less impairment. Non quoted investments in subsidiaries that are not clas-sified as held for sale are classified in the available-for-sale port folio
EFFECTIVE DATE NEW STANDARDS OR AMENDMENTS
1 January 2018 - IFRS 15 Revenue from Contracts with Customers- IFRS 9 Financial Instruments- Classification and measurement of Share-based Payment Transactions (Amendments to IFRS 2)- Applying IFRS 9 Financial Instruments with IFRS 4 Insurance Contracts (Amendments to IFRS 4)- Transfers of Investment Property (Amendments to IAS 40)- Annual Improvements to IFRSs 2014-2016 Cycle – various standards (Amendments to IFRS 1 and IAS 28)- IFRIC 22 Foreign Currency Transactions and Advance Consideration
1 January 2019 - IFRS 16 Leases- IFRIC 23 Uncertainty over Income Tax Treatments
1 January 2021 - IFRS 17 Insurance Contracts
To be determined - Sale or Contribution of Asset between an Investor ans its Associate or Joint Venture (Amendments to IFRS 10 and IAS 28)

NOTES TO THE FINANCIAL STATEMENTS 25
and are accounted for at cost less impairment. Gains and losses aris-ing from changes in the fair value of the financial assets measured at fair value through profit or loss are included in the statement of profit and loss in the period in which they arise. Gains and losses arising from changes in the fair value of available-for-sale financial assets are recognised directly in other comprehensive income, until the financial asset is derecognised or impaired at which time the cumulative gain or loss previously recognised in equity is recognised in the statement of profit or loss.
However, interest calculated using the effective interest method is recognised in the statement of profit or loss.
(iii) DerecognitionA financial asset (or, where applicable, a part of a financial asset or part of a group of similar financial assets) is derecognised when:- the rights to receive cash flows from the asset have expired; or- the Bank retains the right to receive cash flows from the asset,
but has assumed an obligation to pay them in full without mate-rial delay to a third party under a “pass-through” arrangement; or
- the Bank has transferred its rights to receive cash flows from the asset and either (a) has transferred substantially all the risks and rewards of the asset, or (b) has neither transferred nor retained substantially all the risks and rewards of the asset, but has transferred control of the asset.
When the Bank has transferred its rights to receive cash flows from an asset and has neither transferred nor retained substantially all the risks and rewards of the asset nor transferred control of the asset, the asset is recognised to the extent of the Bank’s continuing involvement in the asset. Continuing involvement that takes the form of a guaran-tee over the transferred asset is measured at the lower of the original carrying amount of the asset and the maximum amount of considera-tion that the Bank could be required to repay.
When continuing involvement takes the form of a written and/or pur-chased option (including a cash settled option or similar provision) on the transferred asset, the extent of the Bank’s continuing involvement is the amount of the transferred asset that the Bank may repurchase, except that in the case of a written put option (including a cash set-tled option or similar provision) on an asset measured at fair value, the extent of the Bank’s continuing involvement is limited to the lower of the fair value of the transferred asset and the option exercise price.
2.4.3 FINANCIAL LIABILITIES OTHER THAN HELD FOR TRADING AND HEDGING(i) ClassificationThe Bank classifies its financial liabilities other than derivatives in the following categories: financial liabilities measured at amortised cost and financial liabilities at fair value through profit or loss. The Bank uses the fair value option either when:- it eliminates or significantly reduces a measurement or recog-
nition inconsistency that would otherwise arise from measuring liabilities or recognise the gains and losses on them on different bases; or
- a group of financial liabilities is managed and its performance is evaluated on a fair value basis, in accordance with a docu-mented risk management or investment strategy, and informa-tion about the Bank is provided internally on that basis to the entity’s key management personnel.
(ii) Initial recognition and subsequent measurementInterest-bearing liabilities – other than financial liabilities at fair value through profit or loss – are recognised initially at fair value less attributable transaction costs. Subsequent to initial recognition,
interest-bearing liabilities are stated at amortised cost using the effective interest method. Gains and losses are recognised in the statement of profit or loss when the liabilities are derecognised as well as through the amortisation process.
Financial liabilities at fair value through profit or loss are measured at fair value through the statement of profit or loss.
(iii) DerecognitionA financial liability is derecognised when the obligation under the lia-bility is discharged or cancelled or expires.
When an existing financial liability is replaced by another from the same lender on substantially different terms, or the terms of an exist-ing liability are substantially modified, such an exchange or modifica-tion is treated as a derecognition of the original liability and the recog-nition of a new liability, and the difference in the respective carrying amounts is recognised in the statement of profit or loss.
- DERIVATIVE FINANCIAL INSTRUMENTS(i) ClassificationDerivatives, including separated embedded derivatives, are classified as held for trading unless they are designated as effective hedging instruments or a financial guarantee contract. Gains and losses on investments held for trading are recognised in the statement of profit or loss.
The Bank assesses whether embedded derivatives are required to be separated from the host contracts when the Bank becomes party to the contract. Reassessment only occurs when:- their economic characteristics and risks are not closely related
to the characteristics of the host contract;- embedded instruments, even though separate, fully meet the
definition of derivative;- combined instruments are not measured at fair value with
changes in fair value recognised through profit or loss.
An exception relates to call, put, prepayment options embedded in a host loan, where the exercise price compensates the lender for loss of interest by reducing the economic loss from re-investment risk.
Such a type of embedded derivatives is closely related to the host con-tract in either of the following scenarios:- The exercise price of the option is approximately equal on each
exercise date to the amortised cost of the host loan instrument;- The exercise price of the prepayment option reimburses the
lender for an amount up to the approximate present value of lost interest for the remaining term of the host contract. Lost inter-est is the product of the principal amount prepaid, multiplied by the interest rate differential, which is the excess of the effective interest rate of the host contract over the effective interest rate that the lender would receive at the prepayment date if it re-in-vested the principal amount prepaid in a similar contract for the remaining term of the host contract.
(ii) Initial recognition and subsequent measurementDerivative financial instruments are recognised initially at fair value. Subsequent to initial recognition, derivative financial instruments are restated at fair value. The method of recognising the resulting fair value gain or loss depends on whether the derivatives are designated as a hedging instrument, and if so, the nature of the risk being hedged.
Derivatives are carried as assets when their fair value is positive and as liabilities when their fair value is negative.

26 NOTES TO THE FINANCIAL STATEMENTS
Any embedded derivatives in combined financial instruments not directly connected to the latter and with the characteristics to meet the definition of derivative are recorded separately from the host con-tract at fair value.
(iii) TradingDerivatives that do not qualify for hedge accounting are accounted for as trading instruments. The gain or loss on remeasurement to fair value of trading derivatives is recognised immediately in the state-ment of profit and loss.
(iv) HedgingThe Bank may use derivative financial instruments to hedge its expo-sure to foreign exchange and interest rate risks arising from opera-tional, financing and investment activities. Where there is a hedging relationship between a derivative instrument and a related item being hedged, the hedging instrument is measured at fair value. The treat-ment of any resulting gains and losses is set out below.
On initial designation of the hedge, the Bank formally documents:- the relationship between the hedging instruments and the
hedged items;- the risk management objectives and strategies in undertaking
the hedge;- the method that will be used to assess the effectiveness of the
hedging relationship.
The Bank makes an assessment, both at inception of the hedge rela-tionship and on a on-going basis, of whether the hedging instruments are expected to be highly effective in offsetting the changes in the fair value or cash flows of the respective hedged items during the period for which the hedge is designated, and whether the actual results of each hedge are within the range of 80% - 125%.
For the purpose of hedge accounting, the Bank has classified hedges as fair value hedges.
- FAIR VALUE HEDGESThe change in the fair value of a hedging derivative is recognised in the statement of profit or loss. The change in the fair value of the hedged item attributable to the hedged risk is recorded as a part of the carry-ing value of the hedged item and is also recognised in the statement of profit or loss.
For fair value hedges relating to items carried at amortised cost, the adjustment to carrying value is amortised through the statement of profit or loss over the remaining term to maturity. Any adjustment to the carrying amount of a hedged financial instrument for which the effective interest rate method is used, is amortised through the state-ment of profit or loss.
Amortisation may begin as soon as an adjustment exists and shall begin no later than when the hedged item ceases to be adjusted for changes in its fair value attributable to the risk being hedged. If the hedged item is derecognised, the unamortised fair value is recognised immediately in the statement of profit or loss.
When an unrecognised firm commitment is designated as a hedged item, the subsequent cumulative changes in the fair value of the firm commitment attributable to the hedged risk is recognised as an asset or liability with a corresponding gain or loss recognised in the state-ment of profit or loss. The changes in the fair value of the hedging instrument are also recognised in the statement of profit or loss.
(v) DerecognitionDerivatives are derecognised when the rights and obligations under the instrument are discharged, cancelled or expired.
2.4.5 FINANCIAL GUARANTEE CONTRACTS AND LOAN COMMITMENT Financial guarantee contracts issued by the Bank are those contracts that require a payment to be made to reimburse the holder for a loss it incurs because the specified debtor fails to make a payment when due in accordance with the terms of a debt instrument.
Loan commitments are firm commitments to provide loans or advances under pre-specified terms and conditions.
Financial guarantee contracts and loan commitments are recognised in off balance sheet.
The Bank recognises loan commitments when it has fulfilled all its obligations and related contracts have been duly signed by all the counterparties involved.
2.4.6. REPURCHASE AGREEMENTS AND REVERSE REPURCHASE AGREEMENTSThe Bank enters into purchases (sales) of investments under agree-ments to resell (repurchase) substantially identical investments at a certain date in the future at a fixed price. Investments purchased sub-ject to commitments to resell them at future dates are not recognised. The amounts paid are recognised in loans to either banks or custom-ers. The advances are shown as collateralised by the underlying secu-rity. Investments sold under repurchase agreements continue to be recognised in the statement of financial position and are measured in accordance with the accounting policy of the category to which they relate. The proceeds from the sale of the investments are reported as liabilities to either banks or customers.
The difference between the sale and repurchase considerations is recognised on an accrual basis over the period of the transaction and is included in interest.
2.4.7. OFFSETTINGFinancial assets and liabilities are offset and the net amount is reported in the statement of financial position when the Bank has a legally enforceable right to offset the recognised amounts and the transactions are intended to be settled on a net basis or realise the asset and settle the liability simultaneously.
2.4.8 IMPAIRMENT OF FINANCIAL ASSETSThe Bank assesses at each reporting date whether a financial asset or group of financial assets is impaired. An impairment loss is recog-nised whenever the carrying amount of an asset exceeds its recover-able amount. Impairment losses are recognised in the statement of profit or loss.
Indicators of impairment include:- significant financial difficulty of the issuer or obligor;- a breach of contract, such as a default or delinquency in interest
or principal payments;- the Bank has granted to the borrower, for economic or legal rea-
sons relating to the borrower’s financial difficulty, a concession that the lender would not otherwise consider;
- it is becoming probable that the borrower will enter bankruptcy or other financial reorganisation;
- the disappearance of an active market for that financial asset because of financial difficulties.

NOTES TO THE FINANCIAL STATEMENTS 27
In addition, objective evidence of impairment for an investment in an equity instrument includes information about significant changes with an adverse effect that have taken place in the technological, market, economic or legal environment in which the issuer operates, and indi-cates that the cost of the investment in the equity instrument may not be recovered. A significant or prolonged decline in the fair value of an investment in an equity instrument below its cost is also objective evidence of impairment.
The recoverable amount of the Bank’s investments in held-to-matu-rity securities and loans and advances carried at amortised cost is estimated as the present value of estimated future cash flows, dis-counted at the original effective interest rate (i.e. the effective inter-est rate computed at initial recognition of these financial assets). Advances with a short duration are not discounted.
The carrying amount of the asset is reduced through the use of an allowance account and the amount of the loss is recognised in the statement of profit or loss. If, in a subsequent period, the amount of the impairment loss decreases and the decrease can be related objectively to an event occurring after the impairment was recognised (such as an improvement in the debtor’s credit rating), the previously recognised impairment loss is reversed by adjusting the allowance account. The amount of the reversal is recognised in the statement of profit or loss.
An impairment loss in respect of an investment in an equity instru-ment classified as available-for-sale is not reversed through the statement of profit or loss. If the fair value of a debt instrument clas-sified as available-for-sale increases and the increase can be objec-tively related to an event occurring after the impairment loss was rec-ognised in the statement of profit or loss, the impairment loss shall be reversed, with the amount of the reversal recognised in the statement of profit or loss.
In addition, the Bank proceeds with an estimation of a potential col-lective impairment allowance against exposures which, although not specifically identified as requiring a specific allowance, have a greater risk of default than when originally granted. This takes into considera-tion factors such as deterioration in country risk, industry and techno-logical obsolescence, as well as identified structural weaknesses or deterioration in cash flows.
2.4.9 TANGIBLE AND INTANGIBLE FIXED ASSETSFunctional property is stated at fair value less accumulated deprecia-tion and accumulated impairment losses since 31 December 2017 and was accounted at cost less accumulated depreciation and accumu-lated impairment losses until that date.
Items of plant and equipment are stated at cost less accumulated depreciation and accumulated impairment losses. The cost of self-constructed assets includes the cost of materials, direct labour, the initial estimate, where relevant, of the costs of dismantling and removing the items and restoring the site on which they are located, and an appropriate proportion of production overheads.
Intangible assets are included at purchase price or production cost, less accumulated amortisation.
Depreciation is charged to the statement of profit or loss on a straight-line basis over the estimated useful lives of each part of an item of property, plant and equipment. Where parts of an item of property, plant and equipment have different useful lives, they are accounted
for as separate items of property, plant and equipment. Land is not depreciated. The estimated useful lives are as follows (on a straight-line basis):- buildings 40 years- transformation costs 5-10 years- fixtures and fittings 5 years- softwares 1-5 years
An item of property, plant and equipment is derecognised upon dis-posal or when no future economic benefits are expected from its use or disposal. Any gain or loss arising on derecognition of the asset is included in the statement of profit or loss in the year the asset is derecognised. The asset’s residual value, if not insignificant, and use-ful lives and methods of depreciation are reviewed and adjusted, if appropriate, at each financial year-end.
The Bank recognises the cost of replacing part of a property, plant and equipment item at incurrence in the carrying amount of this item if that cost is incurred if it is probable that the future economic benefits embodied with the item will flow to the Bank and the cost of the item can be measured reliably. All other costs are recognised in the state-ment of profit or loss as an expense as incurred.
2.4.10 OTHER ASSETSThis caption includes assets such as prepaid charges, accrued income or unearned income.
Other assets are stated at cost less impairment.
2.4.11 IMPAIRMENT OF NON-FINANCIAL ASSETSThe Bank assesses at each reporting date whether there is an indi-cation that an asset may be impaired. If any such indication exists, or when annual impairment testing for an asset is required, the Bank estimates the asset’s recoverable amount. An asset’s recoverable amount is the higher of an asset’s or cash-generating unit’s fair value less costs to sell and its value in use and is determined for an individ-ual asset, unless the asset does not generate cash inflows that are largely independent of those from other assets or groups of assets. Where the carrying amount of an asset exceeds its recoverable amount, the asset is considered impaired and is written down to its recoverable amount. In assessing value in use, the estimated future cash flows are discounted to their present value using a pre-tax dis-count rate that reflects current market assessments of the time value of money and the risks specific to the asset. These calculations are corroborated by valuation multiples, quoted share prices for publicly traded subsidiaries or other available fair value indicators.
Impairment losses of continuing operations are recognised in the statement of profit or loss in those expense categories consistent with the function of the impaired asset, except, if any, for property previously revalued where the revaluation was taken to equity. In this case the impairment is also recognised in equity up to the amount of any previous revaluation.
For assets, an assessment is made at each reporting date as to whether there is any indication that previously recognised impairment losses may no longer exist or may have decreased. If such indication exists, the Bank makes an estimate of the recoverable amount. A pre-viously recognised impairment loss is reversed only if there has been a change in the estimates used to determine the asset’s recoverable amount since the last impairment loss was recognised. If that is the case the carrying amount of the asset is increased to its recoverable amount. That increased amount cannot exceed the carrying amount

28 NOTES TO THE FINANCIAL STATEMENTS
that would have been determined, net of depreciation, had no impair-ment loss been recognised for the asset in prior years. Such rever-sal is recognised in the statement of profit or loss unless the asset is carried at revalued amount, in which case the reversal is treated as a revaluation increase.
2.4.12 CASH AND CASH EQUIVALENTSCash and short-term deposits in the statement of financial position comprise cash at banks and on hand and short-term deposits with an original maturity of three months or less.
Cash and cash equivalents include the following reserve: credit insti-tutions established in Luxembourg are required to hold minimum reserves with the Luxembourg Central Bank. These deposits repre-sent 2% of some of their liabilities and are considered as not available. Compliance with the reserve requirement is determined on the basis of the institutions’ average daily reserve holdings over the mainte-nance period, thus reserves of credit institutions can vary from one day to another following their treasury management, the money mar-ket or their expectations in interest rates.
2.4.13 EMPLOYEE BENEFITSEmployee benefits are all forms of consideration given by an entity in exchange for service rendered by employees or for the termination of employment.
Short-term employee benefits are employee benefits (other than termination benefits) that are expected to be settled wholly before twelve months after the end of the annual reporting period in which the employees render the related service. They include:- wages, salaries and social security contributions; - paid annual leave and paid sick leave; - profit-sharing and bonus; and - non-monetary benefits (such as medical care, housing or cars)
for current employees.
Post-employment benefits are employee benefits (other than ter-mination benefits and short-term employee benefits) that are paya-ble after the completion of employment. The Bank contributes to a defined contribution retirement plan located with an external insur-ance company.
The Bank does not grant any other employee benefits.
2.4.14 PROVISIONSProvisions are recognised when the Bank has a present obligation (legal or constructive) as a result of a past event and when it is proba-ble that an outflow of resources embodying economic benefits will be required to settle the obligation and when a reliable estimate can be made of the amount of the obligation. Where the Bank expects some or all of a provision to be reimbursed, for example under an insurance contract, the reimbursement is recognised as a separate asset but only when the reimbursement is virtually certain. The expense relat-ing to any provision is presented in the statement of profit or loss net of any reimbursement. If the effect of the time value of money is material, provisions are discounted using a current pre-tax rate that reflects, where appropriate, the risk specific to the liability. Where dis-counting is used, the increase in the provision due to the passage of time is recognised as an interest expense.
2.4.15 OTHER LIABILITIESThis caption includes liabilities such as income perceived in advance, accrued expenses and expenses due but not yet paid. Other liabilities are stated at cost.
2.4.16 DISCONTINUED OPERATIONSA discontinued operation is a component of the Bank’s business, the operations and the cash flows of which can be clearly distinguished from the rest of the Bank and which:- represents a separate major line of business or geographical
area of operations;- is a part of a single co-ordinated plan to dispose of a separate
major line of business or geographical area of operations; or- is a subsidiary acquired exclusively with a view to re-sale.
Classification as a discontinued operation occurs at the earlier of dis-posal or when the operation meets the criteria to be classified as held for sale.
When an operation is classified as a discontinued operation, the state-ment of comprehensive income is re-presented as of the operation has been discontinued from the start of the comparative year.
2.4.17 INTEREST INCOME AND EXPENSEFor all instruments measured at amortised cost, interest income and expense are recognised in the statement of profit or loss as they accrue, taking into account the effective yield of the asset and the liability or an applicable floating rate. Interest income and expense include the amortisation of any discount or premium or other dif-ferences between the initial carrying amount of an interest bearing instrument and its amount at maturity calculated on an effective interest rate basis.
In relation to negative interest rates, the Bank recognises negative interest rates generated by placements or assets in the interest expense caption, while positive interests generated by deposits or lia-bilities in the interest income captions.
2.4.18 FEE AND COMMISSION INCOMEFee and commission income arises on financial services provided by the Bank including cash management services, brokerage services, investment advice and financial planning, investment banking ser-vices, project and structured finance transactions, and asset manage-ment services. Fee and commission income is recognised when the corresponding service is provided.
The Bank recognises the whole amount of fees and commissions income into the statement of profit or loss when their purpose is to reimburse specific or general costs incurred by the Bank in prepar-ing and completing a transaction and they do not represent additional return on a loan or receivable.
2.4.19 DIVIDEND INCOMEDividend income is recognised in the statement of profit or loss when the Bank’s right to receive the payment is established.
2.4.20 NET REALISED GAINS AND LOSSES ON FINANCIAL ASSETS AND LIABILITIES NOT AT FAIR VALUE THROUGH PROFIT AND LOSS
Gains and losses on financial assets and liabilities are recognised in the statement of profit or loss at the date of sale, on the basis of dif-ference between the consideration paid or collected and the carrying amount of such instruments. In case of Available for sale assets, gains and losses are adjusted to take into consideration premiums and dis-counts accrued as at the date of sale.

NOTES TO THE FINANCIAL STATEMENTS 29
2.4.21 TAXESCurrent income taxCurrent tax assets and liabilities for the current and prior years are measured at the amount expected to be recovered from or paid to the taxation authorities. The tax rates and tax laws used to compute the amount are those that are enacted or substantially enacted by the statement of financial position date.
In accordance to the local law (article 164 LIR) a company can neu-tralise its current income taxes thanks to the consolidation of taxa-ble results with the taxable losses generated by its Parent Company located in Luxembourg.
Deferred income tax Deferred income tax is provided using the liability method on tempo-rary differences at the statement of financial position date between the tax bases of assets and liabilities and their carrying amounts for financial reporting purposes.
Deferred tax liabilities are recognised for all taxable temporary dif-ferences, except:- where the deferred tax liability arises from the initial recogni-
tion of goodwill or of an asset or liability in a transaction that is not a business combination and, at the time of the transaction, affects neither the accounting profit nor taxable profit or loss; and
- in respect of taxable temporary differences associated with investments in subsidiaries, associates and interest in joint ven-tures, where the timing of the reversal of the temporary differ-ences can be controlled and it is probable that the temporary differences will not reverse in the foreseeable future.
Deferred tax assets are recognised for all deductible temporary dif-ferences, carry forward and unused tax credits and unused tax losses, to the extent that it is probable that future taxable profits will be avail-able against which the asset can be utilised. The carrying amount of deferred tax assets is reviewed at each statement of financial position date and reduced to the extent that it is no longer probable that suffi-cient taxable profit will be available to allow all or part of the deferred tax asset to be utilised. Unrecognised deferred tax assets are reas-sessed at each statement of financial position date and are recognised to the extent that it has become probable that future taxable profit will allow the deferred tax assets to be recovered.
Deferred tax assets and liabilities are measured at the tax rates that are expected to apply to the year when the asset is realised or the liability is settled, based on tax rates and tax laws that have been enacted or substantively enacted by the statement of financial posi-tion date.
Current tax and deferred tax relating to items recognised directly in other comprehensive income are also recognised in other comprehen-sive income and not in the statement of profit or loss.
Deferred tax assets and deferred tax liabilities are offset, if a legally enforceable right exists to set off current tax assets against current tax liabilities and the deferred taxes relate to the same taxable entity and the same taxation authority.
2.5 RECLASSIFICATION OF INTEREST MARGIN
The Bank has reclassified comparative figures concerning interest income on liabilities and interest expenses on assets. As per conse-quence comparative figures in note 18 and in the statement of profit and loss and other comprehensive income have been restated.
NOTE 3 – FINANCIAL RISK MANAGEMENT
3.1 INTRODUCTION AND OVERVIEW
The Parent Company governing body (Board of Directors), supported by specific Committees, define the “risk profile” at Group level for all the Group entities. The Group risk profile definition considers risk management and control as key factors to guarantee a solid and sus-tainable creation of value in a risk controlled environment in order to assure financial stability and reputation of the Group and to provide a transparent portfolio risk representation. The risk policy is consequently aimed to achieve an appropriate balance between risk and return.
The local Risk Management unit operates under the direction of the Chief Risk Officer and applies the Group business strategies and objectives, defines scopes and methods to manage risks:- assures different types of risk measurement and control i.e.
market, interest rate, liquidity and operational risks following specific policies;
- revaluates the Bank assets according to mark-to-market and fair value principle defined in a “Fair Value Policy” issued at Group level;
- measures financial risks in the banking book and assures that the local limits stated by the Parent Company are respected. A periodic reporting is made to the Parent Company;
- provides the relevant reports to the Parent Company, the Audit Committee, the Board of Directors, the General Management and to the Asset/Liabilities Committee.
The Risk Management function supports the risk identification and measurement processes by providing details and own assessments, proposes risk management policies and approaches compliant with regulatory and the ultimate Parent Company requirements.
The Credit function provides details, own assessments and complies with regulatory and ultimate Parent Company requirements with regards to credit risk, and coordinates the decisions taken by the Credit and Asset Quality Committee.
The Accounting department provides the capital data details and sup-ports the reconciliation with the supervisory capital.
The Compliance function encompasses all measures aiming to avoid that the Bank incurs any loss, financial or not, due to the fact it does not comply with applicable laws and regulations. It is an independent function that identifies, assesses, advises, monitors and reports on the Bank’s compliance risk.

30 NOTES TO THE FINANCIAL STATEMENTS
The Organization & Human Resources Division assures adequate organizational framework and clear lines of responsibilities, with rel-evant documentation.
The Internal Audit provides an independent, periodic and comprehen-sive review of the processes and of the compliance with regulatory and Group requirements.
Roles and responsibilities of the Bank’s bodies and departments/functions have been defined in coordination with the ultimate Parent Company.
3.2 CREDIT RISK
Credit risk is the risk that the Bank will incur a loss because its cus-tomers, clients or counterparties failed to discharge their contractual obligations.
Credit risk arises due to: - exposure to corporate and private clients;- exposure to institutional counterparties.
The Bank credit risk management is based on the commercial and risk strategy drawn up by the Management and validated by the Board of Directors. The main principles are as follows:- the Bank grants credits in priority to corporate clients who are
often also clients of the Group or are part of the Group;
- calculation of the impact on capital requirements is made for all new credit transactions. The objective is to maintain the ade-quate ratio of the own funds beyond the 10.5% required by local regulation;
- each new customer relation must be approved by the “Client Control Committee” and where applicable by the “Committee of acceptance of new customers and operations”;
- the main exposures are toward the ultimate Parent Company;- a large proportion of the loans are collateralised by pledges
(cash or securities);- the Bank does not systematically require a 100% collateral as a
guarantee. It depends on the reputation of the borrower.
Credit risk is assessed by reviewing: - large exposure;- credit limits and collaterals; - credit lines;- financial analysis;- ratings.
The Bank has in place a manual of procedures, which describes the controls, review and reports regarding credit risk. The Bank has a regular Credit Committee which reviews major transactions and risk situations. Periodic reporting on credit risk is made to the Audit Committee.
3.2.1 MAXIMUM EXPOSURE TO CREDIT RISK WITHOUT TAKING ACCOUNT OF ANY COLLATERAL AND OTHER CREDIT ENHANCEMENTSThe table below shows the maximum exposure to credit risk for the components of the statement of financial position, including derivatives. The maximum exposure is shown before the effect of mitigation through the use of collateral agreements but after deduction of impairments.
Where financial instruments are recorded at fair value, the amounts shown above represent the maximum risk exposure that could arise in the future as a result of change in values.
For more detail on the maximum credit exposure to credit risk for each class of financial instruments, references shall be made to the specific notes.
(In €) MAXIMUM EXPOSURE 2017
MAXIMUM EXPOSURE 2016
Cash and cash balances with central banks 128,851,839 79,503,903
Financial assets held for trading 133,702,824 25,469,017
Financial assets at fair value through profit or loss 12,254,930 16,550,671
Available-for-sale financial assets 3,170,452,611 2,944,460,046
Loans and advances 18,687,898,484 14,893,744,682
Derivatives held for hedging 4,986,123 841,669
Other assets 22,372,433 17,290,186
TOTAL 22,160,519,244 17,977,860,174
Guarantees 383,234,583 215,309,119
Commitments 3,734,678,250 3,520,103,961
TOTAL 4,117,912,833 3,735,413,080

NOTES TO THE FINANCIAL STATEMENTS 31
3.2.2 CREDIT QUALITY PER CLASS OF FINANCIAL ASSETSFor classification of non-performing exposures in the various risk categories (doubtful loans, substandard exposures and past due exposures), the Bank rules laid down by its ultimate Parent Company.
The table below gives a breakdown by categories of gross financial assets and credit quality (except for cash balances with central banks) before impairment:
In 2016(In €)
PERFORMING ASSETS
DOUBTFUL ASSETS
SUBSTANDARD EXPOSURES
PAST DUE EXPOSURES TOTAL
Financial assets held for trading 25,469,017 --- --- --- 25,469,017
Financial assets at fair value through profit or loss
16,550,671 --- --- --- 16,550,671
Available-for-sale financial assets 2,944,460,046 --- --- --- 2,944,460,046
Loans and advances 14,772,347,647 132,342,967 --- --- 14,904,690,614
TOTAL 17,758,827,381 132,342,967 --- --- 17,891,170,348
In 2017(In €)
PERFORMING ASSETS
DOUBTFUL ASSETS
SUBSTANDARD EXPOSURES
PAST DUE EXPOSURES TOTAL
Financial assets held for trading 133,702,824 --- --- --- 133,702,824
Financial assets at fair value through profit or loss
12,254,930 --- --- --- 12,254,930
Available-for-sale financial assets 3,170,452,611 --- --- --- 3,170,452,611
Loans and advances 18,687,698,147 443,221 --- --- 18,688,141,368
TOTAL 22,004,108,512 443,221 --- --- 22,004,551,733

32 NOTES TO THE FINANCIAL STATEMENTS
3.2.3 CREDIT QUALITY PER CLASS OF FINANCIAL ASSETSThe gross and net exposures of loans and advances are as follows:
As at 31 December 2016 and 2017, there is no credit position that could qualify for loan forbearance as defined by the ESMA (European Security and Market Authority).
In 2017(In €) GROSS EXPOSURE INDIVIDUAL
IMPAIRMENTCOLLECTIVE
IMPAIRMENT NET EXPOSURE
Performing loans 18,687,698,147 --- --- 18,687,698,147
Doubtful loans 443,221 (242,884) --- 200,337
Past due exposures --- --- --- ---
TOTAL 18,688,141,368 (242,884) --- 18,687,898,484
In 2016(In €) GROSS EXPOSURE INDIVIDUAL
IMPAIRMENTCOLLECTIVE
IMPAIRMENT NET EXPOSURE
Performing loans 14,772,347,647 --- --- 14,772,347,647
Doubtful loans 132,342,967 (10,945,932) --- 121,397,035
Past due exposures --- --- --- ---
TOTAL 14,904,690,614 (10,945,932) --- 14,893,744,682

NOTES TO THE FINANCIAL STATEMENTS 33
3.2.4. CONCENTRATION OF RISKSIn order to avoid a too high concentration of risks, the Bank has to respect the following limit on a permanent basis: - the total risk exposure toward a single client or group of connected clients must not exceed 25% of the own funds of the Bank.
As at 31 December 2017, the lending limit amounted to EUR 469 million (2016: EUR 463 million) and - except for intergroup operations and one sovereign risk (Government of Italy) - no borrower exceeded this amount. The main exposure relates to 96 borrowers or group of borrowers (2016: 70 borrowers or group of borrowers) with financing between EUR 10 billion and EUR 13 million each (2016: between EUR 8.6 billion and EUR 15 million).
The Bank produces large exposures reports, which are the main tests of exposure concentration, as they include exposures to individual clients as well as group of counterparties and banking counterparties. They are communicated to the Management on a regular basis.
Following the Bank’s request, the CSSF has approved an exemption from including in its calculation of the large risk exposures, in accordance with point 24, part XVI of CSSF circular 06/273 as subsequently amended and article 400.2 of the EU Regulation No 575/2013, the risks to which the Bank is exposed with the Intesa Sanpaolo Group. The exposures on related parties are disclosed in Note 27.
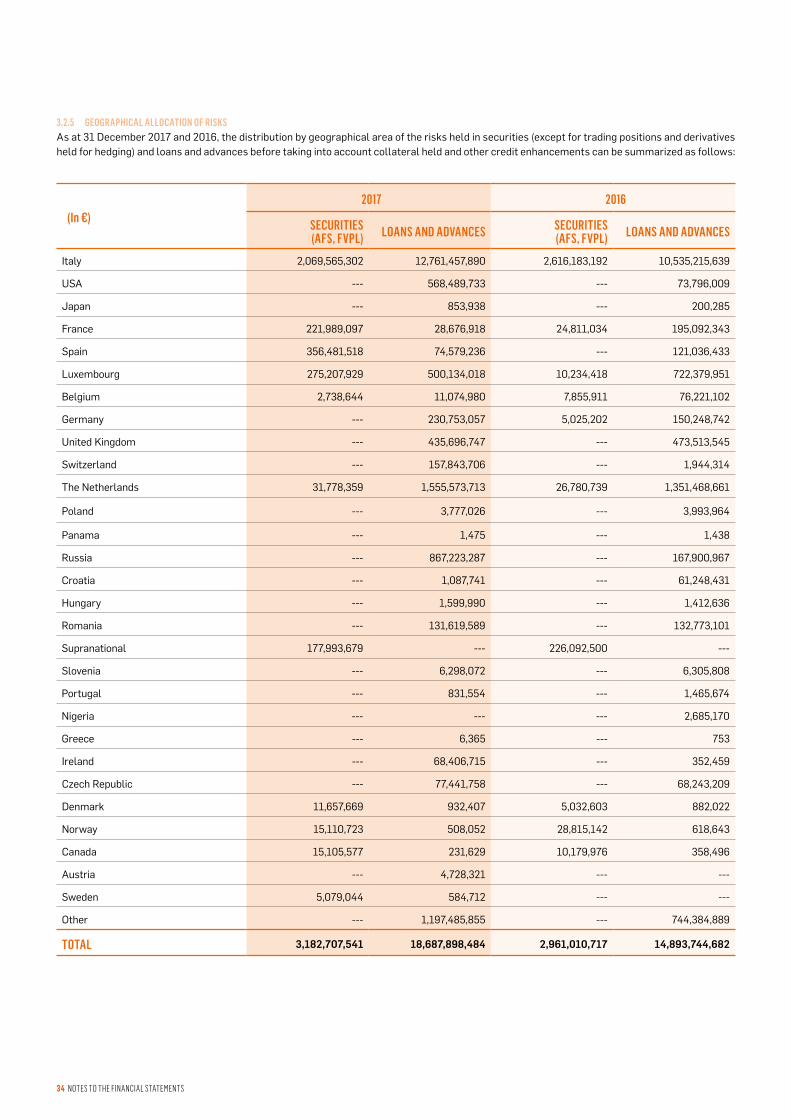
34 NOTES TO THE FINANCIAL STATEMENTS
3.2.5 GEOGRAPHICAL ALLOCATION OF RISKSAs at 31 December 2017 and 2016, the distribution by geographical area of the risks held in securities (except for trading positions and derivatives held for hedging) and loans and advances before taking into account collateral held and other credit enhancements can be summarized as follows:
(In €)2017 2016
SECURITIES (AFS, FVPL) LOANS AND ADVANCES SECURITIES
(AFS, FVPL) LOANS AND ADVANCES
Italy 2,069,565,302 12,761,457,890 2,616,183,192 10,535,215,639
USA --- 568,489,733 --- 73,796,009
Japan --- 853,938 --- 200,285
France 221,989,097 28,676,918 24,811,034 195,092,343
Spain 356,481,518 74,579,236 --- 121,036,433
Luxembourg 275,207,929 500,134,018 10,234,418 722,379,951
Belgium 2,738,644 11,074,980 7,855,911 76,221,102
Germany --- 230,753,057 5,025,202 150,248,742
United Kingdom --- 435,696,747 --- 473,513,545
Switzerland --- 157,843,706 --- 1,944,314
The Netherlands 31,778,359 1,555,573,713 26,780,739 1,351,468,661
Poland --- 3,777,026 --- 3,993,964
Panama --- 1,475 --- 1,438
Russia --- 867,223,287 --- 167,900,967
Croatia --- 1,087,741 --- 61,248,431
Hungary --- 1,599,990 --- 1,412,636
Romania --- 131,619,589 --- 132,773,101
Supranational 177,993,679 --- 226,092,500 ---
Slovenia --- 6,298,072 --- 6,305,808
Portugal --- 831,554 --- 1,465,674
Nigeria --- --- --- 2,685,170
Greece --- 6,365 --- 753
Ireland --- 68,406,715 --- 352,459
Czech Republic --- 77,441,758 --- 68,243,209
Denmark 11,657,669 932,407 5,032,603 882,022
Norway 15,110,723 508,052 28,815,142 618,643
Canada 15,105,577 231,629 10,179,976 358,496
Austria --- 4,728,321 --- ---
Sweden 5,079,044 584,712 --- ---
Other --- 1,197,485,855 --- 744,384,889
TOTAL 3,182,707,541 18,687,898,484 2,961,010,717 14,893,744,682

NOTES TO THE FINANCIAL STATEMENTS 35
(In €)2017 2016
GUARANTEES COMMITMENTS GUARANTEES COMMITMENTS
Belgium --- 422,836,905 --- 400,536,809
Canada --- --- 35,000 ---
France 74,425 --- 181,162 ---
Germany 262,678 126,497,287 262,678 ---
Austria --- 40,408,823 --- ---
Iran --- --- 22,500 ---
Italy 49,242,513 781,325,024 13,388,843 283,588,350
Luxembourg 36,483,909 283,381,086 29,130,393 111,479,562
The Netherlands 5,026,608 792,264,007 11,291,818 1,427,162,591
Qatar --- 417,909,728 --- ---
Spain --- 16,676,395 --- ---
Switzerland 548,687 39,813,186 624,267 3,136,786
Turkey 14,999 --- 11,500 ---
USA 7,260,238 166,108,063 8,545,011 227,735,319
United Kingdom 284,280,526 421,442,616 151,745,947 292,186,766
Venezuela 10,000 --- 17,500 ---
Congo Dem. Republic 30,000 --- 52,500 ---
South Africa --- 188,409,507 --- 24,277,778
Jersey IsL. --- 1 --- ---
Russia --- 33,379,980 --- 750,000,000
Rep.Czecha --- 4,225,642 --- ---
TOTAL 383,234,583 3,734,678,250 215,309,119 3,520,103,961

36 NOTES TO THE FINANCIAL STATEMENTS
Significant concerns about creditworthiness of certain Eurozone countries persisted during the year leading to speculation as to the long-term sustainability of the Eurozone.
The Bank is exposed to such risk mainly through the Italian sovereign debt securities held in its securities portfolio.
3.2.6 INDUSTRY SECTOR ALLOCATION OF RISKSAs at 31 December 2017 and 2016, the breakdown by industry sector of the risks held in securities (except for trading positions and derivatives held for hedging) and loans and advances before taking into account collateral held and other credit enhancements can be summarized as follows:
(In €)2017 2016
SECURITIES (AFS, FVPL) LOANS AND ADVANCES SECURITIES
(AFS, FVPL) LOANS AND ADVANCES
Financial institutions 371,208,572 9,950,509,001 116,541,147 8,357,143,757
Public sector 2,551,980,739 178,979,082 2,806,008,265 29,722,572
Other industries 259,518,230 7,033,991,073 38,461,305 5,465,083,156
Individuals --- 1,524,419,328 --- 1,041,795,197
TOTAL 3,182,707,541 18,687,898,484 2,961,010,717 14,893,744,682
(In €)2017 2016
GUARANTEES COMMITMENTS GUARANTEES COMMITMENTS
Financial institutions 294,054,552 --- 161,780,478 ---
Public sector --- 417,909,728 --- ---
Other industries 88,516,213 3,192,041,815 52,360,535 3,520,103,961
Individuals 663,818 124,726,707 1,168,106 ---
TOTAL 383,234,583 3,734,678,250 215,309,119 3,520,103,961
REPUBLIC OF ITALY
MATURING ON: EUR
2018 526,201,250
2019 553,892,284
2020 104,126,345
2021 237,321,003
2022 183,578,057
2023 135,120,481
2024 101,815,215
2025 100,284,607
TOTAL 1,942,339,242

NOTES TO THE FINANCIAL STATEMENTS 37
3.3 LIQUIDITY RISK
Liquidity risk is defined as the risk that the Bank is not able to meet its payment obligations when they fall due (funding liquidity risk). Normally, the Bank is able to cover cash outflows with inflows of cash, readily marketable assets and its own capacity to obtain credit. With regards to readily liquid assets in particular, market turmoil may occur which makes their sale or use of guarantee in exchange for funds extremely difficult (or even impossible); from this point of view, the Bank’s liquidity is closely tied to the market liquidity conditions (market liquidity risk).
The Liquidity Risk Management policy of the Bank is intended to define the guidelines for prudent management of this risk, outlining all the control processes and standards designed to prevent situations of liquidity crisis for the Bank.
The Intesa Sanpaolo Group Guidelines for Liquidity Risk Management defines the rules, measurement methodologies, behavioural parameters and quantitative limits for the Bank. In accordance with the Group guidelines and with the aim of guaranteeing a sufficient and balanced level of liquidity to ensure on-going availability of sufficient funds to meet its day-to-day payment commitments:- the Bank developed a prudent approach to liquidity management, so as to maintain an overall risk profile at extremely contained levels;- the liquidity risk management policy is clearly communicated to the whole organisation;- all the Bank’s operational units which carry out activities which have an impact on the liquidity are familiar with the liquidity management
strategy and with the corresponding costs and should act within the framework of approved policies and limits;- the units responsible for managing the liquidity risk operate within the approved limits;- the Bank maintains a sufficient level of readily liquid assets to enable business-as-usual and overcome the initial stages of any shock to its own
liquidity or that of the system.
The Bank also complies with Group regulations that from time to time may be imposed on the Bank as part of the Intesa Sanpaolo Group, such as occasional limitation of the access to the market by concentrating with the Parent Company any excess of liquidity.
As at 31 December 2017, the Liquidity Coverage Ratio of the Bank as defined in the article 416 of EU Regulation No 575/2013 was 105% (2016: 137%).

38 NOTES TO THE FINANCIAL STATEMENTS
The tables below present the cash flows payable by the Bank under non-derivative and derivative financial liabilities held for managing liquidity risk by remaining contractual maturities at the date of the statement of financial position.
The breakdown by sector of financial liabilities is as follows (in EUR):
2016(In €)
GOVERNMENT AND CENTRAL
BANKS
OTHER PUBLIC ENTITIES
FINANCIAL INSTITUTIONS
NON- FINANCIAL
COMPANIESOTHER TOTAL
Deposits from central banks 1,316,971,256 --- --- --- --- 1,316,971,256
Financial liabilities held for trading and for hedging --- --- 167,484,552 1,478,319 17,314,729 186,277,600
Financial liabilities at fair value through profit or loss --- --- 16,065,533 --- --- 16,065,533
Financial liabilities measured at amortised cost --- 286,006,138 587,152,750 788,765,955 12,770,604,716 14,432,529,559
TOTAL 1,316,971,256 286,006,138 770,702,835 790,244,274 12,787,919,445 15,951,843,948
2017(In €)
GOVERNMENT AND CENTRAL
BANKS
OTHER PUBLIC ENTITIES
FINANCIAL INSTITUTIONS
NON- FINANCIAL
COMPANIESOTHER TOTAL
Deposits from central banks 1,314,049,823 --- --- --- --- 1,314,049,823
Financial liabilities held for trading and for hedging --- --- 53,304,317 1,653 22,457,480 75,763,450
Financial liabilities at fair value through profit or loss --- --- 12,124,209 --- --- 12,124,209
Financial liabilities measured at amortised cost --- 135,864,241 708,297,280 889,218,597 16,570,727,841 18,304,107,959
TOTAL 1,314,049,823 135,864,241 773,725,806 889,220,250 16,593,185,321 19,706,045,441
31ST DECEMBER 2017IN MILLION €
< 1 MONTH
≥ 1 MONTH < 3 MONTHS
≥ 3 MONTHS< 6 MONTHS
≥ 6 MONTHS< 1 YEAR
≥ 1 YEAR< 2 YEARS
≥ 2 YEARS< 5 YEARS
≥ 5 YEARS TOTAL
Deposit from central banks --- --- --- --- --- 1,314 --- 1,314
Financial liabilities held for trading and derivatives held for hedging 298 14 4,835 126 163 909 33 6,378
Financial liabilities at fair value through profit or loss --- 1 --- 1 3 7 --- 12
Financial liabilities measured at amortised cost 5,233 1,958 1,795 3,354 3,404 2,557 3 18,304
TOTAL 5,531 1,973 6,630 3,481 3,570 4,787 36 26,008
31ST DECEMBER 2016IN MILLION €
< 1 MONTH
≥ 1 MONTH < 3 MONTHS
≥ 3 MONTHS< 6 MONTHS
≥ 6 MONTHS< 1 YEAR
≥ 1 YEAR< 2 YEARS
≥ 2 YEARS< 5 YEARS
≥ 5 YEARS TOTAL
Deposit from central banks --- --- --- --- --- 1,317 --- 1,317
Financial liabilities held for trading and derivatives held for hedging 20 15 15 27 66 73 2 218
Financial liabilities at fair value through profit or loss --- 1 --- 1 3 10 --- 15
Financial liabilities measured at amortised cost 4,534 636 2,086 3,233 2,682 1,259 2 14,432
TOTAL 4,554 652 2,101 3,261 2,751 2,659 4 15,982

NOTES TO THE FINANCIAL STATEMENTS 39
3.4 MARKET RISK
Market risk is the risk that the fair value or future cash flows of financial instruments will fluctuate due to changes in market variables such as interest rates, foreign exchange rates and equity prices.
The Bank’s primary financial instruments comprise money markets assets and liabilities, some cash and liquid resources and various other items that arise directly from its operations.
The Bank enters into derivatives transactions, which are mainly interest rate swaps (“IRS”) and forward foreign currency contracts. Those derivatives are held from an economic point of view for the purpose of monitoring the Bank’s interest rate risk and currency risk respectively.
The Treasury Department is part of Dealing Room and is responsible for managing the interest rate risk and foreign exchange risk generated within the Bank and for maintaining them within risk limits validated by the Board of Directors of the Bank.
To assess market risk, the Bank has put in place a reporting addressed to the Authorized Management, the Internal Audit, the Financial Markets Division and any other operational service responsible.
The Risk Control Function carries out their own analyses and assessments and the results are communicated periodically to the members of Authorized Management of the Bank, to the Financial Markets Division, to the ALCO Committee and to the Board of Directors, through the Audit Committee.
The Risk Management conducts daily controls of positions in foreign exchange, securities trading and interest rate. The result of these checks and any overruns positions are communicated through a daily report to the Management of the Bank.
The Bank has in place Policies and a manual of procedures for the Treasury department and Risk Management, which describe limits, rules and controls.
2016(In €) ZONE EURO OTHER EUROPEAN
COUNTRIES OTHER TOTAL
Deposits from central banks 1,316,971,256 --- --- 1,316,971,256
Financial liabilities held for trading and for hedging 185,932,865 228,028 116,707 186,277,600
Financial liabilities at fair value through profit or loss 16,065,533 --- --- 16,065,533
Financial liabilities measured at amortised cost 13,876,999,521 514,962,237 40,567,801 14,432,529,559
TOTAL 15,395,969,175 515,190,265 40,684,508 15,951,843,948
2017(In €) ZONE EURO OTHER EUROPEAN
COUNTRIES OTHER TOTAL
Deposits from central banks 1,314,049,823 --- --- 1,314,049,823
Financial liabilities held for trading and for hedging 75,287,042 398,668 77,740 75,763,450
Financial liabilities at fair value through profit or loss 12,124,209 --- --- 12,124,209
Financial liabilities measured at amortised cost 17,082,893,822 814,809,045 406,405,092 18,304,107,959
TOTAL 18,484,354,896 815,207,713 403,482,832 19,706,045,441

40 NOTES TO THE FINANCIAL STATEMENTS
Risk measurementsA Value at Risk (VaR) measurement of the proprietary portfolio is computed by the Parent Company Risk Management on a weekly basis and communicated to the Bank Risk Control Function in charge of the analysis.
The VaR model used by the Group and applied to the Bank is based on simulations where calculations of risk is made through the construction of “n” scenarios possible variations compared to the initial value of the risk factors: the scenarios are applied to the initial value of the risk positions in order to estimate the theoretical distribution of profit and loss on which to calculate the VaR at a predetermined percentile.
The approach used for the VaR computation is characterised by:• a model of historical simulation using the platform Mark-to-Future (Algorithmics);• a confidence interval of 99-th percentile;• a considered holding period of 1 day;• a full revaluation of positions.
A daily VaR limit is fixed at EUR 6.2 million.
3.4.1 INTEREST RATE RISK
- AVERAGE INTEREST RATESThe average effective interest rates on financial instruments by main currencies for the year ended 31 December 2017 and 2016 are as follows:
Interest rate risk is the risk arising from potential changes in interest rates that have an impact on the Bank’s assets and liabilities other than those that are present in the trading portfolio.
In general, the interest rate risk is covered as follows:• concerning client deposits in Euro as well as credit, investment and interbank loans, the Bank generally uses floating rates, which sustain
profit margin. Euro bonds that pay fixed rate are hedged by interest rate swaps;• concerning loan and credit operations held in foreign currencies, the Bank uses a roll over interest rates with a pre-agreed fixed margin. The interest rate risk is mainly represented by treasury operations which are not perfectly hedged at maturity or risk of maturity transformation.
2017 2016
Assets Liabilities Assets Liabilities
EUR 0.3749% 0.247618% 0.6987% 0.4334%
USD 3.25337% 2.056692% 2.5547% 1.3789%

NOTES TO THE FINANCIAL STATEMENTS 41
The interest rate risk is analysed based on the maturity of claims and liabilities, which also gives a measure of average margins and durations for treasury operations in given currencies. In order to optimise treasury activities, a mismatch is authorised either through cash positions, off balance sheet positions short term IRS, FRS or Futures. It is subject to certain limits in terms of interest rate positions, liquidity and concentration of client deposits.
The set of “Shift sensitivity +100bps” limits for the Bank has been approved by the Group Financial Risk Committee and by the Bank Board on 26 May 2017 for the last time:
In addition a shift sensitivity +100bps limit for USD currency has been introduced and equal to +/- 3.6 million.
In order to measure interest rate risk, the Risk Management Department uses on a daily basis the “shift sensitivity of Fair Value” (EVE) indicator which measures the changes in economic value of a financial portfolio resulting from a parallel shift (± 100bps) in the discount curves (yield curve) related to currencies. To calculate the present value, discount curves which are suitable for measuring individual financial instruments are applied. The total value of shift sensitivity is broken down by time bucket (bucket analysis), in order to identify the distribution of risk over the time axis.
At year end, the values of shift sensitivity ± 100bps (EVE) have been as follows:
At 31 December 2017, the Net Interest Income Sensitivity (NII), which measures the impact on net interest income of a parallel and instantaneous shock in the interest rate curve of ± 50 bps, over a period of 12 months, has been as follows:
The tables below present the financial assets and liabilities by repricing dates. Interest rate sensitive assets and liabilities are classified in the respective categories according to the interest rate repricing dates. For derivatives, the fair value of the instruments is used.
Bucket Shift +100bp per bucket Shift -100bp per bucket Limits
Short term (13,124,723) 1,196,195 ± 17 mln
Medium term (5,099,776) 6,054,424 ± 18 mln
Long term (5,151,493) 9,672,402 ± 8 mln
TOTAL (23,375,992) 16,923,021 ± 24 mln
Shift + 50bps (NII) Shift - 50bps (NII)
8,732,604 (14,000,512)
Limit per time bucket
Limits Short term Medium term Long term
0 - 18 months 18 months - 5 years > 5 years
± 24 million ± 17 million ± 18 million ± 8 million

42 NOTES TO THE FINANCIAL STATEMENTS
Under the assumptions as defined here above taking into account assets and liabilities as at 31 December 2017, a 100 bp increase or decrease in market interest rates would influence the interest income before tax by EUR (23,375,992) and EUR 16,923,021 respectively.
31st
Dec
embe
r 201
7 (I
n mill
ion €
)< 1
MO
NTH
≥ 1 M
ONTH
< 3
MON
THS
≥ 3 M
ONTH
S< 6
MON
THS
≥ 6 M
ONTH
S< 1
YEA
R ≥
1 YEA
R< 2
YEA
RS≥ 2
YEA
RS< 5
YEA
RS≥ 5
YE
ARS
TOTA
L
Cas
h an
d ca
sh b
alan
ces
with
cen
tral
ban
ks 1
29
---
---
---
---
---
---
129
Fina
ncia
l ass
ets
held
for t
radi
ng a
nd d
eriv
ativ
es
held
for h
edgi
ng 2
5 8
2
6
8
8
5 --
- 1
34
Fina
ncia
l ass
ets
at fa
ir va
lue
thro
ugh
prof
it or
loss
---
---
---
---
---
12
---
12
Avai
labl
e-fo
r-sa
le fi
nanc
ial a
sset
s 2
0 3
30
90
401
5
54
919
8
56
3,17
0
Loan
s an
d ad
vanc
es5,
720
1,91
1 3
76
2,68
63,
074
3,83
51,
086
18,6
88
TOTA
L FIN
ANCI
AL A
SSET
S5,
894
2,24
9 4
68
3,09
33,
636
4,85
11,
942
22,1
33
Dep
osits
from
cen
tral
ban
ks
(3)
---
---
501
--
-81
6--
-1,
314
Fina
ncia
l lia
bilit
ies
held
for t
radi
ng a
nd d
eriv
ativ
es
held
for h
edgi
ng 2
3 1
2
1
1
3
0 1
8 76
Fina
ncia
l lia
bilit
ies
at fa
ir va
lue
thro
ugh
prof
it or
loss
---
---
---
---
---
12
---
12
Fina
ncia
l lia
bilit
ies
mea
sure
d at
am
ortis
ed c
ost
5,23
32,
047
1,70
63,
354
3,40
42,
557
3
18,3
04
TOTA
L FIN
ANCI
AL LI
ABIL
ITIE
S5,
253
2,04
81,
708
3,85
63,
405
3,41
5 2
1 19
,706
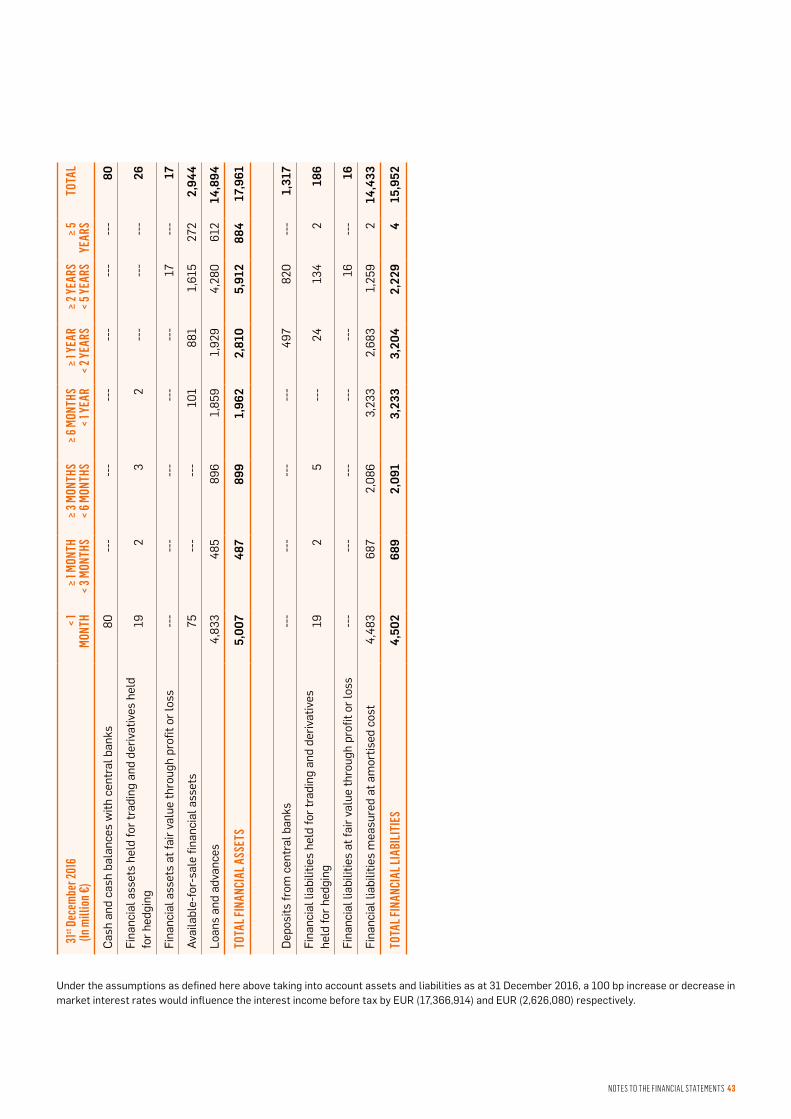
NOTES TO THE FINANCIAL STATEMENTS 43
Under the assumptions as defined here above taking into account assets and liabilities as at 31 December 2016, a 100 bp increase or decrease in market interest rates would influence the interest income before tax by EUR (17,366,914) and EUR (2,626,080) respectively.
31st
Dec
embe
r 201
6 (I
n mill
ion €
)< 1
MO
NTH
≥ 1 M
ONTH
< 3
MON
THS
≥ 3 M
ONTH
S< 6
MON
THS
≥ 6 M
ONTH
S< 1
YEA
R ≥
1 YEA
R< 2
YEA
RS≥ 2
YEA
RS< 5
YEA
RS≥ 5
YE
ARS
TOTA
L
Cas
h an
d ca
sh b
alan
ces
with
cen
tral
ban
ks 8
0 --
---
---
---
---
---
- 8
0
Fina
ncia
l ass
ets
held
for t
radi
ng a
nd d
eriv
ativ
es h
eld
for h
edgi
ng 1
9 2
3
2
--
---
---
- 2
6
Fina
ncia
l ass
ets
at fa
ir va
lue
thro
ugh
prof
it or
loss
---
---
---
---
---
17
---
17
Avai
labl
e-fo
r-sa
le fi
nanc
ial a
sset
s 7
5 --
---
- 1
01
881
1,
615
272
2,
944
Loan
s an
d ad
vanc
es4,
833
485
8
96
1,85
91,
929
4,28
0 6
12
14,8
94
TOTA
L FIN
ANCI
AL A
SSET
S5,
007
487
8
99
1,96
22,
810
5,91
2 8
84
17,9
61
Dep
osits
from
cen
tral
ban
ks--
---
---
---
- 4
97
820
---
1,31
7
Fina
ncia
l lia
bilit
ies
held
for t
radi
ng a
nd d
eriv
ativ
es
held
for h
edgi
ng 1
9 2
5
--
- 2
4 1
34
2
186
Fina
ncia
l lia
bilit
ies
at fa
ir va
lue
thro
ugh
prof
it or
loss
---
---
---
---
---
16
---
16
Fina
ncia
l lia
bilit
ies
mea
sure
d at
am
ortis
ed c
ost
4,48
3 6
87
2,08
63,
233
2,68
31,
259
2
14,4
33
TOTA
L FIN
ANCI
AL LI
ABIL
ITIE
S4,
502
689
2,
091
3,23
33,
204
2,22
9 4
15
,952

44 NOTES TO THE FINANCIAL STATEMENTS
3.5 FOREIGN EXCHANGE RATE RISK
Foreign exchange rate risk is the risk that the value of a financial instrument will fluctuate due to changes in foreign exchange rates.
Specific limits are set-up based on the open positions in foreign currencies. In particular, for transactions involving derivative instruments, ad hoc limits are established.
As at 31 December 2017 and 2016, the financial assets and liabilities denominated in EUR, in USD and in other currencies are as follows (in EUR):
31st December 2017 (In €) EUR USD OTHER TOTAL
Cash and cash balances with central banks 128,839,224 5,271 7,344 128,851,839
Financial assets at fair value through profit or loss and held for trading --- 123,961,304 21,996,450 145,957,754
Available-for-sale financial assets 3,170,452,611 --- --- 3,170,452,611
Loans and advances 15,438,154,188 2,765,165,784 484,578,512 18,687,898,484
TOTAL FINANCIAL ASSETS 18,737,446,023 2,889,132,359 506,582,306 22,133,160,688
Deposits from central banks 1,314,049,823 --- --- 1,314,049,823
Financial liabilities held for trading and held for hedging 50,039,063 15,536,705 10,187,682 75,763,450
Financial liabilities at fair value through profit or loss --- --- 12,124,209 12,124,209
Financial liabilities measured at amortised cost 16,910,968,612 944,429,225 448,710,122 18,304,107,959
TOTAL FINANCIAL LIABILITIES 18,275,057,498 959,965,930 471,022,013 19,706,045,441
31st December 2016 (In €) EUR USD OTHER TOTAL
Cash and cash balances with central banks 79,481,885 6,959 15,059 79,503,903
Financial assets at fair value through profit or loss and held for trading 1,998 15,828,184 26,189,506 42,019,688
Available-for-sale financial assets 2,944,460,046 --- --- 2,944,460,046
Loans and advances 12,824,900,187 1,906,037,782 162,806,713 14,893,744,682
TOTAL FINANCIAL ASSETS 15,848,844,116 1,921,872,925 189,011,278 17,959,728,319
Deposits from central banks 1,316,971,256 --- --- 1,316,971,256
Financial liabilities held for trading and held for hedging 100,998,693 72,828,392 12,450,515 186,277,600
Financial liabilities at fair value through profit or loss --- --- 16,065,533 16,065,533
Financial liabilities measured at amortised cost 13,643,876,585 599,391,796 189,261,178 14,432,529,559
TOTAL FINANCIAL LIABILITIES 15,061,846,534 672,220,188 217,777,226 15,951,843,948
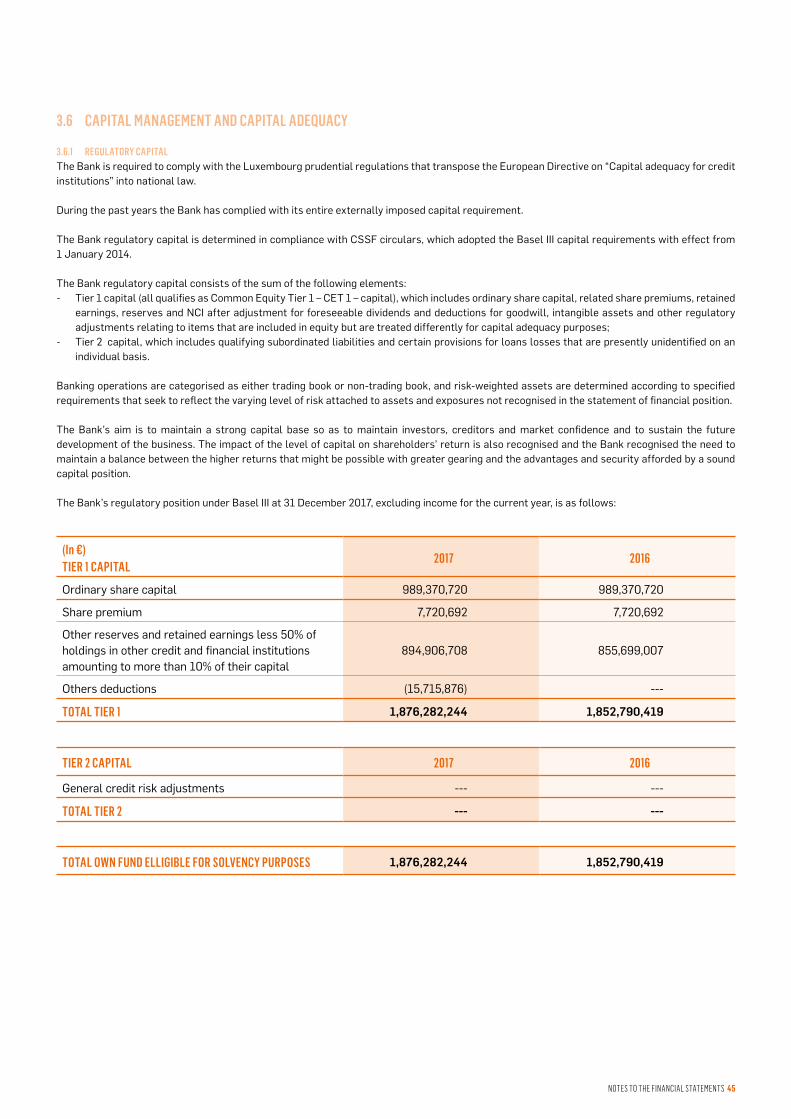
NOTES TO THE FINANCIAL STATEMENTS 45
3.6 CAPITAL MANAGEMENT AND CAPITAL ADEQUACY
3.6.1 REGULATORY CAPITALThe Bank is required to comply with the Luxembourg prudential regulations that transpose the European Directive on “Capital adequacy for credit institutions” into national law.
During the past years the Bank has complied with its entire externally imposed capital requirement.
The Bank regulatory capital is determined in compliance with CSSF circulars, which adopted the Basel III capital requirements with effect from 1 January 2014.
The Bank regulatory capital consists of the sum of the following elements:- Tier 1 capital (all qualifies as Common Equity Tier 1 – CET 1 – capital), which includes ordinary share capital, related share premiums, retained
earnings, reserves and NCI after adjustment for foreseeable dividends and deductions for goodwill, intangible assets and other regulatory adjustments relating to items that are included in equity but are treated differently for capital adequacy purposes;
- Tier 2 capital, which includes qualifying subordinated liabilities and certain provisions for loans losses that are presently unidentified on an individual basis.
Banking operations are categorised as either trading book or non-trading book, and risk-weighted assets are determined according to specified requirements that seek to reflect the varying level of risk attached to assets and exposures not recognised in the statement of financial position.
The Bank’s aim is to maintain a strong capital base so as to maintain investors, creditors and market confidence and to sustain the future development of the business. The impact of the level of capital on shareholders’ return is also recognised and the Bank recognised the need to maintain a balance between the higher returns that might be possible with greater gearing and the advantages and security afforded by a sound capital position.
The Bank’s regulatory position under Basel III at 31 December 2017, excluding income for the current year, is as follows:
(In €)TIER 1 CAPITAL
2017 2016
Ordinary share capital 989,370,720 989,370,720
Share premium 7,720,692 7,720,692
Other reserves and retained earnings less 50% of holdings in other credit and financial institutions amounting to more than 10% of their capital
894,906,708 855,699,007
Others deductions (15,715,876) ---
TOTAL TIER 1 1,876,282,244 1,852,790,419
TIER 2 CAPITAL 2017 2016
General credit risk adjustments --- ---
TOTAL TIER 2 --- ---
TOTAL OWN FUND ELLIGIBLE FOR SOLVENCY PURPOSES 1,876,282,244 1,852,790,419

46 NOTES TO THE FINANCIAL STATEMENTS
3.6.2 CAPITAL REQUIREMENTS AND RISK WEIGHTS The following table summarises the risks broken down by Basel regulatory class. These risks serve as a reference for calculating the solvency ratio of the Bank within the framework of regulatory reports filed with the CSSF.
3.6.3 CAPITAL ADEQUACYUnder the European regulation transposed into national law by the CSSF circulars as amended, the Bank is required to comply with the regulatory ratios at all times meaning minimum common equity capital ratio at least equal to 4.5%, a minimum Tier 1 Capital ratio at least equal to 6% and a minimum Total Capital plus Conservation buffer of 10.5%.
As at 31 December 2017, the solvency ratio of the Bank is 20.33% (2016: 18.49%), above the regulatory limit of 8% and above the regulatory limit including conservation buffer limit of 10.5%. Over the year 2017, the higher solvency ratio amounted to 20.92% (September) and the lower amounted to 18.10% (February).
3.6.4 CAPITAL MANAGEMENT AND PLANNING The primary objectives of the Bank’s capital management policy are to ensure that the Bank complies with externally imposed capital requirements and maintains strong credit ratings and healthy capital ratios in order to support its business and to maximise the shareholder value.
The Bank manages its capital structure and makes adjustments to it according to changes in economic conditions and the risk characteristics of its activities. No changes have been made to the objectives, policies and processes from the previous years.
As part of the internal assessment process for its capital adequacy (relative to Basel III Pillar 2), the Bank considers that the Pillar 1 risks (credit, market and operational risks) are sufficiently covered by the regulatory capital under Pillar 1 as at 31 December 2017 and going forward.
(In €) 2017 2016
AMOUNT OF RISK WEIGHTED ASSETS AMOUNT OF RISK WEIGHTED ASSETS
CREDIT AND COUTERPARTY RISK 8,835,057,975 9,622,345,439
Central governments and central banks 18,794,470 55,805,216
International organizations 3,353,595 ---
Corporates 3,730,980,831 4,723,695,529
Institutions 4,817,679,218 4,698,358,739
Retail 2,236,045 2,746,753
Exposures in default 180,194 537,763
Equity exposures 33,175,689 38,521,470
Other items 56,640,916 30,585,967
Covered bonds 139,063,230 72,092,004
Collective investments undertakings (CIU) 32,953,787 1,998
MARKET RISK --- ---
OPERATIONAL RISK 387,180,026 399,714,120
CREDIT VALUATION ADJUSTMENT 8,207,856 ---
TOTAL RISK WEIGHTED ASSETS AND CAPITAL REQUIREMENTS 9,230,445,857 10,022,059,559
Tier 1 capital ratio 20.33% 18.49%
Total capital ratio 20.33% 18.49%

NOTES TO THE FINANCIAL STATEMENTS 47
3.6.5 THE ICAAP (INTERNAL CAPITAL ASSESSMENT PROCESS)The second Pillar of Basel III capital framework describes how supervisory authorities and the Bank can effectively assess the appropriate level of regulatory capital. This assessment must cover all risks incurred by the Bank, their sensitivity to crises scenarios and how they are expected to evolve in light of development projects.
This internal assessment system is regularly integrated into the Bank’s decision-making and the management processes and supported, where appropriate, by impact analyses of crises scenarios on business plans and by models that reflect concentrations and diversifications in an economic manner.
3.7 OPERATIONAL RISK
The operational risk is the risk of loss resulting from inadequate or failed processes, people and systems or from external events. This definition includes legal risk.
Segregation of duties, internal procedures, and technological systems in force mitigate the risk of losses due to errors or inadequacies.
3.8 DERIVATIVE FINANCIAL INSTRUMENTS
During 2017 and 2016, in order to manage efficiently its treasury position, the Bank used mainly foreign exchange transactions and interest rate swaps.
As at 31 December 2017 and 2016, the notional amount and fair value of the derivatives held for trading are as follows (in EUR):
As mentioned in Note 2, as far as interest rate risk is concerned, only fair value hedge is applied by the Bank.
(In €)2017 2016
NOTIONAL AMOUNT FAIR VALUE NOTIONAL AMOUNT FAIR VALUE
ASSETS
Interest rate instruments --- --- --- ---
Currency instruments 3,985,832,987 133,702,824 2,166,371,502 25,467,019
3,985,832,987 133,702,824 2,166,371,502 25,467,019
LIABILITIES
Interest rate instruments 75,000,000 2,344,804 75,000,000 3,416,187
Currency instruments 2,654,612,861 25,724,387 3,729,449,890 85,278,907
2,729,612,861 28,069,191 3,804,449,890 88,695,094

48 NOTES TO THE FINANCIAL STATEMENTS
3.9 FAIR VALUES OF FINANCIAL ASSETS AND LIABILITIES
The following table summarises the carrying amounts and fair values of financial assets and liabilities measured at amortised cost (excluding cash balances with central banks) in the statement of financial position (in millions of EUR):
The fair value of the financial assets and liabilities corresponds to the amount at which the instrument could be exchanged in a current transaction between willing parties, other than in a forced or liquidation sale.
The fair values of financial assets and financial liabilities measured at amortised cost have been determined though the present value of future cash flows: the value of a financial instrument held to maturity at the year-end analysis is equal to the sum at that date of all the discounted cash inflows and outflows expected.
The cash flows are discounted with reference to the zero-coupon curve associated with currency in which the instrument is denominated and translated, where applicable, to the reference currency using the exchange rate applying on the analysis date.
3.9.1 FAIR VALUE HIERARCHYThe fair values of financial assets and financial liabilities that are traded in active markets are based on quoted market prices or dealer price quotations. For all other financial instruments, the Bank determines fair values using other valuation techniques.
(i) Valuation modelsAs at 31 December 2017 and 2016, the Bank uses the following fair value hierarchy for determining and disclosing the fair value of financial instruments, which reflects the significance of the inputs used in making the measurements:
- Level 1: inputs that are quoted prices (unadjusted) in active markets for identical assets and liabilities. This level includes listed equity securities and debt instruments on exchanges (for example: London Stock Exchange, Frankfurt Stock Exchange, New York Stock Exchange) and exchanges traded derivatives like futures (for example: Nasdaq, S&P 500).
- Level 2: inputs other than quoted prices included within Level 1 that are observable either directly (i.e. prices) or indirectly (i.e. derived from prices). This category includes instruments valued using: quoted market prices in active markets for similar instruments; quoted prices for identical or similar instruments in markets that are considered less than active; or other valuation techniques in which all significant inputs are directly or indirectly observable from market data.
- Level 3: inputs that are unobservable. This category includes all instruments for which the valuation technique includes inputs not based on observable data and the unobservable inputs have a significant effect on the instrument’s valuation. This category includes instruments that are valued based on quoted prices for similar instruments for which significant unobservable adjustments or assumptions are required to reflect differences between the instruments.
Valuation techniques include net present value and discounted cash flow models, comparison with similar instruments for which market observable prices exist and other valuation models. Assumptions and inputs used in valuation techniques include risk-free and benchmark interest rates, credit spreads and other premia used in estimating discount rates, foreign currency exchange rates, equity and equity index prices and expected price volatilities and correlations.
The objective of valuation techniques is to arrive at a fair value measurement that reflects the price that would be received to sell the asset or paid to transfer the liability in an orderly transaction between market participants at the measurement date.
The Bank uses widely recognised valuation models for determining the fair value of common and more simple financial instruments, such as interest rate and currency swaps that use only observable market data and require little management judgement and estimation. Observable prices or model inputs are usually available in the market for listed debt and equity securities, exchanged-traded derivatives and simple over-the-counter derivatives such as interest rate swaps. Availability of observable market prices and inputs varies depending on the products and markets and is prone to changes based on specific events and general conditions in the financial markets.
(In €)CARRYING AMOUNT FAIR VALUE
2017 2016 2017 2016
Assets
Loans and advances 18,688 14,894 18,696 14,761
Liabilities
Financial liabilities measured at amortised cost
18,304 14,433 19,664 15,803

NOTES TO THE FINANCIAL STATEMENTS 49
(ii) Valuation frameworkThe Bank has adopted and applied a specific policy issued by the Group, denominated “Fair Value Policy”, which states principles and methodologies to calculate financial instruments fair value.
In relation to controls and procedures put in place concerning valuation framework, please refer to Note 3.d “Market risk”.
(iii) Financial instruments measured at fair value – fair value hierarchy
The following table analyses financial instruments measured at fair value at year-end, by the level in the fair value hierarchy into which the fair value measurement is categorised. The amounts are based on the values recognised in the statement of financial position.
During the reporting years ending 31 December 2017 and 31 December 2016, there were no transfers between Level 1 and Level 2 categories, and no transfers into and out of Level 3 category.
3.10 OPERATING SEGMENTS
The Bank has four reportable operating segments which are the Bank’s strategic divisions. The Bank’s Management reviews the divisions internal management reports on a monthly basis while the Bank’s Board of Directors reviews these internal management reports on a quarterly basis.
Alongside these strategic divisions the Bank has also governance and administration divisions. The strategic divisions include: the Corporate Banking division which operates on loans, deposits, securities trading and other transactions with corporate customers.
The Wealth Management division operates on loans, deposits, securities trading and other transactions with private customers. The Financial Markets division undertakes the Bank’s funding and centralised risk management activities through borrowings, issue of debt securities, use of derivatives for risk management purposes and investing in debt or equity securities.
The Other Financial Institutions division is related to the loans operations with the other entities of the Intesa Sanpaolo Group. Information regarding the results of each strategic division is disclosed below. Performance is measured based on the revenue as presented in the internal management report reviewed by the Bank’s Board and Management. Division revenues are used to measure performance as such information is considered by the Bank’s management bodies as the most relevant indicator evaluating the achievement of the strategic divisions.
31st December 2017 LEVEL 1 LEVEL 2 LEVEL 3 TOTAL
31st December 2016
FINANCIAL ASSETS HELD FOR TRADING
- Derivatives held for trading --- --- 133,702,824 25,467,019 --- --- 133,702,824 25,467,019
- Equity instruments --- 1,998 --- --- --- --- --- 1,998
FINANCIAL ASSETS AT FAIR VALUE THROUGH PROFIT OR LOSS - Debt instruments --- --- 12,254,930 16,550,671 --- --- 12,254,930 16,550,671
AVAILABLE-FOR-SALE FINANCIAL ASSETS - Equity instruments (other than
investments in subsidiaries) 729,306 630,497 211,185 211,185 --- --- 940,491 841,682
- Debt instruments 3,169,512,120 2,943,618,364 --- --- --- --- 3,169,512,120 2,943,618,364
DERIVATIVES HELD FOR HEDGING --- --- 4,986,123 841,669 --- --- 4,986,123 841,669
TOTAL FINANCIAL ASSETS 3,170,241,426 2,944,250,859 151,155,062 43,070,544 --- --- 3,321,396,488 2,987,321,403
FINANCIAL LIABILITIES HELD FOR TRADING
- Derivatives held for trading --- --- 28,069,191 88,695,094 --- --- 28,069,191 88,695,094
- Short positions --- --- --- --- --- --- --- ---
FINANCIAL LIABILITIES AT FAIR VALUE THROUGH PROFIT AND LOSS
--- --- 12,124,209 16,065,533 --- --- 12,124,209 16,065,533
DERIVATIVES HELD FOR HEDGING --- --- 47,694,259 97,582,506 --- --- 47,694,259 97,582,506
TOTAL FINANCIAL ASSETS --- --- 87,887,659 202,343,133 --- --- 87,887,659 202,343,133

50 NOTES TO THE FINANCIAL STATEMENTS
2017RESULTS BY STRATEGIC DIVISIONS(In € ‘000)
CORPORATE & FINANCIAL
INSTITUTIONS
WEALTH MANAGEMENT
FINANCIAL MARKETS
OTHERS FINANCIAL
INSTITUTIONS
GOVERNANCE TOTAL REVENUES
Net interest margin 51,311 560 87,123 (3,267) --- 135,727
Dividends --- 540 46 --- --- 586 Net commission margin 40,494 3,960 6,453 102 --- 51,009Net trading income (6,111) 294 (4,187) 5,759 --- (4,245)Net other operating expenses 55 (43) (1,263) (4,674) --- (5.926)Profit from discontinuing operations
--- --- --- --- --- ---
Impairment on financial assets
36 (12) --- 75 --- 99
TOTAL AREA RESULTS 85,785 5,298 88,172 (2,005) --- 177,250
Impairment on financial assets
--- --- --- --- --- ---
Depreciation --- --- --- --- (459) (459)Provision --- --- --- --- --- ---Staff and operating expenses --- --- --- --- (38,271) (38,271)Tax expenses --- --- --- --- (3,047) (3,047)TOTAL OPERATING & EXTRAORDINARY EXPENSES
--- --- --- --- (41,777) (41.777)
RESULTS FOR THE YEAR 135,474
2016RESULTS BY STRATEGIC DIVISIONS(In € ‘000)
CORPORATE & FINANCIAL
INSTITUTIONS
WEALTH MANAGEMENT
FINANCIAL MARKETS
OTHERS FINANCIAL
INSTITUTIONS
GOVERNANCE TOTAL REVENUES
Net interest margin 28,073 344 67,115 (1,563) --- 93,969
Dividends --- 880 36 --- --- 916 Net commission margin 35,340 4,344 4,765 174 --- 44,623Net trading income 134 538 22,257 (298) --- 22,631Net other operating expenses (44) (135) (2) (5,086) --- (5,267)Profit from discontinuing operations
--- --- --- --- --- ---
Impairment on financial assets
2,519 94 --- 163 --- 2,776
TOTAL AREA RESULTS 66,022 6,065 94,171 (6,610) --- 159,648
Impairment on financial assets
--- --- --- --- --- ---
Depreciation --- --- --- --- (613) (613)Provision --- --- --- --- (75) (75)Staff and operating expenses --- --- --- --- (34,904) (34,904)Tax expenses --- --- --- --- (2,225) (2,225)TOTAL OPERATING & EXTRAORDINARY EXPENSES
--- --- --- --- (37,817) (37,817)
RESULTS FOR THE YEAR 121,831
Data are presented net of inter-division relationships.

NOTES TO THE FINANCIAL STATEMENTS 51
2017ASSETS BY STRATEGIC DIVISIONS(In € ‘000)
CORPORATE & FINANCIAL
INSTITUTIONS
WEALTH MANAGEMENT
FINANCIAL MARKETS
OTHERSFINANCIAL
INSTITUTIONS
TOTAL
Cash and cash balances with central banks 1,682 (1) 126,834 337 128,852
Financial assets held for trading --- 450 130,162 3,091 133,703
Financial assets designated at fair value through profit or loss
--- --- 12,255 --- 12,255
Available-for-sale financial assets --- --- 3,170,242 211 3,170,453
Loans and advances 8,693,678 15,426 8,077,012 1,901,782 18,687,898
Loans and advances to credit institutions 3,111 --- 8,075,756 1,871,642 9,950,509
Loans and advances to customers 8,690,567 15,426 1,256 30,140 8,737,389
Derivatives held for hedging 513 --- 3,954 519 4,986
Tangible fixed assets 304 --- --- 32,510 32,814
Intangible assets --- --- --- 3 3
Current tax assets 1,821 --- --- --- 1,821
Deferred tax assets --- --- --- 7,515 7,515
Other assets 3,241 397 1,484 17,250 22,372
TOTAL ASSETS 8,701,239 16,273 11,521,943 1,963,216 22,202,672
2016ASSETS BY STRATEGIC DIVISIONS(In € ‘000)
CORPORATE & FINANCIAL
INSTITUTIONS
WEALTH MANAGEMENT
FINANCIAL MARKETS
OTHERSFINANCIAL
INSTITUTIONS
TOTAL
Cash and cash balances with central banks 1,237 --- 78,097 170 79,504
Financial assets held for trading 2,135 1,989 21,345 --- 25,469
Financial assets designated at fair value through profit or loss
--- --- 16,551 --- 16,551
Available-for-sale financial assets --- --- 2,944,249 211 2,944,460
Loans and advances 6,526,054 11,545 5,568,344 2,787,802 14,893,745
Loans and advances to credit institutions 153,538 --- 5,567,040 2,636,566 8,357,144
Loans and advances to customers 6,372,516 11,545 1,304 151,236 6,536,601
Derivatives held for hedging 351 --- --- 491 842
Tangible fixed assets 10 --- --- 8,182 8,192
Intangible assets --- --- --- 4 4
Current tax assets 1,867 --- --- --- 1,867
Deferred tax assets --- --- --- 7,883 7,883
Other assets 2,643 473 987 13,186 17,289
TOTAL ASSETS 6,534,297 14,007 8,629,573 2,817,929 17,995,806

52 NOTES TO THE FINANCIAL STATEMENTS
2017LIABILITIS & EQUITY BY STRATEGIC DIVISION(In € ‘000)
CORPORATE & FINANCIAL
INSTITUTIONS
WEALTH MANAGEMENT
FINANCIAL MARKETS
OTHERSFINANCIAL
INSTITUTIONS
TOTAL
LIABILITIES
Deposits from central banks --- --- 1,314,050 --- 1,314,050
Financial liabilities held for trading --- 162 27,907 --- 28,069
Financial liabilities designated at fair value through profit or loss
12,124 --- --- --- 12,124
Financial liabilities measured at amortised cost 4,165,302 918,967 13,184,382 35,457 18,304,108
Deposits from credit institutions 58,216 --- 617,389 32,692 708,297
Deposits from customers 4,103,788 918,967 1,559,066 2,215 6,584,037
Debts evidenced by certificates 3,298 --- 11,007,926 550 11,011,774
Derivatives held for hedging --- --- 47,694 --- 47,694
Provisions 23 --- --- 1,656 1,679
Current tax liabilities 4,531 --- --- --- 4,531
Deferred tax liabilities --- --- --- 15,606 15,606
Other liabilities 6,069 176 1,179 37,231 44,656
TOTAL LIABILITIES 4,188,049 919,305 14,575,211 89,951 19,772,517
EQUITY
Share capital and share premium --- --- --- 1,397,092 1,397,092
Revaluation reserve --- --- 28,190 (7,634) 20,556
Other reserves and retained earnings 399 273 6,241 870,121 877,034
Net profit for the year 139,193 2,036 (17,789) 12,034 135,474
TOTAL EQUITY 139,592 2,309 16,642 2,271,613 2,430,156
TOTAL LIABILITIES AND EQUITY 4,327,641 921,614 14,591,853 2,361,564 22,202,672

NOTES TO THE FINANCIAL STATEMENTS 53
2016LIABILITIS & EQUITY BY STRATEGIC DIVISION(In € ‘000)
CORPORATE & FINANCIAL
INSTITUTIONS
WEALTH MANAGEMENT
FINANCIAL MARKETS
OTHERSFINANCIAL
INSTITUTIONS
TOTAL
LIABILITIES
Deposits from central banks --- --- 1,316,971 --- 1,316,971
Financial liabilities held for trading 2,022 371 84,904 1,398 88,695
Financial liabilities designated at fair value through profit or loss
16,066 --- --- --- 16,066
Financial liabilities measured at amortised cost 2,816,903 662,161 10,932,021 21,445 14,432,530
Deposits from credit institutions 5,215 --- 560,291 18,797 584,303
Deposits from customers 2,808,390 662,156 1,870,092 2,023 5,342,661
Debts evidenced by certificates 3,298 5 8,501,638 625 8,505,566
Derivatives held for hedging --- --- 97,583 --- 97,583
Provisions 23 --- --- 2,521 2,544
Current tax liabilities 2,225 --- --- --- 2,225
Deferred tax liabilities --- --- --- 9,819 9,819
Other liabilities 18,163 320 1,419 30,155 50,057
TOTAL LIABILITIES 2,855,402 662,852 12,432,898 65,338 16,016,490
EQUITY
Share capital --- --- --- 989,371 989,371
Share premium --- --- --- 7,721 7,721
Revaluation reserve --- --- 6,626 (1,936) 4,690
Other reserves and retained earnings 399 (1,897) 6,241 850,960 855,703
Net profit for the year 82,074 8,081 (339) 32,015 121,831
TOTAL EQUITY 82,473 6,184 12,528 1,878,131 1,979,316
TOTAL LIABILITIES AND EQUITY 2,937,875 669,036 12,445,426 1,943,469 17,995,806
3.11 RETURN ON ASSETS (“ROA”)The Bank return on asset is as follow:
3.12 PILLAR III DISCLOSURES REQUIREMENTS
As part of Intesa Sanpaolo Group, proper Pillar III disclosures are provided in a dedicated and specific document the Parent Company elaborates and publishes on a quarterly basis on its web site.
The document, denominated “Third pillar of Basel 2 and Basel 3 (“Pillar 3”)” is available at the following web address:“http://www.group.intesasanpaolo.com/scriptIsir0/si09/governance/eng_terzo_pilastro_basilea.jsp”
(In €) 2017 2016
Total assets 22,202,672,246 17,995,805,816
Net profit for the year 135,474,318 121,831,307
RETURN ON ASSETS 0.61% 0.68%

54 NOTES TO THE FINANCIAL STATEMENTS
3.12.1 THE ICAAP (INTERNAL CAPITAL ASSESSMENT PROCESS)The revised disclosure requirements will enable market participants to better compare banks’ disclosures of risk-weighted assets. The revisions notably focus on improving the transparency of the internal model-based approaches that banks use to calculate minimum regulatory capital requirements. This assessment must cover all risks incurred by the Bank, their sensitivity to crises scenarios and how they are expected to evolve in light of development projects.
This internal assessment system is regularly integrated into the Bank’s decision-making and the management processes and supported, where appropriate, by impact analyses of crises scenarios on business plans and by models that reflect concentrations and diversifications in an economic manner.
NOTE 4 –CASH AND CASH EQUIVALENTSCash and cash equivalents comprise balances with less than three months’ maturity from the date of acquisition, including cash in hand, deposits held at call with banks and other short-term highly liquid investments with original maturities of three months or less
In accordance with the requirements of the European Central Bank, the Luxembourg Central Bank implemented effective on 1 January 1999, a system of mandatory minimum reserves applicable to all Luxembourg credit institutions. The amount outstanding as at 31 December 2017 is EUR 126,833,521 (2016: EUR 78,093,348).
NOTE 5 – FINANCIAL ASSETS HELD FOR TRADING AND FINANCIAL ASSETS AT FAIR VALUE THROUGH PROFIT OR LOSS
As at 31 December 2017, the position is represented by a unique structured corporate bonds issued in JPY, maturing in February 2021, and funded by a deposit in the same currency from the Bank’s ultimate Parent Company.
(In €) 2017 2016
NET CARRYING AMOUNT NET CARRYING AMOUNT
Cash and cash balances with central banks 128,851,839 79,503,903
Loans and advances to banks with maturity ≤ 3 months
3,745,383,487 2,311,150,389
TOTAL 3,874,235,326 2,390,654,292
(In €)2017 2016
NET CARRYING AMOUNT NET CARRYING AMOUNT
FINANCIAL ASSETS HELD FOR TRADING
Derivatives held for trading 133,702,824 25,467,019
Mutual funds shares --- 1,998
133,702,824 25,469,017
FINANCIAL ASSETS DESIGNATED AT INCEPTION AT FAIR VALUE THROUGH PROFIT OR LOSS
Securities 12,254,930 16,550,671
TOTAL 12,254,930 16,550,671
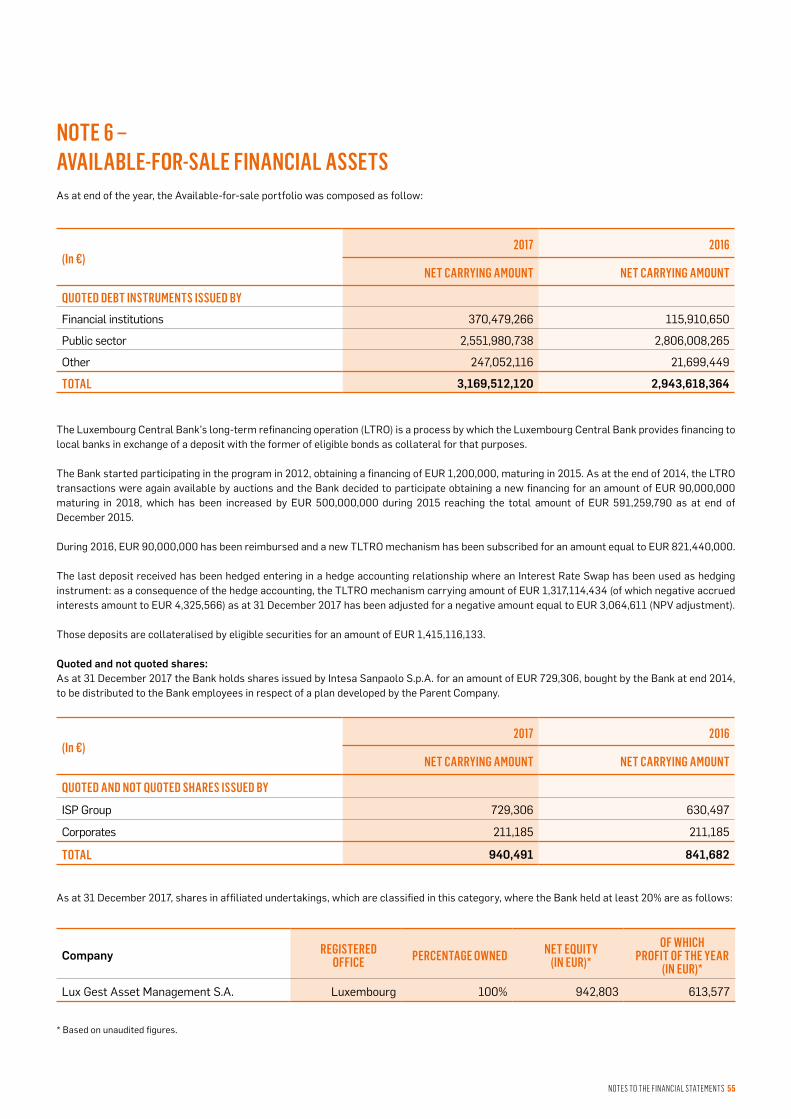
NOTES TO THE FINANCIAL STATEMENTS 55
NOTE 6 – AVAILABLE-FOR-SALE FINANCIAL ASSETSAs at end of the year, the Available-for-sale portfolio was composed as follow:
The Luxembourg Central Bank’s long-term refinancing operation (LTRO) is a process by which the Luxembourg Central Bank provides financing to local banks in exchange of a deposit with the former of eligible bonds as collateral for that purposes.
The Bank started participating in the program in 2012, obtaining a financing of EUR 1,200,000, maturing in 2015. As at the end of 2014, the LTRO transactions were again available by auctions and the Bank decided to participate obtaining a new financing for an amount of EUR 90,000,000 maturing in 2018, which has been increased by EUR 500,000,000 during 2015 reaching the total amount of EUR 591,259,790 as at end of December 2015.
During 2016, EUR 90,000,000 has been reimbursed and a new TLTRO mechanism has been subscribed for an amount equal to EUR 821,440,000.
The last deposit received has been hedged entering in a hedge accounting relationship where an Interest Rate Swap has been used as hedging instrument: as a consequence of the hedge accounting, the TLTRO mechanism carrying amount of EUR 1,317,114,434 (of which negative accrued interests amount to EUR 4,325,566) as at 31 December 2017 has been adjusted for a negative amount equal to EUR 3,064,611 (NPV adjustment).
Those deposits are collateralised by eligible securities for an amount of EUR 1,415,116,133.
Quoted and not quoted shares:As at 31 December 2017 the Bank holds shares issued by Intesa Sanpaolo S.p.A. for an amount of EUR 729,306, bought by the Bank at end 2014, to be distributed to the Bank employees in respect of a plan developed by the Parent Company.
As at 31 December 2017, shares in affiliated undertakings, which are classified in this category, where the Bank held at least 20% are as follows:
* Based on unaudited figures.
(In €)2017 2016
NET CARRYING AMOUNT NET CARRYING AMOUNT
QUOTED DEBT INSTRUMENTS ISSUED BY
Financial institutions 370,479,266 115,910,650
Public sector 2,551,980,738 2,806,008,265
Other 247,052,116 21,699,449
TOTAL 3,169,512,120 2,943,618,364
(In €)2017 2016
NET CARRYING AMOUNT NET CARRYING AMOUNT
QUOTED AND NOT QUOTED SHARES ISSUED BY
ISP Group 729,306 630,497
Corporates 211,185 211,185
TOTAL 940,491 841,682
Company REGISTERED OFFICE PERCENTAGE OWNED NET EQUITY
(IN EUR)*
OF WHICHPROFIT OF THE YEAR
(IN EUR)*
Lux Gest Asset Management S.A. Luxembourg 100% 942,803 613,577

56 NOTES TO THE FINANCIAL STATEMENTS
The below table describes the movements on the revaluation reserve related to the financial assets available for sale per type of securities:
NOTE 7 – LOANS AND ADVANCES
7.1 IMPAIRMENT ALLOWANCE FOR LOANS AND ADVANCESAs at 31 December 2017, the Bank has determined its individual impairment at EUR 242,884 (2016: EUR 10,945,932).
A reconciliation of the allowance for impairment losses for loans and advances is as follows (in EUR):
(In €) FIXED INCOME SECURITIES
FLOATING INCOME SECURITIES
EQUITYSECURITIES TOTAL
BALANCE AS AT 31 DECEMBER 2016 1,716,375 2,941,986 31,874 4,690,235
Increase (decrease) of unrealised gain (271,833) (1,521,141) 98,809 (1,694,165)
(Increase) decrease of unrealised loss 2,256,098 29,393 --- 2,285,491
Amount reclassified from equity to profit or loss for the period
(5,676,652) (1,679,589) --- (7,356,241)
Unrealised fair value gain made on assets bought during the year
4,519,057 (704,617) --- 3,814,440
Deferred tax (171,968) 1,138,558 (25,794) 940,796
BALANCE AS AT 31 DECEMBER 2017 2,371,077 204,590 104,889 2,680,556
(In €)2017 2016
NET CARRYING AMOUNT
OF WHICH: IMPAIRMENT
NET CARRYING AMOUNT
OF WHICH: IMPAIRMENT
Unquoted loans and advances to:Financial institutions and public sector 10,129,488,083 --- 8,386,866,329 ---
Private customers 1,524,419,328 2,784 1,041,795,197 10,531,869
Corporate customers 7,033,991,073 240,100 5,465,083,156 414,063
TOTAL 18,687,898,484 242,884 14,893,744,682 10,945,932
(In €) 2017 2016
Impairment as at 1st January 10,945,932 11,508,164
Charge of the year/Transfers 47,054 493,517
Recoveries/amounts written off (10,750,102) (1,055,749)
IMPAIRMENT AS AT 31 DECEMBER 242,884 10,945,932
of which:
Individual impairment 242,884 10,945,932
Collective impairment --- ---

NOTES TO THE FINANCIAL STATEMENTS 57
7.2 GUARANTEES RECEIVED AS COLLATERALLoans and advances are secured by the following guarantees received by the Bank:
NOTE 8 – PROPERTY AND EQUIPMENT
(In €)
2017 2016
LOANS AND ADVANCES TO CUSTOMERS
LOANS AND ADVANCES TO CREDIT
INSTITUTIONS
LOANS AND ADVANCESTO CUSTOMERS
LOANS AND ADVANCES TO CREDIT
INSTITUTIONS
NET CARRYING AMOUNTS 8,737,389,483 9,950,509,001 6,536,600,925 8,357,143,757
REAL GUARANTEES
Mortgage --- --- --- ---
Securities 2,067,224 --- 2,606,944 ---
Other real guarantees 2,924,717,900 45,000,000 2,202,071,568 45,000,000
PERSONAL GUARANTEES
Government guarantees 853,008,314 --- 71,150,746 ---
Credit institutions guarantees 38,959,143 --- 1,724,661,876 24,990,000
TOTAL GUARANTEES 3,818,752,581 45,000,000 4,000,491,134 69,990,000
(In €) LAND AND BUILDING
OFFICE EQUIPMENT
OTHER EQUIPMENT TOTAL
COST AS AT 1ST JANUARY 2017 25,079,718 1,555,024 7,761,730 34,396,472
Additions 122,651 157,604 285,444 565,699
Disposals/Transfers (165,198) (160,950) 94,689 (231,459)
Cost as at 31 December 2017 25,037,171 1,551,678 8,141,863 34,730,712
Accumulated depreciation as at 1st January 2017 (17,628,113) (1,477,584) (7,098,446) (26,204,143)
Depreciation charge (378,297) (32,774) (46,351) (457,422)
Depreciation reversal 165,198 160,950 (94,689) 231,459
Accumulated depreciation as at 31 December 2017 (17,841,212) (1,349,408) (7,239,486) (26,430,106)
NET CARRYING AMOUNT AS AT 31 DECEMBER 2017 7,195,959 202,270 902,377 8,300,606
Revaluations 24,513,535 --- --- 24,513,535
REVALUED NET CARRYING AMOUNT AS AT 31 DECEMBER 2017 31,709,494 202,270 902,377 32,814,141

58 NOTES TO THE FINANCIAL STATEMENTS
Land and building are used by the Bank for its own needs.
As at 31 December 2017 Land & building caption has been revalued on the base of Intesa Sanpaolo Group voluntary change to adopt land and building fair value as carrying amount instead of acquisition cost.
The above modification has led to the disclosure, in a dedicated valuation reserve, of an unrealized gain of EUR 24 million and all the financial information involving the Bank functional and leading to the above mentioned amount of revaluation reserve are detailed as follows:
8.1 PROPERTY DESCRIPTION
The property comprises 3 office buildings (19/21 Prince Henri and 23 Prince Henri built in 1999) with 7 above ground floors and 3 basement level comprising 34 internal parking spaces for a total of 5,739 m². The property appears to have been constructed around a concrete frame, with stone and glass faced elevations. Internally, the accommodation has been fitted out to include air-conditioning and double-glazing. The internal and external appearance of the office spaces is to a good standard.
The fair value of functional property was determined by an external, independent property valuer, having appropriate recognised professional qualifications and experience in the location and category of the property being valued. The independent valuer will provide the fair value of the Bank’s functional property portfolio every twelve months. The fair value measurement for the functional property has been categorised as a Level 3 fair value based on the inputs to the valuation technique used.
8.2 VALUATION METHODOLOGY
Market valueFunctional property fair value as at 31 December 2017 has been calculated under the assumption of a sale and leaseback to Intesa Sanpaolo for a term in line with market standards that can be identified under a lease length of 9 years and an early net income equal to EUR 1,495,206. The value of the building was assessed by means of both the comparable and investment approaches to valuation. With regards to the investment approach, it has been calculated a net income by considering an assumed estimated rental value (ERV) and deducting appropriate non-recoverable costs and then it has been capitalised at an appropriate hardcore yield into perpetuity. Capital costs required to achieve the assumed ERV are deducted and may include letting fees and tenant incentive among other items. The hardcore yields used are “growth implicit” and therefore no indexation or rental growth is explicitly modelled in our valuations.
(In €) LAND AND BUILDING
OFFICE EQUIPMENT
OTHER EQUIPMENT TOTAL
COST AS AT 1ST JANUARY 2016 25,773,559 1,541,522 7,709,087 35,024,168
Additions 16,591 13,502 52,643 82,736
Disposals/Transfers (710,432) --- --- (710,432)
Cost as at 31 December 2016 25,079,718 1,555,024 7,761,730 34,396,472
Amsterdam Branch integration - Accumulated depreciation
--- --- (43,059) (43,059)
Accumulated depreciation as at 1st January 2016 (18,005,961) (1,440,548) (6,821,378) (26,267,887)
Depreciation charge (332,584) (37,036) (234,009) (603,629)
Depreciation reversal 710,432 --- --- 710,432
Accumulated depreciation as at 31 December 2016 (17,628,113) (1,477,584) (7,098,446) (26,204,143)
NET CARRYING AMOUNT AS AT 31 DECEMBER 2016 7,451,605 77,440 663,284 8,192,329
(In €) 31.12.2017
LAND AND BUILDING - HISTORIC COST 24,543,481
Accumulated depreciation 17,394,016
CARRYING AMOUNT 7,149,465
Fonctional property Fair value as at 31.12.2017 31,663,000
REVALUATION RESERVE 24,513,535

NOTES TO THE FINANCIAL STATEMENTS 59
Vacant Possession ValueFor the Vacant Possession Value it has been adopted both the comparable and investment approaches to valuation. With regards to the investment approach, it has been calculated the net income by considering an assumed estimated rental value (ERV) and deducting appropriate non-recoverable costs. An appropriate void period which also includes any rent free has been considered and it has been capitalised at an appropriate hardcore yield into perpetuity at a rate reflecting the risk associated with a void property. Capital costs required to achieve the assumed ERV are deducted and may include letting fees and tenant incentive among other items. The resultant capital value per sqm as a secondary sense check methodology has been also taken into consideration.
NOTE 9 – INTANGIBLE ASSETS
NOTE 10 – TAX EXPENSE, DEFERRED TAX ASSETS AND LIABILITIESCurrent taxes recorded are related to the Amsterdam branch of the Bank.
In relation to the Luxembourg entity, instead, no current taxes are recorded considering the tax integration since 2002 with the Luxembourg Bank’s local shareholder Intesa Sanpaolo Holding International S.A., which presents significant tax losses carried forward.
Deferred tax assets and liabilities
(In €) 2017
COST AS AT 1ST JANUARY 2017 4,968
Additions ---
Disposals/Transfers ---
Cost as at 31 December 2017 4,968
Accumulated depreciation as at 1st January 2017 (1,125)
Depreciation charge (1,125)
Accumulated depreciation as at 31 December 2017 (2,250)
NET CARRYING AMOUNT AS AT 31 DECEMBER 2017 2,718
(In €) 2017 2016
Current tax assets 1,821,250 1,866,698
Current tax liabilities (4,530,721) (2,225,310)
NET CURRENT TAX ASSETS (LIABILITIES) (2,709,471) (358,612)
(In €) 2017 2016
Deferred tax assets 7,514,893 7,882,772
Deferred tax liabilities (15,605,772) (9,819,036)
TAX ASSETS (LIABILITIES) (8,090,879) (1,936,264)

60 NOTES TO THE FINANCIAL STATEMENTS
Recognised deferred tax assets and liabilities are attributable to the following:
As at 31 December 2017, full recognition of deferred tax assets has been performed by the Bank because they have been lower than deferred tax liabilities amount.
A deferred tax amount has been booked even if the Bank calculates current income in relation to the tax integration with the Bank’s local shareholder and its significant tax losses carried forward.
The deferred tax expenses presented in profit or loss are related to temporary differences generated by financial instruments fair value changes booked through profit or loss.
The deferred tax liabilities calculated on available-for-sale financial assets and on the property contributing to the other comprehensive income are showing a net deferred tax liability balance. The deferred tax amount has been consequently shown in deduction of the relative comprehensive income.
NOTE 11 –OTHER ASSETS AND OTHER LIABILITIES
(In €) 2017 2016
Prepaid charges 2,361,088 2,114,319
Taxes 13,881,832 10,131,046
Accrued commission income 866,428 2,944,889
Other 5,263,085 2,099,932
OTHER ASSETS 22,372,433 17,290,186
(In €) 2017 2016
Social security charges 694,536 686,679
Withholding taxes and VAT 26,661,675 22,018,740
Administrative expenses to be paid 10,996,737 9,093,464
Accrued commission expenses 3,871,671 14,778,505
Short term payable and other sundry accounts 2,431,008 3,480,256
OTHER LIABILITIES 44,655,627 50,057,644
(In €) 1 JANUARY 2017 INCOME STATEMENT EQUITY 31 DECEMBER 2017
Financial assets held for trading (21,179,148) (7,784,950) --- (28,964,098)
Financial assets designated at fair value through profit or loss
5,030,245 (187,089) --- 4,843,156
Available-for-sale financial assets (1,936,269) --- 940,796 (995,473)
Financial liabilities held for trading 15,628,508 7,387,641 --- 23,016,149
Financial liabilities designated at fair value through profit or loss
311,726 127,252 --- 438,978
Provisions and value adjustments 208,674 --- --- 208,674
Tangible assets --- --- (6,638,265) (6,638,265)
NET DEFERRED INCOME TAX ASSETS/(LIABILITIES) (1,936,264) (457,146) (5,697,469) (8,090,879)
NOTES TO THE FINANCIAL STATEMENTS 61
NOTE 12 – DEPOSITS FROM CENTRAL BANKSThe Luxembourg Central Bank’s long-term refinancing operation (LTRO) is a process by which the Luxembourg Central Bank provides financing to local banks in exchange of a deposit with the form of eligible bonds as collateral for that purposes.
The Bank started participating in the program in 2012, obtaining a financing of EUR 1,200,000, maturing in 2015. As at the end of 2014, the LTRO transactions were again available by auctions and the Bank decided to participate obtaining a new financing for an amount of EUR 90,000,000 maturing in 2018, which has been increased by EUR 500,000,000 during 2015 reaching the total amount of EUR 591,259,790 as at end of December 2015.
During 2016, EUR 90,000,000 has been reimbursed and a new TLTRO mechanism has been subscribed for an amount equal to EUR 821,440,000.
The last deposit received has been hedged entering in a hedge accounting relationship where an Interest Rate Swap has been used as hedging instrument: as a consequence of the hedge accounting, the TLTRO mechanism carrying amount of EUR 1,317,114,434 (of which negative accrued interests amount to EUR 4,325,566) as at 31 December 2017 has been adjusted for an amount equal to EUR 3,064,611 (NPV adjustment).
Those deposits are collateralised by eligible securities for an amount of EUR 1,415,116,133.
NOTE 13 – FINANCIAL LIABILITIES AT FAIR VALUE THROUGH PROFIT OR LOSSAs at 31 December 2017, the caption is composed of a financial liability which is eligible, according to IAS 39, to fair value option, with a fair value based on the discounted cash flows method. As at 31 December 2017, the fair value of this liability amounts to EUR 12,124,209 (2016: EUR 16,065,533).

62 NOTES TO THE FINANCIAL STATEMENTS
NOTE 14 – FINANCIAL LIABILITIES MEASURED AT AMORTISED COST
14.1 EUROPEAN MEDIUM TERM NOTES Since November 2011, the Bank participates as an additional issuer in a EUR 70 billion Euro Medium Term Notes (EMTN) Programme, developed by its ultimate Parent Company, alongside Intesa Sanpaolo Bank Ireland (INSPIRE). The programme is guaranteed by Intesa Sanpaolo S.p.A. The EMTN (the “bonds”) issued under this programme bear a maturity date of at maximum 5 years. The maximum aggregate principal amount of notes from time to time outstanding in respect of all issuers will not exceed EUR 70 billion or the equivalent thereof in other currencies. The notes are denominated in any currency subject to compliance with any applicable legal and or regulatory and or central bank requirements. As at 31 December 2017, such notes issued by the Bank amount to EUR 4,841 million (2016: EUR 3,809 million).
14.2 COMMERCIAL PAPERSince March 2011, the Bank participates as an additional issuer in a EUR 30 billion Euro Commercial Paper (ECP) Programme, developed by its ultimate Parent Company, alongside Intesa Sanpaolo Bank Ireland (INSPIRE). The ECP (further the “notes”) issued under this programme bear a maturity date under 1 year (short term notes) and are denominated in Euro, US Dollars or any other currency subject to compliance with any applicable legal and regulatory requirements. The maximum aggregate principal amount of notes from time to time outstanding in respect of all issuers will not exceed EUR 30 billion or the equivalent thereof in other currencies. As at 31 December 2017, such ECP issued by the Bank amount to EUR 1,614 million (2016: EUR 40 million).
(In €)2017 2016 VARIATION
CARRYING AMOUNT CARRYING AMOUNT IN EUR IN %
DEPOSITS FROM CREDIT INSTITUTIONSCurrent accounts and amounts with period of notice
488,585,082 415,830,593 72,754,489 17%
Term deposits 219,712,198 168,472,042 51,240,156 30%
TOTAL 708,297,280 584,302,635 123,994,645 21%
CORPORATE CUSTOMERSCurrent accounts and amounts with period of notice
1,560,969,556 1,801,012,570 (240,043,014) -13%
Term deposits 4,350,998,257 3,379,073,506 971,924,751 29%
TOTAL 5,911,967,813 5,180,086,076 731,881,737 14%
PRIVATE CUSTOMERSCurrent accounts and amounts with period of notice
334,071,413 125,650,350 208,421,063 166%
Term deposits 337,997,489 36,924,498 301,072,991 815%
TOTAL 672,068,902 162,574,848 509,494,054 313%
CERTIFICATES OF DEPOSITS
Certificates of deposits 4,557,128,337 4,655,902,896 (98,774,559) -2%
Bonds 4,840,706,577 3,809,477,284 1,031,229,293 27%
Commercial paper 1,613,939,050 40,185,820 1,573,753,230 3,916%
TOTAL 11,011,773,964 8,505,566,000 2,506,207,964 29%
FINANCIAL LIABILITIES MEASURED AT AMORTISED COST 18,304,107,959 14,432,529,559 3,871,578,400 27%

NOTES TO THE FINANCIAL STATEMENTS 63
NOTE 15 – DERIVATIVES HELD FOR HEDGINGThe Bank mainly uses interest rate swaps to hedge its exposure to changes in the fair values of certain fixed-rate bonds classified as available-for-sale due to adverse changes in interest rates.
In more details, the risk investment strategy is to invest in fixed rate securities carried as available-for-sale. The exposure of the fixed interest rate hedged item to interest rate risk is converted to floating rates with an interest rate swap in order to mitigate a potential fall in its value. The investment in the hedged assets and the completion of the covering hedging instrument are done simultaneously (Asset Swaps).
Each interest rate swap is matched with a specific bond subscribed and each hedging relationship is formally documented at inception. The documentation describes the hedging strategy, identifies the hedged item and the hedging instrument and the nature of the hedged risk.
For each hedging relationship, ex-ante and ex-post hedge effectiveness is measured by ensuring that fair value changes of the hedged items match with fair value changes of the hedging instruments.
The fair values of derivatives designed as fair value hedges are as follows:
Hedged items are as follows (in EUR):
(In €)2017 2016
NOTIONAL AMOUNT FAIR VALUE NOTIONAL AMOUNT FAIR VALUE
ASSETS
Interest rate instruments 490,000,000 4,986,123 70,000,000 841,669
TOTAL 490,000,000 4,986,123 70,000,000 841,669
LIABILITIES
Interest rate instruments 1,558,000,000 47,694,259 1,552,000,000 97,582,506
TOTAL 1,558,000,000 47,694,259 1,552,000,000 97,582,506
(In €)2017 2016
CARRYING VALUE CARRYING VALUE
Available-for-sale financial assets 1,423,827,081 1,052,133,173
Loans and advances 62,920,258 37,467,909
Deposits from central banks 821,440,000 818,218,899
TOTAL 2,308,187,339 1,907,819,981

64 NOTES TO THE FINANCIAL STATEMENTS
NOTE 16 – PROVISIONS
The above table shows provisions movements from 31 December 2016 to 31 December 2017. Reduction have been generated by foreign exchange movements (linked to some provisions in foreign currency) for an amount of EUR 235,389 and utilisation of provisions during 2017.
NOTE 17 – EQUITY1.7.1 SHARE CAPITALAs at 31 December 2011, the Bank’s subscribed and paid-up capital amounts to EUR 280,000,000, represented by 1,750,000 shares with no par value.
On 29 June 2012, the Bank transferred the ownership of its subsidiary Intesa Sanpaolo Private Bank (Suisse), S.A., Lugano (ISPB) to its shareholder Intesa Sanpaolo Holding International S.A., Luxembourg through a partial demerger without dissolution. Consequently, ISPB is ultimately controlled by the same party both before and after the partial demerger.
In a partial demerger without dissolution, both assets and liabilities are transferred, this implied the Bank transferring an equivalent portion of own funds equal to the book value of the transferred asset.
According to the demerger contract concluded between the Bank and its sole shareholder, as published in the draft demerger project in the Luxembourg official newspaper (Mémorial), dated 26 May 2012, the book value of the subsidiary was fixed at EUR 16,605,170 and the Bank reduced its paid-up capital by EUR 4,908,480 cancelling 30,678 shares without par value and reduced its retained earnings and other reserves by an amount of EUR 11,696,690, drawing back its shares capital from EUR 280,000,000 to EUR 275,091,520 represented by 1,719,322 shares with no par value.
On 10 December 2012, the Bank increased its subscribed and paid-up capital by EUR 260,000,000.
On 1 February 2016 the Bank purchased the Branch from the Group through a contribution in kind. For that purpose, 13,750 shares have been issued to Intesa Sanpaolo S.p.A. consisting of EUR 4,279,308.01 to share capital and EUR 7,720,691.99 to share premium in exchange of the Branch.
On 22 September 2016, the Bank performed a capital increase of EUR 449,999,892.27 through the issuance of 1,445,911 shares integrally subscribed by Intesa Sanpaolo Holding International S.A.
The Board of Directors of the Bank during the last meeting held on 25 October 2017 resolved to increase – within the limit of the statutory authorized capital - the share capital by an amount of EUR 399,999,835.08 to raise it from EUR 989,370,720.28 to the amount of EUR 1,389,370,555.36 by creation and issue of 1,285,254 new shares without any nominal value.
(In €) 2017
PROVISION AS AT 1ST JANUARY 2017 2,544,075
Reduction (629,548)
Forex impact (235,389)
Provision reversed during the year ---
PROVISIONS AS AT 31 DECEMBER 2017 1,679,138
(In €) 2016
PROVISION AS AT 1ST JANUARY 2016 2,458,058
Reductions (65,072)
Additions and forex impact 151,089
Provision reversed during the year ---
PROVISIONS AS AT 31 DECEMBER 2016 2,544,075

NOTES TO THE FINANCIAL STATEMENTS 65
These new shares all subscribed by the sole shareholder Intesa Sanpaolo Holding International S.A, fully paid off, benefit from the same rights and privileges as the existing shares.
As at 31 December 3017, the subscribed capital was therefore EUR 1,389,370,555.36 represented by 4,464,237 shares (integrally subscribed).
1.7.2 REVALUATION RESERVERevaluation reserve caption in composed of two amounts:- The fair value revaluation reserve for functional property, amounting to EUR 17,875,270 (net of deferred taxes equal to EUR 6,638,265);- The fair value revaluation reserve for available-for-sale financial assets, which includes the cumulative net change in the fair value of available-
for-sale investments until the investment is derecognised or impaired and amounting to EUR 2,680,556 (net of deferred taxes equal to EUR 940,796).
These revaluation reserves are not distributable.
1.7.3 LEGAL RESERVEUnder Luxembourg Law, the Bank must appropriate to a legal reserve an amount equivalent to 5% of the annual net profit until such reserve is equal to 10% of the share capital. This appropriation is made in the following year. Distribution of the legal reserve is restricted. As at 31 December 2017, the legal reserve amounts to EUR 59,641,565. As a consequence of the share capital increase the Bank had during 2017, it will be increased by EUR 6,773,716 during 2018.
1.7.4 OTHER RESERVESAs at 31 December 2017, other reserves amount to EUR 812,541,743 (2016: EUR 797,333,308).
1.7.5 RETAINED EARNINGSAs at 31 December 2017, retained earnings including the impact of the first time application (FTA) of IFRS as adopted by the European Union, amount to EUR 4,850,848 (2016: EUR 4,819,541).
1.7.6 PROFIT ALLOCATION PROPOSALThe amount attributable to shareholders, including earnings profit from previous financial years but excluding the impact of the first time application of IFRS as adopted by European Union, totals EUR 135,514,523, which corresponds to a return on equity of circa 6.89% (2016: 8.23%). It is proposed to the Annual General Shareholders’ Meeting approving the financial statements as at 31 December 2017 to allocate the above mentioned amounts as follows (in EUR):
(In €) 2017
Net profit of 2017 financial year 135,474,318
Retained profit from previous years (excluding FTA) 40,205
AMOUNT ATTRIBUTABLE TO SHAREHOLDERS 135,514,523
Allocation to legal reserve 6,773,716
Allocation to other reserves 28,726,284
Dividend for the financial year 100,000,000
TOTAL 135,500,000
Retained profit carried forward to the next financial year 14,523
(In €) AFS PORTFOLIO FUNCTIONAL PROPERTY TOTAL
OPENING BALANCE AS AT 31 DECEMBER 2016 4,690,235 --- 4,690,235
Increase / (Decrease) (2,950,475) 24,513,535 21,563,060
Deferred taxes 940,796 (6,638,265) (5,697,469)
CLOSING BALANCE AS AT 31 DECEMBER 2017 2,680,556 17,875,270 20,555,826

66 NOTES TO THE FINANCIAL STATEMENTS
NOTE 18 – NET INTEREST INCOME
(In €) 20172016
RESTATED FIGURES
2016RESTATMENT
2016 LAST YEAR
FIGURES
Cash balances with central banks --- 6,805 --- 6,805
Financial assets held for trading 5,879 2,289 --- 2,289
Financial assets at fair value through profit or loss 427,905 554,948 (4,463) 559,411
Hedging derivatives 900,472 880,673 --- 880,673
Available-for-sale financial assets 33,253,456 41,821,653 (90,243) 41,911,896
Loans and advances 208,359,701 172,038,176 (9,548,322) 181,586,498
Interest income on liabilities 3,418,813 1,732,332 (17,886,504) 19,618,836
Other 30,876 13,191 (617) 13,808
TOTAL INTEREST AND SIMILAR INCOME 246,397,102 217,050,066 (27,530,149) 244,580,215
(In €) 2017 2016 2016 2016
Hedging derivatives 12,082,700 30,601,977 (1,687,740) 32,289,717
Financial liabilities held for trading 364 7,572 --- 7,572
Financial liabilities measured at amortised cost 96,437,275 92,122,838 (17,896,407) 110,019,245
Financial liabilities at fair value thought profit or loss 269,094 348,786 --- 348,786
Interest expense on assets 1,881,025 --- (7,946,002) 7,946,002
TOTAL INTEREST EXPENSES AND SIMILAR CHARGES 110,670,458 123,081,174 (27,530,149) 150,611,323
NET INTEREST INCOME 135,726,644 93,968,892 --- 93,968,892
The Bank has reclassified comparative figures concerning interest income on liabilities and interest expenses on assets. As per consequence comparative figures in note 18 have been restated.
No interest has been accrued in respect of impaired assets in 2017 and 2016.

NOTES TO THE FINANCIAL STATEMENTS 67
(In €) 2017 2016
Credit activities 42,831,402 43,862,613
Wealth management and Treasury activities 25,535,207 18,814,699
Corporate services 776,251 724,652
Other 4,735,336 2,763,229
TOTAL FEE AND COMMISSION INCOME 73,878,196 66,165,193
Credit activities 6,968,067 10,986,271
Brokerage and clearing fees 13,125,124 7,932,299
Other 2,777,906 2,623,315
TOTAL FEE AND COMMISSION EXPENSES 22,871,097 21,541,885
NET FEE AND COMMISSION INCOME 51,007,099 44,623,308
NOTE 19 – NET FEE AND COMMISSION INCOME
NOTE 20 – DIVIDEND INCOMEAs at 31 December 2017 and 2016, dividend income relates to available-for-sale financial assets.
NOTE 21 – NET (UN)REALISED LOSSES ON FINANCIAL ASSETS AND LIABILITIES HELD FOR TRADINGAs at 31 December 2017 and 2016, the net (un)realised (losses) on financial assets and liabilities held for trading are composed of:
As at 31 December 2017 net (un)realised losses on financial assets and liabilities held for trading are mainly composed of :- Losses realised on Interest rate swap contracts unwinded before their maturity for an amount of EUR 61.0 million (of which EUR 46.2 million
paid in relation to their NPV and EUR 14.7 million in relation to interest rate differentials); those contracts have been unwinded in relation to the sale of bond instruments disclosed in note 23;
- Losses unrealised on Cross Currency Interest rate swap contracts for an amount of EUR 22.3 million, of which EUR 1.0 million linked to their NPV and EUR 21.3 million linked to the interest rate differentials related to the hedging of forex exposures.
(In €) 2017 2016
Equity instruments and linked derivatives (17,219) (20,830)
Interest rate instruments and linked derivatives (65,699,672) 1,975,793
Foreign exchange transactions (19,099,116) (7,140,685)
TOTAL (84,816,007) (5,185,722)

68 NOTES TO THE FINANCIAL STATEMENTS
NOTE 22 – NET (UN)REALISED LOSSES ON FINANCIAL ASSETS AND LIABILITIES AT FAIR VALUE THROUGH PROFIT OR LOSSAs at 31 December 2017 the net (un)realised losses on financial assets and liabilities at fair value through profit or loss are mainly composed of unrealised losses on assets classified at fair value through profit or loss for an amount of EUR 742 thousands (2016: EUR 334 thousands) and of realised gains on debt securities for an amount of EUR 273 thousands (2016: EUR 274 thousands).
NOTE 23 – NET REALISED GAINS ON FINANCIAL ASSETS AND LIABILITIES NOT AT FAIR VALUE THROUGH PROFIT OR LOSSAs at 31 December 2017 net realised gains on financial assets and liabilities not at fair value through profit or loss are mainly composed of:- gains realised on the early redemption of several loans granted to intragroup banks for an amount of EUR 25 million; - net gains realised on the sale of bond instruments held in the available-for-sale portfolio for an amount of EUR 55.5 million.
NOTE 24 – NET OTHER OPERATING EXPENSESAs at 31 December 2017 and 2016, net other operating expenses are mainly composed of withholding taxes and net worth tax, which are linked to the Bank’s business activity.
(In €)2017 2016
PROFITS LOSSES NET PROFITS LOSSES NET
Due from banks and customers 25,546,587 --- 25,546,587 20,106,513 --- 20,106,513
Financial assets available for sale 57,729,265 (2,232,995) 55,496,270 8,237,994 (467,798) 7,770,196
Debt securities 57,729,265 (2,232,995) 55,496,270 8,237,994 (467,798) 7,770,196
Equities --- --- --- --- --- ---
TOTAL ASSETS 83,275,852 (2,232,995) 81,042,857 28,344,507 (467,798) 27,876,709
Securities issued 2 (300) (298) 3,512 (3,077) 435
TOTAL LIABILITIES 2 (300) (298) 3,512 (3,077) 435
NET REALISED GAINS AND LOSSES 83,275,854 (2,233,295) 81,042,559 28,348,019 (470,875) 27,877,144

NOTES TO THE FINANCIAL STATEMENTS 69
NOTE 25 – ADMINISTRATIVE EXPENSES
The average number of personnel employed by the Bank at the end of the financial year was as follows:
(In €) 2017 2016
Wages and salaries 13,893,175 13,150,008
Social security charges 2,011,894 1,936,650
Legal pension and similar expenses 710,942 902,827
Employee benefits 2,933,163 1,441,451
Other 521,304 536,695
TOTAL STAFF EXPENSES 20,070,478 17,967,631
Operating expenses 4,229,971 2,895,167
Repair and maintenance 326,253 307,661
Training and moving 941,625 963,942
IT outsourcing costs 8,164,426 6,785,211
Legal and professional fees 1,852,920 3,828,976
Marketing and representation fees 1,538,740 1,586,172
Charges linked to Corporate activity and other charges 1,146,312 569,499
TOTAL GENERAL AND ADMINISTRATIVE EXPENSES 18,200,246 16,936,628
TOTAL ADMINISTRATIVE EXPENSES 38,270,724 34,904,259
2017 2016
Senior Management 4 3
Middle Management 56 54
Employees 110 112
TOTAL 170 169

70 NOTES TO THE FINANCIAL STATEMENTS
NOTE 26 – NET IMPAIRMENT ON FINANCIAL ASSETSDuring the year, the Bank has reversed impairment on financial assets as follow:
NOTE 27 – RELATED PARTY DISCLOSURES27.1 IDENTITY OF RELATED PARTIESThe Bank has a related party relationship with its direct and non-direct parent companies, entities of its Group and with its directors (hereafter “administrative bodies”) and executive officers (hereafter “other key management personnel”). All transactions made with related parties are concluded on an arm’s length basis.
The amount of main assets, liabilities, income and expenses as at 31 December 2017 and 2016 concerning Group entities and the parent companies are as follows:
As at 31 December 2017 and 2016, no impairment loss was recognised on available-for-sale financial assets and loans and advances with related parties.
(In €) 2017 2016
Loans and advances 99,316 2,775,931
IMPAIRMENT 99,316 2,775,931
ASSETS AND LIABILITIES(In €) 2017 2016
Assets held for trading and assets carried at fair value through profit or loss
130,434,587 19,809,595
Available-for-sale financial assets 940,491 841,682
Loans and advances 9,877,621,742 8,225,418,288
Hedging derivatives 4,986,123 841,669
Financial liabilities held for trading and liabilities carried at fair value through profit or loss 16,857,379 85,457,888
Financial liabilities measured at amortised cost 8,468,553,941 7,487,541,998
Hedging derivatives 47,694,259 97,582,506
INCOME AND EXPENSES (In €) 2017 2016
Interest income 58,601,044 93,615,918
Fees and commissions income 556,912 1,135,079
Dividend income 585,971 916,093
Net realised gains on financials assets and liabilities not at fair value through P/L 24,527,500 ---
Other operating income 172,262 ---
Interest expenses (70,886,502) (96,807,298)
Fees and commissions expenses (2,166,940) (5,959,884)
Administrative expenses (10,666,236) (8,221,329)
Other operating expenses (1,626,056) (1,545,071)

NOTES TO THE FINANCIAL STATEMENTS 71
27.2 KEY MANAGEMENT PERSONNELThe Bank incurred expenses with respect tothe remuneration of the members of the administrative, management and supervisory bodies as follows:
Administrative bodies are related to Directors composing the Bank’s board. The amount relates to their participation to each board.
As at 31 December 2017 and 2016, the Bank has no obligations related to retirement pensions for former administrative bodies and key management personnel.
As at 31 December 2017 and 2016, the Bank has not granted advances and credits and has not entered into guarantee commitments for the above mentioned bodies and personnel.
During 2017 the Bank has paid bonuses to Other Key management personnel for an amount of EUR 140,000 (2016: EUR 225,625).
NOTE 28 – COMMITMENTS AND CONTINGENT LIABILITIES The Bank’s commitments and contingent liabilities may be analysed as follows:
(In €) 2017 2016
Administrative bodies 210,901 251,000
Other key management personnel 967,977 849,697
TOTAL 1,178,878 1,100,697
(In €) 2017 2016
Unused confirmed credits 3,734,678,250 3,520,103,961
- out of which towards related parties --- ---
Guarantees and other direct substitutes for credit 383,234,583 215,309,119
- out of which towards related parties 293,506,720 161,191,121

72 NOTES TO THE FINANCIAL STATEMENTS
Guarantees received by the Bank:Unused confirmed credits and contingent liabilities are secured by guarantees received by the Bank as follows:
NOTE 29 – DEPOSIT GUARANTEE AND INVESTOR COMPENSATION SCHEMESThe law related to the resolution, reorganisation and winding-up measures of credit institutions and certain investment firms and on deposit guarantee and investor compensation schemes (“the Law”), transposing into Luxembourgish law the directive 2014/59/EU establishing a framework for the recovery and resolution of credit institutions and investment firms and the directive 2014/49/EU related to deposit guarantee and investor compensation schemes, was passed on 18 December 2015.
The deposit guarantee and investor compensation scheme “Association pour la Garantie des Dépôts Luxembourg” (AGDL) was replaced by a new contribution based system of deposit guarantee and investor compensation scheme. This new system covers eligible deposits of each depositor up to an amount of EUR 100,000 and investments up to an amount of EUR 20,000. The Law also provides that deposits resulting from specific transactions or fulfilling a specific social or other purpose are covered for an amount above EUR 100,000 for a period of 12 months.
The funded amount of the “Fonds de résolution Luxembourg” (FRL) shall reach by the end of 2024 at least 1% of covered deposits, as defined in article 1 number 36 of the Law, of all authorized credit institutions in all participating Member States. This amount will be collected from the credit institutions through annual contributions during the years 2015 to 2024.
The target level of funding of the “Fonds de Garantie des Dépôts Luxembourg” (FGDL) is set at 0.8% of covered deposits, as defined in article 163 number 8 of the Law, of the relevant credit institutions and is to be reached by the end of 2018 through annual contributions. The contributions are to be made in the form of annual payments during the years 2016 to 2018.
When the level of 0.8% is reached, the Luxembourgish credit institutions are to continue to contribute for 8 additional years in order to constitute an additional safety buffer of 0.8% of covered deposits as defined in article 163 number 8 of the Law.
(In €) CONTINGENT LIABILITIES
UNUSED CREDITS
2017
NET CARRYING AMOUNTS 383,234,583 3,734,678,250
Real guarantees
Mortgage --- ---
Securities 2,519,533 ---
Other real guarantees 14,141,767 363,514,378
Personal guaranteesGovernment guarantees --- 417,909,728
Credit institutions guarantees 6,353 ---
TOTAL GUARANTEES 16,667,653 363,514,378
2016
NET CARRYING AMOUNTS 215,309,119 3,520,103,961
Real guarantees
Mortgage --- ---
Securities 486,522 ---
Other real guarantees 17,335,870 180,980,260
Personal guaranteesGovernment guarantees --- 750,000,000
Credit institutions guarantees 5,153 83,246,371
TOTAL GUARANTEES 17,827,545 1,014,226,631

NOTES TO THE FINANCIAL STATEMENTS 73
NOTE 30 – INVESTMENT MANAGEMENT SERVICES AND UNDERWRITING FUNCTIONSThe Bank provides its customers with, among others, the following services:- Private Banking;- Corporate services;- Custody;- and Fiduciary representation.
Assets managed on behalf of third parties are as follows:
NOTE 31 – AUDIT FEES The audit fees and audit related fees for the years ended 31 December 2017 and 2016 are as follows:
(In €) 2017 2016
Custody and administration of transferable securities 8,742,587,173 8,644,073,265
Fiduciary representation 2,331,074 3,032,183
Wealth Management 188,133,467 173,366,351
(In €) 2017 2016
Audit fees 509,000 479,500Audit related fees 15,000 15,000Other --- 15,000
TOTAL 524,000 509,500

74 NOTES TO THE FINANCIAL STATEMENTS
NOTE 32 – ENCUMBERED ASSETSIn 2017 and 2016 the Bank participated to the Long Term Refinancing Operation mechanism organised by the Banque centrale du Luxembourg for an amount of EUR 1,314 million (2016: EUR 1,317 million). Those deposits are collateralised by eligible securities classified in the available-for-sale securities portfolio for an amount of EUR 1,415 million (2016: 1,342 million).
NOTE 33 – EVENTS AFTER THE REPORTING DATEThe Bank is not aware of any adjusting or non-adjusting event that would have occurred between 31 December 2017.
(In €) ENCUMBERED UNENCUMBERED CARRYING AMOUNT
CARRYING AMOUNT
FAIR VALUE CARRYING AMOUNT
FAIR VALUE 2017 2016
Cash and cash equivalents
--- 3,874,235,326 3,874,235,326 2,390,654,292
Debt securities 1,415,116,133 1,415,116,133 1,766,650,917 1,766,650,917 3,181,767,050 2,960,169,035
Equities --- 940,491 940,491 940,491 841,682
Loans and advances 45,520,000 14,896,994,999 14,942,514,997 12,582,594,293
Other financial assets --- 138,688,947 138,688,947 26,310,686
Non financial assets --- 64,525,435 64,525,435 35,235,828
TOTAL 2017 1,460,636,133 1,415,116,133 20,742,036,115 1,767,591,408 22,202,672,246 17,995,805,816

INDEPENDENT AUDITOR’S REPORT


NOTES


Intesa Sanpaolo Bank Luxembourg S. A.19-21, boulevard du Prince HenriL-1724 Luxembourg
Tél. : +352 46 14 11 1Fax : +352 22 37 55
pla
n K