Statement of Corporate Intent 2014/2015
35
Statement of Corporate Intent 2014/2015 For public release 28 August 2014 Prepared by the Directors and Management of CS Energy Ltd (ABN 54 078 848 745) for shareholding Ministers
Transcript of Statement of Corporate Intent 2014/2015
Statement of Corporate Intent 2014/2015 For public release
28 August 2014 Prepared by the Directors and Management of CS Energy Ltd (ABN 54 078 848 745) for shareholding Ministers
2014/2015 SCI Commercial in confidence 2
Contents
Performance Agreement ..................................................................................................... 4
CS Energy ............................................................................................................................ 6
Key challenges and performance objectives .................................................................... 7
CS Energy scorecard ............................................................................................................................ 9 Strategic actions .................................................................................................................................... 9 Strategic projects ................................................................................................................................ 14
Key performance metrics ................................................................................................. 16
Financial key performance indicators ............................................................................................... 16 Non-financial performance targets .................................................................................................... 17 Assumptions ........................................................................................................................................ 19 Other relevant assumptions ............................................................................................................... 19
Financial statements ......................................................................................................... 20
Group profit and loss, balance sheet and cash flow ....................................................................... 20 Capital expenditure (including overhauls) ........................................................................................ 22
Additional requirements ................................................................................................... 23
Prudential financial information ........................................................................................................ 23 Capital structure .................................................................................................................................. 23 Weighted average cost of capital ...................................................................................................... 23 Dividend policy and payment ............................................................................................................. 23 Corporate Governance guidelines for Government Owned Corporations .................................... 24 Risk management ................................................................................................................................ 24 Compliance with government policies .............................................................................................. 24 Sponsorship, advertising, corporate entertainment, and donations ............................................. 24 Employment and Industrial Relations Plan ...................................................................................... 24 Community Service Obligations (CSOs) ........................................................................................... 24
Attachment 1 – Definitions ............................................................................................... 25
Attachment 2 – Employment and Industrial Relations Plan ........................................... 26
Employment and Industrial Relations philosophy and direction ................................................... 26 Remuneration arrangements ............................................................................................................. 27 Employment conditions ...................................................................................................................... 28 Enterprise bargaining and productivity initiatives .......................................................................... 28 Type of employment and workforce planning .................................................................................. 29 Workplace health and safety .............................................................................................................. 29 Equal Employment Opportunity (EEO) and anti-discrimination..................................................... 30 Joint Venture projects ......................................................................................................................... 30 Management of the relationship between GOCs and unions ......................................................... 31 Redundancy provisions ...................................................................................................................... 31 Job security ......................................................................................................................................... 31 Contracting out .................................................................................................................................... 31 Superannuation ................................................................................................................................... 31 Consultation ......................................................................................................................................... 32
Attachment 3 – Hospitality................................................................................................ 33
Attachment 4 – Weighted Average Cost of Capital calculation...................................... 35
2014/2015 SCI Commercial in confidence 3
Glossary of acronyms
AIA Alternative Individual Agreement
DEHP Department of Environment and Heritage Protection
DEWS Department of Energy and Water Supply
EA Enterprise Agreement
E&IR Plan Employment and Industrial Relations Plan
EMT Executive Management Team
FTE Full time equivalent
FWA Fair Work Australia
GW gigawatts
GWh Gigawatt hours
IPPA Interconnection and Power Pooling Agreement
KPI Key Performance Indicator
LREC Large-scale Renewable Energy Certificate
LTIFR Lost Time Injury Frequency Rate
LTPPA Long Term Power Purchasing Agreement
MHL Maximum Hedge Limit
MW megawatts
MWh Megawatt hours
QTC Queensland Treasury Corporation
QTT Queensland Treasury and Trade (formerly OGOC)
SCI Statement of Corporate Intent
SREC Small-scale Renewable Energy Certificate
TCRFR Total Case Recordable Frequency Rate
2014/2015 SCI Commercial in confidence 4
Performance Agreement
Directors' Statement and Agreement of Shareholding Ministers
This Statement of Corporate Intent and all attachments, for 2014/2015, are presented in accordance with Chapter 3, Part 8 of the Government Owned Corporations Act 1993 (GOC Act). In accordance with Chapter 1, Part 3, Section 7 of the GOC Act, the Statement of Corporate Intent represents a formal performance agreement between the Board of CS Energy Limited (CS Energy) and its shareholding Ministers with respect to the financial and non-financial performance targets specified for the financial year. The Statement of Corporate Intent also represents an acknowledgment of, and agreement to major activities, objectives, undertakings, policies, investments and borrowings of CS Energy for 2014/2015. This Statement of Corporate Intent is consistent with CS Energy’s 2014/2015 – 2018/2019 Corporate Plan submitted to, and agreed to by shareholding Ministers in accordance with Chapter 3, Part 7 of the GOC Act. In signing the document, the Board of CS Energy undertakes to ensure that the document, and all reports to shareholding Ministers, are prepared with accuracy and timeliness. In signing this document, CS Energy’s Board undertakes to achieve the targets proposed in the Statement of Corporate Intent for 2014/2015. Significant legacy issues and uncertainties have to be resolved in order to achieve the targets in this Statement of Corporate Intent. In particular, these include: 1. Uncertainty surrounding the timing and detail of the proposed repeal of the Clean Energy
Act 2011 (Cth), and carbon pricing mechanism; 2. The variability and subsequent financial impact of coal deliveries from Anglo American to the
Callide Power Station, and resolution of matters which are subject to litigation in relation to the Coal Supply Agreement with Anglo American;
3. Management of issues associated with the Kogan Creek Solar Boost Project; and 4. Uncertainty over the continued operation of the Boyne Island aluminium smelter. Major changes to key assumptions and outcomes detailed in this Statement of Corporate Intent, which come to the Board’s attention during the year, will be brought to the attention of shareholding Ministers. Any modifications to this Statement of Corporate Intent will be dealt with in accordance with the GOC Act. The Queensland Government, in its State Budget on 3 June 2014, released a draft plan proposing a program of asset transactions, which included the sale of CS Energy. The Government has stated that it remains fully committed to seeking a mandate from the Queensland people before divesting itself of any Government business. However, the Government will commence some preliminary due diligence and preparation activities to ensure that the sale is able to be completed in a timely manner, should the Government decide to proceed. CS Energy will continue to assist Government throughout this process and will ensure that the business is operating as efficiently and effectively as possible.
2014/2015 SCI Commercial in confidence 5
This Statement of Corporate Intent is signed by the Chair on behalf of all the Directors in accordance with a unanimous decision of the Board of CS Energy.
Mr R Rolfe Chairman CS Energy Ltd Date: 28 August 2014 …………………………………………. Shareholding Minister Date:
…………………………………………. Shareholding Minister Date:
2014/2015 SCI Commercial in confidence 6
CS Energy
Mission
CS Energy's mission is to drive business improvement safely, efficiently, and responsibly to maximise value today and create opportunities for tomorrow. This Statement of Corporate Intent (SCI) outlines the foundations upon which CS Energy will be rebuilt and fundamentally transformed.
Business
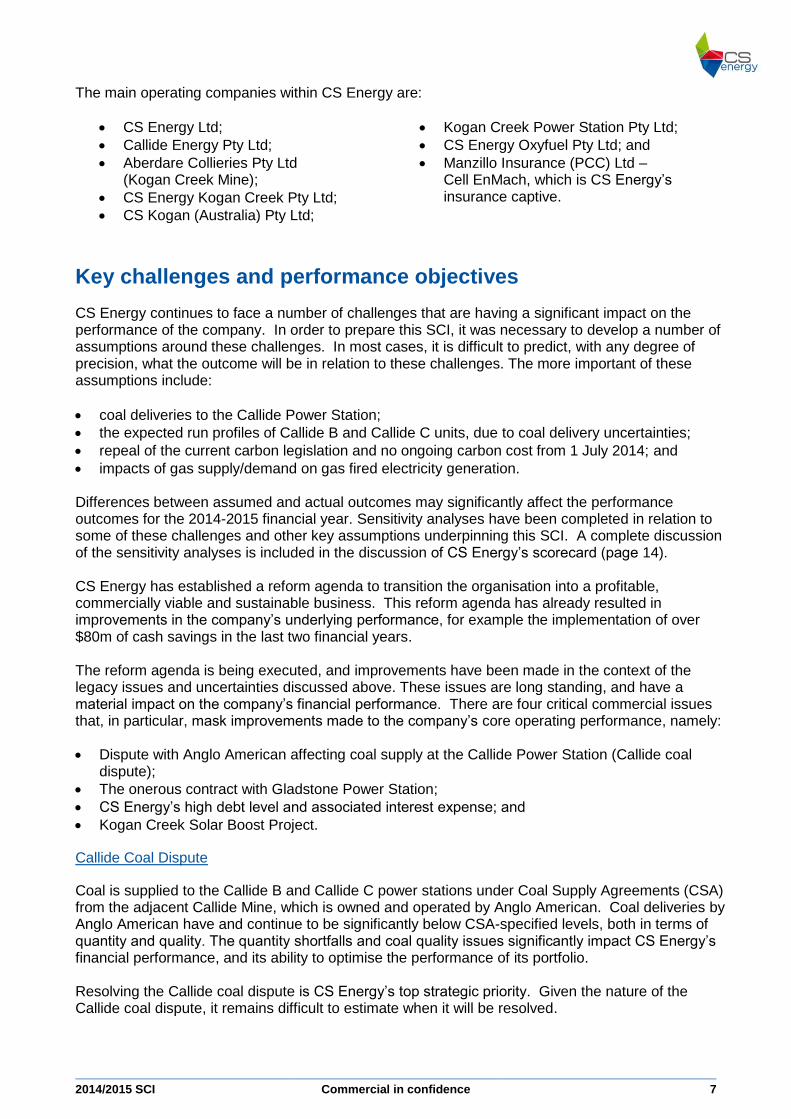
CS Energy Limited (CS Energy) is a Queensland Government Owned Corporation established under the Government Owned Corporations Act 1993 (Qld) (GOC Act), as a merchant generator by the Queensland Government in 1997, following a restructure of the Queensland energy industry. CS Energy’s business includes the generation and sale of electricity, including trading electricity in the National Electricity Market (NEM) under the Electricity Act 1994. CS Energy also holds a Queensland electricity retail licence. CS Energy owns and operates the Callide B, Kogan Creek and Wivenhoe power stations and operates the Callide C Power Station, in which it has a 50% interest. CS Energy is a party to the Interconnection and Power Pooling Agreement (IPPA) which entitles it to trade the output of Gladstone Power Station in excess of the requirements of the Boyne Aluminium Smelter. CS Energy provides operations and maintenance services for the Callide Oxyfuel Project at Callide A Power Station. This internationally funded R&D project is demonstrating the technology required to burn coal with low emissions. CS Energy also owns the Kogan Creek Mine, and the undeveloped Glen Wilga and Haystack Road coal resources near Chinchilla. CS Energy’s portfolio of assets comprises:
2014/2015 SCI Commercial in confidence 7
The main operating companies within CS Energy are:
CS Energy Ltd;
Callide Energy Pty Ltd;
Aberdare Collieries Pty Ltd (Kogan Creek Mine);
CS Energy Kogan Creek Pty Ltd;
CS Kogan (Australia) Pty Ltd;
Kogan Creek Power Station Pty Ltd;
CS Energy Oxyfuel Pty Ltd; and
Manzillo Insurance (PCC) Ltd – Cell EnMach, which is CS Energy’s insurance captive.
Key challenges and performance objectives
CS Energy continues to face a number of challenges that are having a significant impact on the performance of the company. In order to prepare this SCI, it was necessary to develop a number of assumptions around these challenges. In most cases, it is difficult to predict, with any degree of precision, what the outcome will be in relation to these challenges. The more important of these assumptions include:
coal deliveries to the Callide Power Station;
the expected run profiles of Callide B and Callide C units, due to coal delivery uncertainties;
repeal of the current carbon legislation and no ongoing carbon cost from 1 July 2014; and
impacts of gas supply/demand on gas fired electricity generation. Differences between assumed and actual outcomes may significantly affect the performance outcomes for the 2014-2015 financial year. Sensitivity analyses have been completed in relation to some of these challenges and other key assumptions underpinning this SCI. A complete discussion of the sensitivity analyses is included in the discussion of CS Energy’s scorecard (page 14). CS Energy has established a reform agenda to transition the organisation into a profitable, commercially viable and sustainable business. This reform agenda has already resulted in improvements in the company’s underlying performance, for example the implementation of over $80m of cash savings in the last two financial years. The reform agenda is being executed, and improvements have been made in the context of the legacy issues and uncertainties discussed above. These issues are long standing, and have a material impact on the company’s financial performance. There are four critical commercial issues that, in particular, mask improvements made to the company’s core operating performance, namely:
Dispute with Anglo American affecting coal supply at the Callide Power Station (Callide coal dispute);
The onerous contract with Gladstone Power Station;
CS Energy’s high debt level and associated interest expense; and
Kogan Creek Solar Boost Project.
Callide Coal Dispute
Coal is supplied to the Callide B and Callide C power stations under Coal Supply Agreements (CSA) from the adjacent Callide Mine, which is owned and operated by Anglo American. Coal deliveries by Anglo American have and continue to be significantly below CSA-specified levels, both in terms of quantity and quality. The quantity shortfalls and coal quality issues significantly impact CS Energy’s financial performance, and its ability to optimise the performance of its portfolio. Resolving the Callide coal dispute is CS Energy’s top strategic priority. Given the nature of the Callide coal dispute, it remains difficult to estimate when it will be resolved.
2014/2015 SCI Commercial in confidence 8
Onerous Contract in relation to the Gladstone Power Station
CS Energy also controls the dispatch profile for the Gladstone Power Station to support the operations of the Boyne Smelter, and trades residual energy generated into the electricity market. The contractual arrangements are onerous for CS Energy, because of the high fixed capacity payments and comparably high marginal costs associated with running the plant compared with pool revenue received from the dispatch of the Gladstone Power Station. The value of the onerous contract provision, as at 30 June 2013, was calculated to be $187.9 million. In 2014/2015, CS Energy will continue to assess the options available to minimise the impact of the onerous contract in relation to the Gladstone Power Station. CS Energy is also aware that Pacific Aluminium (PacAl), on behalf of the partners in the Boyne Island Smelter (BSL), has indicated that electricity costs have led to an evaluation of the financial sustainability of the BSL. There are potentially significant commercial implications for the Queensland electricity market should the BSL cease to operate at current levels. Modelling is underway to determine potential impacts on electricity prices and demand if a significant change to the BSL operations were to occur. CS Energy is aware of the importance of the continued viability and operation of the BSL to the State economy; however, it is also mindful that any proposed solution must not result in unnecessary erosion of value for CS Energy or the State.
High Debt Levels and Associated Interest Expense
With a gearing ratio above 70%, CS Energy’s financial performance also continues to be impacted by the interest burden associated with a high debt position. CS Energy will continue working to identify opportunities for reducing both debt levels and the cost of debt, including programs to reduce interest rates and charges.
Kogan Creek Solar Boost
The Kogan Creek Solar Boost Project, which commenced construction in July 2011, continues to require the investment of significant financial resources and management time. CS Energy is currently considering available options in relation to the Kogan Creek Solar Boost Project.
Earnings Forecast
CS Energy’s earnings forecasts are subject to the uncertainties discussed above. CS Energy has conducted detailed sensitivity analyses in relation to these uncertainties, and other significant factors that may impact earnings for the 2014/2015 financial year. The results of the sensitivity analyses, including carbon costs, Callide coal deliveries and pool and contract revenue, are discussed on pages 14 to 18 of this SCI. This SCI does not include any adjustments to the carrying value of assets or liabilities that may result from valuation assessments completed as part of the 2014 year-end process. These potential adjustments, made in relation to the 30 June 2014 year end, are dependent on discount rates, electricity pool prices, power station dispatch profiles and input prices of coal and carbon.
2014/2015 SCI Commercial in confidence 9
CS Energy scorecard
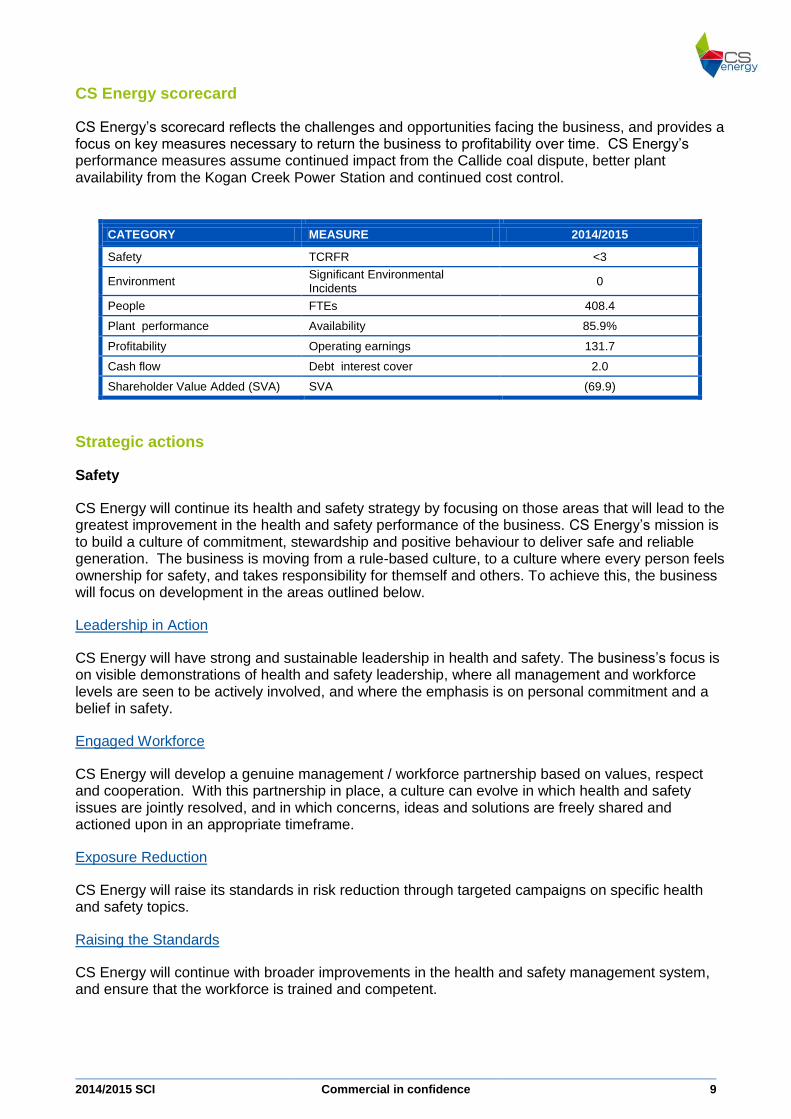
CS Energy’s scorecard reflects the challenges and opportunities facing the business, and provides a focus on key measures necessary to return the business to profitability over time. CS Energy’s performance measures assume continued impact from the Callide coal dispute, better plant availability from the Kogan Creek Power Station and continued cost control.
CATEGORY MEASURE 2014/2015
Safety TCRFR <3
Environment Significant Environmental Incidents
0
People FTEs 408.4
Plant performance Availability 85.9%
Profitability Operating earnings 131.7
Cash flow Debt interest cover 2.0
Shareholder Value Added (SVA) SVA (69.9)
Strategic actions
Safety
CS Energy will continue its health and safety strategy by focusing on those areas that will lead to the greatest improvement in the health and safety performance of the business. CS Energy’s mission is to build a culture of commitment, stewardship and positive behaviour to deliver safe and reliable generation. The business is moving from a rule-based culture, to a culture where every person feels ownership for safety, and takes responsibility for themself and others. To achieve this, the business will focus on development in the areas outlined below.
Leadership in Action
CS Energy will have strong and sustainable leadership in health and safety. The business’s focus is on visible demonstrations of health and safety leadership, where all management and workforce levels are seen to be actively involved, and where the emphasis is on personal commitment and a belief in safety.
Engaged Workforce
CS Energy will develop a genuine management / workforce partnership based on values, respect and cooperation. With this partnership in place, a culture can evolve in which health and safety issues are jointly resolved, and in which concerns, ideas and solutions are freely shared and actioned upon in an appropriate timeframe.
Exposure Reduction
CS Energy will raise its standards in risk reduction through targeted campaigns on specific health and safety topics.
Raising the Standards
CS Energy will continue with broader improvements in the health and safety management system, and ensure that the workforce is trained and competent.
2014/2015 SCI Commercial in confidence 10
Communication
Health and Safety issues will be effectively communicated across the business. This includes providing accurate information in a consistent and timely manner, and listening and acting on feedback that is received.
Environment
CS Energy will maintain a strong focus on operating in an environmentally responsible fashion, including, management of environmental issues that arise from its operations. The Environmental Management Systems in place at each site are certified to the International Standard ISO 14001, and provide the basis for a consistent approach to environmental risk management across the business. External audits of the Systems identify opportunities for continual improvement, with the goal of no Significant Environmental Incidents. Comprehensive environmental monitoring and measurement schedules are in place at each power station, providing data to ensure that compliance limits are met, and that any exceedances are reported to regulatory authorities. Compliance obligations from environmental approvals are closely managed.
People
Capability Realignment
In 2014/2015 CS Energy will continue to ensure the company has the right capability in the right roles, at the right cost, to deliver CS Energy’s reform objectives. In 2013/2014 CS Energy rolled out the capability realignment in two phases. Phase one is complete, and incorporated a review and restructuring of the Corporate Office functions. Phase two is nearing completion, and focuses on the Corporate Operations division. The next step will focus on the realignment of capability at sites. This review aims to establish an optimal number of employees to transform the organisation into a commercially competitive and sustainable business. A review of the Workforce Plan, at 31 December 2013, identified opportunity for further reductions in the Corporate Office staffing levels for 2014/2015, and beyond. The Callide Oxyfuel Project will cease operating at the end of December 2014. The current Callide A operational workforce of 23 full time positions will reduce by 17 by late 2014, with the remaining six positions to commence redeployment to Callide B and Callide C from January 2015. CS Energy is undertaking three approaches at Callide B and Callide C to ensure workforce numbers are brought back within budget after cessation of the Oxyfuel Project, including:
Natural attrition;
Filling positions on a flexible basis (i.e. contractors, casuals, fixed term contracts); and
Offering voluntary redundancies. Corporate staff reductions associated with the Oxyfuel Project includes a reduction of one position at the end of 2014/2015 and a further two positions in 2015/16. The wind down of the Oxyfuel Project will result in a total reduction of 26 operational and corporate staff. The budgeted figures also reflect a reduction in the Callide workforce.
Leadership and Culture
In 2014/2015, CS Energy’s management will continue its focus on defining and building a culture that supports the company’s reform objectives. To support the development a constructive and high performance culture, CS Energy will:
2014/2015 SCI Commercial in confidence 11
Introduce refreshed company values to support a constructive, high performance culture;
Implement a communication strategy that is focused on direct engagement between people, managers and employees;
Develop and integrate performance standards, aligned to accepted leadership levels of work, into the performance management system to enhance leadership capability and role clarity;
Realign people development to the widely accepted 70:20:10 learning model; and
Ensure leaders are provided with the training and support to effectively manage performance in line with the high performance culture.
Industrial Relations
The objective of CS Energy’s Industrial Relations Reform is to provide the company with an industrial relations framework, including site-specific negotiating strategies. The framework aims to enable employee relations matters to be managed in a way that is consistent with shareholder requirements, and is consistent with the following business objectives:
To be a safe power generator;
To support CS Energy’s competitive market position; and
To create productivity and efficiency opportunities.
In 2014/2015, CS Energy will implement the Kogan Creek and Callide Enterprise Agreements, and commence preparations for the re-negotiation of the Corporate and Wivenhoe Enterprise Agreements, in accordance with the GOC Wages Policy (2012). Productivity initiatives and cost savings will continue to be reported to shareholders quarterly. The following negotiation objectives are part of the bargaining frameworks for all re-negotiations of the Enterprise Agreements, which align with CS Energy’s broader strategic direction:
Compliance with GOC Wages Policy (2012);
Management Prerogative;
Cost reduction;
Flexibility;
Culture change; and
Consistency of approach across sites.
Plant performance
CS Energy’s power stations are well placed in the merit order and have unique characteristics, such as a fast ramp rate capability, and, as such, have the potential to provide significant value to CS Energy. With reliable fuel sources in place, given the plants’ places in the merit order, high levels of availability should be expected. Plant performance underpins CS Energy’s financial strategy, provides an opportunity to increase revenue, and is integral to transforming the organisation into a profitable, commercially viable and sustainable business. The adopted asset management strategy focuses on three key actions:
Continue to capture the opportunity to reduce costs and capital expenditure as a result of the current lower generation, provided by standby and reserve shut downs;
Further develop and implement, where appropriate, asset solutions to respond rapidly to any opportunities a changed energy market may offer; and
Finalise the asset management plan and capture revenue opportunities. The adopted strategy will be delivered by:
Deferring the timing of, and where possible, the scope of works associated with overhauls, to the fullest extent possible as a result of the reduced generation and lower in-service time;
2014/2015 SCI Commercial in confidence 12
Deferring stay-in business capital projects in a manner consistent with the changed asset position and major overhaul plan;
Where appropriate, completing opportunistic maintenance during reserve shut downs so as to support a reduced scope of work during major overhauls, and lower the overall cost outcome in general; and
Strengthen the capital project development, approval and review process as part of building on the major overhaul cost savings delivered by the Integrated Service Agreements (ISA).
The key asset metrics focus on capacity, availability and reliability of the portfolio’s plant, and have been developed on the basis of a generation plan which has potential for change due to market and fuel issues. The strategy focuses on providing asset solutions which provide asset flexibility to assist, where possible, to mitigate this risk. As this approach has significant potential for a changed asset outcome during the SCI period, CS Energy has adopted a range of asset metrics that reflect the commercial focus on in-service availability. Variances to the plan which result from decisions to support a changed operational response, due to changes in the wholesale position, will be identified as part of the reporting process. Profitability Operating earnings (excluding mark to market), which are a key ingredient of SVA, continue to be impacted by Callide coal issues but are expected to improve by $79.7m to $131.7m in 2014/2015. A net loss, after tax, of $18.5m (after deducting depreciation, amortisation and interest expense), is forecast for 2014/2015. This represents an improvement of $51.3m over the prior year. The improvements in operating earnings and in the net loss position in 2014/2015 results from the elimination of the carbon tax as well as increased generation from Kogan Creek Power Station due to the absence of an overhaul. Profitability may be significantly impacted by the legacy issues and uncertainties that have to be resolved in order to achieve the targets in this SCI. In particular, these include: 1. Uncertainty surrounding the timing and detail of the proposed repeal of the Clean Energy
Act 2011 (Cth), and carbon pricing mechanism; 2. Potential revenue variability due to the volatility of pool price assumptions; 3. The variability and subsequent financial impact of coal deliveries from Anglo American to the
Callide Power Station, and resolution of matters which are subject to litigation in relation to the Coal Supply Agreement with Anglo American; and
4. Uncertainty over the continued operation of the Boyne Island aluminium smelter.
Increasing Revenue / Gross Margin
CS Energy has a diversified portfolio of assets with the fastest ramp rate capability in the Queensland generation market. The market is characterised by low demand levels partially offset by supply side reductions. Market conditions are expected to start to improve when the first of the liquefied natural gas (LNG) plants on Curtis Island, QCLNG, commences operation from 31 December 2014, and should further improve with the commencement of the additional two LNG plants during Calendar 2015. The contract market is reflecting the expectation of these improvements in demand and the pool outcomes to date. A key risk remains the potential for this demand increase to be offset by reductions in demand from large industrial users, through either load curtailment or closure of operations. Other material factors affecting the short term include:
The changing consumption profile of consumers (record demand levels have not been achieved for some years);
Seasonal weather outcomes;
2014/2015 SCI Commercial in confidence 13
Callide fuel availability and the Callide coal dispute;
The extent of government initiated subsidy schemes and the subsequent impact on the demand profile; and
The extent of climate change action, including the proposed repeal of the existing carbon legislation and replacement with alternate schemes.
The ability of CS Energy to capture all of the opportunities created by the market strategies adopted has been limited by fuel availability. As outlined in the Strategic Projects section of the SCI, CS Energy is undertaking a number of actions to resolve the Callide coal dispute.
Optimal costs / value based decisions
Again, consistent with improving profitability and generating SVA, a strong focus on costs is necessary. This focus on cost reduction exists at both site and corporate levels and, for the two years ending 30 June 2014, CS Energy is forecasting to generate operating and capital cost savings of $88.2m compared with a target of $74.7m set by shareholding Ministers in September 2012. An active program to manage controllable costs has been implemented which includes strengthening accountability and improved cost discipline across the organisation. Other key ingredients of this reform program include better alignment of expenditure with organisational objectives, implementing procedures to optimise cost versus benefit evaluations, strategic procurement, improved work management practices and the variablisation of costs where possible. Management’s focus on cost reduction is being executed in the context of ensuring that all decisions are value based, i.e. all expenditure generates a positive return to the organisation and our shareholders. Management is committed to reducing costs to optimise financial performance, without further damaging the business. The following table provides a breakdown of other key measures across CS Energy’s portfolio.
Site Availability
(%) Generation
(GWhso)
Callide B 84.5 2,926
Callide C 92.5 1,570
Gladstone n/a1 1,4362
Kogan Creek 87.2 5,047
Wivenhoe 80.6 4
1. Not applicable as CS Energy does not operate the Gladstone Power Station. 2. Excludes Boyne Smelter Load.
Sensitivity Analyses
Deterministic and Probabilistic Sensitivity analyses have been included in this SCI. The sensitivity analyses provide the impact of changes in the key variables on CS Energy’s earnings in FY2015, at an EBIT level.
Carbon Price:
The uncertainty around the repeal of the current carbon legislation has the potential to have a significant impact on CS Energy’s EBIT in FY2015. The Commonwealth Government proposes to repeal the Carbon Pricing Mechanism (CPM), introduced under the Clean Energy Act 2011 (Cth), before 1 September 2014, with retrospective application to 1 July 2014. Being guided by the policy imperative and representations of the elected Federal Government and consistent with the position of others GOCs, the Board has adopted a zero carbon cost position in the SCI, effective 1 July 2014.
2014/2015 SCI Commercial in confidence 14
As the carbon price assumption is a key sensitivity to earnings for CS Energy, any deviation from the Federal Government’s implementation timetable will impact CS Energy’s earnings accordingly.
Pool & Contract Revenue:
The current electricity market is characterised by historically low demand levels and pool prices. Market conditions are expected to start to improve following the additional LNG load during FY2015, with the contract market reflecting the expectation of these improvements in demand and pool outcomes to date. However, a key risk remains that the potential demand increase is offset by reductions from large industrial users.
Cash flow and Debt
CS Energy’s financial performance continues to be impacted by a high debt level with net interest on debt expected to grow in 2014/2015 to $63.6m from $56.3m in 2013/2014, reflecting both a reduction in cash held for carbon tax payments and increased borrowings by $86.9m to $899.0m in 2014/2015.
CS Energy’s gearing ratio, forecast at 74.8% at 30 June 2014, suggests that CS Energy’s debt is too high but, more importantly CS Energy’s interest cover ratio provides insight into the impost on cash flows continuing from debt related interest costs. Interest cover is forecast to increase to 2.0 in 2014/2015, from 0.8 expected in 2013/2014, due to an improvement in operating earnings. Further details are provided in the ‘Profitability’ section below. Shareholder Value Added An important measure on CS Energy’s scorecard is Shareholder Value Added (SVA) which measures the residual value being generated for our shareholder. Ultimately, SVA is the measure of success for any commercial organisation. SVA is an estimate of economic profit, being the value created in excess of the return required by the company’s investors (being shareholders and debt providers), and is calculated by deducting a WACC charge on funds employed from adjusted operating profits. CS Energy’s Board and Management Team are aggressively reforming the business to establish a basis for generating SVA, and have made improvements in the company’s underlying performance. However, the Callide coal dispute, Gladstone Power Station onerous contract and CS Energy’s high debt level and associated interest expense mask these improvements. The Board and Management Team are working to resolve those issues that are within the company’s control, particularly the Callide coal dispute. Given CS Energy’s underlying commercial issues, the importance of optimising business financial performance, wherever possible, is underscored. In addition to profit-focussed initiatives relating to revenue and expenditure discussed below, CS Energy has a strong focus on managing cash flow, particularly in relation to capital expenditure. Major capital expenditure is assessed based on underlying business risk and life cycle discounted cash flow value analysis of plant maintenance alternatives. Selection of the preferred alternative is undertaken based on underlying business value, sensitivity analysis and consistency of risk profile with corporate objectives.
Strategic projects
Callide Coal Dispute
Anglo American (Anglo) has contracted with CS Energy and the Callide C Joint Venture to supply coal from the Callide Mine to the Callide B and Callide C Power Stations until 2031, under two separate Coal Supply Agreements (CSAs).
2014/2015 SCI Commercial in confidence 15
The resolution of the Callide coal dispute will remain the key focus of the Board and Management in 2014/2015, having commenced legal proceedings in 2013, while pursuing commercial negotiations in parallel. CS Energy has, and will continue to actively pursue its rights under the CSAs through the courts. CS Energy will continue to seek a commercial resolution which provides greater certainty of coal deliveries to the power stations and preserves shareholder value and optionality.
Kogan Creek Solar Boost Project
In July 2011, construction started on the Kogan Creek Solar Boost Project. A zero carbon cost from 1 July 2014 will be beneficial to CS Energy’s overall portfolio, but will have an adverse impact on the value of the Kogan Creek Solar Boost Project. Management is pursuing the most value accretive conclusion to this project.
Coal Monetisation
CS Energy portfolio includes coal assets located in the Surat Basin, consisting of the Kogan Creek Mine, the Glen Wilga coal resource, the Haystack Road resource and associated property ownership. The Kogan Creek Mine is the only operational coal resource at this time. The Kogan Creek Mine contains a significant volume of coal which is surplus to the Kogan Creek Power Station’s requirements. In 2014/2015, CS Energy will continue to monitor the following options to monetise its surplus coal assets:
fuel source for power generation;
domestic coal sales;
export coal sales; and
sale of the undeveloped coal resource.
In the short term, CS Energy will continue to investigate options to sell surplus coal production domestically, for either consumption or processing for export.
Callide Oxyfuel Project
The Callide Oxyfuel Project is a joint venture between CS Energy, ACA Low Emissions Technologies Ltd, Glencore, Schlumberger Carbon Services, and Japanese participants J-Power Group, Mitsui & Co., and IHI Corporation. The project is one of the world’s most advanced carbon capture projects and aims to demonstrate how carbon capture technology can be applied to new and existing coal-fired power stations to generate electricity with low emissions. The project was awarded $63 million from the Australian Government under the Low Emissions Technology Demonstration Fund. The Callide Oxyfuel Project has also received financial support from the Japanese and Queensland governments and technical support from JCOAL. The Callide Oxyfuel Project in central Queensland has now operated for more than one year in its intended demonstration mode, has passed the halfway mark of the planned 5,000 hours in oxy-firing mode and successfully completed more than 2,000 hours of industrial operation of the carbon dioxide capture plant. The Project remains on track for completion of the planned test schedule by November 2014, and finalisation of the site rehabilitation program by December 2015. The test schedule has however been impacted by the unavailability of coal as a result of the of the ongoing Callide coal supply issue. CS Energy will work with the Oxyfuel Joint Venture to minimise this impact, and where possible address this issue during the remainder of the 2014 calendar year.
2014/2015 SCI Commercial in confidence 16
Key performance metrics
In accordance with Section 119(3) of the Government Owned Corporations Act 1993 (GOC Act), the Board of CS Energy undertakes that the financial and non-financial targets and the financial statements will form the basis for assessment of quarterly outcomes reported to shareholding Ministers. Definitions for the financial and non-financial SCI targets are provided in Attachment 1 and are consistent with the key performance indicator definitions included in the quarterly reporting templates submitted by CS Energy to shareholding Ministers.
Financial key performance indicators
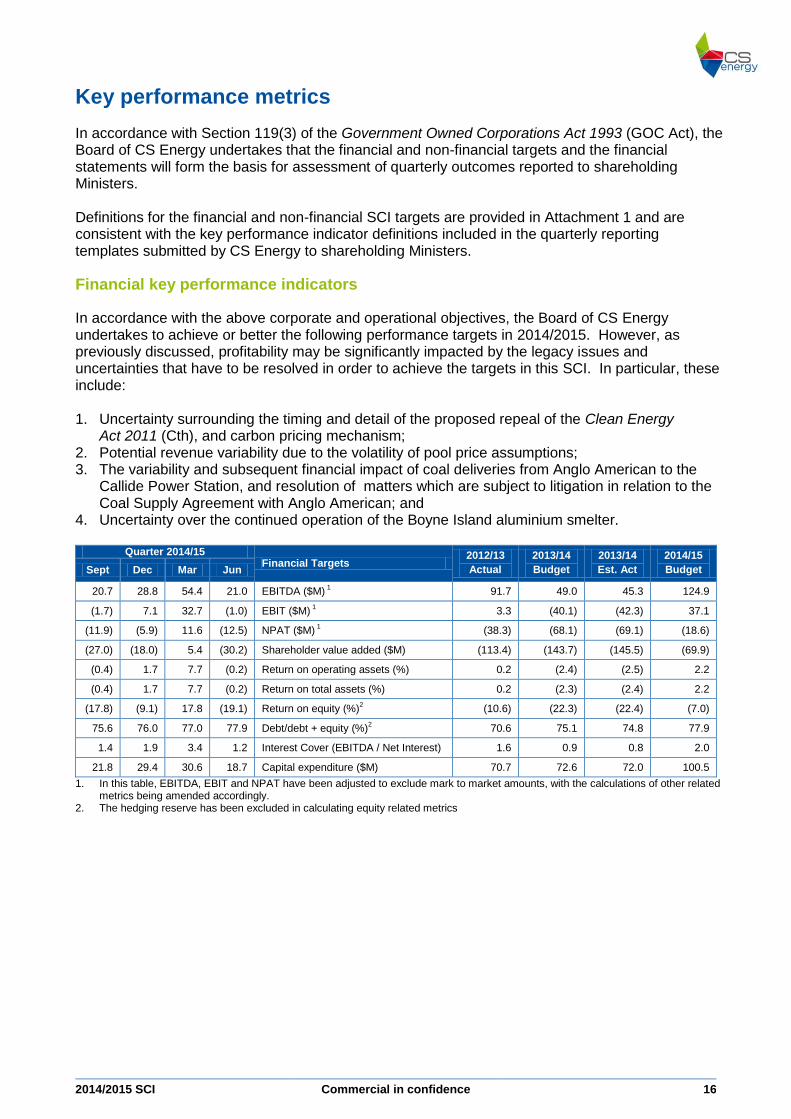
In accordance with the above corporate and operational objectives, the Board of CS Energy undertakes to achieve or better the following performance targets in 2014/2015. However, as previously discussed, profitability may be significantly impacted by the legacy issues and uncertainties that have to be resolved in order to achieve the targets in this SCI. In particular, these include: 1. Uncertainty surrounding the timing and detail of the proposed repeal of the Clean Energy
Act 2011 (Cth), and carbon pricing mechanism; 2. Potential revenue variability due to the volatility of pool price assumptions; 3. The variability and subsequent financial impact of coal deliveries from Anglo American to the
Callide Power Station, and resolution of matters which are subject to litigation in relation to the Coal Supply Agreement with Anglo American; and
4. Uncertainty over the continued operation of the Boyne Island aluminium smelter.
Quarter 2014/15 Financial Targets
2012/13
Actual
2013/14
Budget
2013/14
Est. Act
2014/15
Budget Sept Dec Mar Jun
20.7 28.8 54.4 21.0 EBITDA ($M) 1
91.7 49.0 45.3 124.9
(1.7) 7.1 32.7 (1.0) EBIT ($M) 1
3.3 (40.1) (42.3) 37.1
(11.9) (5.9) 11.6 (12.5) NPAT ($M) 1
(38.3) (68.1) (69.1) (18.6)
(27.0) (18.0) 5.4 (30.2) Shareholder value added ($M) (113.4) (143.7) (145.5) (69.9)
(0.4) 1.7 7.7 (0.2) Return on operating assets (%) 0.2 (2.4) (2.5) 2.2
(0.4) 1.7 7.7 (0.2) Return on total assets (%) 0.2 (2.3) (2.4) 2.2
(17.8) (9.1) 17.8 (19.1) Return on equity (%)2 (10.6) (22.3) (22.4) (7.0)
75.6 76.0 77.0 77.9 Debt/debt + equity (%)2 70.6 75.1 74.8 77.9
1.4 1.9 3.4 1.2 Interest Cover (EBITDA / Net Interest) 1.6 0.9 0.8 2.0
21.8 29.4 30.6 18.7 Capital expenditure ($M) 70.7 72.6 72.0 100.5
1. In this table, EBITDA, EBIT and NPAT have been adjusted to exclude mark to market amounts, with the calculations of other related metrics being amended accordingly.
2. The hedging reserve has been excluded in calculating equity related metrics
2014/2015 SCI Commercial in confidence 17
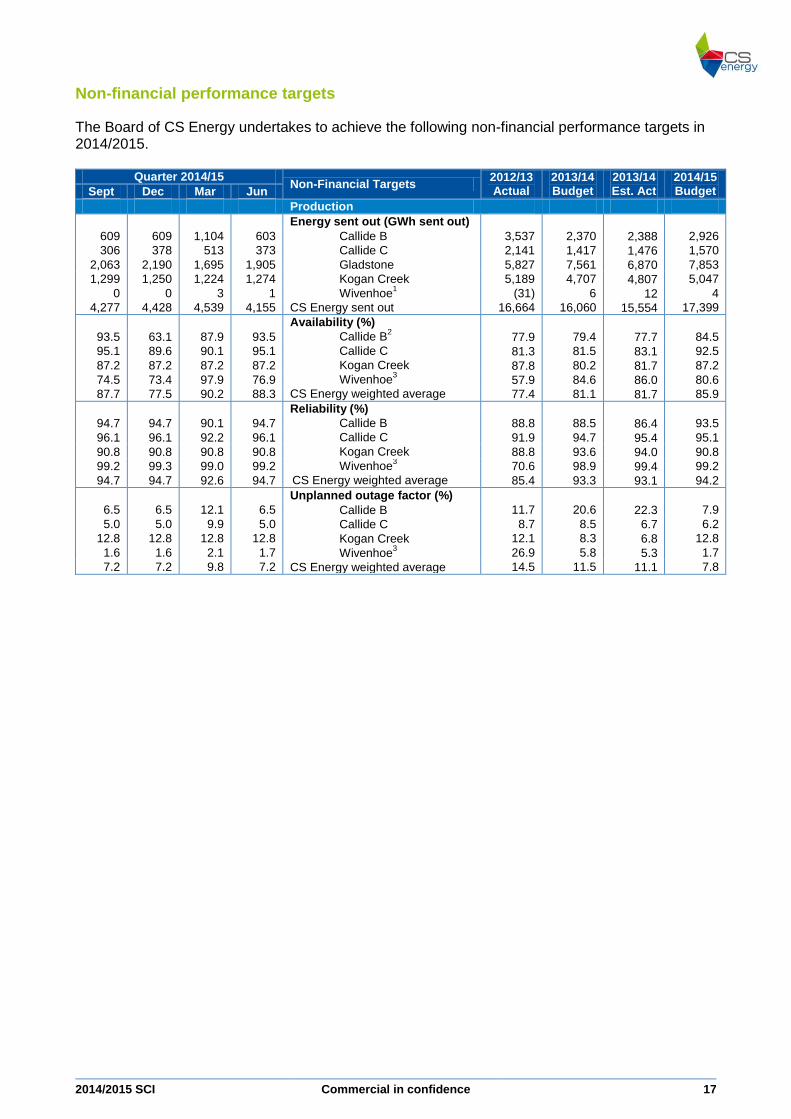
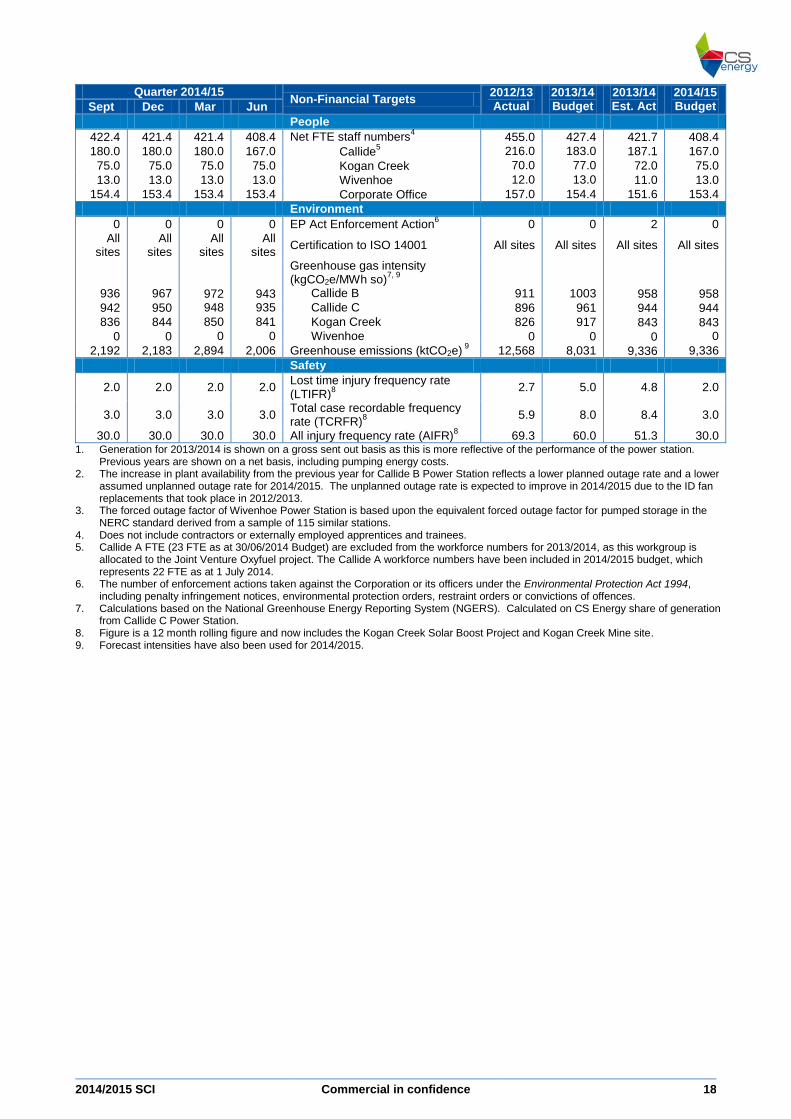
Non-financial performance targets
The Board of CS Energy undertakes to achieve the following non-financial performance targets in 2014/2015.
Quarter 2014/15 Non-Financial Targets
2012/13 Actual
2013/14 Budget
2013/14 Est. Act
2014/15 Budget Sept Dec Mar Jun
Production
Energy sent out (GWh sent out)
609 609 1,104 603 Callide B 3,537 2,370 2,388 2,926
306 378 513 373 Callide C 2,141 1,417 1,476 1,570
2,063 2,190 1,695 1,905 Gladstone 5,827 7,561 6,870 7,853
1,299 1,250 1,224 1,274 Kogan Creek 5,189 4,707 4,807 5,047
0 0 3 1 Wivenhoe1 (31) 6 12 4
4,277 4,428 4,539 4,155 CS Energy sent out 16,664 16,060 15,554 17,399
Availability (%)
93.5 63.1 87.9 93.5 Callide B2
77.9 79.4 77.7 84.5
95.1 89.6 90.1 95.1 Callide C 81.3 81.5 83.1 92.5
87.2 87.2 87.2 87.2 Kogan Creek 87.8 80.2 81.7 87.2
74.5 73.4 97.9 76.9 Wivenhoe3
57.9 84.6 86.0 80.6
87.7 77.5 90.2 88.3 CS Energy weighted average 77.4 81.1 81.7 85.9
Reliability (%)
94.7 94.7 90.1 94.7 Callide B 88.8 88.5 86.4 93.5
96.1 96.1 92.2 96.1 Callide C 91.9 94.7 95.4 95.1
90.8 90.8 90.8 90.8 Kogan Creek 88.8 93.6 94.0 90.8
99.2 99.3 99.0 99.2 Wivenhoe3 70.6 98.9 99.4 99.2
94.7 94.7 92.6 94.7 CS Energy weighted average 85.4 93.3 93.1 94.2
Unplanned outage factor (%)
6.5 6.5 12.1 6.5 Callide B 11.7 20.6 22.3 7.9
5.0 5.0 9.9 5.0 Callide C 8.7 8.5 6.7 6.2
12.8 12.8 12.8 12.8 Kogan Creek 12.1 8.3 6.8 12.8
1.6 1.6 2.1 1.7 Wivenhoe3 26.9 5.8 5.3 1.7
7.2 7.2 9.8 7.2 CS Energy weighted average 14.5 11.5 11.1 7.8
2014/2015 SCI Commercial in confidence 18
Quarter 2014/15 Non-Financial Targets
2012/13 Actual
2013/14 Budget
2013/14 Est. Act
2014/15 Budget Sept Dec Mar Jun
People
422.4 421.4 421.4 408.4 Net FTE staff numbers4
455.0 427.4 421.7 408.4
180.0 180.0 180.0 167.0 Callide5 216.0 183.0 187.1 167.0
75.0 75.0 75.0 75.0 Kogan Creek 70.0 77.0 72.0 75.0
13.0 13.0 13.0 13.0 Wivenhoe 12.0 13.0 11.0 13.0
154.4 153.4 153.4 153.4 Corporate Office 157.0 154.4 151.6 153.4
Environment
0 0 0 0 EP Act Enforcement Action6 0 0 2 0
All sites
All sites
All sites
All sites
Certification to ISO 14001 All sites All sites All sites All sites
Greenhouse gas intensity (kgCO2e/MWh so)
7, 9
936 967 972 943 Callide B 911 1003 958 958
942 950 948 935 Callide C 896 961 944 944
836 844 850 841 Kogan Creek 826 917 843 843
0 0 0 0 Wivenhoe 0 0 0 0
2,192 2,183 2,894 2,006 Greenhouse emissions (ktCO2e) 9
12,568 8,031 9,336 9,336
Safety
2.0 2.0 2.0 2.0 Lost time injury frequency rate (LTIFR)
8 2.7 5.0 4.8 2.0
3.0 3.0 3.0 3.0 Total case recordable frequency rate (TCRFR)
8 5.9 8.0 8.4 3.0
30.0 30.0 30.0 30.0 All injury frequency rate (AIFR)8
69.3 60.0 51.3 30.0 1. Generation for 2013/2014 is shown on a gross sent out basis as this is more reflective of the performance of the power station.
Previous years are shown on a net basis, including pumping energy costs. 2. The increase in plant availability from the previous year for Callide B Power Station reflects a lower planned outage rate and a lower
assumed unplanned outage rate for 2014/2015. The unplanned outage rate is expected to improve in 2014/2015 due to the ID fan replacements that took place in 2012/2013.
3. The forced outage factor of Wivenhoe Power Station is based upon the equivalent forced outage factor for pumped storage in the NERC standard derived from a sample of 115 similar stations.
4. Does not include contractors or externally employed apprentices and trainees. 5. Callide A FTE (23 FTE as at 30/06/2014 Budget) are excluded from the workforce numbers for 2013/2014, as this workgroup is
allocated to the Joint Venture Oxyfuel project. The Callide A workforce numbers have been included in 2014/2015 budget, which represents 22 FTE as at 1 July 2014.
6. The number of enforcement actions taken against the Corporation or its officers under the Environmental Protection Act 1994, including penalty infringement notices, environmental protection orders, restraint orders or convictions of offences.
7. Calculations based on the National Greenhouse Energy Reporting System (NGERS). Calculated on CS Energy share of generation from Callide C Power Station.
8. Figure is a 12 month rolling figure and now includes the Kogan Creek Solar Boost Project and Kogan Creek Mine site. 9. Forecast intensities have also been used for 2014/2015.
2014/2015 SCI Commercial in confidence 19
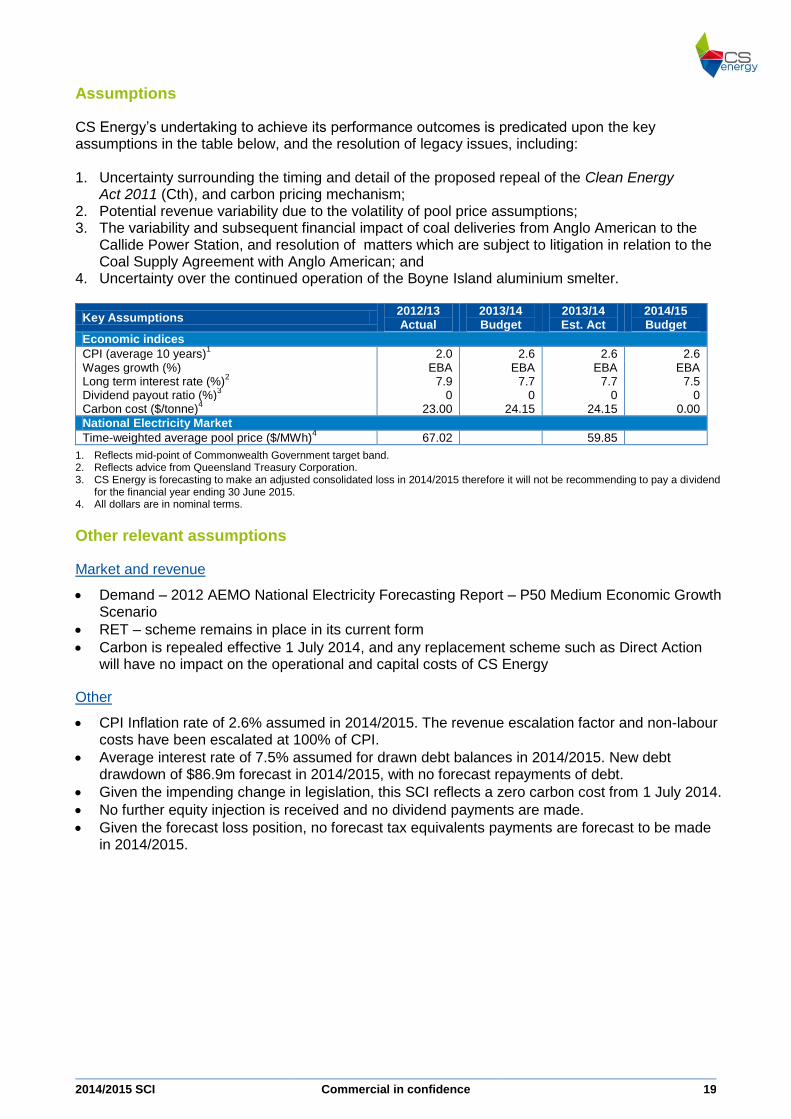
Assumptions
CS Energy’s undertaking to achieve its performance outcomes is predicated upon the key assumptions in the table below, and the resolution of legacy issues, including: 1. Uncertainty surrounding the timing and detail of the proposed repeal of the Clean Energy
Act 2011 (Cth), and carbon pricing mechanism; 2. Potential revenue variability due to the volatility of pool price assumptions; 3. The variability and subsequent financial impact of coal deliveries from Anglo American to the
Callide Power Station, and resolution of matters which are subject to litigation in relation to the Coal Supply Agreement with Anglo American; and
4. Uncertainty over the continued operation of the Boyne Island aluminium smelter.
Key Assumptions 2012/13 Actual
2013/14 Budget
2013/14 Est. Act
2014/15 Budget
Economic indices
CPI (average 10 years)1 2.0 2.6 2.6 2.6
Wages growth (%)
EBA EBA EBA EBA Long term interest rate (%)
2 7.9 7.7 7.7 7.5
Dividend payout ratio (%)3
0 0 0 0 Carbon cost ($/tonne)
4 23.00 24.15 24.15 0.00
National Electricity Market
Time-weighted average pool price ($/MWh)4
67.02 59.85
1. Reflects mid-point of Commonwealth Government target band. 2. Reflects advice from Queensland Treasury Corporation. 3. CS Energy is forecasting to make an adjusted consolidated loss in 2014/2015 therefore it will not be recommending to pay a dividend
for the financial year ending 30 June 2015. 4. All dollars are in nominal terms.
Other relevant assumptions
Market and revenue
Demand – 2012 AEMO National Electricity Forecasting Report – P50 Medium Economic Growth Scenario
RET – scheme remains in place in its current form
Carbon is repealed effective 1 July 2014, and any replacement scheme such as Direct Action will have no impact on the operational and capital costs of CS Energy
Other
CPI Inflation rate of 2.6% assumed in 2014/2015. The revenue escalation factor and non-labour costs have been escalated at 100% of CPI.
Average interest rate of 7.5% assumed for drawn debt balances in 2014/2015. New debt drawdown of $86.9m forecast in 2014/2015, with no forecast repayments of debt.
Given the impending change in legislation, this SCI reflects a zero carbon cost from 1 July 2014.
No further equity injection is received and no dividend payments are made.
Given the forecast loss position, no forecast tax equivalents payments are forecast to be made in 2014/2015.
2014/2015 SCI Commercial in confidence 20
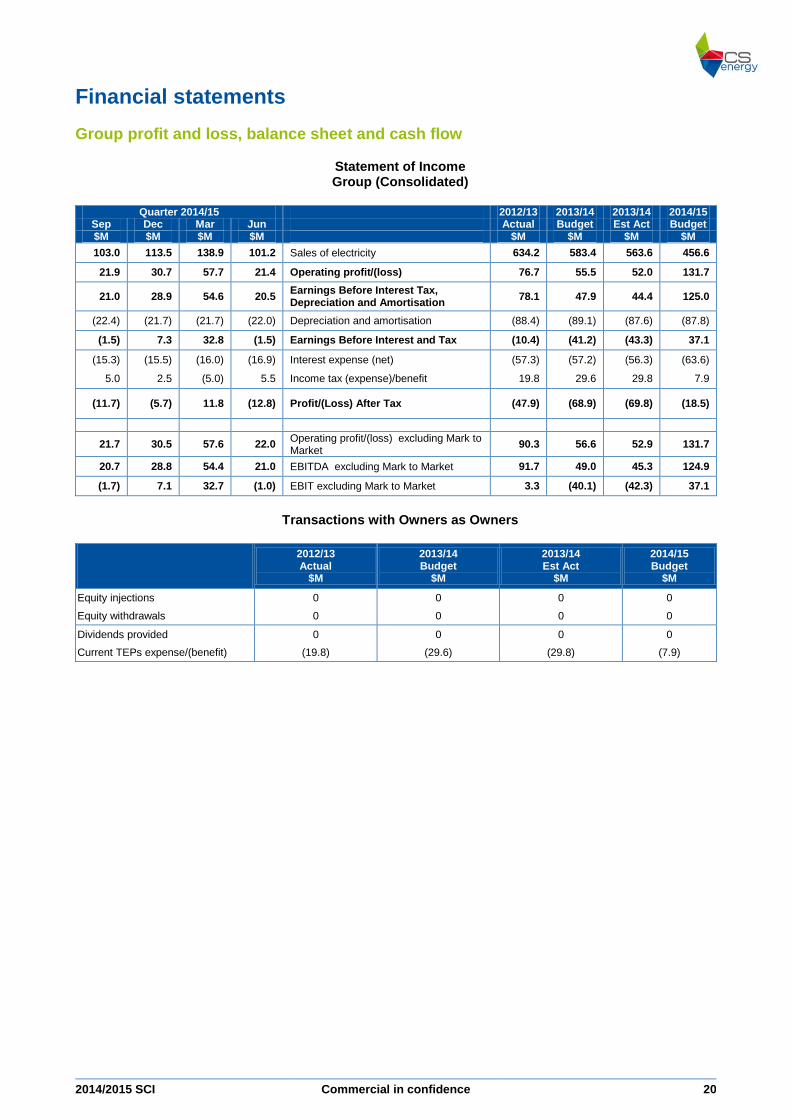
Financial statements
Group profit and loss, balance sheet and cash flow
Statement of Income Group (Consolidated)
Quarter 2014/15 2012/13 2013/14 2013/14 2014/15 Sep Dec Mar Jun Actual Budget Est Act Budget $M $M $M $M $M $M $M $M
103.0 113.5 138.9 101.2 Sales of electricity
634.2 583.4 563.6 456.6
21.9 30.7 57.7 21.4 Operating profit/(loss) 76.7 55.5 52.0 131.7
21.0 28.9 54.6 20.5 Earnings Before Interest Tax, Depreciation and Amortisation
78.1 47.9 44.4 125.0
(22.4) (21.7) (21.7) (22.0) Depreciation and amortisation (88.4) (89.1) (87.6) (87.8)
(1.5) 7.3 32.8 (1.5) Earnings Before Interest and Tax (10.4) (41.2) (43.3) 37.1
(15.3) (15.5) (16.0) (16.9) Interest expense (net) (57.3) (57.2) (56.3) (63.6)
5.0 2.5 (5.0) 5.5 Income tax (expense)/benefit 19.8 29.6 29.8 7.9
(11.7) (5.7) 11.8 (12.8) Profit/(Loss) After Tax (47.9) (68.9) (69.8) (18.5)
21.7 30.5 57.6 22.0 Operating profit/(loss) excluding Mark to Market 90.3 56.6 52.9 131.7
20.7 28.8 54.4 21.0 EBITDA excluding Mark to Market 91.7 49.0 45.3 124.9
(1.7) 7.1 32.7 (1.0) EBIT excluding Mark to Market 3.3 (40.1) (42.3) 37.1
Transactions with Owners as Owners
2012/13 Actual
$M
2013/14 Budget
$M
2013/14 Est Act
$M
2014/15 Budget
$M
Equity injections 0 0 0 0
Equity withdrawals 0 0 0 0
Dividends provided 0 0 0 0
Current TEPs expense/(benefit) (19.8) (29.6) (29.8) (7.9)
2014/2015 SCI Commercial in confidence 21
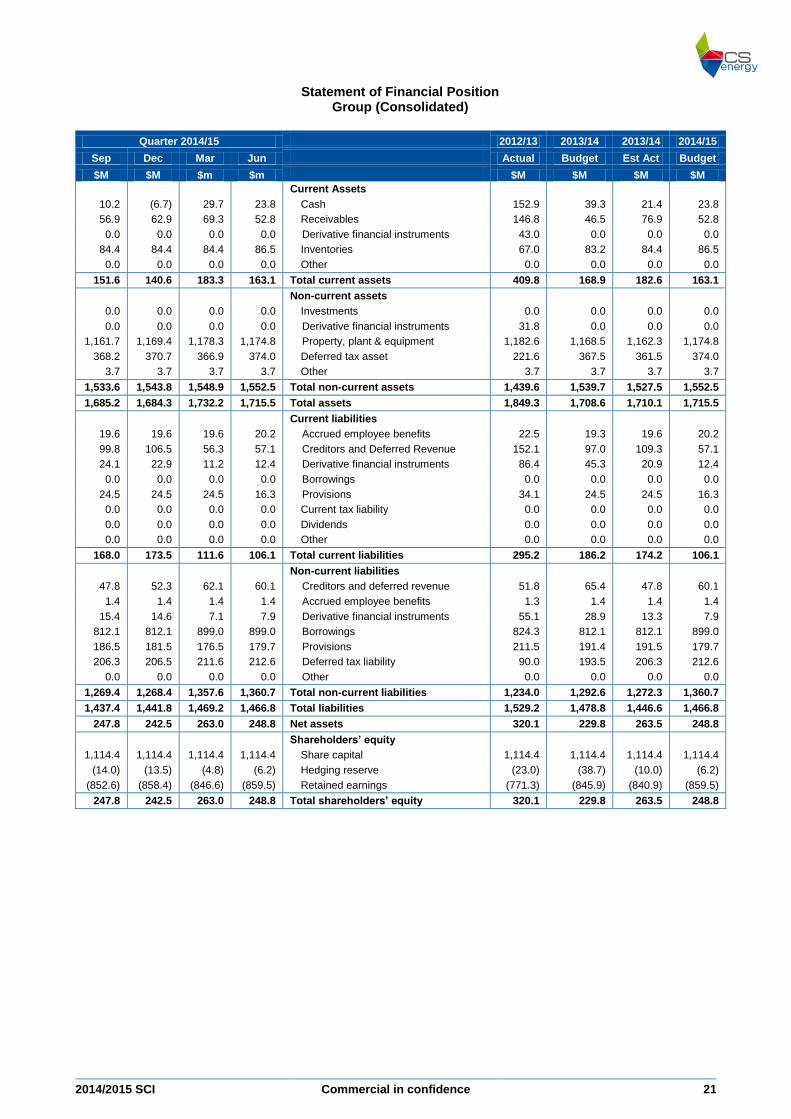
Statement of Financial Position Group (Consolidated)
Quarter 2014/15 2012/13 2013/14 2013/14 2014/15
Sep Dec Mar Jun Actual Budget Est Act Budget
$M $M $m $m $M $M $M $M
Current Assets 10.2 (6.7) 29.7 23.8 Cash 152.9 39.3 21.4 23.8
56.9 62.9 69.3 52.8 Receivables 146.8 46.5 76.9 52.8
0.0 0.0 0.0 0.0 Derivative financial instruments 43.0 0.0 0.0 0.0
84.4 84.4 84.4 86.5 Inventories 67.0 83.2 84.4 86.5
0.0 0.0 0.0 0.0 Other
0.0 0.0 0.0 0.0
151.6 140.6 183.3 163.1 Total current assets 409.8 168.9 182.6 163.1
Non-current assets
0.0 0.0 0.0 0.0 Investments 0.0 0.0 0.0 0.0
0.0 0.0 0.0 0.0 Derivative financial instruments 31.8 0.0 0.0 0.0
1,161.7 1,169.4 1,178.3 1,174.8 Property, plant & equipment 1,182.6 1,168.5 1,162.3 1,174.8
368.2 370.7 366.9 374.0 Deferred tax asset 221.6 367.5 361.5 374.0
3.7 3.7 3.7 3.7 Other
3.7 3.7 3.7 3.7
1,533.6 1,543.8 1,548.9 1,552.5 Total non-current assets 1,439.6 1,539.7 1,527.5 1,552.5
1,685.2 1,684.3 1,732.2 1,715.5 Total assets 1,849.3 1,708.6 1,710.1 1,715.5
Current liabilities
19.6 19.6 19.6 20.2 Accrued employee benefits 22.5 19.3 19.6 20.2
99.8 106.5 56.3 57.1 Creditors and Deferred Revenue 152.1 97.0 109.3 57.1
24.1 22.9 11.2 12.4 Derivative financial instruments 86.4 45.3 20.9 12.4
0.0 0.0 0.0 0.0 Borrowings 0.0 0.0 0.0 0.0
24.5 24.5 24.5 16.3 Provisions 34.1 24.5 24.5 16.3
0.0 0.0 0.0 0.0 Current tax liability 0.0 0.0 0.0 0.0
0.0 0.0 0.0 0.0 Dividends 0.0 0.0 0.0 0.0
0.0 0.0 0.0 0.0 Other
0.0 0.0 0.0 0.0
168.0 173.5 111.6 106.1 Total current liabilities 295.2 186.2 174.2 106.1
Non-current liabilities
47.8 52.3 62.1 60.1 Creditors and deferred revenue 51.8 65.4 47.8 60.1
1.4 1.4 1.4 1.4 Accrued employee benefits 1.3 1.4 1.4 1.4
15.4 14.6 7.1 7.9 Derivative financial instruments 55.1 28.9 13.3 7.9
812.1 812.1 899.0 899.0 Borrowings 824.3 812.1 812.1 899.0
186.5 181.5 176.5 179.7 Provisions 211.5 191.4 191.5 179.7
206.3 206.5 211.6 212.6 Deferred tax liability 90.0 193.5 206.3 212.6
0.0 0.0 0.0 0.0 Other 0.0 0.0 0.0 0.0
1,269.4 1,268.4 1,357.6 1,360.7 Total non-current liabilities 1,234.0 1,292.6 1,272.3 1,360.7
1,437.4 1,441.8 1,469.2 1,466.8 Total liabilities 1,529.2 1,478.8 1,446.6 1,466.8
247.8 242.5 263.0 248.8 Net assets 320.1 229.8 263.5 248.8
Shareholders’ equity
1,114.4 1,114.4 1,114.4 1,114.4 Share capital 1,114.4 1,114.4 1,114.4 1,114.4
(14.0) (13.5) (4.8) (6.2) Hedging reserve (23.0) (38.7) (10.0) (6.2)
(852.6) (858.4) (846.6) (859.5) Retained earnings (771.3) (845.9) (840.9) (859.5)
247.8 242.5 263.0 248.8 Total shareholders’ equity 320.1 229.8 263.5 248.8
2014/2015 SCI Commercial in confidence 22
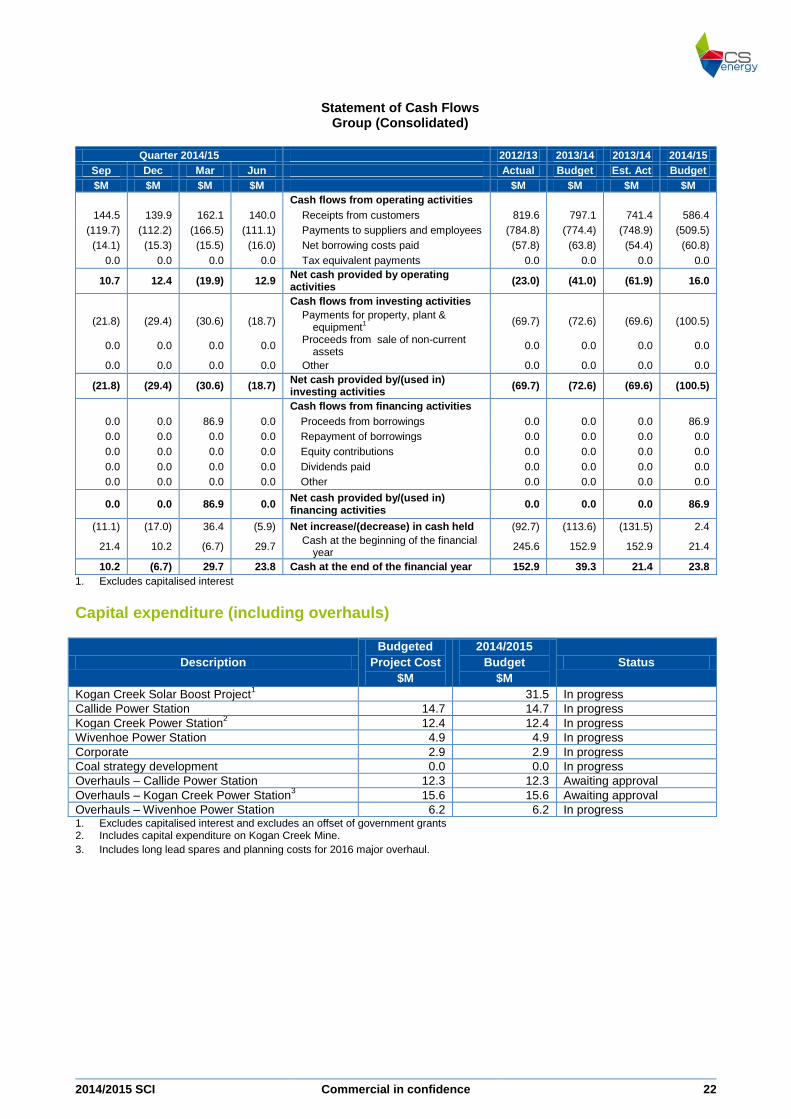
Statement of Cash Flows Group (Consolidated)
Quarter 2014/15 2012/13 2013/14 2013/14 2014/15
Sep Dec Mar Jun Actual Budget Est. Act Budget
$M $M $M $M $M $M $M $M
Cash flows from operating activities
144.5 139.9 162.1 140.0 Receipts from customers 819.6 797.1 741.4 586.4
(119.7) (112.2) (166.5) (111.1) Payments to suppliers and employees (784.8) (774.4) (748.9) (509.5)
(14.1) (15.3) (15.5) (16.0) Net borrowing costs paid (57.8) (63.8) (54.4) (60.8)
0.0 0.0 0.0 0.0 Tax equivalent payments 0.0 0.0 0.0 0.0
10.7 12.4 (19.9) 12.9 Net cash provided by operating activities
(23.0) (41.0) (61.9) 16.0
Cash flows from investing activities
(21.8) (29.4) (30.6) (18.7) Payments for property, plant &
equipment1 (69.7) (72.6) (69.6) (100.5)
0.0 0.0 0.0 0.0 Proceeds from sale of non-current
assets 0.0 0.0 0.0 0.0
0.0 0.0 0.0 0.0 Other 0.0 0.0 0.0 0.0
(21.8) (29.4) (30.6) (18.7) Net cash provided by/(used in) investing activities
(69.7) (72.6) (69.6) (100.5)
Cash flows from financing activities
0.0 0.0 86.9 0.0 Proceeds from borrowings 0.0 0.0 0.0 86.9
0.0 0.0 0.0 0.0 Repayment of borrowings 0.0 0.0 0.0 0.0
0.0 0.0 0.0 0.0 Equity contributions 0.0 0.0 0.0 0.0
0.0 0.0 0.0 0.0 Dividends paid 0.0 0.0 0.0 0.0
0.0 0.0 0.0 0.0 Other 0.0 0.0 0.0 0.0
0.0 0.0 86.9 0.0 Net cash provided by/(used in) financing activities
0.0 0.0 0.0 86.9
(11.1) (17.0) 36.4 (5.9) Net increase/(decrease) in cash held (92.7) (113.6) (131.5) 2.4
21.4 10.2 (6.7) 29.7 Cash at the beginning of the financial
year 245.6 152.9 152.9 21.4
10.2 (6.7) 29.7 23.8 Cash at the end of the financial year 152.9 39.3 21.4 23.8
1. Excludes capitalised interest
Capital expenditure (including overhauls)
Description
Budgeted
Project Cost
$M
2014/2015
Budget
$M
Status
Kogan Creek Solar Boost Project1 31.5 In progress
Callide Power Station 14.7 14.7 In progress
Kogan Creek Power Station2
12.4 12.4 In progress
Wivenhoe Power Station 4.9 4.9 In progress
Corporate 2.9 2.9 In progress
Coal strategy development 0.0 0.0 In progress
Overhauls – Callide Power Station 12.3 12.3 Awaiting approval
Overhauls – Kogan Creek Power Station3 15.6 15.6 Awaiting approval
Overhauls – Wivenhoe Power Station 6.2 6.2 In progress 1. Excludes capitalised interest and excludes an offset of government grants 2. Includes capital expenditure on Kogan Creek Mine.
3. Includes long lead spares and planning costs for 2016 major overhaul.
2014/2015 SCI Commercial in confidence 23
Additional requirements
As part of its performance agreement with shareholding Ministers, the Board provides the following additional undertakings.
Prudential financial information
The Board will ensure CS Energy takes full responsibility to ensure that prudent financial practices are applied both within the corporation and within its subsidiaries (whether fully controlled or otherwise). Without limiting the obligations imposed on the Board and the Chief Executive by the GOC Act and, where applicable, the Corporations Act 2001, this includes a commitment to:
Abide by the Code of Practice for Government Owned Corporations’ Financial Arrangements (Code of Practice), as issued by the Queensland Government; and
Establish, maintain and implement appropriate financial risk management practices and policies and as specified in the Code of Practice.
Capital structure
The Board will prudently manage the financing of the CS Energy group. As an integral part of the financing of the Company, overall debt will be managed with Queensland Treasury Corporation (QTC) to ensure that CS Energy maintains the appropriate credit rating or other rating as determined by shareholding Ministers.
Weighted average cost of capital
The Board will ensure that CS Energy reviews its weighted average cost of capital (WACC) on an annual basis. As part of the SCI process, CS Energy’s beta and optimal capital structure are being determined in consultation with shareholder representatives. Other than the annual review process, if CS Energy encounters a significant change to the risk profile of its business, it will recalculate its WACC in consultation with shareholder representatives. Details of CS Energy’s WACC calculations are provided in Attachment 4.
Dividend policy and payment
While the dividend process is governed by the Government Owned Corporations Act 1993 and the Corporations Act 2001 (Cth), the Board will also ensure that CS Energy’s dividend policy takes into account the return its shareholders expect on their investments. CS Energy’s policy is to recommend and pay a dividend of 80 per cent (or the percentage otherwise agreed with shareholding Ministers) of CS Energy’s adjusted consolidated profit subject to the requirements of Section 254T of the Corporations Act 2001. It is expected that the dividend letter to be provided by the Board to shareholding Ministers in May 2015 will indicate that no dividend will be payable for the financial year ending 30 June 2015, as CS Energy is forecasting to make an adjusted consolidated loss for the year ending 30 June 2015. A significant contributor to this loss position is the annual interest cost to service CS Energy’s debt. As part of CS Energy’s core reform objective focusing on optimal costs, CS Energy will review options for reducing both debt levels and the cost of debt, including programs to reduce interest rates and charges. CS Energy is forecasting to pay dividends in the future. When determining the actual dividend to be paid based on the audited financial results, the CS Energy Board will ensure shareholding Ministers are consulted through their departments, and that written agreement is received for any material changes to the adjustment items previously identified in May 2015, and for any subsequent new adjustment items identified. This written agreement is to be obtained by CS Energy prior to payment of the final dividend by the Board.
2014/2015 SCI Commercial in confidence 24
Corporate Governance guidelines for Government Owned Corporations
CS Energy has adopted all the recommendations in the Corporate Governance Guidelines for Government Owned Corporations (Corporate Governance Guidelines).
Risk management
The CS Energy Board has ultimate responsibility for ensuring the impacts of all potential internal and external risks of the Company are managed. The Company’s risk identification and management process is monitored by the Audit and Risk Committee, which is a subcommittee of the Board and which reports to the Board on a regular basis. The risk management framework is designed to ensure that all potential financial, operational and other risks are regularly identified, assessed, monitored and reported to the Audit and Risk Committee and the CS Energy Board, as appropriate, along with risk mitigation and management plans. In particular, potential security risks have been considered and identified and a framework to respond to security threats has been developed. The CS Energy Board will continually monitor security risks and update the Company’s response framework as necessary. Risk management plans have been incorporated in CS Energy’s budgetary and strategic planning processes.
Compliance with government policies
The Board will ensure that the CS Energy Group complies with the relevant government policies and guidelines, in particular, the approval, notification, reporting and other requirements of those policies and guidelines.
Sponsorship, advertising, corporate entertainment, and donations
Consistent with the shareholders expectations, the Corporate Entertainment and Hospitality Guidelines 2008 and CS Energy’s Corporate Entertainment and Hospitality Policy, all non-essential and non-committed sponsorships, advertising, entertainment and donations have been removed from the 2014/2015 budget. Details of the budgeted expenditure are provided in Attachment 3.
Employment and Industrial Relations Plan
An Employment and Industrial Relations (E&IR) Plan meeting the requirements of Section 149 of the GOC Act is included as Attachment 2. The remuneration arrangements for the Directors, the Chief Executive and all Senior Executives of CS Energy are detailed in the E&IR Plan.
Community Service Obligations (CSOs)
CS Energy has no Community Service Obligations as defined by section 112 of the GOC Act.
2014/2015 SCI Commercial in confidence 25
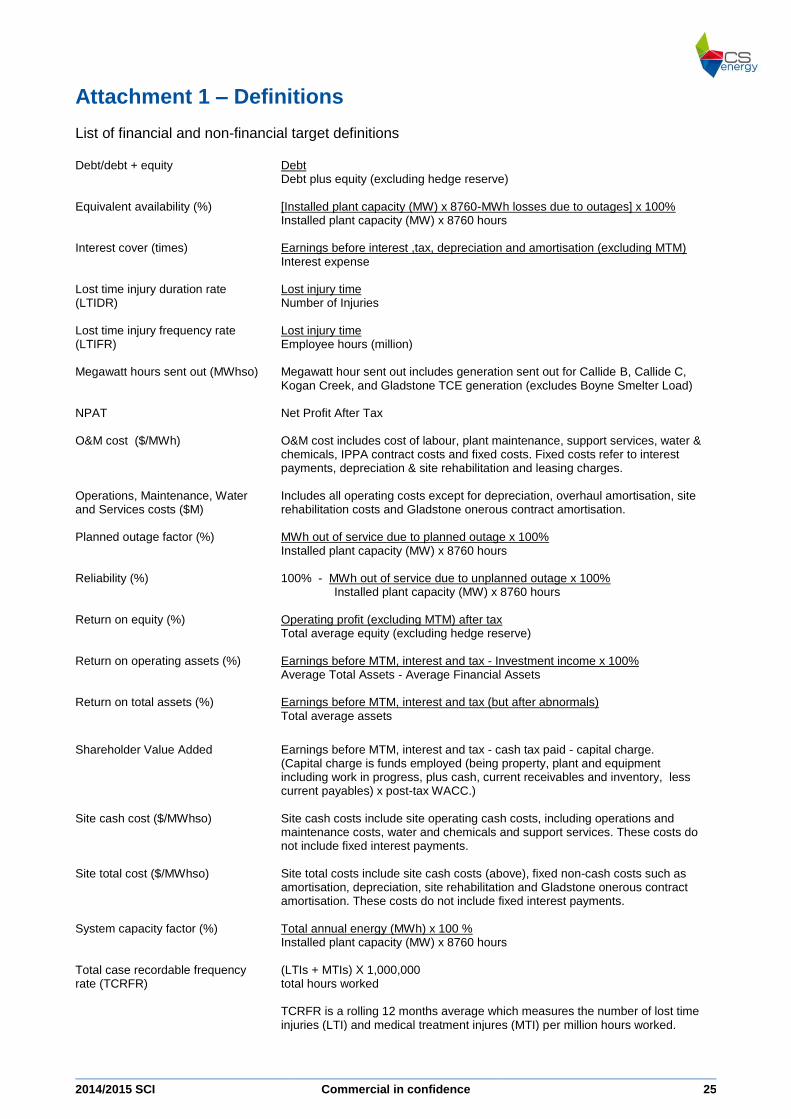
Attachment 1 – Definitions
List of financial and non-financial target definitions Debt/debt + equity Debt
Debt plus equity (excluding hedge reserve)
Equivalent availability (%) [Installed plant capacity (MW) x 8760-MWh losses due to outages] x 100% Installed plant capacity (MW) x 8760 hours
Interest cover (times) Earnings before interest ,tax, depreciation and amortisation (excluding MTM) Interest expense
Lost time injury duration rate (LTIDR)
Lost injury time Number of Injuries
Lost time injury frequency rate (LTIFR)
Lost injury time Employee hours (million)
Megawatt hours sent out (MWhso) Megawatt hour sent out includes generation sent out for Callide B, Callide C, Kogan Creek, and Gladstone TCE generation (excludes Boyne Smelter Load)
NPAT Net Profit After Tax
O&M cost ($/MWh)
O&M cost includes cost of labour, plant maintenance, support services, water & chemicals, IPPA contract costs and fixed costs. Fixed costs refer to interest payments, depreciation & site rehabilitation and leasing charges.
Operations, Maintenance, Water and Services costs ($M)
Includes all operating costs except for depreciation, overhaul amortisation, site rehabilitation costs and Gladstone onerous contract amortisation.
Planned outage factor (%)
MWh out of service due to planned outage x 100% Installed plant capacity (MW) x 8760 hours
Reliability (%)
100% - MWh out of service due to unplanned outage x 100% Installed plant capacity (MW) x 8760 hours
Return on equity (%) Operating profit (excluding MTM) after tax Total average equity (excluding hedge reserve)
Return on operating assets (%) Earnings before MTM, interest and tax - Investment income x 100% Average Total Assets - Average Financial Assets
Return on total assets (%) Earnings before MTM, interest and tax (but after abnormals) Total average assets
Shareholder Value Added Earnings before MTM, interest and tax - cash tax paid - capital charge. (Capital charge is funds employed (being property, plant and equipment including work in progress, plus cash, current receivables and inventory, less current payables) x post-tax WACC.)
Site cash cost ($/MWhso) Site cash costs include site operating cash costs, including operations and maintenance costs, water and chemicals and support services. These costs do not include fixed interest payments.
Site total cost ($/MWhso) Site total costs include site cash costs (above), fixed non-cash costs such as amortisation, depreciation, site rehabilitation and Gladstone onerous contract amortisation. These costs do not include fixed interest payments.
System capacity factor (%) Total annual energy (MWh) x 100 % Installed plant capacity (MW) x 8760 hours
Total case recordable frequency rate (TCRFR)
(LTIs + MTIs) X 1,000,000 total hours worked TCRFR is a rolling 12 months average which measures the number of lost time injuries (LTI) and medical treatment injures (MTI) per million hours worked.
2014/2015 SCI Commercial in confidence 26
Attachment 2 – Employment and Industrial Relations Plan
Employment and Industrial Relations philosophy and direction
Industrial Relations Strategy
The objective of CS Energy’s Industrial Relations Reform is to provide the company with a solid industrial relations framework that includes site-specific negotiating strategies. The framework aims to enable employee relations matters to be managed in a way which is consistent with shareholder requirements and the following business objectives:
To be a safe power generator;
To support CS Energy’s competitive market position;
To create productivity and efficiency opportunities.
The following negotiation objectives are part of the bargaining frameworks for all re-negotiations of the Enterprise Agreements (EA), which align with CS Energy’s broader strategic direction:
Compliance with Government Owned Corporations (GOC) Wages Policy (2012);
Restoring Managerial Prerogative;
Cost reduction;
Flexibility;
Cultural change; and
Consistency of approach across sites.
The content of replacement EAs will be consistent with GOC Wages Policy (2012). Negotiations for the replacement agreements will be carried out in accordance with the provisions of the Fair Work Act 2009 (FW Act), particularly with respect to the good faith bargaining objectives of the FW Act.
Enterprise Agreements
In 2014/2015, CS Energy will implement the Kogan Creek and Callide Enterprise Agreements, and commence preparations for the re-negotiation of the Corporate and Wivenhoe Enterprise Agreements, in accordance with the GOC Wages Policy 2012. Productivity initiatives and cost savings to be achieved during the life of these enterprise agreements will continue to be reported to shareholders quarterly. Each EA is tailored to suit the different location, environment, structure and operation of each power station and site. All agreements will be developed in consultation with employees and relevant unions. As part of the industrial relations framework implementation, a detailed risk assessment was completed and mitigation plans continue to be updated on an ongoing basis. Contingency plans for possible industrial action have been developed. To reflect the requirements under the FW Act and the Government Owned Corporations Bargaining Guidelines, a step by step project plan was developed and is being updated on an ongoing basis. A comprehensive communication plan to support the overall industrial relations reform strategy and negotiation strategy has been prepared and implemented. This includes providing timely and factual information to employees following each enterprise agreement meeting.
2014/2015 SCI Commercial in confidence 27
Remuneration arrangements
Chief and Senior Executives
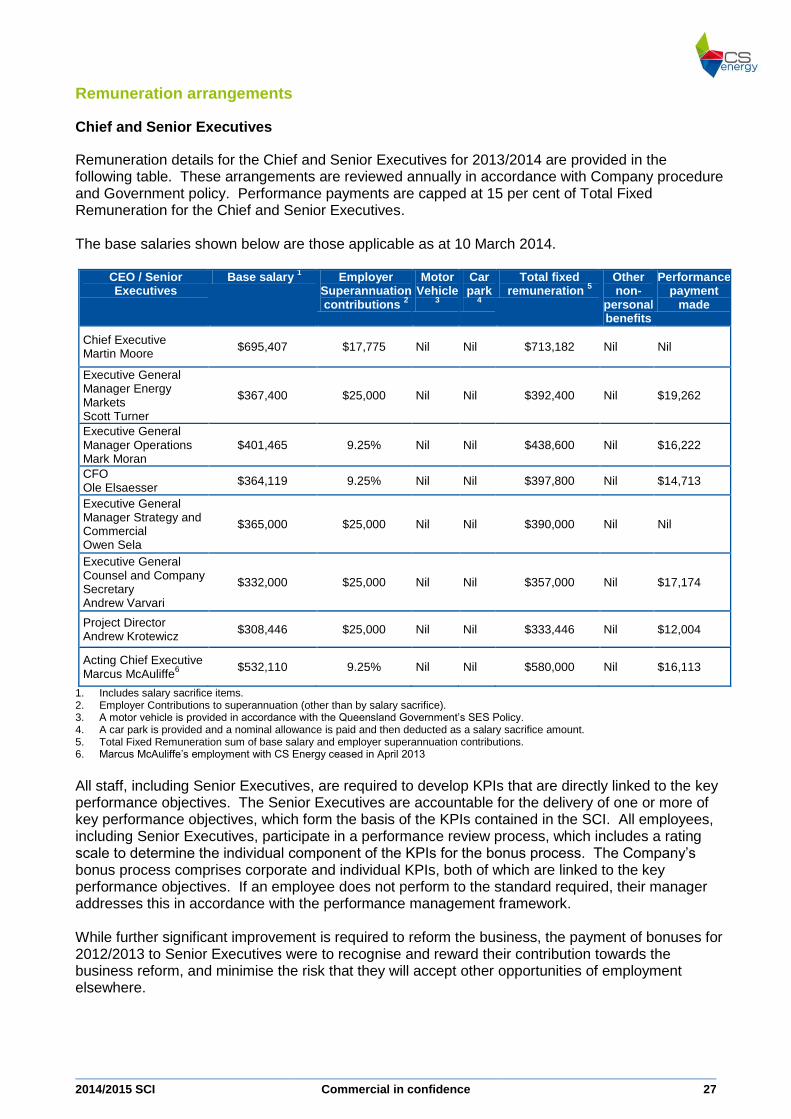
Remuneration details for the Chief and Senior Executives for 2013/2014 are provided in the following table. These arrangements are reviewed annually in accordance with Company procedure and Government policy. Performance payments are capped at 15 per cent of Total Fixed Remuneration for the Chief and Senior Executives. The base salaries shown below are those applicable as at 10 March 2014.
CEO / Senior Executives
Base salary 1 Employer
Superannuation contributions
2
Motor Vehicle
3
Car park
4
Total fixed remuneration
5
Other non-
personal benefits
Performance payment
made
Chief Executive Martin Moore
$695,407 $17,775 Nil Nil $713,182 Nil Nil
Executive General Manager Energy Markets Scott Turner
$367,400 $25,000 Nil Nil $392,400 Nil $19,262
Executive General Manager Operations Mark Moran
$401,465 9.25% Nil Nil $438,600 Nil $16,222
CFO Ole Elsaesser
$364,119 9.25% Nil Nil $397,800 Nil $14,713
Executive General Manager Strategy and Commercial Owen Sela
$365,000 $25,000 Nil Nil $390,000 Nil Nil
Executive General Counsel and Company Secretary Andrew Varvari
$332,000 $25,000 Nil Nil $357,000 Nil $17,174
Project Director Andrew Krotewicz
$308,446 $25,000 Nil Nil $333,446 Nil $12,004
Acting Chief Executive Marcus McAuliffe
6
$532,110 9.25% Nil Nil $580,000 Nil $16,113
1. Includes salary sacrifice items. 2. Employer Contributions to superannuation (other than by salary sacrifice). 3. A motor vehicle is provided in accordance with the Queensland Government’s SES Policy. 4. A car park is provided and a nominal allowance is paid and then deducted as a salary sacrifice amount. 5. Total Fixed Remuneration sum of base salary and employer superannuation contributions. 6. Marcus McAuliffe’s employment with CS Energy ceased in April 2013
All staff, including Senior Executives, are required to develop KPIs that are directly linked to the key performance objectives. The Senior Executives are accountable for the delivery of one or more of key performance objectives, which form the basis of the KPIs contained in the SCI. All employees, including Senior Executives, participate in a performance review process, which includes a rating scale to determine the individual component of the KPIs for the bonus process. The Company’s bonus process comprises corporate and individual KPIs, both of which are linked to the key performance objectives. If an employee does not perform to the standard required, their manager addresses this in accordance with the performance management framework. While further significant improvement is required to reform the business, the payment of bonuses for 2012/2013 to Senior Executives were to recognise and reward their contribution towards the business reform, and minimise the risk that they will accept other opportunities of employment elsewhere.
2014/2015 SCI Commercial in confidence 28
Examples of significant Senior Executive led achievements during 2012/2013 include:
delivery of a successful summer trading strategy;
establishment of new risk management and compliance frameworks;
cost optimisation via a robust cost review process, resulting in significant reduction in corporate costs;
implementation of a more robust program of measuring and accounting for electricity market derivatives; and
effective project management of capital works program.
Employment conditions
General conditions of employment are provided in various Enterprise Agreements (EAs) under the Fair Work Act 2009 (Cth), Alternative Individual Agreements (AIA), other industrial instruments and CS Energy human resources policies and procedures. Rates of pay, including productivity payments are included in EAs and all purpose allowances, where applicable (e.g. power house allowance, disability allowances, etc) are incorporated in all-up rates within those Enterprise Agreements. CS Energy and its employees are also governed by the Government Owned Corporations Act 1993 and Regulations, the Electricity Act 1994 and Electricity Regulation of 2006 and the Fair Work Act 2009. The Electrical Power Industry Award 2010 is the Modern Award which applies to the power generation industry. Alternative Individual Agreements (AIAs) provided for under EAs will continue to be offered where roles require special skills or employment flexibility, to ensure that CS Energy can attract and retain quality employees to compete effectively in the electricity market. 57.8% (257 employees) of employees are engaged under an EA and 42.2% (188 employees) are engaged under an AIA as at 10 March 2014. The terms and conditions of AIA employees are underpinned by the relevant Enterprise Agreements, in so far as an employee can be no worse off financially under an AIA.
Enterprise bargaining and productivity initiatives
Enterprise bargaining
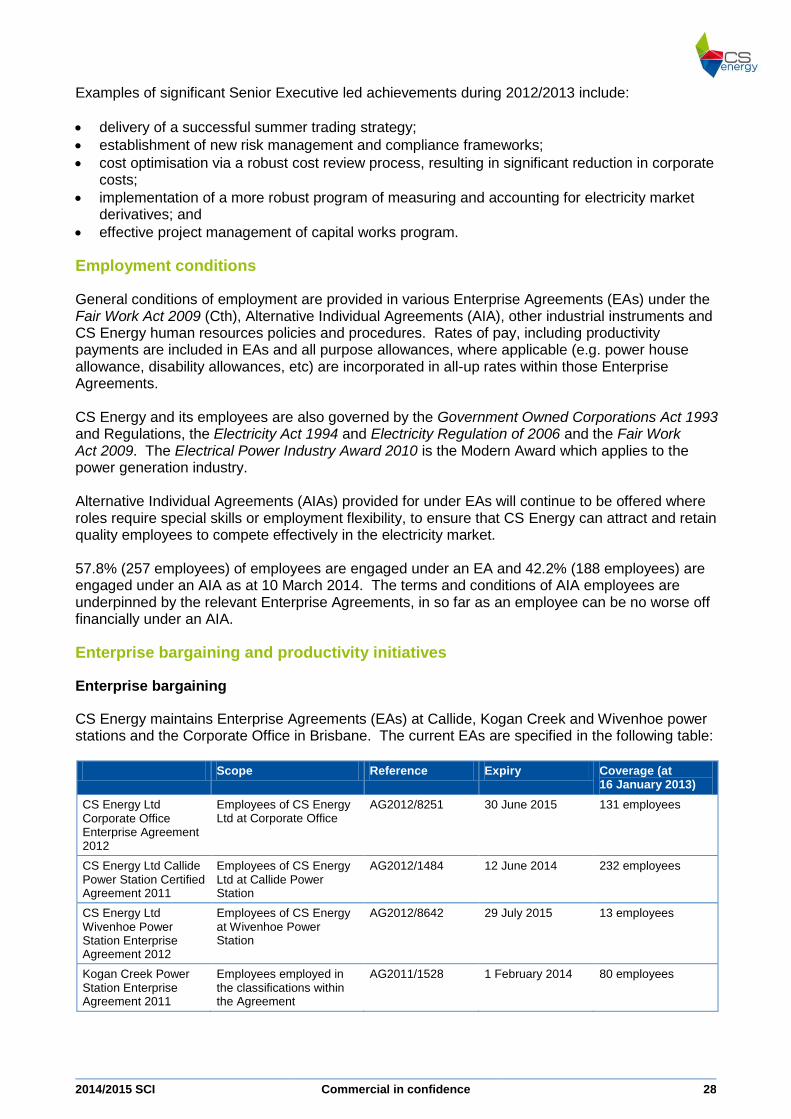
CS Energy maintains Enterprise Agreements (EAs) at Callide, Kogan Creek and Wivenhoe power stations and the Corporate Office in Brisbane. The current EAs are specified in the following table:
Scope Reference Expiry Coverage (at 16 January 2013)
CS Energy Ltd Corporate Office Enterprise Agreement 2012
Employees of CS Energy Ltd at Corporate Office
AG2012/8251 30 June 2015 131 employees
CS Energy Ltd Callide Power Station Certified Agreement 2011
Employees of CS Energy Ltd at Callide Power Station
AG2012/1484 12 June 2014 232 employees
CS Energy Ltd Wivenhoe Power Station Enterprise Agreement 2012
Employees of CS Energy at Wivenhoe Power Station
AG2012/8642 29 July 2015 13 employees
Kogan Creek Power Station Enterprise Agreement 2011
Employees employed in the classifications within the Agreement
AG2011/1528 1 February 2014 80 employees
2014/2015 SCI Commercial in confidence 29
Productivity initiatives
Each EA includes a number of productivity initiatives. CS Energy will provide shareholding Ministers with quarterly reports on the implementation and progress of the productivity initiatives included in CS Energy’s Enterprise Agreements.
Type of employment and workforce planning
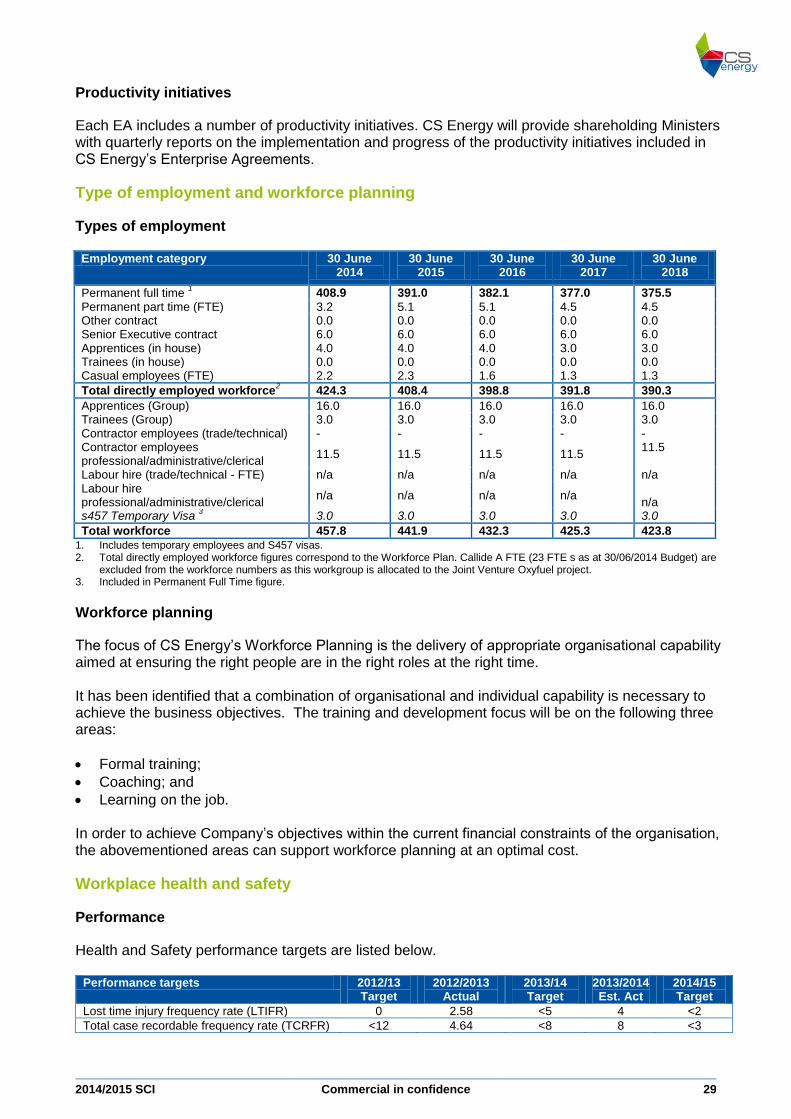
Types of employment
Employment category 30 June 2014
30 June 2015
30 June 2016
30 June 2017
30 June 2018
Permanent full time 1 408.9 391.0 382.1 377.0 375.5
Permanent part time (FTE) 3.2 5.1 5.1 4.5 4.5 Other contract 0.0 0.0 0.0 0.0 0.0 Senior Executive contract 6.0 6.0 6.0 6.0 6.0 Apprentices (in house) 4.0 4.0 4.0 3.0 3.0 Trainees (in house) 0.0 0.0 0.0 0.0 0.0 Casual employees (FTE) 2.2 2.3 1.6 1.3 1.3
Total directly employed workforce2 424.3 408.4 398.8 391.8 390.3
Apprentices (Group) 16.0 16.0 16.0 16.0 16.0 Trainees (Group) 3.0 3.0 3.0 3.0 3.0 Contractor employees (trade/technical) - - - - - Contractor employees professional/administrative/clerical
11.5 11.5 11.5 11.5 11.5
Labour hire (trade/technical - FTE) n/a n/a n/a n/a n/a Labour hire professional/administrative/clerical
n/a n/a n/a n/a n/a
s457 Temporary Visa 3 3.0 3.0 3.0 3.0 3.0
Total workforce 457.8 441.9 432.3 425.3 423.8 1. Includes temporary employees and S457 visas. 2. Total directly employed workforce figures correspond to the Workforce Plan. Callide A FTE (23 FTE s as at 30/06/2014 Budget) are
excluded from the workforce numbers as this workgroup is allocated to the Joint Venture Oxyfuel project. 3. Included in Permanent Full Time figure.
Workforce planning
The focus of CS Energy’s Workforce Planning is the delivery of appropriate organisational capability aimed at ensuring the right people are in the right roles at the right time. It has been identified that a combination of organisational and individual capability is necessary to achieve the business objectives. The training and development focus will be on the following three areas:
Formal training;
Coaching; and
Learning on the job.
In order to achieve Company’s objectives within the current financial constraints of the organisation, the abovementioned areas can support workforce planning at an optimal cost.
Workplace health and safety
Performance
Health and Safety performance targets are listed below.
Performance targets 2012/13 Target
2012/2013 Actual
2013/14 Target
2013/2014 Est. Act
2014/15 Target
Lost time injury frequency rate (LTIFR) 0 2.58 <5 4 <2
Total case recordable frequency rate (TCRFR) <12 4.64 <8 8 <3
2014/2015 SCI Commercial in confidence 30
The health and safety of all people on our sites is core to every aspect of our business. Having all people return home safe and well at the end of the day is central to everything that we do. We are committed to the goal of zero harm which means having a reduced target in both the LTIFR and TRCFR in 2014/2015. These lagging indicators will continue to be used to identify the effectiveness of the safety management system and will also assist the business with identifying and highlighting areas for specific exposure reduction initiatives over the next twelve months.
Equal Employment Opportunity (EEO) and anti-discrimination
CS Energy is committed to the creation and maintenance of an environment where all employees are able to contribute and operate to their full capacity and be recognised accordingly. CS Energy aims, through education strategies, to provide a workplace that is free from unlawful discrimination, sexual harassment, bullying, victimisation and vilification. All employees have access to the CS Energy Procedure for Equal Employment Opportunity (EEO) and Appropriate Workplace Behaviour and the Fair Treatment and Grievance Resolution System Procedure. The Recruitment and Selection Guidelines Procedure provides direction for all CS Energy recruitment and selection activities to be based on using fair, open and transparent processes to select the best person for the job within an efficient and effective process. These documents are available on the intranet or in hard copy from the People and Culture team, and are included in the induction process. A yearly face to face Code of Conduct Equal Employment Opportunity (EEO) training program contributes to the development of an organisational culture that is underpinned by a shared set of values, including obligations in relation to EEO. This program reinforces employee knowledge and ensures they understand their responsibilities and as well as expectations and requirements in relation to CS Energy’s principles and appropriate workplace behaviour. An online program is also available for new employees as part of their induction process. A new Code of Conduct to support a foundation for a safe, fair and productive work environment is being rolled out in 2014. In accordance with Section 31 of the Public Service Act 2008, CS Energy reports EEO statistical data to the Public Service Commission on an annual basis. CS Energy submitted a report in July 2013. The next report is due in July 2014.
Joint Venture projects
CS Energy (through its wholly owned subsidiary, Callide Energy Pty Ltd) remains in joint venture with IG Power (Callide) Pty Ltd at Callide C Power Station. Operations and maintenance services for Callide C Power Station are provided by CS Energy under a contract to the joint venture entity. CS Energy employees and some contractors are undertaking work for the joint venture. Relevant CS Energy employees are covered by the CS Energy Ltd Callide Power Station Certified Agreement 2008. CS Energy has a joint venture arrangement with CS Energy, ACA Low Emissions Technologies Ltd, Glencore, Schlumberger Carbon Services, and Japanese participants J-Power Group, Mitsui & Co., and IHI Corporation for the Callide Oxyfuel Project at Callide A Power Station. CS Energy employees are seconded to work for the Joint Venture Project for the period of the Callide Oxyfuel Project. At this stage, there are no direct employees of the Project, although this arrangement is not precluded.
2014/2015 SCI Commercial in confidence 31
Management of the relationship between GOCs and unions
CS Energy consults with staff and unions in accordance with Enterprise Agreements. Consultative forums include site consultative committees. A Peak Consultative Committee comprising senior management from the Company and union officials meets regularly.
Redundancy provisions
CS Energy and its subsidiaries remain a party to redundancy arrangements formalised through Enterprise Agreements (EAs), which provide for retraining and redeployment, including salary maintenance, as a first alternative to retrenchment. Severance payments contained in the Enterprise Agreements provide for three weeks pay for every year of service, to a maximum of 75 weeks, plus an early separation payment of 13 weeks, pro-rata long service leave and a re-training and outplacement support costing $1,000-$2,000 per employee, depending on the site. A “no disadvantage” provision in relation to redundancy arrangements exists for employees transferring to CS Energy from 1 July 2011 from Stanwell and Tarong (including employees at Wivenhoe Power Station) in relation to EAs applying to those employees immediately prior to 1 July 2011. This is consistent with the Government Guarantees and the Transition Principles arising out of the Generator Restructure which the Board of CS Energy is required to apply under the terms of the Direction from shareholding Ministers issued in accordance with Section 299 Electricity Act 1994. The Transition Principles cease to apply as at 30 June 2014.
Job security
Current CS Energy Enterprise Agreements (EAs) provide for no forced redundancies reflecting previous Government policy on job security. This will be reviewed in accordance with new Government Wages Policy 2012 in the renegotiation of the next Enterprise Agreements (EAs).
Contracting out
CS Energy will continue to comply with Enterprise Agreements and any applicable legislation on the use of contractors.
Superannuation
In accordance with Superannuation Guarantee (Administration) Act 1992, CS Energy offers membership of and contributes to a number of approved superannuation funds, as requested by employees. Under CS Energy policy, the Energy Super Fund is the default fund for new defined contribution fund members. The Energy Super Defined Benefit Fund which closed to new employees in 2002, has an employee contribution rate of five per cent and an employer contribution rate of 10 per cent. This rate is reviewed every two years by the Fund Actuary. Presently, 24 per cent of the CS Energy workforce remains in this plan. The remainder of the workforce are in a number of defined contribution funds, with 40 per cent of the workforce in the Superannuation Guarantee Contribution (SGC) employer fund (currently 9.25% contribution) and the remaining 36 percent of the workforce are in the contributory defined contribution fund where the employee contribution is five per cent, with CS Energy contributing 10 per cent. The SCG contribution increased from 9% to 9.25% from 1 July 2013 and will increase again to 9.5% in 2014/2015.
2014/2015 SCI Commercial in confidence 32
Consultation
Employees, unions and representatives of Queensland Treasury and Trade (QTT), the Department of Energy and Water Supply (DEWS), the Department of the Premier and Cabinet (DPC) and the Public Service Commission (PSC) have been consulted in the preparation of this Employment and Industrial Relations Plan.
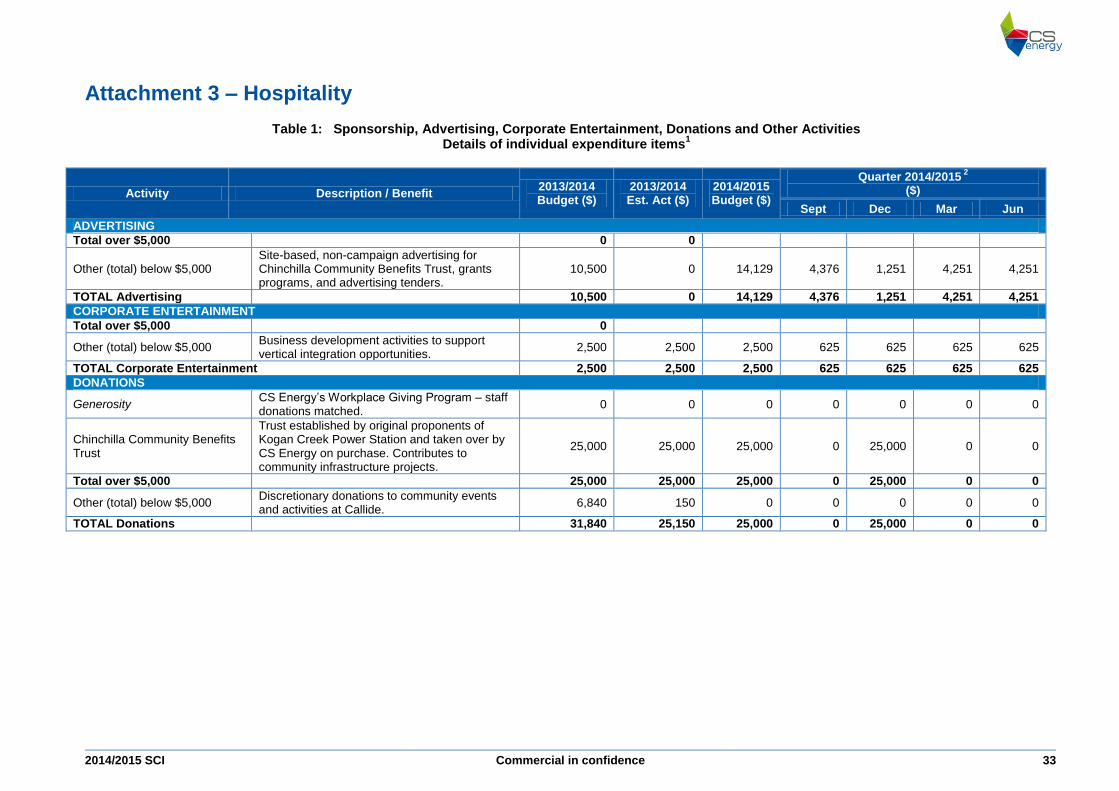
2014/2015 SCI Commercial in confidence 33
Attachment 3 – Hospitality
Table 1: Sponsorship, Advertising, Corporate Entertainment, Donations and Other Activities Details of individual expenditure items
1
Activity Description / Benefit 2013/2014 Budget ($)
2013/2014 Est. Act ($)
2014/2015 Budget ($)
Quarter 2014/2015 2
($)
Sept Dec Mar Jun
ADVERTISING
Total over $5,000 0 0
Other (total) below $5,000 Site-based, non-campaign advertising for Chinchilla Community Benefits Trust, grants programs, and advertising tenders.
10,500 0 14,129 4,376 1,251 4,251 4,251
TOTAL Advertising 10,500 0 14,129 4,376 1,251 4,251 4,251
CORPORATE ENTERTAINMENT
Total over $5,000 0
Other (total) below $5,000 Business development activities to support vertical integration opportunities.
2,500 2,500 2,500 625 625 625 625
TOTAL Corporate Entertainment 2,500 2,500 2,500 625 625 625 625
DONATIONS
Generosity CS Energy’s Workplace Giving Program – staff donations matched.
0 0 0 0 0 0 0
Chinchilla Community Benefits Trust
Trust established by original proponents of Kogan Creek Power Station and taken over by CS Energy on purchase. Contributes to community infrastructure projects.
25,000 25,000 25,000 0 25,000 0 0
Total over $5,000 25,000 25,000 25,000 0 25,000 0 0
Other (total) below $5,000 Discretionary donations to community events and activities at Callide.
6,840 150 0 0 0 0 0
TOTAL Donations 31,840 25,150 25,000 0 25,000 0 0
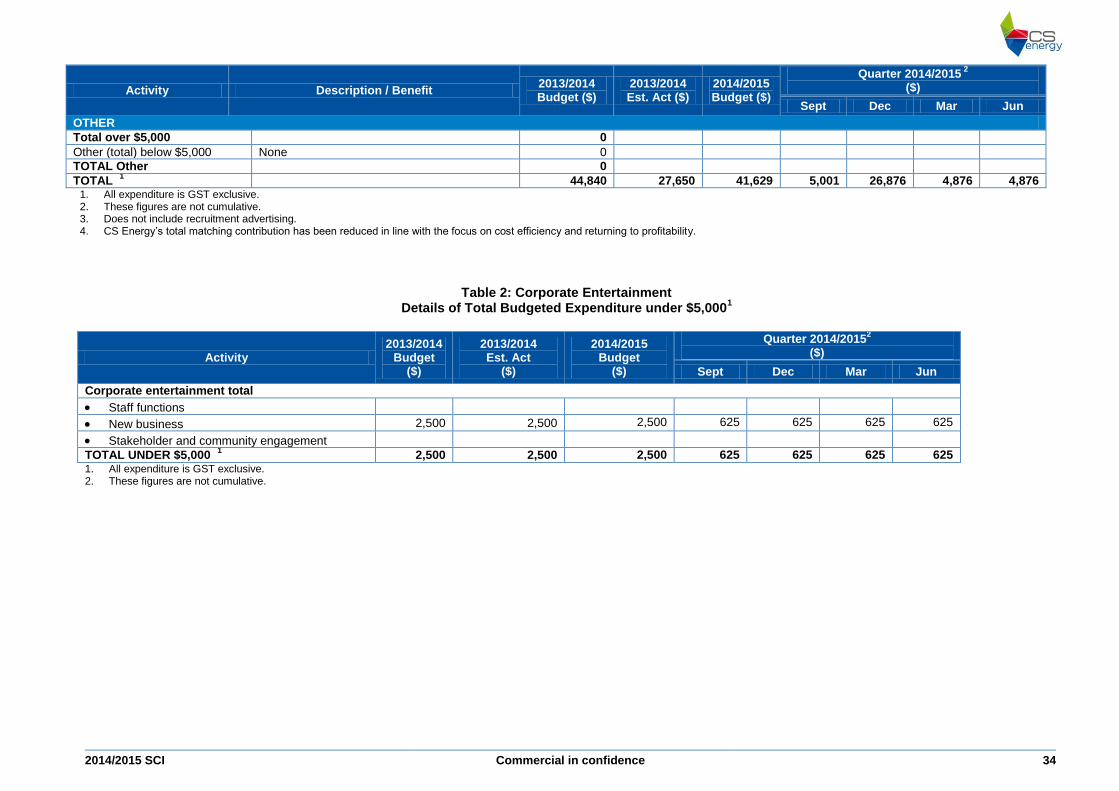
2014/2015 SCI Commercial in confidence 34
Activity Description / Benefit 2013/2014 Budget ($)
2013/2014 Est. Act ($)
2014/2015 Budget ($)
Quarter 2014/2015 2
($)
Sept Dec Mar Jun
OTHER
Total over $5,000 0
Other (total) below $5,000 None 0
TOTAL Other 0
TOTAL 1 44,840 27,650 41,629 5,001 26,876 4,876 4,876
1. All expenditure is GST exclusive. 2. These figures are not cumulative. 3. Does not include recruitment advertising. 4. CS Energy’s total matching contribution has been reduced in line with the focus on cost efficiency and returning to profitability.
Table 2: Corporate Entertainment Details of Total Budgeted Expenditure under $5,000
1
Activity 2013/2014
Budget ($)
2013/2014 Est. Act
($)
2014/2015 Budget
($)
Quarter 2014/20152
($)
Sept Dec Mar Jun
Corporate entertainment total
Staff functions
New business 2,500 2,500 2,500 625 625 625 625
Stakeholder and community engagement
TOTAL UNDER $5,000 1 2,500 2,500 2,500 625 625 625 625
1. All expenditure is GST exclusive. 2. These figures are not cumulative.
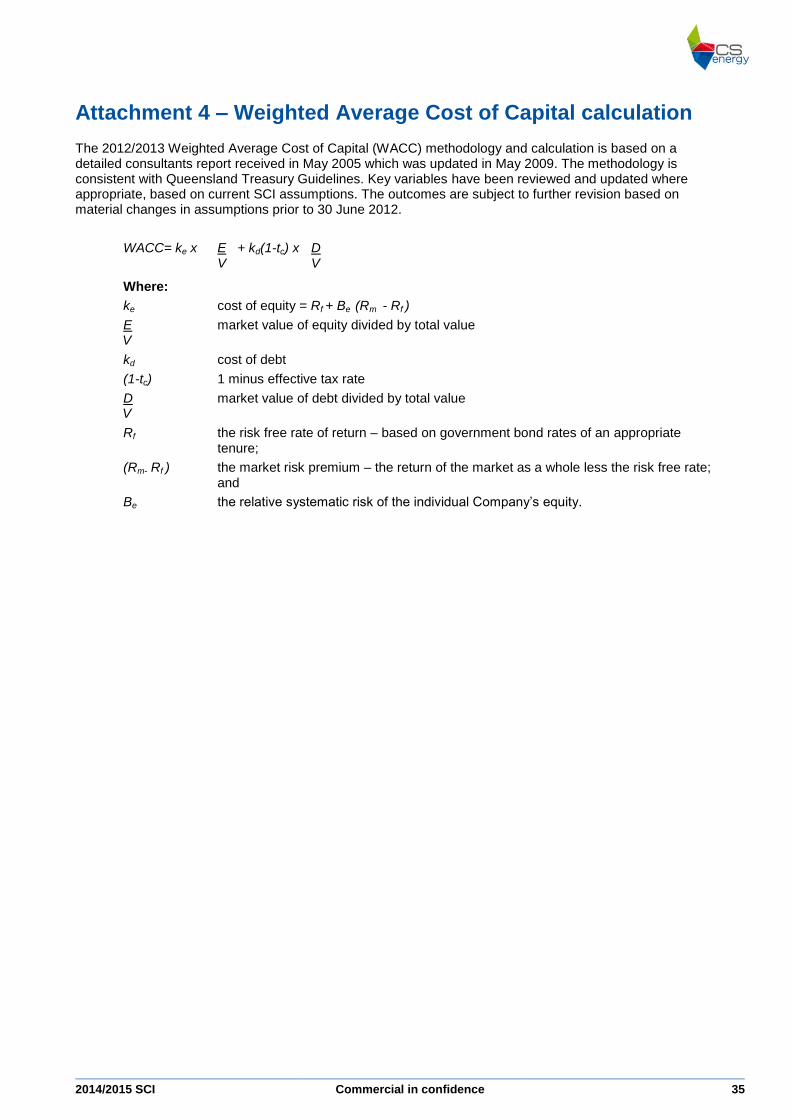
2014/2015 SCI Commercial in confidence 35
Attachment 4 – Weighted Average Cost of Capital calculation
The 2012/2013 Weighted Average Cost of Capital (WACC) methodology and calculation is based on a detailed consultants report received in May 2005 which was updated in May 2009. The methodology is consistent with Queensland Treasury Guidelines. Key variables have been reviewed and updated where appropriate, based on current SCI assumptions. The outcomes are subject to further revision based on material changes in assumptions prior to 30 June 2012.
WACC= ke x E + kd(1-tc) x D V V
Where:
ke cost of equity = Rf + Be (Rm - Rf )
E market value of equity divided by total value V
kd cost of debt
(1-tc) 1 minus effective tax rate
D market value of debt divided by total value V
Rf the risk free rate of return – based on government bond rates of an appropriate tenure;
(Rm- Rf ) the market risk premium – the return of the market as a whole less the risk free rate; and
Be the relative systematic risk of the individual Company’s equity.