STATEMENT OF CORPORATE INTENT 2012-13 - Power … · · 2012-05-10power and water corporation...
60
STATEMENT OF CORPORATE INTENT 2012-13 POWER AND WATER CORPORATION ANDROID APP ON
Transcript of STATEMENT OF CORPORATE INTENT 2012-13 - Power … · · 2012-05-10power and water corporation...
1
STATEMENT OF CORPORATE INTENT 2012-13
POWER AND WATER CORPORATION
ANDROID APP ON
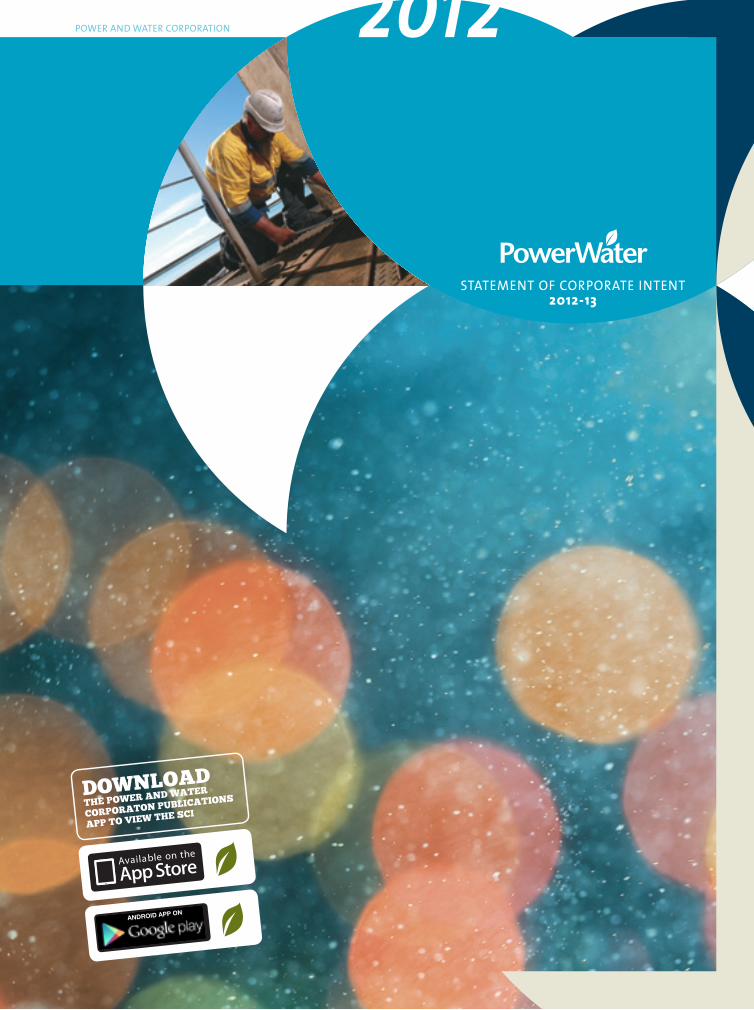
SAFETYINTEGRITY TEAMWORK COMMITMENTCOMMUNICATION
SAFETYProtecting the health and well-being of ourselves, contractors and the general public to achieve zero harm.
INTEGRITY Engendering trust through open, honest and ethical behaviours.
TEAMWORK Working together for a common purpose, achieving our goals in a supportive, respectful and enthusiastic manner.
COMMITMENTLeading by example, continually improving, accountable for our actions and carrying them out with passion and purpose.
COMMUNICATION Engaging in an open, positive and constructive way to obtain better individul and business outcomes.
WE VALUE:
SAFETYINTEGRITY TEAMWORK COMMITMENTCOMMUNICATION
3
6 RISKS 39Financial Position 41Prudent and Effective Capital Investment 42Environmental Considerations 43Regulatory Changes 46Demand for Service and Service Reliability 48Corporate Risk Register 50
7 CAPITAL EXPENDITURE 51 Generation 52 Power Networks 53
Water Services 53Sewerage Services 54Other Major Investment 54
APPENDIX 57Comparison of Australian Utility Tariffs
GLOSSARY 5
1 INTRODUCTION 7Strategic Direction 8Framework for Success 8Scope and Nature of Activities 9
2 STRATEGIES 11Financial Sustainability 14In Good Operational and Asset Health 17Organisationally Capable 19Environmentally Sustainable 21Trusted 22Indigenous Essential Services 23
3 MAJOR ASSUMPTIONS TO 2015 25Demand Forecasts 26Revenue Projections 28
4 FINANCIAL PROJECTIONS 31
5 TARGETS 33Tracking and Reporting Progress 34Strategic Management Framework 34Key Performance Indicators 35
POWER AND WATER CORPORATION STATEMENT OF CORPORATE INTENT 2012-13
CONTENTS

5
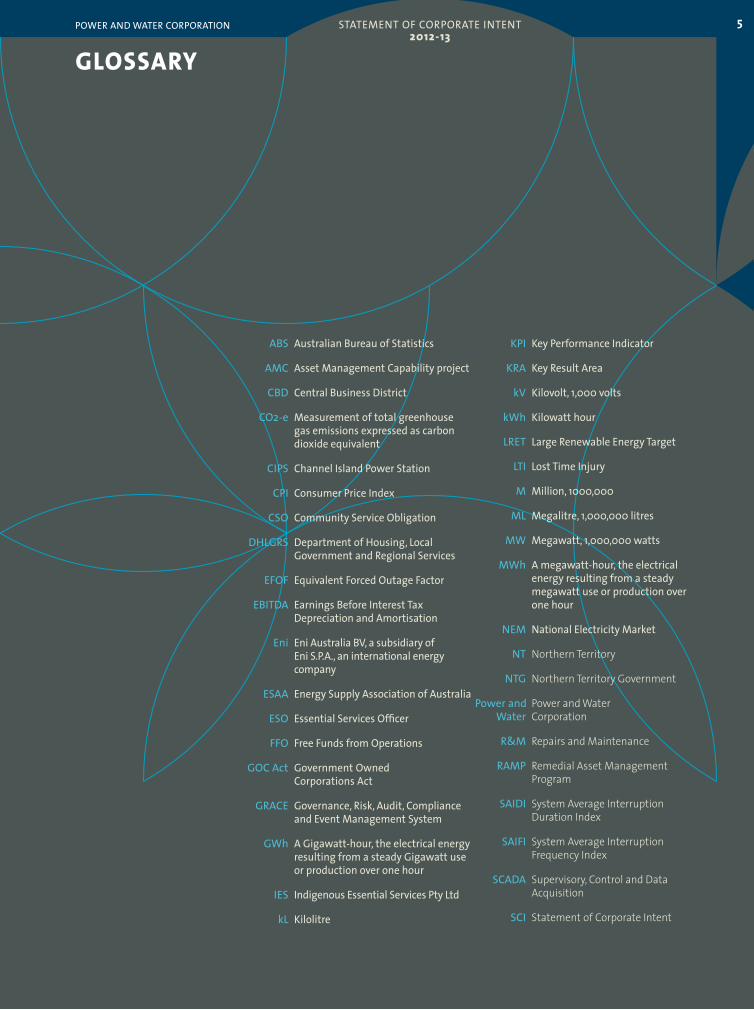
GLOSSARYPOWER AND WATER CORPORATION
KPI Key Performance Indicator
KRA Key Result Area
kV Kilovolt, 1,000 volts
kWh Kilowatt hour
LRET Large Renewable Energy Target
LTI Lost Time Injury
M Million, 1000,000
ML Megalitre, 1,000,000 litres
MW Megawatt, 1,000,000 watts
MWh A megawatt-hour, the electrical energy resulting from a steady megawatt use or production over one hour
NEM National Electricity Market
NT Northern Territory
NTG Northern Territory Government
Power and Power and Water Water Corporation
R&M Repairs and Maintenance
RAMP Remedial Asset Management Program
SAIDI System Average Interruption Duration Index
SAIFI System Average Interruption Frequency Index
SCADA Supervisory, Control and Data Acquisition
SCI Statement of Corporate Intent
STATEMENT OF CORPORATE INTENT 2012-13
ABS Australian Bureau of Statistics
AMC Asset Management Capability project
CBD Central Business District
CO2-e Measurement of total greenhouse gas emissions expressed as carbon dioxide equivalent
CIPS Channel Island Power Station
CPI Consumer Price Index
CSO Community Service Obligation
DHLGRS Department of Housing, Local Government and Regional Services
EFOF Equivalent Forced Outage Factor
EBITDA Earnings Before Interest Tax Depreciation and Amortisation
Eni Eni Australia BV, a subsidiary of Eni S.P.A., an international energy company
ESAA Energy Supply Association of Australia
ESO Essential Services Officer
FFO Free Funds from Operations
GOC Act Government Owned Corporations Act
GRACE Governance, Risk, Audit, Compliance and Event Management System
GWh A Gigawatt-hour, the electrical energy resulting from a steady Gigawatt use or production over one hour
IES Indigenous Essential Services Pty Ltd
kL Kilolitre
T5 Tranche 5 electricity customer – those who consume more than 160 MWh per annum
T6 Tranche 6 electricity customer – those who consume less than 160 MWh per annum
T2030 Territory 2030 Strategy (Northern Territory Government)
TBD To Be Determined
TGT Territory Growth Town
UC The Utilities Commission of the Northern Territory established by Part 2 of the Utilities Commission Act
WSAA Water Services Association of Australia
ZIP Zero Incident Process
SIHIP Strategic Indigenous Housing and Infrastructure Program
SRES Small Renewable Energy Scheme
STC Small-scale Technology Certificates (issued under the SRES)
STP Small-scale Technology Percentage
T1 Tranche 1 electricity customer – those who consume more than 4 GWh per annum
T2 Tranche 2 electricity customer – those who consume more than 3 GWh per annum
T3 Tranche 3 electricity customer – those who consume more than 2 GWh per annum
T4 Tranche 4 electricity customer – those who consume more than 750 MWh per annum
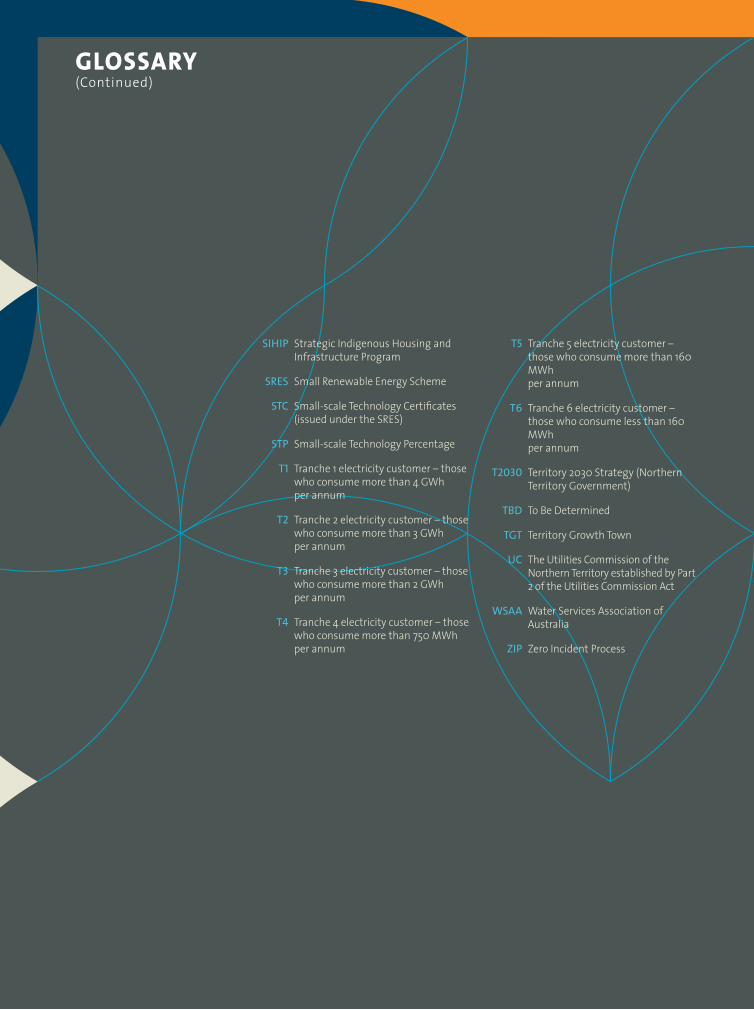
GLOSSARY (Continued)
7POWER AND WATER CORPORATION STATEMENT OF CORPORATE INTENT 2012-13
INTRODUCTION
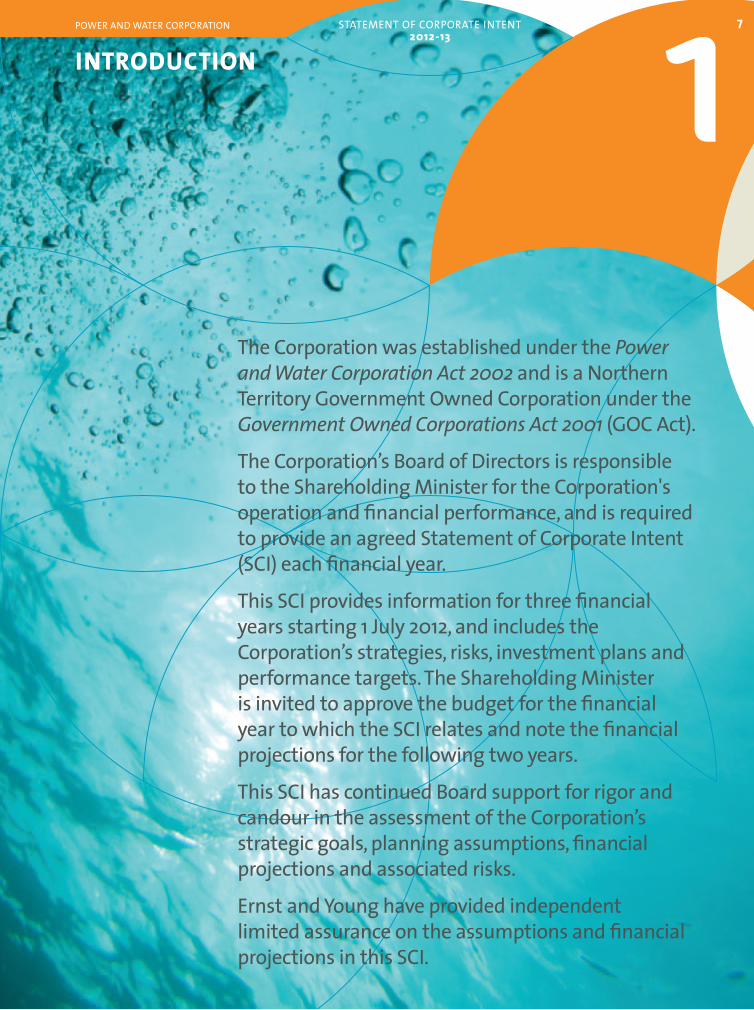
The Corporation was established under the Power and Water Corporation Act 2002 and is a Northern Territory Government Owned Corporation under the Government Owned Corporations Act 2001 (GOC Act).
The Corporation’s Board of Directors is responsible to the Shareholding Minister for the Corporation's operation and financial performance, and is required to provide an agreed Statement of Corporate Intent (SCI) each financial year.
This SCI provides information for three financial years starting 1 July 2012, and includes the Corporation’s strategies, risks, investment plans and performance targets. The Shareholding Minister is invited to approve the budget for the financial year to which the SCI relates and note the financial projections for the following two years.
This SCI has continued Board support for rigor and candour in the assessment of the Corporation’s strategic goals, planning assumptions, financial projections and associated risks.
Ernst and Young have provided independent limited assurance on the assumptions and financial projections in this SCI.
1
INTRODUCTION
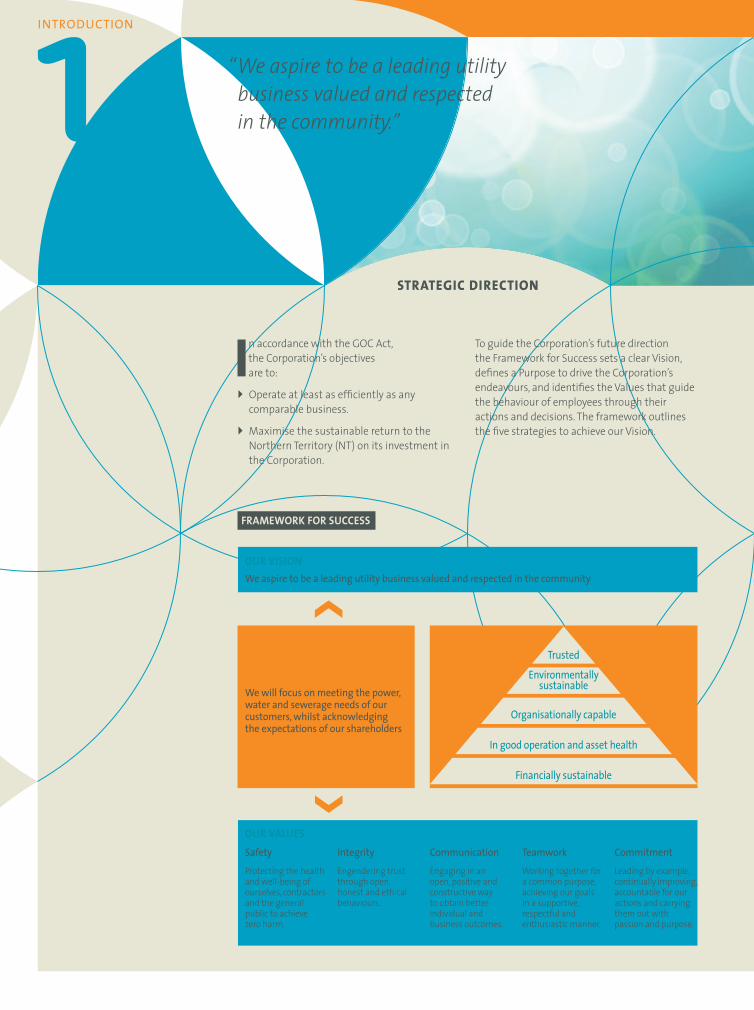
STRATEGIC DIRECTION
To guide the Corporation’s future direction the Framework for Success sets a clear Vision, defines a Purpose to drive the Corporation’s endeavours, and identifies the Values that guide the behaviour of employees through their actions and decisions. The framework outlines the five strategies to achieve our Vision.
In accordance with the GOC Act, the Corporation’s objectives are to:
} Operate at least as efficiently as any comparable business.
} Maximise the sustainable return to the Northern Territory (NT) on its investment in the Corporation.
FRAMEWORK FOR SUCCESS
OUR PURPOSE
We will focus on meeting the power, water and sewerage needs of our customers, whilst acknowledging the expectations of our shareholders
We aspire to be a leading utility business valued and respected in the community
OUR STRATEGIES
OUR VISION
Safety
Protecting the health and well-being of ourselves, contractors and the general public to achieve zero harm.
Integrity
Engendering trust through open, honest and ethical behaviours.
Communication
Engaging in an open, positive and constructive way to obtain better individual and business outcomes.
Teamwork
Working together for a common purpose, achieving our goals in a supportive, respectful and enthusiastic manner.
Commitment
Leading by example, continually improving, accountable for our actions and carrying them out with passion and purpose.
OUR VALUES
Organisationally capable
In good operation and asset health
Financially sustainable
Environmentally sustainable
Trusted
“Weaspiretobealeadingutilitybusinessvaluedandrespectedinthecommunity.”
9
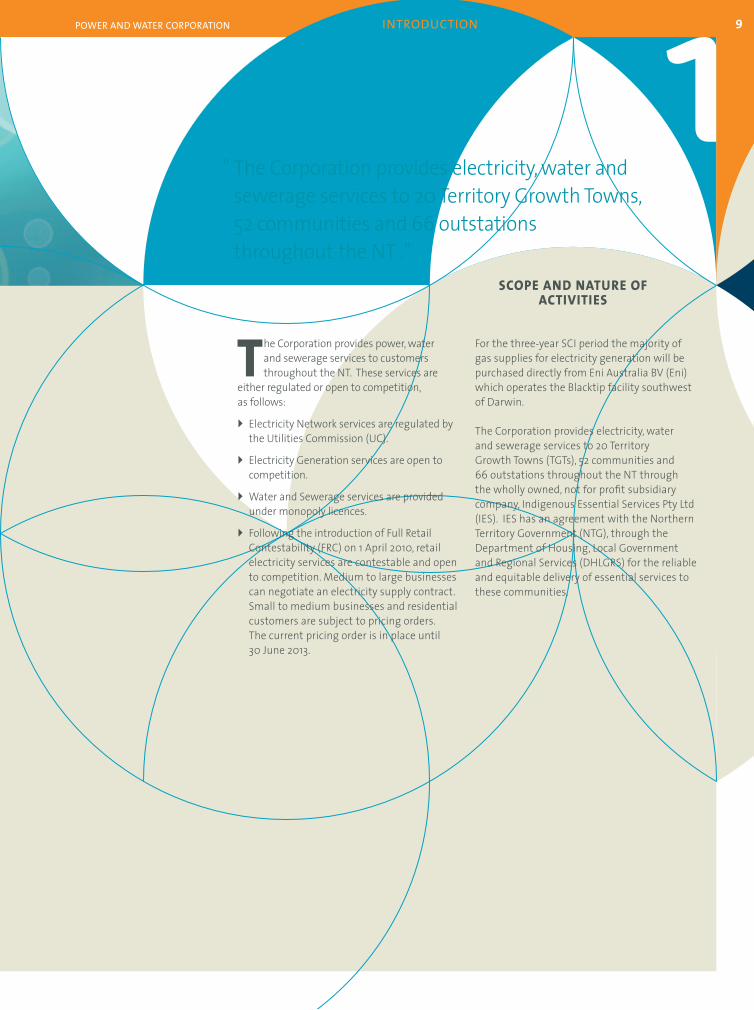
SCOPE AND NATURE OF ACTIVITIES
POWER AND WATER CORPORATION INTRODUCTION
For the three-year SCI period the majority of gas supplies for electricity generation will be purchased directly from Eni Australia BV (Eni) which operates the Blacktip facility southwest of Darwin.
The Corporation provides electricity, water and sewerage services to 20 Territory Growth Towns (TGTs), 52 communities and 66 outstations throughout the NT through the wholly owned, not for profit subsidiary company, Indigenous Essential Services Pty Ltd (IES). IES has an agreement with the Northern Territory Government (NTG), through the Department of Housing, Local Government and Regional Services (DHLGRS) for the reliable and equitable delivery of essential services to these communities.
The Corporation provides power, water and sewerage services to customers throughout the NT. These services are
either regulated or open to competition, as follows:
} Electricity Network services are regulated by the Utilities Commission (UC).
} Electricity Generation services are open to competition.
} Water and Sewerage services are provided under monopoly licences.
} Following the introduction of Full Retail Contestability (FRC) on 1 April 2010, retail electricity services are contestable and open to competition. Medium to large businesses can negotiate an electricity supply contract. Small to medium businesses and residential customers are subject to pricing orders. The current pricing order is in place until 30 June 2013.
" The Corporation provides electricity, water and sewerage services to 20 Territory Growth Towns, 52 communities and 66 outstations throughout the NT ."


11POWER AND WATER CORPORATION STATEMENT OF CORPORATE INTENT 2012-13
STRATEGIES 2
The Corporation’s key strategies have been developed to meet the challenges facing the Corporation and to achieve our Vision. The business and operational plans for each business unit are designed to execute these strategies and to improve the responsiveness, reliability and efficiency of the services delivered.
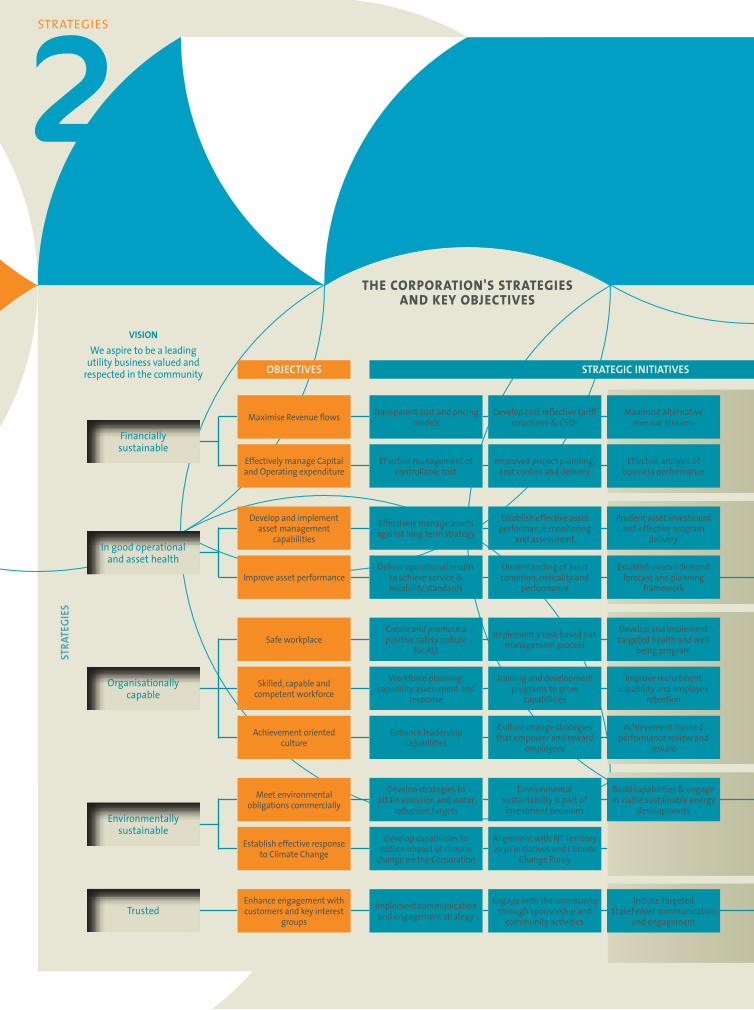
THE CORPORATION'S STRATEGIESAND KEY OBJECTIVES
STRATEGIES
Maximise alternative revenue streams
Effective analysis of business performance
Prudent asset investment and effective program
delivery
Establish overall demand forecast and planning
framework
Develop and implement targeted health and well
being program
Improve recruitment capability and employee
retention
Achievement focused performance review and
reward
Build capabilities & engage in viable sustainable energy
developments
Initiate targeted Stakeholder communication
and engagement
Develop cost reflective tariff structures & CSOs
Improved project planning, cost control and delivery
Establish effective asset performance monitoring
and assessment
Understanding of asset condition, criticality and
performance
Implement a task based risk management process
Training and development programs to grow
capabilities
Culture change strategies that empower and reward
employees
Environmental sustainability is part of investment decisions
Alignment with NT Territory 2030 initiatives and Climate
Change Policy
Engage with the community through sponsorship and
community activities
Transparent cost and pricing models
Effective management of controllable cost
Effectively manage assets against long term strategy
Deliver operational results to achieve service & reliability standards
Create and promote a positive safety culture
for ALL
Workforce planning, capability assessment and
response
Enhance leadership capabilities
Develop strategies to attain emission and water
reduction targets
Develop capabilities to reduce impact of climate
change on the Corporation
Implement communication and engagement strategy
Maximise Revenue flows
Effectively manage Capital and Operating expenditure
Develop and implement asset management
capabilities
Improve asset performance
Safe workplace
Skilled, capable and competent workforce
Achievement oriented culture
Meet environmental obligations commercially
Establish effective response to Climate Change
Enhance engagement with customers and key interest
groups
Financially sustainable
In good operational and asset health
Environmentally sustainable
Trusted
Organisationally capable
STRATEGIC INITIATIVESOBJECTIVES
VISIONWe aspire to be a leading
utility business valued and respected in the community
STRA
TEGI
ES
13POWER AND WATER CORPORATION STRATEGIES
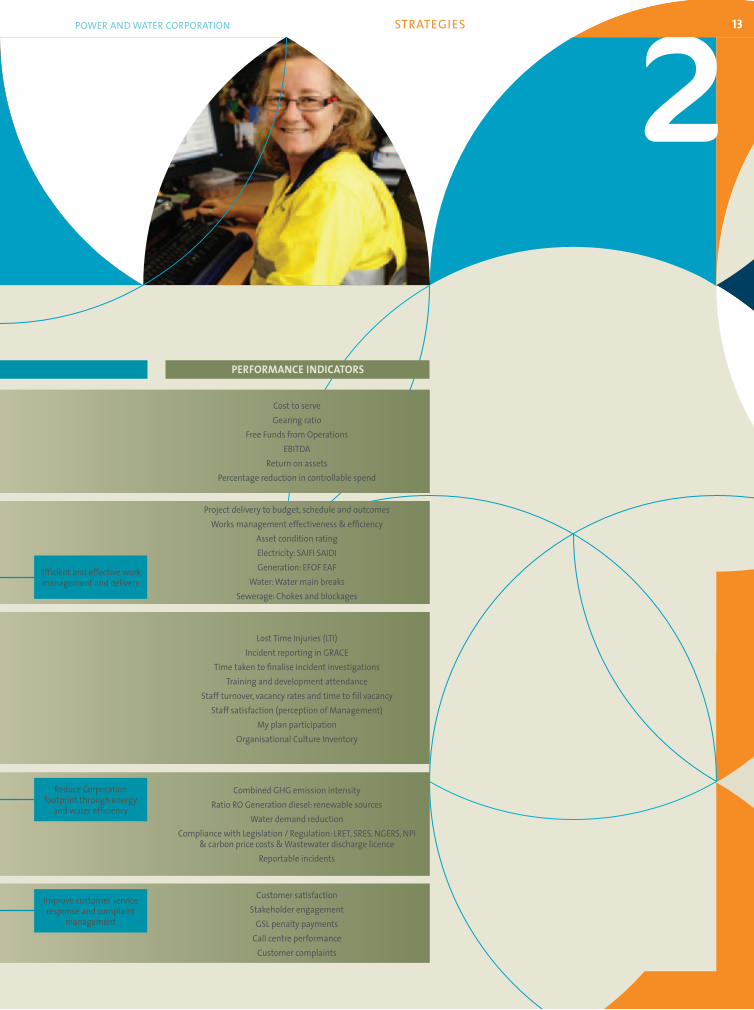
Cost to serveGearing ratio
Free Funds from OperationsEBITDA
Return on assetsPercentage reduction in controllable spend
Project delivery to budget, schedule and outcomesWorks management effectiveness & efficiency
Asset condition ratingElectricity: SAIFI SAIDIGeneration: EFOF EAF
Water: Water main breaksSewerage: Chokes and blockages
Combined GHG emission intensityRatio RO Generation diesel: renewable sources
Water demand reductionCompliance with Legislation / Regulation: LRET, SRES, NGERS, NPI
& carbon price costs & Wastewater discharge licenceReportable incidents
Customer satisfactionStakeholder engagement
GSL penalty paymentsCall centre performance
Customer complaints
Lost Time Injuries (LTI)Incident reporting in GRACE
Time taken to finalise incident investigationsTraining and development attendance
Staff turnover, vacancy rates and time to fill vacancyStaff satisfaction (perception of Management)
My plan participationOrganisational Culture Inventory
Efficient and effective work management and delivery
Reduce Corporation footprint through energy
and water efficiency
Improve customer service response and complaint
management
STRATEGIC INITIATIVES PERFORMANCE INDICATORS
STRATEGIES
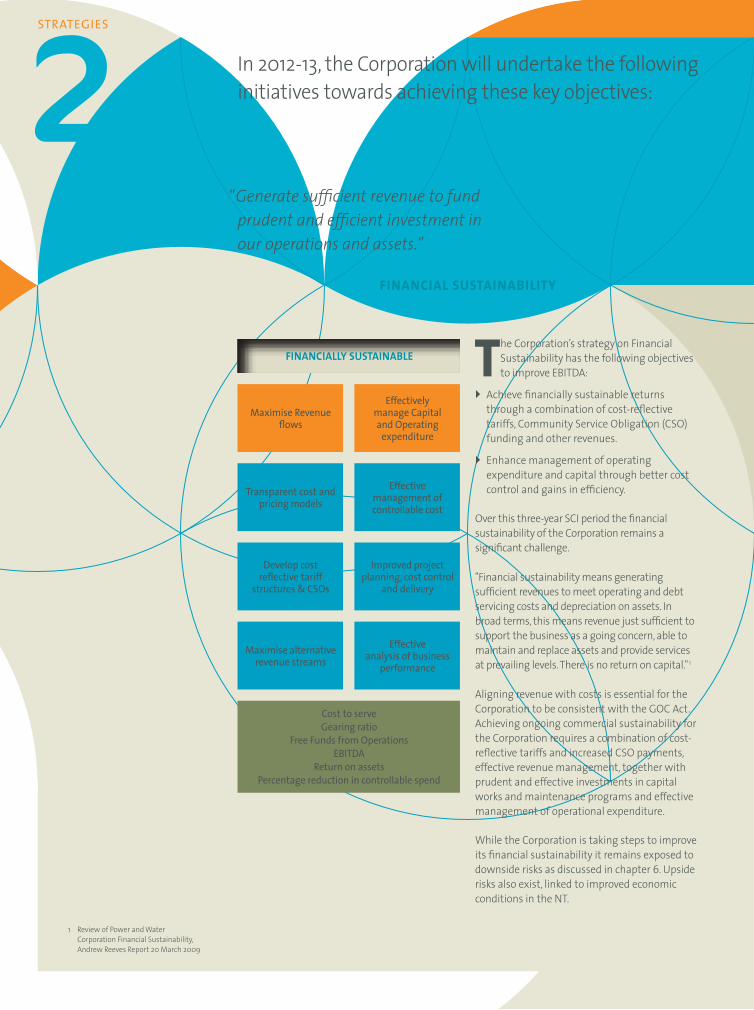
FINANCIAL SUSTAINABILITY
The Corporation’s strategy on Financial Sustainability has the following objectives to improve EBITDA:
} Achieve financially sustainable returns through a combination of cost-reflective tariffs, Community Service Obligation (CSO) funding and other revenues.
} Enhance management of operating expenditure and capital through better cost control and gains in efficiency.
Over this three-year SCI period the financial sustainability of the Corporation remains a significant challenge.
"Financial sustainability means generating sufficient revenues to meet operating and debt servicing costs and depreciation on assets. In broad terms, this means revenue just sufficient to support the business as a going concern, able to maintain and replace assets and provide services at prevailing levels. There is no return on capital."1
Aligning revenue with costs is essential for the Corporation to be consistent with the GOC Act. Achieving ongoing commercial sustainability for the Corporation requires a combination of cost-reflective tariffs and increased CSO payments, effective revenue management, together with prudent and effective investments in capital works and maintenance programs and effective management of operational expenditure.
While the Corporation is taking steps to improve its financial sustainability it remains exposed to downside risks as discussed in chapter 6. Upside risks also exist, linked to improved economic conditions in the NT.
In 2012-13, the Corporation will undertake the following initiatives towards achieving these key objectives:
Maximise Revenue flows
Transparent cost and pricing models
Develop cost reflective tariff
structures & CSOs
Maximise alternative revenue streams
Cost to serveGearing ratio
Free Funds from OperationsEBITDA
Return on assetsPercentage reduction in controllable spend
Effectively manage Capital and Operating
expenditure
Effective management of controllable cost
Improved project planning, cost control
and delivery
Effective analysis of business
performance
1 Review of Power and Water Corporation Financial Sustainability, Andrew Reeves Report 20 March 2009
FINANCIALLY SUSTAINABLE
“Generatesufficientrevenuetofundprudentandefficientinvestmentinouroperationsandassets.”
15POWER AND WATER CORPORATION STRATEGIES
efficiency, rebates and concessions, shop front operation and payment channel efficiency and other discretionary expenditure.
CAPITAL INVESTMENT
Focus on capital investment will continue with enhancements to governance, management and delivery of the program with a clear prioritisation of projects based on overall value to the business. Examination of program prudence, efficiency, effectiveness and risk will result in investment planning reforms, specifically focused on:
} Prudent capital investment: capital expenditure that is necessary and sufficient to meet the required standards of service, reliability and security.
ê Outline of investment in each priority category and an associated sensitivity analysis based on risk profile.
ê Quantitative analysis of the links between investments and outcomes and associated sensitivity analysis and benchmarking.
ê The introduction of a probabilistic analysis of program budgets.
ê Top down investment program review for major projects.
} Effective project delivery: ensure program and project delivery is efficient, cost effective and timely with controlled risks.
ê Major project cost reviews and a detailed cash-flow assessment.
ê Project delivery risk assessment.
ê Efficiency focus on optimisation of R&M / capital investment.
MAXIMISING REVENUE FLOW
In this SCI the current projections for electricity, water and sewerage revenue are consistent with the current price determination and are increasing by CPI each year over the three-year SCI. The current price determination expires in 2012-13. Over recent years, power, water and sewerage tariffs have increased significantly throughout Australia and there are strong indications that this trend will continue.
As initially identified in the 2011-12 SCI; electricity, water and sewerage revenues continue to consistently fall below that required for financial sustainability and a significant gap exists to achieve commercial sustainability.
The SCI’s water revenue projections incorporate water demand management initiatives aimed at reducing domestic water use to achieve the Territory 2030 Strategy’s (T2030) lower consumption levels. Review of the current tariff structure needs to be considered to reduce a direct reliance on consumption and to reflect a more realistic cost for maintaining the water infrastructure and asset base.
EXPENDITURE MANAGEMENT
Concurrent with the revenue optimisation, prudent expenditure management will be achieved through targeted cost reductions in controllable costs. The major cost elements are energy, personnel and repairs and maintenance (R&M) and reducing these costs could impede service delivery. However, it is possible to reduce controllable costs without having a material impact on service delivery and the capital or R&M programs. To date, reductions from the operational budget have been identified resulting from examination of vehicle fleet
STRATEGIES
} Construction of Darwin 132/66kV terminal substation and transmission lines from CIPS. The project will provide enhanced security in supplying power to the Darwin CBD area.
} Water Services' investment in various design and construction projects for Darwin River Dam and Manton Dam. In addition the improvement and expansion of the water source and distribution mains in the Palmerston areas.
} Closure of the Larrakeyah outfall, Leanyer treatment augmentation and other projects to increase the capacity and improve the output quality of wastewater treatment plants.
ê Major project 'Health Check'.
ê Structured development program for project managers and engineers.
ê Enhance contract engagement, including an Early Contractor Involvement program.
Key projects to renew or extend the life of existing assets or to meet projected growth in demand for electricity, water and sewerage services include the following:
} Life-extension works to Channel Island Power Station (CIPS) generation sets 1 to 5 which are nearing their end-of-life. The project will increase the overall efficiency and reliability of generation units into the future, as well as obtaining full value from the available life in the units at least cost.
} Reconditioning and augmentation works for zone substations including City, Berrimah, Casuarina, Frances Bay and the construction of Leanyer, McMinn and Norris Bell Zone Substations to meet demand growth.
FINANCIAL SUSTAINABILITY (Continued)
17POWER AND WATER CORPORATION STRATEGIES
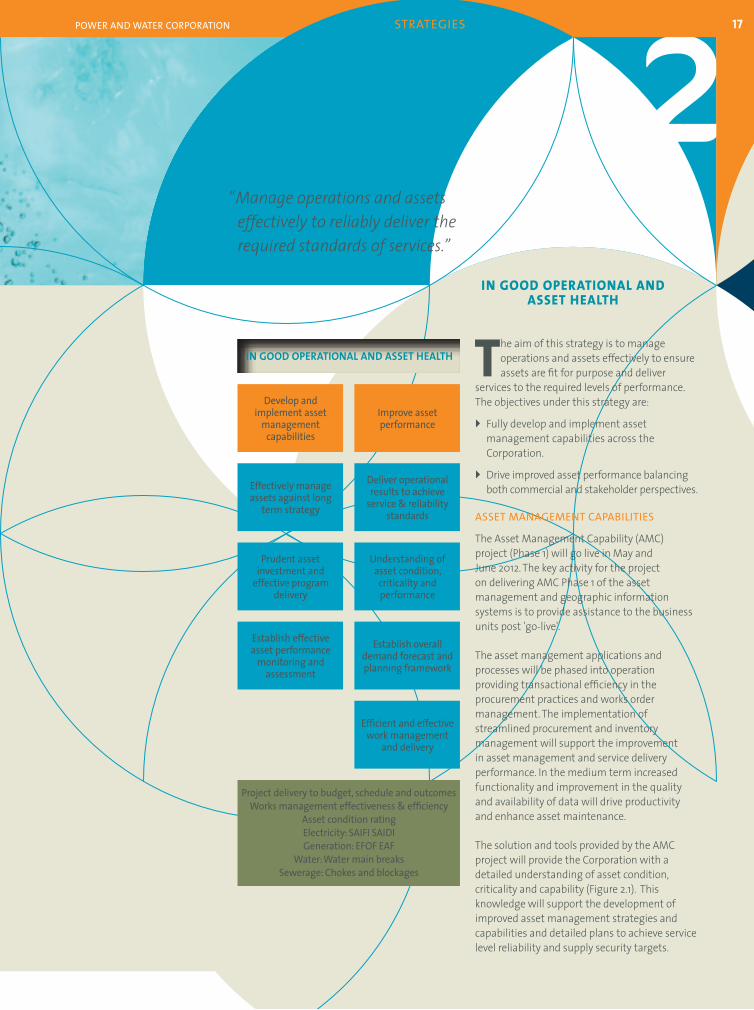
IN GOOD OPERATIONAL ANDASSET HEALTH
The aim of this strategy is to manage operations and assets effectively to ensure assets are fit for purpose and deliver
services to the required levels of performance. The objectives under this strategy are:
} Fully develop and implement asset management capabilities across the Corporation.
} Drive improved asset performance balancing both commercial and stakeholder perspectives.
ASSET MANAGEMENT CAPABILITIES
The Asset Management Capability (AMC) project (Phase 1) will go live in May and June 2012. The key activity for the project on delivering AMC Phase 1 of the asset management and geographic information systems is to provide assistance to the business units post 'go-live'.
The asset management applications and processes will be phased into operation providing transactional efficiency in the procurement practices and works order management. The implementation of streamlined procurement and inventory management will support the improvement in asset management and service delivery performance. In the medium term increased functionality and improvement in the quality and availability of data will drive productivity and enhance asset maintenance.
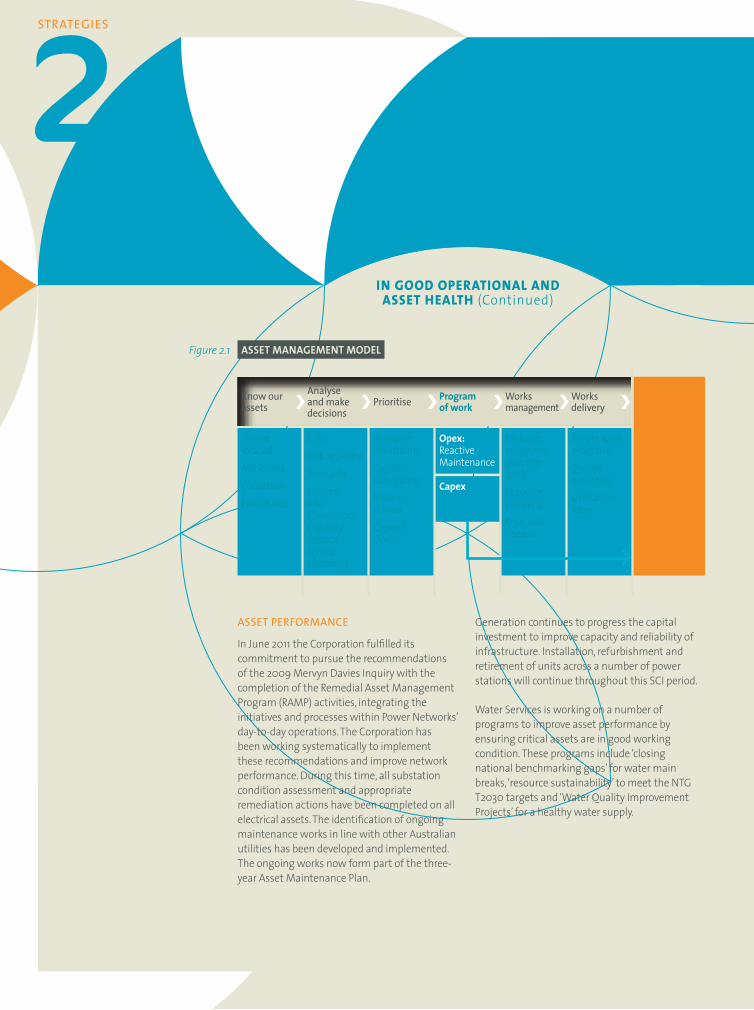
The solution and tools provided by the AMC project will provide the Corporation with a detailed understanding of asset condition, criticality and capability (Figure 2.1). This knowledge will support the development of improved asset management strategies and capabilities and detailed plans to achieve service level reliability and supply security targets.
Develop and implement asset
management capabilities
Effectively manage assets against long
term strategy
Prudent asset investment and
effective program delivery
Establish effective asset performance
monitoring and assessment
Project delivery to budget, schedule and outcomesWorks management effectiveness & efficiency
Asset condition ratingElectricity: SAIFI SAIDIGeneration: EFOF EAF
Water: Water main breaks Sewerage: Chokes and blockages
Improve asset performance
Deliver operational results to achieve
service & reliability standards
Understanding of asset condition,
criticality and performance
Establish overall demand forecast and planning framework
Efficient and effective work management
and delivery
IN GOOD OPERATIONAL AND ASSET HEALTH
“Manageoperationsandassetseffectivelytoreliablydelivertherequiredstandardsofservices.”
STRATEGIES
Generation continues to progress the capital investment to improve capacity and reliability of infrastructure. Installation, refurbishment and retirement of units across a number of power stations will continue throughout this SCI period.
Water Services is working on a number of programs to improve asset performance by ensuring critical assets are in good working condition. These programs include ‘closing national benchmarking gaps’ for water main breaks, ‘resource sustainability’ to meet the NTG T2030 targets and ‘Water Quality Improvement Projects’ for a healthy water supply.
ASSET PERFORMANCE
In June 2011 the Corporation fulfilled its commitment to pursue the recommendations of the 2009 Mervyn Davies Inquiry with the completion of the Remedial Asset Management Program (RAMP) activities, integrating the initiatives and processes within Power Networks’ day-to-day operations. The Corporation has been working systematically to implement these recommendations and improve network performance. During this time, all substation condition assessment and appropriate remediation actions have been completed on all electrical assets. The identification of ongoing maintenance works in line with other Australian utilities has been developed and implemented. The ongoing works now form part of the three-year Asset Maintenance Plan.
Know our assets
Analyse and make decisions
Prioritise Programofwork
Works management
Works delivery
LevelsofserviceResidualrisk
Customers-price
Opex:Reactive Maintenance
Capex
Where locatedAttributesConditionFailure rate
RulesRisk appetiteForecastsDrivers:RiskComplianceCapacityReplaceServicestandards
Resource constraintsCapital constraintsBalance driversCapex v Opex
Package, scope and plan the workResource planningPrice and release
Excute work programsQuality assuranceUtilisation rates
IN GOOD OPERATIONAL AND ASSET HEALTH (Continued)
ASSET MANAGEMENT MODELFigure2.1
19POWER AND WATER CORPORATION STRATEGIES
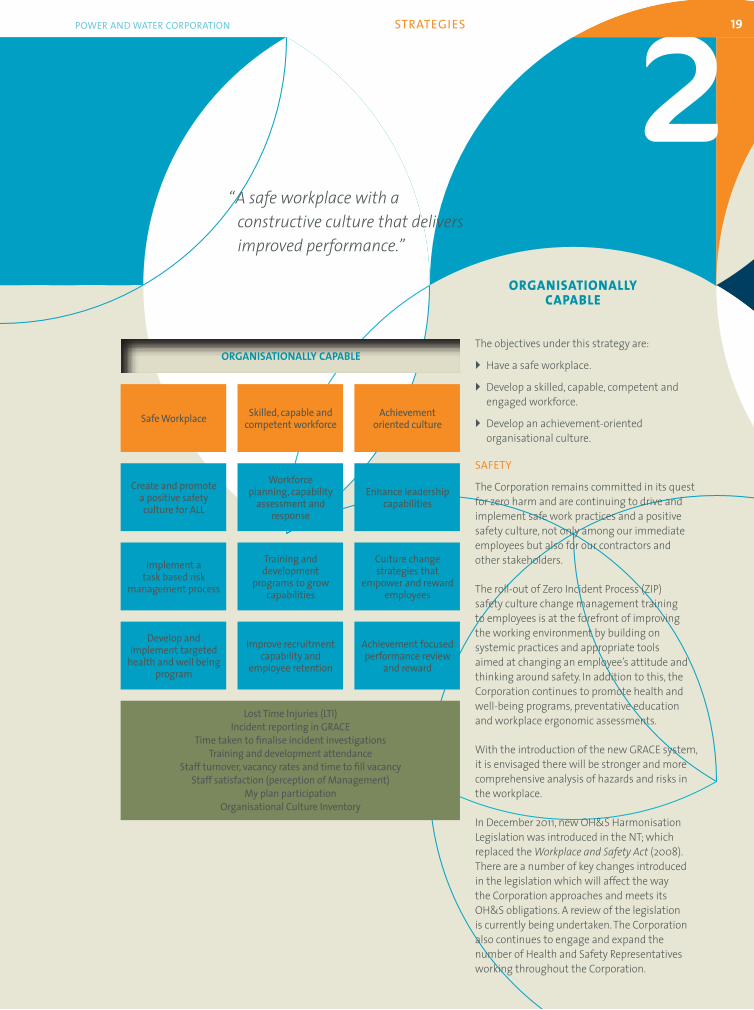
ORGANISATIONALLY CAPABLE
The objectives under this strategy are:
} Have a safe workplace.
} Develop a skilled, capable, competent and engaged workforce.
} Develop an achievement-oriented organisational culture.
SAFETY
The Corporation remains committed in its quest for zero harm and are continuing to drive and implement safe work practices and a positive safety culture, not only among our immediate employees but also for our contractors and other stakeholders.
The roll-out of Zero Incident Process (ZIP) safety culture change management training to employees is at the forefront of improving the working environment by building on systemic practices and appropriate tools aimed at changing an employee’s attitude and thinking around safety. In addition to this, the Corporation continues to promote health and well-being programs, preventative education and workplace ergonomic assessments.
With the introduction of the new GRACE system, it is envisaged there will be stronger and more comprehensive analysis of hazards and risks in the workplace.
In December 2011, new OH&S Harmonisation Legislation was introduced in the NT; which replaced the WorkplaceandSafetyAct(2008). There are a number of key changes introduced in the legislation which will affect the way the Corporation approaches and meets its OH&S obligations. A review of the legislation is currently being undertaken. The Corporation also continues to engage and expand the number of Health and Safety Representatives working throughout the Corporation.
Skilled, capable and competent workforceSafe Workplace
Workforce planning, capability
assessment and response
Create and promote a positive safety culture for ALL
Training and development
programs to grow capabilities
Implement a task based risk
management process
Improve recruitment capability and
employee retention
Develop and implement targeted
health and well being program
Lost Time Injuries (LTI)Incident reporting in GRACE
Time taken to finalise incident investigationsTraining and development attendance
Staff turnover, vacancy rates and time to fill vacancyStaff satisfaction (perception of Management)
My plan participation Organisational Culture Inventory
Achievement oriented culture
Enhance leadership capabilities
Culture change strategies that
empower and reward employees
Achievement focused performance review
and reward
ORGANISATIONALLY CAPABLE
“Asafeworkplacewithaconstructiveculturethatdeliversimprovedperformance.”

STRATEGIES
ORGANISATIONAL CULTURE
The Corporation continues to embark on a Culture Change Program based on an agreed vision and shared values. The preferred organisational culture is based on the following behaviours and mindsets:
} Achievement, Humanistic-Encouraging, Affiliative and Self-Actualising.
Culture change of this nature takes time to emerge and cannot only be driven by the workforce capability and Human Resource teams. Every business unit, team and individual in the organisation needs to contribute. Cultural change of this nature generally takes three to five years to evolve.
THE WORKFORCE
The Corporation’s ability to achieve results is highly dependent on the development of current employee capabilities, and in recruiting and retaining appropriately skilled staff. A series of initiatives will continue during the three-year SCI period to advance the Corporation’s leadership and workforce capabilities including:
} Training and development programs for effective leaders, managers and employees so they are skilled and knowledgeable for the job at hand and future roles.
} A universal MyPlan process for all employees to drive clarity in relation to roles and goals and how employee efforts can optimally contribute to the Corporation’s success.
} Workforce plans so each business understands their workforce needs and the current state of the workforce including future development, recruitment and succession planning.
} Effective performance measurements with capabilities to address poor performance in the workplace.
ORGANISATIONALLY CAPABLE (Continued)
21POWER AND WATER CORPORATION STRATEGIES
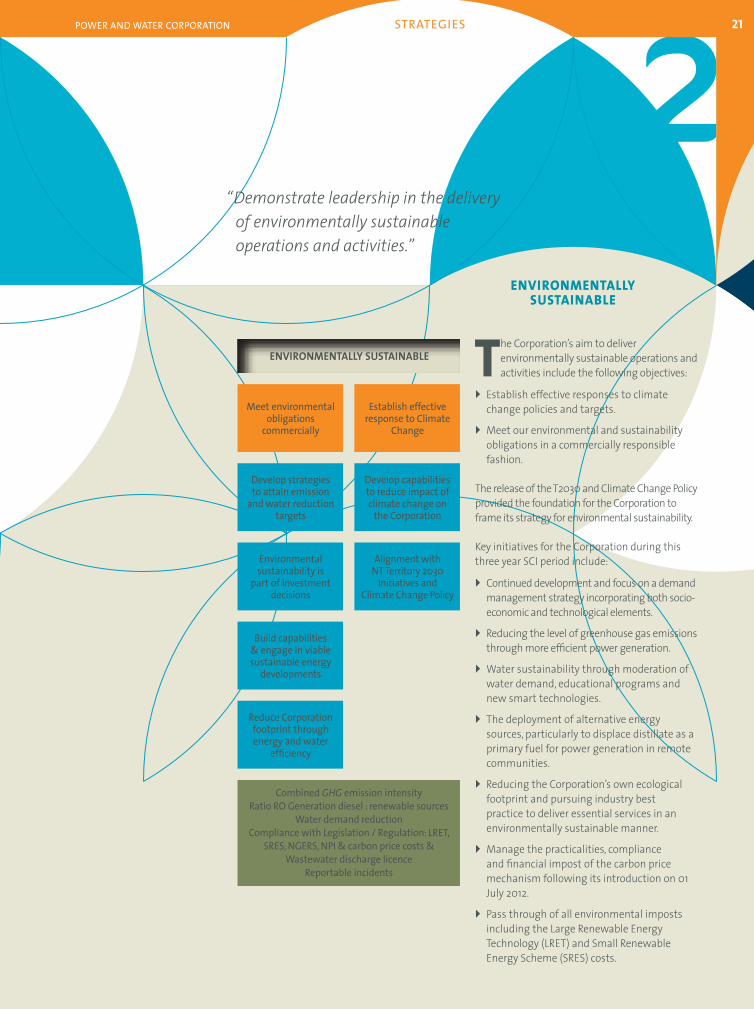
ENVIRONMENTALLY SUSTAINABLE
The Corporation’s aim to deliver environmentally sustainable operations and activities include the following objectives:
} Establish effective responses to climate change policies and targets.
} Meet our environmental and sustainability obligations in a commercially responsible fashion.
The release of the T2030 and Climate Change Policy provided the foundation for the Corporation to frame its strategy for environmental sustainability.
Key initiatives for the Corporation during this three year SCI period include:
} Continued development and focus on a demand management strategy incorporating both socio-economic and technological elements.
} Reducing the level of greenhouse gas emissions through more efficient power generation.
} Water sustainability through moderation of water demand, educational programs and new smart technologies.
} The deployment of alternative energy sources, particularly to displace distillate as a primary fuel for power generation in remote communities.
} Reducing the Corporation’s own ecological footprint and pursuing industry best practice to deliver essential services in an environmentally sustainable manner.
} Manage the practicalities, compliance and financial impost of the carbon price mechanism following its introduction on 01 July 2012.
} Pass through of all environmental imposts including the Large Renewable Energy Technology (LRET) and Small Renewable Energy Scheme (SRES) costs.
Meet environmental obligations
commercially
Develop strategies to attain emission
and water reduction targets
Environmental sustainability is
part of investment decisions
Build capabilities & engage in viable sustainable energy
developments
Combined GHG emission intensityRatio RO Generation diesel : renewable sources
Water demand reductionCompliance with Legislation / Regulation: LRET,
SRES, NGERS, NPI & carbon price costs &Wastewater discharge licence
Reportable incidents
Establish effective response to Climate
Change
Develop capabilities to reduce impact of climate change on
the Corporation
Alignment with NT Territory 2030
Initiatives and Climate Change Policy
Reduce Corporation footprint through energy and water
efficiency
ENVIRONMENTALLY SUSTAINABLE
“Demonstrateleadershipinthedeliveryofenvironmentallysustainableoperationsandactivities.”

STRATEGIES
TRUSTED
The Corporation’s objective in regards to being a Trusted Utility is to:
} Enhance engagement with customers and key interest groups.
The Corporation strives to be a trusted utility which delivers on its promises. The level of trust achieved reflects on the Corporation’s standing in the wider community, its perception as a reliable and responsible organisation, the degree of customer satisfaction with the services it delivers and the degree of employee satisfaction.
During this SCI period, the Corporation continues to implement its Communications Strategy to target key business partnerships and community stakeholders, and employ the use of modern media techniques, particularly the use of on-line messaging and social networking to communicate openly and transparently with customers, the community and Government.
The Communications Strategy’s objective is to inform and educate the community to influence behaviour and increase customer and stakeholder understanding of the Corporation’s services and capabilities. The strategy will be reviewed in late 2012 to refine communication plans for the following two years.
The Corporation is continuing to communicate with employees through employee forums and is engaging employees to assist with workforce planning and cultural change.
Initiate targeted Stakeholder
communication and engagement
Customer satisfaction Stakeholder engagement
GSL penalty payments Call centre
performance Customer complaints
Enhance engagement with customers and key
interest groups
Implement communication and
engagement strategy
Engage with the community through
sponsorship and community activities
Improve customer service response and complaint management
TRUSTED
“Atrustedutilitythatdeliversonitspromises.”
23POWER AND WATER CORPORATION STRATEGIES
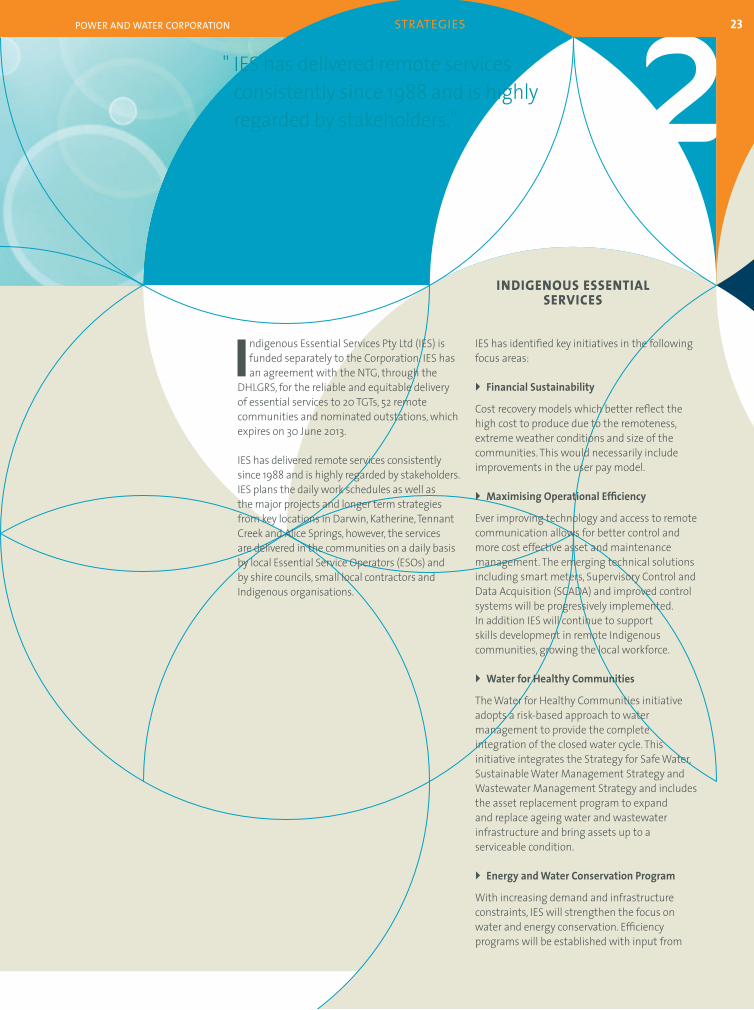
INDIGENOUS ESSENTIAL SERVICES
IES has identified key initiatives in the following focus areas:
} FinancialSustainability
Cost recovery models which better reflect the high cost to produce due to the remoteness, extreme weather conditions and size of the communities. This would necessarily include improvements in the user pay model.
} MaximisingOperationalEfficiency
Ever improving technology and access to remote communication allows for better control and more cost effective asset and maintenance management. The emerging technical solutions including smart meters, Supervisory Control and Data Acquisition (SCADA) and improved control systems will be progressively implemented. In addition IES will continue to support skills development in remote Indigenous communities, growing the local workforce.
} WaterforHealthyCommunities
The Water for Healthy Communities initiative adopts a risk-based approach to water management to provide the complete integration of the closed water cycle. This initiative integrates the Strategy for Safe Water, Sustainable Water Management Strategy and Wastewater Management Strategy and includes the asset replacement program to expand and replace ageing water and wastewater infrastructure and bring assets up to a serviceable condition.
} EnergyandWaterConservationProgram
With increasing demand and infrastructure constraints, IES will strengthen the focus on water and energy conservation. Efficiency programs will be established with input from
Indigenous Essential Services Pty Ltd (IES) is funded separately to the Corporation. IES has an agreement with the NTG, through the
DHLGRS, for the reliable and equitable delivery of essential services to 20 TGTs, 52 remote communities and nominated outstations, which expires on 30 June 2013.
IES has delivered remote services consistently since 1988 and is highly regarded by stakeholders. IES plans the daily work schedules as well as the major projects and longer term strategies from key locations in Darwin, Katherine, Tennant Creek and Alice Springs, however, the services are delivered in the communities on a daily basis by local Essential Service Operators (ESOs) and by shire councils, small local contractors and Indigenous organisations.
" IES has delivered remote services consistently since 1988 and is highly regarded by stakeholders."
ê Minimising long term service delivery costs, meeting community demand growth in an economic and environmentally sustainable manner.
ê Making efficient use of emerging technologies and gaseous fuels.
ê Preparing for the financial impacts of climate change.
} WorkforceCapabilityincludingESODevelopment
The development of ESOs will be a priority resulting from the combination of a retiring ESO workforce and an increase in complexity of power, water and sewerage infrastructure.
the local stakeholders for the TGTs and other priority communities.
} ReducingtheRelianceonDistillateforElectricityGeneration
Implementing key initiatives from the Energy Source Strategy Towards 2020 provides an economic and technical assessment of energy source options available for remote power generation with the objectives of:
ê Replacing diesel fuel as the primary source of power generation in remote towns and communities, by pursuing a diversified energy source mix for the period up to 2015. The longer term approach will be finalised to ensure the Corporation avoids being locked into a high cost energy mix for the future.
INDIGENOUS ESSENTIAL SERVICES (Continued)
25POWER AND WATER CORPORATION STATEMENT OF CORPORATE INTENT 2012-13
MAJOR ASSUMPTIONSTO 2015 3
This chapter describes the most significant assumptions used to prepare the financial projections included in this SCI.
MAJOR ASSUMPTIONS TO 2015
DEMAND FORECASTS
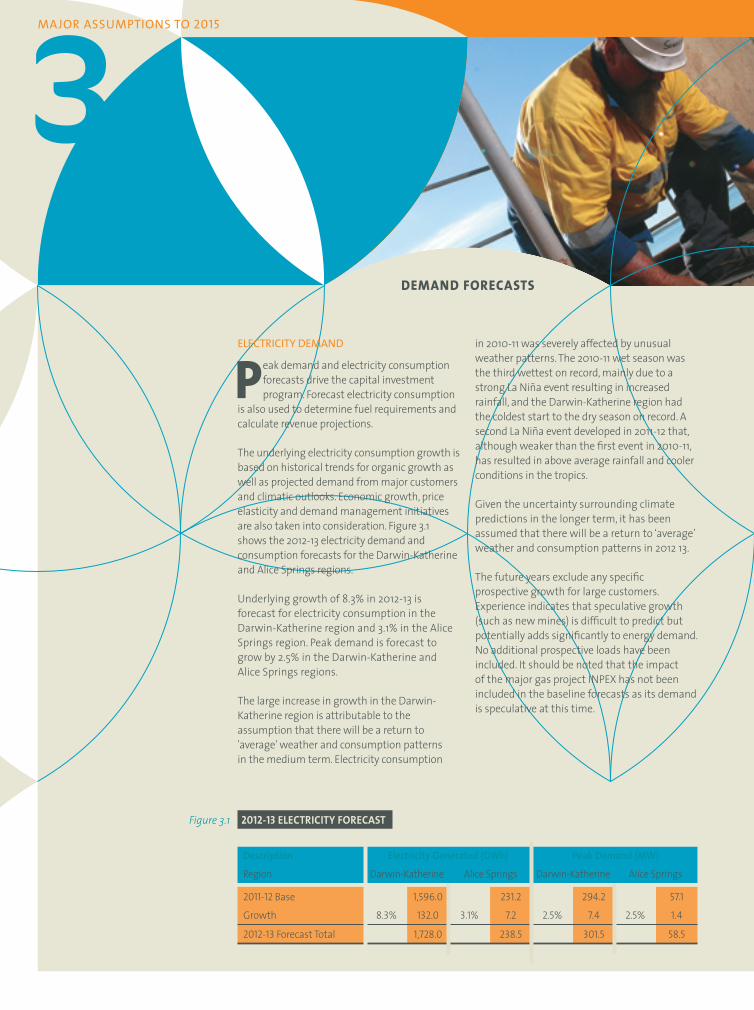
in 2010-11 was severely affected by unusual weather patterns. The 2010-11 wet season was the third wettest on record, mainly due to a strong La Niña event resulting in increased rainfall, and the Darwin-Katherine region had the coldest start to the dry season on record. A second La Niña event developed in 2011-12 that, although weaker than the first event in 2010-11, has resulted in above average rainfall and cooler conditions in the tropics.
Given the uncertainty surrounding climate predictions in the longer term, it has been assumed that there will be a return to ‘average’ weather and consumption patterns in 2012 13.
The future years exclude any specific prospective growth for large customers. Experience indicates that speculative growth (such as new mines) is difficult to predict but potentially adds significantly to energy demand. No additional prospective loads have been included. It should be noted that the impact of the major gas project INPEX has not been included in the baseline forecasts as its demand is speculative at this time.
ELECTRICITY DEMAND
Peak demand and electricity consumption forecasts drive the capital investment program. Forecast electricity consumption
is also used to determine fuel requirements and calculate revenue projections.
The underlying electricity consumption growth is based on historical trends for organic growth as well as projected demand from major customers and climatic outlooks. Economic growth, price elasticity and demand management initiatives are also taken into consideration. Figure 3.1 shows the 2012-13 electricity demand and consumption forecasts for the Darwin-Katherine and Alice Springs regions.
Underlying growth of 8.3% in 2012-13 is forecast for electricity consumption in the Darwin-Katherine region and 3.1% in the Alice Springs region. Peak demand is forecast to grow by 2.5% in the Darwin-Katherine and Alice Springs regions.
The large increase in growth in the Darwin-Katherine region is attributable to the assumption that there will be a return to 'average' weather and consumption patterns in the medium term. Electricity consumption
2012-13 ELECTRICITY FORECASTFigure 3.1
Description ElectricityGenerated(GWh) PeakDemand(MW)
Region Darwin-Katherine Alice Springs Darwin-Katherine Alice Springs
2011-12 Base 1,596.0 231.2 294.2 57.1
Growth 8.3% 132.0 3.1% 7.2 2.5% 7.4 2.5% 1.4
2012-13 Forecast Total 1,728.0 238.5 301.5 58.5
27POWER AND WATER CORPORATION MAJOR ASSUMPTIONS TO 2015
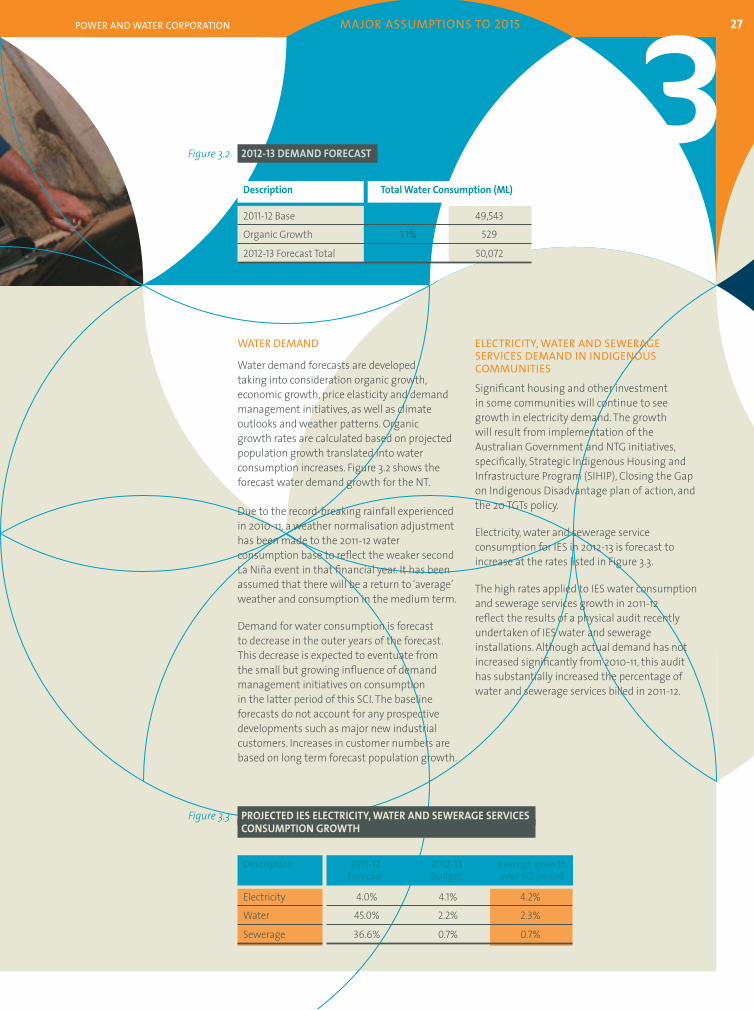
ELECTRICITY, WATER AND SEWERAGE SERVICES DEMAND IN INDIGENOUS COMMUNITIES
Significant housing and other investment in some communities will continue to see growth in electricity demand. The growth will result from implementation of the Australian Government and NTG initiatives, specifically, Strategic Indigenous Housing and Infrastructure Program (SIHIP), Closing the Gap on Indigenous Disadvantage plan of action, and the 20 TGTs policy.
Electricity, water and sewerage service consumption for IES in 2012-13 is forecast to increase at the rates listed in Figure 3.3.
The high rates applied to IES water consumption and sewerage services growth in 2011-12 reflect the results of a physical audit recently undertaken of IES water and sewerage installations. Although actual demand has not increased significantly from 2010-11, this audit has substantially increased the percentage of water and sewerage services billed in 2011-12.
WATER DEMAND
Water demand forecasts are developed taking into consideration organic growth, economic growth, price elasticity and demand management initiatives, as well as climate outlooks and weather patterns. Organic growth rates are calculated based on projected population growth translated into water consumption increases. Figure 3.2 shows the forecast water demand growth for the NT.
Due to the record-breaking rainfall experienced in 2010-11, a weather normalisation adjustment has been made to the 2011-12 water consumption base to reflect the weaker second La Niña event in that financial year. It has been assumed that there will be a return to ‘average’ weather and consumption in the medium term.
Demand for water consumption is forecast to decrease in the outer years of the forecast. This decrease is expected to eventuate from the small but growing influence of demand management initiatives on consumption in the latter period of this SCI. The baseline forecasts do not account for any prospective developments such as major new industrial customers. Increases in customer numbers are based on long term forecast population growth.
Description 2011-12 2012-13 Averagegrowth Forecast Budget overSCIperiod
Electricity 4.0% 4.1% 4.2%
Water 45.0% 2.2% 2.3%
Sewerage 36.6% 0.7% 0.7%
PROJECTED IES ELECTRICITY, WATER AND SEWERAGE SERVICESCONSUMPTION GROWTH
Figure 3.3
Description TotalWaterConsumption(ML)
2011-12 Base 49,543
Organic Growth 1.1% 529
2012-13 Forecast Total 50,072
2012-13 DEMAND FORECASTFigure 3.2
MAJOR ASSUMPTIONS TO 2015
REVENUE PROJECTIONS
results demonstrate that current tariffs for electricity and water are below the Australian average, and the second lowest amongst all jurisdictions. The effect of the Australian Government’s carbon pricing mechanism on electricity tariffs is not reflected in any of the jurisdictions’ tariffs as its impact is still being determined by regulators and utilities.
In contrast, different fuel sources, long distances, remote locations, the need for reserve capacity and limited operational scale result in higher service delivery costs than in other jurisdictions. These factors in addition to the Corporation’s tariffs cost structure and capital investment program has necessitated large and on-going borrowings.
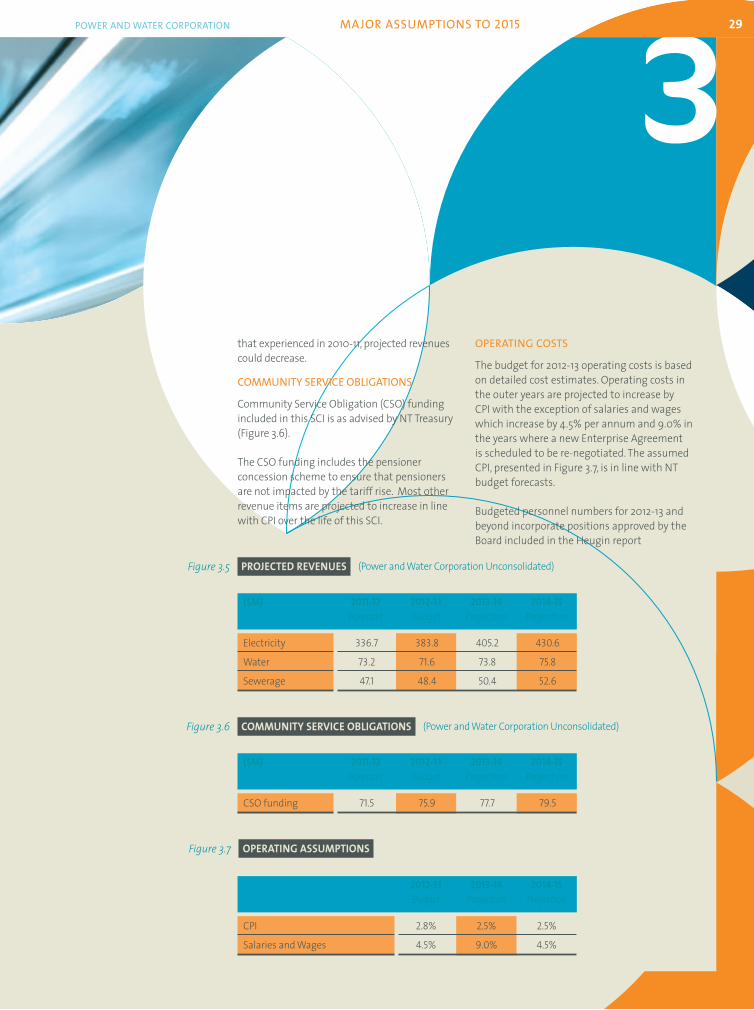
The Corporation’s revenues are projected to increase steadily over the period, reflecting demand growth and the price path for water, sewerage, and pricing order electricity customer prices to 2012-13. Figure 3.5 shows the resulting revenues for the Corporation.
One of the major assumptions underpinning this revenue forecast is that there will be a return to ‘average’ weather and consumption patterns in 2012 13. If this does not occur, and weather and consumption patterns remain at similar levels to
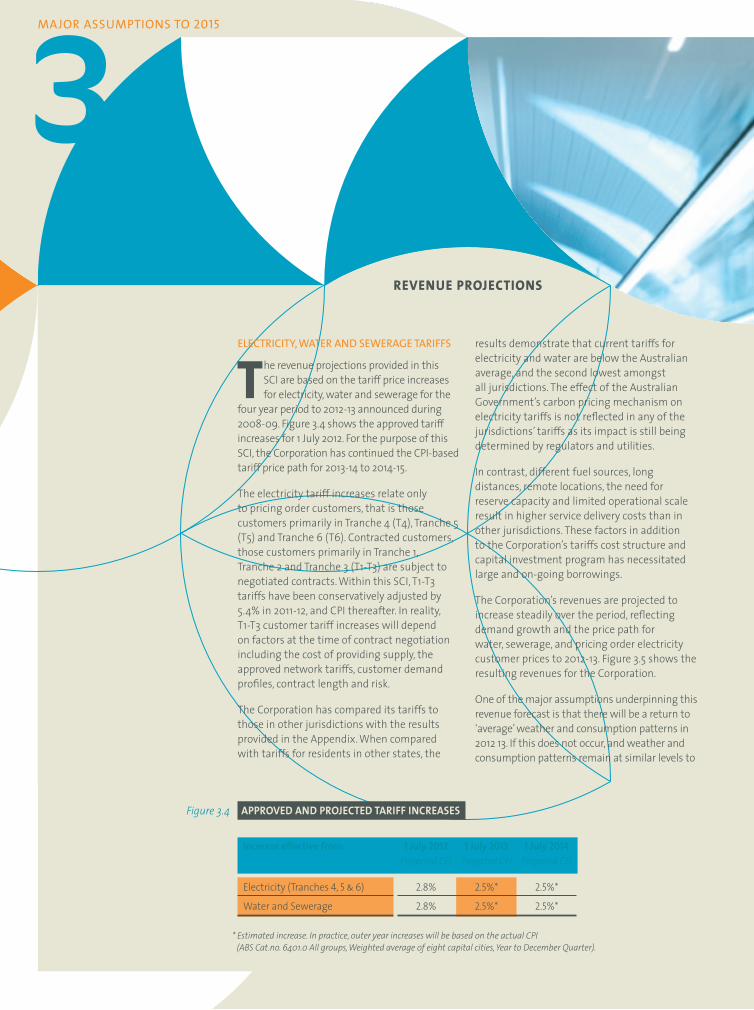
ELECTRICITY, WATER AND SEWERAGE TARIFFS
The revenue projections provided in this SCI are based on the tariff price increases for electricity, water and sewerage for the
four year period to 2012-13 announced during 2008-09. Figure 3.4 shows the approved tariff increases for 1 July 2012. For the purpose of this SCI, the Corporation has continued the CPI-based tariff price path for 2013-14 to 2014-15.
The electricity tariff increases relate only to pricing order customers, that is those customers primarily in Tranche 4 (T4), Tranche 5 (T5) and Tranche 6 (T6). Contracted customers, those customers primarily in Tranche 1, Tranche 2 and Tranche 3 (T1-T3) are subject to negotiated contracts. Within this SCI, T1-T3 tariffs have been conservatively adjusted by 5.4% in 2011-12, and CPI thereafter. In reality, T1-T3 customer tariff increases will depend on factors at the time of contract negotiation including the cost of providing supply, the approved network tariffs, customer demand profiles, contract length and risk.
The Corporation has compared its tariffs to those in other jurisdictions with the results provided in the Appendix. When compared with tariffs for residents in other states, the
APPROVED AND PROJECTED TARIFF INCREASESFigure 3.4
Increase effective from: 1 July 2012 1 July 2013 1 July 2014 Projected CPI Projected CPI Projected CPI
Electricity (Tranches 4, 5 & 6) 2.8% 2.5%* 2.5%*
Water and Sewerage 2.8% 2.5%* 2.5%*
* Estimated increase. In practice, outer year increases will be based on the actual CPI (ABS Cat.no. 6401.0 All groups, Weighted average of eight capital cities, Year to December Quarter).
29POWER AND WATER CORPORATION MAJOR ASSUMPTIONS TO 2015
OPERATING COSTS
The budget for 2012-13 operating costs is based on detailed cost estimates. Operating costs in the outer years are projected to increase by CPI with the exception of salaries and wages which increase by 4.5% per annum and 9.0% in the years where a new Enterprise Agreement is scheduled to be re-negotiated. The assumed CPI, presented in Figure 3.7, is in line with NT budget forecasts.
Budgeted personnel numbers for 2012-13 and beyond incorporate positions approved by the Board included in the Heugin report
that experienced in 2010-11, projected revenues could decrease.
COMMUNITY SERVICE OBLIGATIONS
Community Service Obligation (CSO) funding included in this SCI is as advised by NT Treasury (Figure 3.6).
The CSO funding includes the pensioner concession scheme to ensure that pensioners are not impacted by the tariff rise. Most other revenue items are projected to increase in line with CPI over the life of this SCI.
PROJECTED REVENUES Figure 3.5
($M) 2011-12 2012-13 2013-14 2014-15 Forecast Budget Projection Projection
Electricity 336.7 383.8 405.2 430.6
Water 73.2 71.6 73.8 75.8
Sewerage 47.1 48.4 50.4 52.6
COMMUNITY SERVICE OBLIGATIONSFigure 3.6
($M) 2011-12 2012-13 2013-14 2014-15 Forecast Budget Projection Projection
CSO funding 71.5 75.9 77.7 79.5
OPERATING ASSUMPTIONSFigure 3.7
2012-13 2013-14 2014-15 Budget Projection Projection
CPI 2.8% 2.5% 2.5%
Salaries and Wages 4.5% 9.0% 4.5%
(Power and Water Corporation Unconsolidated)
(Power and Water Corporation Unconsolidated)
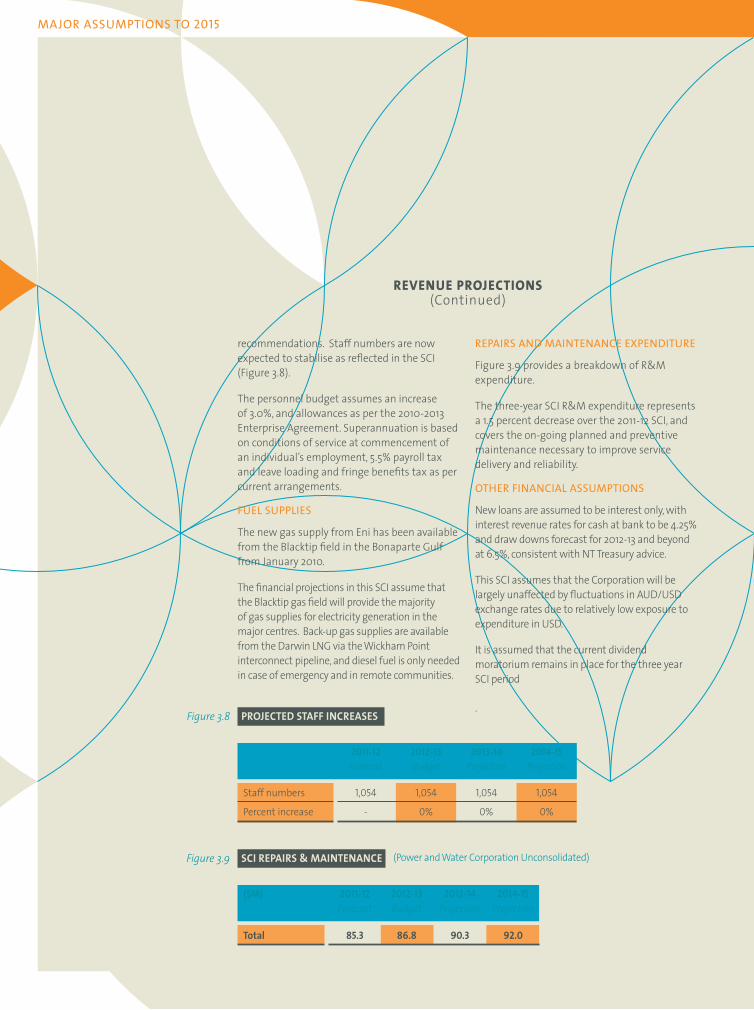
REPAIRS AND MAINTENANCE EXPENDITURE
Figure 3.9 provides a breakdown of R&M expenditure.
The three-year SCI R&M expenditure represents a 1.5 percent decrease over the 2011-12 SCI, and covers the on-going planned and preventive maintenance necessary to improve service delivery and reliability.
OTHER FINANCIAL ASSUMPTIONS
New loans are assumed to be interest only, with interest revenue rates for cash at bank to be 4.25% and draw downs forecast for 2012-13 and beyond at 6.5%, consistent with NT Treasury advice.
This SCI assumes that the Corporation will be largely unaffected by fluctuations in AUD/USD exchange rates due to relatively low exposure to expenditure in USD.
It is assumed that the current dividend moratorium remains in place for the three year SCI period
.
recommendations. Staff numbers are now expected to stabilise as reflected in the SCI (Figure 3.8).
The personnel budget assumes an increase of 3.0%, and allowances as per the 2010-2013 Enterprise Agreement. Superannuation is based on conditions of service at commencement of an individual’s employment, 5.5% payroll tax and leave loading and fringe benefits tax as per current arrangements.
FUEL SUPPLIES
The new gas supply from Eni has been available from the Blacktip field in the Bonaparte Gulf from January 2010.
The financial projections in this SCI assume that the Blacktip gas field will provide the majority of gas supplies for electricity generation in the major centres. Back-up gas supplies are available from the Darwin LNG via the Wickham Point interconnect pipeline, and diesel fuel is only needed in case of emergency and in remote communities.
PROJECTED STAFF INCREASESFigure 3.8
2011-12 2012-13 2013-14 2014-15 Forecast Budget Projection Projection
Staff numbers 1,054 1,054 1,054 1,054
Percent increase - 0% 0% 0%
REVENUE PROJECTIONS (Continued)
SCI REPAIRS & MAINTENANCEFigure 3.9
($M) 2011-12 2012-13 2013-14 2014-15 Forecast Budget Projection Projection
Total 85.3 86.8 90.3 92.0
(Power and Water Corporation Unconsolidated)
MAJOR ASSUMPTIONS TO 2015
31POWER AND WATER CORPORATION STATEMENT OF CORPORATE INTENT 2012-13
FINANCIAL PROJECTIONS 4
This chapter comments on the resulting projections of the Corporation’s financial performance and fiscal position.
FINANCIAL PROJECTIONS
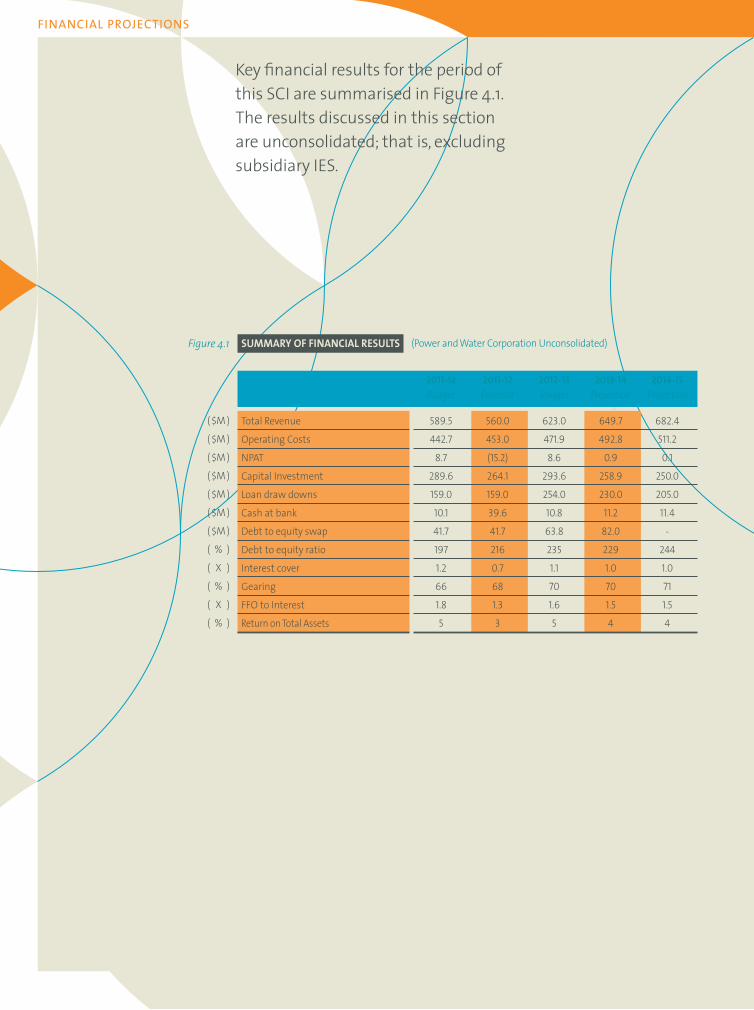
Key financial results for the period of this SCI are summarised in Figure 4.1. The results discussed in this section are unconsolidated; that is, excluding subsidiary IES.
SUMMARY OF FINANCIAL RESULTSFigure 4.1
2011-12 2011-12 2012-13 2013-14 2014-15 Budget Forecast Budget Projection Projection
Total Revenue 589.5 560.0 623.0 649.7 682.4
Operating Costs 442.7 453.0 471.9 492.8 511.2
NPAT 8.7 (15.2) 8.6 0.9 0.1
Capital Investment 289.6 264.1 293.6 258.9 250.0
Loan draw downs 159.0 159.0 254.0 230.0 205.0
Cash at bank 10.1 39.6 10.8 11.2 11.4
Debt to equity swap 41.7 41.7 63.8 82.0 -
Debt to equity ratio 197 216 235 229 244
Interest cover 1.2 0.7 1.1 1.0 1.0
Gearing 66 68 70 70 71
FFO to Interest 1.8 1.3 1.6 1.5 1.5
Return on Total Assets 5 3 5 4 4
( $M )
( $M )
( $M )
( $M )
( $M )
( $M )
( $M )
( % )
( X )
( % )
( X )
( % )
(Power and Water Corporation Unconsolidated)

33POWER AND WATER CORPORATION STATEMENT OF CORPORATE INTENT 2012-13
TARGETS 5
TARGETS
The KPIs stated in the SCI represent the most significant measures and may be supplemented in the business unit plan with additional operational measurements.
STRATEGIC MANAGEMENT FRAMEWORK
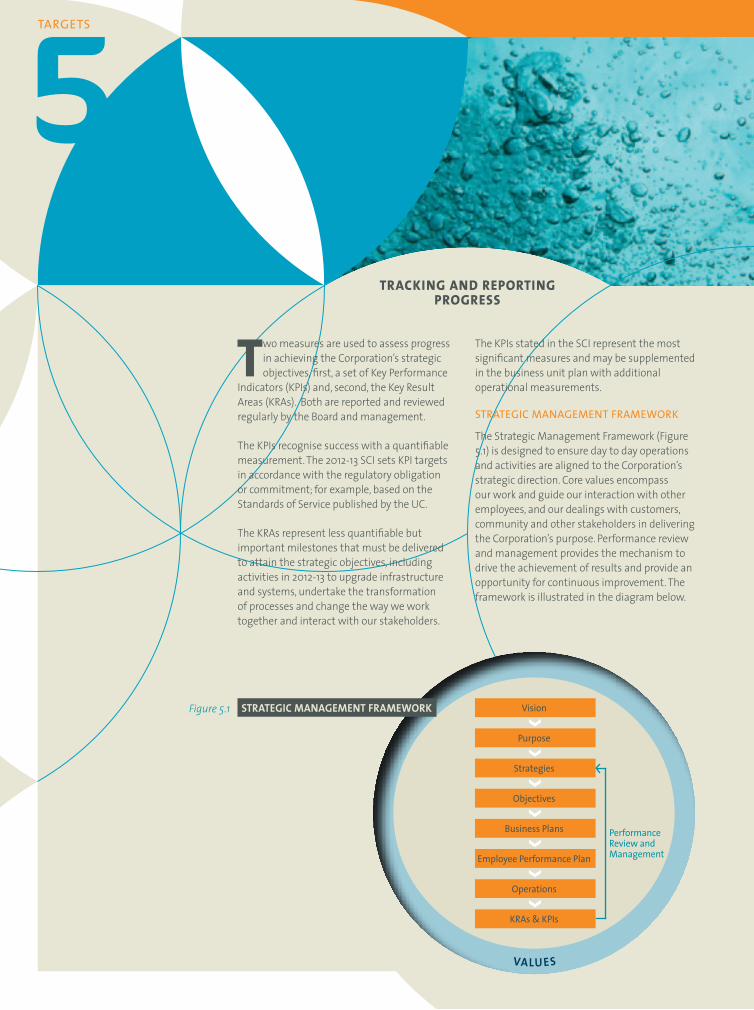
The Strategic Management Framework (Figure 5.1) is designed to ensure day to day operations and activities are aligned to the Corporation’s strategic direction. Core values encompass our work and guide our interaction with other employees, and our dealings with customers, community and other stakeholders in delivering the Corporation’s purpose. Performance review and management provides the mechanism to drive the achievement of results and provide an opportunity for continuous improvement. The framework is illustrated in the diagram below.
Two measures are used to assess progress in achieving the Corporation’s strategic objectives, first, a set of Key Performance
Indicators (KPIs) and, second, the Key Result Areas (KRAs). Both are reported and reviewed regularly by the Board and management.
The KPIs recognise success with a quantifiable measurement. The 2012-13 SCI sets KPI targets in accordance with the regulatory obligation or commitment; for example, based on the Standards of Service published by the UC.
The KRAs represent less quantifiable but important milestones that must be delivered to attain the strategic objectives, including activities in 2012-13 to upgrade infrastructure and systems, undertake the transformation of processes and change the way we work together and interact with our stakeholders.
TRACKING AND REPORTING PROGRESS
Vision
Purpose
Objectives
PerformanceReview andManagement
Business Plans
Employee Performance Plan
Operations
KRAs & KPIs
Strategies
STRATEGIC MANAGEMENT FRAMEWORKFigure5.1
VALU ES
35
KEY PERFORMANCE INDICATORS
POWER AND WATER CORPORATION TARGETS
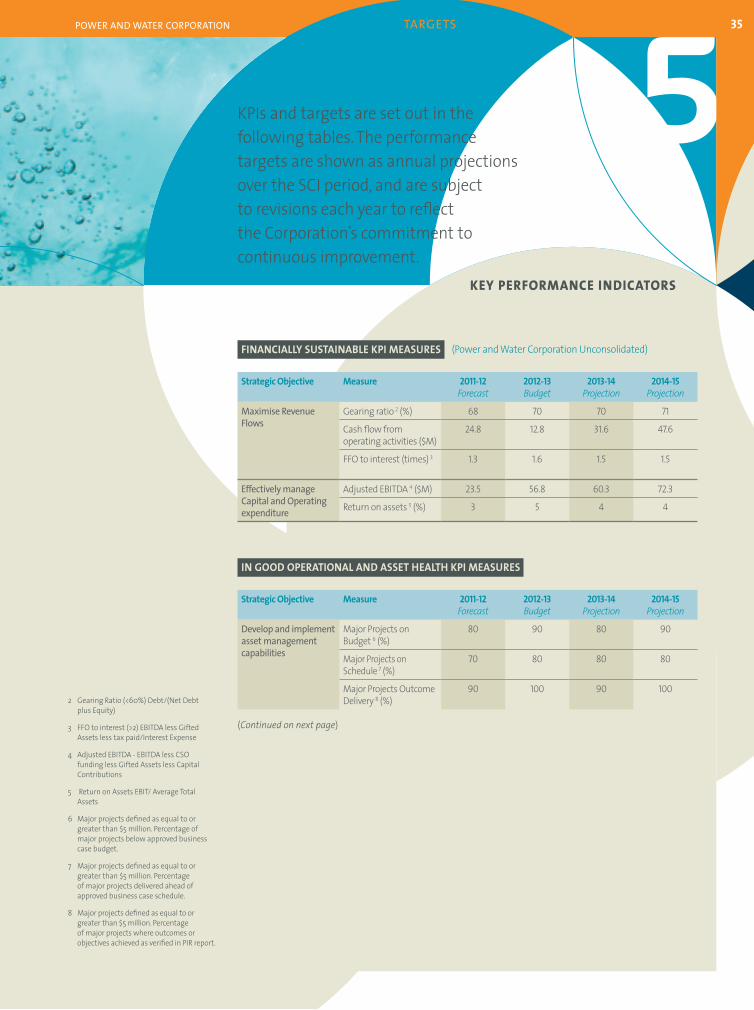
FINANCIALLY SUSTAINABLE KPI MEASURES
StrategicObjective Measure 2011-12 Forecast
2012-13 Budget
2013-14 Projection
2014-15 Projection
Maximise Revenue Flows
Gearing ratio 2 (%) 68 70 70 71
Cash flow from operating activities ($M)
24.8 12.8 31.6 47.6
FFO to interest (times) 3 1.3 1.6 1.5 1.5
Effectively manage Capital and Operating expenditure
Adjusted EBITDA4 ($M) 23.5 56.8 60.3 72.3
Return on assets5 (%) 3 5 4 4
IN GOOD OPERATIONAL AND ASSET HEALTH KPI MEASURES
StrategicObjective Measure 2011-12 Forecast
2012-13 Budget
2013-14 Projection
2014-15 Projection
Develop and implement asset management capabilities
Major Projects on Budget6 (%)
80 90 80 90
Major Projects on Schedule 7 (%)
70 80 80 80
Major Projects Outcome Delivery 8 (%)
90 100 90 100
KPIs and targets are set out in the following tables. The performance targets are shown as annual projections over the SCI period, and are subject to revisions each year to reflect the Corporation’s commitment to continuous improvement.
2 Gearing Ratio (<60%) Debt/(Net Debt plus Equity)
3 FFO to interest (>2) EBITDA less Gifted Assets less tax paid/Interest Expense
4 Adjusted EBITDA - EBITDA less CSO funding less Gifted Assets less Capital Contributions
5 Return on Assets EBIT/ Average Total Assets
6 Major projects defined as equal to or greater than $5 million. Percentage of major projects below approved business case budget.
7 Major projects defined as equal to or greater than $5 million. Percentage of major projects delivered ahead of approved business case schedule.
8 Major projects defined as equal to or greater than $5 million. Percentage of major projects where outcomes or objectives achieved as verified in PIR report.
(Power and Water Corporation Unconsolidated)
(Continuedonnextpage)
TARGETS
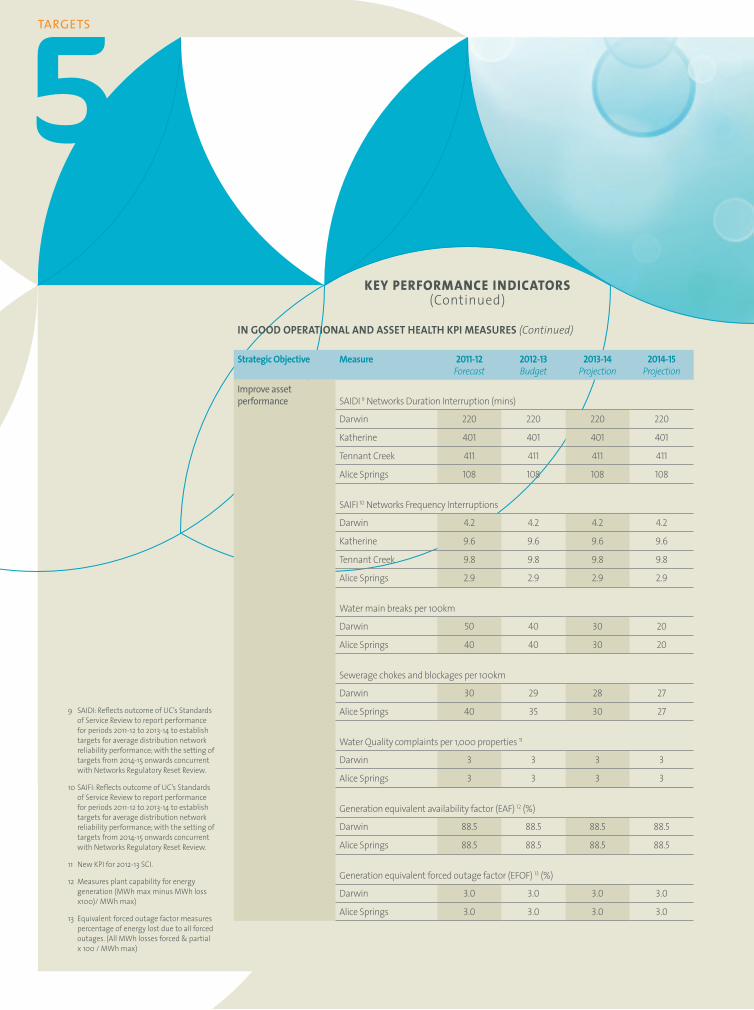
IN GOOD OPERATIONAL AND ASSET HEALTH KPI MEASURES (Continued)
StrategicObjective Measure 2011-12 Forecast
2012-13 Budget
2013-14 Projection
2014-15 Projection
Improve asset performance SAIDI 9 Networks Duration Interruption (mins)
Darwin 220 220 220 220
Katherine 401 401 401 401
Tennant Creek 411 411 411 411
Alice Springs 108 108 108 108
SAIFI 10 Networks Frequency Interruptions
Darwin 4.2 4.2 4.2 4.2
Katherine 9.6 9.6 9.6 9.6
Tennant Creek 9.8 9.8 9.8 9.8
Alice Springs 2.9 2.9 2.9 2.9
Water main breaks per 100km
Darwin 50 40 30 20
Alice Springs 40 40 30 20
Sewerage chokes and blockages per 100km
Darwin 30 29 28 27
Alice Springs 40 35 30 27
Water Quality complaints per 1,000 properties 11
Darwin 3 3 3 3
Alice Springs 3 3 3 3
Generation equivalent availability factor (EAF) 12 (%)
Darwin 88.5 88.5 88.5 88.5
Alice Springs 88.5 88.5 88.5 88.5
Generation equivalent forced outage factor (EFOF) 13 (%)
Darwin 3.0 3.0 3.0 3.0
Alice Springs 3.0 3.0 3.0 3.0
9 SAIDI: Reflects outcome of UC’s Standards of Service Review to report performance for periods 2011-12 to 2013-14 to establish targets for average distribution network reliability performance; with the setting of targets from 2014-15 onwards concurrent with Networks Regulatory Reset Review.
10 SAIFI: Reflects outcome of UC’s Standards of Service Review to report performance for periods 2011-12 to 2013-14 to establish targets for average distribution network reliability performance; with the setting of targets from 2014-15 onwards concurrent with Networks Regulatory Reset Review.
11 New KPI for 2012-13 SCI.
12 Measures plant capability for energy generation (MWh max minus MWh loss x100)/ MWh max)
13 Equivalent forced outage factor measures percentage of energy lost due to all forced outages. (All MWh losses forced & partial x 100 / MWh max)
KEY PERFORMANCE INDICATORS (Continued)
37POWER AND WATER CORPORATION TARGETS
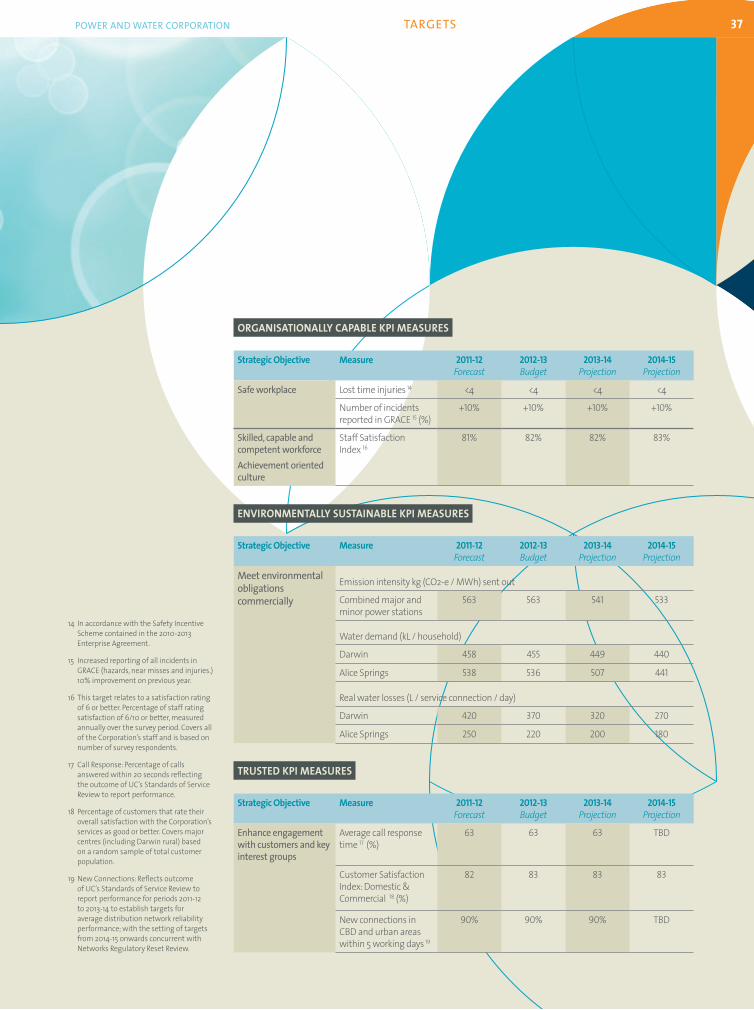
ORGANISATIONALLY CAPABLE KPI MEASURES
StrategicObjective Measure 2011-12 Forecast
2012-13 Budget
2013-14 Projection
2014-15 Projection
Safe workplace Lost time injuries 14 <4 <4 <4 <4
Number of incidents reported in GRACE 15 (%)
+10% +10% +10% +10%
Skilled, capable and competent workforceAchievement oriented culture
Staff Satisfaction Index 16
81% 82% 82% 83%
ENVIRONMENTALLY SUSTAINABLE KPI MEASURES
StrategicObjective Measure 2011-12 Forecast
2012-13 Budget
2013-14 Projection
2014-15 Projection
Meet environmental obligations commercially
Emission intensity kg (CO2-e / MWh) sent out
Combined major and minor power stations
563 563 541 533
Water demand (kL / household)
Darwin 458 455 449 440
Alice Springs 538 536 507 441
Real water losses (L / service connection / day)
Darwin 420 370 320 270
Alice Springs 250 220 200 180
TRUSTED KPI MEASURES
StrategicObjective Measure 2011-12 Forecast
2012-13 Budget
2013-14 Projection
2014-15 Projection
Enhance engagement with customers and key interest groups
Average call response time 17(%)
63 63 63 TBD
Customer Satisfaction Index: Domestic & Commercial 18(%)
82 83 83 83
New connections in CBD and urban areas within 5 working days 19
90% 90% 90% TBD
14 In accordance with the Safety Incentive Scheme contained in the 2010-2013 Enterprise Agreement.
15 Increased reporting of all incidents in GRACE (hazards, near misses and injuries.) 10% improvement on previous year.
16 This target relates to a satisfaction rating of 6 or better. Percentage of staff rating satisfaction of 6/10 or better, measured annually over the survey period. Covers all of the Corporation’s staff and is based on number of survey respondents.
17 Call Response: Percentage of calls answered within 20 seconds reflecting the outcome of UC’s Standards of Service Review to report performance.
18 Percentage of customers that rate their overall satisfaction with the Corporation’s services as good or better. Covers major centres (including Darwin rural) based on a random sample of total customer population.
19 New Connections: Reflects outcome of UC’s Standards of Service Review to report performance for periods 2011-12 to 2013-14 to establish targets for average distribution network reliability performance; with the setting of targets from 2014-15 onwards concurrent with Networks Regulatory Reset Review.


39POWER AND WATER CORPORATION STATEMENT OF CORPORATE INTENT 2012-13
RISKS 6
RISKS
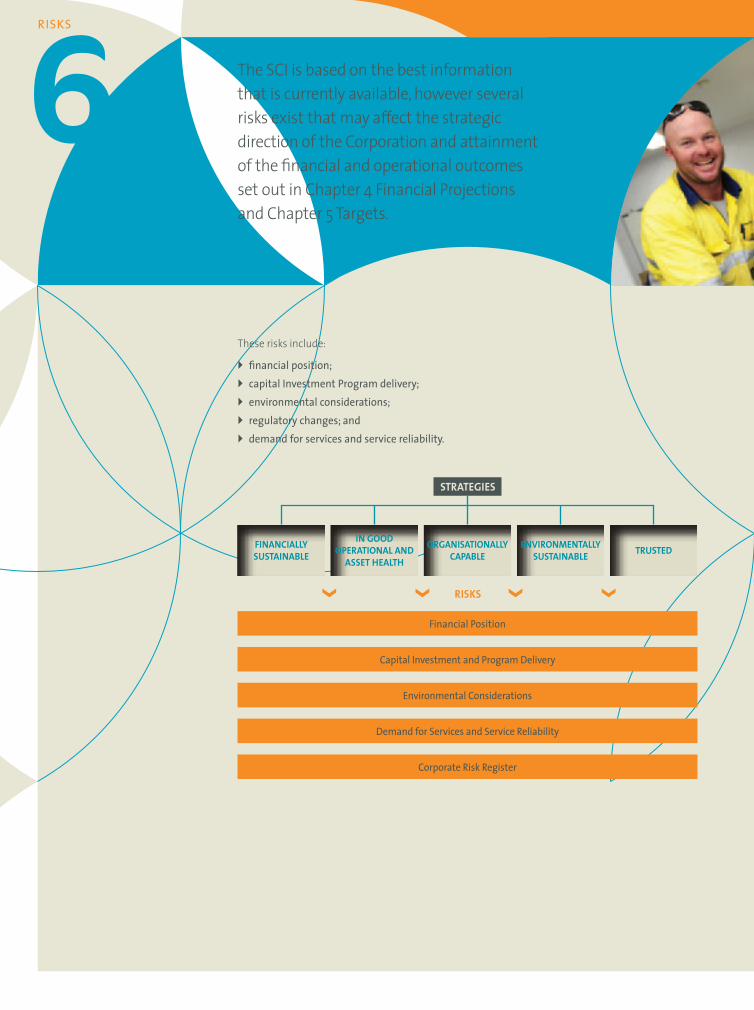
The SCI is based on the best information that is currently available, however several risks exist that may affect the strategic direction of the Corporation and attainment of the financial and operational outcomes set out in Chapter 4 Financial Projections and Chapter 5 Targets.
These risks include:
} financial position;} capital Investment Program delivery;} environmental considerations; } regulatory changes; and} demand for services and service reliability.
STRATEGIES
Financial Position
Capital Investment and Program Delivery
Environmental Considerations
Demand for Services and Service Reliability
Corporate Risk Register
FINANCIALLYSUSTAINABLE
INGOODOPERATIONALAND
ASSETHEALTH
ORGANISATIONALLYCAPABLE
ENVIRONMENTALLYSUSTAINABLE TRUSTED
RISKS
41
FINANCIAL POSITION
POWER AND WATER CORPORATION RISKS
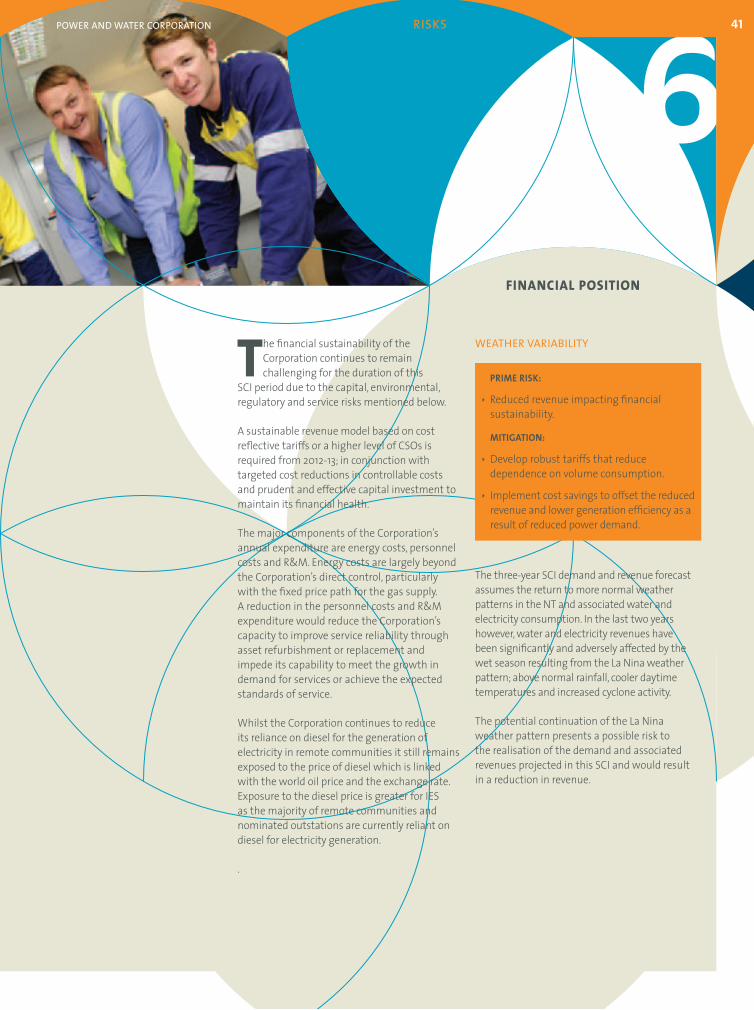
WEATHER VARIABILITY
The three-year SCI demand and revenue forecast assumes the return to more normal weather patterns in the NT and associated water and electricity consumption. In the last two years however, water and electricity revenues have been significantly and adversely affected by the wet season resulting from the La Nina weather pattern; above normal rainfall, cooler daytime temperatures and increased cyclone activity.
The potential continuation of the La Nina weather pattern presents a possible risk to the realisation of the demand and associated revenues projected in this SCI and would result in a reduction in revenue.
The financial sustainability of the Corporation continues to remain challenging for the duration of this
SCI period due to the capital, environmental, regulatory and service risks mentioned below.
A sustainable revenue model based on cost reflective tariffs or a higher level of CSOs is required from 2012-13; in conjunction with targeted cost reductions in controllable costs and prudent and effective capital investment to maintain its financial health.
The major components of the Corporation’s annual expenditure are energy costs, personnel costs and R&M. Energy costs are largely beyond the Corporation’s direct control, particularly with the fixed price path for the gas supply. A reduction in the personnel costs and R&M expenditure would reduce the Corporation’s capacity to improve service reliability through asset refurbishment or replacement and impede its capability to meet the growth in demand for services or achieve the expected standards of service.
Whilst the Corporation continues to reduce its reliance on diesel for the generation of electricity in remote communities it still remains exposed to the price of diesel which is linked with the world oil price and the exchange rate. Exposure to the diesel price is greater for IES as the majority of remote communities and nominated outstations are currently reliant on diesel for electricity generation.
.
PRIME RISK:
ê Reduced revenue impacting financial sustainability.
MITIGATION:
ê Develop robust tariffs that reduce dependence on volume consumption.
ê Implement cost savings to offset the reduced revenue and lower generation efficiency as a result of reduced power demand.

RISKS
Several risks are associated with the delivery of the capital investment program. In particular, the size of the program will
challenge the Corporation’s capability to deliver projects on time and within budget.
Over the next three years the NT’s economy is expected to experience strong growth driven by significant resource projects in the transport, Liquefied Natural Gas and mining sectors. Inevitably the increase in market demand will reduce contractor availability, impact material supply and increase equipment delivery lead times, consequently driving up the project delivery costs and delaying completion timeframes. This competitive market will be felt in local industry sectors, which is contracted to deliver a substantial part of the capital investment program.
The Corporation is determined to deliver the capital investment program and improve asset management capabilities. Focus on the capital investment will continue with enhancements to governance, management and delivery of the program with a clear prioritisation of projects based on overall value to the business.
.
PRIME RISKS:
ê Escalation of project costs above budget and schedule delays in delivering assets.
ê Overspend exposure to R&M budget.
MITIGATION:
ê Restructure procurement contracts on a program basis rather than by project eg early contract involvement.
ê Pruning of programs and projects by assessing the priority and value to the business.
PRUDENT AND EFFECTIVE CAPITAL INVESTMENT
43
ENVIRONMENTAL CONSIDERATIONS
POWER AND WATER CORPORATION RISKS
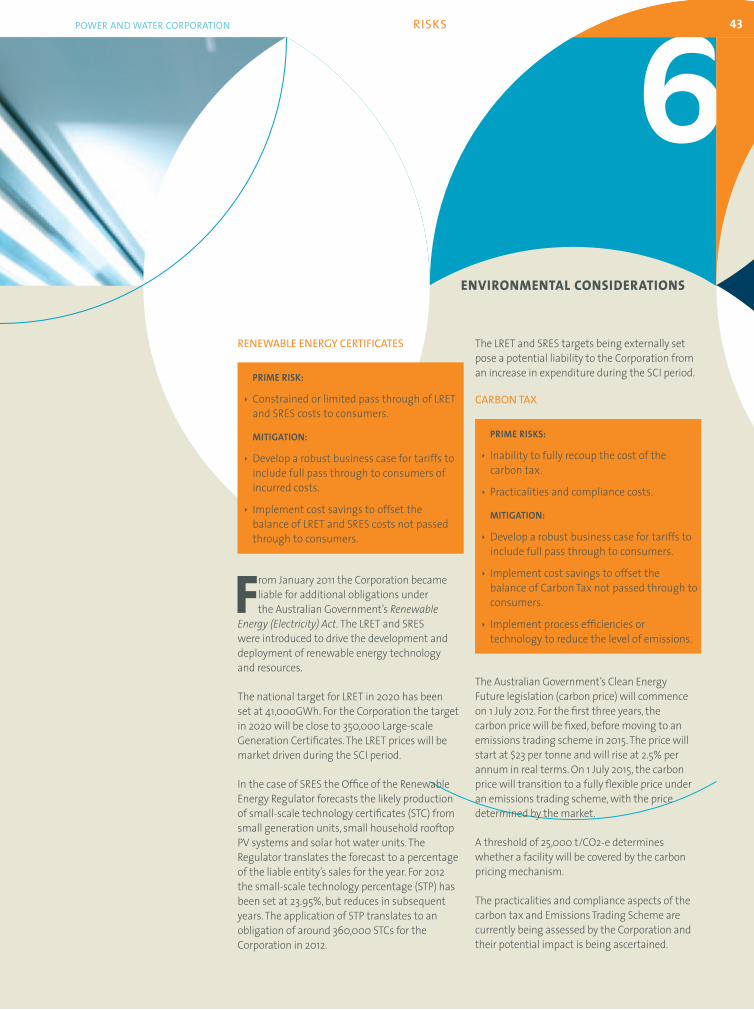
The LRET and SRES targets being externally set pose a potential liability to the Corporation from an increase in expenditure during the SCI period.
CARBON TAX
The Australian Government’s Clean Energy Future legislation (carbon price) will commence on 1 July 2012. For the first three years, the carbon price will be fixed, before moving to an emissions trading scheme in 2015. The price will start at $23 per tonne and will rise at 2.5% per annum in real terms. On 1 July 2015, the carbon price will transition to a fully flexible price under an emissions trading scheme, with the price determined by the market.
A threshold of 25,000 t/CO2-e determines whether a facility will be covered by the carbon pricing mechanism.
The practicalities and compliance aspects of the carbon tax and Emissions Trading Scheme are currently being assessed by the Corporation and their potential impact is being ascertained.
RENEWABLE ENERGY CERTIFICATES
From January 2011 the Corporation became liable for additional obligations under the Australian Government’s Renewable
Energy(Electricity)Act. The LRET and SRES were introduced to drive the development and deployment of renewable energy technology and resources.
The national target for LRET in 2020 has been set at 41,000GWh. For the Corporation the target in 2020 will be close to 350,000 Large-scale Generation Certificates. The LRET prices will be market driven during the SCI period.
In the case of SRES the Office of the Renewable Energy Regulator forecasts the likely production of small-scale technology certificates (STC) from small generation units, small household rooftop PV systems and solar hot water units. The Regulator translates the forecast to a percentage of the liable entity’s sales for the year. For 2012 the small-scale technology percentage (STP) has been set at 23.95%, but reduces in subsequent years. The application of STP translates to an obligation of around 360,000 STCs for the Corporation in 2012.
PRIME RISK:
ê Constrained or limited pass through of LRET and SRES costs to consumers.
MITIGATION:
ê Develop a robust business case for tariffs to include full pass through to consumers of incurred costs.
ê Implement cost savings to offset the balance of LRET and SRES costs not passed through to consumers.
PRIME RISKS:
ê Inability to fully recoup the cost of the carbon tax.
ê Practicalities and compliance costs.
MITIGATION:
ê Develop a robust business case for tariffs to include full pass through to consumers.
ê Implement cost savings to offset the balance of Carbon Tax not passed through to consumers.
ê Implement process efficiencies or technology to reduce the level of emissions.
RISKS
Annual water demand can vary significantly due to seasonal rainfall variations and progress against the 2030 targets will need to be measured over several years. For the purpose of long term water resource planning the Corporation will use a rolling three year average to smooth out annual fluctuations in water demand.
The Corporation has identified and implemented a number of programs to reduce current water use that will contribute towards the NTGs T2030 Strategy targets. These initiatives include:
} consumer education through campaigns and conservation rules;
} rebates and retrofits for homes and in time business and industry;
} improved metering to provide consumer information;
} pressure reduction programs where practical;
} community water reuse; and
} supply substitution where possible.
The Alice Springs Water Smart program commenced in 2011 and will deliver water demand reductions. A similar broad based program for Darwin is being developed and will comprise all of the initiatives identified above.
The Corporation will continue to investigate options and to engage collaboratively with other NTG agencies to develop a consistent whole of government approach to attain the T2030 targets.
Progress in reducing water consumption in the NT is critical to defer the need for new water sources in Darwin, Alice Springs and elsewhere in the NT.
WATER SUSTAINABILITY
The NTGs T2030 Strategy and Climate Change Policy both contain targets for water sustainability and demand management. These targets are:
} Reduce the amount of water that NT house-holds use by 20% by 2015 and a further 10% by 2020 compared to 2009 consumption levels.
} Ensure efficient use of water by business and industry.
ENVIRONMENTAL CONSIDERATIONS(Continued)
PRIME RISKS:
ê Demand management initiatives fail to reduce water consumption significantly to achieve targeted levels.
ê Accelerated requirement to increase water sources.
ê Reduced revenue as a result of a lower level of water demand.
MITIGATION:
ê Develop a targeted demand management program inclusive of a whole of Government approach for residential, commercial and government segments.
ê Implement community water restrictions.
ê Implement process efficiencies or technology to restrict the level of water consumption.
ê Review the water tariff structure to ensure adequate recovery of the fixed cost of supply whilst promoting more efficient water usage.
45POWER AND WATER CORPORATION RISKS
The Corporation is committed to progressively reducing the impact of wastewater discharging to Darwin Harbour over a 15-20 year time frame given the extent of investment required.
The Corporation has committed to close the Larrakeyah Outfall and upgrade treatment processes at the Leanyer Sanderson wastewater treatment plant. In addition, the Corporation has committed to upgrades at East Arm and Palmerston wastewater treatment plants.
DARWIN SEWERAGE TREATMENT
The Corporation holds five Wastewater Discharge Licences in the Darwin Region that discharge to Darwin Harbour. The current licences were issued in 2011 for a two-year period as a basis for improvement in the quality of wastewater discharge to meet the new Darwin Harbour Water Objectives. This followed increased community and political awareness of the issue of wastewater discharge into the harbour.
Whereas previous licences included quantitative discharge water quality limits based on historical performance, current licences focus on the process of establishing mixing zones and development of more appropriate site-specific water quality limits. Current licences also contain more stringent conditions in relation to monitoring and reporting requirements, including public reporting. It is anticipated that future licences will refer to the locally derived numerical discharge quality limits.
PRIME RISK:
ê Accelerated requirement to improve water discharge quality.
MITIGATION:
ê Accelerate the implementation of process efficiencies or technology to improve water quality discharge levels.
ê Increase or bring forward capital investment to provide tertiary treatment of wastewater.
RISKS
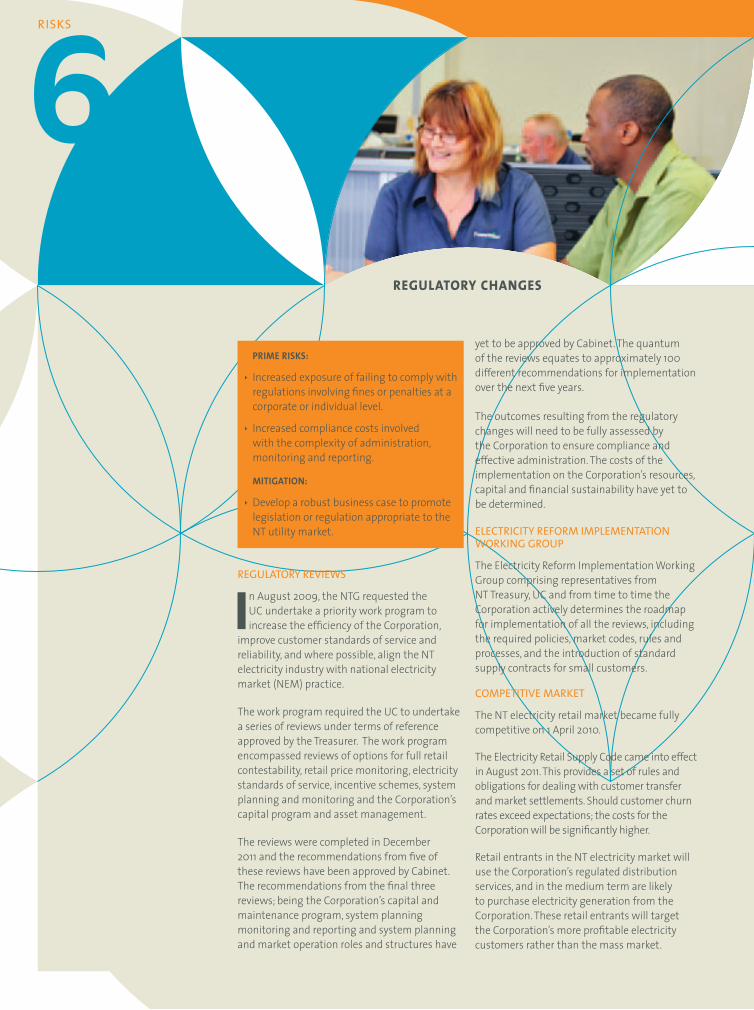
yet to be approved by Cabinet. The quantum of the reviews equates to approximately 100 different recommendations for implementation over the next five years.
The outcomes resulting from the regulatory changes will need to be fully assessed by the Corporation to ensure compliance and effective administration. The costs of the implementation on the Corporation’s resources, capital and financial sustainability have yet to be determined.
ELECTRICITY REFORM IMPLEMENTATION WORKING GROUP
The Electricity Reform Implementation Working Group comprising representatives from NT Treasury, UC and from time to time the Corporation actively determines the roadmap for implementation of all the reviews, including the required policies, market codes, rules and processes, and the introduction of standard supply contracts for small customers.
COMPETITIVE MARKET
The NT electricity retail market became fully competitive on 1 April 2010.
The Electricity Retail Supply Code came into effect in August 2011. This provides a set of rules and obligations for dealing with customer transfer and market settlements. Should customer churn rates exceed expectations; the costs for the Corporation will be significantly higher.
Retail entrants in the NT electricity market will use the Corporation’s regulated distribution services, and in the medium term are likely to purchase electricity generation from the Corporation. These retail entrants will target the Corporation’s more profitable electricity customers rather than the mass market.
REGULATORY REVIEWS
In August 2009, the NTG requested the UC undertake a priority work program to increase the efficiency of the Corporation,
improve customer standards of service and reliability, and where possible, align the NT electricity industry with national electricity market (NEM) practice.
The work program required the UC to undertake a series of reviews under terms of reference approved by the Treasurer. The work program encompassed reviews of options for full retail contestability, retail price monitoring, electricity standards of service, incentive schemes, system planning and monitoring and the Corporation’s capital program and asset management.
The reviews were completed in December 2011 and the recommendations from five of these reviews have been approved by Cabinet. The recommendations from the final three reviews; being the Corporation’s capital and maintenance program, system planning monitoring and reporting and system planning and market operation roles and structures have
REGULATORY CHANGES
PRIME RISKS:
ê Increased exposure of failing to comply with regulations involving fines or penalties at a corporate or individual level.
ê Increased compliance costs involved with the complexity of administration, monitoring and reporting.
MITIGATION:
ê Develop a robust business case to promote legislation or regulation appropriate to the NT utility market.

47POWER AND WATER CORPORATION RISKS
ELECTRICITY SYSTEM PLANNING AND MARKET OPERATION ROLES AND STRUCTURES
It has been recommended that the Corporation amend its regulatory and institutional framework. These recommendations include the clarification of roles and responsibilities of the Corporation’s business units and clearer lines of reporting and accountability that are documented in a regulatory framework.
ELECTRICITY SYSTEM PLANNING, MONITORING AND REPORTING
It has been recommended that the Corporation adopts planning instruments and system reporting that is consistent with those of the NEM. Planning information should be updated regularly to provide a program of information collection, analysis and disclosure of power system security and reliability of supply prospects.
GUARANTEED SERVICE LEVEL CODE
A customer service incentive scheme, providing rebates to customers where defined standards of service are not met by the electricity network distributor is in the process of a staged introduction. The Guaranteed Service Level code commenced on 1 January 2012.
RETAIL PRICE MONITORING REGIME
A retail price monitoring regime requiring disclosure of costs and retail prices and reporting against associated benchmarks is in the process of development and will commence during 2012.
ELECTRICITY STANDARDS OF SERVICE
Work will continue in defining the electricity standards of service framework. This will require monitoring and reporting of electricity supplier standards of service against defined performance benchmarks. A staged implementation will occur from 2012 as targets are determined and aligned with the regulatory determination process.
ASSET MANAGEMENT CAPABILITY PROJECT
For the next three years the Corporation will be required to undertake annual reporting to the Treasurer in relation to progress with the implementation of the Asset Management Capability (AMC) project and associated achievements.
RISKS
The TGTs are Ali Curung, Angurugu/Umbakumba, Borroloola, Daguragu/Kalkarindji, Elliott, Galiwin'ku, Gapuwiyak, Gunbalanya, Hermannsburg, Lajamanu, Maningrida, Milingimbi, Nguiu, Ngukurr, Numbulwar, Papunya, Ramingining, Umbakumba, Wadeye, Yirrkala and Yuendumu.
The towns will be the regional “hub” and will have town planning and provide services to all people living in that region, where people from surrounding regions can attend schools, police stations, court, health services, aged care and disability facilities. In order to have services like any other country town, TGTs will need proper infrastructure – including water, sewerage and electricity.
The growth in water and electricity demand in the TGTs is difficult to estimate as it depends on the investment programs and policy initiatives of governments. Some TGTs have experienced large increases in energy demand in the past few years where others have stayed stable. In addition to the growth, it is anticipated that new levels of service will be expected and defined. At this stage new levels of service have not been determined, consequently this SCI does not include the funding allocation required to meet the new levels of service or the potential substantial growth in demand.
TERRITORY GROWTH TOWNS
PRIME RISKS:
ê Funding fails to adequately cover the required asset and infrastructure augmentation.
ê Lack of sustainable water sources or reliable power supply compromises economic and social development.
ê Reputational risks to the Corporation of not meeting service levels.
MITIGATION:
ê Develop robust tariffs or a funding case that demonstrates the risks and benefits in Remote Community asset investment.
ê Reduction of service level commensurate with funding levels.
ê Deferral of approval to connect secondary infrastructure.
ê Implementation of community based demand management water efficiency and electricity efficiency initiatives.
DEMAND FOR SERVICE AND SERVICE RELIABILITY
As part of Working Future the NTG defined 20 of the biggest and strategically placed remote communities
as TGTs and defined a strategy that will see 20 Indigenous communities transformed over time into TGTs that:
} are properly planned and designed;
} have services, buildings and facilities like any other country town; and
} benefit from targeted investment in infrastructure.
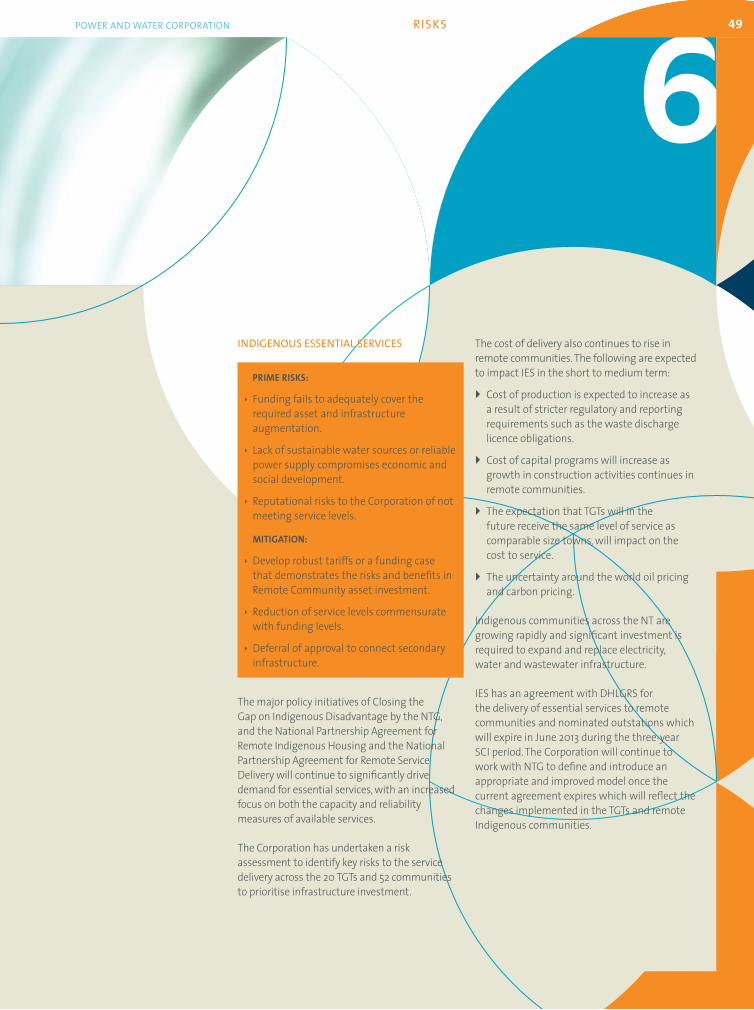
49POWER AND WATER CORPORATION RISKS
The cost of delivery also continues to rise in remote communities. The following are expected to impact IES in the short to medium term:
} Cost of production is expected to increase as a result of stricter regulatory and reporting requirements such as the waste discharge licence obligations.
} Cost of capital programs will increase as growth in construction activities continues in remote communities.
} The expectation that TGTs will in the future receive the same level of service as comparable size towns, will impact on the cost to service.
} The uncertainty around the world oil pricing and carbon pricing.
Indigenous communities across the NT are growing rapidly and significant investment is required to expand and replace electricity, water and wastewater infrastructure.
IES has an agreement with DHLGRS for the delivery of essential services to remote communities and nominated outstations which will expire in June 2013 during the three-year SCI period. The Corporation will continue to work with NTG to define and introduce an appropriate and improved model once the current agreement expires which will reflect the changes implemented in the TGTs and remote Indigenous communities.
INDIGENOUS ESSENTIAL SERVICES
The major policy initiatives of Closing the Gap on Indigenous Disadvantage by the NTG, and the National Partnership Agreement for Remote Indigenous Housing and the National Partnership Agreement for Remote Service Delivery will continue to significantly drive demand for essential services, with an increased focus on both the capacity and reliability measures of available services.
The Corporation has undertaken a risk assessment to identify key risks to the service delivery across the 20 TGTs and 52 communities to prioritise infrastructure investment.
PRIME RISKS:
ê Funding fails to adequately cover the required asset and infrastructure augmentation.
ê Lack of sustainable water sources or reliable power supply compromises economic and social development.
ê Reputational risks to the Corporation of not meeting service levels.
MITIGATION:
ê Develop robust tariffs or a funding case that demonstrates the risks and benefits in Remote Community asset investment.
ê Reduction of service levels commensurate with funding levels.
ê Deferral of approval to connect secondary infrastructure.
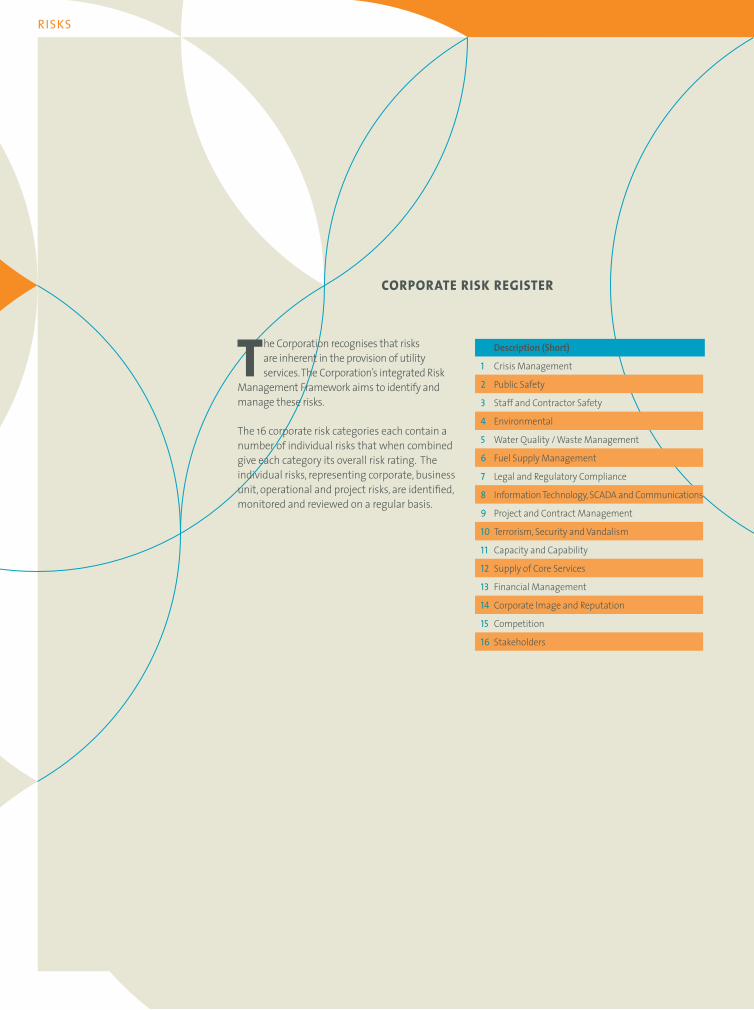
RISKS
The Corporation recognises that risks are inherent in the provision of utility services. The Corporation’s integrated Risk
Management Framework aims to identify and manage these risks.
The 16 corporate risk categories each contain a number of individual risks that when combined give each category its overall risk rating. The individual risks, representing corporate, business unit, operational and project risks, are identified, monitored and reviewed on a regular basis.
CORPORATE RISK REGISTER
Description(Short)
1 Crisis Management
2 Public Safety
3 Staff and Contractor Safety
4 Environmental
5 Water Quality / Waste Management
6 Fuel Supply Management
7 Legal and Regulatory Compliance
8 Information Technology, SCADA and Communications
9 Project and Contract Management
10 Terrorism, Security and Vandalism
11 Capacity and Capability
12 Supply of Core Services
13 Financial Management
14 Corporate Image and Reputation
15 Competition
16 Stakeholders

51POWER AND WATER CORPORATION STATEMENT OF CORPORATE INTENT 2012-13
CAPITAL EXPENDITURE
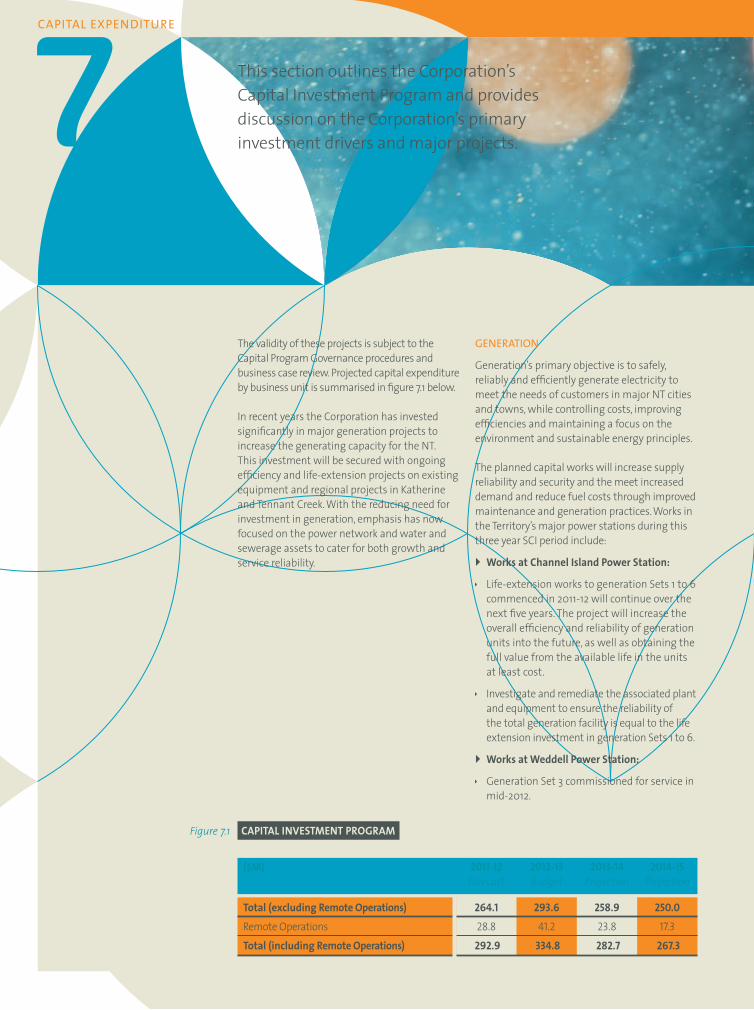
CAPITAL EXPENDITURE
GENERATION
Generation’s primary objective is to safely, reliably and efficiently generate electricity to meet the needs of customers in major NT cities and towns, while controlling costs, improving efficiencies and maintaining a focus on the environment and sustainable energy principles.
The planned capital works will increase supply reliability and security and the meet increased demand and reduce fuel costs through improved maintenance and generation practices. Works in the Territory’s major power stations during this three year SCI period include:
} WorksatChannelIslandPowerStation:
ê Life-extension works to generation Sets 1 to 6 commenced in 2011-12 will continue over the next five years. The project will increase the overall efficiency and reliability of generation units into the future, as well as obtaining the full value from the available life in the units at least cost.
ê Investigate and remediate the associated plant and equipment to ensure the reliability of the total generation facility is equal to the life extension investment in generation Sets 1 to 6.
} WorksatWeddellPowerStation:
ê Generation Set 3 commissioned for service in mid-2012.
The validity of these projects is subject to the Capital Program Governance procedures and business case review. Projected capital expenditure by business unit is summarised in figure 7.1 below.
In recent years the Corporation has invested significantly in major generation projects to increase the generating capacity for the NT. This investment will be secured with ongoing efficiency and life-extension projects on existing equipment and regional projects in Katherine and Tennant Creek. With the reducing need for investment in generation, emphasis has now focused on the power network and water and sewerage assets to cater for both growth and service reliability.
($M) 2011-12 2012-13 2013-14 2014-15 Forecast Budget Projection Projection
Total(excludingRemoteOperations) 264.1 293.6 258.9 250.0Remote Operations 28.8 41.2 23.8 17.3Total(includingRemoteOperations) 292.9 334.8 282.7 267.3
CAPITAL INVESTMENT PROGRAMFigure7.1
This section outlines the Corporation’s Capital Investment Program and provides discussion on the Corporation’s primary investment drivers and major projects.
53POWER AND WATER CORPORATION CAPITAL EXPENDITURE
} Construct and commission a new 132/66kV terminal substation and 132kV transmission system to cater for load growth in the greater Darwin region.
} Complete commissioning of the new Channel Island Power Station 132kV Switchyard ‘B’ to connect new generators.
WATER SERVICES
For the 2012-13 SCI, Water Services reviewed and prioritised the capital works program to match project delivery resource capability. This enabled improved planning, a clearer focus on essential compliance programs and more effective project delivery.
} Recommissioning work on Manton Dam continues in order to meet requirements for additional capacity and diversity of emergency water supplies in the Darwin, Palmerston and rural area.
} The development of a major water treatment plant for the Darwin region water supply will support the return to service of Manton Dam, allow Darwin River Dam’s total capacity to be more fully utilised.
} Palmerston augmentation will include new pumping and transmission infrastructure and new water tanks to service the significant growth in the Palmerston region.
} Berrimah and Northern suburbs water strategy will include transmission infrastructure and water tanks to service the development planned for the Northern suburbs.
} Channel Island water main upgrades are associated with the development of Middle Arm and to improve the security of supply to Channel Island Power Station.
} WorksatTennantCreekPowerStation:
ê The augmentation process will be completed in 2012-13, in particular the engine replacement of Set 15 at 30,000 hours.
POWER NETWORKS
The 2012-13 SCI includes a robust zone substation replacement plan as a consequence of the findings of the Remedial Asset Management Program (RAMP). Of particular concern is the condition of assets at Snell Street and City Zone Substations. Construction is progressing well at Snell Street to completely replace this zone substation (with Woolner Zone Substation) and a mitigation plan has been implemented to manage the potential asset failure risk at all zone substation sites.
The first stage of pre-qualifying companies for the Early Contractor Involvement contract approach, with the scope to design and construct all zone substation replacement projects over the next five years, has been finalised.
Delivering Power Networks 2012-13 Capital Investment Program will be a significant challenge. The program includes the following major projects:
} Complete construction of the replacement Snell Street Zone Substation (Woolner Zone Substation), City Zone Substation, Leanyer Zone Substation and Norris Bell 66/22kV Zone Substation.
} Replacement or upgrade of the Berrimah Zone Substation, Humpty Doo Zone Substation and McMinns Zone Substation.
} Complete the installation of second transformer, 11kV bus section 2 and 66kV transmission ring at Frances Bay Zone Substation.
CAPITAL EXPENDITURE
OTHER MAJOR INVESTMENT
Other major capital investment is aimed at improving the quality and efficiency of the Corporation's business and supporting core business units.
Major investment works planned over the life of this SCI include:
} Package 1 and Package 2 of the Ben Hammond Complex redevelopment will include demolition, construction, refurbishment, civil works, landscaping and road works. The upgrade will meet current and future operational needs and improve safety. This will also include the removal of asbestos from the site.
} Augmentation of corporate support facilities in Alice Springs will include an upgrade to office accommodation, workshop facilities, warehouse and other storage facilities, security, car parking, training facilities and site amenities to meet building codes.
} The implementation of the Maximo and ESRI integrated asset system will be completed and ready for use mid-2012. Considerable effort has been employed to define assets, determine and produce process flows. The introduction of the new systems provides opportunities to improve the management of assets particularly in the areas of asset planning, maintenance planning and condition monitoring. Works will continue to exploit the full potential of the system and features.
} The upgrade of the Victoria Highway complex in Katherine includes general and major site upgrades. It will meet current and future operational needs, improve safety and contribute to increased staff satisfaction.
} The asbestos cement water main replacement project continues to reduce the frequency of failures associated with asbestos cement water mains across the NT.
SEWERAGE SERVICES
The proposed capital works program includes significant investment in wastewater treatment and recycling infrastructure upgrades. Improvement works are proposed for Ludmilla, Leanyer Sanderson, Alice Springs, Katherine and Borroloola.
Sewerage Collection and Transport (Mains and Pumping):
} Completion of the Larrakeyah Outfall Closure Plan involves the diversion of sewerage from Larrakeyah and the Darwin CBD to the Ludmilla Wastewater Treatment Plant to allow the closure of the Larrakeyah outfall. This project is to comply with the wastewater discharge licence requirements. The effluent rising main to East Point will be duplicated, and the East Point outfall will be significantly extended to improve dispersion of treated wastewater.
} Upgrade to Leanyer/Sanderson Wastewater Treatment Plant will involve the implementation of tertiary treatment and disposal infrastructure.
} The Borroloola Sewerage Scheme was initiated for the design and construction of a fully reticulated sewerage system as the existing on-lot systems are not functioning adequately and present significant health risks.
} The Katherine Wastewater Treatment Plant upgrade project aims to meet current and projected loads and to reduce effluent discharge into the Katherine River. This work has been triggered by wastewater discharge licence conditions requiring a reduction in effluent discharged to the environment.

55POWER AND WATER CORPORATION CAPITAL EXPENDITURE

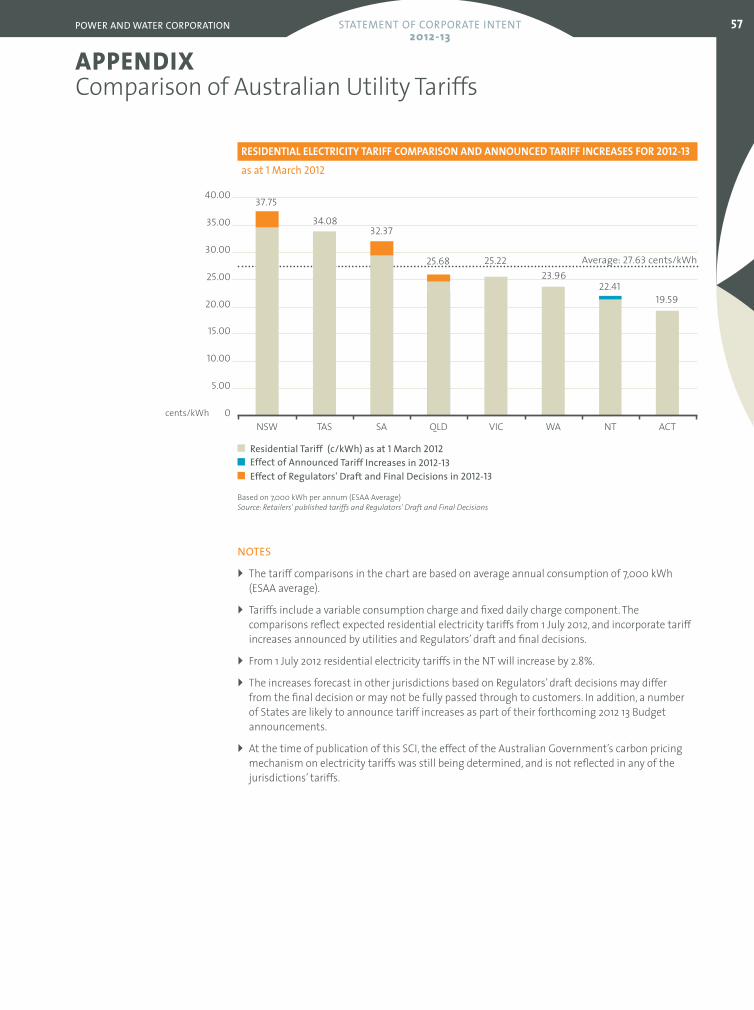
57
APPENDIXComparison of Australian Utility Tariffs
POWER AND WATER CORPORATION STATEMENT OF CORPORATE INTENT 2012-13
cents/kWh
Residential Tariff (c/kWh) as at 1 March 2012
19.5922.41
23.9625.2225.68
32.3734.08
37.75
ACTNTWAVICQLDSATASNSW
Effect of Announced Tariff Increases in 2012-13Effect of Regulators' Draft and Final Decisions in 2012-13
Based on 7,000 kWh per annum (ESAA Average) Source:Retailers'publishedtariffsandRegulators'DraftandFinalDecisions
RESIDENTIAL ELECTRICITY TARIFF COMPARISON AND ANNOUNCED TARIFF INCREASES FOR 2012-13as at 1 March 2012
NOTES
} The tariff comparisons in the chart are based on average annual consumption of 7,000 kWh (ESAA average).
} Tariffs include a variable consumption charge and fixed daily charge component. The comparisons reflect expected residential electricity tariffs from 1 July 2012, and incorporate tariff increases announced by utilities and Regulators’ draft and final decisions.
} From 1 July 2012 residential electricity tariffs in the NT will increase by 2.8%.
} The increases forecast in other jurisdictions based on Regulators’ draft decisions may differ from the final decision or may not be fully passed through to customers. In addition, a number of States are likely to announce tariff increases as part of their forthcoming 2012 13 Budget announcements.
} At the time of publication of this SCI, the effect of the Australian Government’s carbon pricing mechanism on electricity tariffs was still being determined, and is not reflected in any of the jurisdictions’ tariffs.

APPENDIX
cents/kL
Residential Tariff (c/kL) as at 1 March 2012
WANTNSWVICQLDACTSA
Effect of Announced Tariff Increases in 2012-13Effect of Regulators' Draft and Final Decisions in 2012-13
Based on 234 kL per annum (WSAA Average) Source:Retailers'publishedtariffsandRegulators'DraftandFinalDecisions
RESIDENTIAL WATER TARIFF COMPARISON AND ANNOUNCED TARIFF INCREASES FOR 2012-13as at 1 March 2012
NOTES
} The tariff comparisons in the chart are based on average annual consumption of 234 kL (WSAA average). Consumption may vary in each jurisdiction from this derived average as a result of water restriction policies.
} Tariffs include a variable consumption charge and fixed daily charge component. The comparisons reflect expected residential water tariffs from 1 July 2012, and incorporate tariff increases announced by utilities and Regulators’ draft and final decisions.
} From 1 July 2012 residential water tariffs in the NT will increase by 2.8%.
} The increases forecast in other jurisdictions based on Regulators’ draft decisions may differ from the final decision or may not be fully passed through to customers. In addition, a number of States are likely to announce tariff increases as part of their forthcoming 2012 13 Budget announcements.
350.00
300.00
250.00
200.00
150.00
100.00
50.00
0
333.20320.46 316.83
281.23 272.18
219.79 211.26
Average:279.28 cents/kL

59APPENDIXPOWER AND WATER CORPORATION
$ pa
Annual Domestic Sewerage Bill as at 1 March 2012
QLDVICNSWACTNTWASA
Effect of Announced Tariff Increases in 2012-13Effect of Regulators' Draft and Final Decisions in 2012-13
Source:Retailers'publishedtariffsandRegulators'DraftandFinalDecisions
AVERAGE ANNUAL RESIDENTIAL SEWERAGE BILL AND ANNOUNCED CHARGE INCREASES FOR 2012-13as at 1 March 2012
NOTES
} The bill comparisons in the chart incorporate increases in charges announced by utilities and Regulators’ draft and final decisions, and reflect expected annual residential sewerage bills from 1 July 2012.
} From 1 July 2012 residential sewerage tariffs in the NT will increase by 2.8%.
} The increases forecast in other jurisdictions based on Regulators’ draft decisions may differ from the final decision or may not be fully passed through to customers. In addition, a number of States are likely to announce increases in sewerage charges as part of their forthcoming 2012-13 Budget announcements.
800.00
700.00
600.00
500.00
400.00
300.00
200.00
100.00
0
$754.94
$690.87$633.64
$599.29$539.53 $535.75
$475.92
Average $604.28pa
1800245092 [email protected] powerwater.com.au PowerWaterCorp on Twitter
HEAD OFFICE
Level 2, Mitchell Centre 55 Mitchell Street, Darwin GPO Box 1921 Darwin NT 0801
CUSTOMER SERVICE CENTRES
Shop 28, Ground Floor, Mitchell Centre 55 Mitchell Street, Darwin
Shop21, Palmerston Shopping Centre 10 Temple Terrace, Palmerston
Ground Floor, Government Centre 5 First Street, Katherine
Ground Floor, Government Centre Peko Road, Tennant Creek
Shop 8, Alice Plaza 36 Todd Mall, Alice Springs
ABN 15947352360
Printed on recycled paper.
CONTACT US
CallEmail
VisitFollow