Statement of Accounts 2017/18 - Luton Borough Council · Core Financial Statements Notes to the...
146
2017/18 STATEMENT OF ACCOUNTS 2017/18
Transcript of Statement of Accounts 2017/18 - Luton Borough Council · Core Financial Statements Notes to the...

2017/18
STATEMENT OF ACCOUNTS 2017/18

P a g e | 1
01 02 03 04 05 Written
Statements and Narrative Report
Core Financial Statements
Notes to the Accounts
Supplementary Statement and Supporting Notes
Glossary
Chief Finance Officer’s Narrative Report Page 3
Comprehensive Income and Expenditure Statement Page 40
General Accounting Policies and Judgements Page 46
Housing Revenue Account (HRA) Statements Page 116
Glossary of Terms Page 141
Statement of Responsibilities for the Statement of Accounts Page 16
Movement in Reserves Statement Page 41
Comprehensive Income and Expenditure Statement Supporting Notes Page 51
Housing Revenue Account (HRA) Supporting Notes Page 118
Annual Governance Statement Page 17
Balance Sheet Page 42
Movement in Reserves Statement Supporting Notes Page 65
Collection Fund Statements Page 120
Independent Auditor’s Report Page 33
Cash Flow Statement Page 44
Balance Sheet Statement Supporting Notes Page 74
Collection Fund Supporting Notes Page 121
Cash Flow Statement Supporting Notes Page 109
Group Accounts Statements Page 123
Other Supporting Notes Page 111
Group Accounts Supporting Notes Page 123

01 Written Statements and Narrative Report
Narrative Report Page 3
Statement of Responsibilities for the Statement of Accounts Page 16
Annual Governance Statement Page 17
Independent Auditor’s Report Page 44

P a g e | 3
CHIEF FINANCE OFFICER’S NARRATIVE REPORT
A. BACKGROUND
Local Government continues to face a challenging financial picture, the result of
the EU Referendum result and continued austerity. The Government has also
announced its intention to move away from the revenue support grant system,
and to replace this with a system based on 75% retention of increases in business
rates. It is therefore critical that, the Council is successful in its strategy to
become less grant dependent, which requires increasing income from other
sources. In association with the fair funding consultation, the integration with
health and increasing service demands, the uncertainty around the future of
local government finances shows no sign of relenting.
Our medium term financial plan, updated for outturn, estimates that we will
need to achieve at least £13.9 million of additional savings over the next two
years, to offset reductions in government funding and grants, and to meet the
costs of increased demand for essential services. This is despite £113 million of
savings already being achieved over the last seven years.
The Council provides value for money to the taxpayers of Luton by setting a
Council Tax per head of population which is both below the national average,
and considerably below the level of the council tax elsewhere in Bedfordshire,
and is working hard to collect as much income as it can so that this can be
reinvested back into services for Luton residents and businesses.
The combination of increasing demand and reducing resources has put a
considerable pressure on services, some of which were already challenged from
previous years. Children’s and Adults Social Care Services are dealing with more
individuals requiring statutory support with increasing complexity. At the same
time, meeting the demand for increasing numbers of homeless and temporary
accommodation has led to a large overspend. In 2018/19 additional pressures
have been reported in relation to unachieved corporate commissioning and
procurement savings, the running costs of the corporate estate, not achieving
commercialisation income targets and the cost of the ICT service.
The Council continues to transform services to maximise value for money,
commercialise services and enhance the local business environment to attract
further business investment to the town. By managing demand and cost of the
most challenging services, resources can be used more effectively to maximise
customer satisfaction and support. Commercialisation and the Luton Investment
Framework will ensure the Council maximises income potential and maintains
value for money services for the public it serves.
The Council’s is fortunate that it owns London Luton Airport Limited (LLAL) and is
able to utilise income from the airport to invest in non-statutory services in
Luton. Substantial investment in a number of development projects for the
airport is in progress, with work commenced on the £225 million Direct Air Rail
Transport system in February 2018. This will create a fast, frequent and efficient
transport link from Luton Airport Parkway station to the airport and is expected
to facilitate further growth in the number of passengers using the airport. 0
100
200
300
400
500
600Shire Unitaries Council Tax Per Head

P a g e | 4
B. ABOUT LUTON
Luton is a vibrant, modern and diverse town in the East of England. Thirty miles
north of London, and at the centre of the Oxford-Cambridge strategic growth
corridor, the town has excellent transport links by road, rail and air. London
Luton Airport is the fifth largest airport in the UK today, with over 15 million
passengers annually. Luton is situated by the M1 motorway, just 10 miles from
the M25 and is 22 minutes from London by train.
The official estimate of Luton’s population for 2016 was 216,800. The town is
densely populated with around 49 persons per hectare. Luton is now the third
youngest city in the UK, according to the centre for cities. The 2011 census
showed that 22% of the population was under the age of 15, compared with just
18% both regionally and nationally.
The town is also ethnically diverse, with approximately 55% of the population
being of non-white British origins. Due to its industrial base and international
airport, Luton is home to significant Asian, African, Caribbean, Irish and Eastern
European communities. Less than half of the population were recorded as
Christian at the last Census, with around 24% of people identifying as Muslims
and many people of other faiths including Hindus, Sikhs, Jews and Buddhists.
Historically, Luton’s economy has resembled that of an industrial town in the
North of England. From the famous hat-making trade of the Victorian age to the
Vauxhall plant which has employed thousands of Lutonians for the best part of a
century, high-quality manufacturing has long been a feature of the town.
Aviation and engineering are now among the largest employers in Luton, with
major companies such as easyJet, Leonardo and GKN all based in the town.
While the coming years are beginning to look extremely bright for our town,
there are still immense challenges around health and deprivation. In 2015 Luton
was ranked as the 59th most deprived local authority in the country, compared
with being 87th almost a decade earlier.
A study by the Centre for Research in Social Policy showed that around a third of
children in the town were in poverty in 2016. The latest figures from Public
Health England also show that Luton is faring worse than the national average on
key indicators including life expectancy and childhood obesity.
With a young and relatively deprived population, national issues such as housing
and skills shortages remain an important challenge in Luton. Recent figures show
that just 51% of Luton’s students gained 5 A*-Cs at GCSE including English and
Maths; compared to the national average of 57.8%. Despite this Luton was
ranked 68th out of 324 local authorities nationally for social mobility in 2017 and
we are also in the top 25% for early years’ education. With the University of
Bedfordshire at the heart of the town and the growth of apprenticeships and
adult learning opportunities, pathways from the classroom into work are
becoming clearer in Luton.

P a g e | 5
C. CORPORATE OBJECTIVES
Luton Borough Council has a responsibility to report on how it is fulfilling its
statutory duties and how it is providing cost effective, good quality services to
businesses and residents in Luton. The Council needs to make sure that it does
this in a clear, open and easy to understand way so that everyone can see where
we are performing well, in addition to any areas where we need to improve.
The Council has developed a new Strategic Planning Framework which builds
upon reporting processes and draws together different plans and strategies
across the Council into one, comprehensive reporting structure.
The Corporate Plan tells residents what the Council is going to do over the next
few years along with what it will be doing differently and why. Sitting directly
below the Corporate Plan are other key plans or strategies which directly address
the Council’s priorities. Each Service Director is required to have a service plan
which shows how their services will undertake activities to meet the Council’s six
strategic priorities and clearly demonstrates the expected positive impact that
they will deliver for Luton residents. The most relevant strategies and plans are
listed below.
Corporate Plan
Strategic Plans
(6 priorities)
Service Plan (service specific
strategies & actions)
Team Plan
Individual Objectives
Building economic growth & prosperity
Luton Investment Framework
Enhancing skills & education
Skills & Employability Strategy Apprenticeship Strategy
Children & Young People's Plan
Improving health & well being
Joins Strategic Needs Assessment Health & Well-Being Strategy
Better Togther Strategy Sports, Arts & Culture strategies
Flying Start (0-5)
Developing quality homes & infrastructure
Housing Investment Strategy Local Plan & Local Transport Plan
Homelessness Strategy
Supporting safe, strong and cohesive communities
Community Safety Strategy Prevent Duty Plan
Volunteering Strategy Anti-Poverty & Social Mobility Strategy
Local Children Safeguarding Board Threshold document
Integrated, efficient & digital service delivery - striving for a 'one Luton'
approach
Transformation Strategy Organisational Development Strategy
Digital Strategy Medium Term Financial Plan

P a g e | 6
D. CORPORATE PERFORMANCE
A corporate performance report is provided to the management team, Overview
and Scrutiny Board and Executive on a quarterly basis. Current performance is
measured using selected performance indicators against the key priorities of the
Corporate Plan.
The majority of indicators reported for Q4 are either in line with targets,
improved on the previous period or expected to reach target by the end of the
financial year. There was however 12 quarterly and 3 annual performance
indicators identified in quarter 4 as underperforming or at risk of not achieving
target/benchmark average. Website link to the report: O&S Report
E. ACHIEVEMENTS IN LUTON
BUILDING ECONOMIC GROWTH AND PROSPERITY
Formal launch of the Luton Investment Framework – setting out £1.5 billion
of inward investment into the town
New Airport Enterprise Zone granted which will bring more than 7,000 jobs -
consisting of three linked sites surrounding London Luton Airport: Bartlett
Square, Century Park and Airport Business Park.
£110m transformation of London Luton Airport
DEVELOPING QUALITY HOMES AND INFRASTRUCTURE
£25 million development of Marsh Farm underway, where 82 per cent of the
supply chain is local.
The Napier Gateway plans are set to transform the former Vauxhall Motors
site which has stood redundant for 15 years into a landmark mixed used
scheme including homes, leisure and retail.
The Council’s Fixed Assets Team designed and built two new SEN schools.
Investment and planning approval for a state of-the-art Mass Passenger
Transit system (Luton Dart) providing a fast, frequent and efficient means of
transfer from Luton Airport Parkway station directly to the airport terminal.
Luton is already well served by superfast broadband, and is part of the
Central Superfast Broadband project to increase coverage to over 99%. We
have also been selected as a G Fast ultra-fast broadband pilot area.
ENHANCING SKILLS AND EDUCATION
92% of secondary pupils attending good or excellent schools. Improving
results in GCSEs were obtained in 16/17 and 75% of students studying at Sixth
Form or equivalent now go on to university. Hundreds of apprenticeships
have been created by organisations across the town to support young people.
The Unemployment rate in Luton has fallen from 7.6% in December 2014 to
6.6% in December 2016.
P a g e | 7
Full time employment has now increased by 1,300 and full time earnings
increased by 3.4%.
Released £1.3 million investment in the skills to enable projects to progress
with a focus on the transition of young people from education to
employment, and respond to needs of employers, including addressing adult
skills and promoting job and career opportunities.
Achieved an Ofsted rating of “Outstanding” for our Adult Learning
Apprenticeship Programme.
IMPROVING HEALTH AND WELLBEING
Our partnership with Active Luton continues to improve the health of our
communities. The ME TIME Programme which combats inactivity among
women from ethnic minorities now has 5,000 members.
A reduction in childhood obesity (reception year) from 10.4% in 13/14 to
9.7% in 15/16.
The signing of the Concordat between the Council and Luton Clinical
Commissioning Group. This will result in their coming together to form one
commissioning body for health and social care to enable people in Luton to
pursue healthy lives and put communities at the heart of everything they do.
Attainment of seven prestigious Green Flag awards for Luton’s Parks.
Male and female life expectancy had increased from 76.9 and 80.8 years in
2009/10 to 78.4 and 82 years in 2016/17, while infant mortality has reduced
from 7.4 to 5.1 per 1,000 live births.
Secured around £2 million from the Heritage Lottery Fund to refurbish
Wardown House.
Launch of the Cultural Quarter.
A downward trend in teenage pregnancies can be observed from 2013/14-
2014/15.
SUPPORTING SAFE, STRONG AND COHESIVE COMMUNITIES
Launched new team Neighbourhood Enforcement Officers with community
safety accredited powers. In their first 75 days the team issued fixed penalty
notices for unsocial behaviour, 90 ‘on the spot’ actions for town centre
drinking, used their CSAC powers on 53 occasions to deal with begging, 73
enforcement actions for fly-tipping, flyposting and lettering.
Downward trend in the number of looked after children which have
traditionally been around the 400 mark; with a reduction at 31st
March 2016
to 378 and further reduction at 31st
March 2017 to 364.
Participation of 22,000 Luton pupils in the Recycling Reward Scheme for
schools.
INTEGRATED, EFFICIENT AND DIGITAL SERVICE DELIVERY –
STRIVING FOR A ‘ONE LUTON’ APPROACH
Achievement of our highest ever rates of Council Tax and Business Rates
collection.
Luton Access, our information, advice and guidance partnership, supported
18,918 customers in 2016 (25%) with debt, housing and welfare benefits
problems. Intervention resulted in customers being £5.51m better off, 123
homelessness cases were prevented, £7.1 m debt was successfully managed
(£200K written off), 345 bailiff or creditor actions stopped/utility
disconnections prevented. There was a big increase customers having needs
met at assessment stage (77%), reducing those needing referral to (more
expensive) casework support (23%).
P a g e | 8
F. FINANCIAL PERFORMANCE
MEDIUM TERM FINANCIAL PLANNING
The medium term financial strategy (MTFS) sets out how resources will be prioritised in order to achieve the Council’s objectives, including enabling the successful
implementation of the Luton Investment Framework.
For many years the Council has provided value to the taxpayers of Luton by setting a Council Tax per head of population below the national average, and considerably
below the level of the council tax elsewhere in Bedfordshire. The capacity to raise funds through council tax is made more challenging by the high percentage of Band A, B
and C properties and the average number of heads per household in Luton. In comparison to other Shire Unitaries Luton has one of the lowest Council Tax per head.
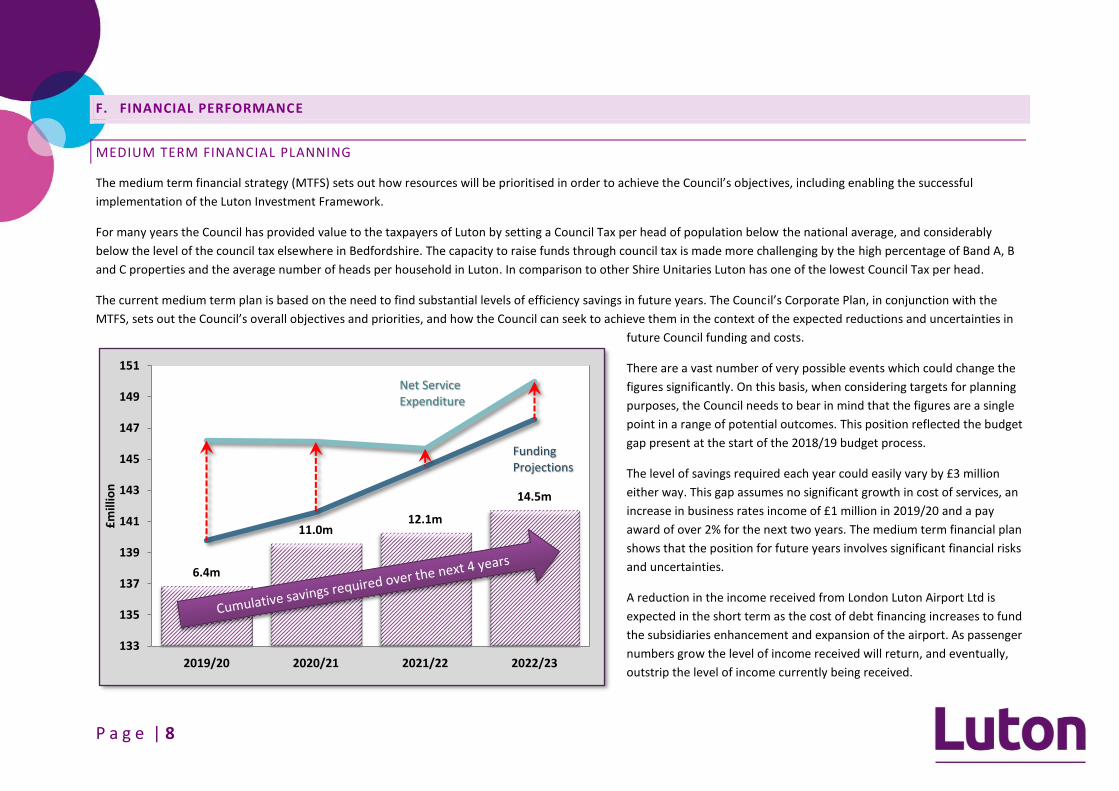
The current medium term plan is based on the need to find substantial levels of efficiency savings in future years. The Council’s Corporate Plan, in conjunction with the
MTFS, sets out the Council’s overall objectives and priorities, and how the Council can seek to achieve them in the context of the expected reductions and uncertainties in
future Council funding and costs.
There are a vast number of very possible events which could change the
figures significantly. On this basis, when considering targets for planning
purposes, the Council needs to bear in mind that the figures are a single
point in a range of potential outcomes. This position reflected the budget
gap present at the start of the 2018/19 budget process.
The level of savings required each year could easily vary by £3 million
either way. This gap assumes no significant growth in cost of services, an
increase in business rates income of £1 million in 2019/20 and a pay
award of over 2% for the next two years. The medium term financial plan
shows that the position for future years involves significant financial risks
and uncertainties.
A reduction in the income received from London Luton Airport Ltd is
expected in the short term as the cost of debt financing increases to fund
the subsidiaries enhancement and expansion of the airport. As passenger
numbers grow the level of income received will return, and eventually,
outstrip the level of income currently being received.
6.4m
11.0m 12.1m
14.5m
133
135
137
139
141
143
145
147
149
151
2019/20 2020/21 2021/22 2022/23
£m
illio
n
Net Service Expenditure
Funding Projections

P a g e | 9
RSG 14%
LLAL Dividend 13%
Business Rates 28%
Council Tax 43%
ASC Precept 2%
0 20 40 60 80 100 120
Chief Executive
Customer & Commercial
People (non-schools)
Place & Infrastructure
Commissioning & Procurement
Public Health
£million Final Spend Operating Budget
REVENUE FINANCING
The Council net revenue expenditure was financed by:
£64.8 million Council Tax
£41.8 million Business Rates (including top-up)
£21.1 million Revenue Support Grant (RSG)
£19.5 million London Luton Airport Ltd (LLAL) Dividend
£3.2 million Adults Social Care Precept
The dividend received from LLAL of £19.5 million (13%) was a significant funding source during 2017/18.
This is 2% higher than in 2016/17 and is now comparable to the percentage of RSG. In 2017/18 Revenue
Support Grant equates to 14% of the total funding below. This is a drop of 5% compared to 2017/18.
2017/18 DEPARTMENTAL NET SPEND
The Council’s final spend by department illustrates the significant
service pressures the Council is experiencing. The total revenue
outturn has been proactively managed within the set operating
budget for the year; however this was assisted by one-off income
and fully releasing the annual revenue contingency.
The continued service demands from Homelessness and Adults
and Children’s social care continue to dominate the prominence
of service commitments. These service pressures are expected to
increase over the medium to long term creating further pressure
on the delivery of other services to the public.
Service demand pressures will continue to put great importance
on the Council’s ability to deliver service efficiencies, corporate
procurement and commissioning savings and transform the way
services are delivered.

P a g e | 10
Council assets and capital financing summary
The Council as at 31st
March 2018 holds long-term assets, in the form of operational property,
investment property, share capital and debentures, to the combined total of £1.341 billion.
£1.012 billion of the long-term assets held are revalued at a minimum every 5 years.
The Council’s underlying need to borrow (Capital Financing Requirement) is £422 million, of
which £300 million is financed by external borrowing. This means the Council has financed the
residual capital expenditure by internal cash balances.
During 2017/18 the Councils Capital Financing Requirement increased by £15 million financed
in part by an increase in debt of £3 million. This increased the level of internal borrowing by
an additional £12 million.
Even with this internal borrowing commitment, the level of investments and cash has
increased by £5 million during 2017/18. These additional cash resources were generated by
increases of £5 million in cash backed reserves and £12 million in working capital.
FINANCIAL POSITION
Useable Reserves increased by £4.9 million to £117 million during 2017/18. The increase includes additional General Fund Balances of £3.4 million and Capital Receipts of
£2.0 million. Of the £117 million, £66 million is ring-fenced for specific projects and service pressures, £24 million is ring-fenced for capital purposes and £11 million is ring-
fenced to the Housing Revenue Account. The only non-specific reserve has a balance of £14 million held to cover wider risks and unforeseen service pressures. This is
reviewed on an annual basis to ensure it is sufficient to manage the level of risk and uncertainty the Council faces.
During 2017/18 unusable reserves have increased from £488 million to £517 million. Unusable reserves are not available now for the Council to utilise, but they do
represent underlying threats and opportunities to the Council. The most notable movement during 2017/18 has been an increase of £33 million in the revaluation reserve.
Upward revaluations for Schools (£20 million) and Council Dwellings (£7 million) occurred during the year. These movements were influenced by increased land values and
inflationary uplifts in build cost assumptions. These gains cannot be utilised until the assets are sold, but as the majority of the assets are vital to the running of statutory
services they are unlikely to be sold.
External Borrowing
£300 million
Capital Financing
Requirement £422 million
Long-term assets
£1.341 billion

P a g e | 11
REVENUE OUTTURN
The provisional outturn is reported to Executive in June 2018. The report includes the
summary table shown. Variations are before the allocation of the contingency budget.
Net spend on General Fund services during 2017/18 is £130.2 million prior to
movements in reserves, with a further £1.6 million of spend to be incurred in 2018/19
from the budgets carried forward from the current year.
Overall General Fund reserves have increased by £3.4 million in 2017/18 (Note 21).
This includes a net increase of £0.7 million in General Fund Earmarked Reserves.
Included within these movements is a transfer of £2.8 million into the Luton
Investment Framework (LIF) reserve from the reorganisation reserve. The reserve
movement also includes a top-up of £0.061 million to the Public Health Reserve.
School Reserves have increased by £2.637 million to £19.484 million as at 31st
March
2018. The entire 2017/18 HRA operational surplus of £2.069 million has been
allocated to a specific capital reserve to fund future capital commitments. The HRA
general reserve totals £8.311 million at 31st
March 2018.
The Council has continued to manage a number of significant demand-led service
pressures over 2017/18, including the high levels of support needed for vulnerable
children and families in the town and providing accommodation for members of the
community that are homeless, together with other emerging pressures in services that have placed additional strain on the overall Budget. Cost pressures were reported to
the Executive at Quarter 1 and early actions were taken to work toward improving the final outturn position for the year including: containing current costs as far as
possible, finding compensating cost savings or additional income across the Council and working toward reducing future costs to more sustainable levels.
Although the Council has achieved a balanced outturn position for 2017/18, this is partly due to a number of one-off cost reductions and income gains; and the main cost
pressures reported in 2017/18 will continue to place pressure on the 2018/19 budget, alongside the need to deliver £5.8 million of further savings already set in the
budget. Plans for managing the ongoing cost pressures, corporate efficiency savings and income targets in 2018/19 and 2019/20 are being further developed and progress
will be regularly reported in the monitoring during 2018/19.
The Council’s accounting policy on providing for the minimum revenue provision is being discussed with the external auditor and any resulting change for 2017/18 will be
included in the audited accounts.
General Fund Position 2017/18 Compared to Operating Budget
Operating Budget
Final Spend
Total Variation
£million £million £ million
Chief Executive 1.439 2.883 1.444
Customer & Commercial 9.827 10.428 0.601
People (non-schools) 106.975 106.910 (0.065)
Place & Infrastructure 32.815 34.672 1.857
Commissioning & Procurement 12.902 12.420 (0.482)
Public Health 15.788 15.727 (0.061)
Public Health Grant (15.788) (15.788) 0.000
Corporate Accounts (excl. reserves) (32.695) (37.064) (4.369)
In Year Spend Prior to Reserves 131.263 130.188 (1.075)
Carry Forwards to 17/18 (incl. PH) 0.000 1.560 1.560
Movements in Specific Reserves (0.364) (0.851) (0.487)
Net Underspend Available to Reserves 0.000 0.002 0.002
Net General Fund Expenditure 130.899 130.899 0.000

P a g e | 12
CAPITAL OUTTURN
The original 2017/18 capital programme for the General Fund totalled £179.1
million with a further £22.6 million for the HRA. Capital projects have been
monitored monthly during 2017/18, with progress reported to the Executive on a
quarterly cumulative basis.
The final capital spend reported to Executive for the year is £49.704 million for the
General Fund and £17.667 million for the HRA. A breakdown of the expenditure
compared to the original programme for the year is shown in the table.
In comparison to the original budget the final capital spend is substantially lower.
The capital expenditure not incurred during 2017/18 is still expected in later
financial years and therefore does not generate a permanent saving to the Council.
The provisional outturn identifies a total overspend of £0.6 million on the
Wardown Museum Redevelopment project. All other schemes have been financed
in full.
The final financing of capital spend compared to the original programme is shown
in the table below:
The total underspends of £129.4 million reflects the rephrasing of a number of
schemes; which includes:
£83.2 million in LLAL financing
£14.9 million in Foxhall Homes financing
£14.4 million in temporary accommodation
£10.2 million in ring-fenced funded schools additional school places, new
equipment and maintenance.
The additional capital receipts received were generated from a new allocation to
the temporary accommodation purchase scheme (TAPS) from the right to buy
receipts.
Capital Programme 2017/18
Spend Analysis
Original Programme
Final Capital Spend
Total Variation
£million £million £ million
Place & Infrastructure 21.503 20.569 (0.934)
People Department 21.076 10.052 (11.023)
Chief Executive's Department 4.975 1.484 (3.490)
Customer & Commercial 23.338 7.472 (15.866)
Corporate Projects 108.200 10.126 (98.074)
Total General Fund Programme 179.092 49.704 (129.388)
Housing Revenue Account 22.559 17.667 (4.893)
Total LBC Capital Programme 201.651 67.370 (134.281)
Capital Programme 2017/18
General Fund Funding Analysis
Original Funding
Final Capital
Funding
Total Variation
£million £million £ million
Grants & Contributions 27.293 15.174 (12.119)
Revenue Contributions 0.253 1.049 0.796
LLAL Dividend - Capital Element 2.865 4.364 1.499
Capital Receipts 7.610 9.499 1.889
Prudential Borrowing 141.071 19.619 (121.452)
Total General Fund Financing 179.092 49.705 (129.387)

P a g e | 13
FINANCIAL STATEMENTS EXPLAINED
Comprehensive Income and Expenditure Statement
This statement shows the accounting cost in the year of providing service in
accordance with generally accepted accounting practices, rather than the
amount to be funded from taxation. Councils raise taxation to cover expenditure
in accordance with regulations; this may be different from the accounting cost.
The taxation position is shown in the Movement in Reserves Statement.
Movement in Reserves Statement
This statement shows the movement in the year on the different reserves held
by the Council, analysed into ‘usable reserves’ (i.e. those that can be applied to
fund expenditure or reduce local taxation) and other reserves. The (Surplus) /
Deficit on the Provision of Services Line shows the true economic cost of
providing the Council’s services, more details of which are shown in the
Comprehensive Income and Expenditure Statement. These are different from the
statutory amounts required to be charged to the General Fund Balance and the
Housing Revenue Account for setting council tax and dwellings rent.
Balance Sheet
The Balance Sheet shows the value as at the Balance Sheet date of the assets and
liabilities recognised by the Council. The net assets of the Council are matched by
the reserves held by the Council. Reserves are reported in two categories –
usable and unusable. Usable reserves, i.e. those reserves that the Council may
use to provide services, subject to statutory limitations and the need to maintain
prudent levels of reserves for financial stability. Unusable reserves cannot be
used to fund Council services.
Cash Flow Statement
The Cash Flow Statement shows the changes in cash and cash equivalents of the
Council during the reporting period. The statement shows how the Council
generates and uses cash and cash equivalents by classifying cash flows as
operating, investing and financing activities. The amount of net cash flows arising
from operating activities is a key indicator of the extent to which the operations
of the Council are funded by way of taxation and grant income or from the
recipient of services provided by the Council. Investing activities represent the
cash outflows which have been made for intended future service delivery. Cash
flows arising from financing activities are useful in predicting claims on future
cash flows by providers of capital (i.e. borrowing).
Notes to the Accounts
Explanatory notes to explain in more detail the assets and liabilities as at the
balance sheet and income and expenditure for the financial year. This section
also includes other unique disclosures to local government, such as Member
allowances and officer remuneration.
Housing Revenue Account
The Council is required by the Local Government and Housing Act 1989 (section
74) to keep a Housing Revenue Account (HRA) which records all revenue
expenditure and income relating to the provision of council dwellings and related
services. The use of this account is prescribed by statute and the Council is not
allowed to fund any expenditure for non-housing services from this account.
Collection Fund Statement
The Collection Fund is an agent’s statement that reflects the statutory obligation
for billing authorities to maintain a separate Collection Fund. The statement
shows the transactions of the billing authority in relation to the collection of
council tax and non-domestic rates from taxpayers and distribution of this
income to the Council, Police, Fire and the Government.
Group Accounts
The Council is involved with a number of companies whose assets and liabilities
are not included in the Council’s single entity statements. Most of these
companies are small simple investments and are not included within the Group.
Currently only the wholly owned subsidiaries of London Luton Airport Ltd and
Foxhall Homes are included in the Group Boundary.
P a g e | 14
G. PEOPLE PLAN
Our ‘People Plan 2016-19’ explains how we will recruit, communicate with,
develop and enable our workforce to deliver the Council’s mission statement and
vision. We recognise that staff have been expected to deliver high quality
services throughout a sustained period of major change and budget reductions.
As a Council, we will respond to further challenges and changes during the next
three years, with great optimism for the future. The Organisation key priorities
for the engagement, development and support of its people as follows:
Ensure the Council has a productive, suitably qualified, skilled and motivated
workforce, able to deliver services in a more commercial context, and in
accordance with the Council’s mission, vision and values
Ensure managers are able to lead, manage and improve performance of
individuals, teams and services
Promote the Council as an employer of choice, using pro-active attraction,
recruitment & retention methods to engage with the community & workforce
Ensure that our strategic priorities, decisions and actions are informed by
accurate, good quality data
Offer accessible, timely and inclusive learning opportunities to develop
people’s skills and knowledge, and measure the impact of learning on
behaviours, performance and productivity
Ensure that employees are confident and resilient to deliver good practice,
safe in the knowledge that they have management support, with appropriate
systems and the necessary tools to do their job well
Ensure that all employees understand and are able to meet their
safeguarding and other legal responsibilities
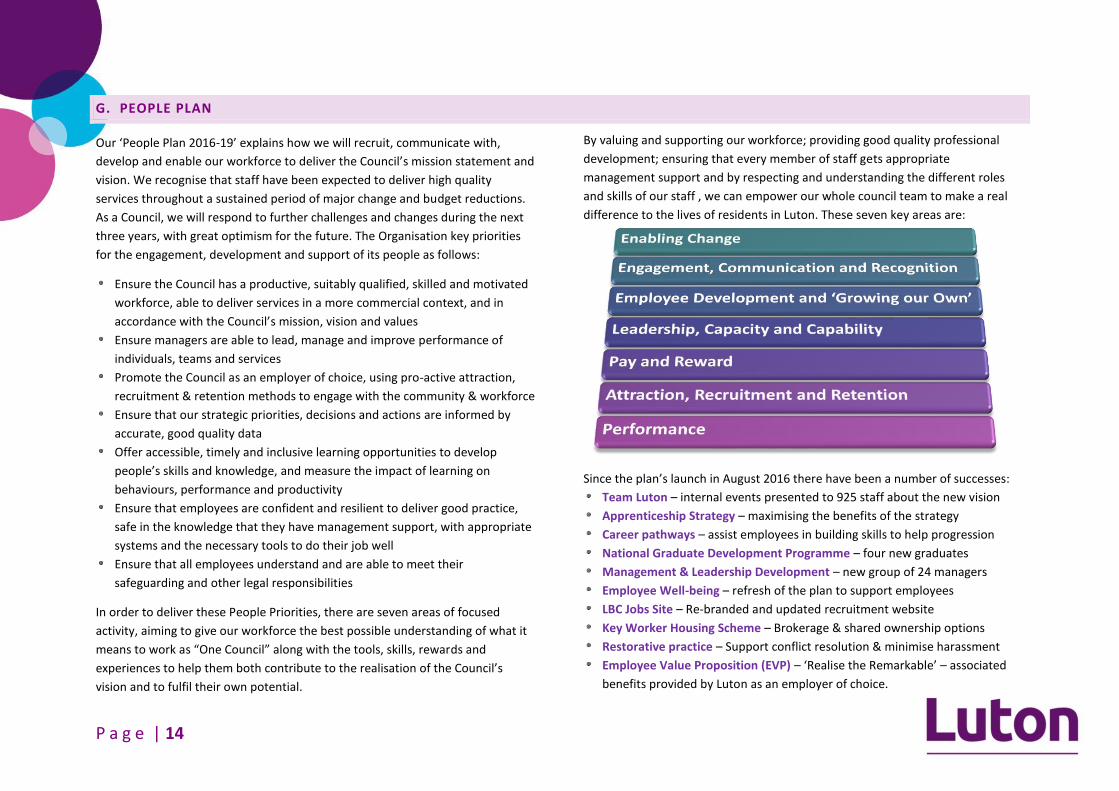
In order to deliver these People Priorities, there are seven areas of focused
activity, aiming to give our workforce the best possible understanding of what it
means to work as “One Council” along with the tools, skills, rewards and
experiences to help them both contribute to the realisation of the Council’s
vision and to fulfil their own potential.
By valuing and supporting our workforce; providing good quality professional
development; ensuring that every member of staff gets appropriate
management support and by respecting and understanding the different roles
and skills of our staff , we can empower our whole council team to make a real
difference to the lives of residents in Luton. These seven key areas are:
Since the plan’s launch in August 2016 there have been a number of successes:
Team Luton – internal events presented to 925 staff about the new vision
Apprenticeship Strategy – maximising the benefits of the strategy
Career pathways – assist employees in building skills to help progression
National Graduate Development Programme – four new graduates
Management & Leadership Development – new group of 24 managers
Employee Well-being – refresh of the plan to support employees
LBC Jobs Site – Re-branded and updated recruitment website
Key Worker Housing Scheme – Brokerage & shared ownership options
Restorative practice – Support conflict resolution & minimise harassment
Employee Value Proposition (EVP) – ‘Realise the Remarkable’ – associated
benefits provided by Luton as an employer of choice.

P a g e | 15
H. STRATEGIC RISK MANAGEMENT
The Council’s updated corporate Risk Management Strategy was approved by Executive in April 2018. It sets out the Council’s strategy for the effective management of
risks and opportunities. The Audit & Governance Committee are provided with an update of the Council’s corporate risks, to assist the committee to fulfil their obligations
to periodically review the Authority’s corporate risk register and to consider the effectiveness of the Council’s risk management arrangements.
Key Risk Impact Control Measure Update
Expenditure Control
Failure to keep to approved budget, particularly for demand-led services, new requirements, savings targets, loss of income
Monthly budget monitoring procedures; including volatile budget reporting & deficit recovery plans Forecasts and management information to predict patterns (e.g. children's, homelessness) Financial training for managers to support robust monitoring & deliver services within operational budget Sufficient budgeted contingency & current pressures in the MTFS to assess financial sustainability
Staff Recruitment & Retention
Failure to recruit/retain staff. Luton not preferred living area. Potentially losing top performing staff and staff not having the right skill set
People Plan signed off by Corporate Management Team in September 2016 Internal ‘Team Luton’ communications and events to inform officers of the Council’s vision going forward New development strategies: Apprenticeship Strategy & Career Pathways Other schemes: National Graduate Development Programme, Management & Leadership Development,
Employee Value Proposition (EVP), Employee Well-being plan
Homelessness Risk of overspends in Homelessness due demand & costs pressures
Progress is being made through the work of the Homelessness Tiger Team Full budget review undertaken
Universal Credit
Universal Credit risks to customers (increased debt, housing instability, communication & process) & to the Council (arrears, collection of HB overpayments & increased vulnerability)
Reduce negative impact and communicate process and systems for support Communications & engagement Minimise the financial cost to the Council Business intelligence
Significant Projects
Failure to control project expenditure & potential significant abortive costs to be charged to revenue if projects are not successful
Governance arrangements are in place in LLAL and LBC to monitor and report on significant projects Significant risks will be reported the Executive as appropriate
All of the major risks are managed by their risk owner. The owner is responsible for implementing control measures to ensure the likelihood and impact of the risk is
minimised. The risks recorded within the corporate risk register are reviewed, updated and reported back to the Internal Governance Group, Corporate Leadership
Management Team on a regular basis. This is an important process to support better decision making through the understanding of risk, whether a positive opportunity or
threat and the likely impact.

P a g e | 16
STATEMENT OF RESPONSIBILITY FOR THE STATEMENT OF ACCOUNTS
A. THE COUNCIL'S RESPONSIBILITIES
The Council is required to:
make arrangements for the proper administration of its financial affairs and
to secure that one of its officers has the responsibility for the administration
for those affairs, in line with statute this is the Section 151 Officer;
manage its affairs to secure economic, efficient and effective use of resources
and safeguard its assets; and
approve the Statement of Accounts
B. THE RESPONSIBILITIES OF THE SERVICE DIRECTOR (FINANCE
& AUDIT)
The Service Director (Finance & Audit) is responsible for the preparation of the
Council's Statement of Accounts which are, in accordance with proper practice as
set out in the CIPFA/LASAAC Code of Practice on Local Authority Accounting in
the United Kingdom ('the Code'), present fairly the financial position of the
Council at the accounting date and the income and expenditure for the year.
In preparing these Statements of Accounts, the Section 151 Officer has:
selected suitable accounting policies and then applied them consistently;
made judgements and estimates that were reasonable and prudent; and
complied with the local authority Code.
The Section 151 Officer has also:
kept proper accounting records which were up to date.
taken reasonable steps for the prevention and detection of fraud and other
irregularities.
Signed
Dev Gopal
Dev Gopal FCA, FCPFA, FCCA, CMgr MCMI
Service Director (Finance & Audit)
C. APPROVAL OF STATEMENT OF ACCOUNTS
The Council’s constitution states that the Audit and Governance Committee has
the responsibility to approve the Council’s Statement of Accounts. The Accounts
and Audit Regulations 2015 introduced a requirement for the chair or deputy
chair of the meeting at which approval is given to sign the accounts. This formally
represents the completion of the Council’s approval process of the accounts.
Signed
Roy Davis
Councillor Roy Davis
Chair of Audit & Governance Committee

P a g e | 17
ANNUAL GOVERNANCE STATEMENT
A. SCOPE OF RESPONSIBILITIES
A1. Luton Borough Council is responsible for ensuring its business is conducted
in accordance with the law and proper standards, and that public money is
safeguarded and properly accounted for, and used economically, efficiently
and effectively. The Council also has a duty under the Local Government
Act 1999 to make arrangements to secure continuous improvement in the
way in which its functions are exercised, having regard to a combination of
economy, efficiency and effectiveness.
A2. In discharging this overall responsibility, the Council is also responsible for
putting in place proper arrangements for the governance of its affairs and
facilitating the exercise of its functions, which includes ensuring a sound
system of internal control is maintained through the year and that
arrangements are in place for the management of risk. In exercising this
responsibility the Council places reliance on the Chief Executive to support
the governance and risk management processes. The Council has approved
and adopted a code of corporate governance, which was updated in 2013.
It can be found at:
http://democracy.luton.gov.uk/cmis5public/Meetings/tabid/70/ctl/ViewMe
etingPublic/mid/397/Meeting/4534/Committee/1005/Default.aspx, as item
12 appendix A, or be obtained from the Council’s offices at the following
address: Town Hall, Luton, LU1 2BQ.
A3. This statement explains how the Council has complied with the code and
also meets the requirements of the Accounts and Audit Regulations 2015 in
relation to the publication of a statement on internal control.
B. THE PURPOSE OF THE GOVERNANCE FRAMEWORK
B1. The governance framework comprises the systems and processes, and
culture and values by which the Council is directed and controlled and its
activities through which it accounts to and engages with the community. It
enables the Council to monitor the achievement of its strategic objectives
and to consider whether those objectives have led to the delivery of
appropriate, cost-effective services, including achieving value for money.
B2. The system of internal control is a significant part of that framework and is
designed to manage risk to a reasonable and foreseeable level. It cannot
eliminate all risk of failure to achieve policies, aims and objectives; it can
therefore only provide reasonable and not absolute assurance of
effectiveness. The system of internal control is based on an ongoing
process designed to identify and prioritise the risks to the achievement of
the Council’s policies, aims and objectives, to evaluate the likelihood of
those risks being realised and the impact should they be realised, to
manage them effectively, efficiently and economically.
B3. The governance framework has been in place at the Council for the year
ended 31st
March 2018 and up to the date of approval of the Statement of
Accounts.
C. THE GOVERNANCE FRAMEWORK – OUTLINE
C1. This section describes the key elements of the systems and processes that
comprise the governance arrangements that have been put in place for the
Council and how they are linked to each other.

P a g e | 18
STRATEGIC PLANNING
C2. This section describes the Council’s Strategic Planning Framework.
C3. The Prospectus was produced in 2013 and ‘lays the groundwork for Luton’s
path to prosperity’. It provided a financial assessment for the Council and
set a number of propositions in relation to ‘business and growth’,
‘education and lifelong learning’ and ‘health and social care’.
C4. The Prospectus helped to shape the Luton Investment Framework (LIF)
which sets out a 20 year strategy for major transformation of the town
through inward investment. The Framework was approved by Executive in
June 2015 and a major launch was held for business leaders and the media
at an event in April 2016. This Framework effectively replaces the
Prospectus. A launch of phase 2 of the LIF took place on 29 June 2017
which focused on skills and health and wellbeing.
C5. A new Corporate Plan 2017-2020 was approved last year, which refreshed
the Council’s mission, vision and priorities in light of the Investment
Framework, and also takes into account new Executive portfolios, senior
management structure, organisation development strategy and Council
brand. The plan includes latest demographic and business information on
Luton, the Council’s achievements since the last Corporate Plan was
published, what residents have told us, key “place shaping” actions, new
performance measures, risks and the Medium Term Financial Plan. It
supports the 4 year finance settlement approved by the Department for
Communities and Local Government.
C6. The new Investment Framework sets out plans to achieve £1.5billion of
private investment, upskill our local workforce, create 18,500 new jobs,
build 5,700 new homes and two new schools. It sets out plans to improve
the health and wellbeing of Luton residents including increased life
expectancy and life choices and provides support to 5,000 families in
parenting Luton’s young children. The framework includes investment in
green travel and carbon reduction. It also sets out investment in the
voluntary sector. At the heart of the framework is business growth –
attracting new large businesses and improving connectivity by road, rail
and air. Central to this is an Enterprise Zone announced by government in
2015 and will stimulate growth around London Luton Airport, the fastest
growing airport in the UK. Major infrastructure works are planned,
including a new road to open up New Century Park, part of the enterprise
zone, and work has begun to build a new passenger transport system
(Luton Direct Air Rail Transit (DART) linking Luton Parkway railway station
with the airport terminal. Further details on the Investment Framework
can be found at http://www.luton.gov.uk/lutoninvestmentframwork
C7. The Executive Leader and Deputy Leader presented a report on initial
progress on the Investment Framework to Full Council in February 2017,
when a decision was taken to invest £2.9m in LIF projects, including £1.9m
in skills over 3 years.
C8. The new Corporate Plan will be underpinned by a refreshed set of
Corporate Performance Indicators which will be monitored by Overview
and Scrutiny board and the Executive on a quarterly basis.
C9. On a more detailed level, 3 year service plans (latest update 2017-2020,
produced by each Service Director for their own services), enable the
Council to review and manage performance across all areas of Council
business. It helps to provide the “golden thread” between corporate
strategies such as the People Plan and service delivery projects and actions.
Service plans are monitored by the Chief Executive through quarterly
Delivery and Accountability meetings. These plans are especially important
in the current financial context in which Luton Borough Council needs to
save a further £13.9 million over the next two years.
P a g e | 19
C10. Now that the new corporate plan is in place, the strategic planning
framework enables a clear and demonstrable line of sight between the
Luton Investment Framework, Corporate Plan, service plans, team plans
and people’s PPAs. This is the ‘golden thread’. Measurement and
monitoring take place through a range of delivery mechanisms including
performance indicators and individual performance objectives.
ENSURING DELIVERY OF SERVICES AND THE BEST USE OF
AVAILABLE RESOURCES
C11. This section explains how the quality of services is measured and how the
Council ensures that they are delivered effectively in accordance with its
objectives.
C12. Service delivery, and the measurement of quality of services, is linked to
the Council’s Prospectus themes and corporate objectives through its
service planning processes (as detailed above). Specific performance
targets are set in line with these objectives. Service, team and project and
delivery plans are also prepared to align with this framework. Objectives
for individuals are then linked with those team plans through the Personal
Performance Appraisals to ensure consistency of service aims and delivery
in line with objectives.
C13. The measurement of quality of services is linked through the same process,
with team and service performance indicators and targets being set to
reflect their expected contributions to meeting corporate objectives and
Prospectus themes. The most important performance measures
corporately have been (and will continue to be under the new Performance
Management Framework) determined by the Council’s Corporate
Leadership Management Team, and are reported to Executive and
Overview Scrutiny Board on a quarterly basis via a ‘score card’ which
includes appropriate targets, commentary and a RAG rating to help monitor
and improve performance. In addition, there are a series of indicators
mandated by the Government for national assessment of the quality and
delivery of key local government services, particularly in relation to
children’s services and adult social care. These are measured and the
assessment externally verified as part of the audit process.
C14. The Council’s risk management process is key to ensuring the effective
delivery of service. Consideration of risk in order to develop plans including
effective risk mitigation measures is designed to enable the Council to
deliver effectively, by planning for risks before they happen. It is also
designed to enable the Council to take effective advantage of opportunities
in a planned and structured way, by ensuring that opportunities that link
directly with the Council’s overall objectives are the ones that are pursued.
C15. The delivery and accountability meetings referred to above provide an
approximately quarterly review and challenge of service and financial
performance, risk management, and challenge of specific areas such as
sickness, overtime, completion of appraisals, debt and agency costs.
C16. The budget and medium term planning process is directly linked to the
delivery of services in line with objectives. Proposals for variations to the
budget are assessed in terms of their potential impact, and prioritized
accordingly.
C17. The Council’s transformation strategy, Luton Together Phase 3, reflects a
focus on income generation and service improvement, and is based on the
design principles shown in paragraph C10 above. The strategy includes the
rolling savings programme, which is subject to regular update and
development. Monitoring shows that there was a shortfall in achieving all
of the savings planned for 2017/18, with pressures emerging on some
income streams and a large shortfall on the delivering the corporate target
for procurement savings within the year. The shortfall has been managed
within the final outturn position achieved for 2017/18 and final net costs
P a g e | 20
are within the budget set for the year, including the full use of the 2017/18
contingency budget to help meet demand-driven cost pressures in a
number of services. The 2018/19 budget has been set with £ 5.9 million of
savings and additional income, and some options have been put forward in
principle that can contribute towards achieving the 2019/20 target. The
corporate target for procurement savings has been re-phased for delivery
over 2018/19 & 2019/20 in the latest financial plan. Detailed delivery and
implementation plans are being produced and robust monitoring will take
place as part of monthly reporting and the Delivery and Accountability
meetings. All projects are carefully coordinated, with progress monitored
and scrutinised via savings ‘Trackers’. The savings proposals have been
developed with members to ensure that all options are considered and
prioritised in line with the aims of the Prospectus.
C18. The Council’s value for money is now assessed by the external auditors
each year. An unqualified Value for Money ('VFM') opinion was issued in
January 2018. The assessment highlighted the risks around Financial
Resilience and the LLAL Direct Air Rail Transport System, but had no
immediate concerns over how the Council is managing each risk and they
will continue to monitor the risks highlighted.
C19. The Council was reported to the Pensions Regulator because of delays in
submitting complete and accurate end of year data on pensionable pay and
contributions to the Bedfordshire Pension Fund for 2014/15 in accordance
with the agreed timescales. The Council worked on an improvement plan
with its IT provider, and the data was finally provided. Further, the 2015/16
data was provided to the Bedfordshire Pension Fund by the end of April
2016, as required. However, the external auditors have qualified the end of
year returns for the separate Teachers Pension Scheme. The 2016/17 audit
for the Teacher’s Pension Scheme will be audited and the outcome of that
audit will form part any updates of this report.
ROLES AND RESPONSIBILITIES
C20. The Council’s Constitution sets out the Council’s key functions and who is
responsible for them. Part 3 of the Constitution – ‘Responsibility for
Functions’ sets out the responsibilities for each Council committee. The
scheme of delegation to officers is set out in Parts 6 and 7 of the
Constitution.
C21. Part 2 of the Constitution also sets out the Council’s management
structure, and the specific functions of three statutory posts that are an
important part of the Council’s governance – the Head of Paid Service (the
Chief Executive), the Monitoring Officer (the Service Director Human
Resources and Monitoring Officer) and the Chief Finance Officer (the
Service Director, Finance & Audit).
C22. The Constitution also includes Standing Orders and Financial Regulations,
which define how the Council conducts its business in a consistent and
appropriate manner.
STANDARDS OF CONDUCT
C23. The Council’s Constitution includes codes of conduct for both members and
officers that comply with the requirements of the Localism Act 2011.
C24. Complaints against members are investigated by a subcommittee of the
Standards Committee, in conjunction with the Independent Person (IP).
C25. The Council’s Standards Committee is an advisory committee, responsible
for the promotion of high standards of conduct. Of the fifteen members on
Standards Committee, five are independent members, i.e. not elected
members, who are co-opted to serve on the Committee.
C26. Complaints against members are investigated by a subcommittee of the
Standards Committee, in conjunction with the Independent Person (IP).
P a g e | 21
There is a panel of three IPs who can be called upon when required. This
was arranged as part of a collaborative process with other public sector
bodies locally.
C27. A complaint may be referred to the Standards Committee for investigation,
hearing and sanction. During 2017/18, two complaints were made against
Members that couldn’t be resolved informally. One complaint was against
an individual member, and one against a collective group of seventeen
members. These complaints went to the Assessment Panel, which is a
subcommittee of Standards Committee, both complaints were rejected.
C28. Two Adjudication Panels, a subcommittee of Standards Committee, were
heard in 2017/18, arising from complaints made in the previous year.
These complaints were rejected.
C29. The Council’s three political Group Leaders have determined that training
on the Council’s Code of Conduct for elected members and the “standards”
regime is mandatory for all Councils and is required to be undertaken once
every four year period.
C30. At each formal meeting of the Council, the Executive and the Council’s
Committees, members are reminded to declare any pecuniary interests in
relation to the business to be discussed and decisions to be taken. As a
necessary part of being a member all members are provided with a
Members’ Handbook. This contains a section which gives advice on matters
relating to compliance with the Code of Conduct.
C31. The Council has a register of member interests, maintained by the
Monitoring Officer, in which all registrable interests must be entered for
both the elected Member and their spouse or partner. Members are
reminded on a regular basis of the need to register their interests.
Registrable interests include gifts and hospitality received by members.
C32. During 2017/18 the Council’s values were refreshed and promoted to the
workforce. Organisational development (OD) activities as part of the
Council’s OD strategy known as the “People Plan” have focussed on the
importance of those values during the year. The focus on a values-led
organization, rather than simply an organization with values, emphasizes
the importance of conduct in line with those values. .
C33. Each new member of staff receives an induction pack which has been
updated during 2017/18, which includes the Code of Conduct for Officers,
and the importance of adhering to this Code is emphasised.
C34. In addition, professional staff are subject to the codes of conduct of their
particular professions.
STANDING ORDERS, FINANCIAL INSTRUCTIONS, DELEGATIONS,
CONTRACT REGULATIONS AND THEIR UPDATE
C35. The Council’s Standing Orders, including regulations regarding contracts,
and Financial Regulations are part of the Council’s Constitution.
C36. The Council has a Constitution Committee, which meets as necessary to
consider changes to the Constitution and make recommendations to the
full Council, which can also make changes to the Constitution on the
recommendation of any of the three statutory officers.
C37. Updates to a number of parts of the Constitution were approved in
2017/18, these were: Articles of the Constitution (part 2); Responsibility for
Functions (part 3); Scheme of Members Allowances (part 13), Register of
Members (part 15); Complaints Procedure (part 18) and Management
Structure (part 19).
C38. Financial Regulations include a section on risk management, and the
importance of managing risk within every aspect of management. This is
also emphasized in the Risk Management Strategy.

P a g e | 22
WHISTLEBLOWING AND COMPLAINTS
C39. The Whistleblowing Policy applies to all individuals working in or for the
organisation, including elected members, directly employed employees,
agency workers, contractors and suppliers. During 2017/18, twelve
whistleblowing allegations were received. All were subject to review, some
of which involved referrals to other agencies.
C40. Anyone wishing to make a serious allegation typically raises it with their
immediate manager. However, this may depend on the seriousness and
sensitivity of the issues involved and who is suspected of the malpractice.
For these reasons staff can make whistleblowing allegations direct to the
Council’s Monitoring Officer on a confidential basis.
C41. The Council has set out and published procedures for dealing with
complaints, with target times for complaints to be acknowledged,
investigated and responded to, and with each department having a
nominated complaints co-ordinator to review progress.
FINANCIAL MANAGEMENT ARRANGEMENTS
C42. The Chartered Institute of Public Finance and Accountancy (CIPFA)
published a statement on the role of the Chief Financial Officer in 2010.
This statement includes a significant number of governance requirements
in relation to financial management in general and the role and
responsibilities of the Chief Financial Officer (CFO) in particular. These
include the requirement that the CFO ‘should report directly to the Chief
Executive and be a member of the Leadership Team, with a status at least
equivalent to the other members.’ This is not the case in Luton, and the
statement requires the reasons for this to be explained, together with how
the arrangements adopted deliver the same impact.
C43. In Luton, along with a number of other Councils, the role of Chief Financial
Officer is at Service Director level, rather than at Corporate Director level.
This does ensure that the CFO’s role is focussed on the core financial and
strategic responsibilities rather than being diluted by taking on a wider
remit. The CFO reports to the Corporate Director Customer and
Commercial. However, the CFO attends all meetings of the Corporate
Leadership Management Team (CLMT) as a full team member, attends all
corporate officer meetings with elected members, as well as being able to
go directly to the Chief Executive whenever necessary.
C44. Luton’s financial management arrangements are in line with the other key
governance requirements in the CIPFA statement. A member of the Luton
Borough Council staff acts as Chief Financial Officer and Company Secretary
(on behalf of Luton Borough Council) for London Luton Airport Limited
(LLAL), who is responsible for the production of LLAL accounts with
assistance from PricewaterhouseCoopers.
THE ROLE AND FUNCTIONING OF THE AUDIT AND GOVERNANCE
COMMITTEE
C45. The Audit and Governance Committee of the Council discharges the
functions of the Council as required by the Practical Guidance for Local
Authorities on Audit Committees published by the Chartered Institute of
Public Finance and Accountancy. The Committee, which meets quarterly,
helps improve the corporate focus on the core issues arising from internal
control, reporting and management, and receives regular reports on
Internal Audit reviews, as well as reports from external audit, and an annual
review of risk management.

P a g e | 23
COMPLIANCE WITH LAW AND INTERNAL POLICY AND
PROCEDURE
C46. The Chief Executive is responsible for the effective and efficient
administration of the Council. The Head of Human Resources and
Monitoring Officer as Monitoring Officer is required to ensure that agreed
procedures are followed and that the Council conducts its business lawfully
and in accordance with all applicable statutes and regulations. If the
Monitoring Officer becomes aware that the Council or any Committee or
officer on its behalf has or is about to embark upon an unlawful course,
then she has a duty to report the matter to either the Full Council or, in the
case of executive functions, to the Council’s Executive. The precise scope of
this duty is set out in Sections 5 and 5A of the Local Government and
Housing Act 1989 (as amended).
C47. The Service Director, Finance & Audit as Chief Finance Officer is similarly
required to report issues of a financial nature to the Council where they
may give rise to a breach of requirements, be they statutory or otherwise.
C48. All papers to be considered by members at formal meetings are scrutinised
by the statutory officers, or staff acting on their behalf, to ensure
compliance with regulatory requirements. This includes scrutiny by Finance
officers to ensure that all expenditure is lawful.
C49. Service Directors are also required to ensure that their services comply with
legislation and regulation. They are aided by numerous professional
networks, and they are required to review, at the end of each year, that the
service has complied with legislation, regulation, internal policy, including
the application and maintenance of internal controls and procedure, as part
of their annual assurance Statement of Governance and Controls.
C50. Each Service Director and Corporate Director is responsible for the effective
use of the human, financial, and information technology resources
allocated to their services. The assurance statements referred to above also
relate to the effective use of resources to deliver services.
DEVELOPMENT OF MEMBERS AND SENIOR OFFICERS
C51. The Council has a member development programme, and a corporate
training programme for officers designed to provide training in key
corporate requirements. Transformation workshops have been held
quarterly for senior officers to ensure the transformation strategy is being
applied throughout the organisation. The personal performance appraisal
system has been developed as an assessment of performance and
competencies, and has recently been revised slightly in light of feedback
and evaluation.
C52. The cross party Member Development Steering Group oversees the
learning and development of councillors. The group has implemented a
range of initiatives including a new induction process and Councillor
Handbook, personal development plans, workshops and e-learning courses.
C53. The Council has been awarded the East of England Charter for Elected
Member Development until 2016 and has also committed to a process of
continuous improvement over this time. The work of the Member
Development Steering Group was awarded a silver award in the 2015
Training Journal Awards for “Best Public Sector Programme”.
ENGAGEMENT WITH COMMUNITIES AND OTHER STAKEHOLDERS
C54. The council is committed to listening to its citizens and service users. By
understanding the views of local people it is able to provide effective
services in line with their needs.
C55. Consultation and community engagement is seen as an integral part of
service planning, delivery and decision-making, and this is reflected in the
P a g e | 24
council’s values. A six monthly survey of 1,000 residents has been
commissioned to monitor perceptions of the town and council service
delivery. Its results are used to track awareness and opinions on LIF
priorities and impact of transformations on people’s lives. The third survey
was completed in November 2017.
C56. A planned and coordinated approach to consultation and engagement
activities is essential and is facilitated by:
a corporate team of consultation and engagement practitioners to
advise, support and deliver effective and meaningful consultation across
the council
the use of an updated and robust consultation procedure which
incorporates internal governance including risk assessing for legal
challenge, ensuring consultation is ethical, promoting best practice and
quality assurance principles. This is to ensure the council has an
organisational framework in place outlining the corporate standard for
consultation activities across the organisation
further development of the Luton consultation partnership portal on
which over 1,500 residents are registered to take part in a range of
consultation and engagement activities
the use of mixed methodologies (both qualitative and quantitative) to
enhance response rates, ensure methods are inclusive and maximising
opportunities for a broader and representative population in the local
decision making processes. This is supported by greater use of on-line
activities, social media and electronic voting
consultation on a number of large scale/high profile projects have been
successfully delivered to inform the council’s strategic priorities and
shape services which include the draft waste strategy, Public Spaces
Protection Order, selective licensing, housing strategy, several road
improvement and parking schemes, Council Tax Reduction scheme,
fostering and school expansions.
maintaining a range of corporate and service specific consultation and
user engagement mechanisms including registered residents on Luton
consultation portal, service-user databases, planned events
a coordinated approach to undertaking consultation projects to avoid
duplication. Over the last two years around 100 consultation and
engagement projects have been delivered and/or supported and several
thousands of people have participated/given their views
C57. The council encourages local communities to be involved in action planning
and decision-making such as its member-led engagement initiative, now
entering its second year. The vast majority of councillors now administrate
their own ward Facebook pages, where residents have the opportunity to
ask questions, promote local events and discuss local issues. Councillors
also organise and run their own ‘Let’s Talk’ events, inviting members of the
community to engage with them on a range of topical issues.
C58. The council has a good track record of working with its partners in the
statutory and third sector on consultation initiatives. Key areas of joint
working include the integration of pharmaceutical needs assessment and
better health through better food choices.
C59. Luton Council and Luton Clinical Commissioning Group (LCCG) joined forces
to enable Luton people to live healthier lives. Cllr Hazel Simmons, Leader of
the Council and Nina Pearson, Chair of LCCG signed a concordat on 29 June
2017, demonstrating each organisation’s commitment to improve the
outcomes of Luton’s residents. Work has begun bringing the commissioning
functions of the two organisations together with joint commission
arrangements in place, ensuring the public and patients’ voice are at the
centre of health decision making.

P a g e | 25
C60. With regard to communications, the council uses a range of approaches to
inform and feed back to citizens including its monthly electronic newsletter
eLuton, the website – including videos, social networking opportunities and
regular news updates. We also use a mix of traditional local media, direct
mailings, member surgeries and exhibitions.
C61. A new communications strategy for 2018-2023 has been approved by
senior leaders, supporting an outcome-focussed approach. The team will
focus on campaigns which directly align communications activity with the
main strategic priorities of the Luton Investment Framework and the
corporate plan. By prioritising communications activity on this basis, and
ensuring campaigns are well-researched, targeted and measureable, with a
dedicated focus on contacting hard-to-reach groups, we will ensure
resources are appropriately targeted.
C62. In 2017/18 the council dealt with almost 500 media enquiries, produced
over 300 press releases, sent thousands of social media posts and issued
dozens of electronic and hardcopy newsletters reaching tens of thousands
of Luton residents. The high profile communications, marketing and digital
campaigns we delivered included Think Luton Think Investment as part of
the Luton Investment Framework, #KeepLutonTidy, #KeepLutonSafe, Let’s
Talk (MLE) campaigns, #WasteLessRecycleMore, CSE, Fostering & Adoption,
Prevent and Counter Extremism, Volunteering, #BeClearOnCancer,
Dementia Friendly, Love Luton, Community Cohesion, Elections, Teacher
Recruitment, Flying Start, Council Tax, self-care, MyAccount and Do It
Online.
C63. The council has been recognised nationally in awards and had significant
achievements and honours during 2017/18, which are indicative of the
strength of the governance arrangements that have facilitated those
achievements.
C64. They include:
nominated for the Council of the Year category in the annual MJ Awards
nominated for the Council of the Year and Team of the Year categories
in the annual LGC awards.
the council was awarded 6 Green Flags for its public parks
awarded Purple Flag status which recognises Luton town centre has an
‘entertaining’, ‘diverse’, ‘safe’ and ‘enjoyable’ nightlife.
secured millions of pounds worth of grants for arts and culture,
children’s social care, to tackle homelessness and for community
projects]
working as part of a consortium, secured £2million of European Social
Funding that will benefit a range of projects and initiatives in the most
deprived wards in Luton, led by local communities through the
Community Led Local Development programme
the launch of the Aspiration Centre, and the 16x16 skills project for
young people which form part of the £1.9 million LIF Skills and
Opportunities programme, a three year plan to drive aspiration and
highlight opportunities for Luton people.
launching and co-chairing the new national Special Interest Group on
Countering Extremism
C65. In recent years resources have been diverted into managing the council’s
profile on social media. This includes growing our online audience to get
important messages out about council services and responding very quickly
to community feedback which in turn has helped to reduce complaints. We
now have a combined audience of more than 20,000 followers on the
official council Facebook and Twitter accounts alone, with several other
departments sending their own tailored messages. Our team works to
respond to all urgent enquiries within 24 hours and uses these vital
communication channels on a daily basis, sending hundreds of tweets every
week.

P a g e | 26
PARTNERSHIPS
C66. The Council has a large number of collaborative/partnership arrangements
with other organisations.
C67. Partnership working is an essential part of modern local government, and
the Council’s partnership register shows just how many collaborative
partnerships, of varying sizes, the Council is involved in. The register has
been reviewed and updated by service managers during the course of the
year and clearly identifies the Council’s key strategic partnerships including
funding associated arrangements. This supports coordination across
partnerships – for example, collaborative working between the Health and
wellbeing Board and the Community Safety Executive.
C68. Officers have produced partnership guidance to ensure that key issues of
risk are taken into account prior to the setting up of partnerships, and to
ensure that they set up in line with the Council’s key objectives.
GROUP GOVERNANCE
C69. The Council owns or controls the entire issued share capital of London
Luton Airport Ltd, the company that, by virtue of the requirements of the
Airports Act 1986, owns London Luton Airport. The airport is operated by
an unrelated entity, London Luton Airport Operations Ltd., under a
Concession Agreement, which terminates on 31st March 2031.
C70. London Luton Airport Ltd. is controlled by a board a directors, in
accordance with its Memorandum and Articles of Association. Professional,
operational and company secretarial advice is provided to the company by
the Council under a management services agreement. In 2012/13 the
company reviewed its governance arrangements, and this included a
rewriting of the management services agreements.
C71. The accounts of London Luton Airport Ltd. are incorporated into the group
accounts of Luton Borough Council, and the assessment of governance and
controls made by the Service Director of Finance & Audit includes that
relating specifically to London Luton Airport Ltd.
C72. In 2017/18 London Luton Airport Limited instigated a major programme of
infrastructure works, plus an application for a Development Control Order
(DCO), an application for significant expansion, from a current maximum of
18million passengers per annum, up to a maximum of 38million passengers
per annum. The funding of this programme is intended to be by way of
debenture loans from Luton Borough Council, subject to the Council
undertaking due diligence, as shareholder and investor, of loan
applications. The principle of issuing debenture loans for the Direct Air Rail
Transport Scheme was agreed in 2017/18, up to a maximum of £225
million, with the release of loans dependent on the achievement of agreed
project milestones. An initial loan of £15 million has been made.
C73. The Council uses a registered company, Luton Traded Services Limited, as a
vehicle through which to trade with the private sector. This company is not
affiliated to Luton Borough Council and does not form part of the Group
Accounts. The Council undertook some very limited trading in 2017/18
through LTS Ltd. As part of the Council Housing Strategy, the Council has set
up a wholly owned housing company (Foxhall Homes) as a residential
development company. The company has incurred costs in 2017/18, but
not commenced any site development work to date. The capital
programme has set aside £30.3 million to provide funding to Foxhall Homes
in form of debentures. The Council will also subscribe to the share capital of
that company.
D. REVIEW OF EFFECTIVENESS
D1. Luton Borough Council has responsibility for conducting, at least annually, a
review of the effectiveness of the governance framework, including the

P a g e | 27
system of internal control. The review of effectiveness is informed by the
work of the Corporate Directors and Service Directors who have
responsibility for the development and maintenance of the governance
environment, Internal Audit’s annual report, and also by the reviews of the
external auditors and other review agencies and inspectorates.
D2. The Risk and Internal Control Group with responsibility for drafting this
Annual Governance Statement have considered the governance framework
and the system of internal controls. This group has involvement in and
oversight of the processes necessary to maintain and reviewing the
effectiveness of the governance framework. In producing this statement
full regard has been made to the Council’s Risk Registers, corporate and
departmental, plus those maintained for major projects and those of
partners, the quarterly statements of governance produced by Service
Directors addressing areas of potential risk in terms of internal controls,
and the Delivery and Accountability meetings held by the Chief Executive,
the Director of Customer & Commercial Services, and the Service Director
of Finance and Audit with all Service Directors that directly review and
challenge performance, finance, sickness and risk in each service area.
D3. The Council itself maintains overall control of its governance framework.
D4. The Executive is responsible for all Council functions except as specifically
provided otherwise by law (and this is reflected in the Constitution).
D5. The Audit and Governance Committee considered external assessments
and internal audit reports throughout the year.
D6. Overview and Scrutiny Board have reviewed and challenged Executive
decisions during the year. The Board focussed on an evidence-based
approach and the use of Task and Finish groups for particular projects. Such
as the debenture loan for London Luton Airport Ltd.
D7. There is a Finance Review Group that is responsible for the scrutiny of the
budget and other financial issues.
D8. The Standards Committee oversees the framework of the Code of Conduct
for Members on an annual basis.
D9. Internal Audit undertook audits throughout the year using risk-based audit
assessments. The service has reported to management on control issues,
and produces an annual report to Audit and Governance Committee, which
concluded that an adequate level of assurance can be provided in
connection with the Council’s framework of governance, risk management
and control, with some exceptions identified during the year (details noted
in Section F below). It states that these exceptions are given for the
purpose of highlighting the key areas of risk which existed within the
Council’s control environment during the year. These areas of risk are not
considered to have such an effect as to reduce the overall acceptable level
of assurance or materially increase the risk.
D10. The Internal Audit Service works to the standards prescribed by the Public
Sector Internal Audit Standards (PSIAS). The Authority’s first external
assessment on the effectiveness of the Council’s Internal Audit Service and
compliance with PSIAS and the Code of Ethics took place in March 2018.
The External Assessor confirmed that the service “Generally Conforms”
with the majority of the Standards, as well as the Definition, Core Principles
and the Code of Ethics, which form the mandatory elements of the Institute
of Internal Auditors’ International Professional Practices Framework (IPPF),
the globally recognised standard for quality in Internal Auditing. The
External Assessor also stated that the service is good in its reflection of the
standards and operating with efficiency. The Council’s external auditor also
carries out an annual review of the Council’s internal audit arrangements.

P a g e | 28
D11. The Chief Finance Officer and Monitoring Officer have provided assurances
that no major issues relating to their responsibilities have arisen during
2017/18.
D12. The external auditor’s annual audit letter confirmed that the Council’s
accounts give a true and fair view of the Council’s financial affairs for
2016/17. The Audit Results Report, published on the Council’s website,
issues an unqualified opinion on the Value for Money assessment.
D13. The Annual Audit Report included a number of recommendations to assist
the improvement in financial reconciliations and the production of the
financial statements. The report highlighted the importance of
development in this area, especially in light of the faster closure agenda to
be realised in 2017/18. The report recognised that the Council has put in
place a robust plan to strengthen its controls, processes, capacity and
capability to produce good quality financial statements to meet the faster
closure timescales. It did however highlight remaining weaknesses in the
bank reconciliation process and related party documentation process.
These areas are being strengthened and will form part of the 2017/18 audit
review process.
D14. The Council has robust budget monitoring procedures in place with
monthly reports provided to the corporate management team and
quarterly reports to members. The 2017/18 monitoring identified
significant budget pressures in services from early in the year and recovery
measures were put in place to address this and work toward achieving a
balanced budget by the end of the financial year. The monitoring reports
for quarters 3 & 4 predicted a steady improvement in the net forecast
outturn position; with the final forecast for the year predicting a small net
underspend of £22,000 compared to budget. This includes full deployment
of the contingency budget to meet significant budget pressures during the
year, including volatile and demand driven services for children’s care and
for temporary accommodation to reduce homelessness. The final outturn
position achieved for 2017/18 is close to the final forecast with a net
underspend of around £2,000. The ongoing impact of the cost pressures
reported in 2017/18 is being assessed to refine future monitoring,
preparation of the 2019/20 Budget and to refresh the Medium Term
Financial Strategy.
D15. The Council was reported to the Pensions Regulator because of delays in
submitting complete and accurate end of year data on pensionable pay and
contributions to the Bedfordshire Pension Fund for 2014/15 in accordance
with the agreed timescales. The Council worked on an improvement plan
with its IT provider, and the data was finally provided. Further, the 2015/16
data was provided to the Bedfordshire Pension Fund by the end of April
2016, as required. However, the external auditors have qualified the end of
year returns for the separate Teachers Pension Scheme. The 2016/17 audit
for the Teacher’s Pension Scheme has been completed. The audit showed
improvements had been implemented, however there are still
improvements expected for 2017/18.
D16. Even though major savings have been required for the last 7 years, the vast
majority of the savings proposals included in the budget were delivered in
full with the exception of procurement savings relating to General Fund.
D17. Outcomes continue to improve in some key areas. The amount of council
tax and business rates collected in year, have again improved. This will help
maintain vital services during difficult financial times, even though hard
choices will have to be made over the coming years.
D18. The new Corporate Management Structure was approved by Executive in
March 2017 and is now fully implemented.
D19. In May 2017 Full Council approved an additional service director post for
London Luton Airport Ltd to manage the ongoing operations and significant
capital projects.

P a g e | 29
E. REVIEW OF PROGRESS IN RELATION TO SIGNIFICANT
GOVERNANCE AND INTERNAL CONTROL ISSUES IN THE
2016-17 STATEMENT
E1. It was expected that achieving the level of savings required for 2016/17 and
future years would be very challenging indeed, and would impact
significantly on service provision. However, for 2016/17 the level of savings
needed was less than originally anticipated due principally to the increase
in Council Tax income. As a result the impact on service provision and
employment was relatively low.
E2. A number of initiatives have been introduced with the aim of keeping staff
sickness under control. However, it has not been possible to reduce
sickness levels, which remain above the public sector average.
E3. The self-assessment for Luton’s Children Services completed in May 2018
outlines Luton’s improvement journey and highlights the changes that have
been, and continue to be made to keep children safe, achieve well, and
realising our vision of “Putting children, young people and families at the
heart of what we do”.
E4. Luton’s Children’s Services Improvement Board agreed to complete the
Post Ofsted Action Plan in October 2017 and move into the next phase of
improvement. All improvement actions are being reviewed to ensure we
have robust evidence and can demonstrate sustained improvement in the
areas identified along with incorporating the improvements our audit and
assessment has highlighted. There will be particular focus on the impact
and effectiveness of our practice, our financial sustainability, the
permanent recruitment to our workforce and embedding the family
safeguarding model as part of the review of our model of delivery.
However, through continuous performance management and evaluation,
we recognise that there is more we need to do, with improvements to our
assessment service and looked after children service being a priority for the
coming months.
E5. We face significant challenges in delivering services for children and their
families that keep them safe. Increases in complexity of needs means that
we have had to work harder and to generate innovative ways of working to
meet these needs now and in the future. We are meeting this challenge
head on and the collective determination of our staff, partners, portfolio
holder and Executive, along with corporate ownership and determination
we are passionate and determined to develop an improved consistency of
practice across our model of delivery which has children, young people and
families at the heart of our practice.
E6. Reducing social work caseloads has been a key priority and there has been
a renewed emphasis on this particularly in the assessment team where we
have not yet fully achieved the position we are aiming for. System changes,
embedding threshold frameworks and more emphasis on early help
professionals becoming involved in children who may historically have been
CIN at the earliest point has provided a bedrock to allow us to focus on
embedding consistency of practice and impact of our effectiveness. In
2016, we knew from audits and Ofsted confirmed that management
oversight was not always consistent. Increased supervision and recent
audits show that there is evidence of some good practice emerging
however we will work with determination to ensure our plans are timely,
focused upon outcomes with the wishes and views of the child at the heart
of our practice.
E7. We know the things we need to improve:
A sustainable resource base for children’s services
The stability and permanence of our workforce and reduced case loads
The child’s journey and workflow through our social care system and
the overall effectiveness of our practice

P a g e | 30
The number of children who have independent fostering arrangements
and reduce those who are placed more than 20 miles from Luton.
The quality and effectiveness of our looked after children and 14 plus
service.
E8. As part of commitment to taking forward the improvement areas identified
above work is underway to carefully examine the needs of the Luton
population to ensure we have a strong evidence base which will determine
if we are fully utilising our resource in the most effective way and if we
need to make changes to our model of delivery in order that we can more
effectively target children who need our support in a more timely way as
part of a more integrated approach across the continuum of need.
Improvement requirements will be monitored through the strengthened
performance, improvement and accountability meetings with the DCS
along with the established governance arrangements including the
Children’s Services Improvement Board and the LSCB. We are clear about
our areas for development as represented by our refreshed improvement
plan which outlines our journey, commitment and determination to
achieve good outcomes for the children, young people ad families of Luton.
E9. For more detailed information please refer to the document CHILDREN’S
SERVICES SELF-ASSESSMENT May 2018 “Putting children, young people and
families at the heart of what we do”.
E10. The council continues to work with its IT supplier to deliver the
transformation programme, however it is running considerably late and the
customer experience is not at the level expected. Further discussion is
taking place and LBC will have to ensure that the programme is back on
track in order to deliver savings as a result of the investments.
E11. In view of these assurances, and whilst acknowledging some issues, the
overall framework of governance appears to be working reasonably
effectively. Significant governance issues are addressed in the following
section. These do need to be seen in the overall context of an effective
governance system.
F. SIGNIFICANT GOVERNANCE & INTERNAL CONTROL ISSUES
F1. The key governance, risk management and internal control issues identified
from the internal audit reviews carried out during 2017/18 were as follows:
Internal Audit issued 1 ‘No’ Assurance, 8 ‘Limited’ Assurance, and 3
‘Qualified’ audit opinions. Management have confirmed that the
majority of the recommendations raised have either been fully
implemented or are in the process of being implemented.
2 debt recovery audit reviews for Social Care Financial Contributions
Recovery and Adults’ Direct Payments were completed – Monitoring,
which identified that internal controls around debt recovery were
generally not operating effectively. Both audits resulted in a ‘Limited’
Assurance opinion. Overall the reviews highlighted that there were
considerable delays in taking appropriate recovery action due to a lack
of co-ordination between departments in pursuing the recovery of
debts; the volume of work and insufficient resources; and the
complexity of some cases. In September 2017, the Debt Tiger Team was
set up to carry out a corporate review of debt collection, reduce the
Council’s debt and establish improved and consistent procedures for
the management of debt.
Outstanding weaknesses and gaps in internal control surrounding the
management and maintenance of the IT Asset Register; monitoring of
employees’ permitted use of Mobile Phones and the maintenance of
Mobile Phone records; and the management monitoring and
completeness of the Commercial Property Management Asset Register
have not been fully addressed since the original audit reviews were
undertaken. Management have confirmed that since the Internal Audit
follow up reviews were undertaken in 2017/18 outstanding

P a g e | 31
recommendations have now either been fully implemented or are in the
process of being implemented.
During the year concerns were raised with management over user
access rights to the payroll system, lack of segregation of duties and the
risk of fraud and error. Management introduced compensating controls
to address Internal Audit’s concerns, however during the physical follow
up review there was insufficient evidence to demonstrate that these
controls are embedded and working effectively. Discussions are
ongoing with management to identify other measures that could be put
in place to mitigate this risk.
F2. The 2017/18 outturn shows that there are significant overspends in
children’s services and accommodation for homelessness (also national
issues), together with pressures on maintaining the corporate property
estate, revenues collection, information technology and a shortfall against
the budget target for procurement savings. The 2017/18 overspends in these
areas have been partly met by the central contingency budget, together with
cost savings or additional income generated across other Council services
and the final outturn positon within budget for the year. The cost of
children’s services continues to be challenged and measured against the
targets set in the Glide Path action plan, to assist in returning the service to a
more affordable and sustainable position. The mix of temporary
accommodation used to relieve homelessness is also continuing to change,
including less use of short term nightly lets and the Council acquiring
properties and developing long term solutions to provide a more cost
effective housing supply chain. Prevention work is also continuing, with
targeted interventions and support to help reduce the number of persons
becoming homeless and the number of children becoming looked after by
the Council. The underlying causes of the property, revenues collection and
information technology costs are being examined to develop measures that
will return the services to a position within the budget.
F3. A detailed programme of savings for 2018/19 and future years been
developed with a greater emphasis placed on procurement and
commissioning savings, as well as efficiency savings achieved through
transformation enabled by technology, which will also improve the customer
experience. Savings initiatives include a tighter control on level of debts and
also on agency spend. The Council will also improve on the amount of
income raised through commercialisation and also to make up for the
shortfall reported to date. Any delay in the preparation and implementation
of the savings plan would lead to savings included in the 2018/19 budget not
being achieved. The preparation for the 2019/20 budget in well under way.
F4. The Teachers’ Pension Scheme return has been given a qualified audit
report by the external auditors. Progress has been made but there are still
a few IT issues to be resolved. Officers are working with a view to resolve
any remaining issues with a view to avoid any further qualification for
2017/18.
F5. In common with most local authorities in the region, the Council is
experiencing difficulties in recruiting permanent qualified staff with
experience in areas like social work, project management, construction,
and planning. The Council revised People Plan has several initiatives to
address recruitment and retention issues. There is a People plan board
which meets. Staff sickness needs to be reduced, which remains above the
public sector average.
F6. There has been an upward trend in terms of value of uncollected debt
amassing on the Council’s Balance Sheet. There are a number of underlying
issues creating this trend, but they can be attributable to three key themes;
Pockets of poor debt collection policies and processes, limited write offs of
debts assessed as uncollectible and debt being raised incorrectly or late.
P a g e | 32
F7. There are actions in place to improve ongoing collection performance and
to assess, and collect where possible, outstanding aged debt. Targets have
been set as part of the 2018/19 and 2019/20 budget delivery plan.
F8. The Council’s wholly owned subsidiary, London Luton Airport Ltd, received
an audit recommendation in the 2016/17 audit to facilitate greater levels of
segregation of duties and formalise the approval of manual ledger journals.
The recommendations have been address by a change in the subsidiaries
finance structure.
F9. The Council has been able to close the accounts in order to meet the
deadline as set by central government i.e. 31 May 2018. This required
considerable planning and input from all the departments. The audit for
this year’s accounts has progressed well and the auditors can’t see any
reason why this year’s audit won’t be completed on time. No significant
issues have been raised by the external auditors as part of the interim
audit.
G. APPROVAL OF ANNUAL GOVERNANCE STATEMENT
Signed
Laura Church
Laura Church
Interim Chief Executive
Signed
Hazel Simmons
Councillor Hazel Simmons
Leader of the Council

P a g e | 33
INDEPENDENT AUDITOR’S REPORT
A. OPINION
We have audited the financial statements of Luton Borough Council for the year ended 31 March 2018 under the Local Audit and
Accountability Act 2014. The financial statements comprise the:
Authority and Group Movement in Reserves Statement;
Authority and Group Comprehensive Income and Expenditure Statement
Authority and Group Balance Sheet;
Authority and Group Cash Flow Statement;
Housing Revenue Account Income and Expenditure Statement, the Housing Revenue Account Movement in Reserves Statement, and
the Collection Fund; and
the related Notes 1 to 45 of the Authority Financial Statements, Notes 1 – 7 of the Housing Revenue Account, Notes 1 – 3 of the
Collection Fund, and the accounting policies and notes 1 to 15 of the Group Financial Statements.
The financial reporting framework that has been applied in their preparation is applicable law and the CIPFA/LASAAC Code of Practice on Local
Authority Accounting in the United Kingdom 2017/18.
In our opinion the financial statements:
give a true and fair view of the financial position of Luton Borough Council and Group as at 31 March 2018 and of its expenditure and
income for the year then ended; and
have been prepared properly in accordance with the CIPFA/LASAAC Code of Practice on Local Authority Accounting in the United
Kingdom 2017/18.

P a g e | 34
BASIS FOR OPINION
We conducted our audit in accordance with International Standards on Auditing (UK) (ISAs (UK)) and applicable law. Our responsibilities under
those standards are further described in the Auditor’s responsibilities for the audit of the financial statements section of our report below. We
are independent of the authority and group in accordance with the ethical requirements that are relevant to our audit of the financial
statements in the UK, including the FRC’s Ethical Standard and the Comptroller and Auditor General’s (C&AG) AGN01, and we have fulfilled our
other ethical responsibilities in accordance with these requirements.
We believe that the audit evidence we have obtained is sufficient and appropriate to provide a basis for our opinion.
CONCLUSIONS RELATING TO GOING CONCERN
We have nothing to report in respect of the following matters in relation to which the ISAs (UK) require us to report to you where:
the Service Director (Finance & Audit)’s use of the going concern basis of accounting in the preparation of the financial statements is
not appropriate; or
the Service Director (Finance & Audit) has not disclosed in the financial statements any identified material uncertainties that may cast
significant doubt about the Authority’s ability to continue to adopt the going concern basis of accounting for a period of at least twelve
months from the date when the financial statements are authorised for issue.
OTHER INFORMATION
The other information comprises the information included in the Statement of Accounts 2017/18, other than the financial statements and our
auditor’s report thereon. The Service Director (Finance and Audit) is responsible for the other information.
Our opinion on the financial statements does not cover the other information and, except to the extent otherwise explicitly stated in this
report, we do not express any form of assurance conclusion thereon.

P a g e | 35
In connection with our audit of the financial statements, our responsibility is to read the other information and, in doing so, consider whether
the other information is materially inconsistent with the financial statements or our knowledge obtained in the audit or otherwise appears to
be materially misstated. If we identify such material inconsistencies or apparent material misstatements, we are required to determine
whether there is a material misstatement in the financial statements or a material misstatement of the other information. If, based on the
work we have performed, we conclude that there is a material misstatement of the other information, we are required to report that fact.
We have nothing to report in this regard.
B. OPINION ON OTHER MATTERS PRESCRIBED BY THE LOCAL AUDIT AND ACCOUNTABILITY ACT 2014
ARRANGEMENTS TO SECURE ECONOMY, EFFICIENCY AND EFFECTIVENESS IN THE USE OF RESOURCES
In our opinion, based on the work undertaken in the course of the audit, having regard to the guidance issued by the C&AG in August 2017, we
are satisfied that, in all significant respects, Luton Borough Council put in place proper arrangements to secure economy, efficiency and
effectiveness in its use of resources for the year ended 31 March 2018.
MATTERS ON WHICH WE REPORT BY EXCEPTION
We report to you if:
in our opinion the annual governance statement is misleading or inconsistent with other information forthcoming from the audit or our
knowledge of the Council;
we issue a report in the public interest under section 24 of the Local Audit and Accountability Act 2014;
we make written recommendations to the audited body under Section 24 of the Local Audit and Accountability Act 2014;
we make an application to the court for a declaration that an item of account is contrary to law under Section 28 of the Local Audit and
Accountability Act 2014;
we issue an advisory notice under Section 29 of the Local Audit and Accountability Act 2014; or
we make an application for judicial review under Section 31 of the Local Audit and Accountability Act 2014.
P a g e | 36
We have nothing to report in these respects.
C. RESPONSIBILITY OF THE SERVICE DIRECTOR (FINANCE & AUDIT)
As explained more fully in the Statement of the Service Director (Finance & Audit) Responsibilities set out on page 16, the Service Director
(Financer and Audit) is responsible for the preparation of the financial statements, which includes the financial statements, in accordance with
proper practices as set out in the CIPFA/LASAAC Code of Practice on Local Authority Accounting in the United Kingdom 2017/18, and for being
satisfied that they give a true and fair view.
In preparing the financial statements, the Service Director (Financer and Audit) is responsible for assessing the Authority’s ability to continue
as a going concern, disclosing, as applicable, matters related to going concern and using the going concern basis of accounting unless the
Authority either intends to cease operations, or have no realistic alternative but to do so.
The Authority is responsible for putting in place proper arrangements to secure economy, efficiency and effectiveness in its use of resources,
to ensure proper stewardship and governance, and to review regularly the adequacy and effectiveness of these arrangements.
D. AUDITOR’S RESPONSIBILITIES FOR THE AUDIT OF THE FINANCIAL STATEMENTS
Our objectives are to obtain reasonable assurance about whether the financial statements as a whole are free from material misstatement,
whether due to fraud or error, and to issue an auditor’s report that includes our opinion. Reasonable assurance is a high level of assurance, but
is not a guarantee that an audit conducted in accordance with ISAs (UK) will always detect a material misstatement when it exists.
Misstatements can arise from fraud or error and are considered material if, individually or in the aggregate, they could reasonably be expected
to influence the economic decisions of users taken on the basis of these financial statements.
A further description of our responsibilities for the audit of the financial statements is located on the Financial Reporting Council’s website at
https://www.frc.org.uk/auditorsresponsibilities. This description forms part of our auditor’s report.

P a g e | 37
E. SCOPE OF THE REVIEW OF ARRANGEMENTS FOR SECURING ECONOMY, EFFICIENCY AND EFFECTIVENESS IN THE USE OF
RESOURCES
We have undertaken our review in accordance with the Code of Audit Practice, having regard to the guidance on the specified criterion issued
by the Comptroller and Auditor General (C&AG) in November 2017, as to whether the Luton Borough Council had proper arrangements to
ensure it took properly informed decisions and deployed resources to achieve planned and sustainable outcomes for taxpayers and local
people. The Comptroller and Auditor General determined this criterion as that necessary for us to consider under the Code of Audit Practice in
satisfying ourselves whether the Authority put in place proper arrangements for securing economy, efficiency and effectiveness in its use of
resources for the year ended 31 March 2018.
We planned our work in accordance with the Code of Audit Practice. Based on our risk assessment, we undertook such work as we considered
necessary to form a view on whether, in all significant respects, Luton Borough Council had put in place proper arrangements to secure
economy, efficiency and effectiveness in its use of resources.
We are required under Section 20(1)(c) of the Local Audit and Accountability Act 2014 to satisfy ourselves that the Authority has made proper
arrangements for securing economy, efficiency and effectiveness in its use of resources. The Code of Audit Practice issued by the National
Audit Office (NAO) requires us to report to you our conclusion relating to proper arrangements.
We report if significant matters have come to our attention which prevent us from concluding that the Authority has put in place proper
arrangements for securing economy, efficiency and effectiveness in its use of resources. We are not required to consider, nor have we
considered, whether all aspects of the Authority’s arrangements for securing economy, efficiency and effectiveness in its use of resources are
operating effectively.
F. CERTIFICATE
We certify that we have completed the audit of the accounts of Luton Borough Council in accordance with the requirements of the Local Audit
and Accountability Act 2014 and the Code of Audit Practice issued by the National Audit Office.

P a g e | 38
G. USE OF OUR REPORT
This report is made solely to the members of Luton Borough Council, as a body, in accordance with Part 5 of the Local Audit and Accountability
Act 2014 and for no other purpose, as set out in paragraph 43 of the Statement of Responsibilities of Auditors and Audited Bodies published by
Public Sector Audit Appointments Limited. To the fullest extent permitted by law, we do not accept or assume responsibility to anyone other
than the Authority and the Authority’s members as a body, for our audit work, for this report, or for the opinions we have formed.
Neil Harris
Neil Harris (Key Audit Partner)
Ernst & Young LLP (Local Auditor)
Luton
9th January 2019
The maintenance and integrity of Luton Borough Council’s web site is the responsibility of the directors; the work carried out by the auditors
does not involve consideration of these matters and, accordingly, the auditors accept no responsibility for any changes that may have occurred
to the financial statements since they were initially presented on the web site.
Legislation in the United Kingdom governing the preparation and dissemination of financial statements may differ from legislation in other
jurisdictions

P a g e | 39
02 Core Financial Statements
Comprehensive Income & Expenditure Statement Page 40
Movement in Reserves Statement Page 41
Balance Sheet Page 42
Cash Flow Statement Page 44

P a g e | 40
COMPREHENSIVE INCOME AND EXPENDITURE STATEMENT
This statement shows the accounting cost in the year of providing service in accordance with generally accepted accounting practices, rather than the amount to be funded
from taxation. Councils raise taxation to cover expenditure in accordance with regulations; this may be different from the accounting cost. The taxation position is shown
in the Movement in Reserves Statement. This is the second year the service segments within the CIES are presented in the same format as the Council’s organisational
directorates. In previous years the segments were strictly aligned to the service areas described by CIPFA guidance.
2016/17 RESTATED 2017/2018
Gross Spend
Gross Income
Net Spend
Gross Spend
Gross Income
Net Spend
£000 £000 £000 £000 £000 £000
7,375 (1,333) 6,042 Chief Executive 4,748 (1,501) 3,247
58,819 (17,829) 40,990 Place and Infrastructure 64,985 (20,320) 44,665
121,659 (108,678) 12,981 Customer and Commercial 122,114 (109,921) 12,193
31,423 (19,537) 11,886 Public Health, Commissioning & Procurement 29,040 (16,788) 12,252
137,456 (32,743) 104,713 People 166,742 (50,617) 116,125
177,984 (173,626) 4,358 Schools Individual Budgets 174,782 (172,358) 2,424
18,576 (38,454) (19,878) Housing Revenue Account (HRA Statements) 38,539 (38,351) 189
279 (930) (651) Other Corporate Accounts 334 (1,208) (874)
553,571 (393,130) 160,441 Total Net Cost of Services 601,284 (411,062) 190,222
33,344 Other operating expenditure (Note 8) (2,848)
(7,626) Financing and investment income and expenditure (Note 9) (11,752)
(171,688) Taxation and non-specific grant income (Note 10) (152,136)
14,471 (Surplus) or Deficit on Provision of Services 23,486
(95,379) (Surplus)/deficit on revaluation of Property, Plant & Equipment & Heritage (Note 23) (41,827)
76,871 Re-measurements of the net defined benefit liability (Note 33) (15,198)
(18,508) Other Comprehensive Income and Expenditure (57,025)
(4,037) Total Comprehensive Income and Expenditure (33,539)
The relationship between the funding and accounting outturn is reconciled within the Expenditure and Funding Analysis (Note 6).
2016/17 restated to include “Internal Recharges” within departmental segments, not on its own line separately; this has not changed the “total net cost of services”.

P a g e | 41
MOVEMENT IN RESERVES STATEMENT
The Movement in Reserves Statement is a summary of the changes to the Council’s reserves over the course of the year. Reserves are divided into “usable”, which can be
invested in capital projects or service improvements, and “unusable” which must be set aside for specific purposes.
General
Fund Balance
Housing Revenue Account
Major Repairs Reserve
Capital Receipts Reserve
Capital Grants
Unapplied Reserve
Total Usable
Reserves
Unusable Reserves
Total Council
Reserves
£000 £000 £000 £000 £000 £'000 £000 £000
Balance at 31 March 2016 (71,187) (8,405) (1,406) (11,067) (6,884) (98,949) (497,710) (596,659)
Opening Balance Adjustment 0 0 0 0 0 0 88 88
Revised Balance at 31 March 2016 (71,187) (8,405) (1,406) (11,067) (6,884) (98,949) (497,622) (596,571)
Movement in Reserves during 2016-17
Total Comprehensive Income and Expenditure 31,596 (17,125) 0 0 0 14,471 (18,508) (4,037)
Adj. between accounting basis & funding basis (37,329) 15,348 (1,133) (6,112) 1,390 (27,836) 27,836 0
(Increase) or Decrease in 2016-17 (5,733) (1,777) (1,133) (6,112) 1,390 (13,365) 9,328 (4,037)
Balance at 31 March 2017 (76,920) (10,182) (2,539) (17,179) (5,494) (112,314) (488,294) (600,608)
Movement in Reserves during 2017-18
Total Comprehensive Income and Expenditure 17,133 6,353 0 0 0 23,486 (57,025) (33,539)
Adj. between accounting basis & funding basis (20,561) (6,818) (593) (1,956) 1,509 (28,418) 28,418 0
(Increase) or Decrease in 2017-18 (3,427) (466) (593) (1,956) 1,509 (4,932) (28,607) (33,539)
Balance at 31 March 2018 (80,348) (10,647) (3,132) (19,135) (3,985) (117,247) (516,900) (634,147)
Adjustments between accounting basis and funding basis under regulations are explained in more detail in Note 20.
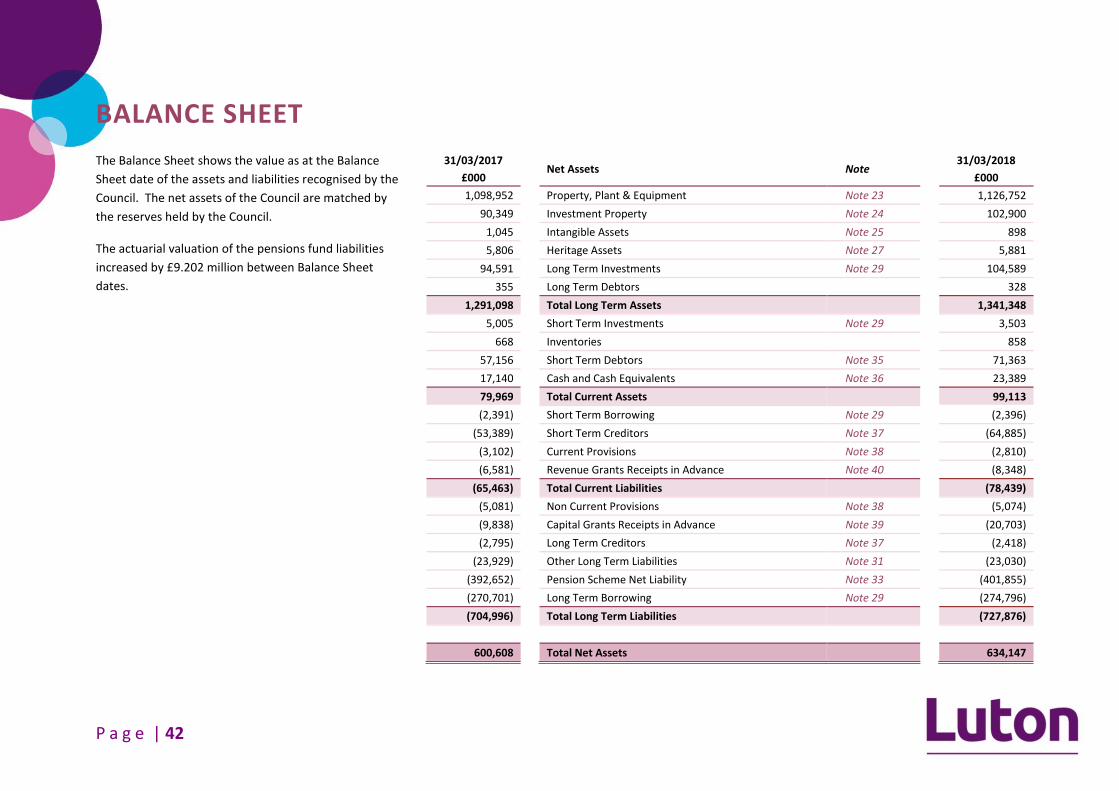
P a g e | 42
BALANCE SHEET
The Balance Sheet shows the value as at the Balance
Sheet date of the assets and liabilities recognised by the
Council. The net assets of the Council are matched by
the reserves held by the Council.
The actuarial valuation of the pensions fund liabilities
increased by £9.202 million between Balance Sheet
dates.
31/03/2017 Net Assets Note
31/03/2018
£000 £000
1,098,952 Property, Plant & Equipment Note 23 1,126,752
90,349 Investment Property Note 24 102,900
1,045 Intangible Assets Note 25 898
5,806 Heritage Assets Note 27 5,881
94,591 Long Term Investments Note 29 104,589
355 Long Term Debtors 328
1,291,098 Total Long Term Assets 1,341,348
5,005 Short Term Investments Note 29 3,503
668 Inventories 858
57,156 Short Term Debtors Note 35 71,363
17,140 Cash and Cash Equivalents Note 36 23,389
79,969 Total Current Assets 99,113
(2,391) Short Term Borrowing Note 29 (2,396)
(53,389) Short Term Creditors Note 37 (64,885)
(3,102) Current Provisions Note 38 (2,810)
(6,581) Revenue Grants Receipts in Advance Note 40 (8,348)
(65,463) Total Current Liabilities (78,439)
(5,081) Non Current Provisions Note 38 (5,074)
(9,838) Capital Grants Receipts in Advance Note 39 (20,703)
(2,795) Long Term Creditors Note 37 (2,418)
(23,929) Other Long Term Liabilities Note 31 (23,030)
(392,652) Pension Scheme Net Liability Note 33 (401,855)
(270,701) Long Term Borrowing Note 29 (274,796)
(704,996) Total Long Term Liabilities (727,876)
600,608 Total Net Assets 634,147
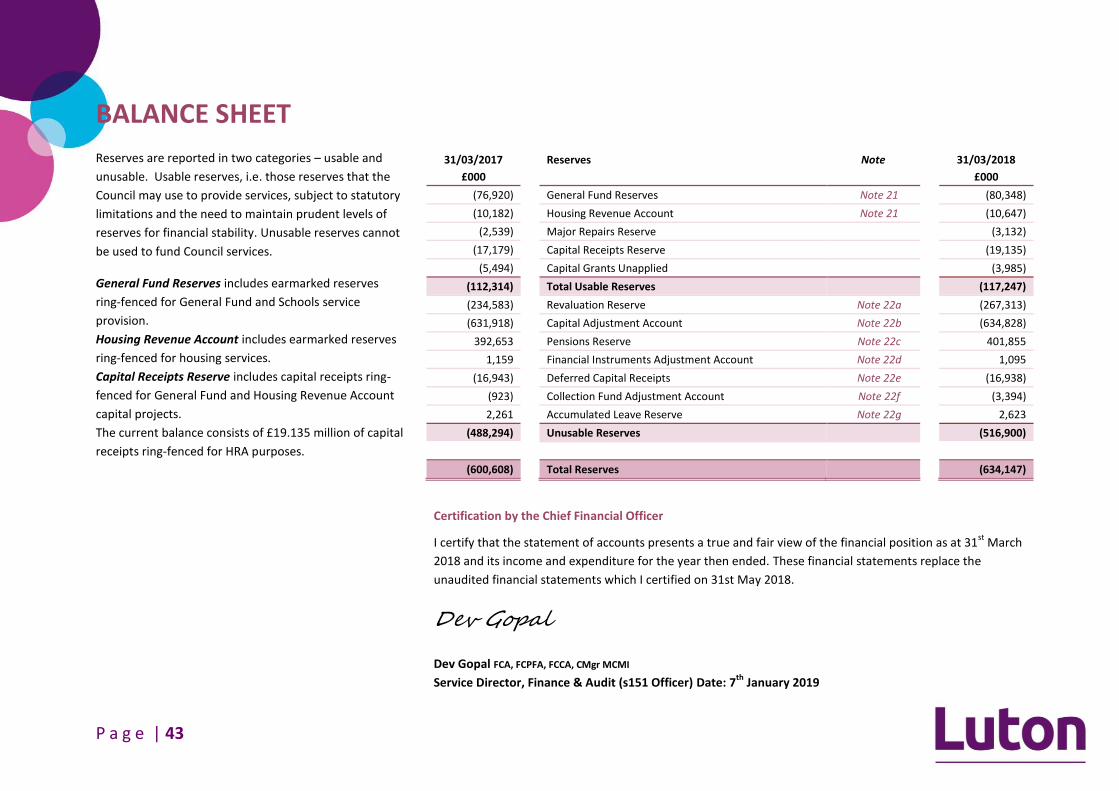
P a g e | 43
BALANCE SHEET
Reserves are reported in two categories – usable and
unusable. Usable reserves, i.e. those reserves that the
Council may use to provide services, subject to statutory
limitations and the need to maintain prudent levels of
reserves for financial stability. Unusable reserves cannot
be used to fund Council services.
General Fund Reserves includes earmarked reserves
ring-fenced for General Fund and Schools service
provision.
Housing Revenue Account includes earmarked reserves
ring-fenced for housing services.
Capital Receipts Reserve includes capital receipts ring-
fenced for General Fund and Housing Revenue Account
capital projects.
The current balance consists of £19.135 million of capital
receipts ring-fenced for HRA purposes.
31/03/2017 Reserves Note 31/03/2018
£000
£000
(76,920) General Fund Reserves Note 21 (80,348)
(10,182) Housing Revenue Account Note 21 (10,647)
(2,539) Major Repairs Reserve
(3,132)
(17,179) Capital Receipts Reserve
(19,135)
(5,494) Capital Grants Unapplied
(3,985)
(112,314) Total Usable Reserves
(117,247)
(234,583) Revaluation Reserve Note 22a (267,313)
(631,918) Capital Adjustment Account Note 22b (634,828)
392,653 Pensions Reserve Note 22c 401,855
1,159 Financial Instruments Adjustment Account Note 22d 1,095
(16,943) Deferred Capital Receipts Note 22e (16,938)
(923) Collection Fund Adjustment Account Note 22f (3,394)
2,261 Accumulated Leave Reserve Note 22g 2,623
(488,294) Unusable Reserves
(516,900)
(600,608) Total Reserves
(634,147)
Certification by the Chief Financial Officer
I certify that the statement of accounts presents a true and fair view of the financial position as at 31st
March
2018 and its income and expenditure for the year then ended. These financial statements replace the
unaudited financial statements which I certified on 31st May 2018.
Dev Gopal
Dev Gopal FCA, FCPFA, FCCA, CMgr MCMI
Service Director, Finance & Audit (s151 Officer) Date: 7th
January 2019

P a g e | 44
CASH FLOW STATEMENT The Cash Flow Statement shows the changes in cash and cash equivalents of the Council during the reporting period. The statement shows how the Council generates and
uses cash and cash equivalents by classifying cash flows as operating, investing and financing activities. The amount of net cash flows arising from operating activities is a
key indicator of the extent to which the operations of the Council are funded by way of taxation and grant income or from the recipient of services provided by the Council.
Investing activities represent the extent to which cash outflows have been made for resources which are intended to contribute to the Council’s future service delivery.
Cash flows arising from financing activities are useful in predicting claims on future cash flows by providers of capital (i.e. borrowing) to the Council.
31/03/2017 31/03/2018
£000 £000 £000 £000
(14,471) Net surplus or (deficit) on the provision of services (23,486)
56,194 Adjustments to net surplus or deficit on the provision of services for non-cash movements 79,002
(23,715) Adjustments for items included in the net surplus or deficit on the provision of services that are investing and financing activities
(26,711)
18,008 Net cash flows from Operating Activities (Note 41) 28,805
(34,893) Investing Activities (Note 42) (24,748)
(803) Financing Activities (Note 42) 2,192
(17,688) Net increase or decrease in cash and cash equivalents 6,249
34,828 Cash and cash equivalents at the beginning of the reporting period 17,140
17,140 Cash and cash equivalents at the end of the reporting period 23,389
During 2017/18 the Councils Capital Financing Requirement increased by £15 million financed by new loans to the value of £3 million. This increased the level of internal
borrowing by an additional £12 million. Even with this internal borrowing commitment, the level of investments and cash & cash equivalents has increased by £5 million
during 2017/18. These additional cash resources were generated by increases of £5million in cash back reserves and £12 million in working capital.

P a g e | 45
03 Notes to the Statements
General Accounting Policies & Judgements Page 46
Comprehensive Income & Expenditure Supporting Notes Page 51
Movement in Reserves Statement Supporting Notes Page 65
Balance Sheet Supporting Notes Page 74
Cash Flow Statement Supporting Notes Page 109
Other Supporting Notes Page 111

P a g e | 46
GENERAL ACCOUNTING POLICIES & JUDGEMENTS SUPPORTING NOTES
NOTE 1) GENERAL ACCOUNTING POLICIES
GENERAL PRINCIPLES AND BASIS OF PREPARATION
The Statement of Accounts summarises Luton Borough Council’s transactions for
the year ending 31st
March 2018. The Council is required to prepare an annual
Statement of Accounts by the Accounts and Audit (England) Regulations 2015.
The regulations require the accounts to be prepared in accordance with proper
accounting practices.
These practices primarily comprise the following:
The Code of Practice on Local Authority Accounting in the United Kingdom
2017/18
The Service Reporting Code of Practice for Local Authorities 2017/18
and are supported by International Financial Reporting Standards (IFRS).
The accounts are prepared on a going concern basis and the accounting
convention adopted in the Statement of Accounts is principally historical cost,
modified by the revaluation of certain categories of non-current assets and
financial instruments.
ACCRUALS OF INCOME AND EXPENDITURE
The accounts are maintained on an accruals basis, this means that activity is
accounted for in the year that it takes place, not simply when cash payments are
made or received. This means that the following applies:
Revenue from the sale of goods is recognised when the Council transfers the
significant risks and rewards of ownership to the purchaser and it is probable
that economic benefits associated with the transaction will flow to the
Council.
Revenue from the provision of services is recognised when the Council can
reliably assume that the transaction will be completed and it is probable that
economic benefits associated will flow to the Council.
Goods procured by the Council are accounted for when consumed, which is
normally when they are delivered. Where there is a gap between delivery of
goods and their consumption, they are carried as inventories on the Balance
Sheet.
Expenses in relation to services received, including services provided by
employees of the Council, are recorded as expenditure when the services are
received rather than when payments are made.
Interest receivable on investments and payable on borrowings are accounted
for respectively as income and expenditure on the basis of the effective
interest rate for the relevant financial instrument rather than the cash flows
fixed or determined by the contract.
Where revenue and expenditure have been recognised in the accounts, but
the cash transaction has not yet happened, a debtor or creditor will be
recorded in the Balance Sheet for the relevant amount. For debtors where it
is doubtful that the amount due will be received, the balance is reduced and a
charge is made to revenue for the income that may not be collected.
Revenue relating to such things as council tax, general rates, etc. shall be
measured at the full amount receivable (net of any impairment losses) as
they are non-contractual, non-exchange transactions and there can be no
difference between the delivery and payment dates. Revenue should be
recognised when it is probable that the economic benefit will flow to the
Council, and the amount of revenue can be measured reliably.

P a g e | 47
OVERHEADS AND SUPPORT SERVICES
In accordance with the costing principles of the CIPFA Service Reporting Code of
Practice 2017/18 (SeRCOP), the costs of central departments are charged to
services broadly on the basis of time spent by officers or an appropriate
applicable measurement. Information Management Services are charged on a
range of bases such as unit cost for desktop facilities, actual cost for applications,
productive hours for application and network support etc. Accommodation is
allocated on a floor/desk area occupied basis. The total absorption costing
principle is used, the full cost of overheads and support services are shared
between users in proportion to the benefits received.
The full service cost is included within the service segments included in the
Comprehensive Income and Expenditure Statement, as part of Net Expenditure
on Continuing Services.
SCHOOLS RECOGNITION
Schools maintained by the Council are recognised on the Balance Sheet as the
balance of control lies with the Council. Consequently all those schools’ assets,
liabilities, reserves and cash flows are recognised in the financial statements.
Voluntary aided and voluntary controlled schools are not recognised on the
Council’s Balance Sheet as the balance of control for these schools lies with the
respective dioceses. The Council does not however recognise schools funded by
PF2 arrangements on its balance sheet, but does account for the income &
expenditure in the CIES (as per VA & VC schools).
VALUE ADDED TAX (VAT)
VAT payable is included as an expense only to the extent that it is not
recoverable from Her Majesty’s Revenue and Customs. VAT receivable is
excluded from income.
BASIS OF CONSOLIDATION
Subsidiaries are entities that the Council has the power to govern. In the
Council’s financial statements, the investment in the subsidiary is carried at cost.
In the Group financial statements, the subsidiary is accounted for using the
acquisition accounting method where assets, liabilities, revenue and expenditure
are added in on a line-by-line basis.
The Luton Borough Council Group consists of Luton Borough Council, London
Luton Airport Limited (a wholly owned subsidiary of the Council) and Foxhall
Homes Limited (a wholly owned subsidiary of the Council).
The Group Accounts have been prepared on the basis of a full consolidation; this
means that all transactions between the Group entities are eliminated. The
Group only includes these two subsidiaries, no joint ventures or associates.
NOTE 2) ACCOUNTING STANDARDS THAT HAVE BEEN ISSUED
BUT HAVE YET BEEN ADOPTED
For 2018/19 the Local Authority Accounting Code of Practice includes a number
of changes resulting from revisions to accounting standards, these are;
IFRS9 Financial Instruments introduces changes to classification and
measurement of financial assets and a new “expected credit loss” model for
impairing financial assets. The impact will be to reclassify assets currently
classified as loans and receivables and available for sale to amortised cost
and fair value through other comprehensive income based on the
contractual cash flows and business model for holding the assets.
Standards not expected to have significant impact to the Council;
IFRS15 Revenue from Contracts with Customers including amendments to
IFRS15 Clarifications to IFRS15 Revenue from Contracts with Customers
Amendments to IAS12 Income Taxes: Recognition of Deferred Tax Assets for
Unrealised Losses
Amendments to IAS7 Statement of Cash Flows: Disclosure Initiative

P a g e | 48
NOTE 3) ASSUMPTIONS MADE ABOUT THE FUTURE AND OTHER MAJOR SOURCES OF ESTIMATION UNCERTAINTY
The Statement of Accounts, prepared on a going concern basis, contain estimated figures that are based on assumptions made by the Council about the future or that are
otherwise uncertain. Estimates are made taking into account historical experience, current trends and other relevant factors. However, because balances cannot be
determined with certainty, actual results could be materially different from the assumptions and estimates. The items which there are a significant risk of material
adjustment in the forthcoming financial year are:
Item Uncertainty Explanation Consequences of Uncertainty
Pro
pe
rty,
Pla
nt
and
Eq
uip
men
t Assets are depreciated over useful lives that are dependent on assumptions about the level of repairs and maintenance that will be incurred in relation to individual assets. The current economic climate makes it uncertain that the Council will be able to sustain its current spending on repairs and maintenance, bringing into doubt the useful lives assigned to assets. For HRA dwellings, the use of the major repairs allowance as a proxy for depreciation is no longer acceptable. The new treatment of depreciation is further explained in Note 23.
If the useful lives of assets are reduced, depreciation increases and the carrying amount of the assets falls.
It is estimated that the annual depreciation charge for buildings would increase by approximately £1 million for General Fund and £0.4 million for the HRA for every year that useful lives had to be reduced.
Pe
nsi
on
s
Liab
ility
Estimation of the net liability to pay pensions depends on a number of complex judgements relating to the discount rate used, the rate at which salaries are projected to increase, changes in retirement ages, mortality rates and expected returns on pension fund assets. A firm of actuaries is engaged to provide the Council with expert advice about the assumptions to be applied.
The effects on the net pension’s liability of changes in individual assumptions can be measured. However, the assumptions interact in complex ways; during 2017/18, the Council’s actuaries advised that the net pension’s liability had increased by £9.202 million. Please see Note 33 for sensitivity analysis.
Bu
sin
ess
Rat
es
Ap
pea
ls
At 31st March 2018, the Council had a provision for NNDR appeals of £4.472 million (49% of £9.127 million of the total appeals provision attributable to the Collection Fund). Please see Provisions Note 38.
Analyse Local provide up to date analyses and projections of appeals based on the latest appeals data released by the Valuation Office. The estimate can fluctuate significantly between financial years. The four largest known appeals total £3.041 million, which is 33.3% of the total provision. If another significant appeal of £1 million was lodged the provision could increase by 11%. Currently there are 230 known appeals outstanding at an approximate average of £26,137. If the number of known appeals increased by 10%, at the average amount, this would increase the provision by approximately £601,151 (7%).
Do
ub
tfu
l
De
bts
As at 31st March 2018, the Council had outstanding arrears of £113.981 million, of which £22.340 million is with LLAL and FH ltd. £42.619 million has been provided for in case of non-collection of debts. Note 35. If there was a reduction in the rate of collection there would be an increase need to contribute to the provision on an annual basis.
If the provision was incorrectly calculated and higher than expected debt write offs were required, future financial years would have to incur additional budgetary costs. If the downturn in collection rates was representative of longer term collection, then the Council may need to revise the doubtful debt provision calculation and annual budgeted contribution.
Please note the fair value concept is explained further in note 45 and PPE valuations explained in note 23.

P a g e | 49
NOTE 4) CRITICIAL JUDGEMENTS IN APPLYING ACCOUNTING
POLICIES
In applying the accounting policies set out above, the Council has had to make
certain judgements about complex transactions or those involving uncertainty
about future events. The main critical judgements made in the Statement of
Accounts are:
FUNDING
There is a high degree of uncertainty about future levels of funding for local
government. However, the Council has determined that this uncertainty is not
sufficient to provide an indication that the assets of the Council might be
impaired as a result of a need to close facilities and reduce levels of service
provision. This is because the Council is determined to preserve front line
services as far as possible.
The Council also prepare the accounts based on it being a going concern.
GROUP BOUNDARIES
The group boundaries have been assessed using the criteria associated with the
Code. In line with this, the Council has identified two material subsidiaries
(London Luton Airport Ltd and Foxhall Homes Ltd) and produced Group Accounts
accordingly.
The Council’s group boundary has increased for the wholly owned housing
company, Foxhall Homes Ltd, in 2017/18 it’s first year as part of the group.
Judgement on the grounds on materiality is that group accounts are required by
the Council and are therefore consolidated as such.
SCHOOLS
In accordance with the Code, the Council recognises schools on the Balance
Sheet where future economic benefits or service potential associated with the
school will flow to the Authority. Where the Authority can employ staff and is
responsible for the admission criteria, these schools are recognised.
There are several types of school within the Borough with Community Schools
and Foundation Schools recognised on the balance sheet. The schools that are
not recognised on the balance sheet are Voluntary Aided, Academies and Free
Schools.
School assets are treated as a disposal from the Balance Sheet on the date a
school is converted to an academy.
LOCAL ENTERPRISE PARTNERSHIP (LEP)
South East Midlands Local Enterprise Partnership (SEMLEP) is a locally owned
public private partnership and therefore involves a large number of stakeholders
including 14 local authorities, local businesses, business organisations and many
other private, public and third sector organisations.
Luton Borough Council is the accountable body for the SEMLEP. There is a clear
governance framework which states Luton Borough Council acts an agent in this
arrangement and has no rights to use the funding for local services, unless
authorised by the SEMLEP board.
EMBEDDED LEASES
Annually the contracts register is reviewed to ascertain where infrastructure
assets are being used solely to deliver services to the Council. The correct
accounting treatment for these arrangement is to separate the contract

P a g e | 50
payments into revenue and capital. Currently there are two contracts which have
been judged to contain infrastructure assets. They are the highways contract
with Volker Highways and the multi-functional devices provided by Danwood.
These arrangements are explained in more detail within Note 31.
PROPERTY, PLANT & EQUIPMENT
Judgement is made in assessing PPE assets into appropriate asset categories as
prescribed under the Code. These are subject to a degree of interpretation and
judgement but given the Code’s outlines the Council believe all classifications are
as accurate as possible given the circumstances of each asset.
BETTER CARE FUND (BCF)
In respect of the BCF the terms of the Section 75 agreement means that
contracts are stand-alone with the financial risk being retained by the lead body.
Each partner then manages the contracts with their own providers of BCF
services and each partner retains any financial risk relating to those contracts.
The BCF is not a separate legal entity and has been accounted for as a pooled
budget arrangement (see Note 18), since it is not an entity, joint operation or
joint venture. It should be noted that neither party has unilateral control of the
BCF, as decisions of the Board need to be made unanimously.
NOTE 5) EVENTS AFTER THE REPORTING PERIOD
The Draft Statement of Accounts was authorised for issue by the Service Director
(Finance & Audit) on 31st
May 2018. Events taking place after this date are not
reflected in the financial statements or notes. Where events taking place before
this date provided information about conditions existing at 31st
March 2018, the
figures in the financial statements and notes have been adjusted in all material
respects to reflect the impact of this information.
The uncertainty and complexity of our financial landscape is increased by the as
yet unquantifiable impact of Brexit on both local government funding and future
legislation. These impacts could turn out to be either positive or negative overall
but are likely to affect the Council’s key budget factors such as interest and
inflation rates, labour costs and property and rental values. This could also lead
to additional demand on Council service and a depression in the value of the
Council’s commercial investments and subsidiaries.
Prior to the 31st
March 2018, the Council had been approached to provide
financial and practical support to the company which is responsible for the
operation of the Vauxhall plant in Luton. Since this time further due diligence has
been carried out, and as a result a substantial commitment has been agreed in
principal, to support the company and maintain economic regeneration in the
region.

P a g e | 51
COMPREHENSIVE INCOME & EXPENDITURE STATEMENT NOTES
NOTE 6) EXPENDITURE AND FUNDING ANALYSIS
2017/18 is the second year of the Expenditure and Funding Analysis note. This note demonstrates how the funding available to the Council for the year 2017/18 been used
to provide services in comparison with those resources consumed or earned under generally accepted accounting practice (GAAP). The Expenditure and Funding analysis
also shows how this expenditure is allocated for decision making purposes between the Council’s directorates. Income and expenditure accounted for under GAAP is
presented more fully in the Comprehensive Income and Expenditure Statement.
2016/17 2017/18
Net Expenditure Chargeable to the General
Fund and HRA Balances
Adjustments between the Funding and Accounting
Basis
Net Expenditure Comprehensive
Income and Expenditure Statement
Net Expenditure Chargeable to the General
Fund and HRA Balances
Adjustments between the Funding and Accounting
Basis
Net Expenditure Comprehensive
Income and Expenditure Statement
£000 £000 £000 £000 £000 £000
6,035 7 6,042 Chief Executive 2,908 339 3,247
35,131 5,859 40,990 Place and Infrastructure 30,736 13,929 44,665
12,996 (15) 12,981 Customer and Commercial 10,737 1,456 12,193
13,366 (1,480) 11,886 Public Health, Commissioning & Procurement 12,387 (134) 12,252
103,899 814 104,713 People 112,829 3,296 116,125
3,570 788 4,358 Schools Individual Budgets (2,638) 5,062 2,424
(1,777) (18,101) (19,878) Housing Revenue Account (466) 655 189
(44,792) 44,141 (651) Other Corporate Accounts (38,785) 37,914 (874)
128,428 32,013 160,441 Net Cost of Services 127,708 62,516 190,222
(135,938) (10,032) (145,970) Other Income & Expenditure (131,600) (35,136) (166,736)
(7,510) 21,981 14,471 (Surplus) or Deficit (3,893) 27,380 23,486
(79,592) Opening General Fund & HRA Balance (87,102)
(7,510) Movement In Year (3,893)
(87,102) Closing General Fund & HRA Balance (90,995)
The movement in year is split between the General Fund and Housing Revenue Account within the Movement in Reserves Statement.

P a g e | 52
NOTE 6A) EXPENDITURE AND FUNDING ANALYSIS (CONTINUED)
Adjustments from the General Fund to the amounts presented in the Comprehensive Income and Expenditure Statement:
2016/17 2017/18
Adjustments for Capital Purposes
Net change for the Pensions Adjustment
Other Differences
Total Adjustment
Adjustments from General Fund to arrive at the Comprehensive Income and Expenditure Statement amounts
Adjustments for Capital Purposes
Net change for the Pensions Adjustment
Other Differences
Total Adjustment
(Note 1) (Note 2) (Note 3) (Note 1) (Note 2) (Note 3)
£000 £000 £000 £000 £000 £000 £000 £000
0 74 (67) 7 Chief Executive 0 435 (96) 339
0 (84) 5,943 5,859 Place and Infrastructure 0 2,017 11,912 13,929
0 106 (121) (15) Customer and Commercial 0 2,288 (832) 1,456
0 (1,480) 0 (1,480) Public Health, Commissioning & Procurement 0 (134) 0 (134)
0 699 115 814 People 0 3,411 (115) 3,296
0 788 0 788 Schools Individual Budgets 0 5,738 (676) 5,062
(13,287) (123) (4,691) (18,101) Housing Revenue Account 7,213 263 (6,821) 655
26,378 1,245 16,518 44,141 Other Corporate Accounts 18,967 0 18,947 37,914
13,091 1,225 17,697 32,013 Net Cost of Services 26,180 14,017 22,320 62,516
1,691 10,650 (22,373) (10,032) Other income and expenditure from the Expenditure and Funding Analysis
(21,027) 10,383 (24,492) (35,136)
14,782 11,875 (4,676) 21,981
Difference between General Fund surplus or deficit and Comprehensive Income and Expenditure Statement Surplus or Deficit on the Provision of Services
5,152 24,400 (2,172) 27,380
Other income and expenditure represents the income and expenditure included in the Comprehensive Income and Expenditure Statement outside of the Net Cost of
Services, and is explained in more detail in the following Notes 8, 9 and 10.

P a g e | 53
Note 1 – Capital accounting charges and financing, including; Depreciation, Amortisation, Revaluations, Revenue Expenditure Funded Capital Under Statute (REFCUS),
Disposals, Capital Receipts, Minimum Revenue Provision (MRP), Major Repairs Allowance, Direct Revenue Financing and Capital Grants & Contributions.
Note 2 – IAS19 pension adjustments. This includes the accounting adjustments to remove historical deficit contributions and to recognise financing costs and returns for
the financial year.
Note 3 – Other accounting adjustments, including; Employee Benefits Accrual, Financial Instruments Accounting Adjustments and Collection Fund Accounting Adjustments.
In addition to these accounting adjustments all transfers out of the Net Cost of Services to the Other Income and Expenditure line is incorporated in this column.
The below table illustrates the material items of income and expenditure included in Net Expenditure Chargeable to the General Fund and HRA Balances column of the
Expenditure Funding Analysis.
2016/17 2017/18 Depreciation, amortisation, impairment
Fees & Charges
Internal Recharges
Segmental Analysis Depreciation, amortisation, impairment
Fees & Charges
Internal Recharges
£000 £000 £000 £000 £000 £000
1,751 (432) (12,817) Chief Executive 1,800 (588) (15,612)
13,242 (23,309) (28,428) Place and Infrastructure 7,379 (26,209) (28,988)
365 (18,985) (38,716) Customer and Commercial 422 (20,655) (42,850)
1,867 (3,342) (3,554) Public Health, Commissioning & Procurement 1,912 (756) (2,872)
14,851 (22,992) (6,964) People 15,919 (37,806) (7,496)
0 (9,782) (6,311) Schools Individual Budgets 0 (8,521) (4,520)
(1,593) (38,454) (526) Housing Revenue Account 18,994 (38,351) (128)
445 (3,242) (1,882) Other Corporate Accounts 445 (1,216) (3,131)
30,928 (120,538) (99,198) Total 46,871 (134,101) (105,596)
The significant change year on year on ‘Depreciation, amortisation and impairment’ on the Housing Revenue Account is primarily due to an £18m change in HRA Property,
Plant and Equipment revaluation (£11.997 million gain in 2016/17 to a £6.321 million loss in 2017/18) and an £2m change in HRA Investment Properties revaluation
(£0.177 million loss in 2016/17 to a £2.167 million loss in 2017/18).
The significant change year on year on ‘Fees and charges’ on the People section is primarily due to much higher income levels from outside bodies for Learning Disabilities
and Section 31 purchased care.

P a g e | 54
NOTE 7) EXPENDITURE AND INCOME ANALYSED BY NATURE
Total expenditure has increased between years mainly due to capital charges
relating to disposals, revaluations and depreciation.
Government grants and contributions have fallen year on year but the Council
continues to maximise such revenue streams wherever possible.
Interest and investment income has increased between years due to the
increased LLAL dividend for 2017/18 of £19.500 million (£17.800 million
2016/17).
* Employee benefits expenses include £30.094 million (£27.413 million in
2016/17) of employee costs for staff not employed by the Council. This
represents the staffing costs of the 9 maintained schools (8 in 2016/17) which
have Voluntary Aided or Foundation status.
** Internal recharges include all central support cost, internal trading and other
inter department charging.
The Authority’s expenditure and income is analysed as follows:
2016/17 2017/18
£000 £000
Expenditure
235,761 Employee benefits expenses* 250,028
362,405 Other services expenses 370,187
42,065 Support service recharges 55,063
30,928 Depreciation, amortisation, impairment 46,871
11,983 Interest payments 12,092
112 Precepts and levies 113
658 Payments to Housing Capital Receipts Pool 651
32,574 Gain on the disposal of assets (3,611)
716,485 Total expenditure 731,392
(99,198) Internal recharges** (105,596)
617,288 Total expenditure 625,796
Income
(120,538) Fees, charges and other service income (134,101)
(22,186) Interest and investment income (24,458)
(111,378) Income from council tax, non-domestic rates
(112,969)
(348,714) Government grants and contributions (330,783)
(602,816) Total income (602,311)
14,471 Surplus or Deficit on the Provision of Services
23,486

P a g e | 55
NOTE 8) OTHER OPERATING EXPENDITURE
Other operating Expenditure reported includes all levies payable, total payments
made to the Government Housing Receipts Pool in line with statutory
arrangements for certain property sales within the Housing Revenue Account
and gains/losses generated from in year disposals of non-current assets.
The significant loss in the previous financial year was due to the disposal of
Challney Girls School (£22.8 million) and Putteridge High School (£12.4 million)
assets who converted to academy status. No Council schools converted to
academy status within 2017/18.
31/03/2017 31/03/2018
£000 £000
112 Levies 113
658 Payments to the Government Housing Capital Receipts Pool
651
32,574 Gains/losses on the disposal of non-current assets
(3,611)
33,344 Total (2,848)
NOTE 9) FINANCING AND INVESTMENT INCOME AND EXPENDITURE
Financing and investment income and expenditure includes interest receivable
and payable on the Council’s investment portfolio. The Council’s net rental
income on the properties it holds purely for investment purposes is also
included. It also includes the interest element of the pension fund liability.
The dividend received from the Council’s wholly owned subsidiary, London Luton
Airport Ltd, increased by £1.700 million between financial years to create a total
dividend of £19.500 million for 2017/18 (£17.800 million 2016/17).
31/03/2017 31/03/2018
£000 £000
11,983 Interest payable and similar charges 12,092
10,650 Net interest on the net defined benefit liability
10,383
(4,386) Interest receivable and similar income (4,958)
(6,604) Income and expenditure in relation to investment properties and changes in their fair value (Note 24)
(10,744)
(17,800) Dividends receivable (19,500)
(1,469) Trading and other investment activities (Note 19)
974
(7,626) Total Financing and Investment Income and Expenditure
(11,752)

P a g e | 56
NOTE 10) TAXATION AND NON-SPECIFIC GRANT INCOME
This note consolidates all non-specific grants and contributions receivable that
cannot be directly attributable to service expenditure and therefore not included
in the gross income amount relevant to the service area. All capital grants and
contributions are credited to non-specific grant income even if service specific.
The note also identifies the Council’s proportion of council tax and business rates
used to fund in year service activities.
In line with Central Government austerity measures, the Council’s Central
Government funding, titled Revenue Support Grant, has reduced by £7.667
million between years.
31/03/2017 31/03/2018
£000 £000
(64,712) Council Tax income (68,224)
(35,825) Non-domestic rates (31,186)
(10,841) Non-domestic rates Top Up Payment (13,559)
(28,769) Revenue Support Grant (21,102)
(3,920) New Homes Bonus (3,074)
(1,441) S31 Business Rates Compensation (2,651)
(114) Other grants 0
(26,066) Capital grants and contributions (12,340)
(171,688) Total Taxation and Non Specific Grant Income
(152,136)
Capital grants and contributions are analysed in more detail below:
31/03/2017 31/03/2018
£000 Capital grants and contributions £000
(3,685) Capital Grants -School Condition Allocation (2,621)
(11,716) Other Capital Grants - Education (4,015)
(710) Devolved Formula Capital (1,098)
(2,788) Local Transport Plan Block Allocation Grant (2,779)
(2,146) Wardown Park Museum Development Grant 0
(1,672) Other Government Grants (<£1m) (866)
(299) Other Non-Government Grants (<£1m) (253)
(1,849) s106 Developers' Contributions (583)
(1,201) Luton Dunstable Busway Contributions (126)
(26,066) Total Capital Grants and Contributions (12,340)
External funding recognised to fund the Capital Programme in 2017/18 has
decreased by £13.726 million in comparison to 2016/17.

P a g e | 57
NOTE 11) GRANT INCOME CREDITED TO SERVICES
ACCOUNTING POLICY
Whether paid on account, by instalments or in arrears, government grants and
third party contributions and donations are recognised as due to the Council
when there is reasonable assurance that:
The Council will comply with the conditions attached to the payments, and
The grants or contributions will be received
Amounts recognised as due to the Council are not credited to the
Comprehensive Income and Expenditure Statement until conditions attached to
the grant or contribution are required to be consumed by the recipient as
specified, or future economic benefits or service potential must be returned to
the transferor.
Monies advanced as grants and contributions for which conditions have not been
satisfied, the grant or contribution is credited to the relevant service line
(attributable revenue grants and contributions) or Taxation and Non-Specific
Grant Income (non-ring-fenced revenue grants and all capital grants) in the
Comprehensive Income and Expenditure Statement.
Where capital grants are credited to the Comprehensive Income and Expenditure
Statement, they are reversed out of the General Fund Balance in the Movement
in Reserves Statement. Where the grant has yet to be used to finance capital
expenditure, it is posted to the Capital Grants Unapplied Reserve. Where it has
been applied, it is posted to the Capital Adjustment Account. Amounts in the
Capital Grants Unapplied Reserve are transferred to the Capital Adjustment
Account once they have been applied to fund capital expenditure.
The Council credited the following grants, contributions and donations to the Net
Cost of Services within the Comprehensive Income and Expenditure Statement in
2017/18:
31/03/2017 31/03/2018
£000 £000
Revenue Grants Credited to Services
(154,067) Dedicated Schools Grant (153,224)
(55,391) Rent Allowances (54,280)
(30,252) Rent Rebates (27,360)
(16,194) Public Health Grant (main) (15,788)
(9,305) Pupil Premium Grant (8,720)
(2,630) Education Services Grant (816)
(2,811) Challney Girls PFI - EFA Funding (2,811)
(2,701) Infant Free School Meals Grant (2,678)
(1,668) Weekly Collection Support Scheme (1,068)
(1,170) HB Admin subsidy (1,098)
(635) Troubled Families Initiative (747)
(594) Disc. Rent All. Ben. Sub. (previously "other") (1,085)
0 Homelessness Support Grant (2,728)
0 Improved Better Care Fund (3,844)
(573) Unaccompanied Asylum Seeker Grant (previously "other")
(1,033)
0 Adult Learning- Education Skills Fund (2,092)
(9,209) Other Grants & Contributions (10,482)
(287,200) Total Revenue Grants Credited to Services (289,853)
Capital Grants Credited to Services
(1,035) Disabled Facilities Grant (1,201)
(108) Other Contributions to House Renovation Grants (144)
(61) Other Capital Grants - Education (417)
(1,204) Total Capital Grants Credited to Services (1,762)
(288,404) Total Grants Credited to Services (291,616)

P a g e | 58
NOTE 12) DEDICATED SCHOOLS GRANT
The Council’s expenditure on schools is funded by the Dedicated Schools Grant (DSG) from the Department for Education. An element of DSG is recouped by the
Department to fund academy schools in the Council’s area. The grant can only be applied to meet net expenditure properly included with the ring-fenced schools budget,
as defined in the Schools Finance (England) Regulations 2011. The schools budget includes the Individual Schools Budget, which is divided into a budget for each school
and a budget for a range of services provided on a council wide basis. The two elements are required to be accounted for on a separate basis.
Details of the deployment of DSG receivable for 2017/18 are as follows:
2016/17 2017/18 Individual Individual
Central Schools Central Schools Expenditure Budgets Total Expenditure Budgets Total
£000 £000 £000 £000 £000 £000
21,948 186,121 208,069 Final DSG before Academy Recoupment 27,253 190,265 217,518
(54,671) (54,671) Academy figure recouped 0 (64,132) (64,132)
21,948 131,450 153,398 Total DSG after Academy Recoupment 27,253 126,133 153,386
1,666 1,666 Brought forward from previous year 1,123 0 1,123
0 Carry-forward to next year agreed in advance 0 0 0
23,614 131,450 155,064 Agreed initial budgeted distribution in this year 28,376 126,133 154,509
125 125 In year adjustments (162) 0 (162)
23,739 131,450 155,189 Final budgeted distribution for this year 28,214 126,133 154,347
(22,616) (22,616) Actual Central Expenditure for this year (25,093) 0 (25,093)
(131,450) (131,450) Actual ISB deployed to schools 0 (126,133) (126,133)
0 Local authority contribution for this year 0 0 0
1,123 0 1,123 DSG Underspend carried forward 3,121 0 3,121

P a g e | 59
NOTE 13) MATERIAL ITEMS OF INCOME AND EXPENDITURE
This note identifies material items of income and expenditure.
£7.350 million upward revaluation of the Housing Revenue Account Council
Dwellings, £61.759 million in 2016/17 (see Note 23)
£20.349 million upward revaluation of educational assets total, £32.500
million in 2016/17. This was based on £1.928 million schools revalued and
£18.421 million indexing schools not formally revalued.
£36.218 million of depreciation has been charged across the General Fund
and Housing revenue Account, £39.802 million in 2016/17 (see Note 23)
£19.5 million dividend from our wholly owned subsidiary, London Luton
Airport Ltd, £17.800 million in 2016/17 (see Note 9).
NOTE 14) MEMBER ALLOWANCES
The Council paid the following amounts to members of the Council during
2017/18:
2016/17 2017/18
£000 £000
Member Allowances 441 441
Member Expenses 4 5
Total 445 446
NOTE 15) EXTERNAL AUDIT COSTS
The Council has incurred the following costs in relation to the audit of the
Statement of Accounts, certification of grant claims and for non-audit services
provided by the Council’s External Auditors (Ernst & Young LLP) and their
previous auditor (Grant Thornton):
2016/17 2017/18
£000 £000
Fees payable to Ernst & Young LLP with regard to external audit services carried out by the appointed auditor
122 122
Fees payable to Ernst & Young LLP for the certification of grant claims and returns
28 18
Fees payable to Grant Thornton for the certification of grant claims and returns
6 6
External Audit Costs Total 156 147
No accrual has been made for disputed 2016/17 and 2017/18 audit fees.

P a g e | 60
NOTE 16) SENIOR OFFICER REMUNERATIONS
The remuneration of senior employees, defined as those who are members of the Corporate Leadership Management Team, those holding statutory posts, or those whose
remuneration £150,000 or more per year, was as set out below.
Post Holder
Salary
Employers pension
contributions Compensation for
loss of office Total
Remuneration
£000 £000 £000 £000
2016/17
Chief Executive (Trevor Holden)* 205 25 0 230
Corporate Director, Customer and Commercial 129 17 0 146
Corporate Director, People 129 17 0 146
Corporate Director, Place and Infrastructure 119 16 0 135
Corporate Director, Public Health, Commissioning and Procurement 114 16 0 130
Corporate Director, Housing & Community Living Deleted Jun 2016 30 2 0 32
Service Director, Human Resources and Monitoring Officer 86 12 0 98
Service Director, Finance and Audit, Section 151 Officer 81 11 0 92
Total 2016/17 Remuneration 893 116 0 1,009
2017/18
Chief Executive (Trevor Holden)* 195 33 0 228
Corporate Director, Customer and Commercial 130 22 0 151
Corporate Director, People Start Jan 2018 27 4 0 31
Corporate Director, People Ended Nov 2017 80 13 0 93
Corporate Director, Place and Infrastructure 123 20 0 143
Corporate Director, Public Health, Commissioning and Procurement 121 17 0 137
Service Director, Human Resources and Monitoring Officer 86 15 0 101
Service Director, Finance and Audit, Section 151 Officer 83 14 0 97
Total 2017/18 Remuneration 845 138 0 983
*Chief Executives’ salary for 2017/18 includes election allowances totalling £6,444 (£18,918 in 2016/17).
Due to a restructuring of posts, the role of Corporate Director, Housing & Community Living was deleted in June 2016, so does not occur in 2017/18.
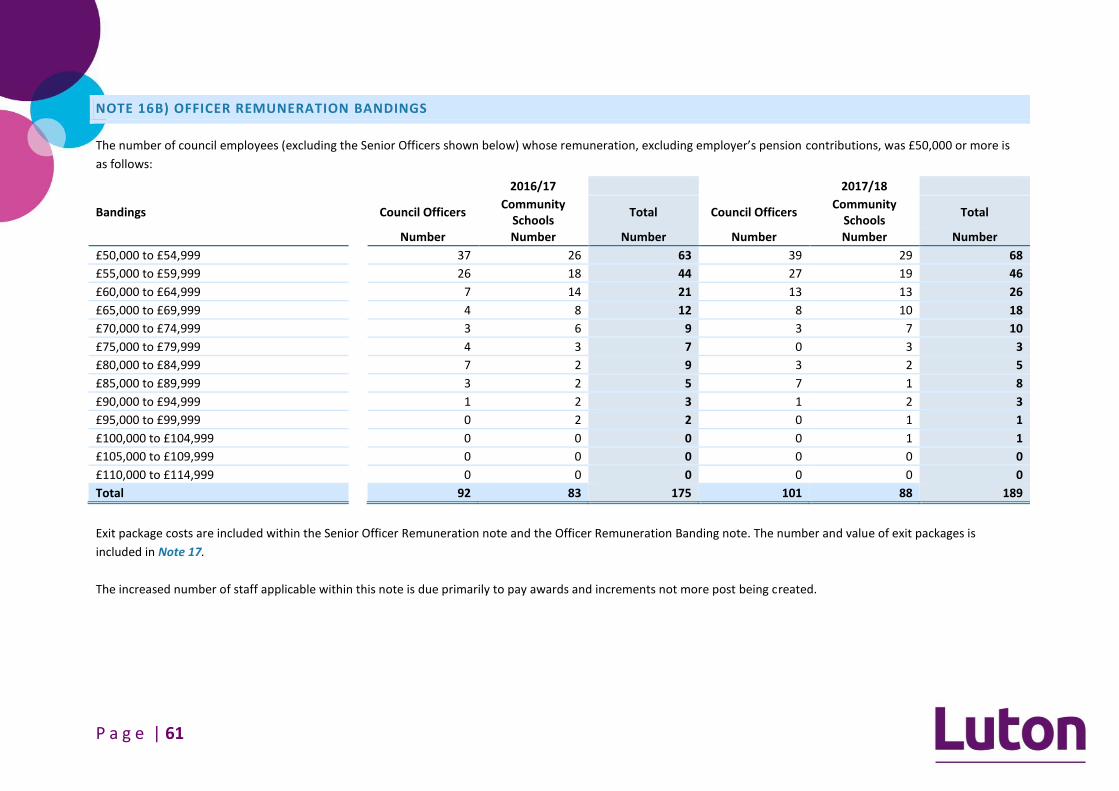
P a g e | 61
NOTE 16B) OFFICER REMUNERATION BANDINGS
The number of council employees (excluding the Senior Officers shown below) whose remuneration, excluding employer’s pension contributions, was £50,000 or more is
as follows:
2016/17
2017/18
Bandings Council Officers Community
Schools Total Council Officers
Community Schools
Total
Number Number Number Number Number Number
£50,000 to £54,999 37 26 63 39 29 68
£55,000 to £59,999 26 18 44 27 19 46
£60,000 to £64,999 7 14 21 13 13 26
£65,000 to £69,999 4 8 12 8 10 18
£70,000 to £74,999 3 6 9 3 7 10
£75,000 to £79,999 4 3 7 0 3 3
£80,000 to £84,999 7 2 9 3 2 5
£85,000 to £89,999 3 2 5 7 1 8
£90,000 to £94,999 1 2 3 1 2 3
£95,000 to £99,999 0 2 2 0 1 1
£100,000 to £104,999 0 0 0 0 1 1
£105,000 to £109,999 0 0 0 0 0 0
£110,000 to £114,999 0 0 0 0 0 0
Total 92 83 175 101 88 189
Exit package costs are included within the Senior Officer Remuneration note and the Officer Remuneration Banding note. The number and value of exit packages is
included in Note 17.
The increased number of staff applicable within this note is due primarily to pay awards and increments not more post being created.

P a g e | 62
NOTE 17) EXIT PACKAGES
ACCOUNTING POLICY
Termination benefits are amounts payable as a result of a decision by the Council to terminate an officer’s employment before the normal retirement date or an office’s
decision to accept voluntary redundancy and are charged on an accruals basis to the relevant service line in which the employee worked in the Comprehensive Income and
Expenditure Statement.
Where termination benefits involve the enhancement of pensions, statutory provisions require the General Fund balance to be charged with the amount payable by the
Council to the pension fund or pensioner in the year, not the amount calculated according to the relevant accounting standards. In the Movement in Reserves Statement,
appropriations are required to and from the Pensions Reserve to remove the notional debits and credits for pension enhancement termination benefits and replace them
with debits for the cash paid to the pension fund and pensioners and any such amounts payable, but unpaid at the year-end.
The Council will recognise a termination benefit at the earlier of the following
dates:
when the authority can no longer withdraw the offer of those benefits, and
when the authority recognises costs for a restructuring that is within the
scope of section 8.2 of the Code and IAS 37 and involves the payment of
termination benefits.
The Council terminated the contract of a number of employees in 2017/18,
liabilities of £0.748 million (£0.907 million in 2016/17). The exit packages
included in the accounts are set out in the table opposite.
Number of Exit
Packages
Number of Exit
Packages
Cost of Exit
Packages
Cost of Exit
Packages Exit Package Cost Band
2016/17 2017/18 2016/17 2017/18
No. No. £000 £000
£0 to £20,000 56 69 381 400
£20,001 to £40,000 11 5 318 167
£40,001 to £60,000 4 2 208 93
£60,001 to £80,000 0 0 0 0
£80,001 to £100,000 0 1 0 88
Total 71 77 907 748
This consists of:
Voluntary Exits 31 12 571 127
Compulsory Exits 26 56 222 505
Other Exits 14 9 114 116
Total 71 77 907 748
The table includes exit packages relating to schools and external trusts. These exit package costs are all reflected in the Comprehensive Income and Expenditure Statement.
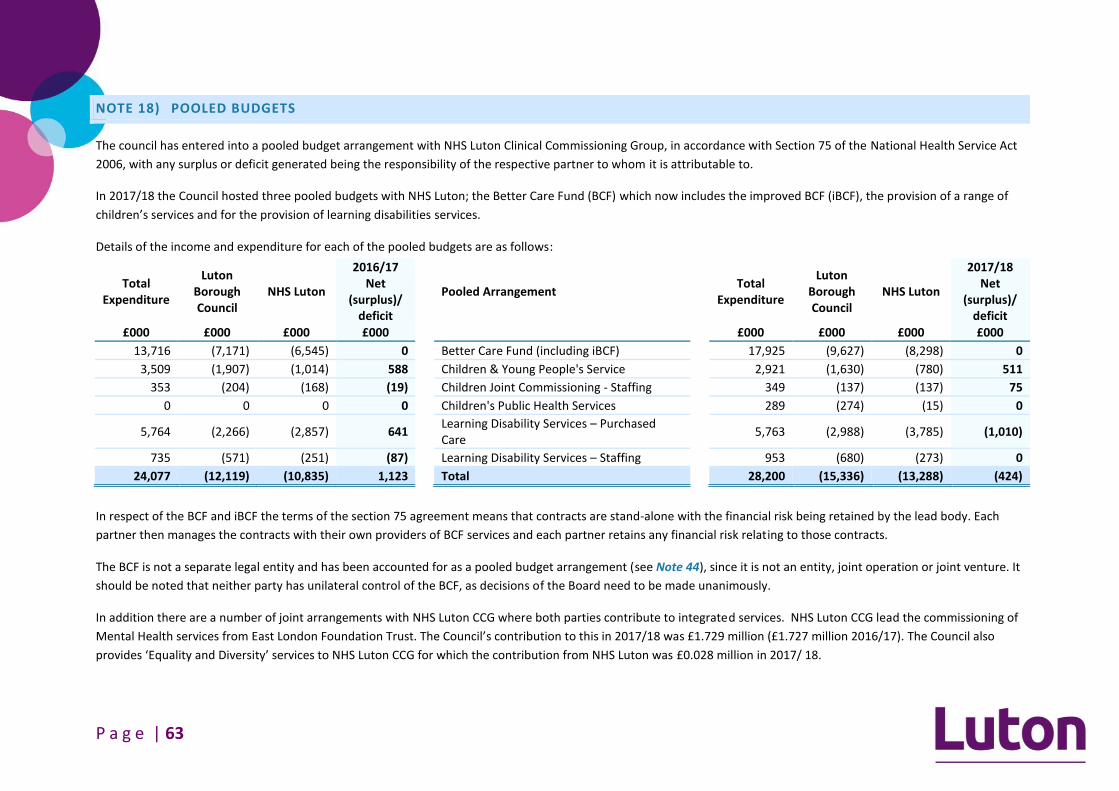
P a g e | 63
NOTE 18) POOLED BUDGETS
The council has entered into a pooled budget arrangement with NHS Luton Clinical Commissioning Group, in accordance with Section 75 of the National Health Service Act
2006, with any surplus or deficit generated being the responsibility of the respective partner to whom it is attributable to.
In 2017/18 the Council hosted three pooled budgets with NHS Luton; the Better Care Fund (BCF) which now includes the improved BCF (iBCF), the provision of a range of
children’s services and for the provision of learning disabilities services.
Details of the income and expenditure for each of the pooled budgets are as follows:
Total Expenditure
Luton Borough Council
NHS Luton
2016/17
Pooled Arrangement Total
Expenditure
Luton Borough Council
NHS Luton
2017/18 Net
(surplus)/ deficit
Net (surplus)/
deficit
£000 £000 £000 £000 £000 £000 £000 £000
13,716 (7,171) (6,545) 0 Better Care Fund (including iBCF) 17,925 (9,627) (8,298) 0
3,509 (1,907) (1,014) 588 Children & Young People's Service 2,921 (1,630) (780) 511
353 (204) (168) (19) Children Joint Commissioning - Staffing 349 (137) (137) 75
0 0 0 0 Children's Public Health Services 289 (274) (15) 0
5,764 (2,266) (2,857) 641 Learning Disability Services – Purchased Care
5,763 (2,988) (3,785) (1,010)
735 (571) (251) (87) Learning Disability Services – Staffing 953 (680) (273) 0
24,077 (12,119) (10,835) 1,123 Total 28,200 (15,336) (13,288) (424)
In respect of the BCF and iBCF the terms of the section 75 agreement means that contracts are stand-alone with the financial risk being retained by the lead body. Each
partner then manages the contracts with their own providers of BCF services and each partner retains any financial risk relating to those contracts.
The BCF is not a separate legal entity and has been accounted for as a pooled budget arrangement (see Note 44), since it is not an entity, joint operation or joint venture. It
should be noted that neither party has unilateral control of the BCF, as decisions of the Board need to be made unanimously.
In addition there are a number of joint arrangements with NHS Luton CCG where both parties contribute to integrated services. NHS Luton CCG lead the commissioning of
Mental Health services from East London Foundation Trust. The Council’s contribution to this in 2017/18 was £1.729 million (£1.727 million 2016/17). The Council also
provides ‘Equality and Diversity’ services to NHS Luton CCG for which the contribution from NHS Luton was £0.028 million in 2017/ 18.

P a g e | 64
NOTE 19) TRADING AND OTHER INVESTMENT ACTIVITIES
This note incorporates the net (profit) or loss of the Council’s trading units and the centrally managed insurance accounts (£0.974 million deficit). The Council’s trading
units (profit) or loss for 2017/18 is summarised below:
2016/17 2017/18
Turnover Expenditure (Surplus)/
Deficit Description Turnover Expenditure
(Surplus)/ Deficit
£000 £000 £000 £000 £000 £000
(18,026) 18,250 224 Housing maintenance (20,619) 21,536 917
(1,845) 1,640 (205) Insurance (1,603) 1,817 214
(9,281) 9,166 (115) Schools catering service (9,234) 9,547 313
(4,046) 3,716 (330) Property design and maintenance (3,350) 3,033 (317)
(2,481) 2,307 (174) Other trading units (2,520) 2,367 (153)
(35,679) 35,079 (600) Total (37,326) 38,300 974
0 (869) (869) Credit approval arrangements 0 0 0
(35,679) 34,210 (1,469) Total (37,326) 38,300 974
The £0.917 million deficit of ‘Housing maintenance’ is due to £1.240 million accounting adjustments, predominantly £1.190 million for pensions. Without these the service
would have made a surplus.
For 2017/18 the ‘Property Design and Maintenance has been partially re-assessed as not meeting the terms of the Code to be classified as a trading operation, no prior
period adjustment has been made based on the immateriality of the 2016/17 amount (£0.7 million net).
For 2017/18 the ‘Credit Approval Arrangements’ has been re-assessed as not meeting the terms of the Code to be classified as a trading operation, no prior period
adjustment has been made based on the immateriality of the 2016/17 amount (a £0.869 million credit only).

P a g e | 65
MOVEMENT IN RESERVES STATEMENT SUPPORTING NOTES
NOTE 20) ADJUSTMENTS BETWEEN ACCOUNTING BASIS AND FUNDING BASIS UNDER REGULATIONS
This note details the adjustments that are made to the total comprehensive income and expenditure recognised by the Council in the year in accordance with proper
accounting practice to the resources that are specified by statutory provisions as being available to the Council to meet future capital and revenue expenditure. X
2016/17
2017/18
General Fund
Reserves
Housing Revenue Account
Major Repairs Reserve
Capital Receipts Reserve
Capital Grants
Unapplied
Unusable Reserves
General
Fund Reserves
Housing Revenue Account
Major Repairs Reserve
Capital Receipts Reserve
Capital Grants
Unapplied
Unusable Reserves
£000 £000 £000 £000 £000 £000 £000 £000 £000 £000 £000 £000
Rev. of Accounting Charges for Capital
(29,575) (10,227) 0 0 0 39,802 Charges for depreciation and impairment of non-current assets
(25,711) (10,506) 0 0 0 36,218
(324) 0 0 0 0 324 Amortisation of intangible assets (261) 0 0 0 0 261
(3,292) 11,997 0 0 0 (8,705) Revaluation losses on Property, Plant and Equipment
(7,300) (6,321) 0 0 0 13,621
671 (177) 0 0 0 (494) Movements in the market value of Investment Properties
5,396 (2,167) 0 0 0 (3,229)
(2,443) 0 0 0 0 2,443 Revenue Expenditure funded Capital under Statute
(2,192) 0 0 0 0 2,192
(35,927) (5,498) 0 0 0 41,425 Non-current assets written off on disposal or sale as part of the gain/loss on disposal
(4,288) (5,573) 0 4 0 9,858
X
X

P a g e | 66
2016/17
2017/18
General Fund
Reserves
Housing Revenue Account
Major Repairs Reserve
Capital Receipts Reserve
Capital Grants
Unapplied
Unusable Reserves
General
Fund Reserves
Housing Revenue Account
Major Repairs Reserve
Capital Receipts Reserve
Capital Grants
Unapplied
Unusable Reserves
£000 £000 £000 £000 £000 £000 £000 £000 £000 £000 £000 £000
External Capital Financing Adjustments
21,737 226 0 0 0 (21,963) Capital grants and contributions applied to CAA
8,605 437 0 0 0 (9,042)
5,370 0 0 0 (5,370) 0
Capital grants and contributions unapplied recognised in year
5,060 0 0 0 (5,060) 0
0 0 0 0 6,760 (6,760) Application of grants to capital financing transferred to the Capital Adjustment Account
0 0 0 0 6,570 (6,570)
1,425 7,550 0 (8,975) 0 0 Transfer of cash sale proceeds credited as part of the gain/loss on disposal
7,437 6,128 0 (13,565) 0 0
0 (124) 0 124 0 0 Contribution from the Capital Receipts Reserve towards administrative costs of disposals
0 (92) 0 92 0 0
(658) 0 0 658 0 0 Contribution from Capital Receipts to be paid to the government capital receipts pool
(651) 0 0 651 0 0
0 0 0 (1,017) 0 1,017 Transfer from Deferred Capital Receipts Reserve upon receipt of cash
0 0 0 (5) 0 5
0 0 0 3,098 0 (3,098) Use of the Capital Receipts Reserve to finance new capital expenditure
0 0 0 10,867 0 (10,867)
X
X

P a g e | 67
2016/17
2017/18
General Fund
Reserves
Housing Revenue Account
Major Repairs Reserve
Capital Receipts Reserve
Capital Grants
Unapplied
Unusable Reserves
General
Fund Reserves
Housing Revenue Account
Major Repairs Reserve
Capital Receipts Reserve
Capital Grants
Unapplied
Unusable Reserves
£000 £000 £000 £000 £000 £000 £000 £000 £000 £000 £000 £000
Capital Financing Requirement Funding
9,034 0 0 0 0 (9,034) Statutory prov. for repayment of debt 9,288 0 0 0 0 (9,288)
371 0 0 0 0 (371) Statutory provision for repayment of debt (PFI)
366 0 0 0 0 (366)
3,390 1,729 0 0 0 (5,119) Capital expenditure charged against the General Fund and HRA balances
5,413 1,603 0 0 0 (7,015)
0 9,965 (9,965) 0 0 0 Reversal of Major Repairs Allowance credited to the HRA
0 10,178 (10,178) 0 0 0
0 0 8,832 0 0 (8,832) Use of the Major Repairs Reserve to finance new capital expenditure
0 0 9,585 0 0 (9,585)
Other Statutory Adjustments
(8) 7 0 0 0 1 Amount by which finance costs differ from costs chargeable (statute)
59 5 0 0 0 (64)
(32,414) (325) 0 0 0 32,739 Reversal of items relating to retirement benefits debited or credited to the statement
(45,817) (1,044) 0 0 0 46,861
20,654 207 0 0 0 (20,861) Employer’s pensions contributions and direct payments to pensioners payable in the year
21,912 550 0 0 0 (22,462)
4,208 0 0 0 0 (4,208) Council Tax and NNDR income credited differs from income calculated in accordance with statute
2,471 0 0 0 0 (2,471)
452 18 0 0 0 (470) Officer remuneration charged on an accruals basis differs from amount chargeable under statute
(348) (15) 0 0 0 362
(37,329) 15,348 (1,133) (6,112) 1,390 27,836 Total Statutory Adjustments (20,561) (6,818) (593) (1,956) 1,509 28,418
X

P a g e | 68
NOTE 21) TRANSFER TO/FROM GENERAL FUND & HOUSING REVENUE ACCOUNT
This note reconciles the amounts transferred to and from the General Fund and Housing Revenue Account balances, including transfers to and from named earmarked
reserves. Earmarked reserves provide financing for future expenditure plans and the amounts posted back from earmarked reserves to meet General Fund and Housing
Revenue Account expenditure.
Reserves Description Balance at 1 April 2016
Transfers Out Transfers In Balance at 31 March 2017
Transfers Out Transfers In Balance at 31 March 2018
£000 £000 £000 £000 £000 £000 £000
General Fund
General Fund Reserve (14,021) 0 0 (14,021) 0 0 (14,021)
Earmarked Reserves
Invest to Save Reserve (3,990) 1,379 (1,899) (4,511) 16 (704) (5,199)
Specific Risk Management Reserve (2,970) 0 0 (2,970) 0 0 (2,970)
Service Provision Reserve (1,871) 770 (4,033) (5,134) 2,434 (2,860) (5,560)
Butterfield Profit Share Reserve (884) 200 (153) (837) 79 (281) (1,039)
Recession & Welfare Benefits Reserve (1,486) 15 0 (1,471) 0 0 (1,471)
Reorganisation Reserve (4,137) 211 (917) (4,843) 3,125 0 (1,718)
Major Projects Reserve (8,362) 0 0 (8,362) 0 0 (8,362)
Insurance Reserve (2,784) 0 (205) (2,989) 214 0 (2,775)
Capital Reserve (752) 298 0 (454) 0 (80) (534)
Pension Fund Reserve (4,459) 0 (1,425) (5,884) 117 0 (5,767)
Public Health Reserve (757) 757 (376) (376) 0 (61) (437)
Investment Reserve (1,799) 599 0 (1,200) 284 0 (916)
Funding Equalisation Reserve (1,037) 0 (5,066) (6,103) 853 (1,024) (6,274)
Specific Service Reserve (1,265) 542 0 (723) 11 (18) (730)
Luton Investment Framework Reserve 0 0 0 0 149 (2,900) (2,751)
Cremator Mercury Emissions Reserve 0 0 0 0 28 (171) (144)
Other Reserves (196) 0 0 (196) 0 0 (196)
Earmarked Reserves Total (36,749) 4,771 (14,074) (46,052) 7,309 (8,099) (46,843)
School Reserves (20,417) 3,570 0 (16,847) 2,413 (5,050) (19,484)
General Fund Total (71,187) 8,341 (14,074) (76,920) 9,723 (13,149) (80,348)

P a g e | 69
Reserves Description Balance at 1 April 2016
Transfers Out Transfers In Balance at 31 March 2017
Transfers Out Transfers In Balance at 31 March 2018
£000 £000 £000 £000 £000 £000 £000
Housing Revenue Account
HRA General Balance (8,189) 0 (122) (8,311) 0 0 (8,311)
HRA Earmarked Reserves
Legal Disputes Reserve (217) 0 (52) (269) 0 0 (269)
Revenue Contributions to Capital 0 0 (1,602) (1,602) 1,603 (2,069) (2,068)
HRA Earmarked Reserves Total (217) 0 (1,654) (1,871) 1,603 (2,069) (2,337)
House Revenue Account Total (8,406) 0 (1,776) (10,182) 1,603 (2,069) (10,647)
The Invest to Save Reserve is to be utilised for initiatives, which will reduce future revenue costs.
The Specific Risk Management Reserve is to actively manage risk management as this becomes increasingly important for all councils. As a result, part of the General
Reserve has been earmarked to cover potential loss of income, given the importance to the Council of its trading undertakings.
The Service Provision Reserve is earmarked for specific budget carry forward requests from 2017/18 to 2018/19.
The Butterfield Profit Share Reserve has been created in accordance with the agreement made with the operator of the Business Innovation Centre, the Council’s share of
the profit is held in this reserve for economic development.
The Welfare Reform and Recession Reserve (formerly the Recession Reserve) is intended for use for one-off developments and initiatives to prepare for and mitigate the
impact of Welfare Reform, as well as local issues arising as a consequence of the recession that impact on the Council’s key priorities.
The Reorganisation Reserve is to enable the Council to cover the costs of reorganisations required as a result of budget decisions. A number of approved savings will
involve reducing staff numbers and whilst the council aims to redeploy staff wherever possible, redundancy and early payment of pension may become due. This reserve
will be used to pay for such costs as they arise. £2.900 million of the £3.125 million transfer out of this reserve went to the Luton Investment Framework Reserve.
The Major Projects Reserve has been established in recognition of the scale of major construction projects, particularly infrastructure projects, being undertaken by the
Council, principally on the basis of fixed amounts of grant funding from central government. This also recognises that the conditions of grant could require some
repayment. The establishment of such a reserve was a recommendation of the Council’s Finance Review Group, who undertake the financial scrutiny function.
The Insurance Reserve helps to reduce cost of external insurance by self-insurance of certain risks, the reserve is held against claims, which may be received in future years.
The Capital Reserve holds contributions from the Income and Expenditure Account to fund future capital expenditure.
The Pension Fund Reserve is earmarked for reducing future pension liabilities and will be paid to the Bedfordshire Pension Fund.
The Public Health Reserve is held for supporting public health functions and is a requirement of the Public Health grant.
The Investment Reserve was set up to fund specific investment projects. Almost all the funds are committed.

P a g e | 70
The Funding Equalisation Reserve was set up to help address future fluctuations in major income sources such as business rates, new homes bonus & government grants.
The Specific Service Reserve was set up for specific services where spend is incurred over more than one year and equalisation is required.
The Luton Investment Framework Reserve was set up to promote economic development in the town. The £2.9 million was transferred from the Reorganisation Reserve.
The Cremator Mercury Emissions Reserve is earmarked for replacement of cremator equipment.
The HRA Revenue Contributions to Capital Reserve was created to hold HRA revenue contributions which have been set-a-side for specific future HRA capital schemes.
NOTE 22) UNUSABLE RESERVES
31/03/2017
31/03/2018
£000 £000
(234,583) Revaluation Reserve (note 22a) (267,313)
(631,918) Capital Adjustment Account (note 22b) (634,828)
392,653 Pensions Reserve (note 22c) 401,855
1,159 Financial Instruments Adj. Account (note 22d) 1,095
(16,943) Deferred Capital Receipts (note 22e) (16,938)
(923) Collection Fund Adjustment Account (note 22f) (3,394)
2,261 Accumulated Leave Reserve (note 22g) 2,623
(488,294) Total Unusable Reserves (516,900)
X
All unusable reserves are described below; the movements in year for all
reserves with a material balance are also disclosed.
NOTE 22A) REVALUATION RESERVE
The Revaluation Reserve includes the gains made by the Council arising from
increases in the value of its Property, Plant and Equipment. The balance is
reduced when assets with accumulated gains are:
revalued downwards or impaired and the gains are lost;
used in the provision of services and the gains are consumed through
depreciation;
disposed of and the gains are realised.
The reserve contains only revaluation gains accumulated since 1st
April 2007, the
date that the Reserve was created. Accumulated gains arising before that date
are consolidated into the balance on the Capital Adjustment Account. X
31/03/2017
31/03/2018
£000 £000
(146,464) Opening Balance (234,583)
(2,175) Opening Balance Adjustment 0
(148,639) Adjusted Opening Balance (234,583)
(101,127) Upward revaluation of assets (50,626)
5,748 Downward revaluation of assets 8,799
(95,379) (Surplus) or deficit on revaluation of non-current assets
(41,827)
9,435 Amount written off to the CAA 9,097
(234,583) Closing Balance (267,313) X

P a g e | 71
NOTE 22B) CAPITAL ADJUSTMENT ACCOUNT
31/03/2017 31/03/2018
£000 £000 £000 £000
(644,365) Opening Balance (631,918)
2,263 Opening Balance Adjustment* 0
(642,102) Adjusted Opening Balance (631,918)
Reversal of capital charges debited or credited to the CIES:
39,802 Charges for depreciation and impairment of non-current assets 36,218
2,443 Revenue expenditure funded from capital under statute 2,192
324 Amortisation of intangible assets 261
41,425 Non-current assets written off on disposal or sale as part of the gain/ loss on disposal to the CIES 9,858
(8,705) Revaluation losses on Property, Plant and Equipment 13,621
(494) Movements on Investment Properties (3,230)
74,795 Total reversal of capital charges debited or credited to the CIES 58,920
(9,435) Adjusting amounts written out of the Revaluation Reserve (9,097)
65,360 Net written out amount of the cost of non-current assets consumed in the year 49,823
Capital financing applied in the year:
(3,098) Use of the Capital Receipts Reserve to finance new capital expenditure (10,867)
(8,832) Use of the Major Repairs Reserve to finance new capital expenditure (9,585)
(21,963) Capital grants and contributions credited to the CIES that have been applied to capital financing (9,042)
(6,760) Application of grants to capital financing from the Capital grants Unapplied Account (6,570)
(9,034) Minimum Revenue Provision (9,288)
(371) Minimum Revenue Provision (PFI) (366)
(5,118) Capital expenditure charged against the general Fund and HRA balance (7,015)
(55,176) Total capital financing applied in year (52,733)
(631,918) Closing Balance (634,828)
* There was a 2016/17 opening balance adjustment for the Multi-Functional Device restatement of £0.088 million and the write off of unreconciled Revaluation Reserve
balances to the Capital Adjustment Account. This was created by misstated transactions in prior years. The £2.175 million adjustment did not warrant a prior period
adjustment.

P a g e | 72
The Capital Adjustment Account absorbs the timing differences arising from the
different arrangements for accounting for the consumption of non-current assets
and for financing the acquisition, construction or enhancement element of those
assets under statutory provisions. The account is debited with the cost of
acquisition, construction or enhancement as depreciation, impairment losses and
amortisations are charged to the Comprehensive Income and Expenditure
Statement (with reconciling postings from the Revaluation Reserve to convert
fair value figures to a historical cost basis). The Account is credited with the
amounts set aside by the Council as finance for the costs of acquisition,
construction and enhancement.
The Account contains accumulated gains and losses on Investment Properties
and gains recognised on donated assets that have yet to be consumed by the
Council.
The Account also contains revaluation gains accumulated on Property, Plant and
Equipment before April 2007, the date that the Revaluation Reserve was created
to hold such gains.
NOTE 22C) PENSIONS RESERVE
The Pensions Reserve absorbs the timing differences arising from the different
arrangements for accounting for post-employment benefits and for funding
benefits in accordance with statutory provisions. The Council accounts for post-
employment benefits in the Comprehensive Income and Expenditure Statement
as the benefits are earned by employees accruing years of service, updating the
liabilities recognised to reflect inflation, changing assumptions and investment
returns on any resources set aside to meet the costs.
However, statutory arrangements require benefits earned to be financed as the
Council makes employer’s contributions to the pension fund or eventually pay
any pension for which it is directly responsible. The debit balance on the
Pensions Reserve therefore shows a substantial shortfall in the benefits earned
by past and current employees and the resources the Council has set aside to
meet them. The statutory arrangements will ensure that funding will have been
set aside by the time the benefits are due for payment. X
31/03/2017
31/03/2018
£000 £000
303,904 Opening Balance 392,653
32,739
Reversal of net charges made to the Surplus or Deficit for the Provision of Services for post-employment benefits in accordance with the Code
46,861
(20,861) Actual amount charged against the General Fund Balance for pensions in the year
(22,461)
11,878 Total Movement in Reserves transfers to reserve
24,400
76,871
Re-measurements of the net defined benefit liability debited or credited to Other Comprehensive Income & Expenditure Statement
(15,198)
392,653 Closing Balance 401,855
Further information on the Pension Fund assets / liabilities can be found Note 33.
NOTE 22D) FINANCIAL INSTRUMENTS ADJUSTMENT ACCOUNT
The Financial Instrument Adjustment Account absorbs the timing differences
arising from the different arrangements for accounting for income and
expenditure relating to certain financial instruments and for bearing losses or
benefitting from gains per statutory provisions. The Council uses the Account to
manage premiums paid and discounts received on the early redemption of loans.
Premiums are debited and discounts are credited to the Comprehensive Income
and Expenditure Statement when they are incurred, but reversed out of the

P a g e | 73
General Fund Balance and Housing Revenue Account to the Account in the
Movement in Reserves Statement. Over time, the net expense is posted back to
the General Fund and Housing Revenue Account balances in accordance with
statutory arrangements.
NOTE 22E) DEFERRED CAPITAL RECEIPTS
This reserve holds the gains recognised on the disposal of non-current assets but
for which cash settlement has yet to take place. Under statutory arrangements,
the Council does not treat these gains as usable for financing new capital
expenditure until they are backed by cash receipts. When the deferred cash
settlement eventually takes place, amounts are transferred to the Capital
Receipts Reserve. X
31/03/2017 Deferred Capital Receipts
31/03/2018
£000 £000
(17,960) Opening Balance (16,943)
0 Transfer of deferred sale proceeds credited as part of the gain/loss on disposal to the CIES
0
1,017 Transfer to the Capital Receipts Reserve upon receipt of cash
5
(16,943) Closing Balance (16,938)
NOTE 22F) COLLECTION FUND ADJUSTMENT ACCOUNT
This reserve manages the differences arising from the recognition of council tax
and business rates income in the Comprehensive Income and Expenditure
Statement as it falls due from taxpayers compared with the statutory
arrangements for paying across amounts to the General Fund from the Collection
Fund. X
31/03/2017 Collection Fund Adjustment Account
31/03/2018
£000 £000
3,286 Opening Balance (923)
(2,097)
Amount by which council tax income credited to the CIES is different from council tax income calculated for the year in accordance with statutory requirements
(223)
(2,112)
Amount by which non-domestic rates income credited to the CIES is different from non-domestic rates income calculated for the year in accordance with statutory requirements
(2,248)
(923) Closing Balance (3,394)
Please refer the Collection Fund Statements for more information.
NOTE 22G) ACCUMULATED ABSENCES ACCOUNT
This reserve absorbs the differences that would otherwise arise on the General
Fund Balance from accruing for compensated absences earned but not taken in
the year e.g. annual leave entitlement carried forward at 31st
March. Statutory
arrangements require that the impact on the General Fund Balance is neutralised
by transfers to or from the Account.
There has been a £0.362 million increase in the 2017/18 statement value.

P a g e | 74
BALANCE SHEET SUPPORTING NOTES
NOTE 23) PROPERTY, PLANT & EQUIPMENT
ACCOUNTING POLICY
Assets that have physical substance and are held for use in the production or
supply of goods or services, for rental to others, or for administrative purposes
and that are expected to be used during more than one financial year are
classified as Property, Plant and Equipment.
Recognition
Expenditure on the acquisition of, creation or enhancement of Property, Plant
and Equipment is capitalised on an accruals basis, provided that it is probable
that the future economic benefits or service potential associated with the item
will flow to the Council and the cost of the item can be measured reliably.
Expenditure that maintains, but does not add to an asset’s potential to deliver
future economic benefits or service potential (i.e. routine repairs and
maintenance) is charged as an expense when it is incurred.
Measurement
Property, Plant and Equipment is capitalised if it is capable of being used for
more than one year and items individually have a cost of at least £10,000. They
are also capitalised if collectively they have a cost of at least £10,000, where the
assets are functionally interdependent, they have broadly simultaneous purchase
dates and expected disposal dates and are under single managerial control.
Assets are initially valued at cost, comprising:
the purchase price.
any costs attributable to bringing the asset to the location and condition
necessary for it to be capable of operating in the manner intended by
management.
The cost of assets acquired other than by purchase is deemed to be its fair value,
unless the acquisition does not have commercial substance (i.e. it will not lead to
a variation in the cash flows of the Council). In the latter case, where an asset is
acquired via an exchange, the cost of the acquisition is the carrying amount of
the asset given up by the Council.
Donated assets are measured initially at fair value. The difference between fair
value and any consideration paid is credited to the Taxation and Non-specific
Grant Income line of the Comprehensive Income and Expenditure Statement,
unless the donation has been made conditionally. Until conditions are satisfied,
the gain is held in a Donated Assets Account. Where gains are credited to the
Comprehensive Income and Expenditure Statement, they are reversed out of the
General Fund Balance to the Capital Adjustment Account in the Movement in
Reserves Statement.
Assets are then carried in the Balance Sheet using the following measurement
bases:
Infrastructure, community assets and assets under construction - historical
cost net of depreciation (community assets are not depreciated).
Council dwellings – current value, determined using the basis of existing
use value for social housing (EUV-SH) on the basis laid down by the DCLG,
i.e. open market value less a specified notified percentage known as the
social housing discount.
Council offices – current value, determined as the amount that would be
paid in its existing use (existing use value), except for a few offices that are
situated close to the council’s housing properties, where there is no market

P a g e | 75
for office accommodation and that are measured at depreciated
replacement cost (instant build) as an estimate of current value
School buildings – current value, but because of their specialist nature, are
measured at depreciated replacement cost, which is used as an estimate of
current value
Surplus assets – the current value measurement base is fair value,
estimated at highest and best use from a market participant’s perspective
All other assets – fair value, determined as the amount that would be paid
for the asset in its existing use.
Where there is no market-based evidence of current value because of the
specialist nature of an asset, depreciated replacement cost (i.e. the cost of
reconstructing the building on a modern equivalent basis less accumulated
depreciation), is used as an estimate of fair value.
Where non-property assets have short useful lives or low values (or both),
depreciated historical cost basis is used as a proxy for current value.
Assets included in the Balance Sheet at current value are revalued sufficiently
regularly to ensure that their carrying amount is not materially different from
their current value at the year-end, but as a minimum every five years. Increases
in valuations are matched by credits to the Revaluation Reserve to recognise
unrealised gains. Exceptionally, gains might be credited to the Comprehensive
Income and Expenditure Statement where they arise from the reversal of a loss
previously charged to a service.
Where decreases in value are identified, they are accounted for by:
Where there is a balance of revaluation gains for the asset in the
Revaluation Reserve, the carrying amount of the asset is written down
against that balance up to the amount of the accumulated gains.
Where there is no balance in the Revaluation Reserve or an insufficient
balance, the carrying amount of the asset is written down against the
relevant service line(s) in the Comprehensive Income and Expenditure
Statement.
The Revaluation Reserve contains revaluation gains recognised since 1 April 2007
only, the date of its formal implementation. Gains arising before that date have
been consolidated into the Capital Adjustment Account.
Impairment
Assets are assessed at each year-end as to whether there is any indication that
an asset may be impaired. Where indications exist and any possible differences
are estimated to be material, the recoverable amount of the asset is estimated
and, where this is less than the carrying amount of the asset, an impairment loss
is recognised for the shortfall.
Where impairment losses are identified, they are accounted for as follows:
If there is a balance of revaluation gains for the asset in the Revaluation
Reserve, the carrying amount of the asset is written down against that
balance (up to the amount of the accumulated gains).
If there is no balance in the Revaluation Reserve or an insufficient balance,
the carrying amount of the asset is written down against the relevant
service line(s) in the Comprehensive Income and Expenditure Statement.
Where an impairment loss is reversed subsequently, the reversal is credited to
the relevant service line(s) in the Comprehensive Income and Expenditure
Statement, up to the amount of the original loss, adjusted for depreciation that
would have been charged if the loss had not been recognised.
Depreciation
Depreciation is provided for on all Property, Plant and Equipment assets by the
systematic allocation of their depreciable amounts over their useful lives. An
exception is made for assets without a determinable finite useful life (i.e.
freehold land and certain Community Assets) and assets that are not yet
available for use (i.e. assets under construction).

P a g e | 76
Depreciation is calculated on the following bases:
Buildings - on a straight–line basis over their estimated useful lives. Assets
are depreciated over forty years, unless a different period is advised by the
Council’s Valuer.
Housing properties (dwelling and non-dwelling) - in accordance with
guidelines the Housing Revenue Account is charged an amount equivalent
to the depreciation charged on a straight line basis over its estimated useful
lives. The Council no longer uses the Major Repairs Allowance as a proxy for
Housing dwelling depreciation.
Infrastructure - depreciated on the straight-line method using asset lives of
up to sixty years.
Vehicles & Equipment - depreciated on a 25% reducing balance method.
From 2017/18 the Council will no longer depreciated for part years based on
date of purchase. The Council’s policy is to depreciate in full years only. Although
assets in the course of construction are not depreciated until the year in which
they are brought into use. The 2016/17 accounts included £1.749 million within
the total depreciation of £39.731 million, as part year depreciation.
Where an item of Property, Plant and Equipment asset has a new major
component after 1 April 2010 whose cost is significant in relation to the total cost
of the item, the component will be depreciated separately. Where significant,
components of existing assets are identified as part of the revaluation process.
Where a component is replaced or restored, the carrying amount of the old
component is derecognised to avoid double counting and the new component
reflected in the carrying amount. This recognition and de-recognition takes place
regardless of whether the replaced part had been depreciated separately. The
de-minimis level for this recognition and de-recognition is £150,000 (based on
the capital expenditure of the new component).
Revaluation gains are also depreciated, with an amount equal to the difference
between current value depreciation charged on assets and the depreciation that
would have been chargeable based on their historical cost being transferred each
year from the Revaluation Reserve to the Capital Adjustment Account.
The CIES therefore fully reflects the use of assets and the consumption of their
economic benefits in the provision of services.
Charges to Revenue for Non-Current Assets
Services, support services and trading accounts are debited with the following
amounts to record the cost of holding non-current assets during the year:
Depreciation attributable to the assets used by the relevant service.
Revaluation and impairment losses on assets used by the service where
there are no accumulated gains in the Revaluation Reserve against which
the losses can be written off.
The Council is not required to raise council tax to fund depreciation, revaluation
and impairment losses. However, it is required to make an annual contribution
from revenue, known as the Minimum Revenue Provision (MRP), towards the
reduction in its overall borrowing requirement. The MRP is calculated on a
prudent basis determined by the Council in accordance with statutory guidance.
Depreciation, revaluation and impairment losses are therefore replaced by the
MRP, by way of an adjusting transaction with the Capital Adjustment Account in
the Movement in Reserves Statement for the difference between the two.
Componentisation
The Code requires that each part of an item of property, plant and equipment
with a cost that is significant in relation to the total cost of the item is
depreciated separately. Within the Council’s asset portfolio there are a number
of asset classes where componentisation will not be considered, including:
Equipment – as this is considered immaterial
Asset classes which are not depreciated – such as land, investment
property, heritage assets, community assets, surplus assets and assets held
for sale.

P a g e | 77
The remaining assets, which are contained with the operational portfolio, are
often of a specialised nature such as schools and leisure centres. The Council
requires the valuation specialists to provide component information for each
asset which is then reviewed to assess if inclusion of different components will
have a material impact on depreciation.
Revenue Expenditure Funded from Capital under Statute
Expenditure incurred during the year that may be capitalised under statutory
provisions but that does not result in the creation of a non-current asset has
been charged as expenditure to the relevant service in the Comprehensive
Income and Expenditure Statement in the year. Where the Council has
determined to meet the cost of this expenditure from existing capital resources
or by borrowing, a transfer in the Movement in Reserves Statement from the
General Fund Balance to the Capital Adjustment Account then reverses out the
amounts charged so that there is no impact on the level of council tax.
Interest Capitalisation
The Council’s accounting policy includes the capitalisation of borrowing costs for
qualifying assets as it better reflects the costs of property, plant and equipment
and helps ensure that those benefiting from the use of the asset meet those
costs.
In applying the accounting policy, the Council has identified that the only scheme
which meets the qualifying asset definition is currently the Direct Air Rail Transit
scheme being developed by LLAL.
The council’s definition of a qualifying asset is an asset that incurs a material
amount of debt interest cost during the construction of the asset.
Borrowing costs for non-qualifying assets are charged to the Financing and
Investment Income and Expenditure line in the Comprehensive Income and
Expenditure Statement in the financial year in which they were incurred.
Effects of Changes in Estimates
In 2017/18 the Council made the decision to no longer depreciate non-current
assets for part years from the date of purchase, this is a change in the accounting
estimates.
Within the 2016/17 depreciation figure of £39.731 million under the policy of full
and part calculations, the split was;
£37.982 million full years (95.6%)
£1.749 million part years (4.4%)
This change in estimation technique is considered immaterial at 4.4% of the
depreciation total, so has not been retrospectively applied and restated in the
2016/17 accounts.
The change in estimation technique will still materially reflect the asset use, as
per Code requirements on this issue.
In 2017/18 the ability to the Major Repairs Allowance (MRA) as a proxy for the
annual depreciation charge for the HRA dwellings was removed. There has been
the need to develop a new methodology to calculate the annual depreciation
charge. The methodology is based on a 70:30 buildings to land ratio, an average
cost of all significant components (assumed to be halfway through their lives)
and a 60 year residual structure assumption. Using this revised methodology the
2017/18 depreciation charge is £10.178 million. This is estimated to be
approximately 4% higher than the previous MRA Proxy calculation.

P a g e | 78
Movements in Property, Plant & Equipment during 2017/18
Council Dwellings
Other Land and
Buildings
Vehicles, Plant,
Furniture & Equipment
Infrastructure Assets
Community Assets
Surplus Assets
Assets under Construction
Total Property, Plant &
Equipment
PFI Assets included in
PPE
£000 £000 £000 £000 £000 £000 £000 £000 £000
Cost or Valuation
At 1 April 2017 452,039 426,593 55,450 252,606 8,790 8,014 25,971 1,229,464 0
Embedded lease adjustment 0 0 0 0 0 0 0 0 0
Additions 10,006 14,342 6,790 6,252 22 126 11,689 49,226 0
Depreciation written out on revaluation (10,208) (7,395) 0 0 0 0 0 (17,603) 0
Revaluation increases/ (decreases) to RR 14,360 26,331 0 0 0 1,071 0 41,762 0
Revaluation increases/ (decreases) to the CIES (7,006) (7,300) 0 0 0 685 0 (13,621) 0
Derecognition – disposals (4,598) (4,828) (8,669) (50,616) 0 (1,680) 0 (70,391) 0
Derecognition – other 0 (208) (6) 0 0 0 0 (214) 0
Reclassifications- (to)/from other non-current assets 0 594 0 0 (32) 0 (4,119) (3,557) 0
Other movements in cost or valuation 9,901 (1,576) 1,035 0 0 4,460 (13,820) (0) 0
At 31 March 2018 464,495 446,553 54,600 208,242 8,780 12,676 19,721 1,215,066 0
Accumulated Depreciation & Impairment
At 1 April 2017 0 (17,485) (35,019) (78,007) 0 0 0 (130,512) 0
Embedded lease adjustment 0 0 0 0 0 0 0 0 0
Depreciation charge (10,205) (12,295) (5,418) (8,299) 0 0 0 (36,218) 0
Depreciation written out on revaluation 10,208 7,395 0 0 0 0 0 17,603 0
Derecognition – disposals 0 1,564 8,538 50,616 0 75 0 60,793 0
Derecognition – other 0 14 6 0 0 0 0 20 0
Assets reclassified within PPE (2) 80 0 0 0 (78) 0 0 0
At 31 March 2018 1 (20,727) (31,893) (35,690) 0 (3) 0 (88,314) 0
Net Book Value at 31 March 2017 452,039 409,108 20,431 174,599 8,790 8,014 25,971 1,098,952 0
Net Book Value at 31 March 2018 464,495 425,826 22,707 172,551 8,780 12,673 19,721 1,126,752 0
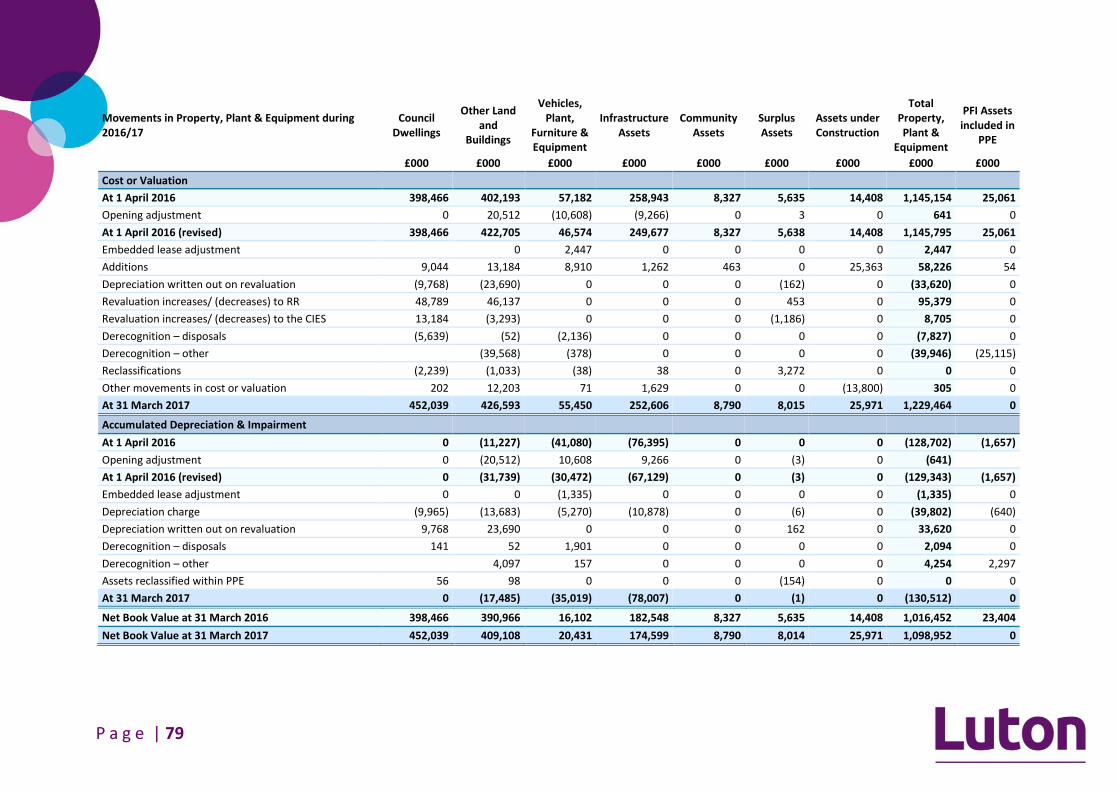
P a g e | 79
Movements in Property, Plant & Equipment during 2016/17
Council Dwellings
Other Land and
Buildings
Vehicles, Plant,
Furniture & Equipment
Infrastructure Assets
Community Assets
Surplus Assets
Assets under Construction
Total Property, Plant &
Equipment
PFI Assets included in
PPE
£000 £000 £000 £000 £000 £000 £000 £000 £000
Cost or Valuation
At 1 April 2016 398,466 402,193 57,182 258,943 8,327 5,635 14,408 1,145,154 25,061
Opening adjustment 0 20,512 (10,608) (9,266) 0 3 0 641 0
At 1 April 2016 (revised) 398,466 422,705 46,574 249,677 8,327 5,638 14,408 1,145,795 25,061
Embedded lease adjustment 0 00 2,447 00 00 00 00 2,447 00
Additions 9,044 13,184 8,910 1,262 463 00 25,363 58,226 54
Depreciation written out on revaluation (9,768) (23,690) 00 00 00 (162) 00 (33,620) 00
Revaluation increases/ (decreases) to RR 48,789 46,137 00 00 00 453 00 95,379 00
Revaluation increases/ (decreases) to the CIES 13,184 (3,293) 00 00 00 (1,186) 00 8,705 00
Derecognition – disposals (5,639) (52) (2,136) 00 00 00 00 (7,827) 00
Derecognition – other 0 (39,568) (378) 00 00 00 00 (39,946) (25,115)
Reclassifications (2,239) (1,033) (38) 38 00 3,272 00 0 00
Other movements in cost or valuation 202 12,203 71 1,629 00 00 (13,800) 305 00
At 31 March 2017 452,039 426,593 55,450 252,606 8,790 8,015 25,971 1,229,464 0
Accumulated Depreciation & Impairment
At 1 April 2016 0 (11,227) (41,080) (76,395) 0 0 0 (128,702) (1,657)
Opening adjustment 0 (20,512) 10,608 9,266 0 (3) 0 (641)
At 1 April 2016 (revised) 0 (31,739) (30,472) (67,129) 0 (3) 0 (129,343) (1,657)
Embedded lease adjustment 00 00 (1,335) 00 00 00 00 (1,335) 00
Depreciation charge (9,965) (13,683) (5,270) (10,878) 00 (6) 00 (39,802) (640)
Depreciation written out on revaluation 9,768 23,690 00 00 00 162 00 33,620 00
Derecognition – disposals 141 52 1,901 00 00 00 00 2,094 00
Derecognition – other 0 4,097 157 00 00 00 00 4,254 2,297
Assets reclassified within PPE 56 98 00 00 00 (154) 00 0 00
At 31 March 2017 0 (17,485) (35,019) (78,007) 0 (1) 0 (130,512) 0
Net Book Value at 31 March 2016 398,466 390,966 16,102 182,548 8,327 5,635 14,408 1,016,452 23,404
Net Book Value at 31 March 2017 452,039 409,108 20,431 174,599 8,790 8,014 25,971 1,098,952 0 X

P a g e | 80
REVALUATIONS
The Council carries out a programme that ensures that all significant classes of Property, Plant and Equipment required to be measured at fair value are revalued. The
2017/18 Investment Properties valuations and some freehold operational properties were carried out in-house by Chartered Surveyors in the Fixed Asset Division, all
members of the Royal Institute of Chartered Surveyors, as at 31st
March 2018.
The HRA housing stock valuations were carried out by DVS (Commercial Arm of the Valuation Office Agency).
The properties were classified as Property Plant and Equipment and were valued to Current Value in Existing Use using either the depreciated replacement costs
methodology (for specialised assets) or the investment method. Valuations of vehicles, plant, furniture and equipment are based on purchase prices.
Valuation method/date Council
Dwellings
Other Land &
Buildings
Vehicles, Plant,
Furniture &
Equipment
Infrastructure Assets
Community Assets
Surplus Assets
Assets under
Construction
Investment Property
Intangible Assets
Heritage assets
Total
£000 £000 £000 £000 £000 £000 £000 £000 £000 £000 £000
Held at Historic Cost 0 0 22,707 172,551 8,780 0 19,721 3 898 0 224,659
Held at Insurance Valuation
0 0 0 0 0 0 0 0 0 5,881 5,881
Valued at Current Value:
31-Mar-18 464,495 316,101 0 0 0 2,958 0 102,897 0 0 886,451
31-Mar-17 0 75,356 0 0 0 6,243 0 0 0 0 81,599
31-Mar-16 0 9,098 0 0 0 0 0 0 0 0 9,098
31-Mar-15 0 19,316 0 0 0 3,472 0 0 0 0 22,788
31-Mar-14 0 5,954 0 0 0 0 0 0 0 0 5,954
31-Mar-13 0 0 0 0 0 0 0 0 0 0 0
31-Mar-12 0 0 0 0 0 0 0 0 0 0 0
Total Cost or Valuation 464,495 425,826 22,707 172,551 8,780 12,673 19,721 102,900 898 5,881 1,236,431
X
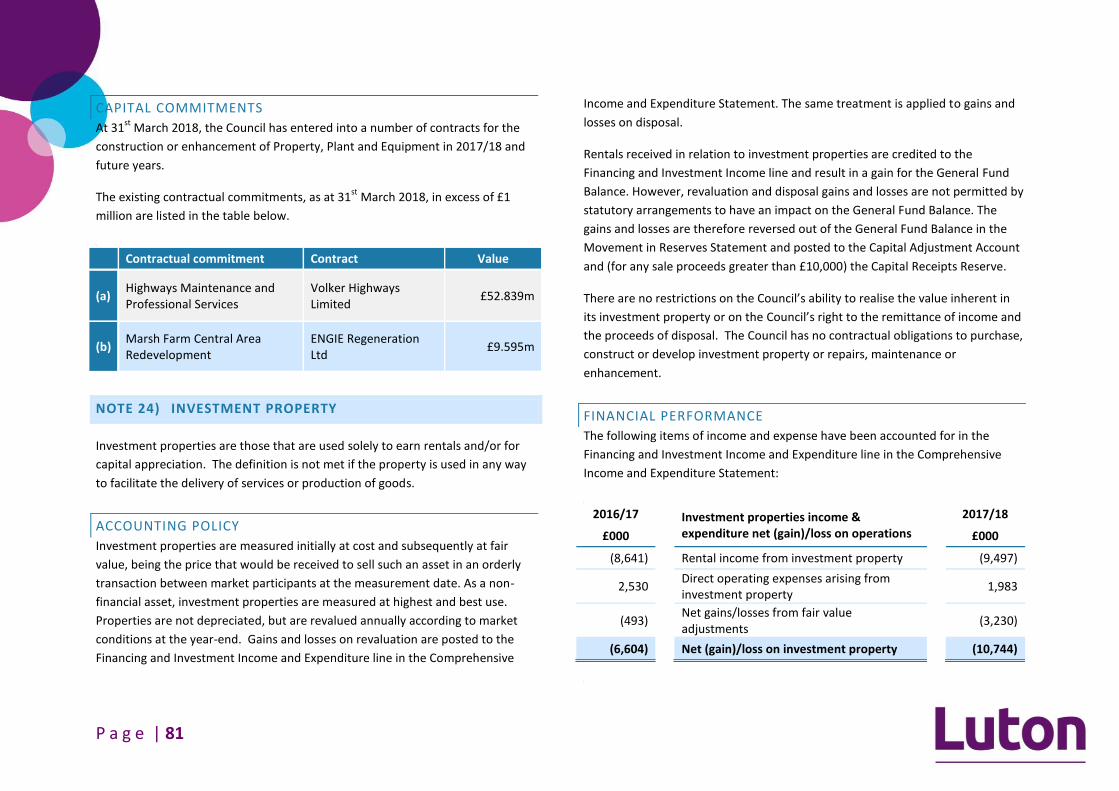
P a g e | 81
CAPITAL COMMITMENTS
At 31st
March 2018, the Council has entered into a number of contracts for the
construction or enhancement of Property, Plant and Equipment in 2017/18 and
future years.
The existing contractual commitments, as at 31st
March 2018, in excess of £1
million are listed in the table below.
X
Contractual commitment Contract Value
(a) Highways Maintenance and Professional Services
Volker Highways Limited
£52.839m
(b) Marsh Farm Central Area Redevelopment
ENGIE Regeneration Ltd
£9.595m
NOTE 24) INVESTMENT PROPERTY
Investment properties are those that are used solely to earn rentals and/or for
capital appreciation. The definition is not met if the property is used in any way
to facilitate the delivery of services or production of goods.
ACCOUNTING POLICY
Investment properties are measured initially at cost and subsequently at fair
value, being the price that would be received to sell such an asset in an orderly
transaction between market participants at the measurement date. As a non-
financial asset, investment properties are measured at highest and best use.
Properties are not depreciated, but are revalued annually according to market
conditions at the year-end. Gains and losses on revaluation are posted to the
Financing and Investment Income and Expenditure line in the Comprehensive
Income and Expenditure Statement. The same treatment is applied to gains and
losses on disposal.
Rentals received in relation to investment properties are credited to the
Financing and Investment Income line and result in a gain for the General Fund
Balance. However, revaluation and disposal gains and losses are not permitted by
statutory arrangements to have an impact on the General Fund Balance. The
gains and losses are therefore reversed out of the General Fund Balance in the
Movement in Reserves Statement and posted to the Capital Adjustment Account
and (for any sale proceeds greater than £10,000) the Capital Receipts Reserve.
There are no restrictions on the Council’s ability to realise the value inherent in
its investment property or on the Council’s right to the remittance of income and
the proceeds of disposal. The Council has no contractual obligations to purchase,
construct or develop investment property or repairs, maintenance or
enhancement.
FINANCIAL PERFORMANCE
The following items of income and expense have been accounted for in the
Financing and Investment Income and Expenditure line in the Comprehensive
Income and Expenditure Statement:
X
2016/17 Investment properties income & expenditure net (gain)/loss on operations
2017/18
£000 £000
(8,641) Rental income from investment property (9,497)
2,530 Direct operating expenses arising from investment property
1,983
(493) Net gains/losses from fair value adjustments
(3,230)
(6,604) Net (gain)/loss on investment property (10,744)
X

P a g e | 82
MOVEMENT IN FAIR VALUE
The fair value of the authority’s investment property is measured annually at
each reporting date. All valuations are carried out internally by qualified RICS
Registered Valuers in accordance with valuation methodologies as set out in the
Royal Institution of Chartered Surveyors Professional Standards (the ‘Red Book’).
The authority’s valuers work closely with the finance officers reporting directly to
the Service Director, Finance and Audit on a regular basis regarding all financial
matters.
The following table summarises the movement in the fair value of investment
properties over the year:
X
31/03/2017 Investment properties movement in value
31/03/2018
£000 £000
79,558 Opening Balance 90,349
10,602 Additions - Purchases 5,839
0 Disposals (43)
494 Total gains/losses in Surplus or Deficit on the Provision of Services resulting from changes in the fair value
3,230
(305) Transfers (to/from Inventories or PPE) 3,524
90,349 Balance at end of the year 102,900
X
More information on fair values is included in Note 45.
NOTE 25) INTANGIBLE ASSETS
Expenditure on non-monetary assets that do not have physical substance but are
controlled by the Council as a result of past events (e.g. software licences) is
capitalised when it is expected that future economic benefits or service potential
will flow from the intangible asset to the Council.
ACCOUNTING POLICY
Intangible assets are measured initially at cost. Amounts are only revalued where
the fair value of the assets held by the Authority can be determined by reference
to an active market. In practice, no intangible asset held by the Authority meets
this criterion, and they are therefore carried at amortised cost. The depreciable
amount of an intangible asset is amortised over its useful life to the relevant
service lines in the Comprehensive Income and Expenditure Statement.
An asset is tested for impairment whenever there is an indication that the asset
might be impaired – any losses recognised are posted to the relevant service
lines in the Comprehensive Income and Expenditure Statement. Any gain or loss
arising on the disposal or abandonment of an intangible asset is posted to the
Other Operating Expenditure line in the Comprehensive Income and Expenditure
Statement.
Where expenditure on intangible assets qualifies as capital expenditure for
statutory purposes, amortisation, impairment losses and disposal gains and
losses are not permitted to have an impact on the General Fund Balance. The
gains and losses are therefore reversed out of the General Fund Balance in the
Movement in Reserves Statement and posted to the Capital Adjustment Account
and (for any sale proceeds greater than £10,000) the Capital Receipts Reserve.

P a g e | 83
MOVEMENT IN ASSET VALUES
The movement in Intangible Assets is included in the table below:
2016/17 Movement in intangible assets
2017/18
£000 £000
Balance at start of year:
1,640 Gross carrying amount 1,763
(394) Accumulated amortisation (718)
1,246 Net carrying amount 1,045
123 Additions 114
0 Reclassifications to/from PPE 0
(324) Amortisation for the period (261)
Balance at end of year:
1,763 Gross carrying amount 1,877
(718) Accumulated amortisation (979)
1,045 Net carrying amount 898
There are no internally generated intangible assets held by the Council.
NOTE 26) ASSETS HELD FOR SALE
ACCOUNTING POLICY
When it becomes probable that the carrying amount of an asset will be
recovered principally through a sale transaction rather than through its
continuing use, it is reclassified as an Asset Held for Sale. The asset is re-valued
immediately before reclassification and then carried at the lower of the amount
and fair value less costs to sell. Where there is a subsequent decrease to fair
value less costs to sell, the loss is posted to the Other Operating Expenditure line
in the Comprehensive Income and Expenditure Statement.
Gains in fair value are recognised only up to the amount of any previous losses
recognised in the Surplus or Deficit on Provision of Services. Depreciation is not
charged on the Assets Held for Sale.
The Council currently has no assets which meets the definition of an Asset Held
for Sale. Assets earmarked for transfer to Foxhall Homes Ltd have been classified
as surplus assets, not held for sale.
NOTE 27) HERITAGE ASSETS
ACCOUNTING POLICY
The carrying amounts of heritage assets are based on insurance valuations and
are reviewed where there is evidence of impairment for heritage assets, e.g.
where an item has suffered physical deterioration or breakage or where doubts
arise as to its authenticity. Any impairment is recognised and measured in
accordance with the Council’s general policies on impairment. If it is agreed to
dispose of any heritage assets the proceeds are accounted for in accordance with
the Council’s general provisions relating to the disposal of property, plant and
equipment. Disposal proceeds are disclosed separately in the notes to the
financial statements and are accounted for in accordance with statutory
accounting requirements relating to capital expenditure and capital receipts.
The assets held include the Mossman Collection of horse-drawn vehicles, the
Shillington Hoard coin collection and the Wenlok Jug. There are various other
photographic and furniture collections among the heritage assets held by the
Council.
There has been no significant movement in the value of Heritage Assets during
2017/18. No Heritage Asset has been re-insured.

P a g e | 84
NOTE 28) CAPITAL EXPENDITURE AND CAPITAL FINANCING
The total amount of capital expenditure incurred in the year is shown in the table
below, together with the resources that have been used to finance it. Where
capital expenditure is to be financed in future years by charges to revenue as
assets are used by the Council, the expenditure results in an increase in the
Capital Financing Requirement (CFR), a measure of the capital expenditure
incurred historically by the Council that has yet to be financed. The CFR is
analysed in the second part of this note.
2016/17 Movement in the CFR
2017/18
£000 £000
385,236 Opening Capital Financing Requirement 407,654
Capital investment
58,226 Property, Plant and Equipment (Note 23) 49,226
10,602 Investment Properties (Note 24) 5,839
123 Intangibles (Note 25) 114
2,443 Revenue Expenditure Funded from Capital under Statute (Note 22b)
2,192
5,000 London Luton Airport Limited Debenture Loan 10,000
1,200 Embedded lease adjustment 0
Sources of finance
(3,098) Capital Receipts (Note 22b) (10,867)
(28,723) Government Grants and Other Contributions (Note 22b)
(15,611)
(8,832) Major Repairs Reserve (Note 22b) (9,585)
Sums set aside from revenue:
(5,118) Direct revenue contributions (Note 22b) (7,015)
(9,405) MRP/loans fund principal (Note 22b) (9,654)
407,654 Closing Capital Financing Requirement 422,292
22,418 Underlying increase to borrow 14,638
The Council’s accounting policy on providing for the minimum revenue provision
is being discussed with the external auditor and any resulting change for 2017/18
will be included in the audited accounts.
NOTE 29) FINANCIAL INSTRUMENTS
ACCOUNTING POLICY
Financial instruments are recognised on the Balance Sheet when the Council
becomes a party to the contractual provisions of a financial instrument.
Financial Liabilities
Financial liabilities are initially measured at fair value and are carried at their
amortised cost. The fair value of loans are valued at carrying value because it is
not possible to derive a fair market value for the types of loans currently held by
the Council. For most of the Council’s borrowings this means that the amount
presented in the Balance Sheet is the outstanding principal repayable (plus
accrued interest). Interest charged to the Comprehensive Income and
Expenditure Statement is the amount payable for the year according to the loan
agreement.
Gains and losses on the repurchase or early settlement of borrowing are credited
and debited to the Financing and Investment Income and Expenditure line in the
Comprehensive Income and Expenditure Statement in the year of
repurchase/settlement. However, where repurchase has taken place as part of a
restructuring of the loan portfolio that involves the modification or exchange of
existing instruments, the premium or discount is respectively deducted from or
added to the amortised cost of the new or modified loan and the write-down to
the Comprehensive Income and Expenditure Statement is spread over the life of
the loan by an adjustment to the effective interest rate.
P a g e | 85
Where premiums and discounts have been charged to the Comprehensive
Income and Expenditure Statement, regulations allow the impact on the General
Fund Balance to be spread over future years. The Council has a policy of
spreading the gain or loss over the term that was remaining on the loan against
which the premium was payable or discount receivable when it was repaid. The
reconciliation of amounts charged to the Comprehensive Income and
Expenditure Statement to the net charge required against the General Fund
Balance is managed by a transfer to or from the Financial Instruments
Adjustment Account in the Movement in Reserves Statement.
Financial Assets
Financial assets are classified into two types:
loans and receivables – assets that have fixed or determinable payments
but are not quoted in an active market
available for sale assets – assets that have a quoted market price and/or do
not have fixed or determinable payments.
Loans and Receivables
Loans and receivables are recognised on the Balance Sheet when the Council
becomes a party to the contractual provisions of a financial instrument and are
initially measured at fair value. They are subsequently measured at their
amortised cost. Annual credits to the Financing and Investment Income and
Expenditure line in the Comprehensive Income and Expenditure Statement for
interest receivable are based on the carrying amount of the asset multiplied by
the effective rate of interest for the instrument. For most of the loans that the
Council has made, this means that the amount presented in the Balance Sheet is
the outstanding principal receivable (plus accrued interest) and interest credited
to the Comprehensive Income and Expenditure Statement is the amount
receivable for the year in the loan agreement.
Where assets are identified as impaired because of a likelihood arising from a
past event that payments due under the contract will not be made, the asset is
written down and a charge made to the relevant service (for receivables specific
to that service) or the Financing and Investment Income and Expenditure line in
the Comprehensive Income and Expenditure Statement. The impairment loss is
measured as the difference between the carrying amount and the present value
of the revised future cash flows discounted at the asset’s original effective
interest rate.
Any gains and losses that arise on the de-recognition of an asset are credited or
debited to the Financing and Investment Income and Expenditure line in the
Comprehensive Income and Expenditure Statement.
Available-for-Sale Assets
Available-for-sale assets are recognised on the Balance Sheet when the Council
becomes a party to the contractual provisions of a financial instrument and are
initially measured and carried at fair value. Where the asset has fixed or
determinable payments, annual credits to the Financing and Investment Income
and Expenditure line in the Comprehensive Income and Expenditure Statement
for interest receivable are based on the amortised cost of the asset multiplied by
the effective rate of interest for the instrument. Where there are no fixed or
determinable payments, income (e.g. dividends) is credited to the
Comprehensive Income and Expenditure Statement when it becomes receivable
by the Council.
The Council currently only has equity shares and debentures, in London Luton
Airport Ltd and Foxhall Homes Ltd, which have no quoted market price and are
therefore currently held at historic cost. These investments are reviewed
annually for any impairment loss. The most recent review has determined that
no impairment loss is required.
A financial instrument is a contract that gives rise to a financial asset of one
entity and a financial liability or equity instruments of another entity. Non
exchange transactions, such as those relating to taxes and government grants, do
not give rise to financial instruments.

P a g e | 86
CATEGORIES OF FINANCIAL INSTRUMENTS
31/03/2017 RESTATED
31/03/2017
31/03/2018 31/03/2018 Long Term Current
Financial Instrument Category Long Term Current
£000 £000 £000 £000
Investments
47,921 5,005 Loans and receivables 57,921 3,503
46,670 0 Unquoted equity investments 46,668 0
94,591 5,005 Total Investments 104,589 3,503
Debtors
355 23,255 Loans and receivables 328 31,817
355 23,255 Total Debtors 328 31,817
Cash & Cash Equivalents
0 17,140 Cash & Cash Equivalents 0 23,389
0 0 Bank (Bank Overdrawn) 0 0
0 17,140 Total Cash 0 23,389
Creditors
(2,795) (39,702) Financial liabilities at amortised cost (2,418) (49,208)
(2,795) (39,702) Total Creditors (2,418) (49,208)
Other Liabilities
(22,610) 0 PFI liabilities (22,244) 0
(1,320) 0 Other liabilities (786) 0
(23,930) 0 Total Other Liabilities (23,030) 0
Borrowings
(270,701) (2,391) Financial liabilities at amortised cost (274,796) (2,396)
(270,701) (2,391) Total Borrowings (274,796) (2,396)
(202,480) 3,308
Total
(195,327) 7,106
2016/17 reclassification of £17m from “Investments- Loans and receivables” to “Cash & Cash Equivalents” to ensure consistency of cash figure with Balance Sheet, this has
not changed the total of this note.

P a g e | 87
INCOME, EXPENSE, GAINS AND LOSSES
The Council’s financial instruments have generated the Comprehensive Income and Expenditure Statement entries listed below.
2016/17
2017/18
Financial Liabilities measured
at amortised
cost
Financial Assets:
Loans and receivables
Financial Assets:
Unquoted Equity
Investment at Cost
Total
Financial Liabilities measured
at amortised
cost
Financial Assets:
Loans and receivables
Financial Assets:
Unquoted Equity
Investment at Cost
Total
£000 £000 £000 £000 £000 £000 £000 £000
11,984 11,984 Interest expense (Note 9) 12,092 0 0 12,092
17 17 Fee expense 21 0 0 21
12,001 0 0 12,001 Total expense in Surplus or Deficit on the Provision of Services
12,113 0 0 12,113
(4,384) (4,384) Interest income (Note 9) 0 (4,958) 0 (4,958)
(17,800) (17,800) Dividend Income (Note 9) 0 0 (19,500) (19,500)
(20) (20) Fee income 0 (17) 0 (17)
0 (4,404) (17,800) (22,204) Total income in Surplus or Deficit on the Provision of Services
0 (4,975) (19,500) (24,475)
12,001 (4,404) (17,800) (10,203) Net (gain)/loss for the year 12,113 (4,975) (19,500) (12,361)
The wholly owned company, London Luton Airport Ltd, dividend increased between years by £1.7 million. This has created the most significant variance between financial
years.
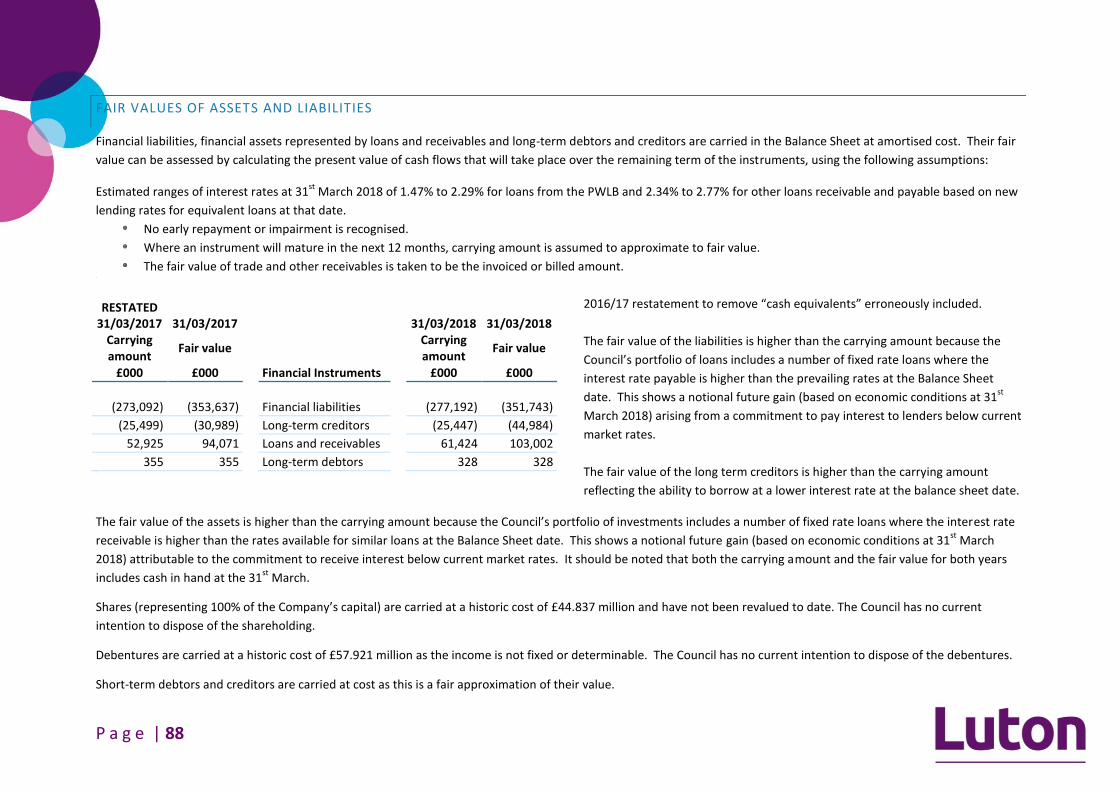
P a g e | 88
FAIR VALUES OF ASSETS AND LIABILITIES
Financial liabilities, financial assets represented by loans and receivables and long-term debtors and creditors are carried in the Balance Sheet at amortised cost. Their fair
value can be assessed by calculating the present value of cash flows that will take place over the remaining term of the instruments, using the following assumptions:
Estimated ranges of interest rates at 31st
March 2018 of 1.47% to 2.29% for loans from the PWLB and 2.34% to 2.77% for other loans receivable and payable based on new
lending rates for equivalent loans at that date.
No early repayment or impairment is recognised.
Where an instrument will mature in the next 12 months, carrying amount is assumed to approximate to fair value.
The fair value of trade and other receivables is taken to be the invoiced or billed amount.X
RESTATED 31/03/2017 31/03/2017
31/03/2018 31/03/2018
Carrying amount
Fair value
Carrying amount
Fair value
£000 £000
Financial Instruments
£000 £000
(273,092) (353,637)
Financial liabilities
(277,192) (351,743)
(25,499) (30,989)
Long-term creditors
(25,447) (44,984)
52,925 94,071
Loans and receivables
61,424 103,002
355 355
Long-term debtors
328 328 X
2016/17 restatement to remove “cash equivalents” erroneously included.
The fair value of the liabilities is higher than the carrying amount because the
Council’s portfolio of loans includes a number of fixed rate loans where the
interest rate payable is higher than the prevailing rates at the Balance Sheet
date. This shows a notional future gain (based on economic conditions at 31st
March 2018) arising from a commitment to pay interest to lenders below current
market rates.
The fair value of the long term creditors is higher than the carrying amount
reflecting the ability to borrow at a lower interest rate at the balance sheet date.
The fair value of the assets is higher than the carrying amount because the Council’s portfolio of investments includes a number of fixed rate loans where the interest rate
receivable is higher than the rates available for similar loans at the Balance Sheet date. This shows a notional future gain (based on economic conditions at 31st
March
2018) attributable to the commitment to receive interest below current market rates. It should be noted that both the carrying amount and the fair value for both years
includes cash in hand at the 31st
March.
Shares (representing 100% of the Company’s capital) are carried at a historic cost of £44.837 million and have not been revalued to date. The Council has no current
intention to dispose of the shareholding.
Debentures are carried at a historic cost of £57.921 million as the income is not fixed or determinable. The Council has no current intention to dispose of the debentures.
Short-term debtors and creditors are carried at cost as this is a fair approximation of their value.

P a g e | 89
NOTE 30) NATURE AND EXTENT OF RISK
The Council’s activities expose it to a variety of financial risks:
credit risk – the possibility that other parties might fail to pay amounts due
to the Council
liquidity risk – the possibility that the Council might not have funds
available to meet its commitments to make payments
market risk – the possibility that financial loss might arise for the Council as
a result of changes in such measures as interest rates and stock market
movements.
The Council’s overall risk management programme focuses on the
unpredictability of financial markets and seeks to minimise potential adverse
effects on the resources available to fund services. Risk management is carried
out by a central treasury team, under policies approved by the Council in the
Annual Treasury Management Strategy. The Council provides written principles
for overall risk management, as well as written policies covering specific areas
such as interest rate risk, credit risk and the investment of surplus cash.
CREDIT RISK
Credit risk arises from deposits with banks and financial institutions, as well as
credit exposures to the council’s customers.
This risk is minimised through the Annual Investment Strategy, which requires
that deposits are not made with financial institutions unless they meet identified
minimum credit criteria. The Council uses the creditworthiness service provided
by its Treasury advisers Link Asset Services, their model combines the ratings of
all the three main agencies – Fitch, Moody’s and Standard and Poors. The
Annual Investment Strategy also imposes a maximum sum to be invested with a
financial institution located within each category.
The credit criteria in respect of financial assets held by the council are detailed
below:
Group Rating Exposure Maximum Maturity
A Combination scoring method - highest band (all at least AA+ with one agency)
£25.0 m 24 Months
B Combination scoring method - second band (all at least AA- with one agency)
£22.5 m 364 Days
C Combination scoring method - third band (all at least A with one agency)
£15.0 m 6 Months
D Combination scoring method - fourth band (all at least A with one agency)
£11.5 m 3 Months
E UK Local Authorities £15.0 m 364 Days
F AAA Rated Money Market Liquidity Funds £22.5 m On call
F1 Part owned or supported under guarantee scheme by UK Government
£30.0 m 2 years
Institutions in Groups A to D must all be in countries with a sovereign rating of
AAA/AA.
The Council’s maximum exposure to credit risk in relation to its investments in
banks cannot be assessed generally as the risk of any institution failing to make
interest payments or repay the principal sum will be specific to each individual
institution. Recent experience has shown that it is rare for such entities to be
unable to meet their commitments. A risk of recoverability applies to all the
Council’s deposits, but there was no evidence at the 31st
March 2018 that this
was likely to crystallise.

P a g e | 90
Customers for goods and services are assessed, taking into account their financial
position, past experience and other factors, with individual credit limits being set
in accordance with parameters set by the relevant department of the Council.
No credit limits were exceeded during the reporting period and the Council does
not expect any losses from non-performance by any of its counterparties in
relation to deposits. The Council does not generally allow credit for customers,
such that only £2.167 million of the total debt past the due date has been
outstanding longer than one month.
The analysis below includes all sundry debts before any impairment and excludes
any social care debt.
31/03/2017 31/03/2018 £000 Debt past due date £000
7,396 Less than one month 10,014
212 One to three months 1,147
347 Three months to one year 452
457 More than one year 568
8,412 Total 12,181
X
The significant change in debts ‘Less than one month’ year on year of £2.618
million is due to a £1.323 million invoice owing by Foxhall Homes Ltd, as the
Council owns this company the debt is not considered doubtful in terms of
collection. The remainder is primarily payroll recharges owing for March unpaid
as at 31st
March 2018 but paid shortly after in April 2018.
The significant change in debts ‘One to three months’ year on year of £0.935
million is due primarily to;
£0.381 million debt with a Scottish City Council (deemed fully collectable)
£0.133 million of payroll recharges, received in April 2018
£0.115 million of Market charges where legal action is pending.
In addition to sundry debts, the Council is owed considerable debt in the relation
to housing tenants (£10.838 million) and housing benefit overpayments (£12.136
million). Due to the nature of the debt the Council has impaired the debt on a
very prudent basis, housing tenants by £10.157 million (93.7%) and housing
benefit overpayments by £11.805 million (97.3%).
LIQUIDITY RISK
The Council has a comprehensive cash flow management system that seeks to
ensure that cash is available as needed. If unexpected movements happen, the
Council has ready access to borrowings from the money markets and the Public
Works Loans Board. There is no significant risk that it will be unable to raise
finance to meet its commitments under financial instruments. Instead, the risk is
that the Council will be bound to replenish a significant proportion of its
borrowings at a time of unfavourable interest rates. The Council sets limits on
the proportion of its fixed rate borrowing during specified periods. The strategy
is to ensure that not more than 15% of loans are due to mature within any one
year through a combination of careful planning of new loans taken out and
(where it is economic to do so) making early repayments. The maturity analysis
of financial liabilities is as follows:
Amount
Borrowing age profile £000
Less than 1 year 2,396
between 12 months & 24 months 0
between 24 months & 5 years 92,856
5 years and above 181,940
Total 277,192
There are a number of Lender Option Borrower Option Loans with maturities
over 40 years, some of which have call dates within five years.
All trade and other payables are due to be paid in less than one year.

P a g e | 91
MARKET RISK
Interest Rate Risk
The Council is exposed to risk in terms of its exposure to interest rate
movements on its borrowings and investments. Movements in interest rates
have a complex impact on the Council. For instance, a rise in interest rates
would have the following effects:
borrowings at variable rates – the interest expense charged to the Surplus
or Deficit on the Provision of Services will rise
borrowings at fixed rates – fair value of the liabilities borrowings will fall
investments at variable rates – the interest income credited to the Surplus
or Deficit on the Provision of Services will rise
investments at fixed rates – the fair value of the assets will fall.
Borrowings are not carried at fair value, so nominal gains and losses on fixed rate
borrowings would not impact on the Surplus or Deficit on the Provision of
Services or other Comprehensive Income and Expenditure. However, changes in
interest payable and receivable on variable rate borrowings and investments will
be posted to the Surplus or Deficit on the Provision of Services and affect the
General Fund Balance. Movements in the fair value of fixed rate investments
that have a quoted market price will be reflected in Other Comprehensive
Income and Expenditure.
The Council has a number of strategies for managing interest rate risk. During
periods of falling interest rates, and where economic circumstances make it
favourable, fixed rate loans will be repaid early to limit exposure to losses. The
risk of loss is ameliorated by the fact that a proportion of government grant
payable on financing costs will normally move with prevailing interest rates or
the Council’s cost of borrowing and provide compensation for a proportion of
any higher costs.
The treasury management team has an active strategy for assessing interest rate
exposure that feeds into the setting of the annual budget and which is used to
update the budget quarterly during the year. This allows any adverse changes to
be accommodated. The analysis will also advise whether new borrowing taken
out is fixed or variable.
According to this assessment strategy, at 31st
March 2018, if interest rates had been 1% higher with all other variables held constant, the financial effect would be:
Sensitivity analysis £000
Impact on General Fund: Interest cost of 1% increase 336
Less: Interest gain from 1% increase (113)
Net (gain)/loss from increase on General Fund 223
Impact on Housing Revenue Account: Impact on HRA of above - borrowing 41
Less interest receivable to the HRA - investment (1)
Net (gain)/loss from increase on Housing Revenue Account 41
Impact on Fair Values: Decrease in Fair Value of Fixed Rate Investments 0
Increase in Fair Value of Fixed Rate Borrowing 38,793 X
The impact of a 1% fall in interest rates would be as above but with the
movements being reversed.
Price Risk
The Council does not generally invest in equity shares; it’s only current
shareholdings are in London Luton Airport Limited and Foxhall Homes Ltd, where
the Council owns 100% of the shares and the shares are not traded. More details
regarding this shareholding can be found in the Group Accounts. The Council is
therefore not exposed to losses arising from movements in the prices of shares.
Foreign Exchange Risk
The Council has no financial assets/liabilities denominated in foreign currencies.

P a g e | 92
NOTE 31) OTHER LONG TERM LIABILITIES
The long term liabilities recorded in the Balance Sheet represent the agreements
listed below: X
Ref Other Long Term Liabilities 31-Mar-17 31-Mar-18
£000 £000
(A) Challney Girls PFI Scheme (22,609) (22,244)
(B) Multi-functional Devices (738) (250)
(C) Highways Vehicles (582) (535)
Total (23,929) (23,030)
X The Challney Girls PFI Scheme (A) is detailed in the next sub-section of this note.
Agreements for Multi-functional Devices (B) and Highways Vehicles (C) are both
explain in more detail within the service concessions sub-section of this note.
PRIVATE FINANCE INITIATIVES AND SIMILAR CONTRACTS
Accounting Policy
PFI and similar contracts are agreements to receive services, where the
responsibility for making available the property, plant and equipment needed to
provide the services passes to the PFI contractor. As the Council is deemed to
control the services that are provided under PFI schemes, and as ownership of
the property, plant and equipment will pass to the Council at the end of the
contracts for no additional charge, the Council carries the assets used under the
contracts on its Balance Sheet as part of Property, Plant and Equipment.
The original recognition of these assets at fair value (based on the cost to
purchase the property, plant and equipment) is balanced by the recognition of a
liability for amounts due to the scheme operator to pay for the capital
investment.
Non-current assets recognised on the Balance Sheet are re-valued and
depreciated in the same way as property, plant and equipment owned by the
Council.
The amounts payable to the PFI operators each year are analysed into five
elements:
Fair value of the services received during the year – debited to the relevant
service in the Comprehensive Income and Expenditure Statement
Finance cost – an interest charge on the outstanding Balance Sheet liability,
debited to the financing and Investment Income and Expenditure line in the
Comprehensive Income and Expenditure Statement
Contingent rent – increases in the amount to be paid for the property
arising during the contract, debited to the Financing and investment
Income and Expenditure line in the Comprehensive Income and
Expenditure Statement
Payment towards liability – applied to write down the Balance Sheet
liability towards the PFI operator (the profile of write-downs is calculated
using the same principles as for a finance lease)
Life cycle replacement costs – proportion of the amounts payable is posted
to the Balance Sheet as a prepayment and then recognised as additions to
Property, Plant and Equipment when the relevant works are eventually
carried out.

P a g e | 93
Building Schools for the Future PFI Scheme
There is a 25 year PFI contract for the construction, maintenance, and facilities
management of Challney Girls School. The financial close for the project was
achieved on 3 June 2009 and construction commenced almost immediately. The
new school building was handed over to the Council on 31st
December 2010. The
school was one of the Council’s Community Schools.
The contract specifies minimum standards for the services provided by the
contractor to the school. The contractor took on the obligation to construct the
school and maintain it in a minimum acceptable condition and to procure and
maintain the plant and equipment needed to operate the school. The buildings
and any plant and equipment installed in them at the end of the contract will be
transferred to the Council for nil consideration. The Council only has rights to
terminate the contract if it compensates the contractor in full for the costs
incurred and future profits that would have been generated over the remaining
term of the contract.
During March 2018 the PFI operating body re-financed the full loan debt
portfolio. This reduced the level of interest payable with a corresponding uplift in
the total liability. The new structure of the debt does not alter the financial
relationship the council has with the Local Education Partnership.
Property, Plant and Equipment
The assets used to provide services at the school were recognised on the
Council’s Balance Sheet until the school converted to Academy status during
2016/17. Details are given in Note 23.
Payments
The Council makes an agreed payment each year which is increased each year by
inflation and can be reduced if the contractor fails to meet availability and
performance standards in any year but which is otherwise fixed. Payments
remaining to be made under the PFI contract at 31st
March 2018 (excluding any
estimation of inflation and availability/performance deductions) are as follows: X
Liability age profile Payment
for services
Capital Charge (MRP)
Interest Element
Total
£000 £000 £000 £000
Payable in 2018/19 1,105 423 2,390 3,918
Payable within 2 to 5 years 4,931 2,065 9,058 16,054
Payable within 6 to 10 years 6,697 4,582 9,723 21,002
Payable within 11 to 15 years 7,494 8,169 6,508 22,171
Payable within 16 to 20 years 4,273 7,004 1,468 12,745
Total 24,500 22,243 29,147 75,890 X
Although the payments made to the contractor are described as unitary payments, they have been calculated to compensate the contractor for the fair value for the services they provide, the capital expenditure incurred and interest payable whilst the capital expenditure remains to be reimbursed. The liability outstanding to pay the liability to the contractor for capital expenditure incurred is as follows:
2016/17 2017/18
£000 £000
Balance outstanding at start of year 22,981 22,609
Loan repayments during the year (2,841) (2,796)
Interest incurred in the year 2,469 2,430
Balance outstanding at year-end 22,609 22,243
SERVICE CONCESSIONS
Service concessions are agreements to receive services, where the responsibility
for making available the property, plant and equipment needed to provide the
services passes to the contractor. As the Council is deemed to control the assets
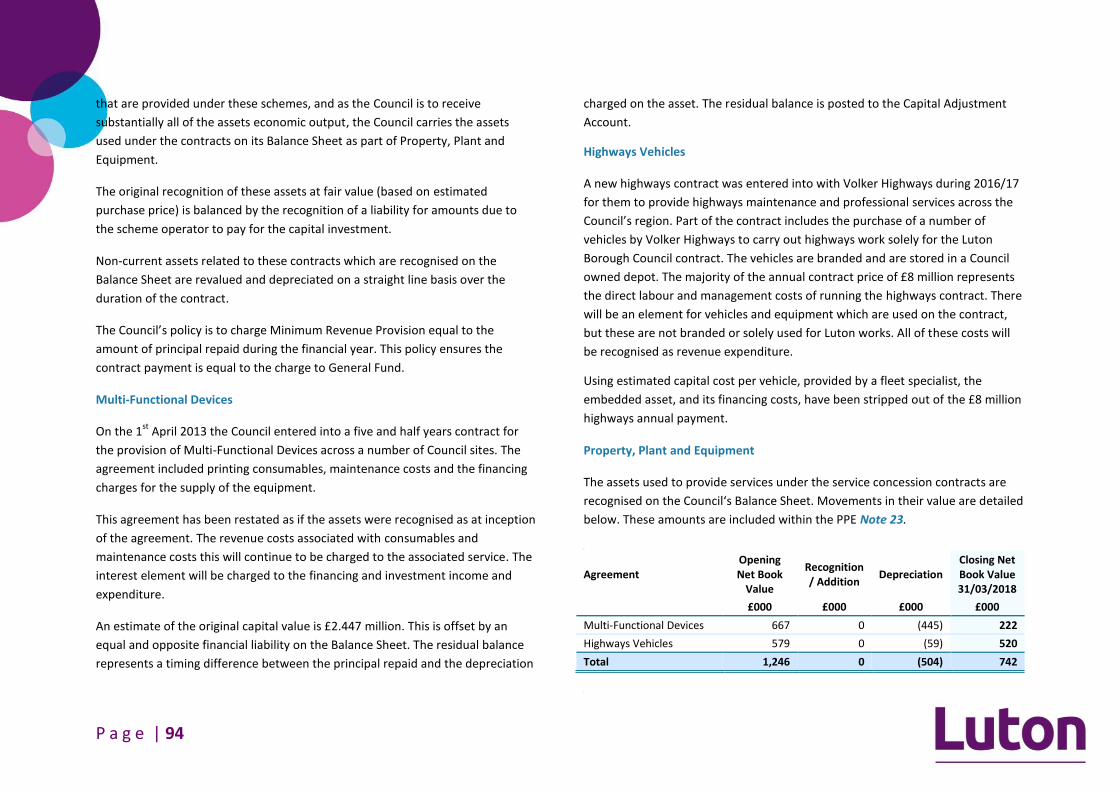
P a g e | 94
that are provided under these schemes, and as the Council is to receive
substantially all of the assets economic output, the Council carries the assets
used under the contracts on its Balance Sheet as part of Property, Plant and
Equipment.
The original recognition of these assets at fair value (based on estimated
purchase price) is balanced by the recognition of a liability for amounts due to
the scheme operator to pay for the capital investment.
Non-current assets related to these contracts which are recognised on the
Balance Sheet are revalued and depreciated on a straight line basis over the
duration of the contract.
The Council’s policy is to charge Minimum Revenue Provision equal to the
amount of principal repaid during the financial year. This policy ensures the
contract payment is equal to the charge to General Fund.
Multi-Functional Devices
On the 1st
April 2013 the Council entered into a five and half years contract for
the provision of Multi-Functional Devices across a number of Council sites. The
agreement included printing consumables, maintenance costs and the financing
charges for the supply of the equipment.
This agreement has been restated as if the assets were recognised as at inception
of the agreement. The revenue costs associated with consumables and
maintenance costs this will continue to be charged to the associated service. The
interest element will be charged to the financing and investment income and
expenditure.
An estimate of the original capital value is £2.447 million. This is offset by an
equal and opposite financial liability on the Balance Sheet. The residual balance
represents a timing difference between the principal repaid and the depreciation
charged on the asset. The residual balance is posted to the Capital Adjustment
Account.
Highways Vehicles
A new highways contract was entered into with Volker Highways during 2016/17
for them to provide highways maintenance and professional services across the
Council’s region. Part of the contract includes the purchase of a number of
vehicles by Volker Highways to carry out highways work solely for the Luton
Borough Council contract. The vehicles are branded and are stored in a Council
owned depot. The majority of the annual contract price of £8 million represents
the direct labour and management costs of running the highways contract. There
will be an element for vehicles and equipment which are used on the contract,
but these are not branded or solely used for Luton works. All of these costs will
be recognised as revenue expenditure.
Using estimated capital cost per vehicle, provided by a fleet specialist, the
embedded asset, and its financing costs, have been stripped out of the £8 million
highways annual payment.
Property, Plant and Equipment
The assets used to provide services under the service concession contracts are
recognised on the Council‘s Balance Sheet. Movements in their value are detailed
below. These amounts are included within the PPE Note 23.
X
Agreement Opening Net Book
Value
Recognition / Addition
Depreciation Closing Net Book Value 31/03/2018
£000 £000 £000 £000
Multi-Functional Devices 667 0 (445) 222
Highways Vehicles 579 0 (59) 520
Total 1,246 0 (504) 742
X
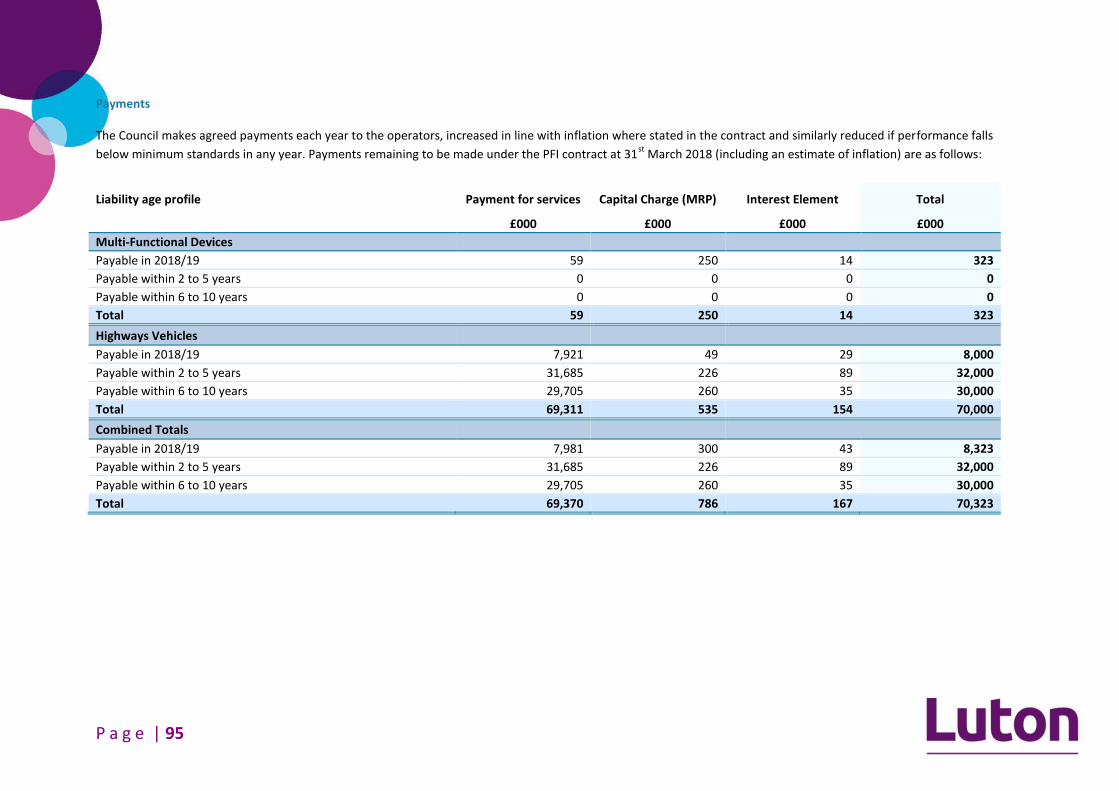
P a g e | 95
Payments
The Council makes agreed payments each year to the operators, increased in line with inflation where stated in the contract and similarly reduced if performance falls
below minimum standards in any year. Payments remaining to be made under the PFI contract at 31st
March 2018 (including an estimate of inflation) are as follows:
Liability age profile Payment for services Capital Charge (MRP) Interest Element Total
£000 £000 £000 £000
Multi-Functional Devices
Payable in 2018/19 59 250 14 323
Payable within 2 to 5 years 0 0 0 0
Payable within 6 to 10 years 0 0 0 0
Total 59 250 14 323
Highways Vehicles
Payable in 2018/19 7,921 49 29 8,000
Payable within 2 to 5 years 31,685 226 89 32,000
Payable within 6 to 10 years 29,705 260 35 30,000
Total 69,311 535 154 70,000
Combined Totals
Payable in 2018/19 7,981 300 43 8,323
Payable within 2 to 5 years 31,685 226 89 32,000
Payable within 6 to 10 years 29,705 260 35 30,000
Total 69,370 786 167 70,323

P a g e | 96
NOTE 32) PENSIONS SCHEMES ACCOUNTED FOR AS DEFINED
CONTRIBUTION SCHEMES
TEACHERS’ PENSION SCHEME
Teachers employed by the Council are members of the Teachers’ Pension
Scheme administered by the Department for Education. The Scheme provides
teachers with specified benefits upon their retirement and the Council
contributes towards the cost by making contributions based on a percentage of
scheme members’ pensionable salaries.
The Scheme is technically a defined benefit scheme however, the scheme is
unfunded. The Department for Education uses a notional fund as the basis for
calculating the employer’s contribution rate paid by local authorities. The Council
is not able to identify its share of the underlying financial position and
performance of the Scheme with sufficient reliability for accounting purposes.
For the purposes of this Statement of Accounts, it is therefore accounted for on
the same basis as a defined contribution scheme.
In 2017/18, the Council paid £7.206 million (2016/17 £7.665 million) to the
Teachers Pensions Agency in respect of teachers’ retirement benefits.
NHS STAFF PENSION SCHEME
Former NHS employees that work for the Council are permitted to maintain their
membership of the NHS Pension Scheme. The Scheme provides these employees
with specified benefits upon their retirement and the Council contributes
towards the costs by making contributions based on a percentage of members’
pensionable salaries.
The scheme is an unfunded defined benefit scheme. However, the Council is not
able to identify its share of the underlying financial position and performance of
the Scheme with sufficient reliability for accounting purposes. For the purposes
of this Statement of Accounts, it is therefore accounted for on the same basis as
a defined contribution scheme.
In 2017/18, the Council paid £0.037 million (2016/17 £0.036 million) to the NHS
Pension Scheme in respect of former NHS staff retirement benefits.
NOTE 33) DEFINED BENEFIT PENSION SCHEMES
ACCOUNTING POLICY
Benefits Payable during Employment
Short-term employee benefits are those due to be settled within 12 months of
the year-end. They include such benefits as wages and salaries, paid annual leave
and paid sick leave, bonuses and non-monetary benefits (e.g. cars) for current
employees and are recognised as an expenses for services in the year in which
employees render services to the Council. An accrual is made for the cost of
holiday entitlements (or any form of leave, e.g. time off owed on flexi-time
schemes) earned by employees but not taken before the year-end which
employees can carry forward into the next financial year. The accrual is made at
the wage and salary rates applicable in the following accounting year, being the
period in which the employee takes the benefit. The accrual is charged to Surplus
or Deficit on the Provision of Services, but then reversed out through the
Movement in Reserves statement so that holiday benefits are charged to
revenue in the financial year in which the holiday absence occurs.
Post Employment Benefits
Employees of the Council are members of three separate pension schemes:
The Local Government Pensions Scheme, administered by Bedford Borough
Council.

P a g e | 97
The Teachers’ Pension Scheme, administered by the Capital Teachers’
Pensions on behalf of the Department for Education.
NHS Pension Scheme
All schemes provide defined benefits to members (retirement lump sums and
pensions), earned as employees work for the Council.
However, the arrangements for the teachers’ scheme mean that liabilities for
these benefits cannot be identified specifically to the Council. The scheme is
therefore accounted for as if it were a defined contribution scheme and no
liability for future payments of benefits is recognised in the Balance Sheet. The
Children’s and Education Services line in the Comprehensive Income and
Expenditure Statement is charged with the employer’s contributions payable to
Teachers’ Pensions in the year.
The Local Government Pension Scheme
The Local Government Scheme is accounted for as a defined benefit scheme.
The liabilities of the Bedfordshire Pension Fund attributable to the Council are
included in the Balance Sheet on an actuarial basis using the projected unit
method – i.e. an assessment of the future payments that will be made in relation
to retirement benefits earned to date by employees, based on assumptions
about mortality rates, employee turnover rates, etc. and projections of projected
earnings for current employees.
Liabilities are discounted to their value at current prices, using a discount rate of
2.7% (2.6% in 2016/17) based on the indicative rate of return on high quality
corporate bonds.
The assets of the Bedfordshire Pension Fund attributable to the council are
included in the Balance Sheet at their fair value:
quoted securities – bid value
unquoted securities – professional estimate
unitised securities – bid value
property – market value.
The change in the net pension’s liability is analysed into six components:
Service cost comprising:
Current service cost – the increase in liabilities as a result of years of service
earned this year – allocated in the CIES to the services for which the
employees worked
Past service cost – the increase in liabilities as a result of a scheme
amendment or curtailment whose effect relates to years of service earned
in earlier years – debited to the Surplus or Deficit on the Provision of
Services in the CIES as part of Non Distributed Costs
Net interest on the net defined benefit liability (asset), i.e. net interest
expense for the authority – the change during the period in the net defined
benefit liability (asset) that arises from the passage of time charged to the
Financing and Investment Income and Expenditure line of the CIES – this is
calculated by applying the discount rate used to measure the defined
benefit obligation at the beginning of the period to the net defined benefit
liability (asset) at the beginning of the period – taking into account any
changes in the net defined benefit liability (asset) during the period as a
result of contribution and benefit payments.
Re-measurements comprising:
the return on plan assets – excluding amounts included in net interest on
the net defined benefit liability (asset) – charged to the Pensions Reserve as
Other Comprehensive Income and Expenditure
actuarial gains and losses – changes in the net pensions liability that arise
because events have not coincided with assumptions made at the last

P a g e | 98
actuarial valuation or because the actuaries have updated their
assumptions – charged to the Pensions Reserve as Other Comprehensive
Income and Expenditure
Contributions paid to the Bedfordshire Pension Fund – cash paid as employer’s
contributions to the pension fund in settlement of liabilities; not accounted for as
an expense.
Discretionary Benefits
The Council also has restricted powers to make discretionary awards of
retirement benefits in the event of early retirements. Any liabilities estimated to
arise as a result of an award to any member of staff (including teachers) are
accrued in the year of the decision to make the award and accounted for using
the same polices as are applied to the Local Government Pension Scheme.
Participation in Pension Schemes
As part of the terms and conditions of employment of its officers, the Council
makes contributions towards the cost of post-employment benefits. Although
these benefits will not actually be payable until employees retire, the Council has
a commitment to make the payments that needs to be disclosed at the time that
employees earn their future entitlement.
The Council participates in the following:
The Local Government Pension Scheme, administered locally by Bedford Borough
Council – this is a funded defined benefit final salary scheme, meaning that the
Council and employees pay contributions into a fund, calculated at a level
intended to balance the pensions liabilities with investment assets.
Arrangements for the award of discretionary post-retirement benefits upon early
retirement – this is an unfunded defined benefit arrangement, under which
liabilities are recognised when awards are made. However, there are no
investment assets built up to meet these pensions liabilities, and cash has to be
generated to meet actual pensions payments as they eventually fall due.
Transactions Relating to Post-employment Benefits
The Council recognises the cost of retirement benefits in the reported cost of
services when they are earned by employees, rather than when the benefits are
eventually paid as pensions. However, the charge the Council is required to
make against council tax is based on the cash payable in the year, so the real cost
of post-employment / retirement benefits is reversed out of the General Fund via
the Movement in Reserves Statement.
The transactions on the next page have been made in the Comprehensive
Income and Expenditure Statement and the General Fund Balance via the
Movement in Reserves Statement during the year in respect of the Local
Government Pension Scheme:

P a g e | 99
PENSIONS TRANSACTIONS IN THE SURPLUS OR DEFICIT ON THE PROVISION OF SERVICES AND THE MOVEMENT IN RESERVES STATEMENT X
2016/17
2017/18
£000
£000
Comprehensive Income and Expenditure Statement
Cost of Services:
(21,839) Current service cost (36,351)
(250) Past service costs (127)
0 (Gain) / loss from settlements 0
Financing and Investment Income and Expenditure:
(10,650) Net Interest Expense (10,383)
(32,739) Total Post-employment Benefits charged to the Surplus or Deficit on the Provision of Services (46,861)
Other Post-employment Benefits Charged to the Comprehensive Income and Expenditure Statement
Re-measurement of the Net Defined Benefit liability comprising:
55,273 Return on plan assets (excluding the net interest expense) (2,838)
6,679 Actuarial gains and (losses) arising on changes in demographic assumptions 0
(154,502) Actuarial gains and (losses) arising on changes in financial assumptions 18,022
15,679 Other (if applicable) 14
(76,871) Total Post-employment Benefits Charged to the Comprehensive Income and Expenditure Statement 15,198
Movement in Reserves Statement
32,739 Reversal of net charges made to the Surplus or Deficit for the Provision of Services for post-employment benefits in accordance with the Code
46,861
Actual amount charged against the General Fund Balance for pensions in the year:
20,010 Employers contributions payable to scheme 21,640
851 Contributions in respect of unfunded benefits 821
20,861 Total amount charged against the General Fund 22,461
The significant change year on year on ‘Current service costs’ is primarily due to a higher discount rate used by the pensions actuary, being based on market conditions
with valuation not controllable by the Council. There has also been a raising of the employers contribution rate in 2017/18 by the Council.
The significant change in ‘Return on plan assets (excluding the net interest expense)’ was due to significantly market conditions in 2016/17, beyond the control of the
Council. X
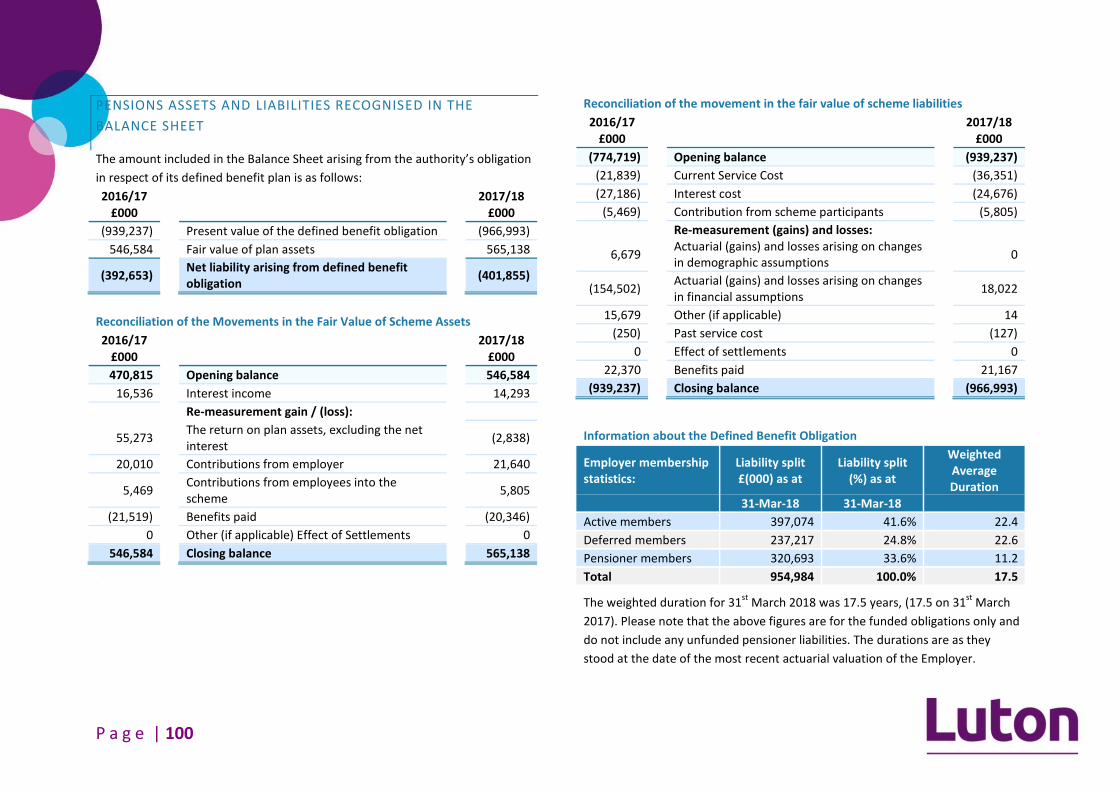
P a g e | 100
PENSIONS ASSETS AND LIABILITIES RECOGNISED IN THE
BALANCE SHEET
The amount included in the Balance Sheet arising from the authority’s obligation
in respect of its defined benefit plan is as follows:
2016/17 2017/18
£000 £000
(939,237) Present value of the defined benefit obligation (966,993)
546,584 Fair value of plan assets 565,138
(392,653) Net liability arising from defined benefit obligation
(401,855)
Reconciliation of the Movements in the Fair Value of Scheme Assets
2016/17 2017/18
£000 £000
470,815 Opening balance 546,584
16,536 Interest income 14,293
Re-measurement gain / (loss):
55,273 The return on plan assets, excluding the net interest
(2,838)
20,010 Contributions from employer 21,640
5,469 Contributions from employees into the scheme
5,805
(21,519) Benefits paid (20,346)
0 Other (if applicable) Effect of Settlements 0
546,584 Closing balance 565,138
X
Reconciliation of the movement in the fair value of scheme liabilities
2016/17 2017/18
£000 £000
(774,719) Opening balance (939,237)
(21,839) Current Service Cost (36,351)
(27,186) Interest cost (24,676)
(5,469) Contribution from scheme participants (5,805)
Re-measurement (gains) and losses:
6,679 Actuarial (gains) and losses arising on changes in demographic assumptions
0
(154,502) Actuarial (gains) and losses arising on changes in financial assumptions
18,022
15,679 Other (if applicable) 14
(250) Past service cost (127)
0 Effect of settlements 0
22,370 Benefits paid 21,167
(939,237) Closing balance (966,993)
Information about the Defined Benefit Obligation
Employer membership statistics:
Liability split £(000) as at
Liability split (%) as at
Weighted Average Duration
31-Mar-18 31-Mar-18
Active members 397,074 41.6% 22.4
Deferred members 237,217 24.8% 22.6
Pensioner members 320,693 33.6% 11.2
Total 954,984 100.0% 17.5
The weighted duration for 31st
March 2018 was 17.5 years, (17.5 on 31st
March
2017). Please note that the above figures are for the funded obligations only and
do not include any unfunded pensioner liabilities. The durations are as they
stood at the date of the most recent actuarial valuation of the Employer.

P a g e | 101
ASSETS COMPOSITION
Quoted Prices 2016/17
Quoted Prices 2016/17
2016/17 Quoted Prices
2017/18 Quoted Prices
2017/18 2017/18
Active Market Inactive Market
Total Active Market Inactive Market
Total
£000 £000 £000 £000 £000 £000
20,127 0 20,127 Cash and cash equivalents 24,336 0 24,336
Debt Securities
0 47,405 47,405 UK Government 0 45,119 45,119
Private Equity:
0 0 0 All 0 1,562 1,562
Property:
0 50,226 50,226 UK Property 0 50,903 50,903
0 0 0 Overseas Property 0 0 0
0 50,226 50,226 Sub-total Property 0 50,903 50,903
Other Investment Funds:
16,489 275,190 291,679 Equities 17,923 272,214 290,137
46,243 0 46,243 Bonds 44,777 0 44,777
90,904 0 90,904 Other 108,304 0 108,304
153,636 275,190 428,826 Sub-total Other investment funds 171,004 272,214 443,218
173,763 372,821 546,584 Total Assets 192,808 365,006 565,138

P a g e | 102
BASIS FOR ESTIMATING ASSETS AND LIABILITIES
Liabilities have been assessed on an actuarial basis using the projected unit credit
method, an estimate of the pensions that will be payable in future years
dependent on assumptions about mortality rates, salary levels, etc.
Both the Local Government Pension Scheme and discretionary benefits liabilities
have been estimated by Hymans Robertson LLP, an independent firm of
actuaries, estimates for the Pension Fund being based of the latest full valuation
of the scheme as at 31st
March 2017.
The significant assumptions used by the actuary have been: X
Mortality Assumptions: 31/03/2017 31/03/2018
Longevity at 65 for current pensioners:
Men 22.4 22.4
Women 24.5 24.5
Longevity at 65 for future pensioners:
Men 24.0 24.0
Women 26.2 26.2
Rate of increase in salaries 2.70% 2.70%
Rate of increase in pensions 2.40% 2.40%
Rate for discounting scheme liabilities 2.60% 2.70%
The estimation of the defined benefit obligations is sensitive to the actuarial
assumptions set out in the table above. The sensitivity analyses below have been
determined based on reasonably possible changes of the assumptions occurring
at the end of the reporting period and assumes for each change that the
assumption analysed changes while all the other assumptions remain constant.
The assumptions in longevity, for example, assume that life expectancy increases
or decreases for men and women. In practice, this is unlikely to occur, and
changes in some of the assumptions may be interrelated. The estimations in the
sensitivity analysis have followed the accounting policies for the scheme, i.e. on
an actuarial basis using the projected unit credit method. The methods and
types of assumptions used in preparing the sensitivity analysis below did not
change from those used in the previous period.
SENSITIVITY ANALYSIS
The sensitivities regarding the principal assumptions used to measure the
scheme liabilities are set out below:
Change in assumptions at 31 March 2018 Approximate
% increase Approximate
amount (£000)
0.5% decrease in Real Discount Rate 10% 95,051
0.5% increase in the Salary Increase Rate 1% 11,221
0.5% increase in the Pension Increase Rate 9% 82,827
IMPACT ON THE AUTHOR ITY’S CASH FLOWS
The objectives of the scheme are to keep employers’ contributions at as constant
a rate as possible. Bedford Borough Council has agreed a strategy with the
scheme’s actuary to achieve a funding level of 100% over the next 20 years.
Funding levels are monitored on an annual basis.
The triennial valuation based on the position as at 31st
March 2017 was
completed during 2016/17, and was reflected in the new budgeted contribution
to the pension fund in 2017/18. The 2017/18 service rate has increased from
14.1% to 17.3% with annual variations to the lump sum payments for deficit
recovery.

P a g e | 103
NOTE 34) LEASES
COUNCIL AS A LESSEE
Finance lease
The Council current has no lessee finance leases. The service concessions section
of Note 31, explains the two agreements which contain embedded assets which
the inherent liability is recognised on the Balance Sheet.
Operating leases
Rentals paid under operating leases are charged to the Comprehensive Income
and Expenditure Statement as an expense of the services benefitting from the
use of the leased property, plant or equipment. Charges are made on a straight-
line basis over the life of the lease; even if this does not match the pattern of
payments (e.g. there is a rent-free period at the commencement of the lease).
The operating leases currently held are managed by the Council’s maintained
schools for vehicles and equipment. The future minimum lease payments due
under non-cancellable leases in future years are included in the table.
31/03/2017 31/03/2018
£000 Future minimum lease payments £000
218 Not later than one year 314
310 Later than one year and not later than five years
516
0 Later than five years 0
528 Total 830
The expenditure charged to service in the Comprehensive Income and
Expenditure Statement during the year was £0.324 million (£0.224 million during
2016/17). There are no contingent rents as the agreements are for vehicles and
equipment and which have fixed amounts which will not be reviewed.
COUNCIL AS A LESSOR
Finance lease
The Council current has no lessor finance leases.
Operating lease
The Council leases out property under operating leases for the following
purposes:
to generate investment income
for the provision of community services
for economic development purposes
The future minimum lease payments receivable under non-cancellable leases in
future years are:
31/03/2017 31/03/2018
£000 Future minimum lease payments £000
8,548 Not later than one year 8,949
27,541 Later than one year and not later than five years
27,250
156,767 Later than five years 151,530
192,856 Total 187,728
X
Included in the above is 39.5 acres of land on President Way that the Council
rents out to its subsidiary London Luton Airport at an annual rent of £1.925
million (£1.925 million 2016/17).
There are no contingent rents for 2017/18 (nil in 2016/17).
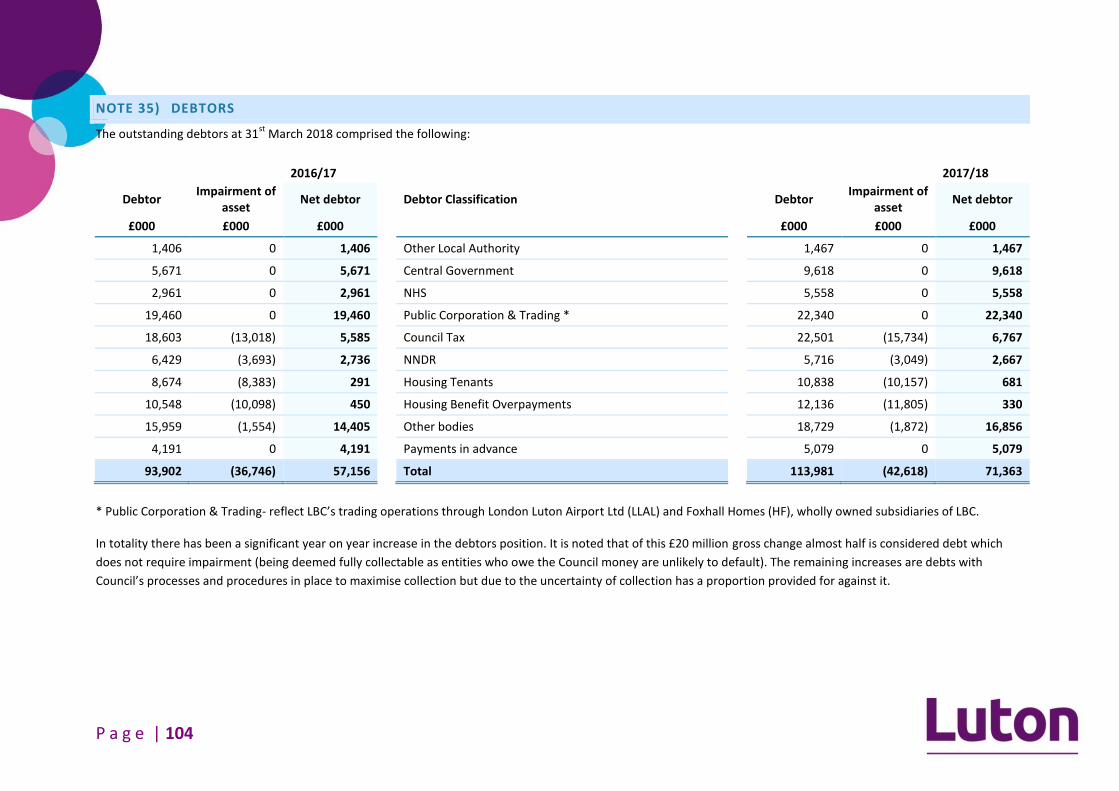
P a g e | 104
NOTE 35) DEBTORSX
The outstanding debtors at 31st
March 2018 comprised the following:
2016/17 2017/18
Debtor Impairment of
asset Net debtor Debtor Classification Debtor
Impairment of asset
Net debtor
£000 £000 £000 £000 £000 £000
1,406 0 1,406 Other Local Authority 1,467 0 1,467
5,671 0 5,671 Central Government 9,618 0 9,618
2,961 0 2,961 NHS 5,558 0 5,558
19,460 0 19,460 Public Corporation & Trading * 22,340 0 22,340
18,603 (13,018) 5,585 Council Tax 22,501 (15,734) 6,767
6,429 (3,693) 2,736 NNDR 5,716 (3,049) 2,667
8,674 (8,383) 291 Housing Tenants 10,838 (10,157) 681
10,548 (10,098) 450 Housing Benefit Overpayments 12,136 (11,805) 330
15,959 (1,554) 14,405 Other bodies 18,729 (1,872) 16,856
4,191 0 4,191 Payments in advance 5,079 0 5,079
93,902 (36,746) 57,156 Total 113,981 (42,618) 71,363
* Public Corporation & Trading- reflect LBC’s trading operations through London Luton Airport Ltd (LLAL) and Foxhall Homes (HF), wholly owned subsidiaries of LBC.
In totality there has been a significant year on year increase in the debtors position. It is noted that of this £20 million gross change almost half is considered debt which
does not require impairment (being deemed fully collectable as entities who owe the Council money are unlikely to default). The remaining increases are debts with
Council’s processes and procedures in place to maximise collection but due to the uncertainty of collection has a proportion provided for against it.

P a g e | 105
NOTE 36) CASH AND CASH EQUIVALENTS
ACCOUNTING POLICY
Cash is represented by cash in hand and deposits with financial institutions
repayable without penalty on notice of not more than 24 hours. Cash
equivalents are investments that mature in three months or under and are
readily convertible to known amounts of cash with insignificant risk of change in
value. In the Cash Flow Statement, cash and cash equivalents are shown net of
bank overdrafts that are repayable on demand and form an integral part of the
Council’s cash management.
The balance of Cash and Cash Equivalents is made up of the following elements:
31/03/2017 Cash and cash equivalents classifications
31/03/2018
£000 £000
7,007 Short-term deposits with banks 0
9,994 Money Market Funds 20,396
132 Bank current accounts 2,972
7 Cash held by the Council 21
17,140 Total 23,389

P a g e | 106
X
NOTE 37) CREDITORS X
The outstanding creditors at 31st
March 2018 comprised the following:
31/03/2017 Creditor Classification 31/03/2018
£000 £000
Short Term Creditors
(1,033) Other Local Authority (656)
(9,567) Central Government (12,510)
(1,054) NHS (1,524)
0 Public Corporations & Trading * (334)
(1,941) Council Tax (2,179)
(2,110) NNDR (1,800)
(2,255) Housing Tenants (3,204)
(35,429) Other bodies (42,678)
(53,389) Short Term Total (64,885)
Long Term Creditors
(2,795) Other bodies (2,418)
(2,795) Long Term Total (2,418)
* Public Corporation & Trading- reflect LBC’s trading operations through London
Luton Airport Ltd (LLAL) and Foxhall Homes (HF), wholly owned subsidiaries of
LBC.
NOTE 38) PROVISIONS
ACCOUNTING POLICY Provisions are made where an event has taken place that gives the Council a legal or
constructive obligation that probably requires settlement by a transfer of economic
benefits or service potential and a reliable estimate can be made of the amount of the
obligation. For instance, the Council may be involved in a court case that could eventually
result in the making of a settlement or the payment of compensation.
Provisions are charged as an expense to the appropriate service line in the Comprehensive
Income and Expenditure Statement in the year that the Council becomes aware of the
obligation and are measured at the best estimate at the Balance Sheet date of the
expenditure required to settle the obligation, taking into account relevant risks and
uncertainties.
When payments are eventually made, they are charged to the provision carried in the
Balance Sheet. Estimated settlements are reviewed at the end of each financial year –
where it becomes less than probable that a transfer of economic benefits will now be
required (or a lower settlement than anticipated is made) the provision is reversed and
credited back to the relevant service.
Where some or all of the payment required to settle a provision is expected to be
recovered from another party (e.g. from an insurance claim) it is only recognised as
income for the relevant service if it is virtually certain that reimbursement will be received
if the Council settles the obligation.
MOVEMENT IN BALANCES X
Description Opening Additions Utilised Released Closing
£000 £000 £000 £000 £000
2017/18
Employee related (743) 0 459 221 (63)
Insurance related (2,121) (1,335) 503 343 (2,610)
Business Rate Appeals (4,653) (2,926) 3,107 0 (4,472)
Contract related 0 0 0 0 0
Other provisions (666) (128) 56 0 (739)
Total (8,183) (4,389) 4,124 564 (7,884)
2016/17
Employee related (841) (502) 466 134 (743)
Insurance related (2,408) (213) 500 0 (2,121)
Business Rate Appeals (7,012) (281) 2,640 0 (4,653)
Contract related (3,050) 0 0 3,050 0
Other provisions (1,186) 38 482 0 (666)
Total (14,497) (958) 4,088 3,184 (8,183)

P a g e | 107
All provisions are reviewed annually to ensure they are at an appropriate level.
The following tables analyse provisions into current and long-term provisions:
Description Current
provision
Between 1 and 5 years
Over 5 years
Long-term total
Total Provision
£000 £000 £000 £000 £000
Employee related
(63) 0 0 0 (63)
Insurance related
(890) (1,450) (270) (1,720) (2,610)
Business Rate Appeals
(1,118) (3,354) 0 (3,354) (4,472)
Other provisions
(739) 0 0 0 (739)
Total (2,810) (4,804) (270) (5,074) (7,884)
Employee related – Represents the annual provision held for estimated
termination costs: staff redundancy costs and pension strain. As a consequence
of core funding reductions, the Council has a rolling programme of savings
projects to help plan for and set a balanced budget each year. To achieve this
and wider service objectives, a significant number of reviews are undertaken
each year to reorganise and reshape how services are delivered by the Council,
leading to reductions in the number of staff employed and consequent
termination costs.
Insurance related – The Insurance Fund provision holds the balances set aside
for potential liabilities in respect of payments that fall within the insurance
excesses. A review of the insurance provision is carried out annually using an
actuarial forecasting approach which is designed to review the appropriateness
of the provisions and reserves for the Council's self-insured claims as at the date
of the valuation. This valuation takes into account all known and outstanding
(unpaid) claims received from 1998 to date, and also makes a calculation for any
incurred but not reported claims (IBNR).
Insurance Issues – Due to the fact that many insurance claims are made and/or
settled some years after the incident to which they relate, it is not possible to
determine when any claims are likely to be settled and hence a provision is made
for insurance losses.
There is an existing provision to cover the potential liabilities in relation to the
Council’s former Insurers, Municipal Mutual Insurance (MMI). MMI were the
insurers for many Local Councils and they collapsed in September 1992. As a
mutually created local government insurance company, Councils are responsible
for meeting any shortfall on claims. The Supreme Court has determined that
employers’ liability insurance cover is triggered at the point of exposure to toxic
materials rather than when a disease starts to develop. This means that the
number of claimants that may arise in relation to policies written by MMI in the
past is very difficult to estimate.
As a result the Council established a provision in 2011/12 for the total maximum
potential liability estimated to be faced by the Council. In January 2014 the
managers of MMI’s business informed the Council that it should expect a levy
charge of 15% of the potential liability, which is £168,000. However, in view of
the uncertainty relating to the extent of such claims, the existing provision has
been retained in full at this time.
Business Rate Appeals – The Local Government Finance Act 2012 introduced a
business retention scheme that enabled local authorities to retain a proportion
of the business rates generated in their area. The new arrangements for the
retention of business rates came into effect on 1 April 2013. Luton Borough
Council, as a billing authority, is required to make provision for refunding
ratepayers who have successfully appealed against the rateable value on their
properties. The provision shown is the Council’s 49% share of the total amount.

P a g e | 108
NOTE 39) CAPITAL GRANTS RECEIPTS IN ADVANCE
The following capital grants and contributions have yet to be recognised as
income as they have conditions attached to them that will require the monies to
be returned to the giver if not met.
31/03/2017 31/03/2018
£000 £000
(4,793) Basic Needs Grant (11,143)
(3,424) Weekly Collection (2,798)
0 Highways Access Project (Local Growth Fund- DCLG)
(1,122)
0 Other Government Grants (<£1m) (1,018)
(1,512) s106 Developers' Contributions (4,128)
(109) Other Non-Government Grants (<£1m) (494)
(9,838) Total Capital Grants and Contributions
(20,703)
£6 million of the £11 million classified as ‘Basic Needs Grant’ is advanced receipt
of the 2018/19 instalment in 2017/18.
The £4.128 million classified as ‘s106 Developer Contributions’ relates to £2
million for the Luton Airport- Highways access, with another £1.206 million for
Napier Park.
NOTE 40) REVENUE GRANTS RECEIPTS IN ADVANCE
The following revenue grants and contributions have yet to be recognised as
income as they have conditions attached to them that will require the monies to
be returned to the giver if not met.
31/03/2017 31/03/2018
£000 £000
(1,355) Weekly Collection Support Grant (631)
(1,668) Family Safeguarding (1,373)
(952) Troubled Families (1,750)
(2,138) Government Grants under £1m (1,508)
(468) Other Grants and Cont. under £1m (3,087)
(6,581) Total Revenue Grants and Contributions
(8,348)
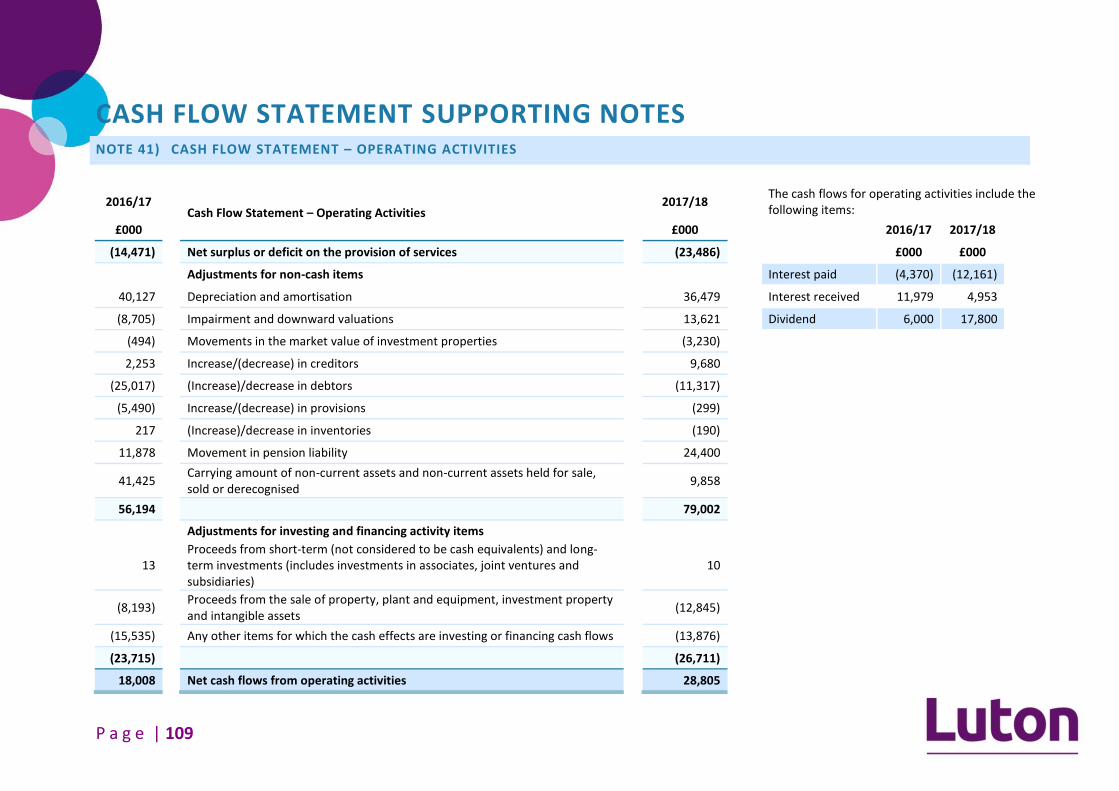
P a g e | 109
CASH FLOW STATEMENT SUPPORTING NOTESNOTE 41) CASH FLOW STATEMENT – OPERATING ACTIVITIES
2016/17 Cash Flow Statement – Operating Activities
2017/18
The cash flows for operating activities include the following items:
£000 £000
2016/17 2017/18
(14,471) Net surplus or deficit on the provision of services (23,486)
£000 £000
Adjustments for non-cash items
Interest paid (4,370) (12,161)
40,127 Depreciation and amortisation 36,479
Interest received 11,979 4,953
(8,705) Impairment and downward valuations 13,621
Dividend 6,000 17,800
(494) Movements in the market value of investment properties (3,230)
2,253 Increase/(decrease) in creditors 9,680
(25,017) (Increase)/decrease in debtors (11,317)
(5,490) Increase/(decrease) in provisions (299)
217 (Increase)/decrease in inventories (190)
11,878 Movement in pension liability 24,400
41,425
Carrying amount of non-current assets and non-current assets held for sale, sold or derecognised
9,858
56,194 79,002
Adjustments for investing and financing activity items
13
Proceeds from short-term (not considered to be cash equivalents) and long-term investments (includes investments in associates, joint ventures and subsidiaries)
10
(8,193)
Proceeds from the sale of property, plant and equipment, investment property and intangible assets
(12,845)
(15,535) Any other items for which the cash effects are investing or financing cash flows (13,876)
(23,715) (26,711)
18,008 Net cash flows from operating activities 28,805

P a g e | 110
NOTE 42) CASH FLOW STATEMENT – INVESTING ACTIVITIES
2016/17 Cash Flow Statement – Investing Activities
2017/18
£000 £000
(68,951) Purchase of property, plant and equipment, investment property and intangible assets (55,180)
(5,000) Purchase of short-term and long-term investments (10,000)
8,194 Proceeds from the sale of property, plant and equipment, investment property and intangible assets 12,846
12,750 Proceeds from short-term and long-term investments 1,500
18,114 Other receipts from investing activities 26,086
(34,893) Net cash flows from investing activities (24,748)
CASH FLOW STATEMENT – FINANCING ACTIVITIES
X
2016/17 Cash Flow Statement – Financing Activities
2017/18
£000 £000
0 Cash receipts of short- and long-term borrowing 0
1,538 Other receipts from financing activities (115)
(504) Cash payments for the reduction of the outstanding liabilities (finance leases) (899)
0 Repayments of short- and long-term borrowing 0
(1,837) Other payments for financing activities 3,206
(803) Other payments for financing activities 2,192

P a g e | 111
OTHER SUPPORTING NOTES
NOTE 43) CONTINGENT ASSETS AND LIABILITIES
A contingent liability arises where an event has taken place that gives the
authority a possible obligation whose existence will only be confirmed by the
occurrence or otherwise of uncertain future events not wholly within the control
of the authority. Contingent liabilities also arise in circumstances where a
provision would otherwise be made but either it is not probable that an outflow
of resources will be required or the amount of the obligation cannot be
measured reliably. Contingent liabilities are not recognised in the Balance Sheet
but disclosed in a note to the accounts.
A contingent asset arises where an event has taken place that gives the authority
a possible asset whose existence will only be confirmed by the occurrence or
otherwise of uncertain future events not wholly within the control of the
authority. Contingent assets are not recognised in the Balance Sheet but
disclosed in a note to the accounts where it is probable that there will be an
inflow of economic benefits or service potential.
At 31st
March 2018, the Council had received notification from the Health and
Safety Executive that it intends to prosecute the Council in relation to an incident
which occurred at a school during June 2016. There remains a level of
uncertainty surrounding whether the prosecution would be successful, and if
successful, the quantum of the fine that would be charged to the Council.
As at 31 March 2018, there is the potential for appeals in relation to charitable
relief exemption for medical facilities, which could result in an 80% reduction in
business rates payable. The potential liability to the Council, including back dated
rates, could be in the region of £2.5 million if a successful appeal is lodged. This is
regarded as a contingent liability because the existence will be confirmed only by
the occurrence or non-occurrence of one or more uncertain future events not
wholly within the control of the authority.
At 31st
March 2018, the Council had no contingent assets.
NOTE 44) RELATED PARTIES
The Council is required to disclose material transactions with related parties –
bodies or individuals that have the potential to control or influence the council or
to be controlled or influenced by the council. Disclosure of these transactions
allows readers to assess the extent to which the council might have been
constrained in its ability to operate independently or might have secured the
ability to limit another party’s ability to bargain freely with the Council.
Central Government
Central Government has effective control over the general operations of the
Council – it is responsible for providing the statutory framework, within which
the Council operates, provides the majority of its funding in the form of grants
and prescribes the terms of many of the transactions that the Council has with
other parties (e.g. council tax bills, housing benefits). Grants credited to the
Comprehensive Income and Expenditure Statement is listed in Notes 10 and 11.
Members
Members of the council have direct control over the council’s financial and
operating policies. The total of members’ allowances paid in 2017/18 is shown in
Note 14. During 2017/18 the council did not have any transactions with
organisations that Members had a pecuniary interest in.

P a g e | 112
Officers
During 2017/18 the council did not have any transactions with organisations that
Officers had a pecuniary interest in.
Other Public Bodies (subject to common control by Central Government)
Details of payments made to the Bedfordshire Pension Fund (Bedford Borough
Council) for employer’s superannuation contributions are shown in Note 33. The
Council has a number of pooled budget arrangements with NHS Luton and with
South Essex Partnership University NHS Foundation Trust. Details of these
arrangements are shown in Note 18.
Other Organisations
The Council paid five organisations monies on which it has Member or Officer
representation and which share educational, economic development, social and
cultural objectives. All payments under £1k have been evaluated as not material
from the Council, and third party, viewpoint.
Organisation 2017/18 2017/18 2017/18 2017/18
expenditure
£000 income
£000 debtor £000
creditor £000
Luton Cultural Services Trust 3,066 (278) 350 (25)
Active Luton (Leisure Trust) 542 (232) 177 (4)
Barnfield College 374 (69) 68 (227)
Marsh Farm Future 129 (8) 0 (7)
Lewsey Festival Committee 1 0 0 0
Luton BID ltd 430 (8) 0 (70)
Entities Controlled or Significantly Influenced by the Council
Details of the Council’s shareholdings and investments in London Luton Airport
Limited are disclosed in the introduction to the Group Accounts. The Council is
involved with a number of companies whose assets and liabilities are not
included in the Council’s single entity statements. Most of these companies are
small simple investments and the Council’s interest does not extend to a
relationship that could be classified as a subsidiary, associate or joint venture.
None of these companies are included in the group accounts.
London Luton Airport Limited
This company is a full subsidiary of the Council and the Group Accounts consist of
the consolidation of its financial statements with those of the Council’s. The
principal activity of the company is the ownership of airport facilities. In 1998/99
the company entered into a thirty-year concession with London Luton Airport
Operations Limited to operate the airport. The Council holds 44,837,002
ordinary £1 shares, equivalent to 100% of the company’s share capital carried at
a historic valuation of £44.837 million. It also held debentures totalling £57.921
million at 31st
March 2018. At the year ended 31st
March 2018, the company had
net assets of £466.741 million (£459.549 million at 31st
March 2017). The
2017/18 profit before tax was £31.273 million and after tax was £26.651 million
(profit before tax £52.603 million and after tax was £46.927 million for 2016/17).
A dividend of £19.5 million has been declared in 2017/18 and is due to be paid in
2018/19. Debenture interest of £3.826 million was payable by the company to
the Council during 2017/18 (£3.883 million in 2016/17).
Foxhall Homes
During 2016/17 the Council established a wholly owned subsidiary called Foxhall
Homes. The purpose of the subsidiary which has been established is to optimise
council land and property assets including the use of redundant spaces to
provide hundreds of much needed new homes. The new subsidiary has not
received/paid any cash transactions from/to the Council as of yet but is
incorporated into the Group Accounts of the Council owing to amounts owed to
the Council during 2017/18.
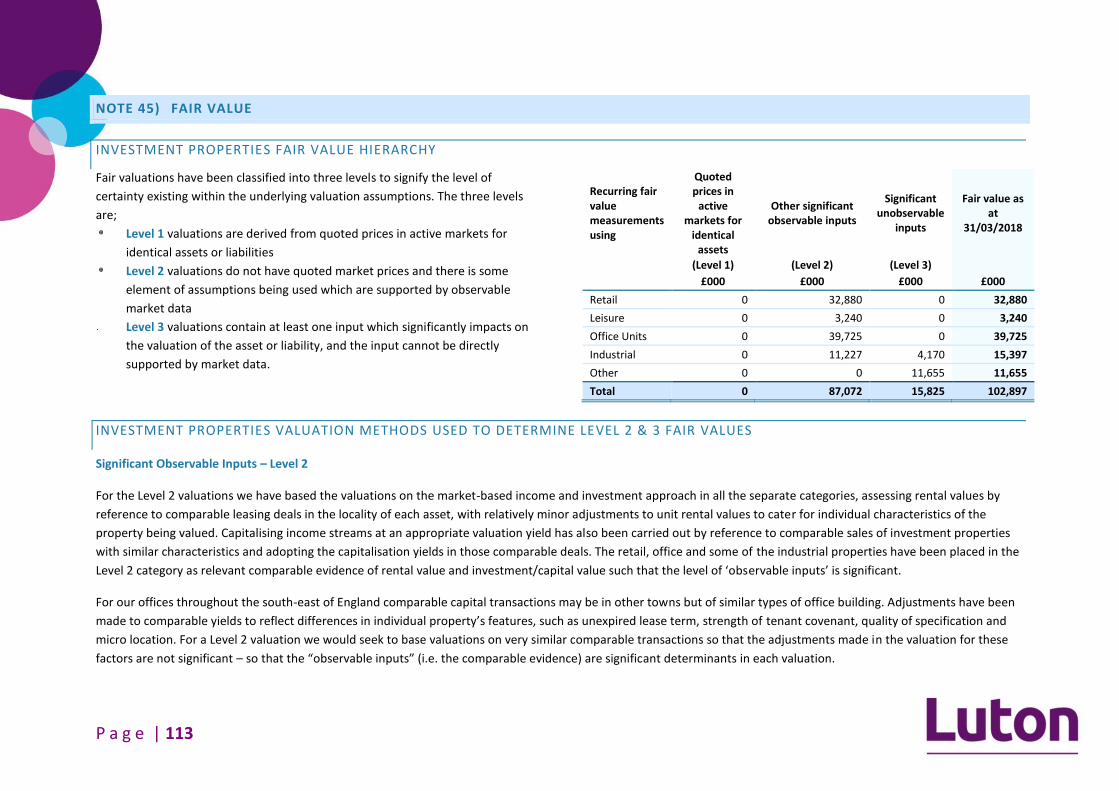
P a g e | 113
NOTE 45) FAIR VALUE
INVESTMENT PROPERTIES FAIR VALUE HIERARCHY
Fair valuations have been classified into three levels to signify the level of
certainty existing within the underlying valuation assumptions. The three levels
are;
Level 1 valuations are derived from quoted prices in active markets for
identical assets or liabilities
Level 2 valuations do not have quoted market prices and there is some
element of assumptions being used which are supported by observable
market data
Level 3 valuations contain at least one input which significantly impacts on
the valuation of the asset or liability, and the input cannot be directly
supported by market data.
Recurring fair value measurements using
Quoted prices in
active markets for
identical assets
Other significant observable inputs
Significant unobservable
inputs
Fair value as at
31/03/2018
(Level 1) (Level 2) (Level 3)
£000 £000 £000 £000
Retail 0 32,880 0 32,880
Leisure 0 3,240 0 3,240
Office Units 0 39,725 0 39,725
Industrial 0 11,227 4,170 15,397
Other 0 0 11,655 11,655
Total 0 87,072 15,825 102,897
INVESTMENT PROPERTIES VALUATION METHODS USED TO DETERMINE LEVEL 2 & 3 FAIR VALUES
Significant Observable Inputs – Level 2
For the Level 2 valuations we have based the valuations on the market-based income and investment approach in all the separate categories, assessing rental values by
reference to comparable leasing deals in the locality of each asset, with relatively minor adjustments to unit rental values to cater for individual characteristics of the
property being valued. Capitalising income streams at an appropriate valuation yield has also been carried out by reference to comparable sales of investment properties
with similar characteristics and adopting the capitalisation yields in those comparable deals. The retail, office and some of the industrial properties have been placed in the
Level 2 category as relevant comparable evidence of rental value and investment/capital value such that the level of ‘observable inputs’ is significant.
For our offices throughout the south-east of England comparable capital transactions may be in other towns but of similar types of office building. Adjustments have been
made to comparable yields to reflect differences in individual property’s features, such as unexpired lease term, strength of tenant covenant, quality of specification and
micro location. For a Level 2 valuation we would seek to base valuations on very similar comparable transactions so that the adjustments made in the valuation for these
factors are not significant – so that the “observable inputs” (i.e. the comparable evidence) are significant determinants in each valuation.

P a g e | 114
Significant Observable Inputs – Level 3
Those assets that are in the categories of some ‘Industrial’ properties, the development sites and all of those categorised as ‘Others’ have been placed in the Level 3
category. The valuation method is largely similar to that used for Level 2 properties, assessing rental values and capital values separately and applying suitable investment
yields to income streams, but more significant adjustments to rents and yields deriving from other transactions may have been applied, using the valuer’s experience and
judgement of the property investment market, than the minor adjustments made in Level 2 valuations. Where the comparable evidence of similar assets is thin, or where
the adjustments we have to make to the valuations using the valuer’s judgement are material, and are thus ‘unobservable inputs’, we would place the valuations in the
Level 3 category. There have been no transfers between level 2 and level 3 categories.
Quantitative information about Fair Value measurement of Investment properties using significant Unobservable Inputs – Level 3
Category 31/03/2018 Value Valuation Method Unobservable Inputs Range Sensitivity
Industrial £4.170 million Income and Investment Yield market approach
Investment yields 5.0% - 11.5% Significant changes in the
investment yield used will result in significant change to capital value
Others £11.655 million
Income and investment yield market approach and site valuation by market
Site values; residential £800,000 - £1,000,000 per acre
Significant changes in any of these variables/inputs are likely to have a
material impact on the fair value capital valuations
Comparable evidence Site values; commercial £500,000 per acre
Comparable evidence Investment yields 7.25% - 15%
Comparable evidence Playing field values £20,000 per acre
Comparable evidence Rental value of health centres £12.00 - £12.50 per sq ft
FINANCIAL INSTRUMENTS FAIR VALUE HIERARCHY
The only financial instruments held by the Council which are classified as Available for sale are the investments in London Luton Airport Ltd. These investments are held at
historical cost as there is no active market or reliable market comparators which could be used to generate a supported fair value. The Council reviews the subsidiaries
accounts on annual basis to ensure no impairment is required to the value of the investment held on the balance sheet. These valuations are therefore classified as level 3.

P a g e | 115
04 Supplementary Statements and Supporting Notes
Housing Revenue Account (HRA) and Supporting Notes Page 117
Collection Fund Statements and Supporting Notes Page 120
Group Accounts and Supporting Notes Page 123
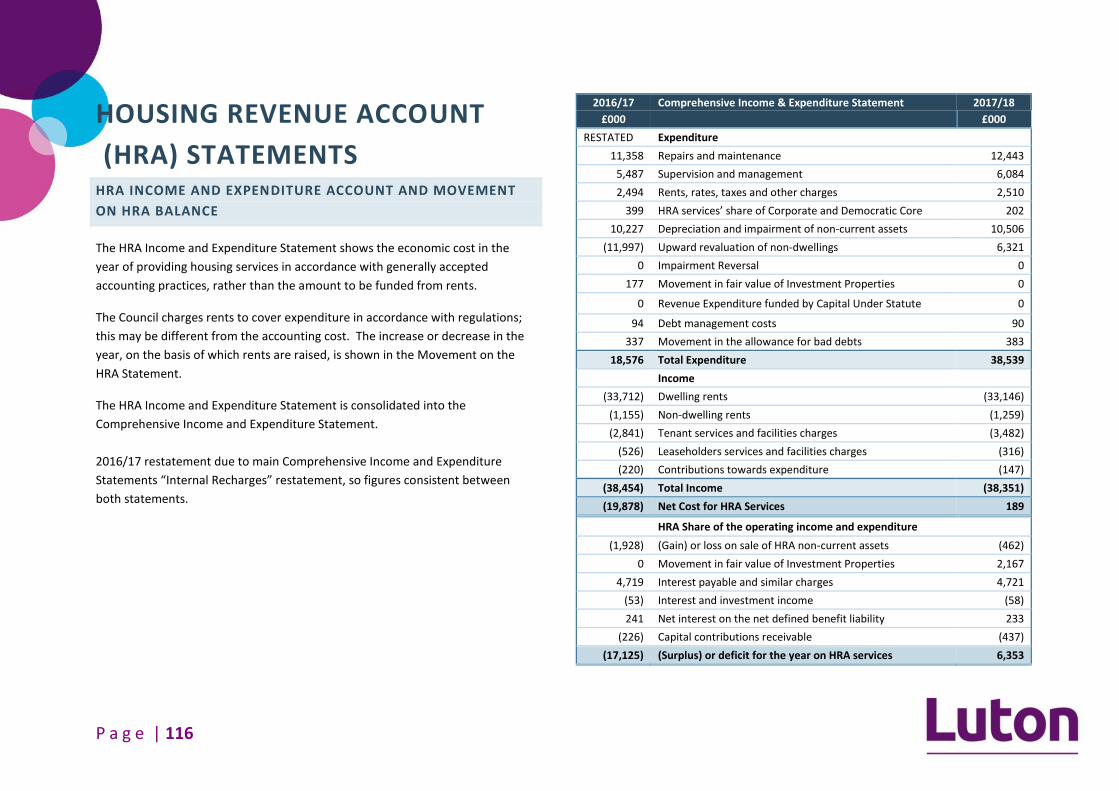
P a g e | 116
HOUSING REVENUE ACCOUNT
(HRA) STATEMENTS HRA INCOME AND EXPENDITURE ACCOUNT AND MOVEMENT
ON HRA BALANCE
The HRA Income and Expenditure Statement shows the economic cost in the
year of providing housing services in accordance with generally accepted
accounting practices, rather than the amount to be funded from rents.
The Council charges rents to cover expenditure in accordance with regulations;
this may be different from the accounting cost. The increase or decrease in the
year, on the basis of which rents are raised, is shown in the Movement on the
HRA Statement.
The HRA Income and Expenditure Statement is consolidated into the
Comprehensive Income and Expenditure Statement.
2016/17 restatement due to main Comprehensive Income and Expenditure
Statements “Internal Recharges” restatement, so figures consistent between
both statements.
2016/17 Comprehensive Income & Expenditure Statement 2017/18
£000 £000
RESTATED Expenditure
11,358 Repairs and maintenance 12,443
5,487 Supervision and management 6,084
2,494 Rents, rates, taxes and other charges 2,510
399 HRA services’ share of Corporate and Democratic Core 202
10,227 Depreciation and impairment of non-current assets 10,506
(11,997) Upward revaluation of non-dwellings 6,321
0 Impairment Reversal 0
177 Movement in fair value of Investment Properties 0
0 Revenue Expenditure funded by Capital Under Statute 0
94 Debt management costs 90
337 Movement in the allowance for bad debts 383
18,576 Total Expenditure 38,539
Income
(33,712) Dwelling rents (33,146)
(1,155) Non-dwelling rents (1,259)
(2,841) Tenant services and facilities charges (3,482)
(526) Leaseholders services and facilities charges (316)
(220) Contributions towards expenditure (147)
(38,454) Total Income (38,351)
(19,878) Net Cost for HRA Services 189
HRA Share of the operating income and expenditure
(1,928) (Gain) or loss on sale of HRA non-current assets (462)
0 Movement in fair value of Investment Properties 2,167
4,719 Interest payable and similar charges 4,721
(53) Interest and investment income (58)
241 Net interest on the net defined benefit liability 233
(226) Capital contributions receivable (437)
(17,125) (Surplus) or deficit for the year on HRA services 6,353

P a g e | 117
MOVEMENT ON THE HRA STATEMENT
This statement takes the outturn on the HRA income and expenditure Statement
and reconciles it to the surplus or deficit for the year on the HRA Balance,
calculated in accordance with the requirements of the Local Government and
Housing Act 1989.
It is consolidated into the Movement in Reserves Statement.
2016/17 Movement in Reserves Statement 2017/18
£000 £000
(8,189) Balance on the HRA at the end of the previous year (8,311)
(17,125) (Surplus) or deficit for the year on HRA services 6,353
Adjustments between accounting and funding basis:
(10,227) Charges for depreciation and impairment of non-current assets
(10,506)
11,997 Revaluation losses on Property, Plant and Equipment (6,321)
(177) Movements in the market value of Investment Properties (2,167)
0 Revenue Expenditure funded from Capital under Statute 0
(5,498) Non-current assets written off on disposal or sale as part of the gain/loss on disposal
(5,573)
226 Capital grants and contributions applied to capital financing
437
7,550 Transfer of cash sale proceeds credited as part of the gain/loss on disposal
6,128
(124) Contribution from the Capital Receipts Reserve towards administrative costs of disposals
(92)
1,729 Capital expenditure charged against the General Fund and HRA balances
1,603
9,965 Reversal of Major Repairs Allowance credited to the HRA 10,178
7 Amount by which finance costs differ from costs chargeable in accordance with statute
5
(325) Reversal of items relating to retirement benefits debited or credited to the statement
(1,045)
207 Employer’s pensions contributions and direct payments to pensioners payable in the year
550
18 Amount by which officer remuneration charged on an accruals basis differs from remuneration chargeable in accordance with statute
(15)
(1,777) Net (increase) or decrease before transfers to or from reserves
(466)
1,655 Transfer to or (from) earmarked reserves 466
(122) (Increase) or decrease in year on the HRA (0)
(8,311) Balance on the HRA at the end of the current year (8,311)

P a g e | 118
HRA STATEMENT SUPPORTING NOTES
HRA 1) MOVEMENTS IN ASSET VALUES
X
Dwellings £000
Land & Buildings £000
VPFE £000
Surplus £000
Investment Property £000
2017/18 Total £000
2016/17 £000
Opening 452,039 6,920 29 2,974 5,045 467,007 409,814
Additions/Transfer 19,905 (70) 0 175 3,944 23,954 11,534
Depreciation (10,205) (291) (10) 0 0 (10,506) (10,227)
Revaluations 7,354 233 0 1,756 (2,167) 7,176 61,384
Disposals (4,598) (232) 0 (743) 0 (5,573) (5,498)
Closing 464,495 6,560 19 4,162 6,822 482,058 467,007
HRA 2) HOUSING STOCK
Balance Sheet Date
Houses and bungalows
Flats Total
1 Bedroom 2 Bedrooms 3 Bedrooms >3 Bedrooms 1 Bedroom 2 Bedrooms 3 Bedrooms
31-Mar-17 126 770 2,599 131 2,363 1,580 226 7,795
31-Mar-18 125 768 2,562 129 2,361 1,594 223 7,762
Change (1) (2) (37) (2) (2) 14 (3) (33)
The average dwelling value is £0.060 million (£0.058 million in 2016/17).
HRA 3) VACANT POSSESSION VALUES
The vacant possession value of dwellings as at 31st
March 2018 is £1,220 million
(£1,187 million in 2016/17). The vacant possession value of a property is defined
as an opinion of the best price at which the sale of the property would have been
completed unconditionally for cash consideration on the date of the valuation.
The difference between the vacant possession value and the balance sheet value
shows the economic cost to the Government of providing council housing at less
than open market value.

P a g e | 119
HRA 4) MAJOR REPAIRS RESERVE
Authorities are required by regulation to establish and maintain a Major Repairs
Reserve. The main credit to the account comprises the total depreciation charge
for all Housing Revenue Account assets. Capital spending on Housing Revenue
Account assets is then funded from the reserve without being charged to the
Housing Revenue Account. The movements of the Major Repairs Reserve can be
found in Note 20.
HRA 5) CAPITAL EXPENDITURE AND FINANCING
Capital Financing 2016/17 2017/18
£000 £000
Prudential Borrowing 7,022 4,648
Capital Grants 225 437
Direct Revenue Financing 1,729 1,603
Major Repairs Reserve 8,832 9,585
Capital Receipts 2,314 1,394
Total Capital Expenditure 20,122 17,667
The £4.648 million is with regard to Marsh Farm Re-development solely.
HRA 6) CAPITAL RECEIPTS RECONCILIATION
X
Capital Receipts 2016/17 2017/18
£000 £000
Sale of Council Houses (8,348) (7,046)
Mortgage receipts 0 0
HRA receipts in year (8,348) (7,046)
Less: Statutory pooling 658 651
Total Capital Receipts (7,691) (6,395)
HRA 7) RENT AND ARREARS
Central Government policy is to reduce housing rents by 1% per year for the four
years until 2020/21.
Type Number of Bedrooms
Lowest Highest Typical
£ £ £
Ho
use
s &
Bu
nga
low
s 1 54.67 113.90 80.95
2 71.56 163.10 89.22
3 76.60 163.10 96.35
4 or more 92.52 119.88 104.62
Flat
s
1 46.62 119.79 74.26
2 56.53 152.58 82.33
3 85.28 98.54 90.78
Rent arrears at 31st
March 2018 were £2.744 million (£2.424 million at 31st
March
2017), against which a provision for bad debt of £2.640 million (£2.315 million at
31st
March 2017) has been made.

P a g e | 120
COLLECTION FUND STATEMENTS
COLLECTION FUND ANNUAL STATEMENT
The Collection Fund is an agent’s statement that reflects the statutory obligation
for billing authorities to maintain a separate Collection Fund. The statement
shows the transactions of the billing authority in relation to the collection from
taxpayers and distribution to local authorities and the Government of Council Tax
and non-domestic rates.
2016/17 2016/17 2017/18 2017/18
NNDR Council
Tax Collection Fund Statement NNDR
Council Tax
£000 £000 £000 £000
Income
- (79,319) Income from Council Tax - (84,093)
(68,590) - Income collectable from business rates (66,295) -
(68,590) (79,319) Total Income (66,295) (84,093)
Expenditure
Prior year estimated surplus / (deficit)
437 - Central Government (2,935) -
428 (912) Luton Borough Council (2,876) 564
- (117) Bedfordshire Police Authority - 71
9 (65) Beds and Luton Combined Fire Authority (59) 40
874 (1,094) Total Prior years estimated surplus / (deficit)
(5,869) 674
Precepts and Demands
33,963 - Central Government 32,463 -
33,284 63,528 Luton Borough Council 31,814 67,438
- 8,004 Bedfordshire Police Authority - 8,260
679 4,473 Beds and Luton Combined Fire Authority 649 4,616
67,926 76,005 Total Precepts and Demands 64,926 80,314
Charges to Collection Fund
255 - Costs of Collection 246 -
381 173 Write-offs charged to Collection Fund 2,860 136
(90) 1,702 Change in allowance for impairment (1,314) 2,740
(2,640) 0 Appeals charged to Collection Fund (3,295) 0
(2,174) 0 Change in provision for appeals 2,926 0
(252) - Transitional Protection payments 1,227 -
(4,520) 1,875 Total Charges to Collection Fund 2,651 2,876
64,280 76,786 Total Expenditure 61,708 83,864
(4,310) (2,533) Deficit/(Surplus) for year (4,587) (229)

P a g e | 121
COLLECTION FUND MOVEMENT IN RESERVES
The surplus generated in 2017/18 for Business Rates and Council Tax has
improved the level of reserves held for both funds.
The closing reserves balances can then be split by the major preceptors. This is
shown in the following note.
2016/17 2016/17 2017/18 2017/18
NNDR Council
Tax Collection Fund Statement NNDR
Council Tax
£000 £000 £000 £000
Movement in Collection Fund Balance during year
(4,310) (2,533) Deficit/(Surplus) for year (4,587) (229)
7,908 (702) Deficit/(Surplus) brought forward 3,598 (3,235)
3,598 (3,235) Deficit/(Surplus) carried forward (989) (3,464)
COLLECTION FUND SUPPORTING NOTES
CF 1) SPLIT OF THE COLLECTION FUND BALANCES SHARE BY MAJOR PRECEPTOR
Council Tax reserves are split across the major preceptors based on the precept
demands place on the Collection Fund.
Business Rates are proportioned based on a set percentage across the major
preceptors.
50% Central Government
49% Luton Borough Council
1% Beds and Luton Combined Fire Authority
2016/17 2016/17 2017/18 2017/18
NNDR Council
Tax Major preceptor splits NNDR
Council Tax
£000 £000 £000 £000
1,799 - Central Government (495) -
1,763 (2,686) Luton Borough Council (485) (2,909)
- (352) Bedfordshire Police Authority - (356)
36 (197) Beds and Luton Combined Fire Authority
(10) (199)
3,598 (3,235) Total reserve balance (989) (3,464)
X

P a g e | 122
CF 2) INCOME FROM BUSINESS RATES
The Council is a billing authority and collects from local businesses an amount equal to the rateable value of their property, multiplied by the uniform rate set nationally by
government. In unitary authority areas such as Luton, the Council will retain 49% of the rates yield.
There is inherent volatility in the Non-Domestic Rates yield as the tax base is based on notional property rental values. The Council now benefits from any growth in yield,
subject to a levy on disproportionate gains, but also shares the risk of any negative volatility in yield, subject to a national safety net system that will ensure retained yield
does not fall below 92.5% of the Council’s baseline funding requirement as determined by the Government.
Ratepayers have a right to appeal against the rateable value attributed to their property under certain circumstances. It is necessary to establish a provision for the
estimated loss in yield, but it is difficult to form an accurate estimate of the potential liability to the Council that will arise due to outstanding rating appeals because
appeals are determined independently by the Valuation Office Agency or, in some cases, the Valuation Tribunal.
The total 2017 non-domestic rateable value at 31st
March 2018 was £171.3 million (£170.5 million at 31st
March 2017). The 2017/18 rating multiplier set by central
government was 47.9p per £ (49.7p per £ in 2016/17) and the 2017/18 small business multiplier was 46.6p per £ (48.4p in 2016/17).
CF 3) INCOME FROM COUNCIL TAX
The Council’s tax base for 2017/18 was 49,733.30 (49,151.29 in 2016/17). This is the number of chargeable dwellings in each of the valuation bands adjusted for discounts
and non-collection and converted into an equivalent number of band D properties. X
Band Value at April 1991 Number of Dwellings Ratio (9th
) Council Tax
A Disabled Relief 13 5 £958.48
A Under 40,000 18,253 6 £1,076.59
B 40,000 – 52,000 26,599 7 £1,256.02
C 52,000 – 68,000 22,401 8 £1,435.46
D 68,000 – 88,000 7,731 9 £1,614.88
E 88,000 – 120,000 3,404 11 £1,973.74
F 120,000 – 160,000 1,051 13 £2,332.61
G 160,000 – 320,000 258 15 £2,691.47
H Over 320,000 32 18 £3,229.76

P a g e | 123
GROUP ACCOUNTS
ACCOUNTING POLICY
BASIS OF CONSOLIDATION
Subsidiaries are entities that the Council has the power to govern. In the
Council’s financial statements, the investment in the subsidiary is carried at cost.
In the Group financial statements, the subsidiary is accounted for using the
acquisition accounting method where assets, liabilities, revenue and expenditure
are added in on a line-by-line basis.
The Group Accounts include all supporting notes which are materially changed by
the amalgamation with the subsidiary’s financial statements.
The Luton Borough Council Group consists of Luton Borough Council, London
Luton Airport Limited (a wholly owned subsidiary of the Council) and Foxhall
Homes Limited (a wholly owned subsidiary of the Council). The Group Accounts
have been prepared on the basis of a full consolidation; this means that all
transactions between the Group entities are eliminated.
The Group only includes these two subsidiaries and no joint ventures or
associates.
LONDON LUTON AIRPORT LIMITED
This company is a full subsidiary of the Council and the Group Accounts consist of
the consolidation of its financial statements with those of the Council’s.
The principal activity of the company is the ownership of airport facilities. In
1998/99 the company entered into a thirty-year concession with London Luton
Airport Operations Limited to operate the airport. The Council holds 44,836,999
ordinary £1 shares, equivalent to 100% of the company’s share capital carried at
a historic valuation of £44.837 million. It also held debentures totalling £57.921
million at 31st
March 2018.
At the year ended 31st
March 2018, the company had net assets of £466.741
million (£459.549 million at 31st
March 2017). The profit before tax was £31.273
million and after tax was £26.651 million (profit before tax £52.603 million and
after tax was £46.927 million for 2016/17).
A dividend of £19.5 million has been declared in 2017/18 and is due to be paid in
2018/19. Debenture interest of £3.862 million was payable by the company to
the Council during 2017/18 (£3.883 million in 2016/17).
Taxation
Taxation expense for the period comprises current and deferred tax recognised
in the reporting period. Tax is recognised in the profit and loss account, except to
the extent that it relates to items recognised in other comprehensive income or
directly in equity. In this case tax is also recognised in other comprehensive
income or directly in equity respectively. Current or deferred taxation assets and
liabilities are not discounted.
(i) Current tax
Current tax is the amount of income tax payable in respect of the taxable profit
for the year or prior years. Tax is calculated on the basis of tax rates and laws
that have been enacted or substantively enacted by the period end.
Management periodically evaluates positions taken in tax returns with respect to
situations in which applicable tax regulation is subject to interpretation. It
establishes provisions where appropriate on the basis of amounts expected to be
paid to the tax authorities.
P a g e | 124
(ii) Deferred tax
Deferred tax arises from timing differences that are differences between taxable
profits and total comprehensive income as stated in the financial statements.
These timing differences arise from the inclusion of income and expenses in tax
assessments in periods different from those in which they are recognised in
financial statements.
Deferred tax is recognised on all timing differences at the reporting date except
for certain exceptions. Unrelieved tax losses and other deferred tax assets are
only recognised when it is probable that they will be recovered against the
reversal of deferred tax liabilities or other future taxable profits.
Deferred tax is measured using tax rates and laws that have been enacted or
substantively enacted by the period end and that are expected to apply to the
reversal of the timing difference.
Concession Contracts
On 20 August 1998 (‘the concession date’) the company entered into a
concession contract with an unrelated entity, London Luton Airport Operations
Limited (“LLAOL”).
Under the terms of this contract LLAOL was granted a concession to operate the
airport for a period of 30 years (‘the concession period’) and a lease over the
company’s land and buildings. In return LLAOL undertook to pay an annual
concession fee to the company comprising of £3 million as a minimum fixed
payment or a greater amount based on workload units (being each departing and
arriving passenger and each 100 tonnes of freight) as prescribed in the
concession agreement and, subject to the continuing growth of passenger
numbers, fund an extensive capital investment programme. At the end of the
concession period the assets, liabilities and operations of the airport revert to
the ownership and use of the company.
In August 2012 a supplemental agreement to the concession contract was
reached between LLAL and LLAOL. This agreement commits the operators to
undertake a significant programme of development works to increase the
Airport’s capacity to handle throughput of up to 18 million passengers per year,
in return for an extension of the Concession Period to March 31st 2031. The
concession agreement was further amended in January 2014 to provide for a
scheme to rebate the Concession Fee Rate payable by the airport operator in
certain circumstances, in order to encourage passenger growth.
At the concession date the trading assets and liabilities of the company were
transferred to LLAOL at book value. No profit or loss arose on the transfer of
these assets and liabilities. The employees of the company were also transferred
to LLAOL.
As the company no longer operates the airport itself, the land and buildings have
become investment properties. At the instruction of the company, Deloitte LLP
has valued the freehold interest in London Luton Airport as at 31st
March 2016.
The next valuation is due to be undertaken as at 31st
March 2020; it has,
however, been agreed that, given the rate at which passenger numbers are
currently growing, and the other developments currently being carried out by
the company, the valuation will be reviewed annually in the intervening periods
to ensure the investment properties are reflected at fair value.
Fixed Assets
The company includes investment properties at their fair value at the balance
sheet date on the basis of the external valuer’s valuation. Any gains or losses
through the change in fair value are recorded through the income statement.
Given the rapid growth in passenger numbers at the airport over the past two years, and the acquisition by the company of a number of strategic property assets adjacent to or connected with the airport, the Board commissioned a full

P a g e | 125
valuation as at 31st March 2016, and this has been reviewed and updated at 31st March 2018.
The balance of Property, Plant & Equipment consists of expenditure incurred to date on the Direct Air Rail Transit (DART) project. This is not operational as of 31st March 2018 and therefore it is classified as Assets Under Construction and is therefore valued at historical cost.
The ongoing capital expenditure incurred in relation to the major schemes is only capitalised when it meets the definition of an asset and the future economic benefits or service potential will flow to the authority, and the cost of the item can be measured reliably.
FOXHALL HOMES LIMITED
This company is a full subsidiary of the Council and the Group Accounts consist of
the consolidation of its financial statements with those of the Council’s.
2017/18 represents the first year of inclusion within the Group accounts of
Foxhall Homes Ltd, this includes the period from inception (February 2017) to the
Balance sheet date (31st
March 2018). The period of February to March 2017
having been previously been assessed as immaterial to 2016/17 accounts.
The principal activity of the company is to provide the Council with a means to
develop a mix of property types of different tenures, maximising resources to
assist in the delivery of much needed homes. The Council holds 1 ordinary £1
shares, equivalent to 100% of the company’s share capital.
At the year ended 31st
March 2018, the company had net assets of negative
£0.470 million (net liabilities). The loss before and after tax was £0.470 million.

P a g e | 126
GROUP COMPREHENSIVE INCOME AND EXPENDITURE STATEMENT
This statement shows the accounting cost of providing service for the group in accordance with generally accepted accounting practices. Councils raise taxation and other
charges to cover expenditure in accordance with regulations which may differ from the accounting cost.
X
31/03/2017 RESTATED
31/03/2018
Spend Income Net Spend Group Spend Income Net Spend
£000 £000 £000 £000 £000 £000
7,375 (1,273) 6,102 Chief Executive 4,748 (1,313) 3,435
58,819 (15,904) 42,915 Place and Infrastructure 64,985 (16,051) 48,934
121,660 (108,212) 13,448 Customer and Commercial 122,114 (109,282) 12,832
31,423 (19,292) 12,131 Public Health, Commissioning & Procurement 29,040 (16,548) 12,492
137,456 (32,706) 104,750 People 166,742 (50,617) 116,125
177,984 (173,626) 4,358 Schools Individual Budgets 174,782 (172,358) 2,424
18,576 (38,454) (19,878) Housing Revenue Account 38,539 (38,351) 189
279 (20) 259 Other Corporate Accounts 334 (1,208) (874)
553,572 (389,487) 164,085 Total Net Cost of Services 601,284 (405,726) 195,558
33,344 Other operating expenditure (2,848)
(46,073) Financing and investment income and expenditure (Note GRP 1) (28,391)
(171,688) Taxation and non-specific grant income (152,136)
(20,332) (Surplus) or Deficit on Provision of Services 12,183
5,674 Tax expenses of subsidiary (LLAL) 4,622
0 Tax expenses of subsidiary (Foxhall Homes) 0
(14,658) Group (Surplus) or Deficit on Provision of Services 16,805
(95,379) Surplus or deficit on revaluation of Property, Plant and Equipment assets (41,827)
76,996 Re-measurements of the net defined benefit liability (7,915)
(18,383) Other Comprehensive Income and Expenditure (49,742)
(33,041) Total Comprehensive Income and Expenditure (32,937)
2016/17 restated to include “Internal Recharges” within departmental segments, not on its own line separately; this has not changed the “total net cost of services”.

P a g e | 127
GROUP MOVEMENT IN RESERVES STATEMENT
This statement summarises the differences between the outturn on the Group Comprehensive Income and Expenditure Account and the movement on the General Fund
Balance and Housing Revenue Account. It also shows the movement in the year on the different reserves held by the Council, analysed into ‘usable reserves’ (i.e. those that
can be applied to fund expenditure or reduce local taxation) and other reserves. The Surplus or (Deficit) On the Provision of Services Line shows the true economic cost of
providing the Council’s services, more details of which are shown in the Comprehensive Income and Expenditure Statement.
Group General
Fund Balance
Housing Revenue Account
Major Repairs Reserve
Capital Receipts Reserve
Capital Grants
Unapplied Reserve
LLAL Profit &
Loss Account
Foxhall Homes Profit &
Loss Account
Total Usable
Reserves
Unusable Reserves
Total Council
Reserves
£000 £000 £000 £000 £000 £000 £000 £000 £000 £000
Balance at 31 March 2016 (71,187) (8,405) (1,406) (11,067) (6,884) (402,629) 0 (501,578) (480,788) (982,366)
Opening Bal. Adjustment 0 88 88
Revised Balance at 31 March 2016 (71,187) (8,405) (1,406) (11,067) (6,884) (402,629) 0 (501,578) (480,700) (982,278)
Movement in Reserves 2016/17
Total Comprehensive Income & Expenditure 31,596 (17,125) (29,004) 0 (14,533) (18,508) (33,041)
Adj. between accounting basis & funding basis under regulations
(37,329) 15,348 (1,133) (6,112) 1,390 0 0 (27,836) 27,836 0
(Increase) or Decrease in 2016/17 (5,733) (1,777) (1,133) (6,112) 1,390 (29,004) 0 (42,369) 9,328 (33,041)
Balance at 31 March 2017 (76,920) (10,182) (2,539) (17,179) (5,494) (431,633) 0 (543,947) (471,372) (1,015,319)
Movement in Reserves 2017/18
Total Comprehensive Income & Expenditure 17,133 6,353 0 0 0 (7,193) 470 16,759 (49,696) (32,937)
Adj. between accounting basis & funding basis under regulations
(20,561) (6,818) (593) (1,956) 1,509 0 0 (28,418) 28,418 0
(Increase) or Decrease in 2017/18 (3,427) (465) (593) (1,956) 1,509 (7,193) 470 (11,655) (21,282) (32,937)
Balance at 31 March 2018 (80,348) (10,647) (3,132) (19,135) (3,985) (438,826) 470 (555,603) (492,655) (1,048,258)

P a g e | 128
GROUP BALANCE SHEET
The group balance sheet shows the value of assets and liabilities recognised by
the group. These are funded by the usable and unusable reserves of the Council.
The significant change year on year within Investment Properties, is further
outlined in Note GRP3.
31/03/2017 Net Assets (Group) 31/03/2018
£000 £000
1,098,951 Property, Plant & Equipment (Note GRP 3) 1,153,890
649,536 Investment Property (Note GRP 3) 674,122
1,045 Intangible Assets 898
5,806 Heritage Assets 5,881
1,833 Long Term Investments (Note GRP 6) 1,831
355 Long Term Debtors 328
1,757,526 Total Long Term Assets 1,836,950
5,005 Short Term Investments 3,503
668 Inventories 1,533
44,741 Short Term Debtors (Note GRP 4) 57,926
37,286 Cash and Cash Equivalents (Note GRP 5) 27,718
87,700 Total Current Assets 90,680
0 Cash and Cash Equivalents (Bank Overdrawn) 0
(2,391) Short Term Borrowing (2,396)
(56,432) Short Term Creditors (Note GRP 7) (74,649)
(3,102) Current Provisions (Note GRP 8) (2,810)
(6,581) Revenue Receipts in Advance (8,348)
(68,506) Total Current Liabilities (88,203)
(59,333) Non Current Provisions (Note GRP 8) (59,037)
(9,838) Capital Grants Receipts in Advance (20,703)
(2,795) Long Term Creditors (2,418)
(23,929) Other Long Term Liabilities (23,030)
(394,805) Net Pensions Asset/Liability (Note GRP 9) (411,185)
(270,701) Long Term Borrowing (274,796)
(761,401) Total Long Term Liabilities (791,169)
1,015,319 Total Net Assets 1,048,258

P a g e | 129
GROUP BALANCE SHEET (CONTINUED…)
31/03/2017 Reserves (Group) 31/03/2018
£000 £000
(76,920) General Fund Reserves (80,348)
(10,182) Housing Revenue Account (10,647)
(2,539) Major Repairs Reserve (3,132)
(17,179) Capital Receipts Reserve (19,135)
(5,494) Capital Grants Unapplied (3,985)
(431,633) LLAL Profit & Loss Account (438,825)
0 Foxhall Homes Profit & Loss Account 470
(543,947) Total Usable Reserves (555,603)
(234,583) Revaluation Reserve (267,313)
(631,917) Capital Adjustment Account (634,828)
392,653 Pensions Reserve 409,179
1,159 Financial Instruments Adjustment Account 1,095
(22) Deferred Capital Receipts (17)
(923) Collection Fund Adjustment Account (3,394)
2,261 Accumulated Leave Reserve 2,623
(471,372) Unusable Reserves (492,655)
(1,015,319) Total Reserves (1,048,258)

P a g e | 130
GROUP CASH FLOW STATEMENT
The group cash flow statement shows the changes in the cash and cash equivalents of the Group, classifying cash flows as operating, investing and financing activities for
the Group. Operating cash flow shows the funding and expenditure on services for the group. Investing activities shows the extent to which cash outflows are made to
contribute to future service delivery of the group. Cash flows from financing activities show payments and receipts for investing and borrowing activities.
31/03/2017 Group 31/03/2018
£000 £000
14,533 Net surplus or (deficit) on the provision of services (16,759)
37,640 Adjustments to net surplus or deficit on the provision of services for non-cash movements see note GRP10 80,938
(23,715) Adjustments for items included in the net surplus or deficit on the provision of services that are investing and financing activities see note GRP10
(26,711)
28,458 Net cash flows from Operating Activities 37,468
(37,379) Investing Activities see note GRP11 (49,227)
(1,025) Financing Activities see note GRP12 2,192
(9,946) Net increase or decrease in cash and cash equivalents (9,568)
47,232 Cash and cash equivalents at the beginning of the reporting period 37,286
37,286 Cash and cash equivalents at the end of the reporting period 27,718

P a g e | 131
SUPPORTING NOTES TO THE GROUP STATEMENTS
GRP 1) FINANCING AND INVESTMENT INCOME AND
EXPENDITURE
31/03/2017 31/03/2018
£000 £000
11,983 Interest payable and similar charges 12,092
10,650 Net interest on the net defined benefit liability 10,383
(503) Interest receivable and similar income (445)
(66,734) Income and expenditure in relation to investment properties and changes in their fair value
(51,396)
0 Dividends Receivable 0
(1,469) Trading and other investment activities 974
(46,073) Total Financing and Investment Income and Expenditure
(28,391)
Inter group debenture interest of £4.603 million and the dividend of £19.5
million has been removed from the single entity amounts. The LLAL operating
profit is then included.
GRP 2) EXTERNAL AUDIT COSTS
2016/17 2017/18
£000 £000
156 Single entity audit costs (Note 15) 147
33 LLAL audit services procured from PWC LLP 45
0 Foxhall Homes audit services procured from PWC LLP 10
189 External Audit Costs Total 202
GRP 3) PROPERTY, PLANT & EQUIPMENT AND INVESTMENT
PROPERTIES
The following items of income and expense have been accounted for in the
Financing and Investment Income and Expenditure line in the Comprehensive
Income and Expenditure Statement:
2016/17 Investment properties income & expenditure net (gain)/loss on operations
2017/18
£000 £000
(48,279) Rental income from investment property (52,973)
3,889 Direct operating expenses arising from investment property
137
(32,670) Net gains/losses from fair value adjustments (7,925)
10,326 Charitable Donations 9,365
(66,734) Net (gain)/loss on investment property (51,396)
The following table summarise the movement in the fair value of investment
properties over the year:
2016/17 Investment properties movement in value 2017/18
£000 £000
599,083 Opening Balance 649,536
18,088 Additions - Purchases 17,038
0 Disposals (43)
32,670 Total gains/losses in Surplus or Deficit on the Provision of Services resulting from changes in the fair value
7,925
(305) Transfers (to/from Inventories or PPE) (334)
649,536 Balance at end of the year 674,122
For Investment Property Fair Value explanations please see Note GRP15.

P a g e | 132
The following table summarise the movement in the fair value of property, plant and equipment over the year:
2016/17 Property, Plant & Equipment movement in value 2017/18
£000 £000
1,016,452 Opening Balance 1,098,952
58,226 Additions - Purchases 72,506
(5,733) Disposals (9,598)
8,705 Total gains/losses in Surplus or Deficit on the Provision of Services resulting from changes in the fair value (13,621)
21,607 Other Adjustments (1,730)
(305) Transfers (to/from Inventories or PPE) 7,382
1,098,952 Balance at end of the year 1,153,890
During 2018/19 there has been £34.665 million of expenditure capitalised for major LLAL projects; including £23.3 million in the Direct Air Rail Transit. This includes
capitalised interest of £0.8 million incurred in relation to the scheme. The remaining capital expenditure is in relation to the planning application to expand the airport to
18 million passengers per annum, the development of Bartlett Square, Century Park enterprise zone and the required access road.
LLAL has set aside reserves as mitigation against any major scheme risks during the development and construction stages of the aforementioned schemes.
X

P a g e | 133
GRP 4) DEBTORS
X
2016/17 2017/18
Debtor Impairment
of asset Net debtor
Debtor Classification (Group) Debtor
Impairment of asset
Net debtor
£000 £000 £000 £000 £000 £000
1,406 0 1,406 Other Local Authority 1,467 0 1,467
6,050 0 6,050 Central Government 10,446 0 10,446
2,961 0 2,961 NHS 5,558 0 5,558
0 0 0 Public Corporation & Trading 0 0 0
18,603 (13,018) 5,585 Council Tax 22,501 (15,734) 6,767
6,429 (3,693) 2,736 NNDR 5,716 (3,049) 2,667
8,674 (8,383) 291 Housing Tenants 10,838 (10,157) 681
10,548 (10,098) 450 Housing Benefit Overpayments 12,136 (11,805) 330
22,205 (1,554) 20,651 Other bodies 26,398 (1,872) 24,525
4,611 0 4,611 Payments in advance 5,485 0 5,485
81,487 (36,746) 44,741 Total 100,544 (42,618) 57,926
GRP 5) CASH AND CASH EQUIVALENTS
LLAL use Money Market Funds and bank accounts as a form of liquidity
instruments.
2016/17 Cash & Cash Equivalents
2017/18
£000 £000
7,007 Short-term deposits with banks 687
14,714 Money Market Funds 20,616
15,558 Bank current accounts 6,394
7 Cash held by the Council 21
37,286 Total 27,718

P a g e | 134
GRP 6) LONG TERM INVESTMENTS
2016/17 Long Term Investments
2017/18
£000 £000
94,591 Single Entity Long Term Investments (note 29) 104,589
(92,758) Investments in subsidiary (LLAL) (102,758)
0 Investments in subsidiary (Foxhall Homes) 0
1,833 Total 1,831
X
The majority of the single entity investments are the share capital and
debentures held by LLAL.
GRP 7) CREDITORS
2016/17 Creditor Classification (Group) 2017/18
£000 £000
(1,033) Other Local Authority (733)
(12,384) Central Government (15,171)
(1,054) NHS (1,524)
0 Public Corporations & Trading 0
(1,941) Council Tax (2,179)
(2,110) NNDR (1,800)
(2,255) Housing Tenants (3,204)
(35,655) Other bodies (50,038)
(56,432) Total (74,649)
The creditors held with Luton Borough Council in the LLAL accounts have been
removed.
GRP 8) PROVISIONS
2016/17 Provisions (Group)
2017/18
£000 £000
(8,183) Single Provisions (note 38) (7,884)
(54,252) Subsidiary Deferred Tax Liability (LLAL) (53,963)
0 Subsidiary Deferred Tax Liability (Foxhall Homes) 0
(62,435) Total (61,847)
The Group Accounts have a significantly higher provision balance due to the
inclusion of LLAL’s deferred tax liability.
GRP 9) NET PENSIONS ASSET/LIABILITY
2016/17 Other Long Term Liabilities (Group) 2017/18
£000 £000
(392,652) Single Entity Other LT Liabilities (note 33) (409,179)
(2,153) Subsidiary Pensions Liability (LLAL) (2,006)
0 Subsidiary Pensions Liability (Foxhall Homes) 0
(394,805) Total (411,185)
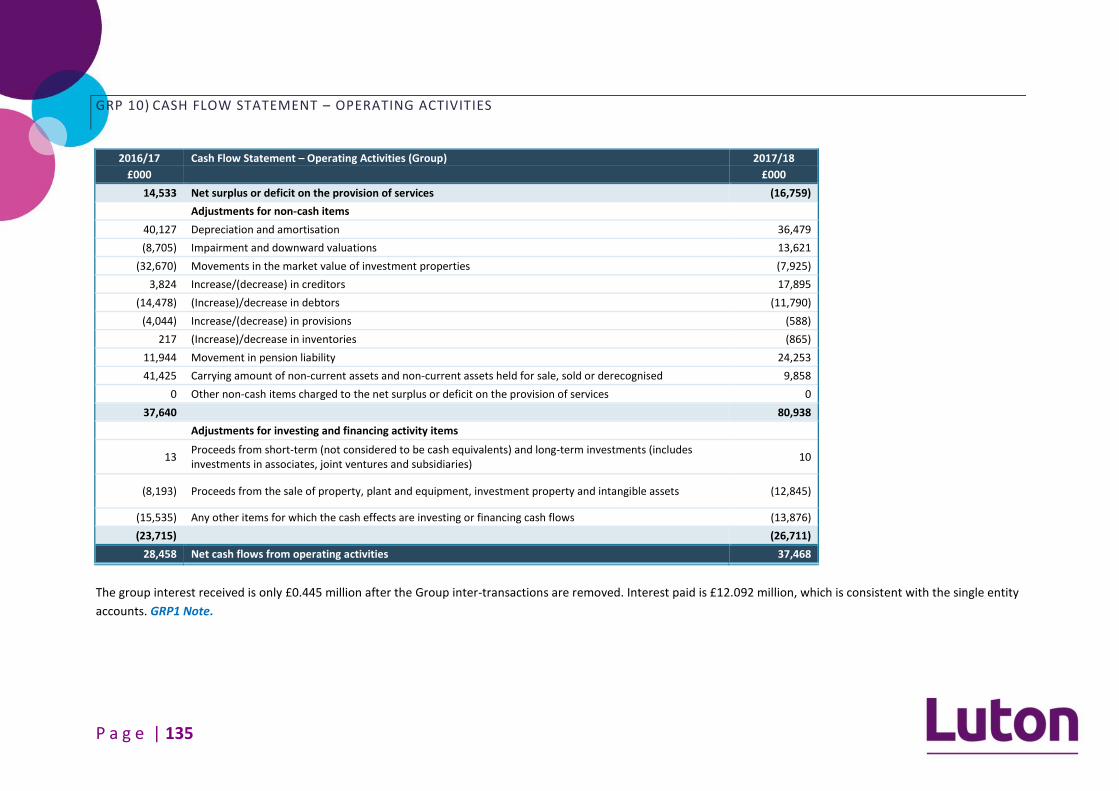
P a g e | 135
GRP 10) CASH FLOW STATEMENT – OPERATING ACTIVITIES
2016/17 Cash Flow Statement – Operating Activities (Group) 2017/18
£000 £000
14,533 Net surplus or deficit on the provision of services (16,759)
Adjustments for non-cash items
40,127 Depreciation and amortisation 36,479
(8,705) Impairment and downward valuations 13,621
(32,670) Movements in the market value of investment properties (7,925)
3,824 Increase/(decrease) in creditors 17,895
(14,478) (Increase)/decrease in debtors (11,790)
(4,044) Increase/(decrease) in provisions (588)
217 (Increase)/decrease in inventories (865)
11,944 Movement in pension liability 24,253
41,425 Carrying amount of non-current assets and non-current assets held for sale, sold or derecognised 9,858
0 Other non-cash items charged to the net surplus or deficit on the provision of services 0
37,640 80,938
Adjustments for investing and financing activity items
13 Proceeds from short-term (not considered to be cash equivalents) and long-term investments (includes investments in associates, joint ventures and subsidiaries)
10
(8,193) Proceeds from the sale of property, plant and equipment, investment property and intangible assets (12,845)
(15,535) Any other items for which the cash effects are investing or financing cash flows (13,876)
(23,715) (26,711)
28,458 Net cash flows from operating activities 37,468
The group interest received is only £0.445 million after the Group inter-transactions are removed. Interest paid is £12.092 million, which is consistent with the single entity
accounts. GRP1 Note.

P a g e | 136
GRP 11) CASH FLOW STATEMENT – INVESTING ACTIVITIES
2016/17 Cash Flow Statement – Investing Activities (Group) 2017/18
£000 £000
(76,438) Purchase of property, plant and equipment, investment property and intangible assets (89,659)
0 Purchase of short-term and long-term investments 0
0 Other payments for investing activities 0
8,195 Proceeds from the sale of property, plant and equipment, investment property and intangible assets 12,846
12,750 Proceeds from short-term and long-term investments 1,500
18,114 Other receipts from investing activities 26,086
(37,379) Net cash flows from investing activities (49,227)
GRP 12) CASH FLOW STATEMENT- FINANCING ACTIVITIES
X
2016/17 Cash Flow Statement – Financing Activities (Group) 2017/18
£000 £000
1,538 Other receipts from financing activities (115)
(725) Cash payments for the reduction of the outstanding liabilities (finance leases) (899)
0 Repayments of short- and long-term borrowing 0
(1,838) Other payments for financing activities 3,206
(1,025) Net cash flows from financing activities 2,192

P a g e | 137
GRP 13) LEASES
All other information regarding leases is unaltered from the single entity statements.
Group Lessor - Operating Lease
On 20th
August 1998 (‘the concession date’) the company entered into a concession contract with an unrelated entity, London Luton Airport Operations Limited (“LLAOL”).
Under the terms of this contract LLAOL was granted a concession to operate the airport for a period of 30 years (‘the concession period’) and a lease over the company’s
land and buildings. In return LLAOL undertook to pay an annual concession fee to the company comprising of £3 million as a minimum fixed payment or a greater amount
based on workload units (being each departing and arriving passenger and each 100 tonnes of freight) as prescribed in the concession agreement and, subject to the
continuing growth of passenger numbers, fund an extensive capital investment programme. At the end of the concession period the assets, liabilities and operations of the
airport revert to the ownership and use of the company.
In August 2012 a supplemental agreement to the concession contract was reached between LLAL and LLAOL. This agreement commits the operators to undertake a
significant programme of development works to increase the Airport’s capacity to handle throughput of up to 18 million passengers per year, in return for an extension of
the Concession Period to March 31st 2031. The concession agreement was further amended in January 2014 to provide for a scheme to rebate the Concession Fee Rate
payable by the airport operator in certain circumstances, in order to encourage passenger growth.
At the concession date the trading assets and liabilities of the company were transferred to LLAOL at book value. No profit or loss arose on the transfer of these assets and
liabilities. The employees of the company were also transferred to LLAOL.
As the company no longer operates the airport itself, the land and buildings have become investment properties. At the instruction of London Luton Airport Limited,
Deloitte LLP have valued the freehold interest in London Luton Airport as at 31st
March 2016. The next valuation is due to be undertaken as at 31st
March 2020; it has,
however, been agreed that, given the rate at which passenger numbers are currently growing, and the other developments currently being carried out by the company, the
valuation will be reviewed annually in the intervening periods to ensure the investment properties are reflected at fair value.
In 1998 London Luton Airport (LLAL) granted a “Concession to Operate” lease of
the Airport to London Luton Airport Operations (LLAOL). The future minimum
lease payments due in respect of this in future years is detailed in the table.
Capital Financing 31/03/2017 31/03/2018
£000 £000
Not later than one year 3,000 3,000
Later than one year and not later than five years 12,000 12,000
Later than five years 30,000 27,000
Total 45,000 42,000
X

P a g e | 138
GRP 14) RELATED PARTIES
The Council is required to disclose material group transactions with related parties – bodies or individuals that have the potential to control or influence the council or to
be controlled or influenced by the council. Disclosure of these transactions allows readers to assess the extent to which the council might have been constrained in its
ability to operate independently or might have secured the ability to limit another party’s ability to bargain freely with the Council. In addition to the disclosures included in
Note 44 the following donations were made by London Luton Airport Ltd:
Organisation Number of
Councillor/Officer Representatives
Amount (£) Nature of service
Luton Cultural Services Trust 2 £2,754,000 Leisure & Culture
Active Luton 3 £1,471,000 Leisure & Culture
Luton CAB 2 £423,000 Citizen Enablement
Luton Law Centre 2 £167,500 Citizen Enablement
Luton Rights 3 £120,500 Citizen Enablement
You Turn 1 £80,000 Community Safety
Safer Luton Partnership 1 £66,000 Community Safety
Luton Foodbank 1 £50,000 Citizen Enablement
Luton Mediation 1 £35,000 Community Safety
Marsh Farm Futures 2 £30,000 Community Involvement
Centre for Youth and Community Dev. 1 £25,000 Health & Wellbeing
Total £5,222,000
A disclosure limit of £1k has been applied to this disclosure. All transactions under £1k have been assessed as not material from the viewpoint of the Group, and the
related party.
Foxhall Homes had no cash transaction in 2017/18 therefore could have no related party transactions.

P a g e | 139
GRP 15) FAIR VALUE- INVESTMENT PROPERTIES
Fair valuations have been classified into three levels to signify the level of
certainty existing within the underlying valuation assumptions. The below table
summarises the consolidated investment properties included in the Group
Accounts for LLAL included at fair value.
Recurring fair value measurements using
Quoted prices in active
markets for identical assets
Other significant observable
inputs
Significant unobservable
inputs
(Level 1) (Level 2) (Level 3)
£000 £000 £000
Freehold Interest in London Luton Airport
0 0 536,500
Office Units 0 2,000 0
Industrial 0 5,530 0
Other 0 2,565 10,775
Total 0 10,095 547,275
The following have not been included in the table but are included in the Group
Balance Sheet figure for Investment Properties:
£102.9 million Luton Borough Council single entity investment
properties (see Note 45)
£13.676 million LALL investment properties assets under construction
which relate to Bartlett Square, Century Park and the Development
Consent Order. These costs are held at historical cost
£0.363 million of expenditure incurred by Foxhall Homes which is
currently assets under construction and valued at historical cost.
Significant Observable Inputs – Level 2
For the Level 2 valuations we have based the valuations on the market-based
income and investment approach in all the separate categories, assessing rental
values by reference to comparable leasing deals in the locality of each asset, with
relatively minor adjustments to unit rental values to cater for individual
characteristics of the property being valued. Capitalising income streams at an
appropriate valuation yield has also been carried out by reference to comparable
sales of investment properties with similar characteristics and adopting the
capitalisation yields in those comparable deals. The office, some of the industrial
properties and other have been placed in the Level 2 category as relevant
comparable evidence of rental value and investment/capital value such that the
level of ‘observable inputs’ is significant.
For our offices throughout the south-east of England comparable capital
transactions may be in other towns but of similar types of office building.
Adjustments have been made to comparable yields to reflect differences in
individual property’s features, such as unexpired lease term, strength of tenant
covenant, quality of specification and micro location. For a Level 2 valuation we
would seek to base valuations on very similar comparable transactions so that
the adjustments made in the valuation for these factors are not significant – so
that the “observable inputs” (i.e. the comparable evidence) are significant
determinants in each valuation.
Significant Observable Inputs – Level 3
The Freehold Interest in London Luton Airport has been placed in the Level 3
category the valuers have adopted an explicit discounted cash flow methodology
and made assumptions regarding passenger growth and RPI forecasts based on
our analysis of historical trends and knowledge of other airports. At reversion
(2031) it is assumed that the freeholder would sell the Airport. This is consistent
with the methodology previously adopted. The valuers have capitalised all
income from passenger and cargo throughput and have made appropriate
P a g e | 140
deductions for management fees and the rent payable on the additional 40 acres
to arrive at a forecast net income each year. As well as adopting an explicit
discounted cash flow methodology the valuers also undertook a ‘cross-check’
using a traditional yield approach. The valuation of £536,500,000 (rounded)
reflects a Net Initial Yield of 8.05% based on current income. This is considered a
prudent level recognising the nature of the interest.
The two of the assets categorised as “Others” have been place in the Level 3
category. One site is Bartlett Square a brownfield site which has a value of
£1.275 million where the valuation has had regard to the potential development
value of the site, reflecting inherent planning risk and has applied an average
acreage rate of £0.35 million, which is at the higher end of the market range but
allows for the proximity to Luton Airport Parkway. The other site is Century Park,
valued at £9.5 million, a land site which has outline planning permission for
commercial development. Due to the scale of the development proposal no
directly comparable land sales have occurred in the area over recent years,
however the valuers have had sight of a number of recent land transactions that
have occurred. Due to the size and complexity of the site there are a large
number of unknown factors that influence its marketability, and therefore end
value. As such the valuers have used the residual value method to establish a
land value per acre, which is then deferred into the future on the basis of
expected market take up. This is consistent with the prior year and reflects the
continued barriers that need to be overcome to deliver development at this site.

P a g e | 141
05 Glossary Accounting Polices Accounting policies define the process whereby
transactions and other events are reflected in the
financial statements.
Accrual Accounting The concept that items of income and expenditure
are included in the accounts in the year they are
earned or incurred, not when the money is
received or paid.
Budget This is a statement of the expected level of service
to be provided expressed in monetary terms, over
a set period of time including both revenue and
capital expenditure.
Capital Adjustment Account This account was formed on 1 April 2007 from the
consolidation the former Capital Financing Account
and the Fixed Asset Restatement Account.
Transactions on the account since reflect the
financing of capital expenditure, the adjustment
for the Minimum Revenue Provision and
adjustments to the value of assets in the balance
sheet which cannot be accounted for in the
Revaluation Reserve. This account cannot be used
to fund revenue expenditure
Capital Expenditure Expenditure on the acquisition of a fixed asset or
expenditure, which adds to and not merely
maintains the value of an existing fixed asset.
Capital Receipts Proceeds from the sale of fixed assets and
repayment of advances. These are either set aside
for the repayment of loans or used to finance new
capital expenditure.
Carry Forwards These are year-end under spends which have been
approved by Members to be carried forward into
the next year to support specific expenditure.
CIPFA This is the Chartered Institute of Public Finance and
Accountancy, the accountancy body which sets and
monitors professional standards and provides
guidance for public services accounting.
Code of Practice on Local Authority
Accounting in the United Kingdom ('the
Code') The ‘Code’ is the accounting standards which CIPFA
have published for Local Authorities to follow
when producing the Statement of Accounts. The
‘Code’ translates International Financial Reporting
Standards (IFRS) into compatible rules and
regulations for Local Authorities to apply.
Collection Fund This fund receives all income raised through
Council Tax and Non-Domestic Rates. The fund
then disperses funds to the Income and
Expenditure Account, pays the precepts to the
Bedfordshire Police Authority and Bedfordshire
and Luton Combined Fire Authority, and transfers
the Non-Domestic Rate income to the Central
Government national pool for redistribution.

P a g e | 142
Community Assets Assets that the council intends to hold in
perpetuity, that have no determinable useful life
and that may have restrictions on their disposal.
Examples of community assets are parks and works
of art.
Contingent Liability A contingent liability is a possible obligation arising
from past events that will only be confirmed by
future events. An example of a contingent liability
would be a court case or employment tribunal
case, which had commenced, but not concluded at
the year-end.
Council Tax This is the means of raising money locally to pay
for local authority services. This is a property-
based tax where the amount levied depends on
the valuation of each dwelling.
Creditors Amounts owed by the Council for goods or services
that it has received but for which payment had not
been made by the balance sheet date of 31 March.
Current Assets These are assets that can be readily realised and
converted into cash.
Current Liabilities These are liabilities that are due for payment
immediately or in the short term.
Current Service Cost (Pensions) This is the increase in the present value of a
defined benefit scheme’s liabilities expected to
arise from employee service in the current period.
Curtailment For a defined benefit scheme, an event that
reduces the expected years of future service of
present employees or reduces for a number of
employees the accrual of defined benefits for
some or all of their future service. Curtailments
include the termination of employees’ service
sooner than expected and the termination of or
amendment to the terms of a defined benefit
scheme so that some or all future service by
current employees will no longer qualify for
benefits or will qualify only for reduced benefits.
Debtors Amounts owed to the Council where services have
been delivered but for which payment has not
been received by the balance sheet date.
Deferred Liabilities These are sums due to be paid by the Council in
future periods.
Defined Benefit Scheme
This is a pension or other retirement benefit
scheme other than a defined contribution scheme.
Usually, the scheme rules define the benefits
independently of the contributions payable, and
the benefits are not directly related to the
investments of the scheme. The scheme may be
funded or unfunded (including notionally funded).
Defined Contribution Scheme
A pension or other retirement benefit scheme into
which an employer pays regular contributions fixed
as an amount or as a percentage of pay and will
have no legal or constructive obligation to pay
further contributions if the scheme does not have
sufficient assets to pay all employee benefits
relating to employee service in the current and
prior periods.
Depreciated Replacement Cost A method employed in valuing land and buildings
where a market value basis is not readily available.
For example this method might be used for valuing
schools, where there is no market for the asset in
its existing use.
Depreciation This is the measure of the value of fixed assets,
used to provide services, consumed during the
accounting period and is based on the expected
useful life of the asset. Consumption includes the
wearing out, using up or other reduction in the
useful life of a fixed asset.
Doubtful Debts A provision made for debts which might not be
paid, based on the age and particular
circumstances relating to the debt.

P a g e | 143
Earmarked Reserves These reserves represent the monies set aside that
can only be used for the specified use or purpose.
Emoluments Amounts paid to employees of the council,
including expenses or non-monetary benefits that
are taxable net of employee pension contributions.
Estimation Techniques The methods adopted by the council to arrive at
estimated monetary amounts, corresponding to
the measurement bases selected, for assets,
liabilities, gains, losses and changes to reserves.
Events after the Balance Sheet Date Events after the balance sheet date are those
events, favourable and unfavourable, that occur
between the balance sheet date and the date
when the Statement of Accounts is authorised for
issue.
Exceptional items Material items which derive from events or
transactions that fall within the ordinary activities
of the authority and which need to be disclosed
separately by virtue of their size or incidence to
give a fair representation to the accounts.
Extraordinary items These are material items, needing a separate
disclosure because they are activities that fall
outside of the ordinary activities of the authority.
Fair Value The fair value of an asset is the price that would be
received to sell an asset or paid to transfer a
liability in an orderly transaction between market
participants at the measurement date.
Financial Reporting Standards (FRS’s) These are statements of accounting standards
issued by the Accounting Standards Board.
Accounting standards apply to all companies, and
other kinds of entities that prepare accounts that
are intended to provide a true and fair view. The
extent to which they apply to local authorities is
determined by the SORP.
Foundation School A school that receives funding from the Council,
but where the governing body owns the land and
buildings. Many of these schools were formerly
grant maintained schools.
General Fund This is the council’s main revenue fund to which
revenue receipts are credited and from which
revenue liabilities are discharged. The movement
on the fund in the year represents the excess of
income over expenditure.
Government Grants Financial assistance provided to the council by
government departments, inter-government
agencies and similar bodies to enable services to
be provided.
Group Accounts These show the revenue account and balance
sheet including regulated companies of the
Council. There are wo companies that falls within
the regulations, these are London Luton Airport Ltd
and Foxhall Homes.
Historical Cost The value of the capital expenditure originally
occurred when the asset was purchased,
constructed or enhanced.
Housing Revenue Account (HRA) This is the ring-fenced account that records the
income and expenditure relating to the provision
of council housing.
Impairment
This is a reduction in the value of a fixed asset
below its carrying amount on the balance sheet.
Examples would include loss in value due to
physical damage or decline in market value due to
a general fall in prices.
Infrastructure Assets These are fixed assets that cannot be assigned to
others and hence have no value to other entities.
Examples of infrastructure assets are highways and
footpaths.

P a g e | 144
Intangible Assets This is expenditure that is of a capital nature, but
where no tangible asset exists. An example of
intangible asset is a computer software licence.
International Financial Reporting
Standards International Financial Reporting Standards (IFRS)
underlie the preparation and presentation of
financial statements in a consistent format so that
users from different countries can interpret
financial information. Local Government produced
IFRS compliant accounts for the first time in
2010/11.
Inventory The amount of unused or unconsumed inventory
(stocks) held by the council in expectation of future
use. When use will not arise until a later period, it
is appropriate to carry forward the amount to be
matched to the use or consumption when it arises.
Investment Properties An interest in land and/or buildings where
construction work and improvements are
complete and it is held for its investment potential,
with any rental income being negotiated at arm’s
length.
Investments (Pensions Fund) The investments of the Pensions Fund are
accounted for in the accounts of the Fund, which is
administered by Bedford Borough Council.
However the council is required to disclose, as part
of the disclosures relating to retirement benefits,
the attributable share of pension scheme assets
associated with their underlying obligations.
Investments (Non-Pensions Fund) A long-term investment is an investment that is
held for use on a continuing basis. The council’s
long-term investments mainly relate to the capital
investment in London Luton Airport Ltd and in land
development. In addition long-term investments
include surplus funds that are invested for periods
in excess of twelve months. Short-term
investments, which are classified as current assets,
comprise deposits of temporary surplus funds with
banks or similar institutions.
Liabilities Amounts the authority either owes or anticipates
owing to others, whether they are due for
immediate payment or not.
Long Term Debtors These are amounts due to the council more than
one year after the balance sheet date.
Major Repairs Allowance (MRA)
The MRA is a government subsidy that was
introduced to replace the Housing Revenue
Account borrowing for repairs.
Major Repairs Reserve (MRR) This reserve is for capital expenditure on HRA
assets.
Minimum Revenue Provision (MRP) This is the minimum amount that must be charged
to an authorities income and expenditure account
each year, as a notional redemption cost of the
authority’s credit liabilities, for example an
element of the principal repayment of outstanding
loans.
Net Book Value The amount at which fixed assets are included in
the balance sheet, for instance their historical cost
or current value less the cumulative amounts
provided for depreciation.
Net Current Replacement Cost The cost of replacing or recreating the particular
asset in its existing condition and in its existing use,
for instance the cost of its replacement or of the
nearest equivalent asset, adjusted to reflect the
current condition of the existing asset.
Non-operational Assets Fixed assets held by the council, but not used or
consumed in the delivery of services or for the
service or strategic objectives of the council.
Examples of such assets include investment
properties and assets that are surplus to
requirements, pending their sale.

P a g e | 145
Non Domestic Rates (NDR) This is a rate in the pound set by central
government at a standard countrywide rate,
applied to the rateable value of each premise not
being used for domestic purposes. It is collected
locally by the council and paid over to central
government. Central government then
redistribute NDR to council’s by revenue grant in
proportion to the population of each authority.
Operational Assets Fixed assets held and occupied, used or consumed
by the council in the direct delivery of those
services for which it has either a statutory or
discretionary responsibility or for the service or
strategic objectives of the authority.
Precept
The levy made by other authorities, namely the
police authority and the combined fire authority,
on the council, requiring the council to collect
income from council taxpayers on their behalf.
Provisions Provisions represent sums set aside in the accounts
to meet future expenditure where the specific
liability is known to exist but is of uncertain
amount or timing.
Prudential Borrowing This is borrowing by local authorities without
government financial support, but in accordance
with the CIPFA prudential code of local authority
borrowing to finance capital expenditure.
Public Works Loan Board (PWLB) This is a government body that provides loans to
local authorities for financing capital expenditure.
Revaluation Reserve IFRS compliant account introduced for the first
time in 2007-08 that reflects revaluations of assets
from 1 April 2007, enabling assets to be shown in
the balance sheet at current value. The overall
balance is attributable to identifiable assets and
impairment can only be charged here if a previous
valuation gain was greater than or equal to the
impairment being credited to the reserve. This
account does not represent additional resource
available to the Council.
Reserves These monies set aside are mainly available to
meet future commitments. Earmarked reserves
are allocated for a specific purpose. Three of the
reserves, the Capital Adjustment Account, the
Pensions Reserve and the Revaluation Reserve
cannot be used to meet commitments.
Revenue Contributions to Capital Outlay
These are contributions from the income and
expenditure account to finance capital
expenditure.
Revenue Support Grant This is the amount of general Central Government
grant support for local authority expenditure. In
addition there are specified grants directly related
to particular services and costs.