State voices-2016-network-vr-plan-preliminary-report
45
UNIFY. FORTIFY. AMPLIFY. Engaging The New American Majority and Strengthening Our Democracy in 2016 2016 NETWORK VOTER REGISTRATION PLAN PRELIMINARY REPORT
-
Upload
soa-watch-labor-caucas-se-mi -
Category
Education
-
view
183 -
download
0
Transcript of State voices-2016-network-vr-plan-preliminary-report

UNIFY. FORTIFY. AMPLIFY.Engaging The New American Majority and
Strengthening Our Democracy in 2016
2016 NETWORK VOTER REGISTRATION PLAN PRELIMINARY REPORT

1
In July 2015, State Voices convened a national voter registration retreat with over 60 participants representing 25 national organizations and 18 state tables. The goal was to create alignment around a collaborative planning process throughout our network, reach agreement on standards for program design and quality control, and establish goals for field voter registration based on rigorous shared metrics.
Four workgroups were established to guide the planning process after the retreat - Program Design and Quality Control, New American Majority Engagement, Research and Experimentation, and Partnership and Planning. During the ensuing months, representatives from national partner organizations, State Voices tables and national staff, and civic engagement funders have created a framework for nonpartisan field voter registration programs in State Voices table states that can be replicated anywhere there are sufficient resources, the willingness to work collaboratively, and the discipline to adhere to rigorous standards and metrics.
This preliminary report includes the products of each workgroup and summaries of voter registration goals and budgets for each State Voices table. A final report, which will include county-level voter registration, contact universe, and turnout goals for each table will be finalized in early January 2016, The final plan will also include detailed projections for mail voter registration programs planned for each state.

2
Facilitators: Alvina Yeh, State Voices; Austin Thompson, Youth Engagement Fund; Jared Nordlund, National Council of La Raza
National Partners: APIAVote, Black Youth Project 100, Bus Federation Civic Fund, Catalist, Center for Community Change, League of Conservation Voters Education Fund, National Council of La Raza, Planned Parenthood Federation of America, Project Vote, Youth Engagement Fund
State Tables: Colorado, Florida, Georgia, Michigan, Minnesota, North Carolina, New Mexico, New York, Pennsylvania, Virginia, Washington
Facilitators: George Christie, State Voices; Drew Tappan, State Voices; Amy Busefink, Project Vote
National Partners: Catalist, Center for Community Change, Everybody Votes, Grassroots Solutions, Mi Familia Vota Education Fund, Planned Parenthood Federation of America, Project Vote, Voter Participation Center, VVN
State Tables: Colorado, Florida, Georgia, Michigan, North Carolina, Nevada, Ohio, Pennsylvania, Virginia, Wisconsin
Outcomes:
• Develop data standards, tools, and promising practices for voterregistration quality control and program design.
• Develop data sets and map voter registration need in all 50 states.
Products:
1. Best Practices for Voter Registration Program Design and QualityControl (Page 5)
2. A Common Methodology For Determining the Voter RegistrationNeed (Page 7)
3. A Set of Modules For Calculation of Net Registration ContactUniverses (Page 7)
NEW AMERICAN MAJORITY ENGAGEMENT WORKGROUP
PROGRAM DESIGN AND QUALITY CONTROL WORKGROUP
Outcome:
• Identify promising practices for voter registration and engagement ofyoung adults, unmarried women, and people of color.
Products:
1. Definition of “New American Majority” for Nonpartisan CivicEngagement Programs (Page 8)
2. Understanding The Complexities of The Voter Registration GapAmong The New American Majority (Page 8)
3. Research Recommendations To Outline What Data and ExperimentsWe Need To Strengthen Engagement of The New AmericanMajority.(Page 9)
4. A Set of Promising Practices To Maximize New American MajorityVoter Registration and Create Long-Term Political Power. (Page 9)

3
Facilitators: Alexis Anderson-Reed, State Voices; Josh Rosmarin, Analyst Institute
National Partners: Analyst Institute, Bus Federation Civic Fund, Catalist, Center for Community Change, NGP/VAN, Project Vote, Voter Participation Center
State Tables: Colorado, Georgia, Michigan, Montana, Nevada, New York, North Carolina, Ohio, Pennsylvania, Washington
Facilitators: Matt Brix, State Voices; Robert Richman, Grassroots Solutions
National Partners: Bus Federation Civic Fund, Catalist, Center for Community Change, Grassroots Solutions, League of Conservation Voters Education Fund, Project Vote, Public Interest Network
State Tables: Colorado, Florida, Michigan, New York, Pennsylvania, Wisconsin
RESEARCH AND EXPERIMENTATION WORKGROUP
Outcomes:
• Outline and disseminate existing research on voter registration.
• Develop a voter registration priority research agenda for 2016.
Products:
1. Updated Voter Registration Literature Review (Summary on Page 10)
2. Future Research Questions (Page 12)
PARTNERSHIP AND PLANNING WORKGROUP
Outcomes:
• Develop language for national and state voter registration partnershipagreements.
• Develop a planning packet for 2016 state-based voter registrationplans, including goals for collaborative planning, term definitions,a timeline, a plan template, a budget template, a gap analysis/gapreporting template, and research on best practices for setting groupgoals, budgeting, and developing shared metrics.
Products:
1. Draft Voter Registration Partnership Agreement (Page 13)
2. Voter Registration Planning Packet (Page 15)
3. State Table Voter Registration Plan Summaries (Page 21)
4
VOTER REGISTRATION WORKGROUP PRODUCTS
5
PROGRAM DESIGN AND QUALITY CONTROL
1. BEST PRACTICES FOR VOTER REGISTRATIONPROGRAM DESIGN AND QUALITY CONTROL
Provided By Project Vote
Before You Start
• Write a memo documenting the c3 nature of your program andnonpartisan selection criteria (i.e. geography and demographics).
• Ensure your registration program follows the c3 memo.
• Meet with election officials to review voter registration laws andyour program procedures. Keep notes of the meeting.
• Seek qualified counsel to provide legal advice as needed throughoutthe registration drive.
• Develop and use a budget that captures the full cost of the programand itemizes expenses in sufficient detail. (A budget template isavailable.)
Field
• Have a written process for recruiting, hiring, and dismissing full-timeand part-time staff that complies with federal and state laws.
• Implement a system to test and track the productivity of registrationsites or events.
• Implement a system for recording information regarding productivity byregistration worker, date, and, if possible, location.
• Provide a registration worker training that covers:
» What fields constitute a complete application
» Who is eligible to collect applications and any restrictions
» Who is eligible to complete an application and standard responsesto common eligibility questions
» What actions related to voter registration are illegal
» What actions related to voter registration violate c3 requirements
• Collect signed policy affirmations on fraud and nonpartisanship duringthe employment process.
• Where allowed, develop a plan for field tests prior to hiring staff orvolunteers who will be collecting applications.
• Regularly review with staff and volunteers
» What is a complete card
» Who is eligible to register
» Who can collect applications and other restrictions
» What is fraud
» What is nonpartisan
• Display signs in workspace demonstrating the organization’s policy onfraud and nonpartisanship.
• Implement a system that tracks applications given to registrationworkers and returned by them after each shift or event.
• Implement a system to record the total number of applicationscollected per collector per shift or event, the number that werecomplete, incomplete, or spoiled and any issues with an application.
• Enforce quality standards that require registration workers to collectcomplete applications from eligible applicants. Periodically observeyour workers in the field and p ovide feedback to team leaders.
Document Retention
• Retain employment records in a location where they can be easilyretrieved.
• Retain signed policy affirmations in a location where they can be easilyretrieved.
• Retain scans of applications. (Comply with any state-specific guidanceregarding copying, scanning, and/or retaining information fromcompleted applications.)
• Retain completed forms used to track applications.
• Retain completed forms used for identifying, addressing, anddocumenting quality issues.
• Retain records of communication with election officials orlaw enforcement.
• Retain copies of scripts, training curricula, procedure manuals, andother documents describing the management of your program.
• Maintain an offsite back-up of your registration drive records.

6
Quality Control
• Maintain a separate and secure space for quality control staff andprograms.
• Maintain a separate and secure space for applications.
• Conduct a visual review of ALL applications collected.
• Implement a system to track applications from the point at which acollector turns them into a supervisor to the point where they aresubmitted so collected applications can be verified on the telephone bythe applicant. (35% on average)
• Have and follow a written protocol for identifying, timely and effectivelyaddressing, and documenting quality issues.
• Have a system for reporting quality issues to election officials.
• Have a system for tying each application to the collector who collectedit.
• Have a system for recording information regarding the findings of thequality control program by collector/volunteer and date.
• Regularly review quality control reports to look for problems, includingproblems with reporting (i.e. late, contains data entry errors) andproblems with the procedures (i.e. incomplete applications not beingaddressed).
Data
• Where legal, retain an image of all applications and related documentsthat is easily retrievable.
• Load all scanned images of applications to VETS.
• Enter information from each application into the VETS data entry
module, including:
» The fields required for Catalist data matching (see attacheddocument)
» Site or event where application was collected
» ID Code of collector who collected the application
» An indicator of whether all the required information is legible on the application.
• Capture daily performance data and regularly review the data to identifypossible problems.
• Allow VETS to automatically load data from applications to Catalist formatching or manually export data to match your applicants to the voter
file to determine how many are making it on the voter rolls.
• Use VETS to maintain all scans and associated data. If you maintain yourown copies, create and use standardized file and older names.
• Create an index and data dictionaries to clarify any abbreviations orprepends.
• Discard obsolete versions after making backups and create new filenames for new versions.
• Ensure quality through the VETS QC module which includes an audit ofthe entire data entry data.
VAN VOTER REGISTRATION TOOL (VRT) DATA FLOW AND BEST PRACTICES
Provided by State Voices
Regardless of the input source, data from registrations gathered by and managed by State Voices table and at-large partners will be loaded to the VAN Voter Registration Tool. This allows partners and affiliates using the State Voices VAN to see and access registrant information, both to continue programs such as voter turnout and to analyze the efficacy of programs as those individuals move from registrant status to registered voters within the MyVoters (Voter file) section of the VAN.
Catalist and VAN are working to provide a pipeline through which data from the Catalist Registration tool passes into the VAN.
Best Practices for the VAN Voter Registration Tool (VRT)
• Discuss strategies and best practices for entering and trackingVoter Registration Applicants with your state table data manageror State Voices national data staff. Methodologies and best practicesmay vary based on the size and scope of your program, as well asmethods of contact and collection.
• Utilize Double Data Entry. Double data entry ensures the highestquality data and can help easily identify data entry problems beforethose errors make it into the VRA dataflow. Double data entry can beas simple as having both an OCA scanner and a keystroke vendor for alarger program or, for smaller operations, using two spreadsheets andlogic that compares rows to identify errors.
• Devise a strategy for batching applications before beginning dataentry. VRT batches can be used to organize and track applications andease your reporting and self-evaluation metrics.

7
• Where legal, keep scans or copies of cards to correct errors. Consultwith legal counsel to determine whether you can retain copies.
• If it is not in the VAN, it is not real. Ensure that every card youcollect makes it into the VRT, whether through interface with anotherapplication, through data entry, or bulk uploads.
2. A COMMON METHODOLOGY FOR DETERMINING THEVOTER REGISTRATION NEED
For the purposes of executing planned voter registration work in the 2016 electoral cycle, it is important that State Voices, partners, and state affiliates have access to a unified methodology or evaluating needs in specific geographies. A unified methodology both provides consistency – donors, planners, and organizers can easily understand numbers from vastly differing geographies – and allows State Voices partners and affil tes to leverage automation features that will improve targeting, program tracking, reporting, and evaluation.
Methodology
The following methodology allows State Voices to evaluate voter registration gaps among vulnerable communities at various geographic levels: National, State, County levels, and at Census geographies down to and including Census Block Group.
Collecting and Defining Datasets
To provide for an apples to apples comparison, State Voices will, at the national level, be using Catalist provided voter data lists for establishing registration numbers and race and gender statistics for registered voters.
For the purposes of using Catalist data, “registered voters” are defined asthose who in the Catalist set have “active” or “inactive” voter status and have participated in any election in the past four calendar years.
Current Population data will be extracted from the United States Census Bureau’s Citizen Voting Aged Population dataset. This data should be extracted from the most recent ACS 5 Year estimates (currently 2013, moving to the 2014 5 YR ACS upon release in December 2015), as this data gives us the most fine-grained subgroup analysis and access to all levels of geography down to the Census Block Group.
These datasets will be collected by State Voices national data staff andloaded to database systems used for the evaluation.
Establishing Gaps
Establishing voter registration gaps is a simple calculation. For any given population, the number of registered voters is subtracted from the Citizen Voting Age Population Estimate (CVAP_EST) for a particular geography. If the number of individuals who do not require registration or re-registration (‘registered’ voters) exceeds the Estimated Citizen Voting Age Population Estimate, the need is assumed to be zero. This yields an estimate of the unregistered, but eligible, citizens in a particular geography. This calculation can be performed on any subgroup for which data exists in both sets. This includes gender, race, and age. Additionally it can be performed at any geography level: National, State, County, Census Tract, or Census Block Group.
The ‘registration gap’ is then determined to be the number of registrants needed to bring the NAM registration rate to the same rate as the general population.
Automations and Voter Registration Needs Targeting
By loading the census data to a database system, these calculations are easily repeated with each release of a Catalist Voter file. As such, reports can be regenerated, and resulting target geographies can be back matched to individuals – resulting in a list of unregistered individuals (and possibly addresses without registered individuals) that can be crossloaded to the State Voices Voter Activation Network (VAN) platform for outreach and voter registrant work targeting.
3. A SET OF MODULES FORCALCULATION OF NET REGISTRATION CONTACT UNIVERSES
Modules will be finalized in early December 2015 upon availability of updated Catalist race models and Census Bureau 5-year American Community Survey (ACS) data for 2010-2014.

8
NEW AMERICAN MAJORITY ENGAGEMENT
1. DEFINITION OF “NEW AMERICAN MAJORITY” FORNONPARTISAN CIVIC ENGAGEMENT PROGRAMS
People of color, single women, and young adults are underrepresented in our democracy. As a whole these communities are registered to vote and participate in the electoral process at lower rates compared to the general population. As a result, our democratically elected governments are less likely to reflect their values and their issues are less likely to be addressed.
Taken together, these emerging groups constitute the New American Majority.
For the purpose of civic engagement activity, specifically voter registration and turnout, State Voices has prepared a base definition of the New American Majority that can be used in planning and programs using tools and datasets available to partners though their state tables, or through the Tools for All program.
Simplified Data Definition of the New American Majority
The following base definition (in psuedocode) is inclusive of all sets and selectable within both the VAN and the Catalist Q Tool:
1. Communities of color and or Hispanic origin:
» race IN(asian, black, hispanic, middle_eastern, native_american,unknown)
2. Youth – those who will be between 18 and 34 years of age on 8November 2016:
» age BETWEEN 17 AND 33 OR birthdate BETWEEN 1981-11-09 AND1998-11-09
3. Single women with children in the household, or with incomes at orbelow the federal poverty line:
» gender = female AND married = single AND children_younger_than_17 = likely
» gender = female AND married = single AND income model = 1. Less than $20,000
2. UNDERSTANDING THE COMPLEXITIES OF THEVOTER REGISTRATION GAP AMONG THE NEW AMERICAN MAJORITY.
We know we cannot focus only voter registration. Building an engaged community requires an integrated, year-long approach with trusted community messengers. We also recognize voter registration and the turnout of those voters are a means to building power and engaging members of the New American Majority.
There are several complexities unique to the NAM. Members are heterogeneous within race groups, highly transient, rapidly growing populations, sometimes isolated from society, suspicious of the role of government, leery of efforts that ask for personal information, and may face language barriers.
Scalable and cost-efficient voter registration programs are an important innovation, but they are not sufficient in closing the voter registration gaps in NAM communities. Running voter registration programs that are scalable and cost-efficient requires targeting easier-to-register voters who, more often than not, are not members of the NAM.
Voter registration programs developed in communities and states that value in-person contact with members of the NAM are the only way to close the voter registration gap among the individual demographic and cultural groups of the NAM. Successful community-based voter registration programs can achieve cost efficiency, high output, and community empowerment that address near-term need in battleground states and also invest in the future power of the NAM.
Lastly, much of the current voter registration gap comes from high move rates among members of the NAM. Until systemic fixes, including better NVRA compliance and legislation that ease access - like automatic registration - are in place, community organizations are best positioned to find people who have moved and remind them to re-register using their new address.

9
3. RESEARCH RECOMMENDATIONS TO OUTLINE WHATDATA AND EXPERIMENTS WE NEED TO STRENGTHEN ENGAGEMENT OF THE NEW AMERICAN MAJORITY.
In order to improve efficiency and best practices or groups leading voter registration efforts in NAM communities, more funding for research and experiments is required. Research and controlled experiments conducted on a large scale often have small sample sizes for minority groups, and it is unclear whether or not results for the larger community apply to the NAM. NAM communities are heterogeneous from culture, geography, and socioeconomics and, as such, they each require their own set of experiments.
Specific gaps in research we encourage more study into include:
• Improved race data and modeling. Voter data firms should continueto work closely with NAM groups to build better models and data pointsthat capture race to improve micro-targeting for voter mobilization andissue advocacy campaigns. Related to this, the improved ability to self-report and track data in the tools provided is key.
• Analyzing the longitudinal impact of voter registration drives.Research firms and organizations should work with NAM groups toanalyze the “waterfall effect” of their voter registration drives overmultiple cycles to better understand the long-term impact of voterregistration drives.
• Compiling a repository of best practices and research to date.Results of past experiments have not always been shared with groupson the ground. More can be done to make sure we are utilizing the bestresearch.
• Culturally inclusive experiments. Conduct community-basedexperiments within NAM-led voter registration drives to increaseknowledge and validate or invalidate past experiments.
» Recreate past best practice experiments to validate theirperformance in NAM communities.
» Conduct voter contact layering experiments to determine if combining registration tactics (eg. mail and canvass) produce better results.
» Test new experiments to increase interest in voter registration within NAM communities (eg. sweepstakes experiment).
» Test the impact of social media and the ability to promote voter registration.
» Test the impact of trusted messengers within NAM communities.
» Test which tactics, messages, and messengers work best in specificcommunities.
» Research attitudes and barriers around voting particular to NAM communities.
Results from such experiments, if shared locally and nationally, could powerfully improve how we engage NAM communities.
4. A SET OF PROMISING PRACTICES THAT WILL ENSURETHE LARGEST NUMBER POSSIBLE OF NEW AMERICAN MAJORITY VOTERS ARE REGISTERED WHILE CREATING LONG-TERM POLITICAL POWER.
Voter registration serves as one of the foundational building blocks for NAM organizations to build local political power by creating activist pipelines, culturally competent messengers, and engagement and capacity beyond Election Day. We know that voter registration works best when it is targeted to identity. Current voter registration programs do not make it standard to disaggregate data, messages, and tactics that speak to those specific andmulti-layered identities.
Over the course of discussions, several national partners and state tables have identified promising practices for engaging the NAM. The following are highlights:
• Multi-state and non-NAM-led organizations should partner with localNAM-led groups and state tables when conducting voter registrationand mobilization efforts to maximize their impact with local knowledge,community-based expertise, community validators, language andmessaging, and cultural sensitivities.
• Similarly, researchers and organizations running experiments shouldengage with groups in those communities on the concept design ofexperiments.
• When conducting experiments, NAM-led organizations should bebrought to the table immediately and given results of their and otherexperiments to help with the scope and design of the experiment on

10
the front end, to maximize its impact on the targeted community.
• When reporting the results of experiments and research, the resultsmust be disaggregated and include crosstabs on race, gender, age,ethnicity, and geography.
• Voter registration drives should be integrated with other data collectionefforts (e.g. social media opt-in) to maximize the amount and quality ofdata collected from the initial contact.
• Voter registration drives must be part of fuller voter engagement plansto engage voters in year-round integrated activities.
Building Long Term Power
Voter registration serves as an opening to engaging new voters in the civic engagement continuum that include education, mobilization, and turnout in year-round civic engagement. A successful voter registration program balances cost efficiency with learning; the key is replication. Our recommendation is that voter registration programs should:
• Create a wealth of wisdom, community validators, and best practiceson how best to engage local communities of color
• Develop culturally-competent community messengers andengagement
• Allow NAM groups to develop a pipeline of experienced staff andactivists for work beyond Election Day
• Include a community empowerment component
• Meet the community where they are instead of where we want them tobe
• Focus on the near-term needs in battleground states but also invest inthe future power of the NAM in non-electoral emerging communities,especially on local policy issues
• Build a larger pipeline of trained data managers and leaders incommunities of color so they can help our communities and run betterprograms
• Communicate impact and solutions that are self-sustaining andreplicable
RESEARCH AND EXPERIMENTATION
1. SUMMARY OF VOTER REGISTRATION LITERATUREREVIEW
Commissioned by State Voices and Prepared by The Analyst Institute and Catalist
In June 2014, State Voices and the Analyst Institute published a Voter Registration Literature Review to provide organizations with the existing research on voter registration to help them run more effective programs based on empirically tested strategies. Since the report’s initial publication, tremendous strides have been made to better establish the net impact and cost efficiency of different modes of outreach on voter registration. A brief summary is provided here. The full report is available upon request.
Mail outreach is by far the most-tested mode of voter registration. Using experiments to improve the cost effectiveness of their programs, the Voter Participation Center (VPC) has been able to reduce the cost per application (as opposed to cost per net registrant) from $12 in 2004 down to slightly over $5 in 2012. Multiple tests across electoral settings have shown that simple and official-sounding messages that clearly inform individuals how to register to vote, paired with plain black-and-white packaging, are the most effective mailers for voter registration. These types of mailers have proven to be more effective than partisan appeals, social norm and identity messages, and colorful packaging.
Importantly, analyses of VPC’s voter registration experiments during the 2014 election cycle found that their voter registration mail not only is cost-effective at generating new registrants, but these individuals also tend to be more likely to actually vote. These new registrants vote between 1.8 and 2.3 percentage points more than the original control groups that did not receive VPC’s voter registration mail. When this increase is compared to voter turnout experiments from the 2014 election, we find that VPC’s mail-based voter registration is as effective—if not more effective—at generating additional ballots cast as many voter turnout tactics that were tested.
One of the most exciting innovations in mail voter registration from the 2014 cycle is the advent of address-based targeting. Traditionally, mail voter registration outreach has been targeted at individuals who were known to be both eligible to vote and unregistered. For the first time in

11
2014, however, research showed that mail sent to addresses known to be occupied but not containing registered voters (and addressed to “Current Resident”) may be as cost-effective as sending voter registration mail to high-response-score Voting Age Population (VAP) targets. If this findingcan be replicated in 2015 and beyond, it may mean that the pool of cost-effective voter registration targets could as much as double, opening up a large new swath of targets for progressive organizations to register.
Canvass, Site-Based, and Mixed Modes
Recent tests of site-based voter registration canvasses have shown the mode can be an effective way to reach unregistered people. A 2014 test found that slightly under half of the registration applications collected at a site-based canvass yielded net registrants, a rate that echoes a similar 2011 test. While the cost per net registrant generated by site-based canvassing is higher than for mail, site-based canvassing still appears to be a strong complement to mail voter registration. On the other hand, a 2014 test that examined the impact of mail, door-to-door canvass, and the combination of the two on net registration found door-to-door canvassing did not have a meaningful impact on registration and the canvass and mail combined condition had an effect very similar to the mail-only condition. While more research needs to be conducted on the efficacy and cost-efficiencyof door-to-door canvasses, these results seem to contradict previous research that showed a substantial impact of door-to-door canvassing (and canvassing combined with mail) on card collection. This is an important reminder of the need to consider the net impact of a program on registration, not only the registration applications collected.
Two other canvass experiments have found that partisan c4 canvasses generate more registered Democrats than nonpartisan canvasses.
While emails are certainly cheaper to send than mail or canvass efforts, they have consistently been found to provide little to no boost to registration rates. This finding holds for emails from known and trusted sources as well as unsolicited emails.
The one experiment in which emails were effective was conducted in states with fully online voter registration.1 Emails that provided college students a link to the online voter registration system increased registration by a
modest, though statistically significant, one percentage point. We have not been able to replicate this finding, thus we do not ecommend relying too much on email voter registration efforts, even in the states with fully online registration.
Phone and Text
Only one experiment compared the effectiveness of phone calls to an uncontacted control group. This experiment found that robo-calls and live phone calls can increase voter registration by 1.7 and 0.8 percentage points, respectively. Due to a lack of replication, we do not have complete confidence in these results.
Two experiments have found that placing a phone call before mailing a registration form is no more effective at registering voters than simply mailing the form. Thus we recommend further replication before suggesting that phones can be effective in voter registration.
One text message experiment found that sending text messages to individuals who opt-in to receiving text messages, download a voter registration form from the Internet, but do not submit that form can increase voter registration rates by a statistically significant 4 pe centage points. While this is an impressive finding for a relatively inexpensive mode of contact, because only one experiment has been conducted and because text message voter registration requires a list of targets who have consented to an organization’s texting their cell phones, we recommend that the effectiveness of text message reminders be replicated in future experiments before making any final determinations of its cost-efficiency or scalability.
Public Services
Another area of voter engagement is in encouraging public service agencies to register voters. Though public assistance offices should already contain voter registration materials, under the National Voter Registration Act of 1993, there is room for growth in reaching unregistered voters when they interact with service agencies. Two experiments have been conducted, both of which show some promise in using emails and trainings to remind public service workers to comply with the law or to train them in ways to better register voters. This research should be expanded to include young voters who apply for driver’s licenses or other types of government services, similar to efforts to increase organ donation rates.
1. As of 2014, the states with fully online voter registration are Arizona, California, Colorado, Connecticut, Delaware, Georgia, Indiana, Kansas, Louisiana, Maryland, Minnesota, Missouri, Nevada, New York, Oregon, South Carolina, Utah, Virginia, and Washington. Fully online voter registration is currently being implemented in five other st tes. See http://www.ncsl.org/research/elections-and-campaigns/electronic-or-online-voter-registration.aspx for more details.

12
Online
While there is little research on whether an online registration option can impact registration rates, initial research seems to offer some promising signs. In a recent study presented in this review, the author conducted an individual-level regression analysis that isolated the impact of online registration on likelihood to register and found a slight but statistically significant positive impact. A 2014 test found that, in states where both online and regular options were available, directing potential registrants to a third-party registration site generated more net registrants than a Secretary of State’s site, but the difference was not statistically significant, nor was the overall difference between any of the treatment conditions and an untreated control group. Given the low cost of online ads, the approach may be relatively cost-effective, but it does not scale nearly as well as mail or site-based canvassing.
Observational Research
Recent studies have looked at new questions, all of which show promising research paths.
• A key new paper by academic researchers concluded that at least 11%of Voting Age Persons in the U.S. are “unlisted,” that is, are not includedin voter files or commercial data records. Compared to their “listed”counterparts, these targets are disproportionately New AmericanMajority. Combined with research from VPC, Analyst Institute, andProject Vote, this study points to the importance of reaching unlistedindividuals using address-based targeting and other approaches.
• In a creative new study, academic and industry researchers used Googlesearch data and found there was significant interest in registration afterdeadlines had passed.
• Using two modeling techniques, a pair of academics argue that pre-registration substantially increases youth voter turnout.
• In their wide-ranging 2012 study, the New Organizing Institute studiedthe registration activities of 93 independent registration organizations,finding they successfully gener ted over 2 million role-changingapplications, over 1 million of which were for new registrants. NOI’s2012 report is summarized in this document, and its similarly detailedand comprehensive reports for 2008 and 2010 are also available to thecommunity.
2. FUTURE RESEARCH QUESTIONS
Targeting
• Are households (from USPS lists or elsewhere) that are confirmed asresidential and occupied but do not have any registered voters goodmail registration targets?
• Do geographies with high proportions of households withoutregistered voters yield more net registrations than geographies with lowproportions of households without registered voters?
• What is the best way to encourage pre-registration of young voters?What are the best data sources for finding these young voters
• Though laws vary by state, election administrators tend to purge voterswho have not recently voted. What is the best way to re-register/reactivate inactive registrants who are in danger of falling off the rolls?
Messaging
• Does organizational branding (canvassers wearing t-shirts, uniforms,or costumes) make in-person outreach more effective than standardcanvasser dress?
• Does leading with issues (e.g., collecting registrations while petitioningfor a ballot measure) yield more registrations (or more registrationsfrom a specific demographic group) than voter registration by itself?
• Can we use quick-iteration A/B testing of solicitation messaging tofurther refine site-based canvassing
• Are targets registered by an organization more responsive to GOTVoutreach from that same organization?
Mode
• Can online ads be a cost-effective and scalable method for registeringvoters? Do video ads, long-term digital campaigns, and novel recruitmenttactics work better than display ads? Does organizational brand matter?
• What types of online registration forms are best suited for gettingapplicants through the registration process quickly and with minimalfriction? Are there particular features or designs that decrease fall-offover the course of the application process?
• Does canvasser efficiency-tracking (e.g., counting traffic at differentlocations or proportion of interactions that are successful) makecanvassers more effective?

13
• Does chase to registration targets who do not complete the process(e.g., fill in a voter registration application but do not show up on thefile) generate net registrations cost-effectively? Which chase modes(in particular digital ads or email, but also text, phone, mail) are mosteffective and cost-effective?
• Are certain types of targets more likely to register via mail versus site-based canvass or online? Does the type of mode used to solicit voterregistration implicitly yield more of one type of voter or another?
• Is it cost-effective to mobilize people to utilize social media toencourage their own personal networks to register to vote online?
PARTNERSHIP AND PLANNING
1. DRAFT VOTER REGISTRATION PARTNERSHIPAGREEMENT
COORDINATED VOTER REGISTRATION PARTNERSHIP AGREEMENT
About State Voices
State Voices is a national network of permanent, nonpartisan, state-based coalitions working year-round to create a more accessible, inclusive, and representative democracy by lifting the voices of New American Majority and building the strength of their leaders and organizations.
Since 2008, State Voices has pioneered a new approach to civic engagement and social change at the state-level. By employing collective impact – where change agents from different sectors come together to accomplish shared goals – we strengthen grassroots efforts to achieve solutions that no one group could achieve on its own. State Voices serves as a backbone organization for our 20 state tables, guiding the vision and strategy of the network, leveraging national resources, and ensuring coordination and communications.
Our 784 state, local, or national affiliate partners are organized into tables in the following states: Colorado, Florida, Georgia, Idaho, Maine, Massachusetts, Michigan, Minnesota, Montana, Nevada, New Mexico, New York, North Carolina, Ohio, Oregon, Pennsylvania, Virginia, Washington, Wisconsin, and California through the San Diego Metropolitan Area table. We also train and support an additional 214 partner groups in non-table states through our Tools For All Program.
The State Voices Network is committed to the elimination of discrimination and inequity based on race, ethnicity, gender, class, and sexual orientation. We seek to reflect this commitment through our hiring practices, table development, programming, and advocacy.
About The Table
[State Table Name] is a statewide network committed to the goal of ensuring that every eligible citizen is able to fully participate in our democracy. [State Table Name] is a model for coordination among

14
nonpartisan 501(c)3 advocacy, community, and grassroots organizations. We focus on engaging and empowering historically underrepresented communities so that we can build the power needed to eliminate barriers to civic participation and guarantee that policy-making is guided by the public interest, not special interests.
The Agreement
[State Table Name] seeks mutually beneficial relationships with 501(c)3 organizations that are engaged in nonpartisan voter registration, education, and turnout work during the 2016 electoral cycle. We want to help our partners achieve their voter registration goals, reduce duplication, and increase efficiencies within individual programs. In order to foster productive, transparent relationships, we have developed this voter registration partner agreement. The agreement lists both our commitments to our partners and what [State Table Name] needs from each partner organization in order to achieve maximum results for our collective voter registration priorities. The agreement is a relationship management tool for 2016 voter registration work in the twenty State Voices table states. The agreement is between each individual table and each respective table partner. The agreement begins when the table director and an authorized signer from a partner organization sign it. The agreement ends June 30, 2017
Table Commitments
1. The table will develop a strategic analysis of the political, demographic,and policy landscape in the state and establish shared priority needs,including compiling and incorporating input and advice from tablepartners.
2. In cooperation with national State Voices, and using the one agreedupon methodology for “mapping the need,” the table will develop adetailed analysis of voter registration gaps, by county, by demographicsubgroup. In cooperation with national State Voices, the table will alsoprovide recommendations for best practices in setting goals, pricing outprograms, and measuring success.
3. The table will provide a space for and facilitate coordinated planningfor nonpartisan electoral campaigns, issue campaign, and ballotcampaigns. This includes voter registration programs.
4. The table will foster networking and relationship building between tablepartners, national partners, and the donor community.
5. Table staff will make available technical assistance with field,communications, strategic analysis, and messaging.
6. The table will facilitate legal review of voter registration programmaterials for coordinated efforts.
7. The table will work to help partner organizations identify theirfundraising needs, and where possible, raise financial resources forcollaborative voter registration programmatic work.
8. The table will provide access to Catalist data and the VAN interface. Thetable will provide data management services that may include, but notbe limited to, cutting turf, administering VAN access, and determiningtargets.
9. Table partners can expect a prompt response (within a reasonabletimeline) on all data requests and questions related to collaborativetable programs.
10. The table will provide state partners and State Voices regular gapanalysis reports about the collaborative voter registration workhappening through the table. The timeline for delivering the reports tonational State Voices can be found in the Gap Analysis template. StateTable directors will establish a separate reporting schedule in eachstate to help make certain partner-level data is collected regularly andreflected in gap analysis reports. Gap analysis reports will be used toevaluate progress toward goals and continuously reevaluate programgoals.
Partner Commitments
1. Follow the spirit as well as the letter of IRS law covering 501(c)(3)activities.
2. Be collaborative. Attend, in person, if possible, all reasonably scheduledvoter registration meetings facilitated by the table. A decision makerfrom the partner organization must attend voter registration meetings.This means the director or a member of the senior staff.
3. Participate in the planning process and provide input and advice to thestate table director. Work with the table director, and/or table staff, toreach agreement about realistic organization-specific program goals,program costs, program design, program targets, program location,turf negotiations among partner organizations, program timeline, anddata collection and reporting plan. Follow the collaborative table planand the methodology for determining the voter registration need. If thepartner wishes to commence work with the table after the planningprocess is complete, the partner shall work with the table director and/or table staff to determine how to best fill gaps in the overall table plan
4. Follow best practices for program implementation, staff training, qualitycontrol, and reporting, as described in the collaborative table voterregistration plan.

15
5. Follow the reporting schedule that corresponds with the regular gapanalysis. The table director and/or table staff will prescribe a reportingschedule that allows for the on-time completion of gap analyses. Thatreporting schedule will be discussed and distributed ahead of programimplementation.
6. Work with the state data manager and state table director to ensureall valuable data gathered through coordinated programmatic workis appended to the VAN in a timely manner. Pay special attention tothis commitment immediately following the state’s voter registrationdeadline and immediately following Election Day(s).
7. Comply with the State Voices VAN MOU. Each group (not one coalitionleader/convener/representative) will sign a separate VAN MOU withState Voices.
8. Be an active supporter of the table with partners and donors.
9. Collaborate with the table’s crisis management plan.
10. The table director and the partner organizations will determine dues orother forms of contributions.
11. Maintain strict confidentiality regarding table plan andprogram information.
2. VOTER REGISTRATION PLANNING PACKET
COORDINATED VOTER REGISTRATION PLANNING PACKET
Overview
State Voices seeks to foster collaborative nonpartisan voter registration planning and program implementation in our twenty table states. Beginning with preparations for 2016 programs, State Voices will work with state and national partners to design programs, agree on definitions, develop onemethodology for mapping the voter registration need in a state, agree on metrics, and make certain there is a coordinated plan to report on both program progress and program gaps. Ultimately, State Voices seeks to achieve collective impact around voter registration, while simultaneously making certain partner organizations are able to achieve their specificorganizational goals. The work begins in 2016, but it does not end in 2016. We view 2016 as the beginning of a multi-year, multi-cycle process to register more people to vote and make certain that those who are registered can and do participate in our democracy in a variety of ways.
This packet is designed to clearly articulate the goals for collaborative voter registration planning in the twenty State Voices table states, provide an overview of that planning process, clarify key definitions, lay out afourth quarter 2015 planning timeline, list some elements of what could be included in regular “gap” reports throughout 2016, and provide a detailed planning template.
Planning Goals
1. Coordinate nonpartisan voter registration programs among state andnational partners in the twenty State Voices table states.
2. Using one agreed upon methodology, map the need for voterregistration in all twenty State Voices table states.
3. Prioritize specific geographical locations (counties) for voter registrationin each state.
4. Prioritize specific constituencies to be registered in eachgeographical location.
5. Map the division of labor among the tables, state-based partners, andnational partners.2
Table Director Partner Executive Director
Date Date
2. Be specific about roles for both smaller, and larger organizations. This will serve the purposes of delivering people onto the voting rolls, while also building organizational capacity in the states.
16
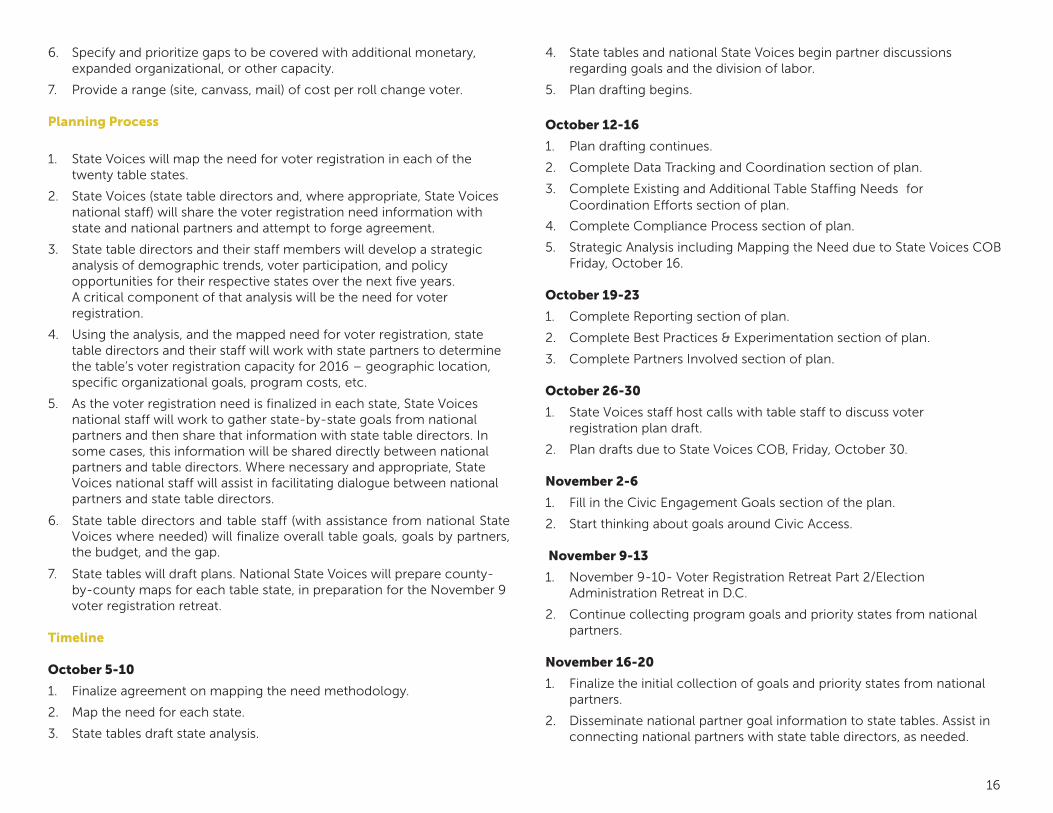
6. Specify and prioritize gaps to be covered with additional monetary,expanded organizational, or other capacity.
7. Provide a range (site, canvass, mail) of cost per roll change voter.
Planning Process
1. State Voices will map the need for voter registration in each of thetwenty table states.
2. State Voices (state table directors and, where appropriate, State Voicesnational staff) will share the voter registration need information withstate and national partners and attempt to forge agreement.
3. State table directors and their staff members will develop a strategicanalysis of demographic trends, voter participation, and policyopportunities for their respective states over the next five years.A critical component of that analysis will be the need for voterregistration.
4. Using the analysis, and the mapped need for voter registration, statetable directors and their staff will work with state partners to determinethe table’s voter registration capacity for 2016 – geographic location,specific organizational goals, program costs, etc.
5. As the voter registration need is finalized in each state, State Voicesnational staff will work to gather state-by-state goals from nationalpartners and then share that information with state table directors. Insome cases, this information will be shared directly between nationalpartners and table directors. Where necessary and appropriate, StateVoices national staff will assist in facilitating dialogue between nationalpartners and state table directors.
6. State table directors and table staff (with assistance from national StateVoices where needed) will finalize overall table goals, goals by partners,the budget, and the gap.
7. State tables will draft plans. National State Voices will prepare county-by-county maps for each table state, in preparation for the November 9voter registration retreat.
Timeline
October 5-10
1. Finalize agreement on mapping the need methodology.
2. Map the need for each state.
3. State tables draft state analysis.
4. State tables and national State Voices begin partner discussionsregarding goals and the division of labor.
5. Plan drafting begins.
October 12-16
1. Plan drafting continues.
2. Complete Data Tracking and Coordination section of plan.
3. Complete Existing and Additional Table Staffing Needs forCoordination Efforts section of plan.
4. Complete Compliance Process section of plan.
5. Strategic Analysis including Mapping the Need due to State Voices COBFriday, October 16.
October 19-23
1. Complete Reporting section of plan.
2. Complete Best Practices & Experimentation section of plan.
3. Complete Partners Involved section of plan.
October 26-30
1. State Voices staff host calls with table staff to discuss voterregistration plan draft.
2. Plan drafts due to State Voices COB, Friday, October 30.
November 2-6
1. Fill in the Civic Engagement Goals section of the plan.
2. Start thinking about goals around Civic Access.
November 9-13
1. November 9-10- Voter Registration Retreat Part 2/ElectionAdministration Retreat in D.C.
2. Continue collecting program goals and priority states from nationalpartners.
November 16-20
1. Finalize the initial collection of goals and priority states from nationalpartners.
2. Disseminate national partner goal information to state tables. Assist inconnecting national partners with state table directors, as needed.

17
3. Start the initial agreement-signing process between national partnersand state tables.
November 23-27
1. Finalize initial county-level, New American Majority specificdemographic breakdown for each state table.
2. Continue the agreement-signing process and the information sharingbetween national partners and state tables.
November 30-December 4
1. Tables begin and continue conversations with state partners and, wherepossible, national partners regarding collective voter registration andGOTV goals and division of labor by county and by demographic group(where appropriate).
2. Continue the agreement-signing process and the information sharingbetween national partners and state tables.
December 7-11
1. Tables continue conversations with state partners and, where possible,national partners regarding collective voter registration and GOTV goalsand division of labor by county and by demographic group.
2. Continue the agreement-signing process, and the information sharingbetween national partners, and state tables.
December 14-18
1. Tables finalize voter registration goals, GOTV goals, turf negotiations,and plans with state partners and national partners.
2. Final 2016 table plans due to national State Voices.
3. Continue the agreement-signing process and the information sharingbetween national partners and state tables.
December 21-23
1. Generate first gap analysis report, focusing heavily on fundraisinggaps that are tied to goals.
January
1. Revise goals, turf negotiations, and division of labor.
2. Finalize the signing of partner agreements.
3. Release second gap analysis report.
Program Update Report Components
1. Only information that is in the VAN will be reported.
2. Roll changes?
3. Cards processed by SOS?
4. Funds raised?
5. Funds left to raise?
6. Priority geographies and, if possible, groups?
Plan Outline
1. State Context
• Describe the major policy, political, and demographic trends andhow they connect to the need for voter registration. Be concise andspecific
2. Table Overview
• Emphasize collaboration of local and national organizations.
• Describe the table’s geographic focus.
• Describe the table’s programmatic focus.
3. Program Focus
• Provide an overview of the table’s voter registration work, placingit in the context of other work at the table. Connect the voterregistration work to other program goals for 2016 and beyond.
• Map the need for VR in the state using the one agreed upondefinition for the New American Majority and the one agreedupon methodology for determining the VR need.
» Represent the need in table or grid format, by county.
• Describe the constituencies who will be engaged through the plan,and be specific about geographical each (who resides where).
18
• Explain the strategy and outreach methods, including an explicitlisting of tactics, such as:3
» Paid site-based voter registration (i.e. public transit stops, hightraffic areas)
» Paid and volunteer door-to-door canvass
» Service provider outreach to clients and members
» College campus voter registration drives
» Mail programs
» Online programs
• Provide an overview of the voter verification systems/processes. »
Correct systemic errors that keep eligible applicants off of theroles
» Increase program efficiency
» Legal support
4. Data Tracking and Coordination
• Provide an explanation and detail the specific expectations about theuse of the tools (VAN and Catalist, perhaps a reporting tool as well).
• Discuss the process for cutting turf.
• Briefly discuss participation in regular meetings and planningsessions.
5. Existing and Additional Table Staffing Needs for CoordinationEfforts
• Management
• Field
• Data
• Legal
• Quality control
6. Compliance Process – Process explained in some detail – steps,division of labor, etc. One process for all those involved in thecoordinated program.
7. Reporting
• Specify the use of a reporting tool.
• Lay out the frequency of reports, the use of reports, and audiencesfor the reports. This includes the regular gap analysis.
• Explain how and when post-election reporting and evaluation willtake place.
8. Use of Best Practices and Experimentation
• Briefly explain how best practices for voter registration willbe integrated into program work.
• If applicable, provide details about experimentation.
9. Budget and Regranting
• Costs
• Regranting recipients (if known)
Voter Registration Terms And Definitions
DEMOGRAPHIC TERMS
Citizen Voting Eligible Population (CVAP) – CVAP is the number of persons in a geographic area who are citizens and at least 18 years of age. CVAP is useful for targeting registration programs as it can be estimated at the census tract and block group level and can be compared to voter registration counts.
Mobility – The percentage of people likely to move houses (and thus need to be re-registered) in a geographic area. Geographic mobility data is available from the census yearly ACS surveys and shows at a low level (census tract or block group) the percentage of people likely to move within a calendar year. Mobility rates vary greatly by geography, age, and housing unit (rentals).
New American Majority - The New American Majority is comprised of people of color, unmarried women, and younger persons ages 18 to 34.
Population Growth – The Everybody Votes Campaign program includes
3. There will be an effort to break out the tactics and numbers (goals) by group, and/or an explanation of what training the table will provide to help groups set realistic goals. Rules for determining which groups can expand their capacity with additional funding will be captured in the agreement.

19
population growth as part of its targeting projections. The growth is definedas the change in citizen voting age population for white and non-white adults in a state over a two-year period. This category includes people who turn 18 years old in a state, adult citizens that move into a state from another state, and newly eligible citizens.
Voting Age Population (VAP) – VAP is the set of individuals who have reached the minimum voting age (18 years old) for a particular geography or political unit.
Voting Eligible Population (VEP) – VEP is an estimate of the number of people eligible to vote. This differs from the citizen voting age population in that it removes additional ineligible adults including felons and mentally incapacitated persons. Felons as a category vary significantly depending on state laws. It is difficult to target using VEP data unfortunately as it is not available below the state level.
VOTER REGISTRATION AND ELECTORAL TERMS
Applications in the Voter Registration Tool - After data entry, electronic records of each voter file applic tion are loaded in the VAN's Voter Registration Tool. This number includes any duplicate applications collected. These data are now available for voter contact and are sent to Catalist for matching.
Card - Card describes a single voter registration application. This can be either a state provided form or the common federal form defined by theHelp America Vote Act of 2002 (HAVA). A card is not an applicant or a registered voter.
Cards Collected - A count of all cards collected from applicants during a specified period (or a running count since inception of the program). Some partners only report applications that have gone through their quality control process - as one table called "cured" in 2012; some report all the raw applications. Our recommendation is our network develops and adopts a standard method of reporting the applications collected.
Cost Per Net Vote – The cost per net vote represents the cost of adding one vote in an election, regardless of whether that vote was added through a new voter registration or a turnout program. In the context of a voter registration program, it represents the cost per net registration generated multiplied by the projected turnout percentage of the newly registered voters.
De-Duped Applications in the Voter Registration Tool - VAN applies a literal matching algorithm to remove duplicate voter registration applications loaded into the VAN’s Voter Registration Tool.
Double Data Entry - Double data entry is a method to improve the reliability and accuracy of data entry. Data is from the same source entered twice - either in the form of two separate channels (such as Optical Character Recognition and keystroke entry). The two input channels are compared to identify flaws and/or me ged to provide a high quality product. Double data entry is initially more costly but results in much higher data quality than single data entry.
Electoral Margin – The electoral margin used in this plan refers to the average margin between winning and losing candidates in recent statewide elections for President, Senate, and Governor. This margin was calculated from recent elections in each state, throwing out the most lopsided races. The average margin in the state then serves as a goal for the Everybody Votes Campaign registration program where the program generates enough net votes through registrations to surpass the electoral margin.
Net Minority Registrations – Goals in the Everybody Votes Campaign program are based solely on registrations from non-white adults. The net minority registrations is an estimate of the number of minority registrations that will be generated from the program assuming that only 90% of all mail registrations and 75% of all site-based registrations will come from non-white adults.
Net New Registered Voters – This is the increase in the number of registered voters in a registration program that are successful and would not have occurred had the registration program not existed.
Net New Votes – This is the number of votes generated from the registration program from successfully registered voters and would not have occurred had the registration program not existed.
Net Registration Rate – This is the percentage of voter registrations from a program that are successful and would not have occurred had the registration program not existed. If a program has a projected net registration rate of 50%, it would have to collect 20,000 total registration applications to generate 10,000 net registrations.
Roll-Changing Registrations – A voter registration is determined to be roll-changing if the voter shows up on the election rolls after the election as a new voter, a change of address, a change in voter status (active/inactive), or a change in his/her registration date. If the voter had been previously registered with no change in status, it does not count as a roll-changing registration.

20
Successful Registrations – A voter registration is determined to be successful if the newly registered voter is found on the voter registration list after the election at the address from which he/she applied. This differs from roll-changing registrations as it counts voters that appear on the list with no apparent change in their voter information.
Unique Applications - The Grassroots Solutions Independent Voter Registration Report uses a more sophisticated matching algorithm than VAN, resulting in eliminating one or two percent more duplicates than the VAN’s algorithm eliminates.VRA – Voter Registration Applicant - An individual who has submitted an application for voter registration.
VRT – Voter Registration Tool - The VAN (Voter Activation Network) Voter Registration tool is the common repository for voter registration applicant data.
MAIL LISTS
Address-Based Mail – Mail sent to addresses where there are no known registered voters, not mail sent to individual names at the address. Address-based mail does not require lists so the potential for expanding the reach of the mail is great. Address-based mail must be targeted geographically, however, so its best use for the Everybody Votes Campaign is to target majority-minority census tracts or precincts. Early experimental returns for address-based mail are promising, though more tests are needed.
Birthday Lists – VPC’s birthday program targets teens in the year when they turn 18 years old and become eligible to vote. Birthday lists tend to be effective year-round as they attempt to register a person on his/her birthday, not around a specific election
Family Lists – Similar to birthday lists, family lists are addressed to the parents in households where there is likely to also contain a child turning
18. The difference with family lists is in not knowing the name of the child.
The family lists generally have a lower response rate than the birthday lists though experiments have shown that the cost per net vote of family programs is competitive with voting age population and address-based lists.
Mover Lists – These lists consist of previously registered voters who have moved and typically filled out a NCOA (National Change of Address) card when they moved. Mover lists typically have the highest response rate of any of the mail registration lists though are somewhat limited in size as not everyone fills out an NCOA card when they move.
Voting Age Population Lists (VAP) – VAP lists are lists of adults that live at a specific add ess and who are not registered to vote. These lists are generated as a result of a match between the voter registration lists in a state with other lists of consumer data. VAP lists have a lower return than other mail lists though are important because they expand the reach of mail to people beyond the more limited mover and birthday lists. VAP lists vary in quality so are best used in tandem with a list quality model that lets one select the names most likely to be cost-effective voter registrations.

21
2016 STATE TABLE VOTER REGISTRATION PLAN SUMMARIES

22
TABLEREPORTED
REGISTRATIONS
GROSS ROLL CHANGE
REGISTRATIONS
NET REGISTRATIONS
FIELD REGISTRATION
BUDGET
PRIORITY COUNTIES
NAM VR GAP
% GAP CLOSED IN PRIORITY
COUNTIES
STATEWIDE NAM VR GAP
% GAP CLOSED
STATEWIDE
Colorado CE Roundtable 102,000 72,420 38,760 $1,734,000 235,783 16.4% 278,844 13.9%
Florida c3 CE Roundtable 275,000 195,250 104,500 $4,675,000 271,026 38.6% 704,348 14.8%
ProGeorgia 39,500 28,045 15,010 $671,500 166,129 9.0% 414,348 3.6%
Idaho CE Table 11,952 8,486 4,542 $203,184 59,969 7.6% 83,614 5.4%
Maine Voices Network 11,400 8,094 4,332 $193,800 26,270 16.5% 45,075 9.6%
Massachusetts Voter Table 56,338 40,000 21,408 $957,746 205,355 10.4% 306,840 7.0%
Michigan Voice 23,662 16,800 8,992 $402,254 341,165 2.6% 508,452 1.8%
Minnesota Voice 20,950 14,875 7,961 $356,150 161,832 4.9% 250,409 3.2%
Montana Voices 23,944 17,000 9,099 $407,048 26,202 34.7% 55,169 16.5%
Silver State Voices (NV) 35,100 24,921 13,338 $596,700 83,243 16.0% 102,081 13.1%
New Mexico CE Table 13,000 9,230 4,940 $221,000 51,155 9.7% 81,025 6.1%
New York CE Table 23,943 17,000 9,098 $407,031 241,635 3.8% 703,681 1.3%
Blueprint NC 30,000 21,300 11,400 $510,000 162,455 7.0% 320,485 3.6%
Ohio Voice 55,000 39,050 20,900 $935,000 217,990 9.6% 540,257 3.9%
Oregon Voice 15,000 10,650 5,700 $255,000 82,844 6.9% 179,184 3.2%
Pennsylvania Voice 175,000 124,250 66,500 $2,975,000 345,718 19.2% 532,387 12.5%
Engage San Diego 3,521 2,500 1,338 $59,857 170,085 0.8% 170,085 0.8%
Virginia CE Table 220,000 156,200 83,600 $3,740,000 147,430 56.7% 296,824 28.2%
Win/Win Network (WA) 24,324 17,270 9,243 $413,508 148,021 6.2% 368,476 2.5%
Wisconsin Voices 30,000 21,300 11,400 $510,000 37,147 30.7% 88,455 12.9%
TOTAL 1,189,634 844,640 452,061 $20,223,778 3,082,873 14.2% 6,030,039 7.5%
STATE VOICES NETWORK 2016 FIELD VOTER REGISTRATION GOALS

23
THE NEED FOR VOTER REGISTRATION
The New American Majority* (NAM) is registered to vote at a lower rate than the general population in every state in America. We refer to the gap between these rates as the Voter Registration Need.
*Unmarried women, people of color, and young adults aged 18-34
NETWORK FIELD REGISTRATION GOALS:
Reported Registrations: 1,189,634Gross Roll Change Registrations: 844,640
Net Registrations: 452,061Budget: $20,223,778
THE NETWORK STRATEGY
Our network has identified 182 priority counties and 2 priority communities where partners have the capacity to register members of the New American Majority. The map shows the NAM registration gap by number and percentage in those priority counties.
3,082,873 NAM net registrations
are needed to close this gap
In our 20 table states, the voter registration gap in
priority counties is
14.2%
STATE VOICES NETWORK
15.4%26,202
15.3%59,969
11.1%
205,3557.0%241,635
9.4%345,718
8.3%147,430
8.8%217,990
10.1%26,270
11.5%341,165
7.4%162,455
7.8%166,129
5.8%271,026
3.8%37,147
12.7%161,832
12.1%170,085
8.5%83,243
12.1%148,021
13.6%
235,783
8.1%51,155
10.6%82,844

24
COLORADO CIVIC ENGAGEMENT ROUNDTABLE
PRIORITY #1 PRIORITY #2 PRIORITY #3
LARIMER 13.4% WELD 16.9%
BOULDER 8.9%
ADAMS 12.1%
ARAPAHOE 11.8%
DOUGLAS 18.9%
JEFFERSON 13.5%
DENVER 7.6%
FREMONT 21.0%
EL PASO 17.7%
PUEBLO 13.1%
ALAMOSA 13.3%LA PLATA 15.1%MONTROSE 17.0%
MESA 16.4%
GARFIELD 10.3%
16,67516,317
1,750
9,027
2,183
10,584
3,204
1,072
4,048
10,221
21,89326,927
27,031
23,033
46,308
15,510
THE NEED FOR VOTER REGISTRATION
The New American Majority* (NAM)is registered to vote at a lower rate
than the general population in every state in America. We refer
to the gap between these rates as the Voter Registration Need.
*Unmarried women, people of color,and young adults aged 18-34
TABLE FIELD REGISTRATION GOALS:
Reported Registrations: 102,000Gross Roll Change Registrations: 72,420
Net Registrations: 38,760Budget: $1,734,000
THE TABLE STRATEGY
The Colorado Civic Engagement Roundtable has identified
16 priority counties where their partners have the capacity to register members of the New American Majority. The map
shows the NAM registration gap by number and percentage in
each priority county.
278,844 NAM net registrations
are needed to close the statewide gap
In Colorado, the statewide voter
registration gap is
13.8%

FLORIDA 501(c)(3) CIVIC ENGAGEMENT TABLE
LEON 7.5%
DUVAL 8.0%
ORANGE 6.9%
OSCEOLA 5.0%
PALM BEACH 8.1%
MIAMI-DADE 2.0%
PINELLAS 7.8%
HILLSBOROUGH 9.2%
11,598
6,73452,848
29,508
27,366
42,332
25,898
BROWARD 3.4%
34,582
40,160
THE NEED FOR VOTER REGISTRATION
The New American Majority* (NAM)is registered to vote at a lower rate than the general population in every state in America. We refer to the gap between these rates as the Voter Registration Need.
*Unmarried women, people of color, and young adults aged 18-34
TABLE FIELD REGISTRATION GOALS:
Reported Registrations: 275,000Gross Roll Change Registrations: 195,250Net Registrations: 104,500Budget: $4,675,000
THE TABLE STRATEGY
The Florida 501(c)(3) Civic Engagement Table has identified 9 priority counties where their partners have the capacity to register members of the New American Majority. The map shows the NAM registration gap by number and percentage in each priority county.
704,348 NAM net registrations are needed to close the statewide gap
In Florida, the statewide voter registration gap is
8.6%
25

26
PROGEORGIA THE NEED FOR VOTER REGISTRATION
The New American Majority* (NAM)is registered to vote at a lower rate
than the general population in every state in America. We refer
to the gap between these rates as the Voter Registration Need.
*Unmarried women, people of color, and young adults aged 18-34
TABLE FIELD REGISTRATION GOALS:
Reported Registrations: 39,500Gross Roll Change Registrations: 28,045
Net Registrations: 15,010Budget: $671,500
THE TABLE STRATEGY
ProGeorgia has identified 11 priority counties where their
partners have the capacity to register members of the New American Majority. The map
shows the NAM registration gap by number and percentage in
each priority county.
414,348 NAM net registrations
are needed to close the statewide gap
In Georgia, the statewide voter registration gap is
9.3%
CHATHAM 8.5%
CLARKE 9.6%
CLAYTON 0.2%
COBB 11.6%
DEKALB 5.1%
FULTON 7.9%
GWINNETT 9.9%
HALL 16.4%
DOUGHERTY 4.3%
MUSCOGEE 5.6%
RICHMOND 3.5%
2,436
4,222
12,495
6,205
9,630
6,989
280
31,39633,358
39,72019,398
27
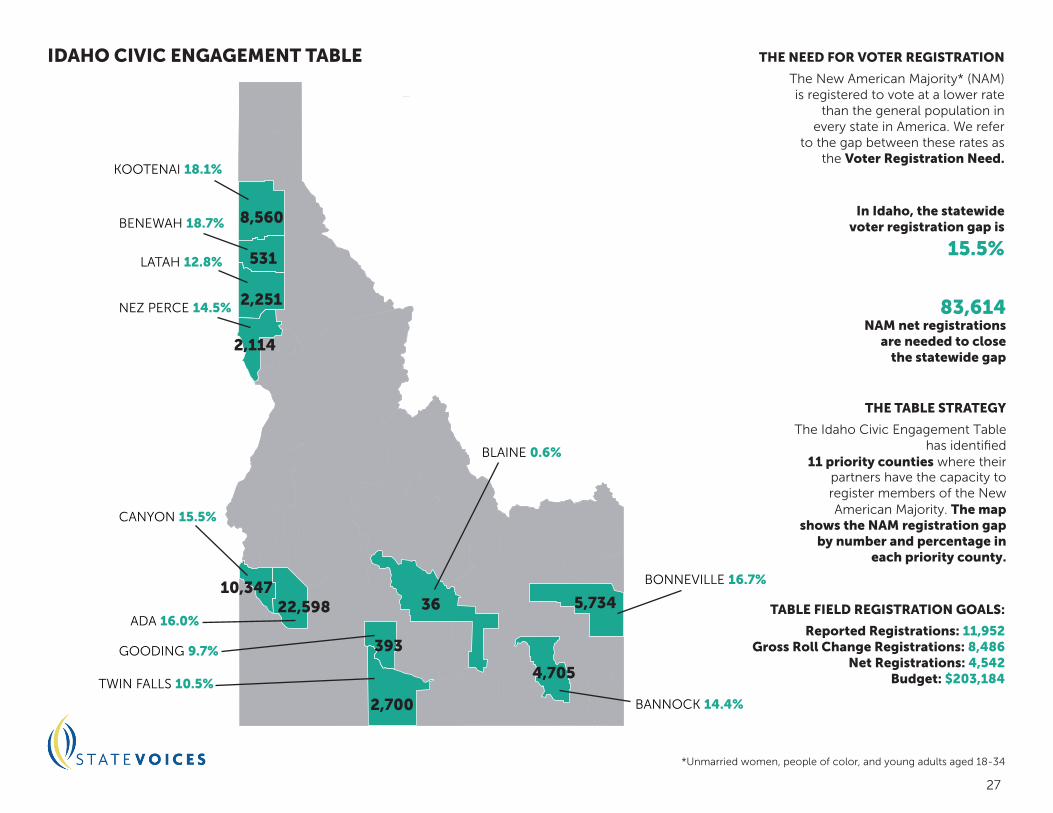
IDAHO CIVIC ENGAGEMENT TABLE THE NEED FOR VOTER REGISTRATION
The New American Majority* (NAM)is registered to vote at a lower rate
than the general population in every state in America. We refer
to the gap between these rates as the Voter Registration Need.
*Unmarried women, people of color, and young adults aged 18-34
TABLE FIELD REGISTRATION GOALS:
Reported Registrations: 11,952Gross Roll Change Registrations: 8,486
Net Registrations: 4,542Budget: $203,184
THE TABLE STRATEGY
The Idaho Civic Engagement Table has identified
11 priority counties where their partners have the capacity to register members of the New American Majority. The map
shows the NAM registration gap by number and percentage in
each priority county.
83,614 NAM net registrations
are needed to close the statewide gap
In Idaho, the statewide voter registration gap is
15.5%
ADA 16.0%
BANNOCK 14.4%
BENEWAH 18.7%
BLAINE 0.6%
BONNEVILLE 16.7%
CANYON 15.5%
GOODING 9.7%
KOOTENAI 18.1%
LATAH 12.8%
NEZ PERCE 14.5%
TWIN FALLS 10.5%
8,560
531
2,251
2,114
3622,59810,347
4,705
5,734
393
2,700
28
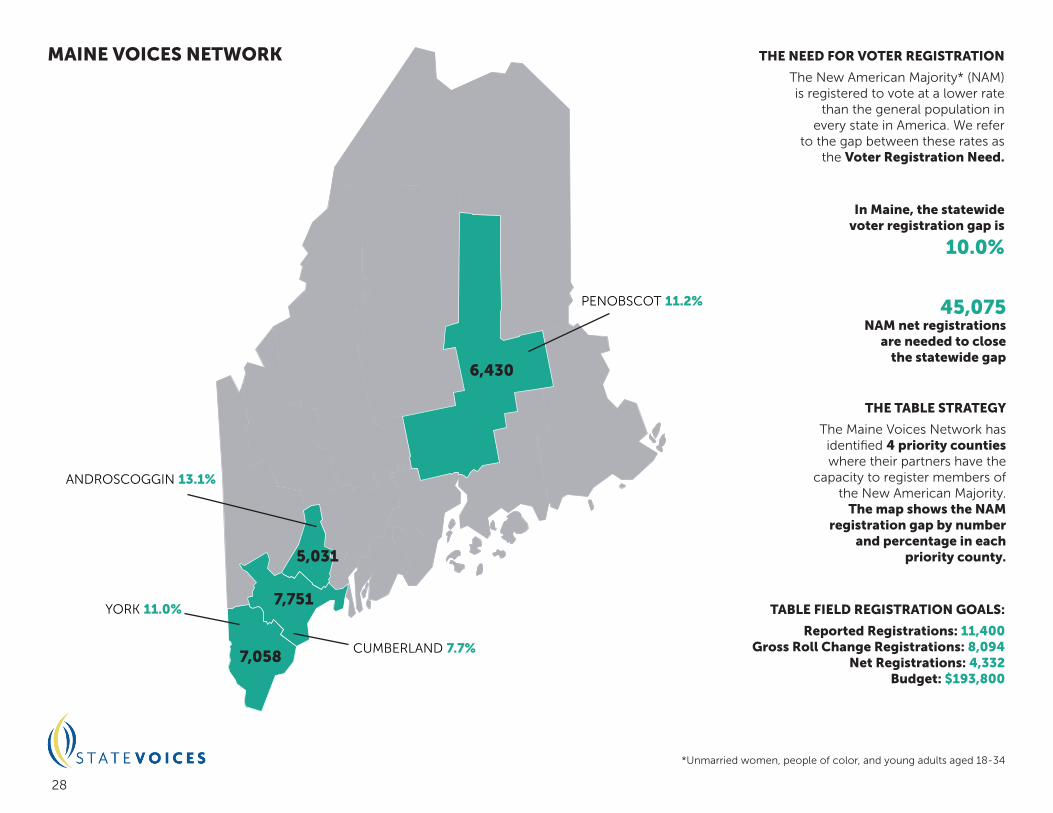
MAINE VOICES NETWORK THE NEED FOR VOTER REGISTRATION
The New American Majority* (NAM)is registered to vote at a lower rate
than the general population in every state in America. We refer
to the gap between these rates as the Voter Registration Need.
*Unmarried women, people of color, and young adults aged 18-34
TABLE FIELD REGISTRATION GOALS:
Reported Registrations: 11,400Gross Roll Change Registrations: 8,094
Net Registrations: 4,332Budget: $193,800
THE TABLE STRATEGY
The Maine Voices Network has identified 4 priority counties where their partners have the
capacity to register members of the New American Majority.
The map shows the NAM registration gap by number
and percentage in each priority county.
45,075 NAM net registrations
are needed to close the statewide gap
In Maine, the statewide voter registration gap is
10.0%
ANDROSCOGGIN 13.1%
CUMBERLAND 7.7%
PENOBSCOT 11.2%
YORK 11.0%
6,430
7,058
7,751
5,031

29
MASSACHUSETTS VOTER TABLE THE NEED FOR VOTER REGISTRATION
The New American Majority* (NAM)is registered to vote at a lower rate
than the general population in every state in America. We refer
to the gap between these rates as the Voter Registration Need.
*Unmarried women, people of color, and young adults aged 18-34
TABLE FIELD REGISTRATION GOALS:
Reported Registrations: 56,338Gross Roll Change Registrations: 40,000
Net Registrations: 21,408Budget: $957,746
THE TABLE STRATEGY
The Massachusetts Voter Table has identified 6 priority counties
where their partners have the capacity to register members of
the New American Majority. The map shows the NAM
registration gap by number and percentage in each priority
county.
306,840NAM net registrations
are needed to close the statewide gap
In Massachusetts, the statewide voter
registration gap is
12.0%
BRISTOL 8.9%
ESSEX 12.4%
HAMPDEN 11.1%
MIDDLESEX 12.0%
SUFFOLK 4.8%
WORCESTER 15.4%
22,654
44,537
67,041
33,801
19,058
18,264

30
MICHIGAN VOICE THE NEED FOR VOTER REGISTRATION
The New American Majority* (NAM)is registered to vote at a lower rate
than the general population in every state in America. We refer
to the gap between these rates as the Voter Registration Need.
*Unmarried women, people of color, and young adults aged 18-34
TABLE FIELD REGISTRATION GOALS:
Reported Registrations: 23,662Gross Roll Change Registrations: 16,800
Net Registrations: 8,992Budget: $402,254
THE TABLE STRATEGY
Michigan Voice has identified 17 priority counties where their
partners have the capacity to register members of the New American Majority. The map
shows the NAM registration gap by number and percentage in
each priority county.
508,452 NAM net registrations
are needed to close the statewide gap
In Michigan, the statewide voter
registration gap is
12.9%
ALLEGAN 18.0%
BAY 16.8%
BERRIEN 14.0%
CALHOUN 15.1%
MUSKEGON 15.7%
OAKLAND 9.1%
OTTAWA 23.6%
GENESEE 12.3%
INGHAM 13.1%
ISABELLA 17.9%
JACKSON 17.2%KALAMAZOO 15.7%
KENT 15.9%MACOMB 10.9%
SAGINAW 13.6%
WASHTENAW 12.5%
WAYNE 6.5%
6,649
11,988
8,358
17,246 7,968
17,660
10,184 19,818
42,142
22,529
60,952
33,725
37,288
10,730
21,598
6,007
6,323
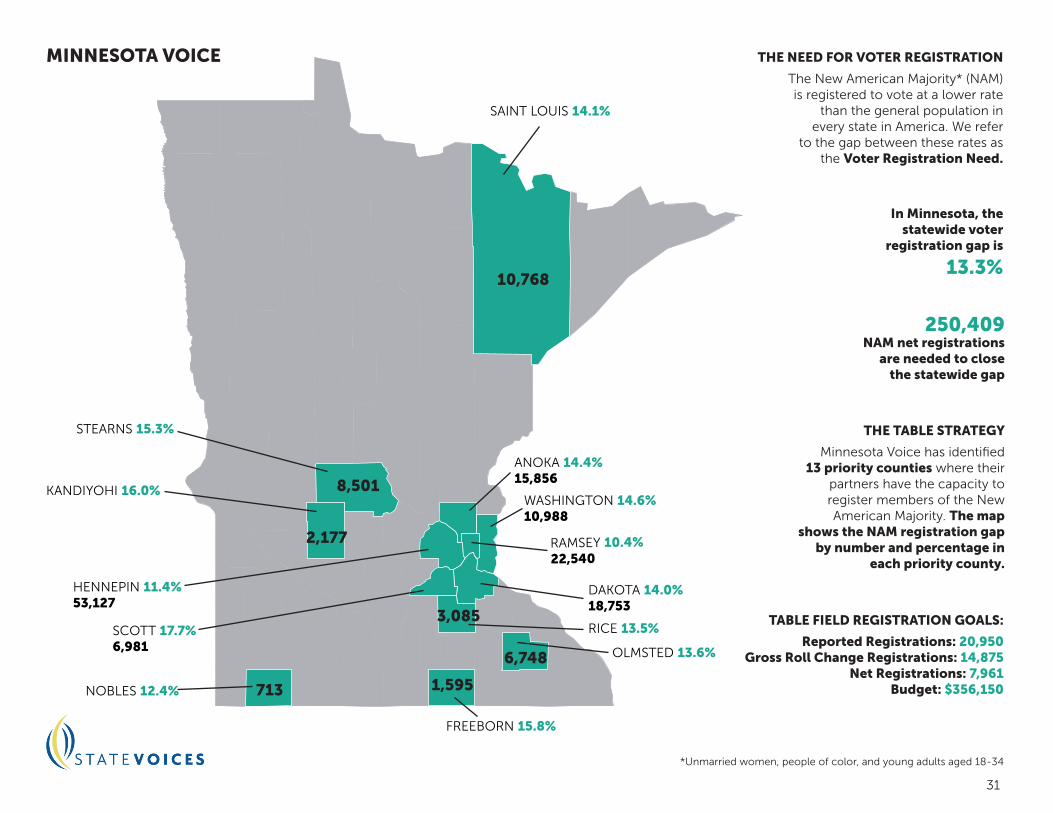
31
MINNESOTA VOICE THE NEED FOR VOTER REGISTRATION
The New American Majority* (NAM)is registered to vote at a lower rate
than the general population in every state in America. We refer
to the gap between these rates as the Voter Registration Need.
*Unmarried women, people of color, and young adults aged 18-34
TABLE FIELD REGISTRATION GOALS:
Reported Registrations: 20,950Gross Roll Change Registrations: 14,875
Net Registrations: 7,961Budget: $356,150
THE TABLE STRATEGY
Minnesota Voice has identified 13 priority counties where their
partners have the capacity to register members of the New American Majority. The map
shows the NAM registration gap by number and percentage in
each priority county.
250,409 NAM net registrations
are needed to close the statewide gap
In Minnesota, the statewide voter
registration gap is
13.3%
ANOKA 14.4%15,856
DAKOTA 14.0%18,753
FREEBORN 15.8%
HENNEPIN 11.4%53,127
KANDIYOHI 16.0%
NOBLES 12.4%
OLMSTED 13.6%
RAMSEY 10.4%22,540
RICE 13.5%
SAINT LOUIS 14.1%
SCOTT 17.7%6,981
STEARNS 15.3%
WASHINGTON 14.6%10,988
10,768
8,501
2,177
713
6,748
1,595
3,085

32
MONTANA VOICES THE NEED FOR VOTER REGISTRATION
The New American Majority* (NAM)is registered to vote at a lower rate
than the general population in every state in America. We refer
to the gap between these rates as the Voter Registration Need.
*Unmarried women, people of color, and young adults aged 18-34
TABLE FIELD REGISTRATION GOALS:
Reported Registrations: 23,944Gross Roll Change Registrations: 17,000
Net Registrations: 9,099Budget: $407,048
THE TABLE STRATEGY
Montana Voices has identified 4 priority counties where their
partners have the capacity to register members of the New American Majority. The map
shows the NAM registration gap by number and percentage in
each priority county.
55,169NAM net registrations
are needed to close the statewide gap
In Montana, the statewide voter
registration gap is
15.1%
CASCADE 18.2%
GALLATIN 13.0%
MISSOULA 12.7%
YELLOWSTONE 17.1%
9,570
5,678
6,069
4,885

33
SILVER STATE VOICES (NEVADA) THE NEED FOR VOTER REGISTRATION
The New American Majority* (NAM)is registered to vote at a lower rate
than the general population in every state in America. We refer
to the gap between these rates as the Voter Registration Need.
*Unmarried women, people of color, and young adults aged 18-34
TABLE FIELD REGISTRATION GOALS:
Reported Registrations: 35,100Gross Roll Change Registrations: 24,921
Net Registrations: 13,338Budget: $596,700
THE TABLE STRATEGY
Silver State Voices has identified 2 priority counties where their
partners have the capacity to register members of the New American Majority. The map
shows the NAM registration gap by number and percentage in
each priority county.
102,081 NAM net registrations
are needed to close the statewide gap
In Nevada, the statewide voter registration gap is
9.1%
65,370
17,873
CLARK 7.8%
WASHOE 10.8%

34
NEW MEXICO CIVIC ENGAGEMENT TABLE THE NEED FOR VOTER REGISTRATION
The New American Majority* (NAM)is registered to vote at a lower rate
than the general population in every state in America. We refer
to the gap between these rates as the Voter Registration Need.
*Unmarried women, people of color, and young adults aged 18-34
TABLE FIELD REGISTRATION GOALS:
Reported Registrations: 13,000Gross Roll Change Registrations: 9,230
Net Registrations: 4,940Budget: $221,000
THE TABLE STRATEGY
The New Mexico Civic Engagement Table has identified 9 priority counties where their
partners have the capacity to register members of the New American Majority. The map
shows the NAM registration gap by number and percentage in
each priority county.
81,025 NAM net registrations
are needed to close the statewide gap
In New Mexico, the statewide voter
registration gap is
7.8%
2,885
3,808
6,696
787
7,544
1,700
26,538
1,8731,024
CHAVES 10.1%
VALENCIA 4.8%
SAN JUAN 11.6%
MCKINLEY 3.7%
CIBOLA 6.1%
LUNA 7.2%DOÑA ANA 6.4%
OTERO 13.3%
BERNALILLO 7.8%

35
NEW YORK CIVIC ENGAGEMENT TABLE THE NEED FOR VOTER REGISTRATION
The New American Majority* (NAM)is registered to vote at a lower rate
than the general population in every state in America. We refer
to the gap between these rates as the Voter Registration Need.
*Unmarried women, people of color, and young adults aged 18-34
TABLE FIELD REGISTRATION GOALS:
Reported Registrations: 23,943Gross Roll Change Registrations: 17,000
Net Registrations: 9,098Budget: $407,031
THE TABLE STRATEGY
The New York Civic Engagement Table has identified 6 priority counties where their partners
have the capacity to register members of the New American
Majority. The map shows the NAM registration gap by
number and percentage in each priority county.
703,681 NAM net registrations
are needed to close the statewide gap
In New York, the statewide voter
registration gap is
8.3%
ERIE 13.1%
KINGS 1.5%19,528
NASSAU 10.5%53,825
QUEENS 1.6%17,161
SUFFOLK 13.3%
WESTCHESTER 8.0%
50,945
70,786
29,390

36
BLUEPRINT NC
FORSYTH 6.9%
GASTON 9.0%
GUILFORD 6.3%
HARNETT 8.8%
JOHNSTON 10.7%
MECKLENBURG 6.3%
NASH 5.9%
NEW HANOVER 10.5%
ONSLOW 11.6%
PITT 7.8%
UNION 11.2%
WAKE 8.4%
WATAUGA 6.9%
EDGECOMBE 1.7%
BUNCOMBE 6.9%
CUMBERLAND 4.7%
DURHAM 2.7%
3,870
6,541
8,365
559
10,668
7,449
14,913
4,5306,523
27,565
2,724
9,751
11,054
7,277
7,082
31,752
1,832
THE NEED FOR VOTER REGISTRATION
The New American Majority* (NAM)is registered to vote at a lower rate than the general population in every state in America. We refer to the gap between these rates as the Voter Registration Need.
TABLE FIELD REGISTRATION GOALS:
Reported Registrations: 30,000Gross Roll Change Registrations: 21,300Net Registrations: 11,400Budget: $510,000
THE TABLE STRATEGY
Blueprint NC has identified 17 priority counties where their partners have the capacity to register members of the New American Majority. The map shows the NAM registration gap by number and percentage in each priority county.
320,485 NAM net registrations are needed to close the statewide gap
In North Carolina, the statewide voter registration gap is
7.8%
*Unmarried women, people of color, and young adults aged 18-34

37
OHIO VOICE THE NEED FOR VOTER REGISTRATION
The New American Majority* (NAM)is registered to vote at a lower rate
than the general population in every state in America. We refer
to the gap between these rates as the Voter Registration Need.
*Unmarried women, people of color, and young adults aged 18-34
TABLE FIELD REGISTRATION GOALS:
Reported Registrations: 55,000Gross Roll Change Registrations: 39,050
Net Registrations: 20,900Budget: $935,000
THE TABLE STRATEGY
Ohio Voice has identified 8 priority counties where their
partners have the capacity to register members of the New American Majority. The map
shows the NAM registration gap by number and percentage in
each priority county.
540,257 NAM net registrations
are needed to close the statewide gap
In Ohio, the statewide voter registration gap is
11.9%
CUYAHOGA 6.4%
FRANKLIN 8.4%
MAHONING 10.8%
LUCAS 9.8%
HAMILTON 8.4%
MONTGOMERY 10.5%
STARK 14.3%
SUMMIT 11.4%
45,847
10,712
19,741
25,257
39,975
19,463
25,590
31,405

38
OREGON VOICE THE NEED FOR VOTER REGISTRATION
The New American Majority* (NAM)is registered to vote at a lower rate
than the general population in every state in America. We refer
to the gap between these rates as the Voter Registration Need.
*Unmarried women, people of color, and young adults aged 18-34
TABLE FIELD REGISTRATION GOALS:
Reported Registrations: 15,000Gross Roll Change Registrations: 10,650
Net Registrations: 5,700Budget: $255,000
THE TABLE STRATEGY
Oregon Voice has identified 4 priority counties where their
partners have the capacity to register members of the New American Majority. The map
shows the NAM registration gap by number and percentage in
each priority county.
179,184NAM net registrations
are needed to close the statewide gap
In Oregon, the statewide voter registration gap is
12.6%
CLACKAMAS 13.7%
LANE 12.5%
MULTNOMAH 7.7%WASHINGTON 11.9%
17,813
17,203
22,951 24,877
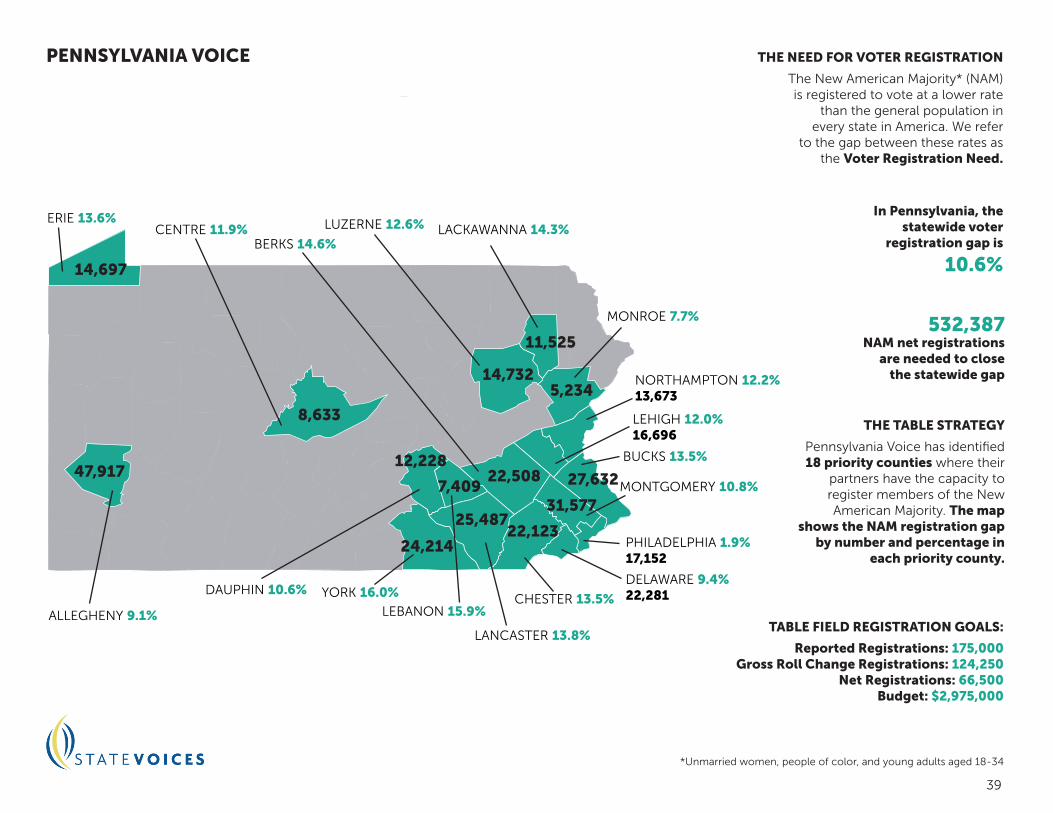
39
PENNSYLVANIA VOICE THE NEED FOR VOTER REGISTRATION
The New American Majority* (NAM)is registered to vote at a lower rate
than the general population in every state in America. We refer
to the gap between these rates as the Voter Registration Need.
*Unmarried women, people of color, and young adults aged 18-34
TABLE FIELD REGISTRATION GOALS:
Reported Registrations: 175,000Gross Roll Change Registrations: 124,250
Net Registrations: 66,500Budget: $2,975,000
THE TABLE STRATEGY
Pennsylvania Voice has identified 18 priority counties where their
partners have the capacity to register members of the New American Majority. The map
shows the NAM registration gap by number and percentage in
each priority county.
532,387NAM net registrations
are needed to close the statewide gap
In Pennsylvania, the statewide voter
registration gap is
10.6%
ALLEGHENY 9.1%
BERKS 14.6%
BUCKS 13.5%
CENTRE 11.9%
CHESTER 13.5%DAUPHIN 10.6%
DELAWARE 9.4%22,281
ERIE 13.6%LACKAWANNA 14.3%
LANCASTER 13.8%
PHILADELPHIA 1.9%17,152
LEBANON 15.9%
LEHIGH 12.0%16,696
LUZERNE 12.6%
MONROE 7.7%
MONTGOMERY 10.8%
NORTHAMPTON 12.2%13,673
YORK 16.0%
14,697
8,633
47,917
14,732
11,525
5,234
22,508
25,487
27,632
22,12324,214
12,228
7,40931,577

40
UNIVERSITY OF CALIFORNIA SAN DIEGO
ENGAGE SAN DIEGO THE NEED FOR VOTER REGISTRATION
The New American Majority* (NAM)is registered to vote at a lower rate
than the general population in every state in America. We refer
to the gap between these rates as the Voter Registration Need.
*Unmarried women, people of color, and young adults aged 18-34
TABLE FIELD REGISTRATION GOALS:
Reported Registrations: 3,521Gross Roll Change Registrations: 2,500
Net Registrations: 1,338Budget: $59,857
THE TABLE STRATEGY
Engage San Diego has identified 2 priority communities where their partners have the capacity to register members of the New
American Majority.
170,085NAM net registrations
are needed to close the county-wide gap
In San Diego, the county-wide voter registration gap is
12.1%
CITY HEIGHTS

41
VIRGINIA CIVIC ENGAGEMENT TABLETHE NEED FOR VOTER REGISTRATION
The New American Majority* (NAM)is registered to vote at a lower rate than the general population in every state in America. We refer to the gap between these rates as the Voter Registration Need.
*Unmarried women,people of color, and young adults aged 18-34
TABLE FIELD REGISTRATION GOALS:
Reported Registrations: 220,000Gross Roll Change Registrations: 156,200Net Registrations: 83,600Budget: $3,740,000
THE TABLE STRATEGY
The Virginia Civic Engagement Table has identified 15 priority counties where their partners have the capacity to register members of the New American Majority. The map shows the NAM registration gap by number and percentage in each priority county.
296,824 NAM net registrations are needed to close the statewide gap
In Virginia, the statewide voter registration gap is
8.5%
ALEXANDRIA 5.9%3,969
ARLINGTON 6.1%6,420
CHESTERFIELD 9.5%12,458
FAIRFAX 6.4%26,511
LOUDOUN 9.4%10,096
MONTGOMERY 12.9%6,129 HENRICO 5.3%
7,559
PRINCE WILLIAM 8.0%13,572
SPOTSYLVANIA 12.4%5,879
STAFFORD 12.1%6,184
VIRGINIA BEACH 12.0%24,683
CHESAPEAKE 9.0%9,366
NORFOLK 5.2%7,899
RICHMOND CITY 4.1%5,445
HAMPTON 1.6%1,260

42
WIN/WIN NETWORK (WASHINGTON) THE NEED FOR VOTER REGISTRATION
The New American Majority* (NAM)is registered to vote at a lower rate
than the general population in every state in America. We refer
to the gap between these rates as the Voter Registration Need.
*Unmarried women, people of color, and young adults aged 18-34
TABLE FIELD REGISTRATION GOALS:
Reported Registrations: 24,324Gross Roll Change Registrations: 17,270
Net Registrations: 9,243Budget: $143,508
THE TABLE STRATEGY
Win/Win Network has identified 3 priority counties where their
partners have the capacity to register members of the New American Majority. The map
shows the NAM registration gap by number and percentage in
each priority county.
368,476NAM net registrations
are needed to close the statewide gap
In Washington, the statewide voter
registration gap is
14.2%
KING 10.3%
PIERCE 16.1%
YAKIMA 13.5%
53,383
83,108
11,530

43
WISCONSIN VOICES
BROWN 10.3%
DANE 0%
EAU CLAIRE 5.9%
KENOSHA 5.6%
MILWAUKEE 2.2%
ONEIDA 0%
RACINE 6.7%
WAUKESHA 2.4%
WINNEBAGO 7.2%
2,436
0
9,013
4,556
0 2,689 10,104
4,863
3,486
THE NEED FOR VOTER REGISTRATION
The New American Majority* (NAM)is registered to vote at a lower rate
than the general population in every state in America. We refer
to the gap between these rates as the Voter Registration Need.
*Unmarried women, people of color, and young adults aged 18-34
TABLE FIELD REGISTRATION GOALS:
Reported Registrations: 30,000Gross Roll Change Registrations: 21,300
Net Registrations: 11,400Budget: $510,000
THE TABLE STRATEGY
Wisconsin Voices has identified 9 priority counties where their
partners have the capacity to register members of the New American Majority. The map
shows the NAM registration gap by number and percentage in
each priority county.
88,455 NAM net registrations
are needed to close the statewide gap
In Wisconsin, the statewide voter
registration gap is
4.3%
THANK YOUSpecial thanks to partners, table staff, and donors who participated in our two civic engagement retreats
and to those who contributed their time and other resources to the voter registration workgroups.
For additional information please contact:
Alexis Anderson-ReedSenior Director of National Programs
State [email protected]
State Voices is a national network of permanent, nonpartisan, state-based coalitions working year-round to create a more accessible, inclusive, and representative democracy by lifting the voices of the
New American Majority and building the strength of their leaders and organizations.
www.statevoices.org