
STATE REPORT UNITY Village Assessments and Returnee Monitoring · Report), published in 2008, an...
74
STATE REPORT UNITY Village Assessments and Returnee Monitoring Analytical Report, Maps and Statistical Tables 2009
-
Upload
nguyendien -
Category
Documents
-
view
219 -
download
0
Transcript of STATE REPORT UNITY Village Assessments and Returnee Monitoring · Report), published in 2008, an...
STATE REPORT UNITY
Village Assessments and Returnee Monitoring
Analytical Report, Maps and Statistical Tables
2009
2
Acknowledgements The International Organization for Migration (IOM) wishes to thank its partners: the Government of Southern Sudan (GoSS) and the Government of National Unity (GoNU), and particularly the Southern Sudan Relief and Rehabilitation Commission (SSRRC) for the hard work and the support in the implementation of this programme. IOM also wishes to thank the United Nations Mission in Sudan (UNMIS) Protection, Return, Reintegration and Recovery (RRR) for their cooperation and support. This project would not have been possible without the generous contributions and support of our donors. In this respect, IOM would like to offer its sincere appreciation to AusAID International Refugee Fund, the European Commission for Humanitarian Aid (ECHO), Government of Japan, the Office for Disaster Assistance of the United States Agency for Development (OFDA/USAID), the United Nations Common Humanitarian Fund (CHF), and UNDP (particularly the Threat and Risk Mapping Analysis project).
3
Table of contents Acknowledgements ...............................................................................................................................................2
Executive summary ...............................................................................................................................................5
PART I – Narrative Report.....................................................................................................................................6
A. Background – IOM village assessments in Unity.............................................................................................6
B. Methodology................................................................................................................................................8
C. Challenges ...................................................................................................................................................9
D. State report – Unity.....................................................................................................................................10
1. Boundaries.................................................................................................................................................10
2. Geography and road infrastructure ...............................................................................................................12
3. Population patterns and migration movements...............................................................................................14
3.1 Population patterns In Unity State............................................................................................................14
E. Assessment results ......................................................................................................................................17
1. Water coverage in assessed areas .................................................................................................................17
1.1. Availability and accessibility of water......................................................................................................17
1.2. Access to improved drinking water in area assessed ..................................................................................18
2. Education and school enrolment...................................................................................................................21
2.1. Coverage and type of education...............................................................................................................21
2.2. School enrolment and gender disaggregation ............................................................................................24
2.3. Construction type and equipment of schools .............................................................................................25
3. Health sector and HIV/AIDS awareness .......................................................................................................28
3.1. Coverage and accessibility of health facilities ...........................................................................................28
3.2. Structure and staffing of healthcare facilities.............................................................................................30
3.3. HIV/AIDS .............................................................................................................................................33
4. Income generation and food resources ..........................................................................................................34
4.1. Income generation activities in the area assessed.......................................................................................34
4.2. Food resources .......................................................................................................................................36
4.3. Food assistance ......................................................................................................................................37
5. Shelter and housing.....................................................................................................................................38
PART II – maps ..................................................................................................................................................39
PART III: statistical tables and form sample ..........................................................................................................60
Annexes .............................................................................................................................................................60
4
Scope of report This report presents a comprehensive overview of information gathered through IOM Sudan’s Village Assessment and Returnee Monitoring Programme in Unity State and seeks to highlight the reintegration challenges that returnees and resident communities face in the different counties in this State of high return. The following report presents the results of Village Assessments conducted in Unity State between May and June 2009. A total of 1,785 villages were assessed, representing 100% of all existing villages in Unity State. The population in the areas is 473,993 residents (76%), 122,421 (19%) returnees and 31,387 IDPs (5%). All of IOM’s programmes in Sudan are aimed at promoting the safe, dignified and sustainable return and reintegration of those who were uprooted by the civil war in Sudan. The war lasted for 21 years and led to the displacement of more than 4 million individuals from or within Southern Sudan, a region dominated by poverty and scarcity. Within Sudan, IOM is most closely associated with the joint Sudanese government, UN and IOM IDP (internally displaced people) return programme. Through this programme, IOM has helped more than 112,000 IDPs return to their homes in Southern Sudan. In addition, IOM has supported the return of Sudanese migrants who have been stranded abroad, the return of highly qualified migrants from the Diaspora (and IDP settlements in Khartoum) and, in coordination with UNHCR, the repatriation of Sudanese refugees. In total, within the last four years, IOM has assisted in the return of more 160,000 individuals to different parts of Sudan. According to IOM’s Total Returns to South Sudan Post-CPA (Comprehensive Peace Agreement Report), published in 2008, an estimated 113,148 returnees have returned to Unity State1. 67% of the returnees to Unity returned from Khartoum, while 18% returned to the State from outside Sudan. The main return destinations within Unity are the counties of Rubkona (27%) and Mayom (15%). Within this context, the IOM Village Assessment Programme (along with the Tracking of Spontaneous Returns Programme) represents a key commitment from IOM to extend support to this enormous number of spontaneous returns. The report is comprised of 3 parts:
• PART I: Data Analysis and Key Findings • PART II: Maps Showing Key Data • PART III: Statistical Tables and Form Samples.
The full Village Assessment Dataset is published in CD format only. The Dataset provides the completed forms for all the villages assessed which can be accessed through ‘clickable’ maps at the State, County and Payam levels.
1 IOM Total Returns to South Sudan Post-CPA to June 2008. The IOM-SSRRC Tracking of Spontaneous Return Programme had captured 60,051 spontaneous returnees at their areas of return in Unity State by June 2009 (see IOM Tracking of Spontaneous Return Report, June 2009).
5
Executive summary The following report presents the results of Village Assessments conducted in Unity State between May and June 2009. A total of 1,785 villages were assessed, representing 100% of all existing villages in Unity State. The population in the areas is 473,993 residents (76%), 122,421 (19%) returnees and 31,387 IDPs (5%). Insufficient access to water, and particularly improved drinking water, was highlighted by the majority of the villages in Unity as the major concern. In Unity, an average of 1,053 people share a single improved water source. Hand pumps have been established in only 27% of the villages assessed. 31% of these existing hand pumps – a total of 209 – were found to be not working during the assessment period. In 42% of the villages assessed, it was found that villagers are using river water as their main source of water. Lack of access to health care was rated as the second major concern. Only 18% of the villages assessed have healthcare facilities, and most of these are mobile clinics (63%). Logistical constraints, such as inaccessible roads, lack of public transport, or lack of financial means, hinder access to health care for the majority of the remaining villages. Of those villages which had healthcare facilities, the majority lacked highly qualified personnel. Of all the health facilities assessed, 45% of health staff are mid wives/traditional birth attendants, 23% are community health workers and 13% are nurses. Only 15% of the health facilities had medical assistants and only 3% had a medical doctor. Levels of HIV/AIDS awareness in Unity State are of particular concern: only 23% of participants in the focus group discussions reported having any knowledge about HIV/AIDS. Education is another major concern in Unity State. Only 19% of the villages assessed have an education facility. 90% of existing education facilities are basic primary schools, 5% are secondary schools and 4% provide only adult literacy classes. The structures of school buildings themselves are generally very basic: 32% are outdoor facilities (under trees); 55% are of non permanent structure; and only 13% are permanent structures. Only 35% of enrolled students are girls. Agro-pastoralism is cited as the main source of income for 68% of the population in Unity, with farming and livestock rearing as main activities. 16% reported supplementing this with fishing and 14% with collecting wood. The main sources of food were the products of the abovementioned activities supplemented with purchasing additional food at markets. The food basket was also supplemented with support from relatives.
6
PART I – NARRATIVE REPORT
A. Background – IOM village assessments in Unity IOM began the Village Assessment Programme in villages of high return in Unity State in 2007. By the end of 2008, 62 villages of high return had been assessed. By June 2009, this figure had increased to 1,785 villages. Initially, the Village Assessment programme was intended to direct IOM’s own reintegration projects in the state, but as the programme has expanded, so too have the objectives of the programme along with the degree of GoSS partnership. Latterly, the programme has come to represent one of the GoSS’s commitments to large-scale remigration planning and coordination. The objectives of the Village Assessment Programme are:
• To provide the Sudanese State Authorities the basis on which to provide reintegration planning and coordination on return reintegration activities;
• To provide a mapping of the status of basic infra-structure and services in the selected States in order to support general recovery and development planning and coordination, for Sudanese authorities, NGOs, and UN bodies;
• To establish databases of the conditions of basic infra-structure and services in each village in the selected States to provide a technical basis for the planning of humanitarian, early recovery and development interventions.
The Village Assessment Program seeks to achieve these objectives through the following activities:
• Collection of data concerning, and mapping of, population patterns and basic infrastructure at village level within six sectors (water, education, health, shelter, food and security);
• Identification of reintegration needs and protection concerns in the assessed villages; • Sharing of information in various forums/formats in order to incorporate the collected
baseline data into reintegration planning; • Build the capacity of the government to collect, monitor and manage baseline data and
reintegration planning. Village Assessments are undertaken through direct field visits, utilizing a standardized assessment tool. In 2009, the program also included capacity building for SSRRC, IOM’s governmental counterpart in Southern Sudan, to collect and manage data. All Village Assessments were conducted by SSRRC enumerators in 2009. The enumerators gathered professional experience in baseline data collection during their work and 78 SSRRC enumerators received further theoretical and technical training from IOM, combined with on-the-job training.. During the reporting period, IOM assessed 1,785 villages in Unity State. The distribution of villages within each County is shown in the table below:
7
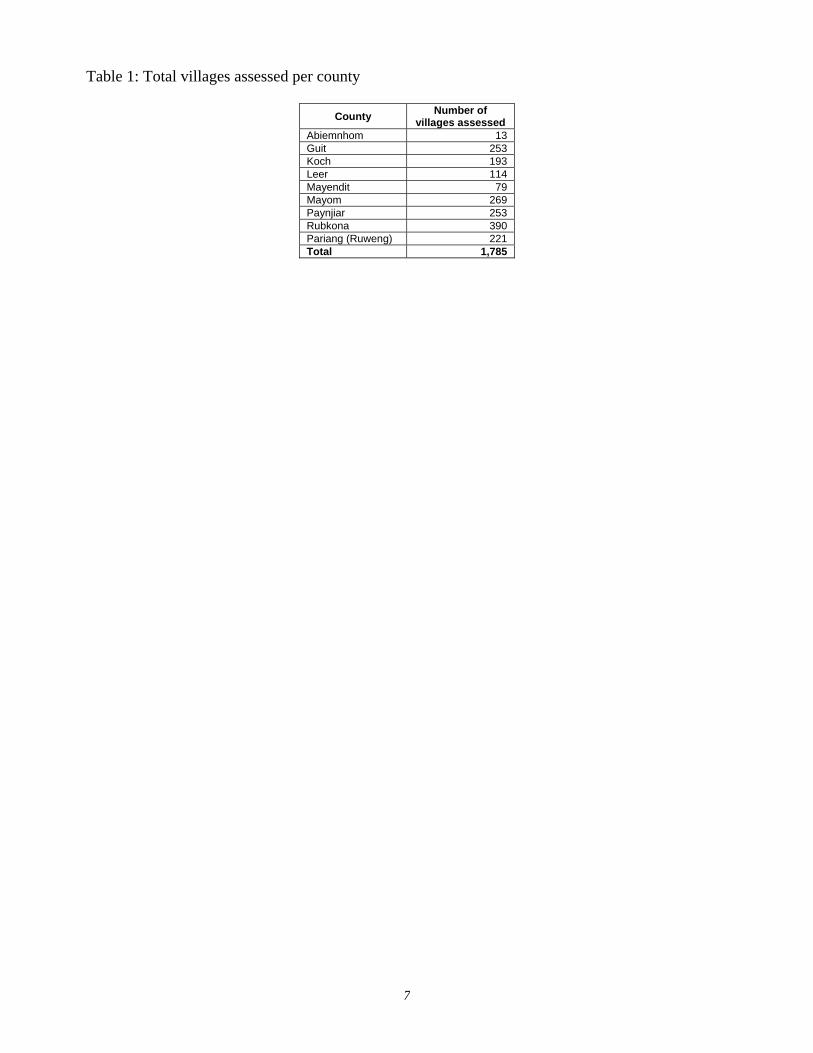
Table 1: Total villages assessed per county
County Number of villages assessed
Abiemnhom 13 Guit 253 Koch 193 Leer 114 Mayendit 79 Mayom 269 Paynjiar 253 Rubkona 390 Pariang (Ruweng) 221 Total 1,785
8
B. Methodology To implement this programme, IOM developed Sudan-specific questionnaires to gather information on the availability and accessibility of basic infrastructure in areas of high return. The questionnaire was designed for village-level assessments and includes questions on population and tribal composition of villages, the availability of shelter and food, and livelihood opportunities, as well as information on water and sanitation, health, education and other issues related to protection and reintegration (For copies of the questionnaires see Annexes 13 and 14). The Village Assessments were conducted by 87 SSRRC enumerators (trained and supported by IOM). Training sessions were developed for the SSRRC enumerators for the Village Assessment Program and included modules in:
• management and implementation of baseline surveys; • human rights and principles of internal displacement; • methodology and logic of the Village Assessment form; and • use of GPS, and other, technical devices (Nokia remote-database access equipment)
Each County was assessed by SSRRC enumerators who had been based in the area. IOM assisted in the preparation and resource management of the assessments and provided necessary logistical and financial support. Working together, IOM and SSRRC developed an operational plan for the program. The methodology use for data collection combined Focus Group Discussions with different social groups (i.e. government representatives, local leader, residents and returnee representatives, women and youths), individual interviews, and visual assessments which involved team members surveying available facilities with key informants and recoding this using GPS. Village Assessment forms were processed in the Joint Operation Center in Juba and Khartoum and consolidated in a centralized IOM database. Verification and quality control was carried out at village level, data entry level and centralized IOM Juba and Khartoum levels. Forms with suspected unreliable information were placed ‘on hold’ and referred to verification teams who would revisit the concerned villages.
9
C. Challenges The main challenge to this Village Assessment was that the total number of villages was unknown at the beginning of the assessment process - making planning difficult. Data provided by the Fifth Sudan Population Census was used for basic planning purposes, but the fluid nature of many of the population movements within Southern Sudan, and the somewhat interpretive nature of determining what constitutes a ‘village’, ‘sub village’ or ‘village cluster’ entailed that the programme needed to supplement the census data in some areas. Accessibility of villages due to swamps, poor road conditions, mapped but non-existent roads was a further challenge in all areas, with exception of Koch and Abiemnom Counties. Part of Unity State is located at the eastern side of the White Nile and the only means of transport across the river are local boats. Except for Pariang and Koch counties, which have better road accessibility, access to around 75% of the villages was only possible via foot paths. Establishing reliable population figures was among the challenging aspects of the assessment process. IOM and the SSRRC did its utmost to verify the numbers of returnees and residents within villages, but it was clear that on some occasions the population data provided during the assessment was unrealistic and inflated. Ultimately the population figures collected through the IOM/SSRRC village assessments significantly exceeded the data of the 2008 Population and Housing Census, published in June 2009. Various factors may contribute to this difference. The census figures, for example, do not include the number of returnees following the date of the census in May 2008. The greatest factor leading to a difference in figures is, however, likely due to interlocutors providing inflated population figures in the expectation that higher population figures would lead to greater levels of assistance. In light of these concerns, and given that the IOM-conducted verification missions were able in general able to support census figures, the total population figures provided in this report are based on the data from the fifth census. Within these totals however, the relative numbers of ‘types’ of population (e.g. returnee, IDP, resident etc) are based on the percentage of these population types established by the village assessment process.
10
D. State report – Unity
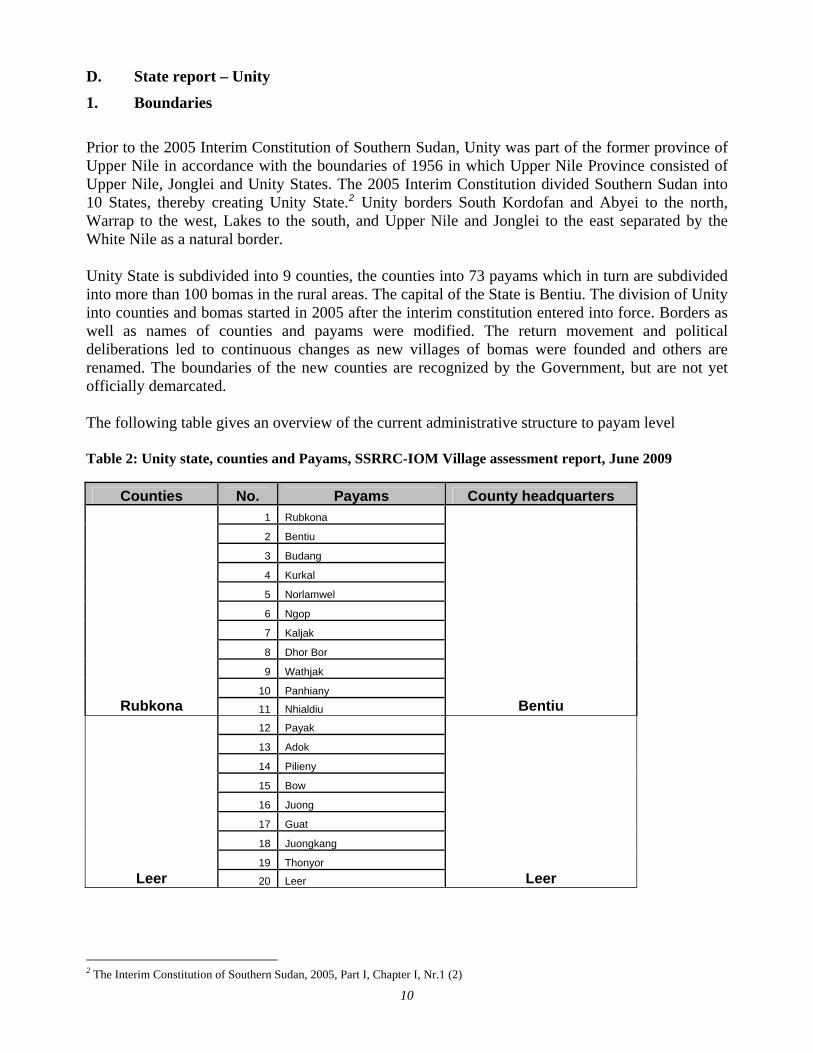
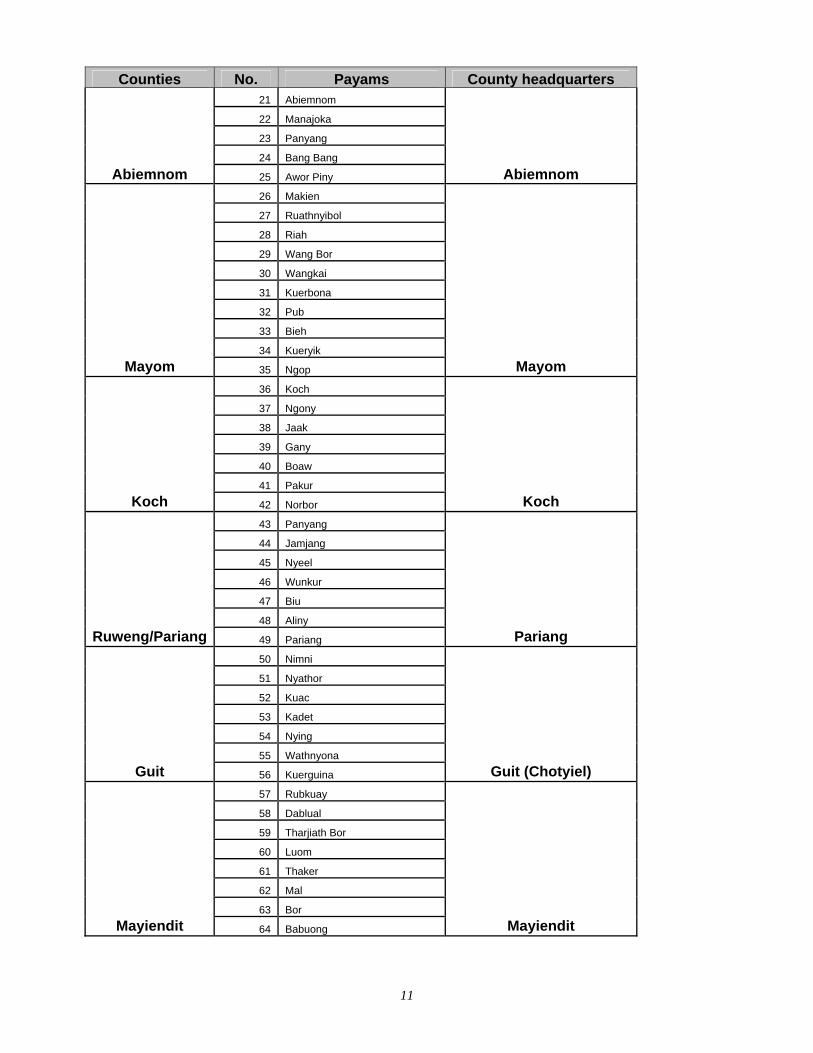
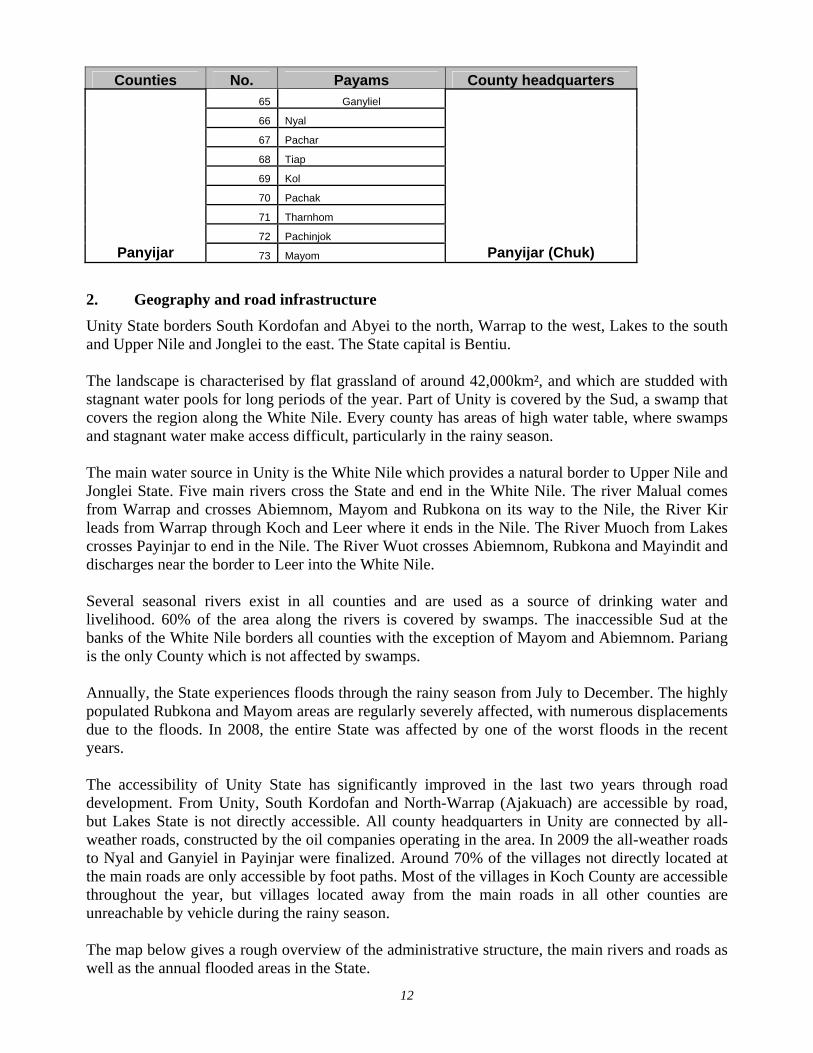
1. Boundaries Prior to the 2005 Interim Constitution of Southern Sudan, Unity was part of the former province of Upper Nile in accordance with the boundaries of 1956 in which Upper Nile Province consisted of Upper Nile, Jonglei and Unity States. The 2005 Interim Constitution divided Southern Sudan into 10 States, thereby creating Unity State.2 Unity borders South Kordofan and Abyei to the north, Warrap to the west, Lakes to the south, and Upper Nile and Jonglei to the east separated by the White Nile as a natural border. Unity State is subdivided into 9 counties, the counties into 73 payams which in turn are subdivided into more than 100 bomas in the rural areas. The capital of the State is Bentiu. The division of Unity into counties and bomas started in 2005 after the interim constitution entered into force. Borders as well as names of counties and payams were modified. The return movement and political deliberations led to continuous changes as new villages of bomas were founded and others are renamed. The boundaries of the new counties are recognized by the Government, but are not yet officially demarcated. The following table gives an overview of the current administrative structure to payam level Table 2: Unity state, counties and Payams, SSRRC-IOM Village assessment report, June 2009
Counties No. Payams County headquarters 1 Rubkona
2 Bentiu
3 Budang
4 Kurkal
5 Norlamwel
6 Ngop
7 Kaljak
8 Dhor Bor
9 Wathjak
10 Panhiany Rubkona 11 Nhialdiu Bentiu
12 Payak
13 Adok
14 Pilieny
15 Bow
16 Juong
17 Guat
18 Juongkang
19 Thonyor Leer 20 Leer Leer
2 The Interim Constitution of Southern Sudan, 2005, Part I, Chapter I, Nr.1 (2)
11
Counties No. Payams County headquarters 21 Abiemnom
22 Manajoka
23 Panyang
24 Bang Bang
Abiemnom 25 Awor Piny Abiemnom 26 Makien
27 Ruathnyibol
28 Riah
29 Wang Bor
30 Wangkai
31 Kuerbona
32 Pub
33 Bieh
34 Kueryik Mayom 35 Ngop Mayom
36 Koch
37 Ngony
38 Jaak
39 Gany
40 Boaw
41 Pakur Koch 42 Norbor Koch
43 Panyang
44 Jamjang
45 Nyeel
46 Wunkur
47 Biu
48 Aliny Ruweng/Pariang 49 Pariang Pariang
50 Nimni
51 Nyathor
52 Kuac
53 Kadet
54 Nying
55 Wathnyona Guit 56 Kuerguina Guit (Chotyiel)
57 Rubkuay
58 Dablual
59 Tharjiath Bor
60 Luom
61 Thaker
62 Mal
63 Bor Mayiendit 64 Babuong Mayiendit
12
Counties No. Payams County headquarters 65 Ganyliel
66 Nyal
67 Pachar
68 Tiap
69 Kol
70 Pachak
71 Tharnhom
72 Pachinjok Panyijar 73 Mayom Panyijar (Chuk)
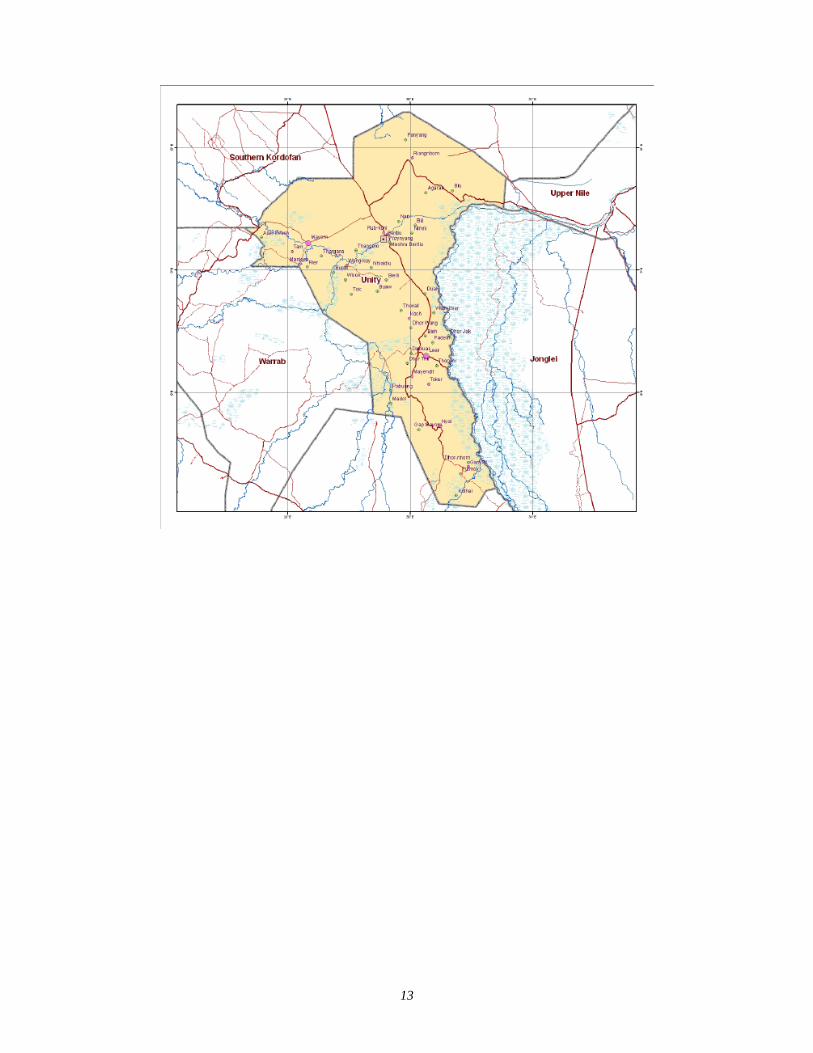
2. Geography and road infrastructure Unity State borders South Kordofan and Abyei to the north, Warrap to the west, Lakes to the south and Upper Nile and Jonglei to the east. The State capital is Bentiu. The landscape is characterised by flat grassland of around 42,000km², and which are studded with stagnant water pools for long periods of the year. Part of Unity is covered by the Sud, a swamp that covers the region along the White Nile. Every county has areas of high water table, where swamps and stagnant water make access difficult, particularly in the rainy season. The main water source in Unity is the White Nile which provides a natural border to Upper Nile and Jonglei State. Five main rivers cross the State and end in the White Nile. The river Malual comes from Warrap and crosses Abiemnom, Mayom and Rubkona on its way to the Nile, the River Kir leads from Warrap through Koch and Leer where it ends in the Nile. The River Muoch from Lakes crosses Payinjar to end in the Nile. The River Wuot crosses Abiemnom, Rubkona and Mayindit and discharges near the border to Leer into the White Nile. Several seasonal rivers exist in all counties and are used as a source of drinking water and livelihood. 60% of the area along the rivers is covered by swamps. The inaccessible Sud at the banks of the White Nile borders all counties with the exception of Mayom and Abiemnom. Pariang is the only County which is not affected by swamps. Annually, the State experiences floods through the rainy season from July to December. The highly populated Rubkona and Mayom areas are regularly severely affected, with numerous displacements due to the floods. In 2008, the entire State was affected by one of the worst floods in the recent years. The accessibility of Unity State has significantly improved in the last two years through road development. From Unity, South Kordofan and North-Warrap (Ajakuach) are accessible by road, but Lakes State is not directly accessible. All county headquarters in Unity are connected by all-weather roads, constructed by the oil companies operating in the area. In 2009 the all-weather roads to Nyal and Ganyiel in Payinjar were finalized. Around 70% of the villages not directly located at the main roads are only accessible by foot paths. Most of the villages in Koch County are accessible throughout the year, but villages located away from the main roads in all other counties are unreachable by vehicle during the rainy season. The map below gives a rough overview of the administrative structure, the main rivers and roads as well as the annual flooded areas in the State.
13
14
3. Population patterns and migration movements
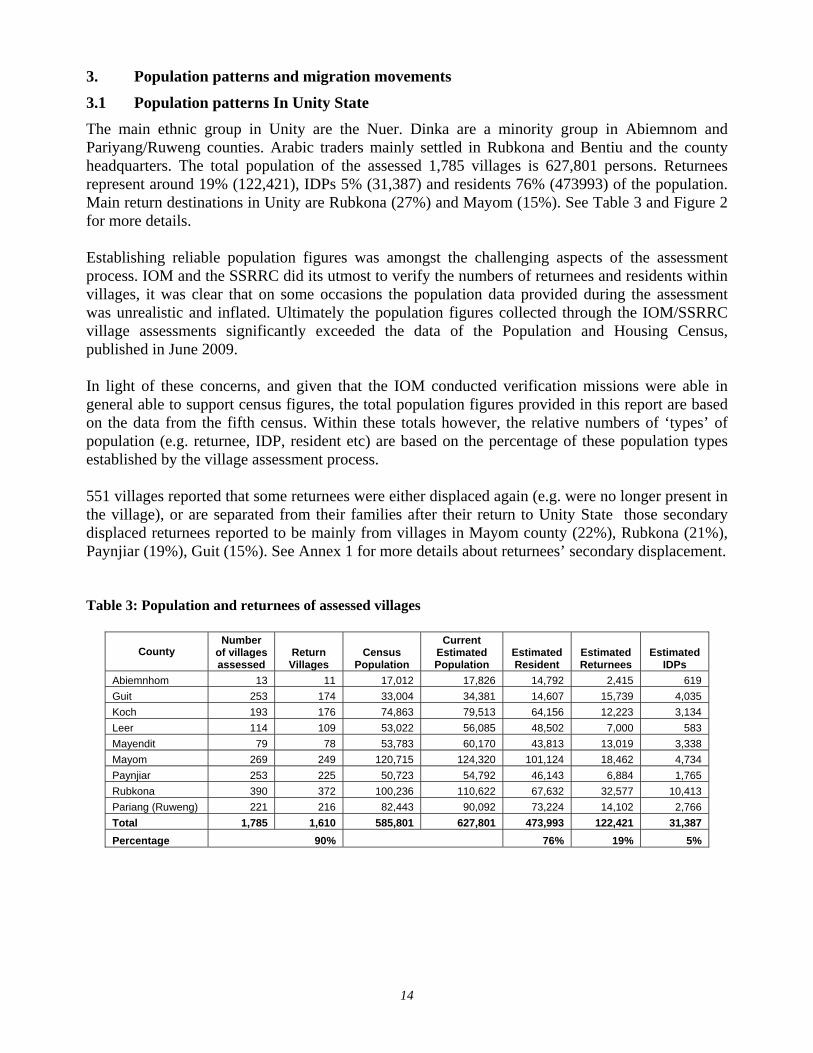
3.1 Population patterns In Unity State The main ethnic group in Unity are the Nuer. Dinka are a minority group in Abiemnom and Pariyang/Ruweng counties. Arabic traders mainly settled in Rubkona and Bentiu and the county headquarters. The total population of the assessed 1,785 villages is 627,801 persons. Returnees represent around 19% (122,421), IDPs 5% (31,387) and residents 76% (473993) of the population. Main return destinations in Unity are Rubkona (27%) and Mayom (15%). See Table 3 and Figure 2 for more details. Establishing reliable population figures was amongst the challenging aspects of the assessment process. IOM and the SSRRC did its utmost to verify the numbers of returnees and residents within villages, it was clear that on some occasions the population data provided during the assessment was unrealistic and inflated. Ultimately the population figures collected through the IOM/SSRRC village assessments significantly exceeded the data of the Population and Housing Census, published in June 2009. In light of these concerns, and given that the IOM conducted verification missions were able in general able to support census figures, the total population figures provided in this report are based on the data from the fifth census. Within these totals however, the relative numbers of ‘types’ of population (e.g. returnee, IDP, resident etc) are based on the percentage of these population types established by the village assessment process. 551 villages reported that some returnees were either displaced again (e.g. were no longer present in the village), or are separated from their families after their return to Unity State those secondary displaced returnees reported to be mainly from villages in Mayom county (22%), Rubkona (21%), Paynjiar (19%), Guit (15%). See Annex 1 for more details about returnees’ secondary displacement. Table 3: Population and returnees of assessed villages
County Number
of villages assessed
Return Villages
Census Population
Current Estimated Population
Estimated Resident
Estimated Returnees
Estimated IDPs
Abiemnhom 13 11 17,012 17,826 14,792 2,415 619 Guit 253 174 33,004 34,381 14,607 15,739 4,035 Koch 193 176 74,863 79,513 64,156 12,223 3,134 Leer 114 109 53,022 56,085 48,502 7,000 583 Mayendit 79 78 53,783 60,170 43,813 13,019 3,338 Mayom 269 249 120,715 124,320 101,124 18,462 4,734 Paynjiar 253 225 50,723 54,792 46,143 6,884 1,765 Rubkona 390 372 100,236 110,622 67,632 32,577 10,413 Pariang (Ruweng) 221 216 82,443 90,092 73,224 14,102 2,766 Total 1,785 1,610 585,801 627,801 473,993 122,421 31,387 Percentage 90% 76% 19% 5%
15
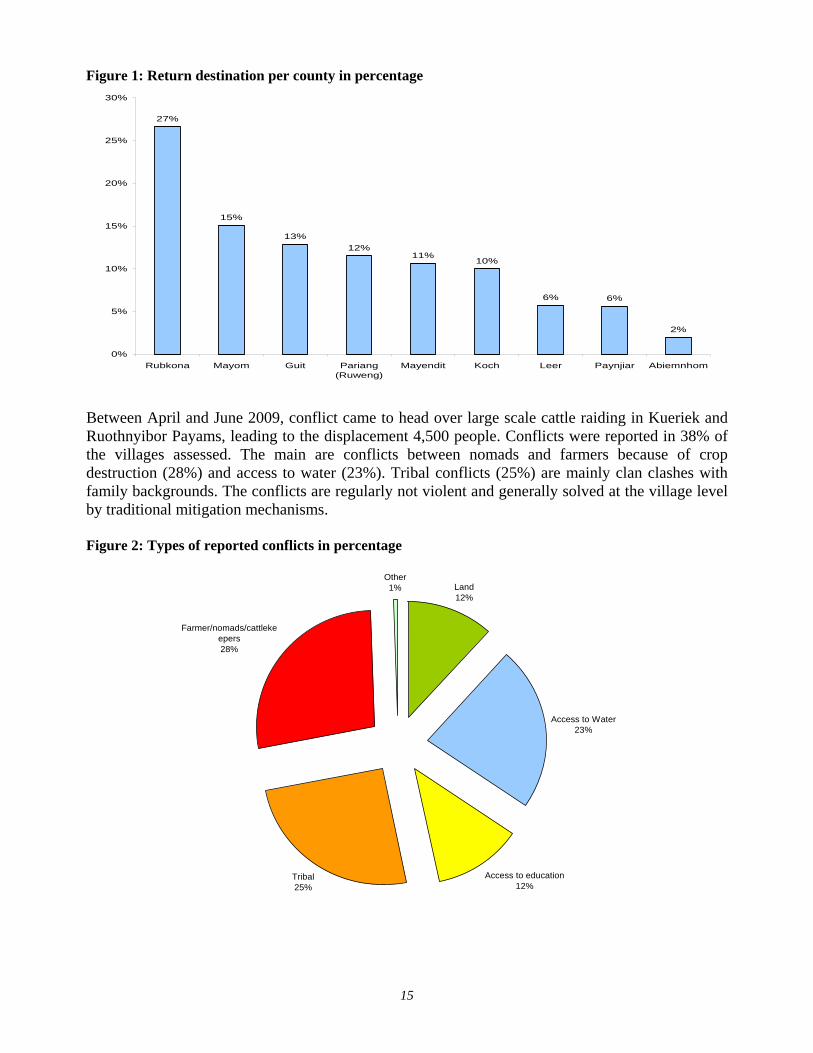
Figure 1: Return destination per county in percentage
27%
15%
13%12%
11%10%
6% 6%
2%
0%
5%
10%
15%
20%
25%
30%
Rubkona Mayom Guit Pariang(Ruweng)
Mayendit Koch Leer Paynjiar Abiemnhom
Between April and June 2009, conflict came to head over large scale cattle raiding in Kueriek and Ruothnyibor Payams, leading to the displacement 4,500 people. Conflicts were reported in 38% of the villages assessed. The main are conflicts between nomads and farmers because of crop destruction (28%) and access to water (23%). Tribal conflicts (25%) are mainly clan clashes with family backgrounds. The conflicts are regularly not violent and generally solved at the village level by traditional mitigation mechanisms. Figure 2: Types of reported conflicts in percentage
Land12%
Access to Water23%
Access to education12%
Tribal25%
Farmer/nomads/cattlekeepers28%
Other1%
16
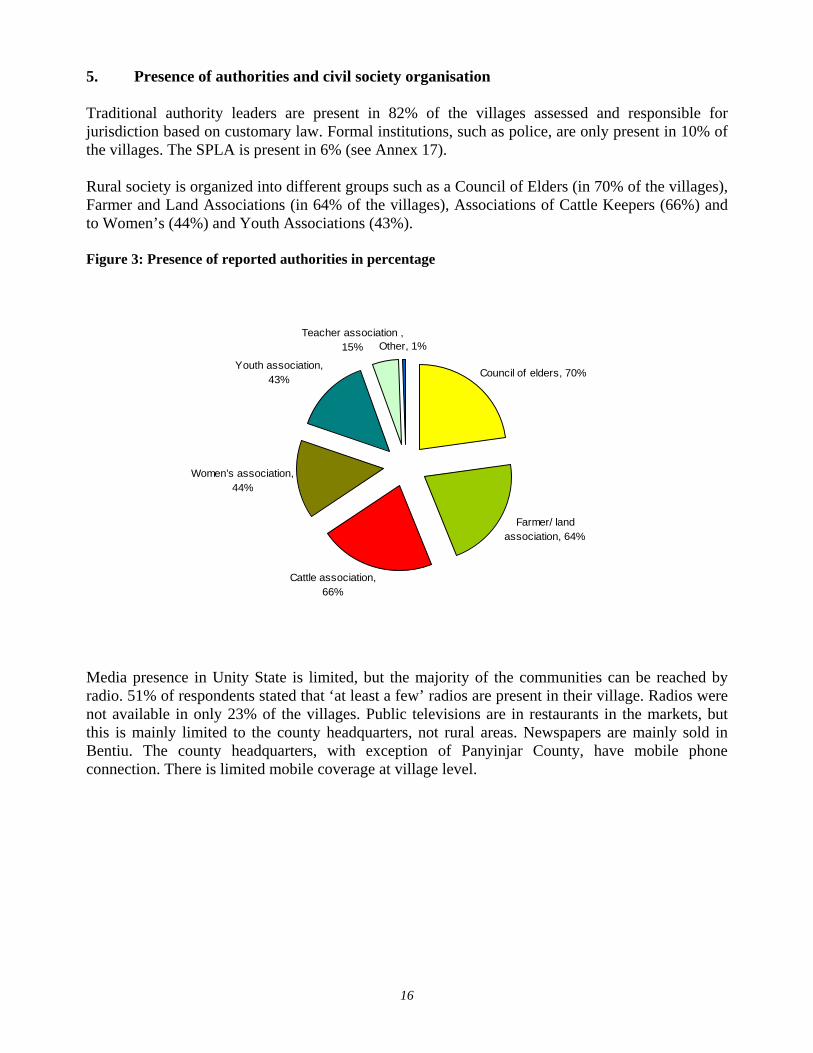
5. Presence of authorities and civil society organisation Traditional authority leaders are present in 82% of the villages assessed and responsible for jurisdiction based on customary law. Formal institutions, such as police, are only present in 10% of the villages. The SPLA is present in 6% (see Annex 17). Rural society is organized into different groups such as a Council of Elders (in 70% of the villages), Farmer and Land Associations (in 64% of the villages), Associations of Cattle Keepers (66%) and to Women’s (44%) and Youth Associations (43%). Figure 3: Presence of reported authorities in percentage
Council of elders, 70%
Farmer/ land association, 64%
Cattle association, 66%
Women’s association, 44%
Youth association, 43%
Teacher association , 15% Other, 1%
Media presence in Unity State is limited, but the majority of the communities can be reached by radio. 51% of respondents stated that ‘at least a few’ radios are present in their village. Radios were not available in only 23% of the villages. Public televisions are in restaurants in the markets, but this is mainly limited to the county headquarters, not rural areas. Newspapers are mainly sold in Bentiu. The county headquarters, with exception of Panyinjar County, have mobile phone connection. There is limited mobile coverage at village level.
17
E. Assessment results 1. Water coverage in assessed areas
1.1. Availability and accessibility of water
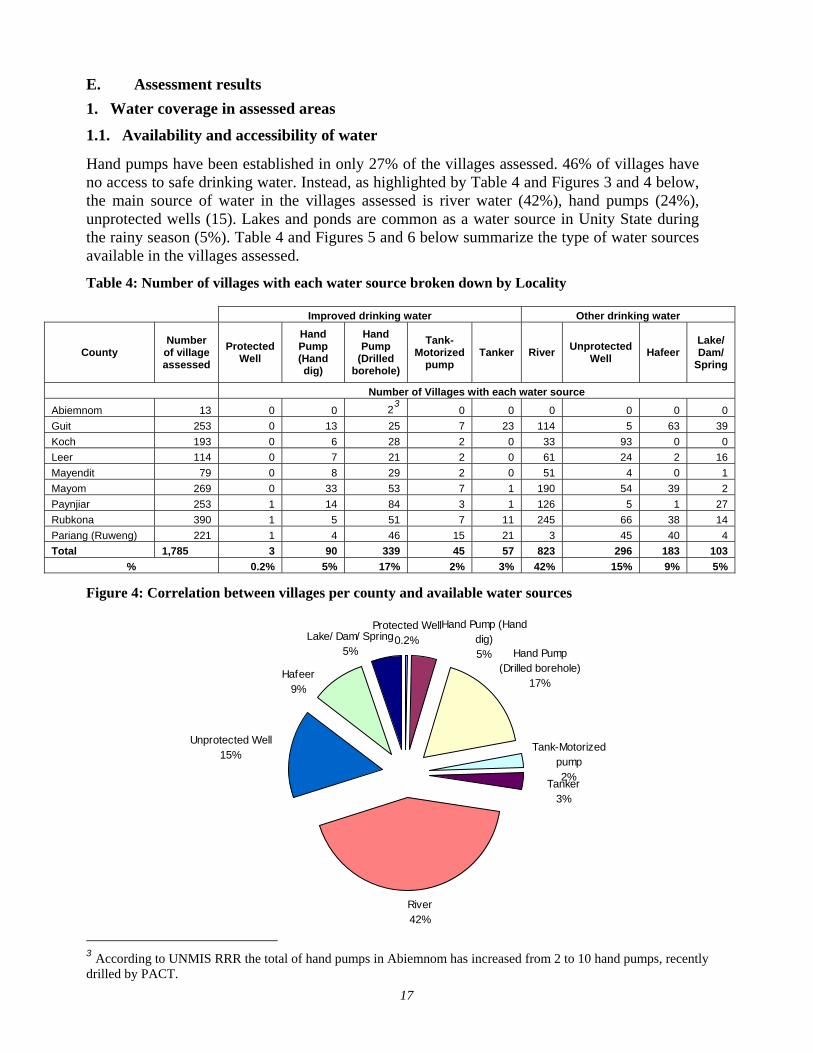
Hand pumps have been established in only 27% of the villages assessed. 46% of villages have no access to safe drinking water. Instead, as highlighted by Table 4 and Figures 3 and 4 below, the main source of water in the villages assessed is river water (42%), hand pumps (24%), unprotected wells (15). Lakes and ponds are common as a water source in Unity State during the rainy season (5%). Table 4 and Figures 5 and 6 below summarize the type of water sources available in the villages assessed.
Table 4: Number of villages with each water source broken down by Locality
Improved drinking water Other drinking water
County Number of village assessed
Protected Well
Hand Pump (Hand dig)
Hand Pump
(Drilled borehole)
Tank-Motorized
pump Tanker River Unprotected
Well Hafeer Lake/ Dam/
Spring
Number of Villages with each water source
Abiemnom 13 0 0 23 0 0 0 0 0 0 Guit 253 0 13 25 7 23 114 5 63 39 Koch 193 0 6 28 2 0 33 93 0 0 Leer 114 0 7 21 2 0 61 24 2 16 Mayendit 79 0 8 29 2 0 51 4 0 1 Mayom 269 0 33 53 7 1 190 54 39 2 Paynjiar 253 1 14 84 3 1 126 5 1 27 Rubkona 390 1 5 51 7 11 245 66 38 14 Pariang (Ruweng) 221 1 4 46 15 21 3 45 40 4 Total 1,785 3 90 339 45 57 823 296 183 103
% 0.2% 5% 17% 2% 3% 42% 15% 9% 5%
Figure 4: Correlation between villages per county and available water sources
Protected Well0.2%
Hand Pump (Drilled borehole)
17%
River42%
Hafeer9%
Unprotected Well15%
Tanker3%
Tank-Motorized pump2%
Lake/ Dam/ Spring5%
Hand Pump (Hand dig)5%
3 According to UNMIS RRR the total of hand pumps in Abiemnom has increased from 2 to 10 hand pumps, recently drilled by PACT.
18
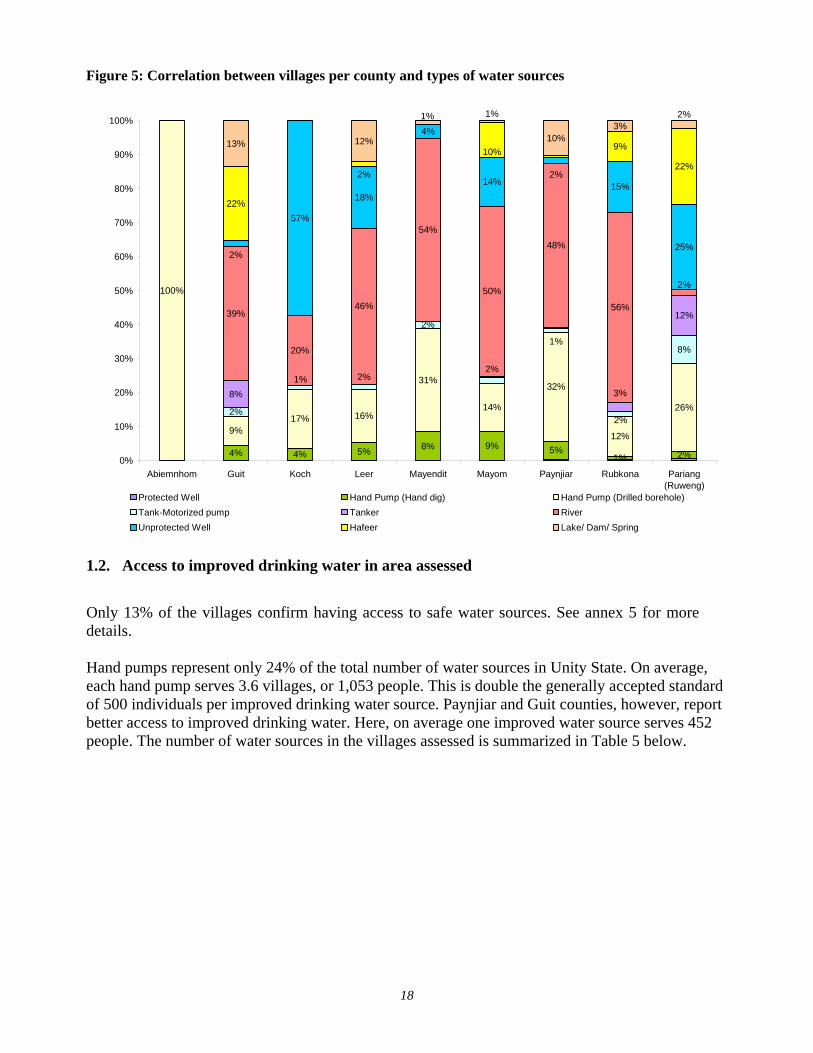
Figure 5: Correlation between villages per county and types of water sources
4% 4% 5% 8% 9% 5%1% 2%
100%
9%17% 16%
31%
14%
32%
12%
26%2%
2%
8%
8%
12%39%
20%
46%
54%
50%
48%
56%
57%
18%
4%
14% 15%
25%
22%
9%
22%
13% 12% 10%3%
2%
1%
2%2%1%
3%
2%
2%
2%2%
10%
2%1% 1%
0%
10%
20%
30%
40%
50%
60%
70%
80%
90%
100%
Abiemnhom Guit Koch Leer Mayendit Mayom Paynjiar Rubkona Pariang(Ruweng)
Protected Well Hand Pump (Hand dig) Hand Pump (Drilled borehole)Tank-Motorized pump Tanker RiverUnprotected Well Hafeer Lake/ Dam/ Spring
1.2. Access to improved drinking water in area assessed
Only 13% of the villages confirm having access to safe water sources. See annex 5 for more details. Hand pumps represent only 24% of the total number of water sources in Unity State. On average, each hand pump serves 3.6 villages, or 1,053 people. This is double the generally accepted standard of 500 individuals per improved drinking water source. Paynjiar and Guit counties, however, report better access to improved drinking water. Here, on average one improved water source serves 452 people. The number of water sources in the villages assessed is summarized in Table 5 below.
19
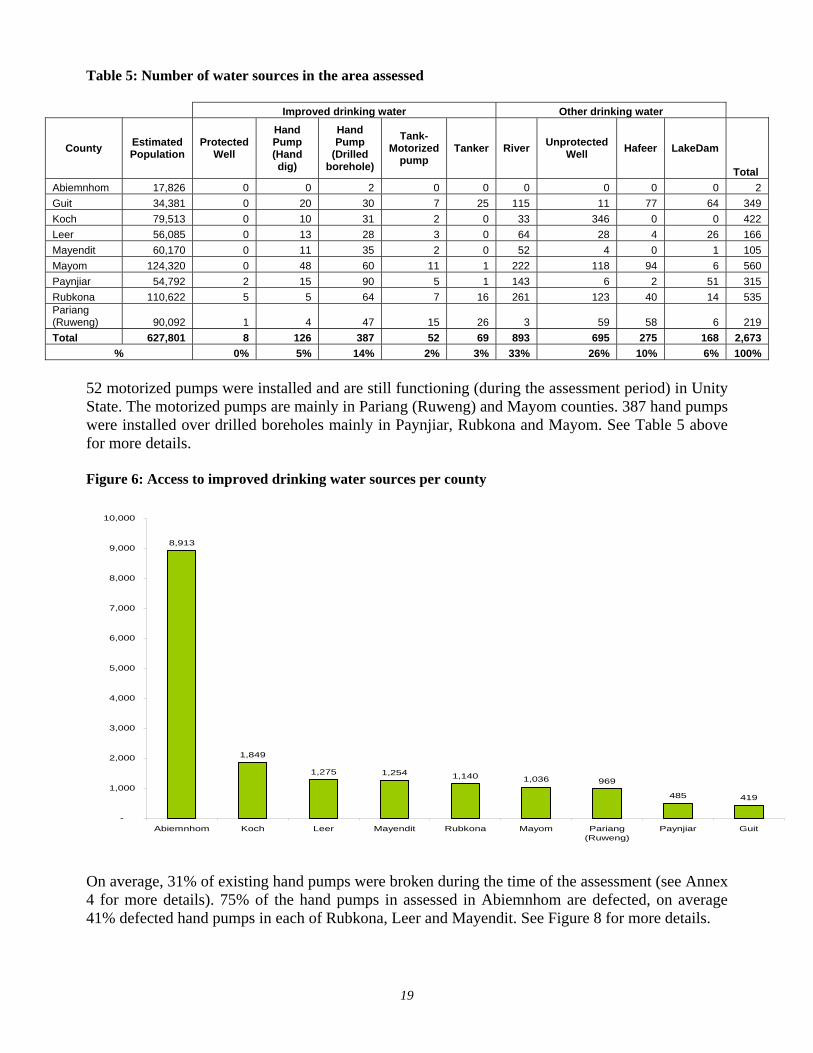
Table 5: Number of water sources in the area assessed
Improved drinking water Other drinking water
County Estimated Population
Protected Well
Hand Pump (Hand dig)
Hand Pump
(Drilled borehole)
Tank-Motorized
pump Tanker River Unprotected
Well Hafeer LakeDam
Total Abiemnhom 17,826 0 0 2 0 0 0 0 0 0 2 Guit 34,381 0 20 30 7 25 115 11 77 64 349 Koch 79,513 0 10 31 2 0 33 346 0 0 422 Leer 56,085 0 13 28 3 0 64 28 4 26 166 Mayendit 60,170 0 11 35 2 0 52 4 0 1 105 Mayom 124,320 0 48 60 11 1 222 118 94 6 560 Paynjiar 54,792 2 15 90 5 1 143 6 2 51 315 Rubkona 110,622 5 5 64 7 16 261 123 40 14 535 Pariang (Ruweng) 90,092 1 4 47 15 26 3 59 58 6 219 Total 627,801 8 126 387 52 69 893 695 275 168 2,673
% 0% 5% 14% 2% 3% 33% 26% 10% 6% 100% 52 motorized pumps were installed and are still functioning (during the assessment period) in Unity State. The motorized pumps are mainly in Pariang (Ruweng) and Mayom counties. 387 hand pumps were installed over drilled boreholes mainly in Paynjiar, Rubkona and Mayom. See Table 5 above for more details. Figure 6: Access to improved drinking water sources per county
8,913
1,849
1,275 1,254 1,140 1,036 969
485 419
-
1,000
2,000
3,000
4,000
5,000
6,000
7,000
8,000
9,000
10,000
Abiemnhom Koch Leer Mayendit Rubkona Mayom Pariang(Ruweng)
Paynjiar Guit
On average, 31% of existing hand pumps were broken during the time of the assessment (see Annex 4 for more details). 75% of the hand pumps in assessed in Abiemnhom are defected, on average 41% defected hand pumps in each of Rubkona, Leer and Mayendit. See Figure 8 for more details.
20
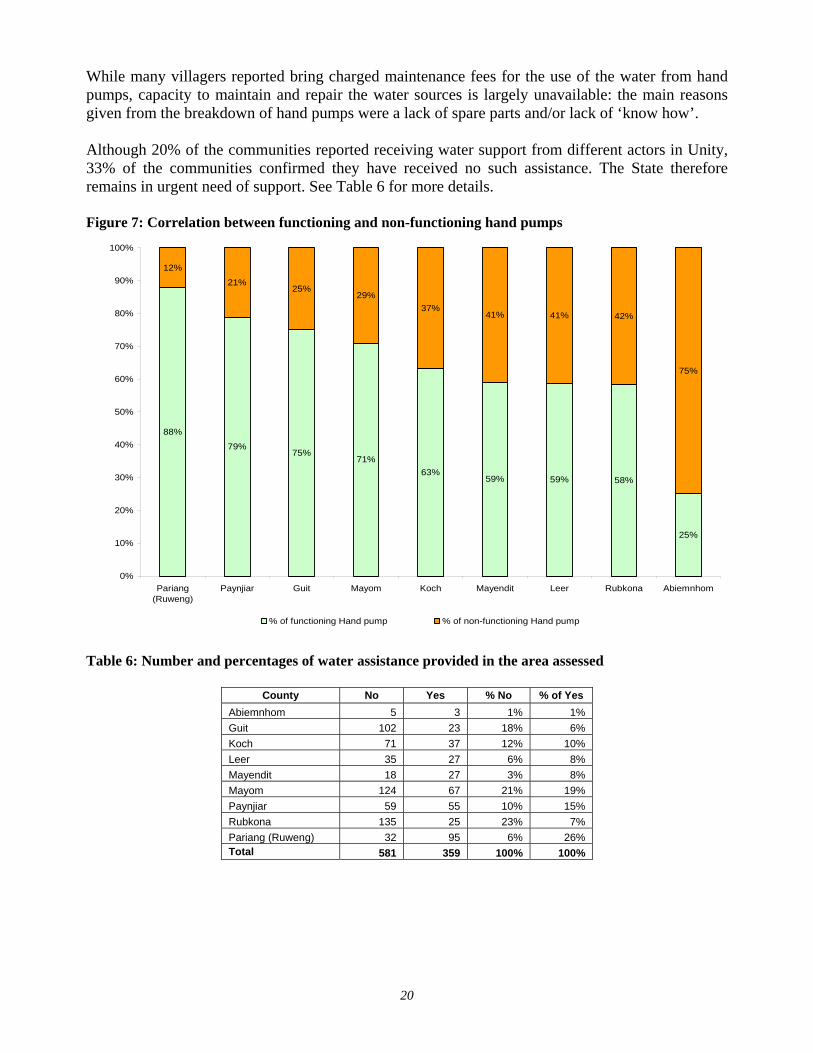
While many villagers reported bring charged maintenance fees for the use of the water from hand pumps, capacity to maintain and repair the water sources is largely unavailable: the main reasons given from the breakdown of hand pumps were a lack of spare parts and/or lack of ‘know how’. Although 20% of the communities reported receiving water support from different actors in Unity, 33% of the communities confirmed they have received no such assistance. The State therefore remains in urgent need of support. See Table 6 for more details. Figure 7: Correlation between functioning and non-functioning hand pumps
88%
79%75%
71%63%
59% 59% 58%
25%
12%
21%25%
29%37%
41% 41% 42%
75%
0%
10%
20%
30%
40%
50%
60%
70%
80%
90%
100%
Pariang(Ruweng)
Paynjiar Guit Mayom Koch Mayendit Leer Rubkona Abiemnhom
% of functioning Hand pump % of non-functioning Hand pump
Table 6: Number and percentages of water assistance provided in the area assessed
County No Yes % No % of Yes Abiemnhom 5 3 1% 1% Guit 102 23 18% 6% Koch 71 37 12% 10% Leer 35 27 6% 8% Mayendit 18 27 3% 8% Mayom 124 67 21% 19% Paynjiar 59 55 10% 15% Rubkona 135 25 23% 7% Pariang (Ruweng) 32 95 6% 26% Total 581 359 100% 100%
21
2. Education and school enrolment
2.1. Coverage and type of education
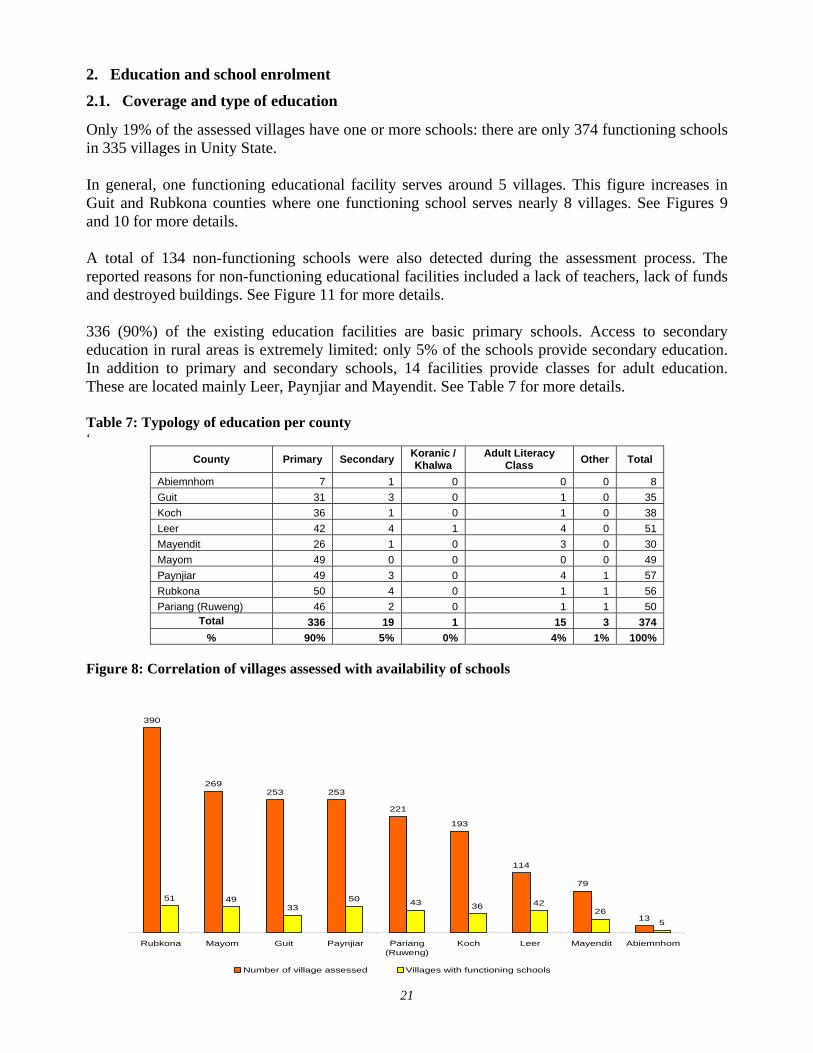
Only 19% of the assessed villages have one or more schools: there are only 374 functioning schools in 335 villages in Unity State. In general, one functioning educational facility serves around 5 villages. This figure increases in Guit and Rubkona counties where one functioning school serves nearly 8 villages. See Figures 9 and 10 for more details. A total of 134 non-functioning schools were also detected during the assessment process. The reported reasons for non-functioning educational facilities included a lack of teachers, lack of funds and destroyed buildings. See Figure 11 for more details. 336 (90%) of the existing education facilities are basic primary schools. Access to secondary education in rural areas is extremely limited: only 5% of the schools provide secondary education. In addition to primary and secondary schools, 14 facilities provide classes for adult education. These are located mainly Leer, Paynjiar and Mayendit. See Table 7 for more details. Table 7: Typology of education per county ‘
County Primary Secondary Koranic / Khalwa
Adult Literacy Class Other Total
Abiemnhom 7 1 0 0 0 8 Guit 31 3 0 1 0 35 Koch 36 1 0 1 0 38 Leer 42 4 1 4 0 51 Mayendit 26 1 0 3 0 30 Mayom 49 0 0 0 0 49 Paynjiar 49 3 0 4 1 57 Rubkona 50 4 0 1 1 56 Pariang (Ruweng) 46 2 0 1 1 50
Total 336 19 1 15 3 374 % 90% 5% 0% 4% 1% 100%
Figure 8: Correlation of villages assessed with availability of schools
390
269253 253
221
193
114
79
13
51 4933
50 43 36 4226
5
Rubkona Mayom Guit Paynjiar Pariang(Ruweng)
Koch Leer Mayendit Abiemnhom
Number of village assessed Villages with functioning schools

22
Figure 9: Number of villages served by one functioning educational facility
2.6
2.7
3.0
5.1
5.1
5.4
5.5
7.6
7.7
0.0 1.0 2.0 3.0 4.0 5.0 6.0 7.0 8.0 9.0
Abiemnhom
Leer
Mayendit
Paynjiar
Pariang (Ruweng)
Koch
Mayom
Rubkona
Guit
Average number of villages served by one functioning educational facility Figure 10: Reasons for non-functioning schools in percentages
18% 20%10%
36%
24% 28%
45%36%
47%
50%
32%
38% 33%
55%
36%44% 43%
50%
32%38%
35% 45%
5%
0%
Abiemnhom Guit Koch Leer Mayendit Mayom Paynjiar Rubkona Pariang(Ruweng)
Destroyed Lack of Teachers Lack of funds Other At the county level, the percentage of functioning schools in the villages assessed was found to vary between 13% each in Rubkona and Guit and 38% in Abiemnhom County.
23
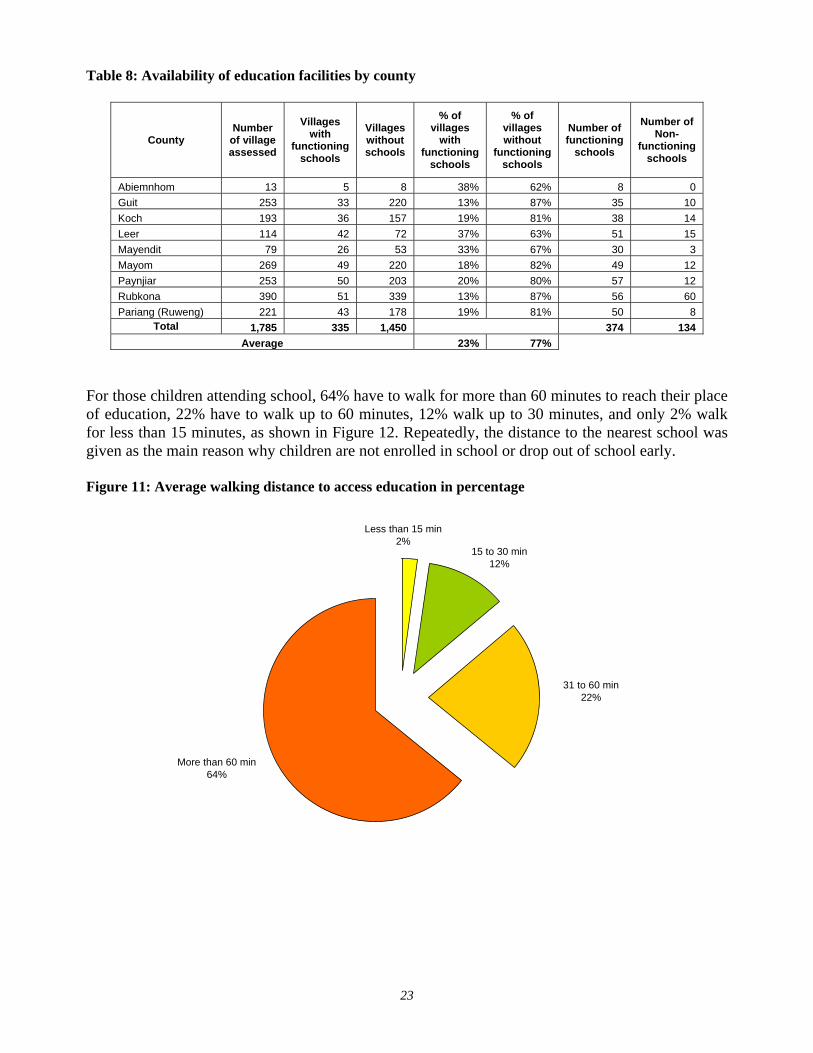
Table 8: Availability of education facilities by county
County Number
of village assessed
Villages with
functioning schools
Villages without schools
% of villages
with functioning
schools
% of villages without
functioning schools
Number of functioning
schools
Number of Non-
functioning schools
Abiemnhom 13 5 8 38% 62% 8 0 Guit 253 33 220 13% 87% 35 10 Koch 193 36 157 19% 81% 38 14 Leer 114 42 72 37% 63% 51 15 Mayendit 79 26 53 33% 67% 30 3 Mayom 269 49 220 18% 82% 49 12 Paynjiar 253 50 203 20% 80% 57 12 Rubkona 390 51 339 13% 87% 56 60 Pariang (Ruweng) 221 43 178 19% 81% 50 8
Total 1,785 335 1,450 374 134 Average 23% 77%
For those children attending school, 64% have to walk for more than 60 minutes to reach their place of education, 22% have to walk up to 60 minutes, 12% walk up to 30 minutes, and only 2% walk for less than 15 minutes, as shown in Figure 12. Repeatedly, the distance to the nearest school was given as the main reason why children are not enrolled in school or drop out of school early. Figure 11: Average walking distance to access education in percentage
15 to 30 min12%
Less than 15 min2%
31 to 60 min22%
More than 60 min64%
24
2.2. School enrolment and gender disaggregation
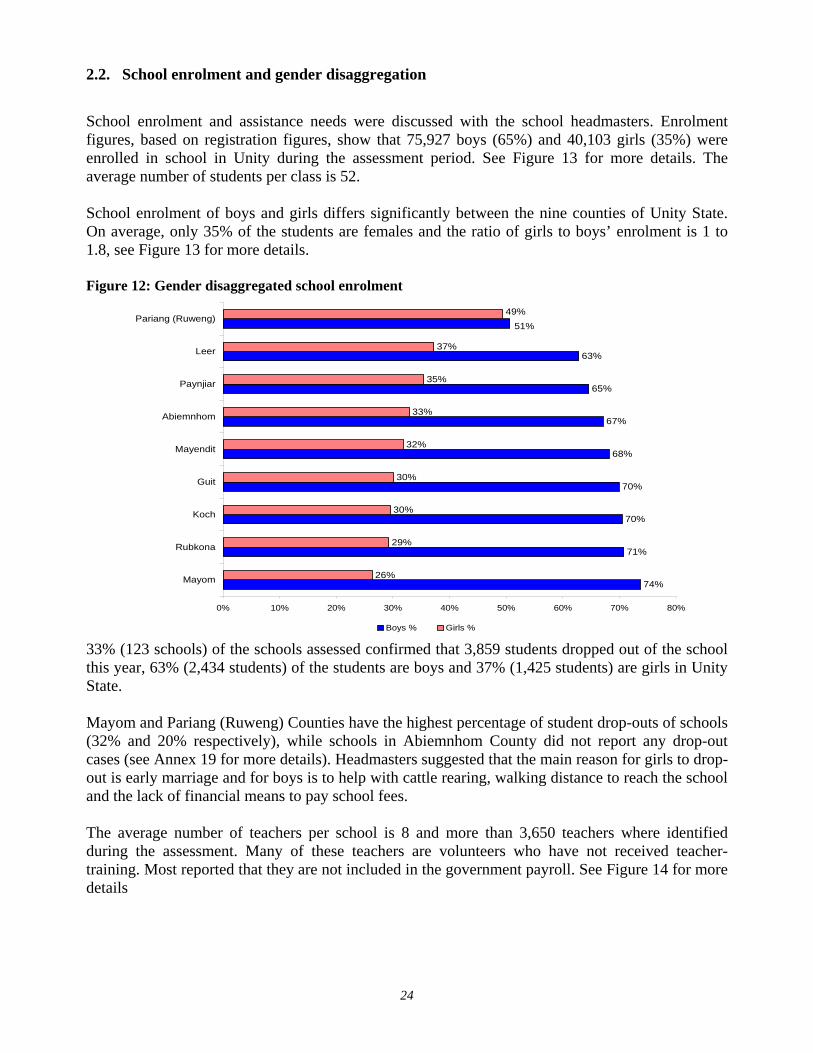
School enrolment and assistance needs were discussed with the school headmasters. Enrolment figures, based on registration figures, show that 75,927 boys (65%) and 40,103 girls (35%) were enrolled in school in Unity during the assessment period. See Figure 13 for more details. The average number of students per class is 52. School enrolment of boys and girls differs significantly between the nine counties of Unity State. On average, only 35% of the students are females and the ratio of girls to boys’ enrolment is 1 to 1.8, see Figure 13 for more details. Figure 12: Gender disaggregated school enrolment
74%
71%
70%
70%
68%
67%
65%
63%
26%
29%
30%
30%
32%
33%
35%
37%
51%49%
0% 10% 20% 30% 40% 50% 60% 70% 80%
Mayom
Rubkona
Koch
Guit
Mayendit
Abiemnhom
Paynjiar
Leer
Pariang (Ruweng)
Boys % Girls % 33% (123 schools) of the schools assessed confirmed that 3,859 students dropped out of the school this year, 63% (2,434 students) of the students are boys and 37% (1,425 students) are girls in Unity State. Mayom and Pariang (Ruweng) Counties have the highest percentage of student drop-outs of schools (32% and 20% respectively), while schools in Abiemnhom County did not report any drop-out cases (see Annex 19 for more details). Headmasters suggested that the main reason for girls to drop-out is early marriage and for boys is to help with cattle rearing, walking distance to reach the school and the lack of financial means to pay school fees. The average number of teachers per school is 8 and more than 3,650 teachers where identified during the assessment. Many of these teachers are volunteers who have not received teacher-training. Most reported that they are not included in the government payroll. See Figure 14 for more details
25
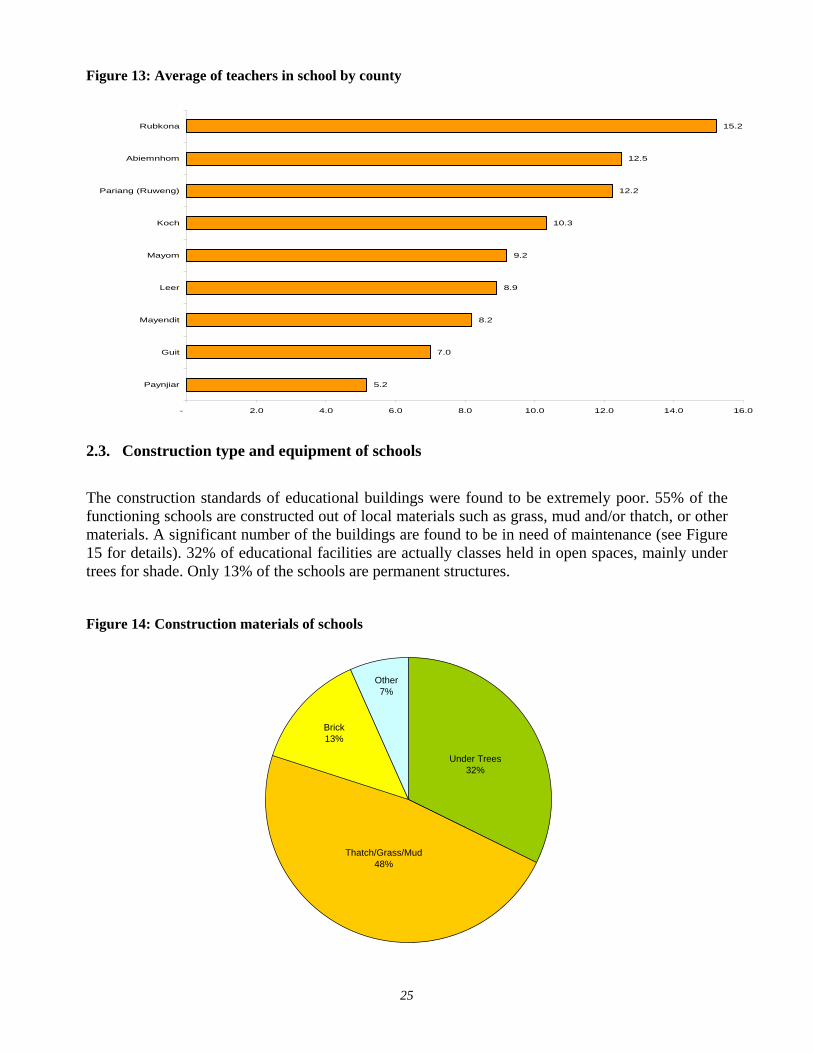
Figure 13: Average of teachers in school by county
5.2
7.0
8.2
8.9
9.2
10.3
12.2
12.5
15.2
- 2.0 4.0 6.0 8.0 10.0 12.0 14.0 16.0
Paynjiar
Guit
Mayendit
Leer
Mayom
Koch
Pariang (Ruweng)
Abiemnhom
Rubkona
2.3. Construction type and equipment of schools
The construction standards of educational buildings were found to be extremely poor. 55% of the functioning schools are constructed out of local materials such as grass, mud and/or thatch, or other materials. A significant number of the buildings are found to be in need of maintenance (see Figure 15 for details). 32% of educational facilities are actually classes held in open spaces, mainly under trees for shade. Only 13% of the schools are permanent structures. Figure 14: Construction materials of schools
Thatch/Grass/Mud48%
Under Trees32%
Brick13%
Other7%
26
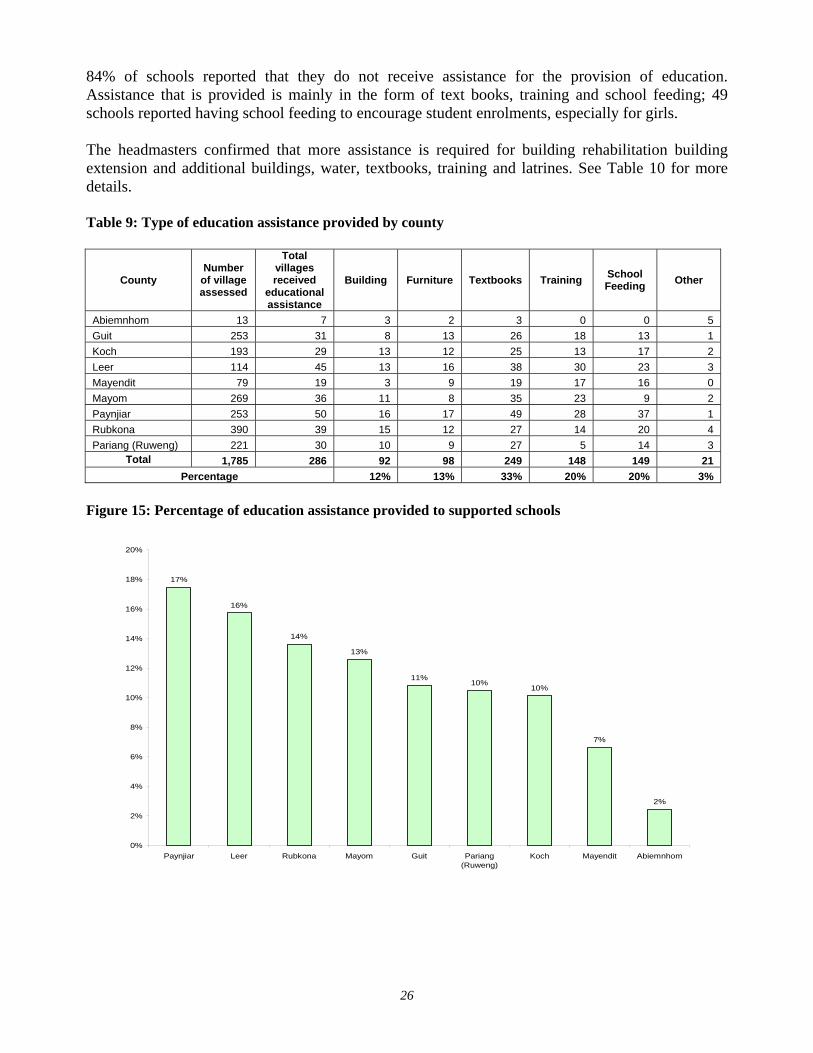
84% of schools reported that they do not receive assistance for the provision of education. Assistance that is provided is mainly in the form of text books, training and school feeding; 49 schools reported having school feeding to encourage student enrolments, especially for girls. The headmasters confirmed that more assistance is required for building rehabilitation building extension and additional buildings, water, textbooks, training and latrines. See Table 10 for more details. Table 9: Type of education assistance provided by county
County Number
of village assessed
Total villages received
educational assistance
Building Furniture Textbooks Training School Feeding Other
Abiemnhom 13 7 3 2 3 0 0 5 Guit 253 31 8 13 26 18 13 1 Koch 193 29 13 12 25 13 17 2 Leer 114 45 13 16 38 30 23 3 Mayendit 79 19 3 9 19 17 16 0 Mayom 269 36 11 8 35 23 9 2 Paynjiar 253 50 16 17 49 28 37 1 Rubkona 390 39 15 12 27 14 20 4 Pariang (Ruweng) 221 30 10 9 27 5 14 3
Total 1,785 286 92 98 249 148 149 21 Percentage 12% 13% 33% 20% 20% 3%
Figure 15: Percentage of education assistance provided to supported schools
17%
16%
14%
13%
11%10%
10%
7%
2%
0%
2%
4%
6%
8%
10%
12%
14%
16%
18%
20%
Paynjiar Leer Rubkona Mayom Guit Pariang(Ruweng)
Koch Mayendit Abiemnhom
27
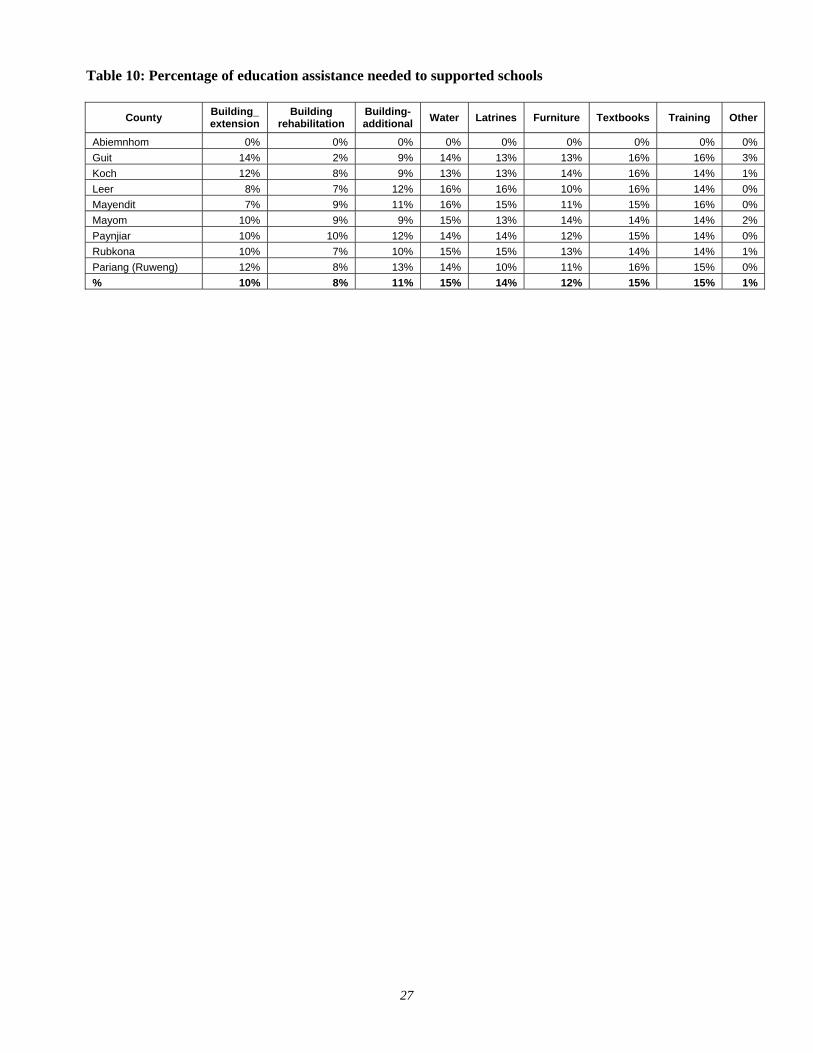
Table 10: Percentage of education assistance needed to supported schools
County Building_ extension
Building rehabilitation
Building- additional Water Latrines Furniture Textbooks Training Other
Abiemnhom 0% 0% 0% 0% 0% 0% 0% 0% 0% Guit 14% 2% 9% 14% 13% 13% 16% 16% 3% Koch 12% 8% 9% 13% 13% 14% 16% 14% 1% Leer 8% 7% 12% 16% 16% 10% 16% 14% 0% Mayendit 7% 9% 11% 16% 15% 11% 15% 16% 0% Mayom 10% 9% 9% 15% 13% 14% 14% 14% 2% Paynjiar 10% 10% 12% 14% 14% 12% 15% 14% 0% Rubkona 10% 7% 10% 15% 15% 13% 14% 14% 1% Pariang (Ruweng) 12% 8% 13% 14% 10% 11% 16% 15% 0% % 10% 8% 11% 15% 14% 12% 15% 15% 1%
28
3. Health sector and HIV/AIDS awareness
3.1. Coverage and accessibility of health facilities
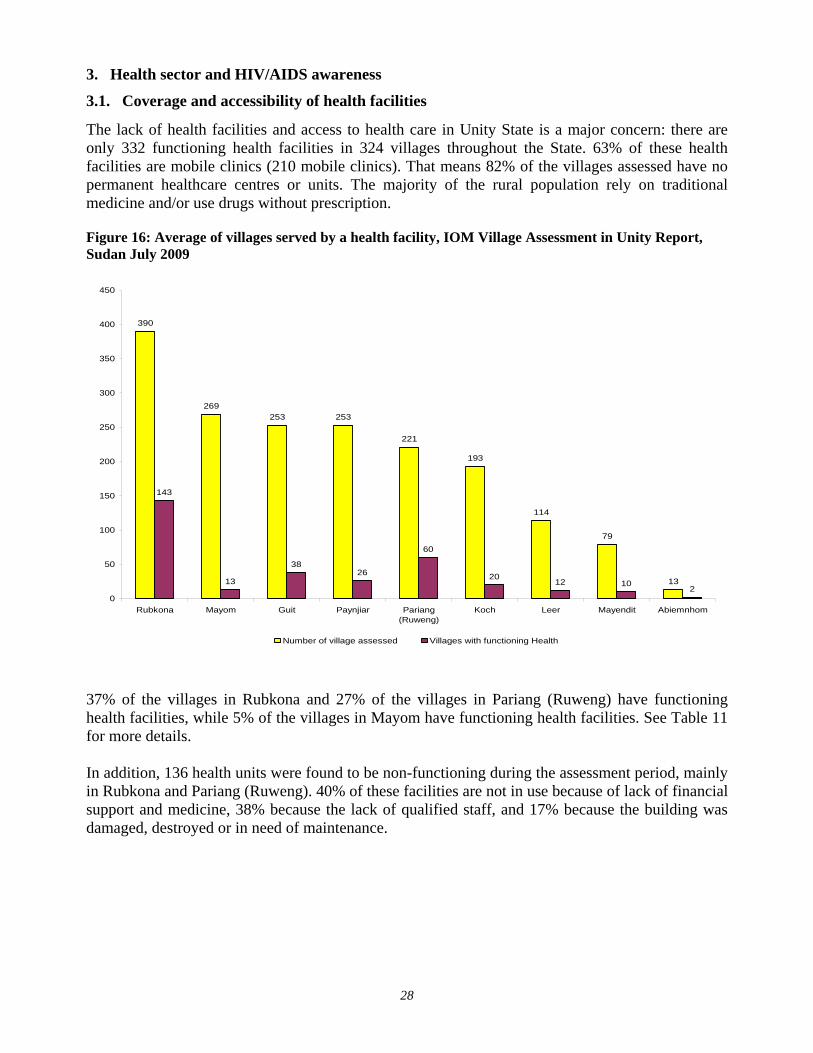
The lack of health facilities and access to health care in Unity State is a major concern: there are only 332 functioning health facilities in 324 villages throughout the State. 63% of these health facilities are mobile clinics (210 mobile clinics). That means 82% of the villages assessed have no permanent healthcare centres or units. The majority of the rural population rely on traditional medicine and/or use drugs without prescription. Figure 16: Average of villages served by a health facility, IOM Village Assessment in Unity Report, Sudan July 2009
390
269253 253
221
193
114
79
13
143
13
3826
60
2012 10
20
50
100
150
200
250
300
350
400
450
Rubkona Mayom Guit Paynjiar Pariang(Ruweng)
Koch Leer Mayendit Abiemnhom
Number of village assessed Villages with functioning Health 37% of the villages in Rubkona and 27% of the villages in Pariang (Ruweng) have functioning health facilities, while 5% of the villages in Mayom have functioning health facilities. See Table 11 for more details. In addition, 136 health units were found to be non-functioning during the assessment period, mainly in Rubkona and Pariang (Ruweng). 40% of these facilities are not in use because of lack of financial support and medicine, 38% because the lack of qualified staff, and 17% because the building was damaged, destroyed or in need of maintenance.
29
Table 11: Availability of health facilities by county
County Number
of village assessed
Villages with
functioning Health
Villages without Health
% of villages
with functioning
Health
% of villages without
functioning Health
Number of functioning Health
Number of Non-
functioning Health
Abiemnhom 13 2 11 15% 85% 4 0 Guit 253 38 215 15% 85% 41 6 Koch 193 20 173 10% 90% 20 7 Leer 114 12 102 11% 89% 12 9 Mayendit 79 10 69 13% 87% 10 11 Mayom 269 13 256 5% 95% 13 9 Paynjiar 253 26 227 10% 90% 26 7 Rubkona 390 143 247 37% 63% 145 60 Pariang (Ruweng) 221 60 161 27% 73% 61 27
Total 1,785 324 1,461 332 136 Table 12: Types of health facilities by county
County Mobile Clinic PHC PHU N/A Total Abiemnhom 0 2 2 0 4 Guit 31 2 3 5 41 Koch 10 4 4 2 20 Leer 4 2 0 6 12 Mayendit 0 0 4 6 10 Mayom 1 9 3 0 13 Paynjiar 0 3 19 4 26 Rubkona 123 4 0 18 145 Pariang (Ruweng) 41 2 2 16 61 Total 210 28 37 57 332 % 63% 8% 11% 17% 100%
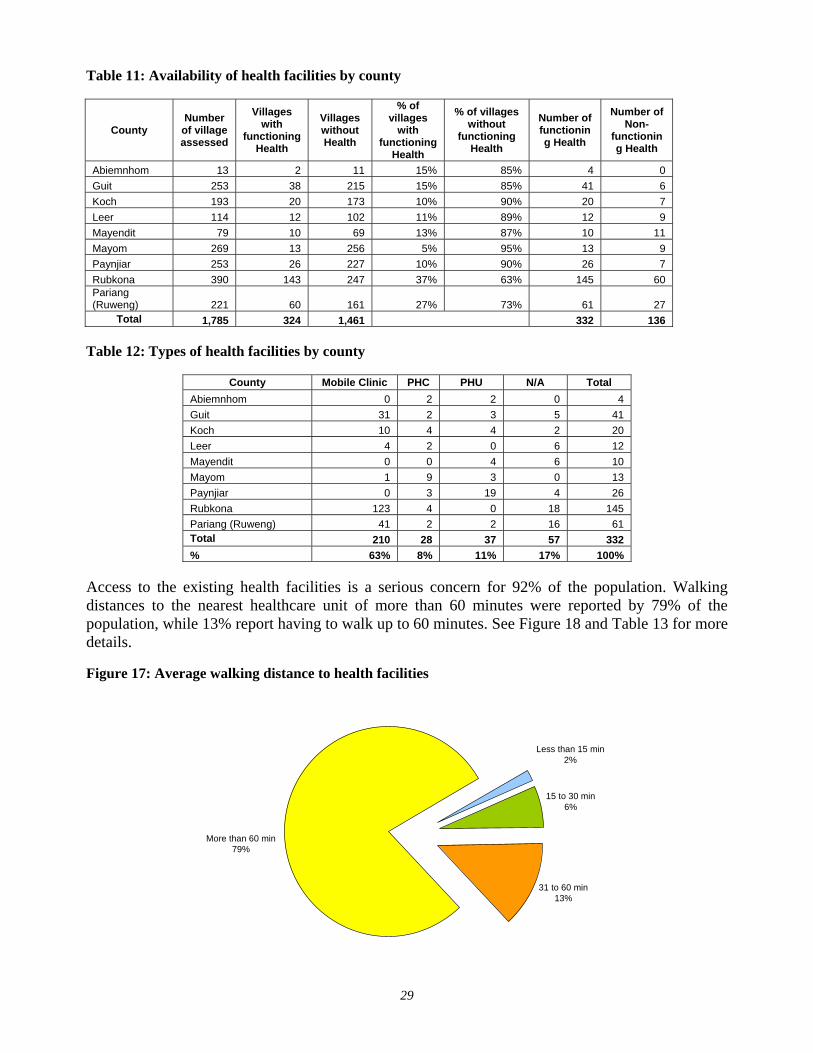
Access to the existing health facilities is a serious concern for 92% of the population. Walking distances to the nearest healthcare unit of more than 60 minutes were reported by 79% of the population, while 13% report having to walk up to 60 minutes. See Figure 18 and Table 13 for more details. Figure 17: Average walking distance to health facilities
15 to 30 min6%
31 to 60 min13%
More than 60 min79%
Less than 15 min2%
30
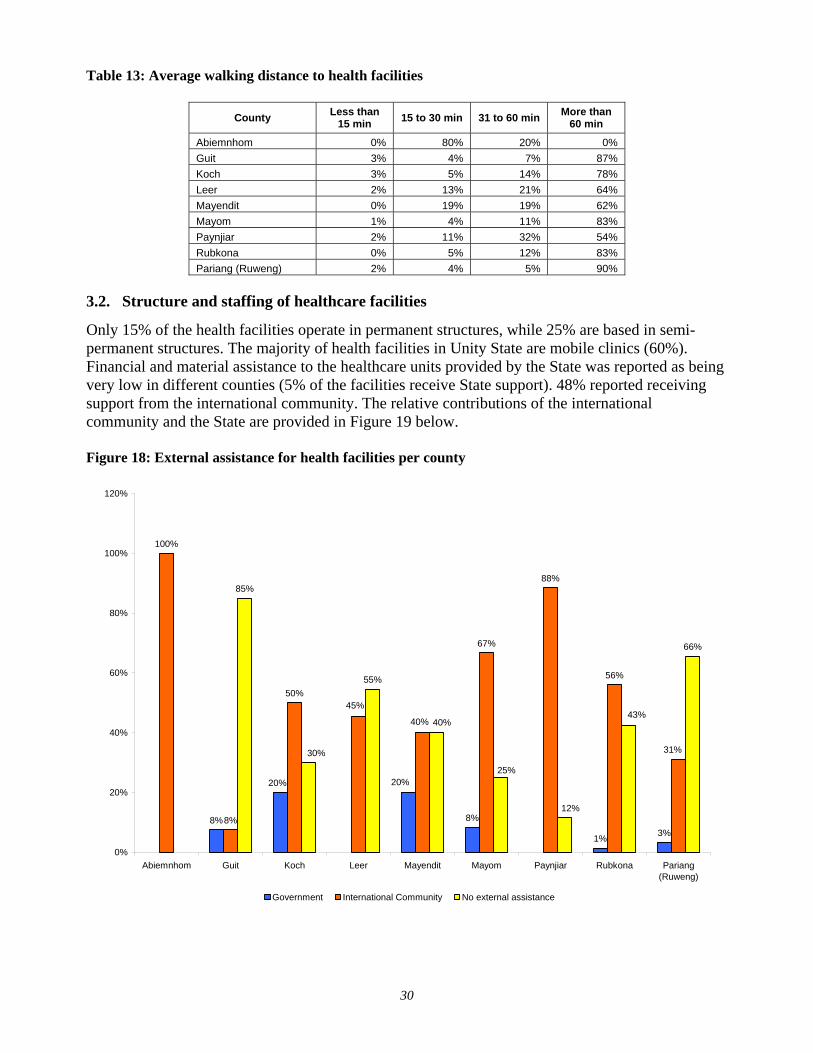
Table 13: Average walking distance to health facilities
County Less than 15 min 15 to 30 min 31 to 60 min More than
60 min
Abiemnhom 0% 80% 20% 0% Guit 3% 4% 7% 87% Koch 3% 5% 14% 78% Leer 2% 13% 21% 64% Mayendit 0% 19% 19% 62% Mayom 1% 4% 11% 83% Paynjiar 2% 11% 32% 54% Rubkona 0% 5% 12% 83% Pariang (Ruweng) 2% 4% 5% 90%
3.2. Structure and staffing of healthcare facilities
Only 15% of the health facilities operate in permanent structures, while 25% are based in semi-permanent structures. The majority of health facilities in Unity State are mobile clinics (60%). Financial and material assistance to the healthcare units provided by the State was reported as being very low in different counties (5% of the facilities receive State support). 48% reported receiving support from the international community. The relative contributions of the international community and the State are provided in Figure 19 below. Figure 18: External assistance for health facilities per county
8% 8%
1% 3%
100%
8%
50%
67%
88%
56%
85%
55%
66%
20%20%
31%
40%
45%43%
12%
25%
40%
30%
0%
20%
40%
60%
80%
100%
120%
Abiemnhom Guit Koch Leer Mayendit Mayom Paynjiar Rubkona Pariang(Ruweng)
Government International Community No external assistance
31
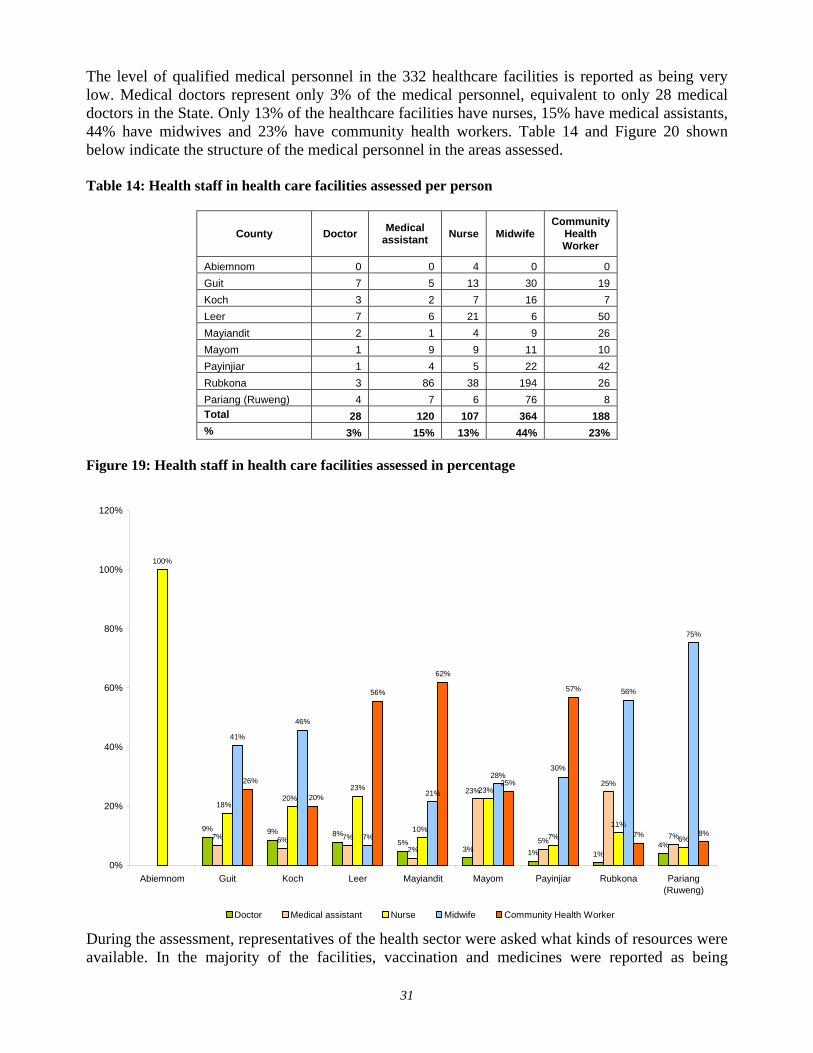
The level of qualified medical personnel in the 332 healthcare facilities is reported as being very low. Medical doctors represent only 3% of the medical personnel, equivalent to only 28 medical doctors in the State. Only 13% of the healthcare facilities have nurses, 15% have medical assistants, 44% have midwives and 23% have community health workers. Table 14 and Figure 20 shown below indicate the structure of the medical personnel in the areas assessed. Table 14: Health staff in health care facilities assessed per person
County Doctor Medical assistant Nurse Midwife
Community Health Worker
Abiemnom 0 0 4 0 0 Guit 7 5 13 30 19 Koch 3 2 7 16 7 Leer 7 6 21 6 50 Mayiandit 2 1 4 9 26 Mayom 1 9 9 11 10 Payinjiar 1 4 5 22 42 Rubkona 3 86 38 194 26 Pariang (Ruweng) 4 7 6 76 8 Total 28 120 107 364 188 % 3% 15% 13% 44% 23%
Figure 19: Health staff in health care facilities assessed in percentage
9% 9% 8%5%
3% 1% 1%4%
7% 6% 7%
2%5%
25%
7%
100%
23%
7%11%
6%
41%
46%
7%
21%
28%
56%
75%
56%
62%
25%
57%
7% 8%
23%23%
10%
20%18%
30%
20%
26%
0%
20%
40%
60%
80%
100%
120%
Abiemnom Guit Koch Leer Mayiandit Mayom Payinjiar Rubkona Pariang(Ruweng)
Doctor Medical assistant Nurse Midwife Community Health Worker
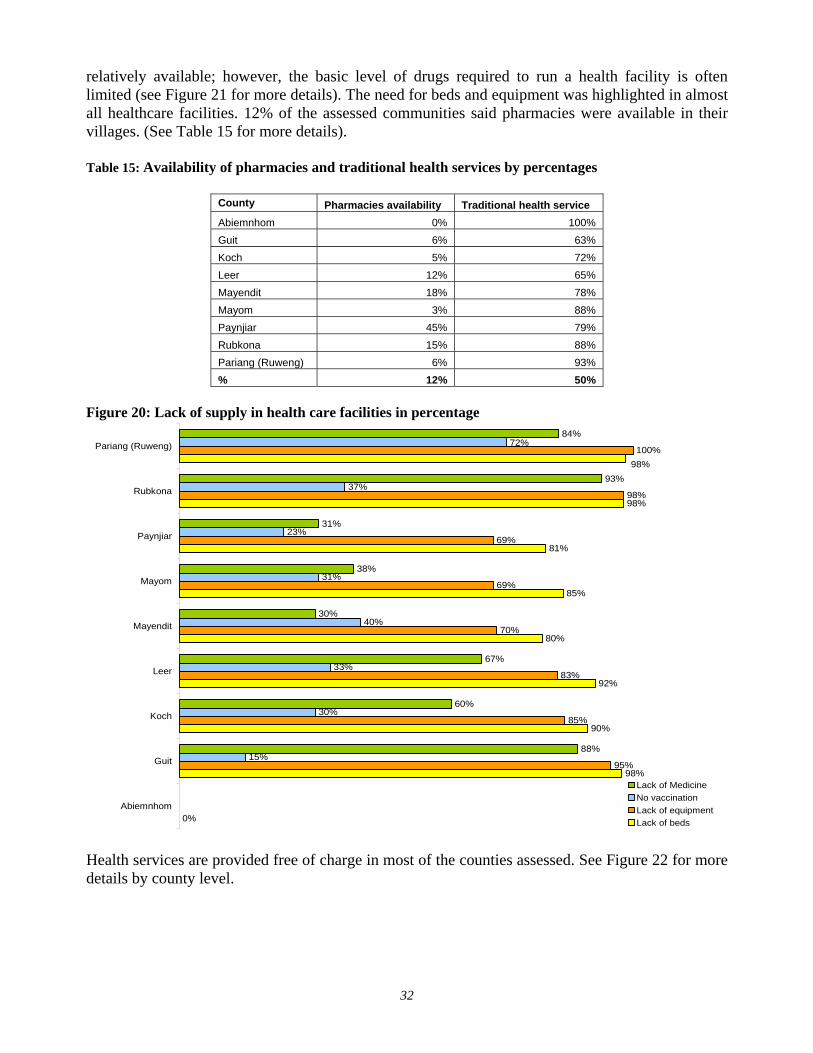
During the assessment, representatives of the health sector were asked what kinds of resources were available. In the majority of the facilities, vaccination and medicines were reported as being
32
relatively available; however, the basic level of drugs required to run a health facility is often limited (see Figure 21 for more details). The need for beds and equipment was highlighted in almost all healthcare facilities. 12% of the assessed communities said pharmacies were available in their villages. (See Table 15 for more details). Table 15: Availability of pharmacies and traditional health services by percentages
County Pharmacies availability Traditional health service Abiemnhom 0% 100% Guit 6% 63% Koch 5% 72% Leer 12% 65% Mayendit 18% 78% Mayom 3% 88% Paynjiar 45% 79% Rubkona 15% 88% Pariang (Ruweng) 6% 93% % 12% 50%
Figure 20: Lack of supply in health care facilities in percentage
0%
98%
90%
92%
80%
85%
81%
98%
95%
85%
83%
70%
69%
69%
98%
100%
15%
30%
33%
40%
31%
23%
37%
88%
60%
67%
30%
38%
31%
93%
84%
98%
72%
Abiemnhom
Guit
Koch
Leer
Mayendit
Mayom
Paynjiar
Rubkona
Pariang (Ruweng)
Lack of MedicineNo vaccinationLack of equipmentLack of beds
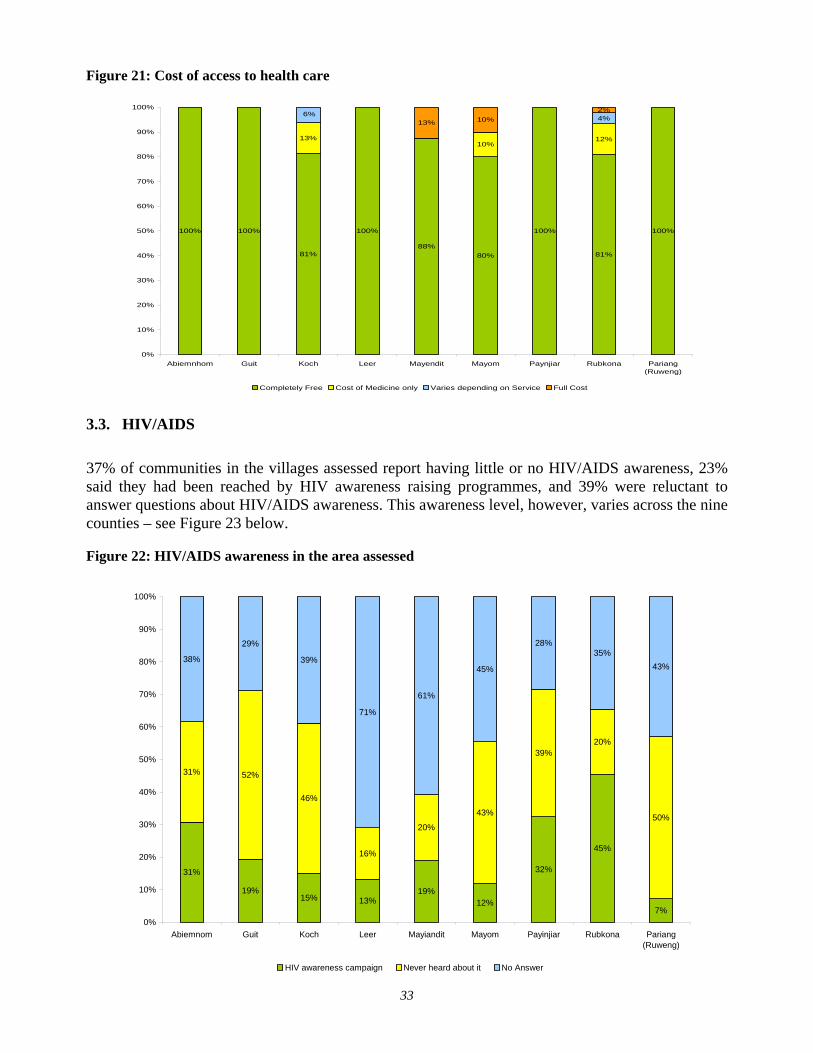
Health services are provided free of charge in most of the counties assessed. See Figure 22 for more details by county level.
33
Figure 21: Cost of access to health care
100% 100%
81%
100%
88%80%
100%
81%
100%
13%10%
12%
4%13% 10%
2%6%
0%
10%
20%
30%
40%
50%
60%
70%
80%
90%
100%
Abiemnhom Guit Koch Leer Mayendit Mayom Paynjiar Rubkona Pariang(Ruweng)
Completely Free Cost of Medicine only Varies depending on Service Full Cost
3.3. HIV/AIDS 37% of communities in the villages assessed report having little or no HIV/AIDS awareness, 23% said they had been reached by HIV awareness raising programmes, and 39% were reluctant to answer questions about HIV/AIDS awareness. This awareness level, however, varies across the nine counties – see Figure 23 below. Figure 22: HIV/AIDS awareness in the area assessed
31%
19%15% 13%
19%12%
32%
45%
7%
31% 52%
46%
16%
20%
43%
39%20%
50%
38%
29%
39%
71%
61%
45%
28%35%
43%
0%
10%
20%
30%
40%
50%
60%
70%
80%
90%
100%
Abiemnom Guit Koch Leer Mayiandit Mayom Payinjiar Rubkona Pariang(Ruweng)
HIV awareness campaign Never heard about it No Answer
34
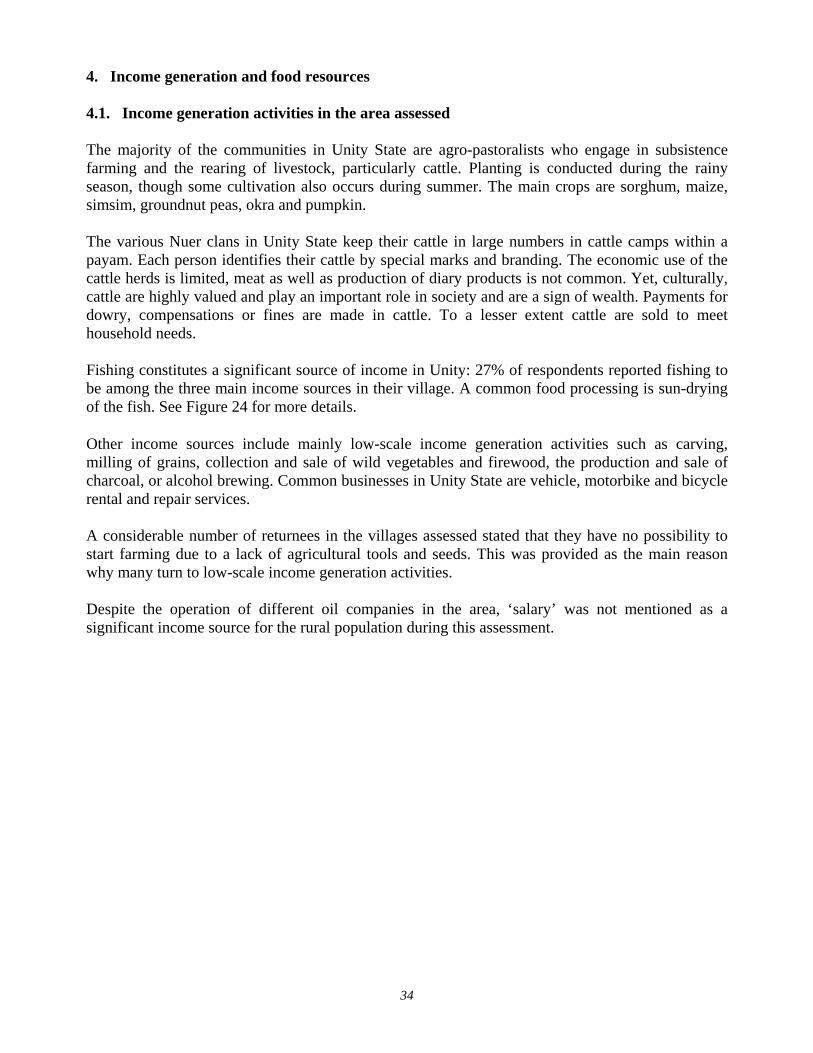
4. Income generation and food resources 4.1. Income generation activities in the area assessed The majority of the communities in Unity State are agro-pastoralists who engage in subsistence farming and the rearing of livestock, particularly cattle. Planting is conducted during the rainy season, though some cultivation also occurs during summer. The main crops are sorghum, maize, simsim, groundnut peas, okra and pumpkin. The various Nuer clans in Unity State keep their cattle in large numbers in cattle camps within a payam. Each person identifies their cattle by special marks and branding. The economic use of the cattle herds is limited, meat as well as production of diary products is not common. Yet, culturally, cattle are highly valued and play an important role in society and are a sign of wealth. Payments for dowry, compensations or fines are made in cattle. To a lesser extent cattle are sold to meet household needs. Fishing constitutes a significant source of income in Unity: 27% of respondents reported fishing to be among the three main income sources in their village. A common food processing is sun-drying of the fish. See Figure 24 for more details.
Other income sources include mainly low-scale income generation activities such as carving, milling of grains, collection and sale of wild vegetables and firewood, the production and sale of charcoal, or alcohol brewing. Common businesses in Unity State are vehicle, motorbike and bicycle rental and repair services. A considerable number of returnees in the villages assessed stated that they have no possibility to start farming due to a lack of agricultural tools and seeds. This was provided as the main reason why many turn to low-scale income generation activities. Despite the operation of different oil companies in the area, ‘salary’ was not mentioned as a significant income source for the rural population during this assessment.
35
Figure 23: Main income generation activities per county
18%24% 23% 26% 27% 26% 24% 22% 23%
12%
27%22%
30% 27% 27% 29% 30% 27%
25%
20%
17%
20%18% 17%
13%20%
18%
19%
14%
20%
15% 23%
13% 22% 9%12%
25%
14%
15%
2% 2% 4%
17%
9%
3%
14%10%
17%
1%1%1% 1%
0%
10%
20%
30%
40%
50%
60%
70%
80%
90%
100%
Abiemnhom Guit Koch Leer Mayendit Mayom Paynjiar Rubkona Pariang(Ruweng)
Livestock Farming Cutting Grass Fishing Collecting wood Hunting
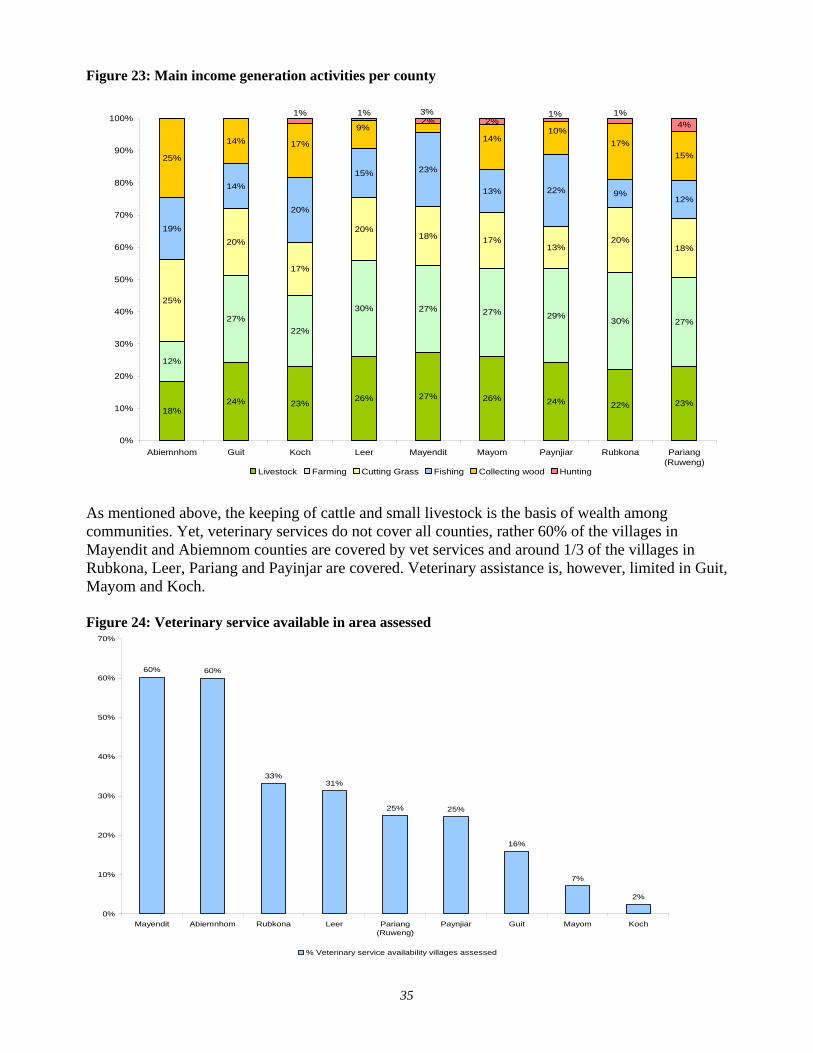
As mentioned above, the keeping of cattle and small livestock is the basis of wealth among communities. Yet, veterinary services do not cover all counties, rather 60% of the villages in Mayendit and Abiemnom counties are covered by vet services and around 1/3 of the villages in Rubkona, Leer, Pariang and Payinjar are covered. Veterinary assistance is, however, limited in Guit, Mayom and Koch. Figure 24: Veterinary service available in area assessed
60% 60%
33%31%
25% 25%
16%
7%
2%
0%
10%
20%
30%
40%
50%
60%
70%
Mayendit Abiemnhom Rubkona Leer Pariang(Ruweng)
Paynjiar Guit Mayom Koch
% Veterinary service availability villages assessed
36
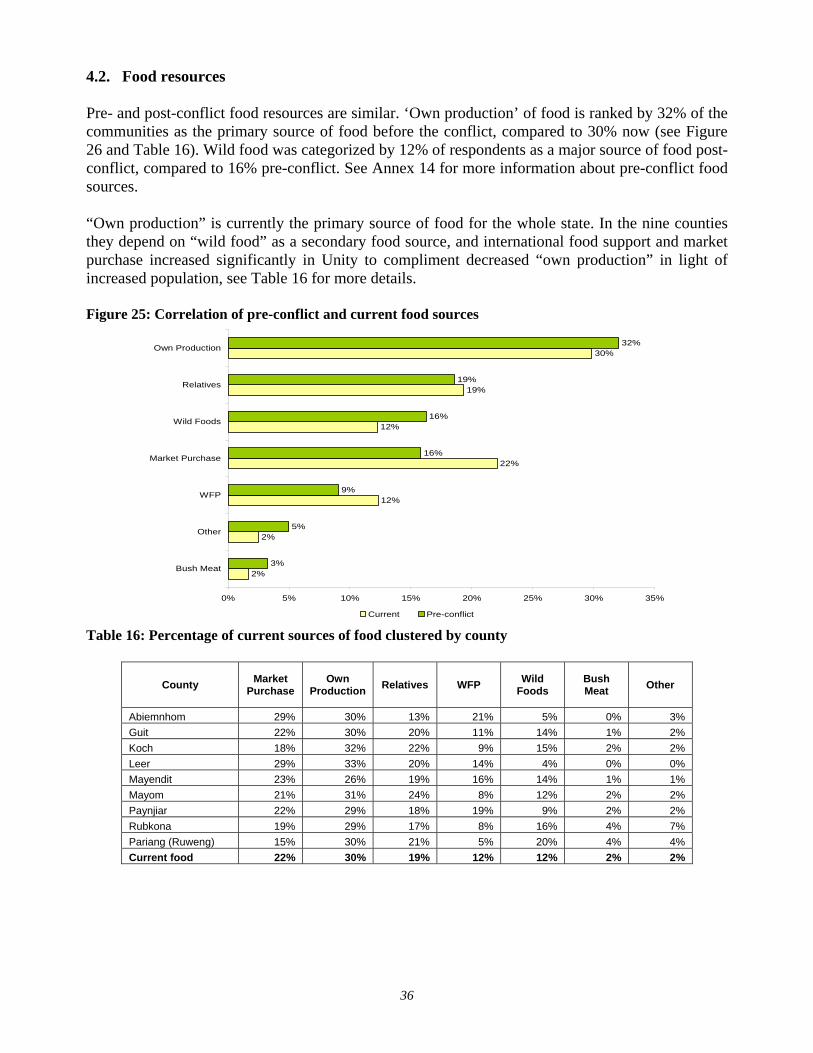
4.2. Food resources Pre- and post-conflict food resources are similar. ‘Own production’ of food is ranked by 32% of the communities as the primary source of food before the conflict, compared to 30% now (see Figure 26 and Table 16). Wild food was categorized by 12% of respondents as a major source of food post-conflict, compared to 16% pre-conflict. See Annex 14 for more information about pre-conflict food sources. “Own production” is currently the primary source of food for the whole state. In the nine counties they depend on “wild food” as a secondary food source, and international food support and market purchase increased significantly in Unity to compliment decreased “own production” in light of increased population, see Table 16 for more details. Figure 25: Correlation of pre-conflict and current food sources
2%
2%
12%
22%
12%
19%
30%
3%
5%
9%
16%
16%
19%
32%
0% 5% 10% 15% 20% 25% 30% 35%
Bush Meat
Other
WFP
Market Purchase
Wild Foods
Relatives
Own Production
Current Pre-conflict Table 16: Percentage of current sources of food clustered by county
County Market Purchase
Own Production Relatives WFP Wild
Foods Bush Meat Other
Abiemnhom 29% 30% 13% 21% 5% 0% 3% Guit 22% 30% 20% 11% 14% 1% 2% Koch 18% 32% 22% 9% 15% 2% 2% Leer 29% 33% 20% 14% 4% 0% 0% Mayendit 23% 26% 19% 16% 14% 1% 1% Mayom 21% 31% 24% 8% 12% 2% 2% Paynjiar 22% 29% 18% 19% 9% 2% 2% Rubkona 19% 29% 17% 8% 16% 4% 7% Pariang (Ruweng) 15% 30% 21% 5% 20% 4% 4% Current food 22% 30% 19% 12% 12% 2% 2%
37
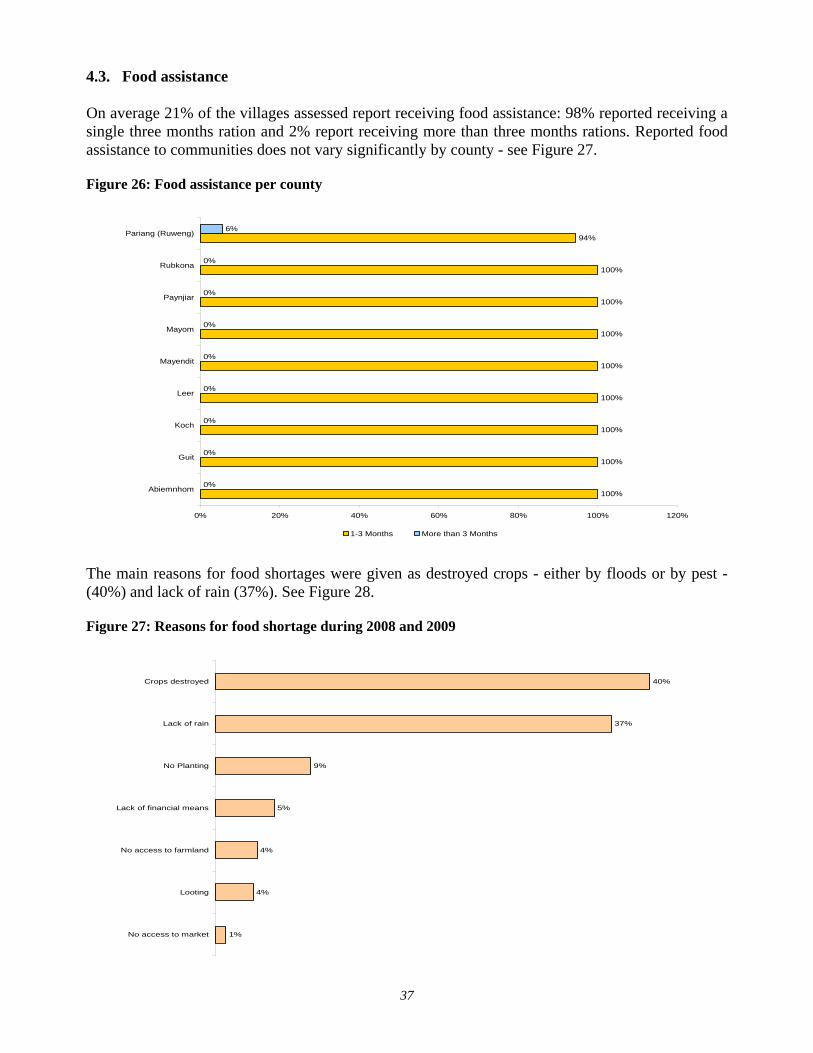
4.3. Food assistance On average 21% of the villages assessed report receiving food assistance: 98% reported receiving a single three months ration and 2% report receiving more than three months rations. Reported food assistance to communities does not vary significantly by county - see Figure 27. Figure 26: Food assistance per county
100%
100%
100%
100%
100%
100%
100%
100%
94%
0%
0%
0%
0%
0%
0%
0%
0%
6%
0% 20% 40% 60% 80% 100% 120%
Abiemnhom
Guit
Koch
Leer
Mayendit
Mayom
Paynjiar
Rubkona
Pariang (Ruweng)
1-3 Months More than 3 Months The main reasons for food shortages were given as destroyed crops - either by floods or by pest - (40%) and lack of rain (37%). See Figure 28. Figure 27: Reasons for food shortage during 2008 and 2009
1%
4%
4%
5%
9%
37%
40%
No access to market
Looting
No access to farmland
Lack of financial means
No Planting
Lack of rain
Crops destroyed
38
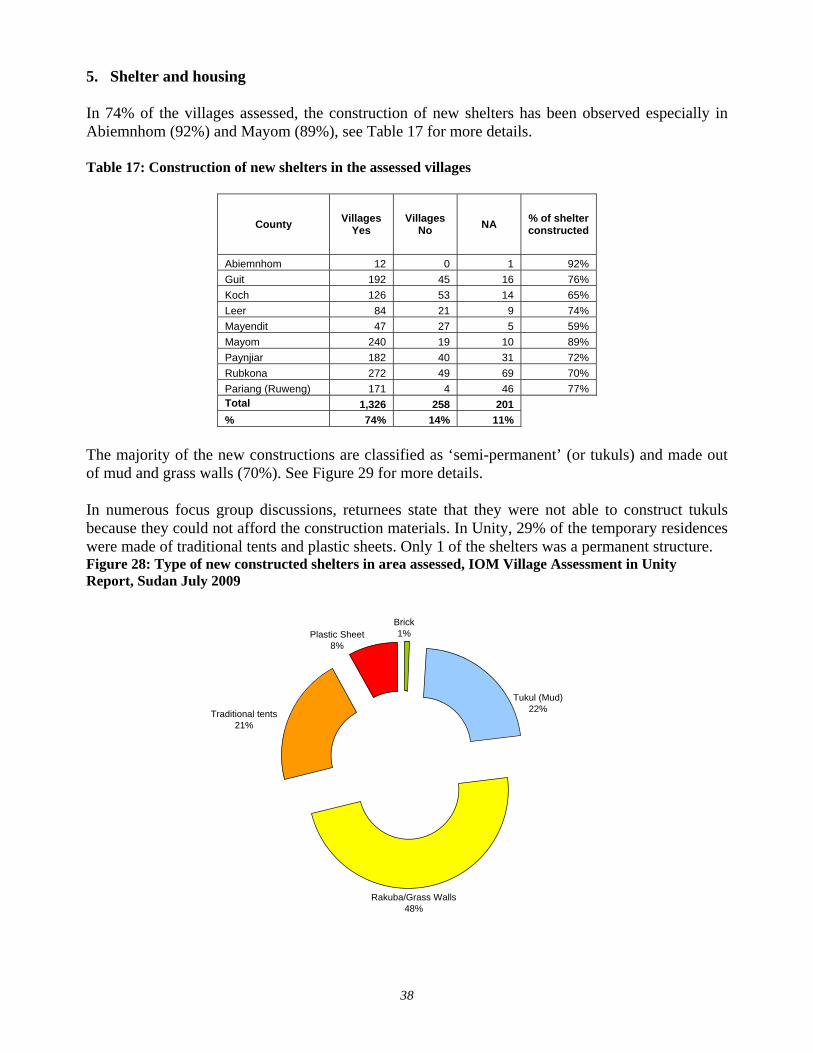
5. Shelter and housing In 74% of the villages assessed, the construction of new shelters has been observed especially in Abiemnhom (92%) and Mayom (89%), see Table 17 for more details. Table 17: Construction of new shelters in the assessed villages
County Villages Yes
Villages No NA % of shelter
constructed
Abiemnhom 12 0 1 92% Guit 192 45 16 76% Koch 126 53 14 65% Leer 84 21 9 74% Mayendit 47 27 5 59% Mayom 240 19 10 89% Paynjiar 182 40 31 72% Rubkona 272 49 69 70% Pariang (Ruweng) 171 4 46 77% Total 1,326 258 201 % 74% 14% 11%
The majority of the new constructions are classified as ‘semi-permanent’ (or tukuls) and made out of mud and grass walls (70%). See Figure 29 for more details. In numerous focus group discussions, returnees state that they were not able to construct tukuls because they could not afford the construction materials. In Unity, 29% of the temporary residences were made of traditional tents and plastic sheets. Only 1 of the shelters was a permanent structure. Figure 28: Type of new constructed shelters in area assessed, IOM Village Assessment in Unity Report, Sudan July 2009
Brick1%Plastic Sheet
8%
Tukul (Mud)22%
Rakuba/Grass Walls48%
Traditional tents21%
39
PART II – MAPS The section of the report presents a collection of thematic maps based predominantly on the data collected through IOM’s Village Assessment Programme. The exceptions to this are Maps 1 and 3 which, to greater or lesser degrees, also rely on data from IOM’s Tracking of Spontaneous Returns Programme. 1. Tracking of Spontaneous Returns: Unity - Cumulative January 2006 - March 2009 This map is based on data from IOM’s Tracking of Spontaneous Returns Programme, based on data gathered from January 2006 up to March 2009. This programme gathers data directly from the villages of return, and thus provides actual return numbers. As of March 2009, the geographic coverage of IOM’s Tracking of Spontaneous Returns Programme is around 65% by payam. Areas of the map shown without colour indicate the lack of reporting mechanism, not lack of returnees. By various means, the IOM area of return tracking programme is directed towards the areas of highest return, and thus the coverage of numbers of returnees tracked is held to be above the geographical coverage of 65%. 2. Density of villages assessed – County level This map is based on data from IOM’s Village Assessment Project gathered between June 2008 and June 2009 and shows the density of villages assessed at the county level. The lightest tone on the map indicates a smaller number of villages assessed in the county, and darker colours indicate areas where the number of villages assessed is higher. 3. Access to Water in Assessed Villages: Unity – County Level This map is based on data from IOM’s Village Assessment Project gathered between June 2008 and June 2009. This map compares the percentage of villages without improved water sources in each county with the villages with improved water sources. The lightest tone on the map indicates the ratio of improved water sources to the number of villages in the county is relatively good, and darker colours indicate areas where there are lower numbers of improved water sources per village per county. As such, the darker the shading the greater the cause for concern. The map also shows the absolute number of villages with improved, or other, water sources for each county in bar chart form. Improved water sources are taken to be wells, hand-pumps, bladders and tankers. 4. Health Facilities in Assessed Villages: Unity – County Level This map is based on data from IOM’s Village Assessment Project gathered between June 2008 and June 2009. The map compares the percentage of villages without a health facility in each county with those villages with a health facility. The lightest tone on the map indicates the ratio of villages that have a health facility to villages without a health facility in any given county are relatively good. Darker shaded counties indicate areas where the number of health facilities is lower compared to the number of villages. As such, darker shaded counties indicate areas of greater concern.
40
5. Health Services Availability in Assessed Villages: Unity – County Level This map is based on data from IOM’s Village Assessment Project gathered between June 2008 and June 2009. The map compares the percentage of villages without a health facility in each county with those villages with a health facility. It also indicates the services which are available in those health facilities. The lightest tone on the map indicates a relatively good ratio of villages that have a health facility to villages without a health facility. Darker shaded counties indicate areas where the number of health facilities is lower compared to the number of villages. As such, darker shaded counties indicate areas of greater concern. The size of the circle is proportional to the number of equipped health facilities. 6. Type Of Health Facility Construction in Assessed Villages: Unity – County Level This map is based on data from IOM’s Village Assessment Project gathered between June 2008 and June 2009. The map shows the type of construction for health facilities in the villages assessed. This map also compares the percentage of villages without a health facility in each county with those villages with a health facility. The sections within the density circles in each county indicate the construction materials used, while the size of the circle is proportional to the number of health facilities in the county. The lightest tone on the map indicates a relatively good ratio of villages that have a health facility to villages without a health facility. Darker shaded counties indicate areas where the number of health facilities is lower compared to the number of villages. As such, darker shaded counties indicate areas of greater concern. 7. Awareness Level about HIV/AIDS in Assessed Villages: Unity – County Level This map is based on data from IOM’s Village Assessment Project gathered between June 2008 and june 2009. It shows the level of awareness of HIV/AIDS at the county level. The size of each density circle indicates the absolute number of villages assessed who replied to the HIV/AIDS question during the village assessment campaign, and the sections within the circles indicate the level of HIV/AIDS awareness found in each county. This map also compares the percentage of villages without a health facility in each county with those villages with a health facility. The lightest tone on the map indicates a relatively good ratio of villages that have a health facility to villages without a health facility. Darker shaded counties indicate areas where the number of health facilities is lower compared to the number of villages. As such, darker shaded counties indicate areas of greater concern. 8. Type Of Education Construction in Assessed Villages: Unity – County Level
This map is based on data from IOM’s Village Assessment Project gathered between June 2008 and June 2009. This map shows the type of construction of schools in the villages assessed. The size of the pie charts show the number of schools per county, and each slice of the pie is proportional to the type of construction of the school. The shaded areas represent the density of primary school per county.
41
9. Numbers of Teachers in Assessed Villages: Unity – County Level This map is based on data from IOM’s Village Assessment Project gathered between June 2008 and June 2009. This map shows the absolute number of teachers in each county, at primary school level only. 10. Numbers of Teachers and Enrolled Student Ratios: Unity – County Level This map is based on data from IOM’s Village Assessment Project gathered between June 2008 and June 2009. This map shows the relative number of teachers to enrolled students, calculated at the county level. Counties where student/teacher ratios are 60:1 or less are light shaded, where ratios are higher, darker shading is used. As such, darker shaded payams indicate areas of greater concern. The map also shows the absolute number of teachers in each county with the use of density circles. 11. Enrolment in Primary Schools by Gender: Unity – County Level This map is based on data from IOM’s Village Assessment Project gathered between June 2008 and June 2009. Coloured circles on this map show the relative number of boy/girl enrolment in primary schools at the county level. Shading is used to indicate the absolute number of primary schools in each county. 12. Percentage of Villages without Schools: Unity – County Level This map is based on data from IOM’s Village Assessment Project gathered between June 2008 and June 2009. This map shows the percentage of villages without schools, calculated at the county level. Counties where the ratio of villages with schools to those without is good, is shown in light shading. Where the ratio of villages with or without schools is poor, darker shading is used. 13. Average Walking Time to Nearest School: Unity – County Level This map is based on data from IOM’s Village Assessment Project gathered between June 2008 and June 2009. This map shows the average walking time to the nearest school calculated at the county level. Light shaded counties indicate where walking time to the nearest school is short, darker shades indicate longer average walking times to the nearest school. 14. Average Walking Time to Nearest Health Facility: Unity – County Level This map is based on data from IOM’s Village Assessment Project gathered between June 2008 and June 2009. This map shows the average walking time to nearest health facility calculated at the county level. Light shaded counties indicate where walking time to the nearest health facility is short, darker shades indicate longer average walking times to the nearest health facility.
42
The following series of maps aim at showing the vulnerability of the village by sector and are based on an estimated average walking speed of 3 km per hour. The calculations and representations are founded on a construct of 3 levels of vulnerability as 1). 3km = acceptable distance; 2). up to 5km = “medium” distance ; 3). up to 10km= critical distance. Above 10 km, all villages should be considered as priority. 15. Access to Education – time/distance correlation in Assessed Villages – Unity This map is based on data from IOM’s Village Assessment Project gathered between June 2008 and June 2009. This map shows the level of access to education facilities in the villages assessed in Unity. It presents a proximity analysis where distance buffers are applied around the villages with primary schools. The proximity of villages without facility is estimated according to their distance to the nearest primary school, ranging between acceptable (3 km) to critical (10 km maximum). Villages located outside these buffers should be considered as high priority areas. 16. Access to Health Facilities – time/distance correlation in Assessed Villages – Unity This map is based on data from IOM’s Village Assessment Project gathered between June 2008 and June 2009. This map shows the level of access to health facilities in the villages assessed in Unity. It presents a proximity analysis where distance buffers are applied around the villages with a health facility. The proximity of villages without a facility is estimated according to their distance to the nearest health facility, ranging between acceptable (3 km) to critical (10 km maximum). Villages located outside these buffers should be considered as high priority areas. 17. Access to Water – time/distance correlation in Assessed Villages – Unity This map is based on data from IOM’s Village Assessment Project gathered between June 2008 and June 2009. These maps show the level of access to water in the villages assessed in Unity. It presents a proximity analysis where distance buffers are applied around the villages with improved water sources. The proximity of villages without improved water sources is estimated according to their distance to the nearest improved water source, ranging between acceptable (3 km) to critical (10 km maximum). Villages located outside these buffers should be considered as high priority areas.

43

44

45

46

47

48

49

50

51

52

53

54

55

56

57

58

59
60
PART III: STATISTICAL TABLES AND FORM SAMPLE
Annexes
Annex 1: Percentage of returnees’ secondary displacement in the assessed area, IOM Village Assessment in Unity Report, Sudan July 2009.........................................................................................................................61 Annex 2: Migration routes in Unity, IOM Village Assessment in Unity Report, Sudan July 2009.................61 Annex 3: Percentage of water sources in the assessed area, IOM Village Assessment in Unity Report, Sudan July 2009 ..........................................................................................................................................................62 Annex 4: Correlation between functioning and non-functioning hand pumps, IOM Village Assessment in Unity Report, Sudan July 2009.........................................................................................................................62 Annex 5: Purified water sources in the area assessed, IOM Village Assessment in Unity Report, Sudan July 2009 ..................................................................................................................................................................62 Annex 6: Reasons for non-functioning schools, IOM Village Assessment in Unity Report, Sudan July 2009..........................................................................................................................................................................63 Annex 7: Average walking distance to access education, IOM Village Assessment in Unity Report, Sudan July 2009 ..........................................................................................................................................................63 Annex 8: Gender disaggregated school enrolment, IOM Village Assessment in Unity Report, Sudan July 2009 ..................................................................................................................................................................63 Annex 9: Construction Materials of schools, IOM Village Assessment in Unity Report, Sudan July 2009....64 Annex 10: Percentage of education assistance provided to supported schools, IOM Village Assessment in Unity Report, Sudan July 2009.........................................................................................................................64 Annex 11: Average walking distance to health facilities, IOM Village Assessment in Unity Report, Sudan July 2009 ..........................................................................................................................................................64 Annex 12: External assistance for health facilities in percentage, IOM Village Assessment in Unity Report, Sudan July 2009 ...............................................................................................................................................65 Annex 13: Heath staff in health care facilities assessed in percentages, IOM Village Assessment in Unity Report, Sudan July 2009...................................................................................................................................65 Annex 14: Percentage of pre-conflict sources of food clustered by county, IOM Village Assessment in Unity Report, Sudan July 2009...................................................................................................................................65 Annex 15: Food assistance per county, IOM Village Assessment in Unity Report, Sudan July 2009 ............66 Annex 16: Reasons for conflict in Unity State .................................................................................................66 Annex 17: .........................................................................................................................................................66 Annex 18: .........................................................................................................................................................67 Annex 16: Modified Village Assessment Form, IOM Village Assessment in Unity Report, Sudan July 2009..........................................................................................................................................................................68 Annex 17: GPS Coordinates for village facilities, IOM Village Assessment in Unity Report, Sudan July 2009..........................................................................................................................................................................74
61
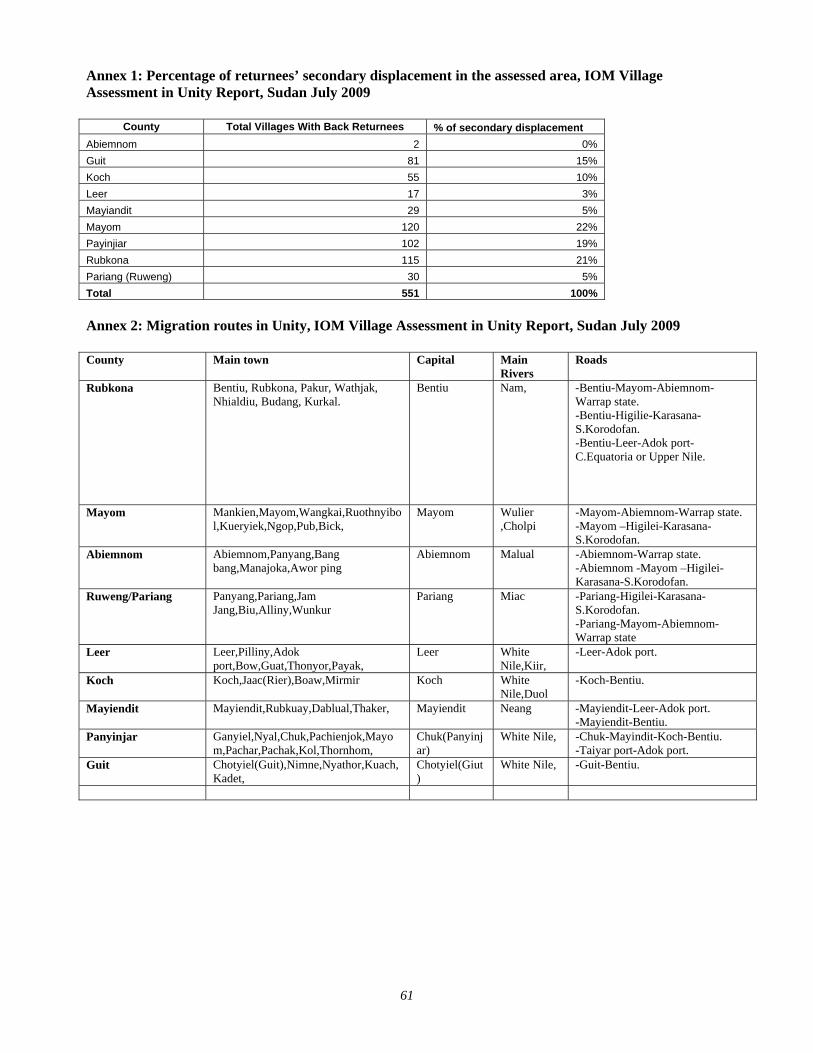
Annex 1: Percentage of returnees’ secondary displacement in the assessed area, IOM Village Assessment in Unity Report, Sudan July 2009
County Total Villages With Back Returnees % of secondary displacement Abiemnom 2 0% Guit 81 15% Koch 55 10% Leer 17 3% Mayiandit 29 5% Mayom 120 22% Payinjiar 102 19% Rubkona 115 21% Pariang (Ruweng) 30 5% Total 551 100% Annex 2: Migration routes in Unity, IOM Village Assessment in Unity Report, Sudan July 2009 County Main town Capital Main
Rivers Roads
Rubkona Bentiu, Rubkona, Pakur, Wathjak, Nhialdiu, Budang, Kurkal.
Bentiu Nam, -Bentiu-Mayom-Abiemnom-Warrap state. -Bentiu-Higilie-Karasana-S.Korodofan. -Bentiu-Leer-Adok port-C.Equatoria or Upper Nile.
Mayom Mankien,Mayom,Wangkai,Ruothnyibol,Kueryiek,Ngop,Pub,Bick,
Mayom Wulier ,Cholpi
-Mayom-Abiemnom-Warrap state. -Mayom –Higilei-Karasana-S.Korodofan.
Abiemnom Abiemnom,Panyang,Bang bang,Manajoka,Awor ping
Abiemnom Malual -Abiemnom-Warrap state. -Abiemnom -Mayom –Higilei-Karasana-S.Korodofan.
Ruweng/Pariang Panyang,Pariang,Jam Jang,Biu,Alliny,Wunkur
Pariang Miac -Pariang-Higilei-Karasana-S.Korodofan. -Pariang-Mayom-Abiemnom-Warrap state
Leer Leer,Pilliny,Adok port,Bow,Guat,Thonyor,Payak,
Leer White Nile,Kiir,
-Leer-Adok port.
Koch Koch,Jaac(Rier),Boaw,Mirmir Koch White Nile,Duol
-Koch-Bentiu.
Mayiendit
Mayiendit,Rubkuay,Dablual,Thaker, Mayiendit Neang -Mayiendit-Leer-Adok port. -Mayiendit-Bentiu.
Panyinjar
Ganyiel,Nyal,Chuk,Pachienjok,Mayom,Pachar,Pachak,Kol,Thornhom,
Chuk(Panyinjar)
White Nile, -Chuk-Mayindit-Koch-Bentiu. -Taiyar port-Adok port.
Guit
Chotyiel(Guit),Nimne,Nyathor,Kuach,Kadet,
Chotyiel(Giut)
White Nile, -Guit-Bentiu.
62
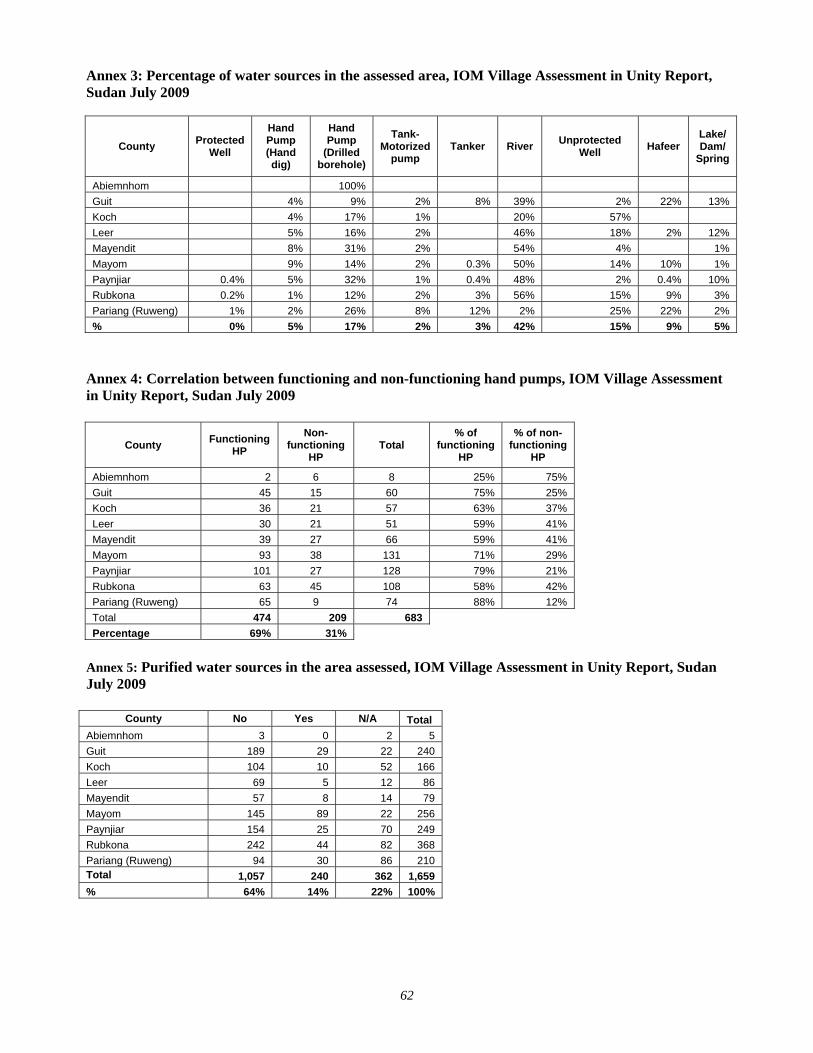
Annex 3: Percentage of water sources in the assessed area, IOM Village Assessment in Unity Report, Sudan July 2009
County Protected Well
Hand Pump (Hand dig)
Hand Pump
(Drilled borehole)
Tank-Motorized
pump Tanker River Unprotected
Well Hafeer Lake/ Dam/
Spring
Abiemnhom 100% Guit 4% 9% 2% 8% 39% 2% 22% 13% Koch 4% 17% 1% 20% 57% Leer 5% 16% 2% 46% 18% 2% 12% Mayendit 8% 31% 2% 54% 4% 1% Mayom 9% 14% 2% 0.3% 50% 14% 10% 1% Paynjiar 0.4% 5% 32% 1% 0.4% 48% 2% 0.4% 10% Rubkona 0.2% 1% 12% 2% 3% 56% 15% 9% 3% Pariang (Ruweng) 1% 2% 26% 8% 12% 2% 25% 22% 2% % 0% 5% 17% 2% 3% 42% 15% 9% 5%
Annex 4: Correlation between functioning and non-functioning hand pumps, IOM Village Assessment in Unity Report, Sudan July 2009
County Functioning HP
Non-functioning
HP Total
% of functioning
HP
% of non-functioning
HP
Abiemnhom 2 6 8 25% 75% Guit 45 15 60 75% 25% Koch 36 21 57 63% 37% Leer 30 21 51 59% 41% Mayendit 39 27 66 59% 41% Mayom 93 38 131 71% 29% Paynjiar 101 27 128 79% 21% Rubkona 63 45 108 58% 42% Pariang (Ruweng) 65 9 74 88% 12% Total 474 209 683 Percentage 69% 31%
Annex 5: Purified water sources in the area assessed, IOM Village Assessment in Unity Report, Sudan July 2009
County No Yes N/A Total Abiemnhom 3 0 2 5 Guit 189 29 22 240 Koch 104 10 52 166 Leer 69 5 12 86 Mayendit 57 8 14 79 Mayom 145 89 22 256 Paynjiar 154 25 70 249 Rubkona 242 44 82 368 Pariang (Ruweng) 94 30 86 210 Total 1,057 240 362 1,659 % 64% 14% 22% 100%
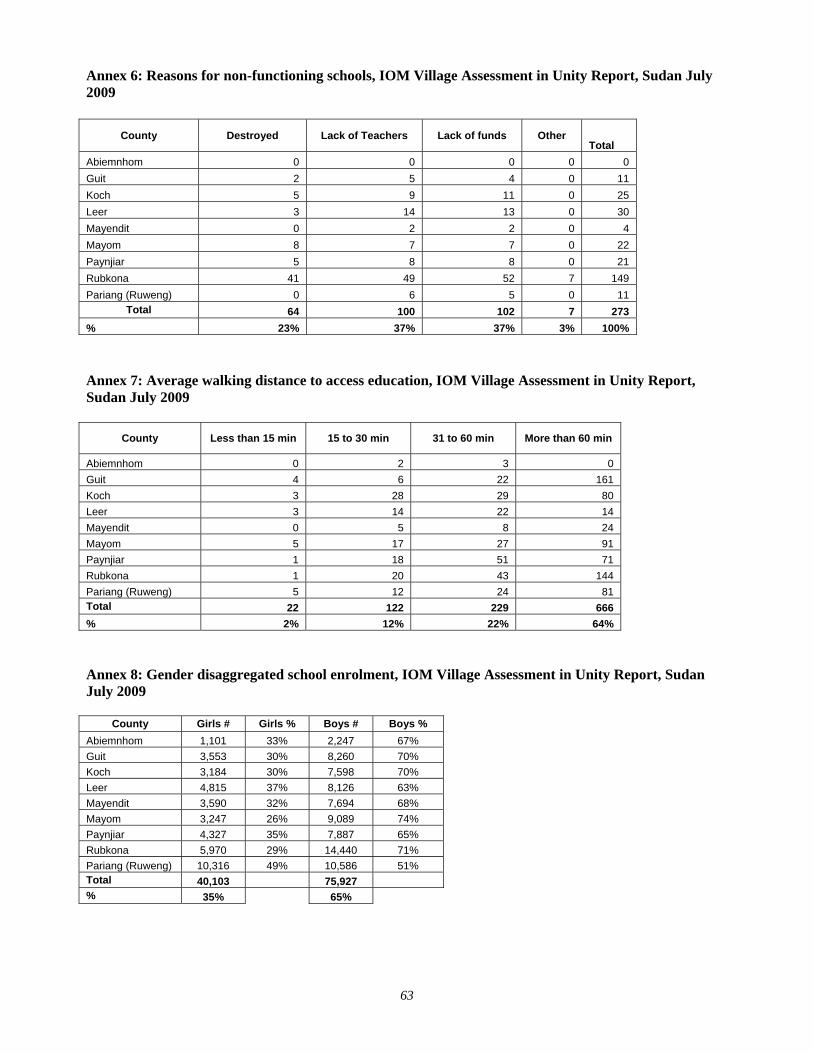
63
Annex 6: Reasons for non-functioning schools, IOM Village Assessment in Unity Report, Sudan July 2009
County Destroyed Lack of Teachers Lack of funds Other Total
Abiemnhom 0 0 0 0 0 Guit 2 5 4 0 11 Koch 5 9 11 0 25 Leer 3 14 13 0 30 Mayendit 0 2 2 0 4 Mayom 8 7 7 0 22 Paynjiar 5 8 8 0 21 Rubkona 41 49 52 7 149 Pariang (Ruweng) 0 6 5 0 11
Total 64 100 102 7 273 % 23% 37% 37% 3% 100% Annex 7: Average walking distance to access education, IOM Village Assessment in Unity Report, Sudan July 2009
County Less than 15 min 15 to 30 min 31 to 60 min More than 60 min
Abiemnhom 0 2 3 0 Guit 4 6 22 161 Koch 3 28 29 80 Leer 3 14 22 14 Mayendit 0 5 8 24 Mayom 5 17 27 91 Paynjiar 1 18 51 71 Rubkona 1 20 43 144 Pariang (Ruweng) 5 12 24 81 Total 22 122 229 666 % 2% 12% 22% 64% Annex 8: Gender disaggregated school enrolment, IOM Village Assessment in Unity Report, Sudan July 2009
County Girls # Girls % Boys # Boys % Abiemnhom 1,101 33% 2,247 67% Guit 3,553 30% 8,260 70% Koch 3,184 30% 7,598 70% Leer 4,815 37% 8,126 63% Mayendit 3,590 32% 7,694 68% Mayom 3,247 26% 9,089 74% Paynjiar 4,327 35% 7,887 65% Rubkona 5,970 29% 14,440 71% Pariang (Ruweng) 10,316 49% 10,586 51% Total 40,103 75,927 % 35% 65%
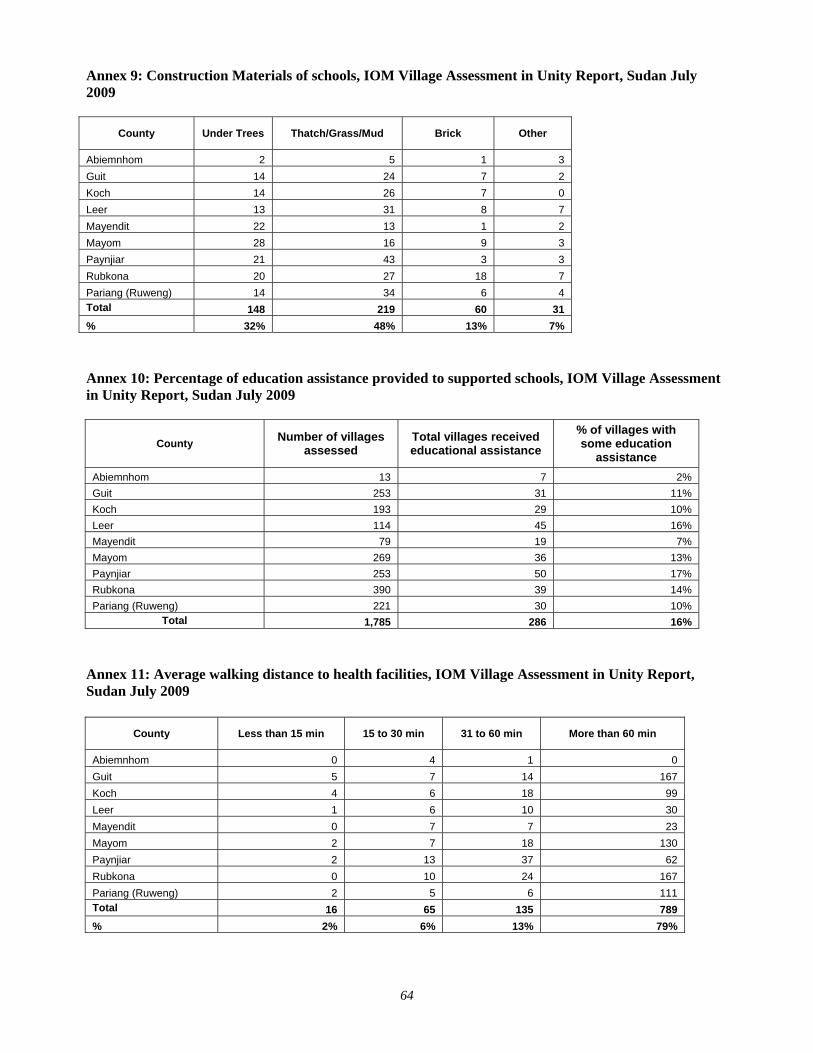
64
Annex 9: Construction Materials of schools, IOM Village Assessment in Unity Report, Sudan July 2009
County Under Trees Thatch/Grass/Mud Brick Other
Abiemnhom 2 5 1 3 Guit 14 24 7 2 Koch 14 26 7 0 Leer 13 31 8 7 Mayendit 22 13 1 2 Mayom 28 16 9 3 Paynjiar 21 43 3 3 Rubkona 20 27 18 7 Pariang (Ruweng) 14 34 6 4 Total 148 219 60 31 % 32% 48% 13% 7% Annex 10: Percentage of education assistance provided to supported schools, IOM Village Assessment in Unity Report, Sudan July 2009
County Number of villages assessed
Total villages received educational assistance
% of villages with some education
assistance Abiemnhom 13 7 2% Guit 253 31 11% Koch 193 29 10% Leer 114 45 16% Mayendit 79 19 7% Mayom 269 36 13% Paynjiar 253 50 17% Rubkona 390 39 14% Pariang (Ruweng) 221 30 10%
Total 1,785 286 16% Annex 11: Average walking distance to health facilities, IOM Village Assessment in Unity Report, Sudan July 2009
County Less than 15 min 15 to 30 min 31 to 60 min More than 60 min
Abiemnhom 0 4 1 0 Guit 5 7 14 167 Koch 4 6 18 99 Leer 1 6 10 30 Mayendit 0 7 7 23 Mayom 2 7 18 130 Paynjiar 2 13 37 62 Rubkona 0 10 24 167 Pariang (Ruweng) 2 5 6 111 Total 16 65 135 789 % 2% 6% 13% 79%
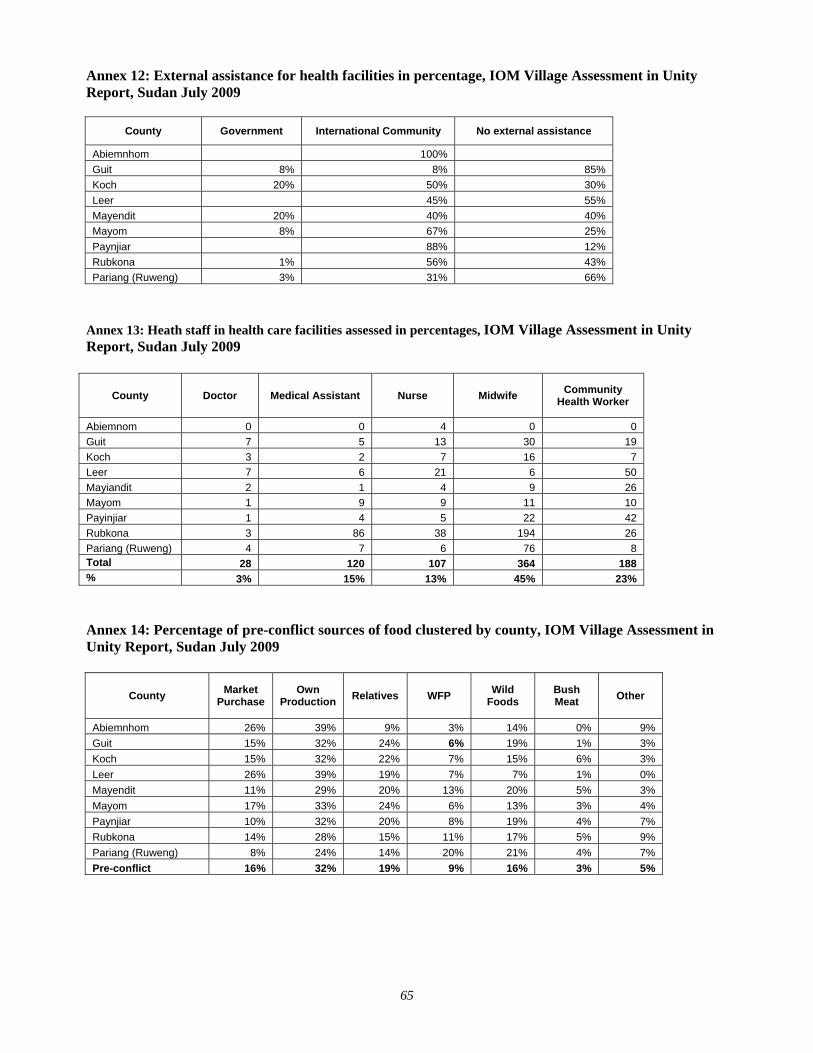
65
Annex 12: External assistance for health facilities in percentage, IOM Village Assessment in Unity Report, Sudan July 2009
County Government International Community No external assistance
Abiemnhom 100% Guit 8% 8% 85% Koch 20% 50% 30% Leer 45% 55% Mayendit 20% 40% 40% Mayom 8% 67% 25% Paynjiar 88% 12% Rubkona 1% 56% 43% Pariang (Ruweng) 3% 31% 66%
Annex 13: Heath staff in health care facilities assessed in percentages, IOM Village Assessment in Unity Report, Sudan July 2009
County Doctor Medical Assistant Nurse Midwife Community Health Worker
Abiemnom 0 0 4 0 0 Guit 7 5 13 30 19 Koch 3 2 7 16 7 Leer 7 6 21 6 50 Mayiandit 2 1 4 9 26 Mayom 1 9 9 11 10 Payinjiar 1 4 5 22 42 Rubkona 3 86 38 194 26 Pariang (Ruweng) 4 7 6 76 8 Total 28 120 107 364 188 % 3% 15% 13% 45% 23% Annex 14: Percentage of pre-conflict sources of food clustered by county, IOM Village Assessment in Unity Report, Sudan July 2009
County Market Purchase
Own Production Relatives WFP Wild
Foods Bush Meat Other
Abiemnhom 26% 39% 9% 3% 14% 0% 9% Guit 15% 32% 24% 6% 19% 1% 3% Koch 15% 32% 22% 7% 15% 6% 3% Leer 26% 39% 19% 7% 7% 1% 0% Mayendit 11% 29% 20% 13% 20% 5% 3% Mayom 17% 33% 24% 6% 13% 3% 4% Paynjiar 10% 32% 20% 8% 19% 4% 7% Rubkona 14% 28% 15% 11% 17% 5% 9% Pariang (Ruweng) 8% 24% 14% 20% 21% 4% 7% Pre-conflict 16% 32% 19% 9% 16% 3% 5%
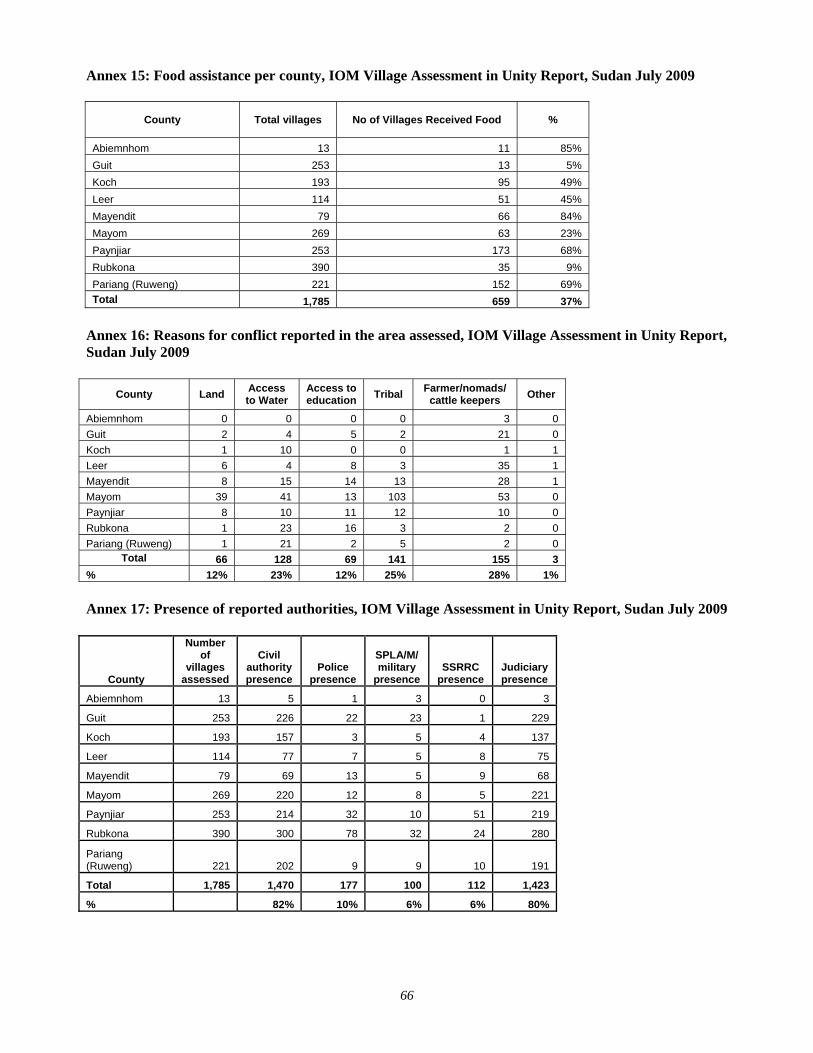
66
Annex 15: Food assistance per county, IOM Village Assessment in Unity Report, Sudan July 2009
County Total villages No of Villages Received Food %
Abiemnhom 13 11 85% Guit 253 13 5% Koch 193 95 49% Leer 114 51 45% Mayendit 79 66 84% Mayom 269 63 23% Paynjiar 253 173 68% Rubkona 390 35 9% Pariang (Ruweng) 221 152 69% Total 1,785 659 37%
Annex 16: Reasons for conflict reported in the area assessed, IOM Village Assessment in Unity Report, Sudan July 2009
County Land Access to Water
Access to education Tribal Farmer/nomads/
cattle keepers Other
Abiemnhom 0 0 0 0 3 0 Guit 2 4 5 2 21 0 Koch 1 10 0 0 1 1 Leer 6 4 8 3 35 1 Mayendit 8 15 14 13 28 1 Mayom 39 41 13 103 53 0 Paynjiar 8 10 11 12 10 0 Rubkona 1 23 16 3 2 0 Pariang (Ruweng) 1 21 2 5 2 0
Total 66 128 69 141 155 3 % 12% 23% 12% 25% 28% 1% Annex 17: Presence of reported authorities, IOM Village Assessment in Unity Report, Sudan July 2009
County
Number of
villages assessed
Civil authority presence
Police presence
SPLA/M/ military
presence SSRRC
presence Judiciary presence
Abiemnhom 13 5 1 3 0 3
Guit 253 226 22 23 1 229
Koch 193 157 3 5 4 137
Leer 114 77 7 5 8 75
Mayendit 79 69 13 5 9 68
Mayom 269 220 12 8 5 221
Paynjiar 253 214 32 10 51 219
Rubkona 390 300 78 32 24 280
Pariang (Ruweng) 221 202 9 9 10 191
Total 1,785 1,470 177 100 112 1,423
% 82% 10% 6% 6% 80%
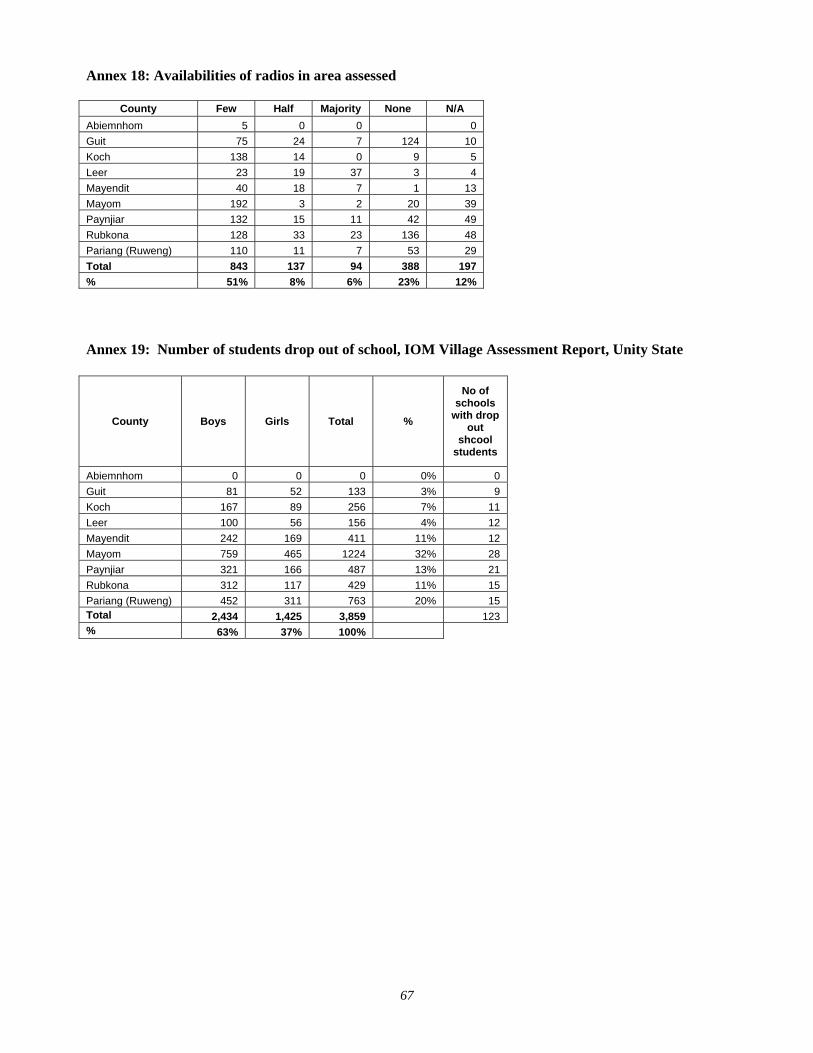
67
Annex 18: Availabilities of radios in area assessed
County Few Half Majority None N/A Abiemnhom 5 0 0 0 Guit 75 24 7 124 10 Koch 138 14 0 9 5 Leer 23 19 37 3 4 Mayendit 40 18 7 1 13 Mayom 192 3 2 20 39 Paynjiar 132 15 11 42 49 Rubkona 128 33 23 136 48 Pariang (Ruweng) 110 11 7 53 29 Total 843 137 94 388 197 % 51% 8% 6% 23% 12% Annex 19: Number of students drop out of school, IOM Village Assessment Report, Unity State
County Boys Girls Total %
No of schools
with drop out
shcool students
Abiemnhom 0 0 0 0% 0 Guit 81 52 133 3% 9 Koch 167 89 256 7% 11 Leer 100 56 156 4% 12 Mayendit 242 169 411 11% 12 Mayom 759 465 1224 32% 28 Paynjiar 321 166 487 13% 21 Rubkona 312 117 429 11% 15 Pariang (Ruweng) 452 311 763 20% 15 Total 2,434 1,425 3,859 123 % 63% 37% 100%
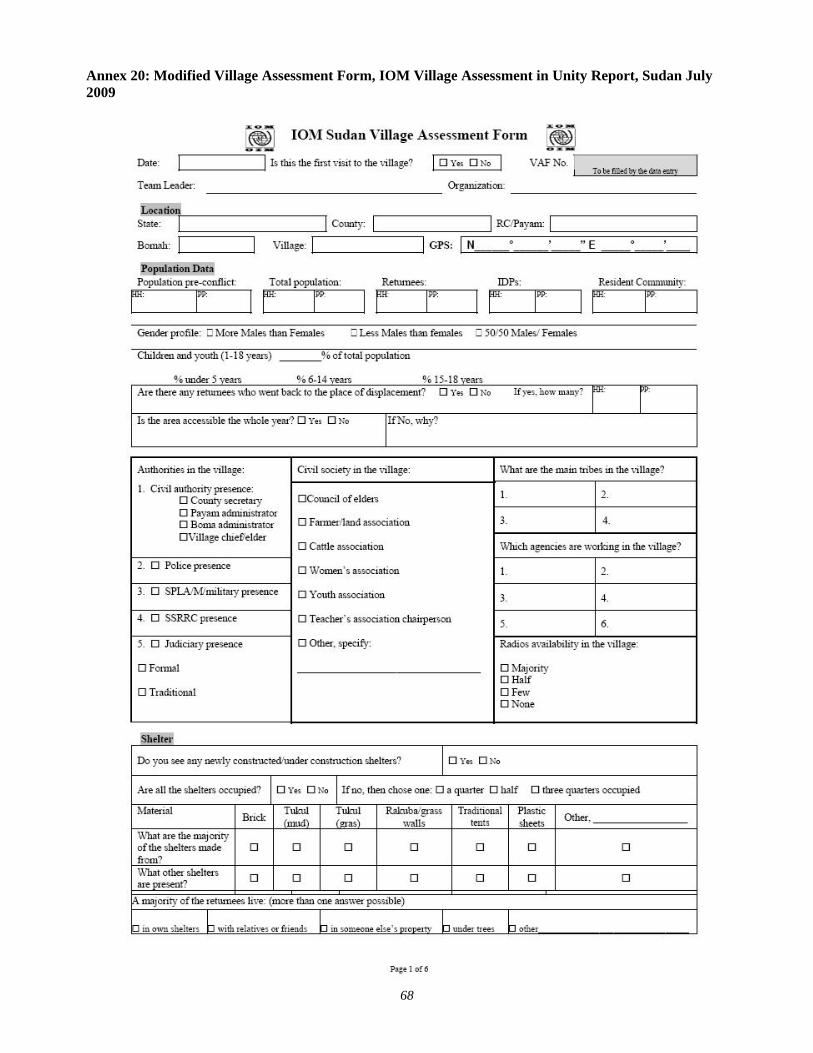
68
Annex 20: Modified Village Assessment Form, IOM Village Assessment in Unity Report, Sudan July 2009
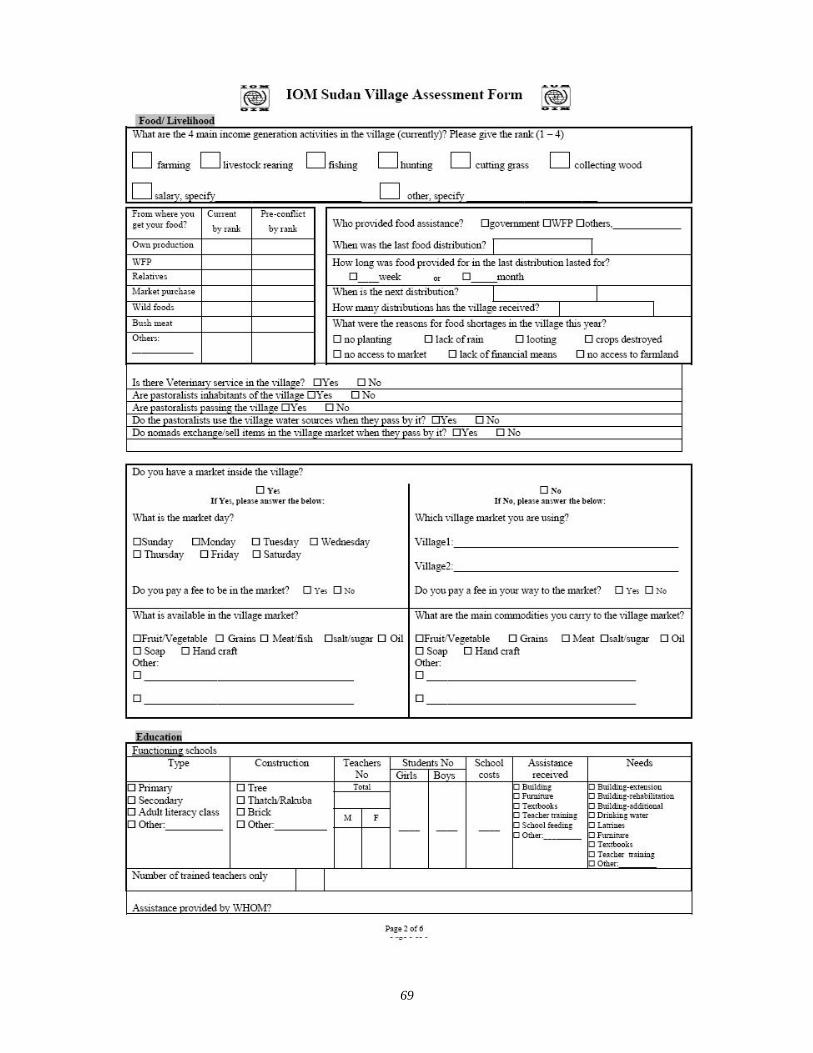
69
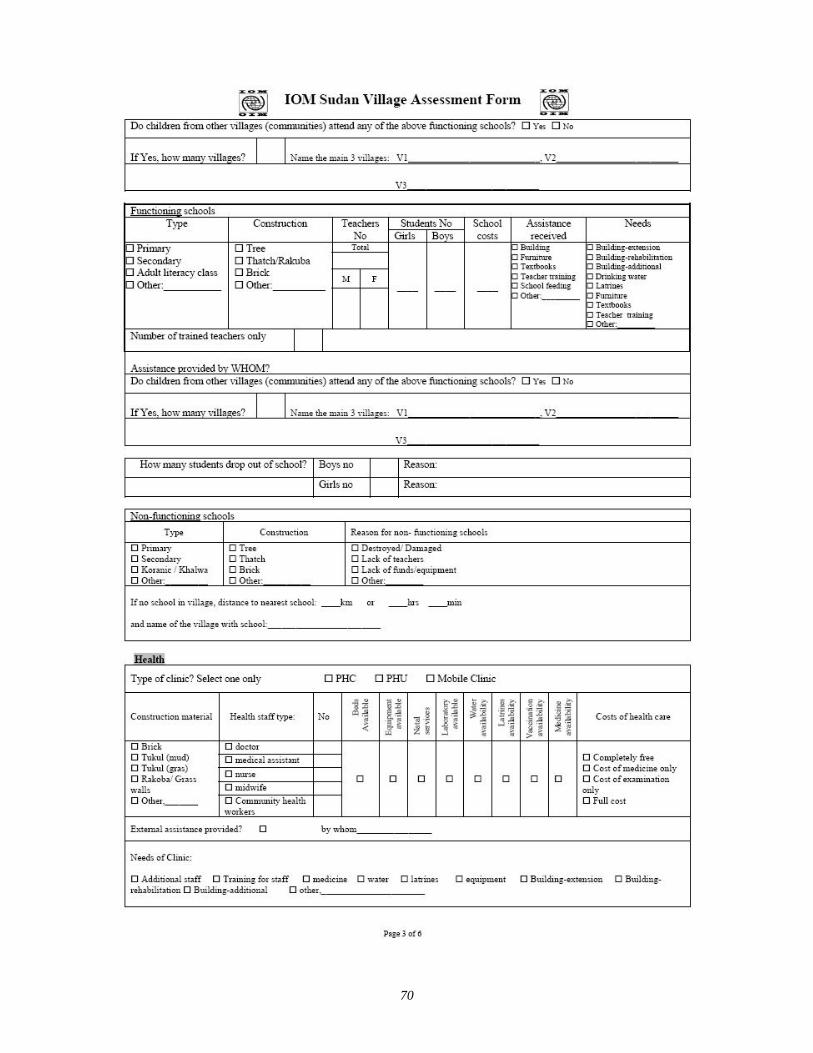
70
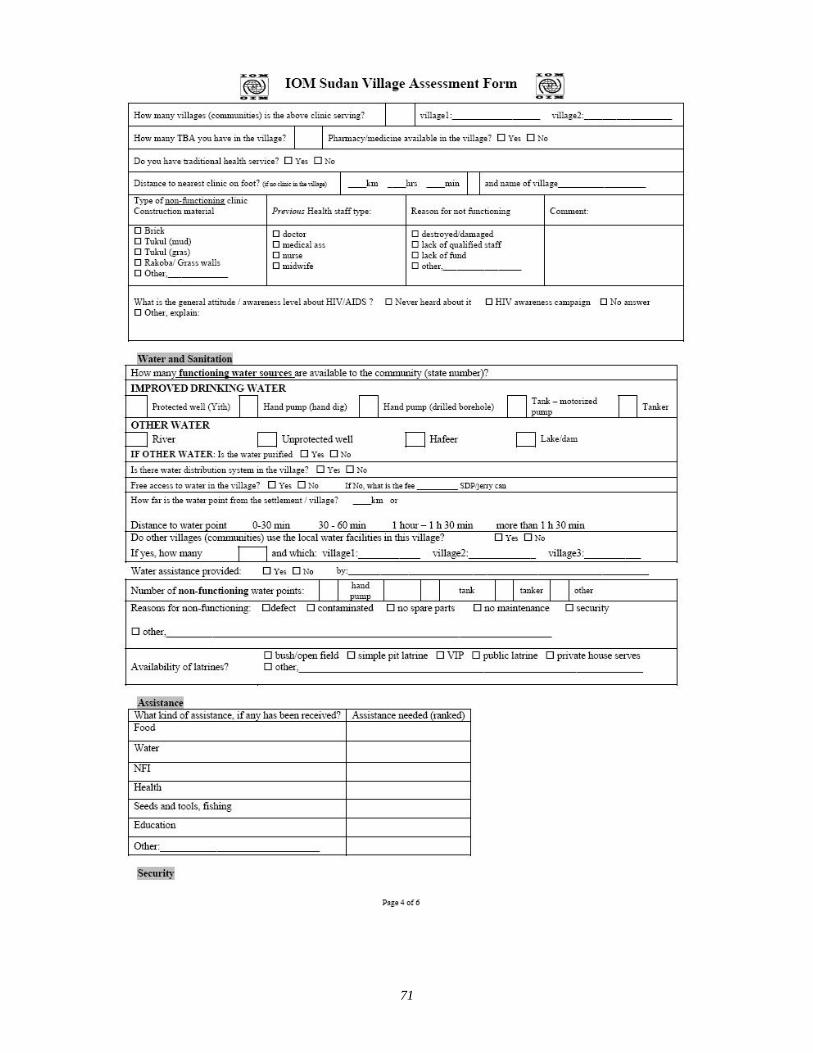
71
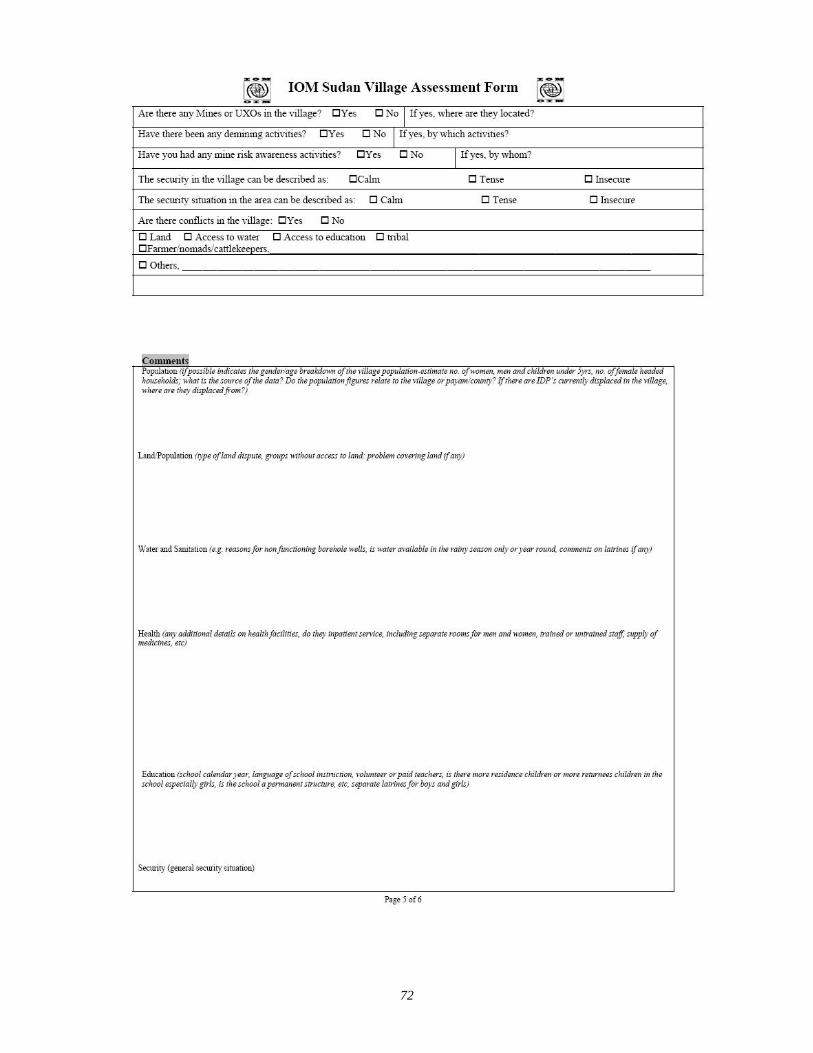
72
73
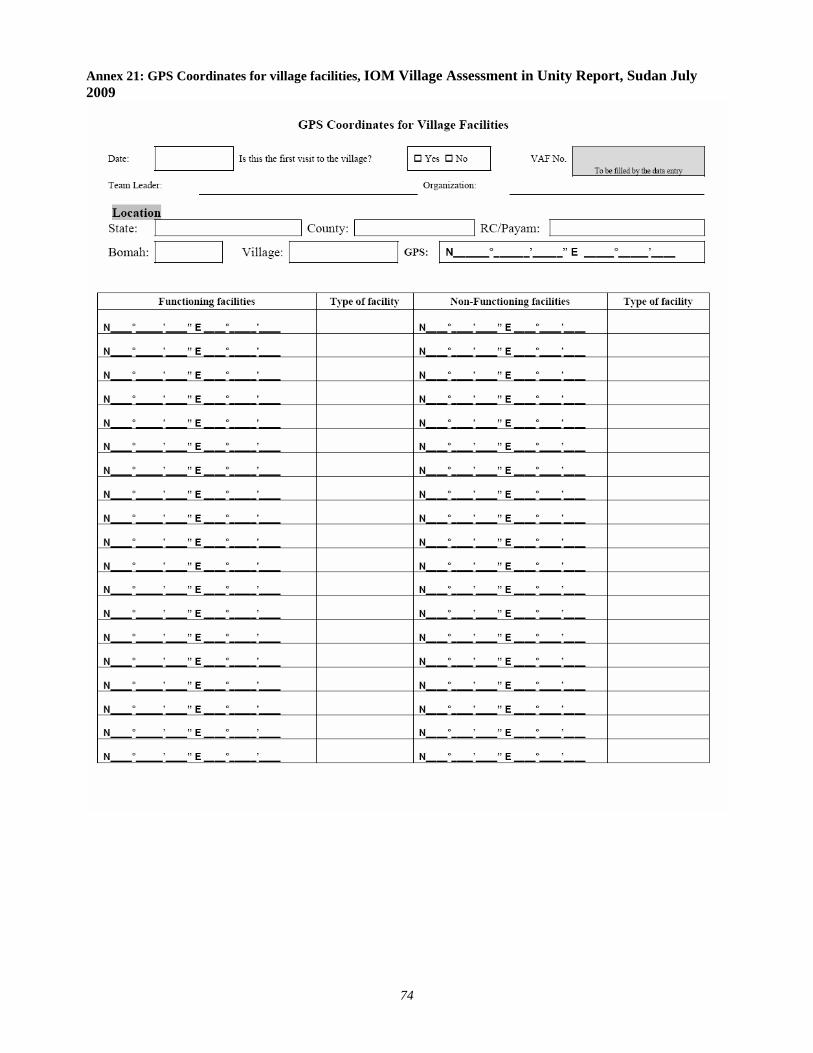
74
Annex 21: GPS Coordinates for village facilities, IOM Village Assessment in Unity Report, Sudan July 2009


![Young Intellectual Nomads: A Generation of Post-Communist Returnees and No-Returnees after Training in the West Pal Tamas[ HAS, Budapest]](https://static.fdocuments.in/doc/165x107/56649cc35503460f9498b11b/young-intellectual-nomads-a-generation-of-post-communist-returnees-and-no-returnees.jpg)

