
State-Profile Latest 30.09.08 · Sr. Secondary Schools 2001-02 127321 85263 145246 30229 2002-03...
137
E State Profile S.NO. States/UTs Page No. 1 Andhra Pradesh E. 1 - E. 4 2 Arunachal Pradesh E. 5 – E 8 3 Assam E 9 – E12 4 Bihar E13 – E.17 5 Chhattisgarh E.18 – E.21 6 Goa E.22 – E.25 7 Gujarat E.26 – E.29 8 Haryana E.30 – E.33 9 Himachal Pradesh E.34 – E.37 10 Jammu & Kashmir E.38 – E.41 11 Jharkhand E.42 – E.45 12 Karnataka E.46 -- E.49 13 Kerala E.50 – E.53 14 Madhya Pradesh E.54 – E.58 15 Maharashtra E.59 – E.63 16 Manipur E.64 – E.67 17 Meghalaya E.68 – E.71 18 Mizoram E.72 – E.75 19 Nagaland E.76 – E.79 20 Orissa E.80 – E.83 21 Punjab E.84 – E.87 22 Rajasthan E.88 – E.91 23 Sikkim E.92 – E.95 24 Tamil Nadu E.96 – E.99 25 Tripura E.100 – E.103 26 Uttar Pradesh E.104 – E.108 27 Uttarakhand E.109 – E.112 28 West Bengal E.113 – E.116 29 A&N Islands E.117 – E 120 30 Chandigarh E.121 – E.123 31 D&N Haveli E.124 – E.125 32 Daman & Diu E.126 – E128 33 Delhi E.129 – E.131 34 Lakshadweep E.132 – E.133 35 Puducherry E.134 – E.136
Transcript of State-Profile Latest 30.09.08 · Sr. Secondary Schools 2001-02 127321 85263 145246 30229 2002-03...
E
State Profile
S.NO. States/UTs Page No.
1 Andhra Pradesh E. 1 - E. 4 2 Arunachal Pradesh E. 5 – E 8 3 Assam E 9 – E12 4 Bihar E13 – E.17 5 Chhattisgarh E.18 – E.21 6 Goa E.22 – E.25 7 Gujarat E.26 – E.29 8 Haryana E.30 – E.33 9 Himachal Pradesh E.34 – E.37
10 Jammu & Kashmir E.38 – E.41 11 Jharkhand E.42 – E.45 12 Karnataka E.46 -- E.49 13 Kerala E.50 – E.53 14 Madhya Pradesh E.54 – E.58 15 Maharashtra E.59 – E.63 16 Manipur E.64 – E.67 17 Meghalaya E.68 – E.71 18 Mizoram E.72 – E.75 19 Nagaland E.76 – E.79 20 Orissa E.80 – E.83 21 Punjab E.84 – E.87 22 Rajasthan E.88 – E.91 23 Sikkim E.92 – E.95 24 Tamil Nadu E.96 – E.99 25 Tripura E.100 – E.103 26 Uttar Pradesh E.104 – E.108 27 Uttarakhand E.109 – E.112 28 West Bengal E.113 – E.116 29 A&N Islands E.117 – E 120 30 Chandigarh E.121 – E.123 31 D&N Haveli E.124 – E.125 32 Daman & Diu E.126 – E128 33 Delhi E.129 – E.131 34 Lakshadweep E.132 – E.133 35 Puducherry E.134 – E.136

E.1
ANDHRA PRADESH
Total Population: 7, 62, 10,007 (as per 2001 Census) Estimated 2005 Population: 79852 (in 000) Literacy Rates: Total : 60.47 Male : 70.32
Female : 50.43
A: School Education
No. of Institutions: (Figures in numbers) Number of Schools Years Primary Upper Primary Secondary Sr. Secondary
2001-02 58249 14472 11464 2791 2002-03 61167 15054 12371 2861 2003-04 63897 15215 13160 3267 2004-05 61680 16667 14342 3368 2005-06 62159 17290 15437 3810
Enrolment (Figures in numbers) Enrolment in Classes Years
I-V VI-VIII IX-X XI-XII2001-02 8626241 3089951 1355406 10896612002-03 8615608 3366950 1463352 11055712003-04 7975659 3502469 1596861 12946172004-05 7692411 3643030 1768327 13917222005-06 7391922 3731018 1903449 1384886
Gross Enrolment Ratio Gross Enrolment Ratio in Classes Years
I-V VI-VIII IX-XII 2001-02 103.97 52.28 34.22 2002-03 95.93 63.12 40.12 2003-04 87.72 64.86 44.61 2004-05 96.71 71.76 47.66 2005-06 94.87 73.91 48.93
Drop-out Rates Drop-out Rates in Classes Years
I-V I-VIII I-X 2001-02 43.03 63.09 70.12 2002-03 41.71 59.94 68.95 2003-04 42.61 59.79 66.70 2004-05 31.95 59.36 63.69 2005-06 24.75 59.07 63.67

E.2
No. of Teachers (Figures in number)
Number of Teachers in Years Primary
Schools Upper Primary
Schools Secondary
Schools Sr. Secondary
Schools
2001-02 127321 85263 145246 30229 2002-03 179961 108222 142149 37271 2003-04 172601 100365 140826 39830 2004-05 166935 103985 140399 43960 2005-06 166790 106215 142544 44323
Pupil Teacher Ratio
Pupil Teacher Ratio in Years Primary
Schools Upper Primary
Schools Secondary
Schools Sr. Secondary
Schools
2001-02 41 39 34 38 2002-03 33 30 29 32 2003-04 35 31 31 34 2004-05 33 31 33 33 2005-06 32 30 34 33
Gender Parity Index
Gender Parity Index in Classes Years I-V VI-VIII IX-XII
2001-02 0.99 0.86 0.75 2002-03 1.01 0.92 0.79 2003-04 1.01 0.93 0.81 2004-05 1.01 0.95 0.82 2005-06 1.01 0.96 0.85
Number of Girls per 100 Boys
Number of Girls per 100 Boys in Classes Years I-V VI-VIII IX-XII
2001-02 97 84 71 2002-03 97 86 73 2003-04 97 88 75 2004-05 98 90 77 2005-06 98 91 80
E.3
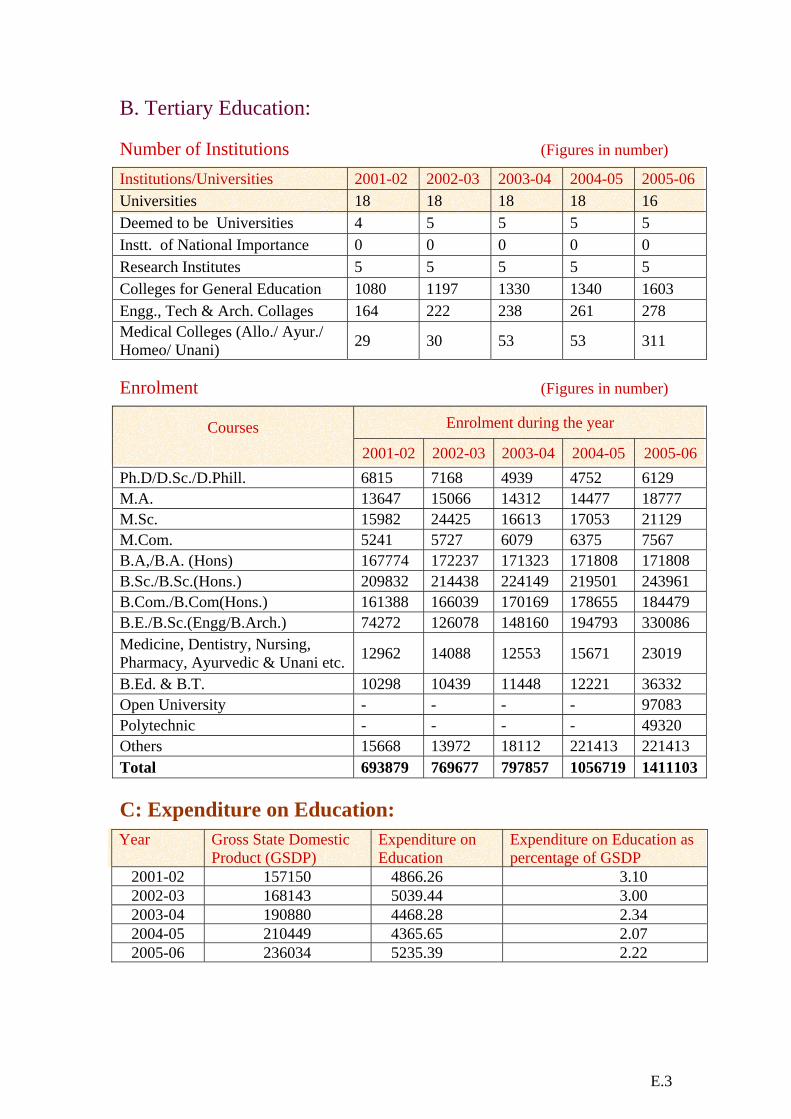
B. Tertiary Education: Number of Institutions (Figures in number) Institutions/Universities 2001-02 2002-03 2003-04 2004-05 2005-06 Universities 18 18 18 18 16 Deemed to be Universities 4 5 5 5 5 Instt. of National Importance 0 0 0 0 0 Research Institutes 5 5 5 5 5 Colleges for General Education 1080 1197 1330 1340 1603 Engg., Tech & Arch. Collages 164 222 238 261 278 Medical Colleges (Allo./ Ayur./ Homeo/ Unani) 29 30 53 53 311
Enrolment (Figures in number)
Enrolment during the year Courses 2001-02 2002-03 2003-04 2004-05 2005-06
Ph.D/D.Sc./D.Phill. 6815 7168 4939 4752 6129 M.A. 13647 15066 14312 14477 18777 M.Sc. 15982 24425 16613 17053 21129 M.Com. 5241 5727 6079 6375 7567 B.A,/B.A. (Hons) 167774 172237 171323 171808 171808 B.Sc./B.Sc.(Hons.) 209832 214438 224149 219501 243961 B.Com./B.Com(Hons.) 161388 166039 170169 178655 184479 B.E./B.Sc.(Engg/B.Arch.) 74272 126078 148160 194793 330086 Medicine, Dentistry, Nursing, Pharmacy, Ayurvedic & Unani etc. 12962 14088 12553 15671 23019
B.Ed. & B.T. 10298 10439 11448 12221 36332 Open University - - - - 97083 Polytechnic - - - - 49320 Others 15668 13972 18112 221413 221413 Total 693879 769677 797857 1056719 1411103
C: Expenditure on Education: Year Gross State Domestic
Product (GSDP) Expenditure on Education
Expenditure on Education as percentage of GSDP
2001-02 157150 4866.26 3.10 2002-03 168143 5039.44 3.00 2003-04 190880 4468.28 2.34 2004-05 210449 4365.65 2.07 2005-06 236034 5235.39 2.22

E.4
D. District-wise Statistics-2005-06 No. of Schools Enrolment Teachers
S.N
o.
District Name PPS PS MS
HS/H
SS/
INTE
RMED
IATE
I-V VI-VIII IX-XII PS MS
HS/H
SS/
INTE
RMED
IATE
1 2 3 4 5 6 7 8 9 10 11 12 1 Sirkakulam 0 2587 845 549 223359 118875 105212 4815 4673 4434 2 Vizianagaram 0 2379 497 458 223239 96953 84512 5826 3264 4056 3 Visakhapatnam 0 3080 648 738 322724 168223 161303 6385 3460 8070 4 East Godavari 0 3208 897 992 388590 219828 192055 8633 5244 9822 5 West Godavari 0 2545 496 661 276267 153881 136994 7041 3058 6977 6 Krishna 0 2507 836 747 319792 160976 172001 6814 5146 9073 7 Guntur 0 2883 585 780 332427 154607 153345 7745 3164 9004 8 Prakasam 0 2939 571 631 291961 114268 96898 7210 3306 6066 9 Nellore 0 2924 717 624 227001 110904 108091 7011 3956 6070 10 Chittoor 0 4499 1014 960 332528 188073 158891 9692 5964 8792 11 Cudappah 0 3203 662 778 278964 132612 105678 8008 4102 7347 12 Ananthpur 0 3093 981 710 344249 185485 145903 7273 5104 6458 13 Kurnool 0 1993 963 678 394515 160820 125456 6392 6036 6819 14 Mehbubnagar 0 2862 985 878 394260 168762 127840 7362 6113 7574 15 Rangareddy 0 2438 819 1373 481480 239624 223288 9599 6314 14855 16 Hyderabad 0 1405 470 1350 421701 221619 240232 9219 4134 16071 17 Medak 0 2035 705 714 293015 138571 102777 4597 3961 5941 18 Nizamabad 0 1769 637 706 250592 123510 96654 5021 4412 5941 19 Adilabad 0 3141 814 750 294210 150576 114683 6874 4758 6420 20 Karim Nagar 0 2610 961 1261 363278 208922 184239 8599 6646 10650 21 Warangal 0 2846 817 1166 353373 187652 174590 8870 5427 10758 22 Khammam 0 2397 770 689 243487 141914 117970 5717 4066 6514 23 Nalgonda 0 2816 600 1054 340910 184363 159723 8087 3907 9155
Total 0 62159 17290 19247 7391922 3731018 3288335 166790 106215 186867 PPS – Pre-Primary Schools PS – Primary Schools MS – Middle Schools HS/HSS/Intermediate - High School/ Hr. Secondary Schools/ Intermediate Schools
E.5
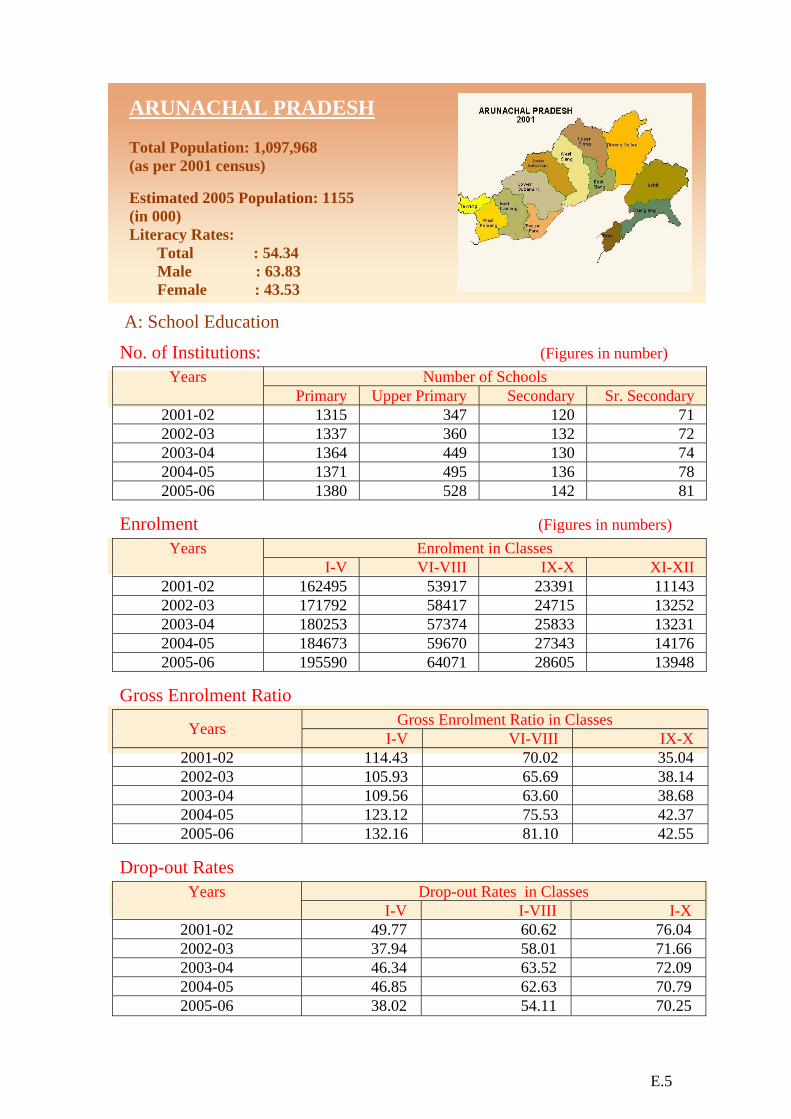
ARUNACHAL PRADESH
Total Population: 1,097,968 (as per 2001 census) Estimated 2005 Population: 1155 (in 000) Literacy Rates: Total : 54.34 Male : 63.83 Female : 43.53
A: School Education
No. of Institutions: (Figures in number) Number of Schools Years
Primary Upper Primary Secondary Sr. Secondary 2001-02 1315 347 120 71 2002-03 1337 360 132 72 2003-04 1364 449 130 74 2004-05 1371 495 136 78 2005-06 1380 528 142 81
Enrolment (Figures in numbers) Enrolment in Classes Years
I-V VI-VIII IX-X XI-XII 2001-02 162495 53917 23391 11143 2002-03 171792 58417 24715 13252 2003-04 180253 57374 25833 13231 2004-05 184673 59670 27343 14176 2005-06 195590 64071 28605 13948
Gross Enrolment Ratio Gross Enrolment Ratio in Classes Years I-V VI-VIII IX-X
2001-02 114.43 70.02 35.04 2002-03 105.93 65.69 38.14 2003-04 109.56 63.60 38.68 2004-05 123.12 75.53 42.37 2005-06 132.16 81.10 42.55
Drop-out Rates Drop-out Rates in Classes Years
I-V I-VIII I-X 2001-02 49.77 60.62 76.04 2002-03 37.94 58.01 71.66 2003-04 46.34 63.52 72.09 2004-05 46.85 62.63 70.79 2005-06 38.02 54.11 70.25

E.6
No. of Teachers (Figures in numbers) Number of Teachers in Years
Primary Schools
Upper Primary Schools
Secondary Schools
Sr. Secondary Schools
2001-02 3461 2676 1718 1808 2002-03 3218 2864 1895 1985 2003-04 3195 2969 1641 1841 2004-05 3630 3069 1662 1894 2005-06 3790 3494 1858 1965
Pupil Teacher Ratio
Pupil Teacher Ratio in Years Primary
Schools Upper Primary
Schools Secondary
Schools Sr. Secondary
Schools
2001-02 34 28 26 30 2002-03 27 25 27 29 2003-04 39 28 27 31
2004-05 34 30 28 31 2005-06 32 30 26 30
Gender Parity Index
Gender Parity Index in Classes Years I-V VI-VIII IX-XII
2001-02 0.83 0.89 0.73 2002-03 0.88 0.88 0.74 2003-04 0.90 0.87 0.75 2004-05 0.89 0.85 0.82 2005-06 0.90 0.85 0.78
Number of Girls per 100 Boys
Number of Girls per 100 Boys in Classes Years I-V VI-VIII IX-XII
2001-02 83 83 65 2002-03 84 85 70 2003-04 85 84 70 2004-05 85 82 70 2005-06 85 83 72

E.7
B. Tertiary Education:
Number of Institutions (Figures in number) Institutions/Universities 2001-02 2002-03 2003-04 2004-05 2005-06 Universities 1 1 1 1 1 Deemed to be Universities 0 0 0 0 1 Instt. of National Importance 0 0 0 0 0 Research Institutes 0 0 3 3 3 Colleges for General Education 7 8 10 10 10 Engg., Tech & Arch. Collages 1 1 1 1 1 Medical Colleges (Allo./ Ayur./ Homeo/ Unani)
0 0 1 1 1
Enrolment (Figures in number)
Enrolment during the year
Courses
2001-02 2002-03 2003-04 2004-05 2005-06
Ph.D/D.Sc./D.Phill. 10 35 22 35 29 M.A. 384 411 420 447 516 M.Sc. 43 46 46 55 58 M.Com. 14 16 27 36 37 B.A,/B.A. (Hons) 4400 4543 5226 4839 5756 B.Sc./B.Sc.(Hons.) 304 417 354 368 391 B.Com./B.Com(Hons.) 352 323 363 308 359 B.E./B.Sc.(Engg/B.Arch.) 396 804 337 360 672 Medicine, Dentistry, Nursing, Pharmacy, Ayurvedic & Unani etc.
0 0 72 85 90
B.Ed. & B.T. 60 60 60 60 59 Open University - - - - 00 Polytechnic - - - - 720 Others 0 0 60 152 152 Total 5963 6655 6987 6745 8839 C: Expenditure on Education: Year Gross State Domestic
Product(GSDP) Expenditure on Education
Expenditure on Education as percentage of GSDP
2001-02 2127 145.88 6.86 2002-03 2103 165.44 7.87 2003-04 2408 172.98 7.18 2004-05 2788 221.97 7.96 2005-06 2987 234.48 7.85
E.8
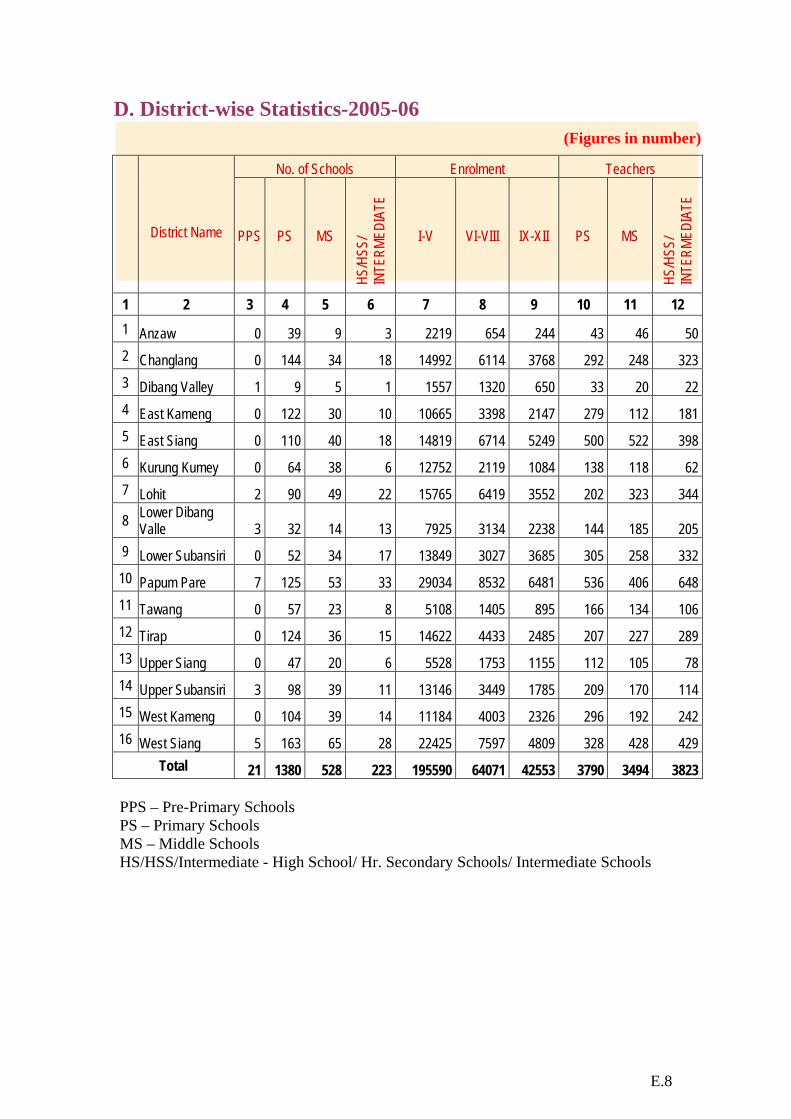
D. District-wise Statistics-2005-06 (Figures in number)
No. of Schools Enrolment Teachers
District Name PPS PS MS
HS/H
SS/
INTE
RMED
IATE
I-V VI-VIII IX-XII PS MS
HS/H
SS/
INTE
RMED
IATE
1 2 3 4 5 6 7 8 9 10 11 12 1 Anzaw 0 39 9 3 2219 654 244 43 46 50 2 Changlang 0 144 34 18 14992 6114 3768 292 248 323 3 Dibang Valley 1 9 5 1 1557 1320 650 33 20 22 4 East Kameng 0 122 30 10 10665 3398 2147 279 112 181 5 East Siang 0 110 40 18 14819 6714 5249 500 522 398 6 Kurung Kumey 0 64 38 6 12752 2119 1084 138 118 62 7 Lohit 2 90 49 22 15765 6419 3552 202 323 344
8 Lower Dibang Valle 3 32 14 13 7925 3134 2238 144 185 205
9 Lower Subansiri 0 52 34 17 13849 3027 3685 305 258 332 10 Papum Pare 7 125 53 33 29034 8532 6481 536 406 648 11 Tawang 0 57 23 8 5108 1405 895 166 134 106 12 Tirap 0 124 36 15 14622 4433 2485 207 227 289 13 Upper Siang 0 47 20 6 5528 1753 1155 112 105 78 14 Upper Subansiri 3 98 39 11 13146 3449 1785 209 170 114 15 West Kameng 0 104 39 14 11184 4003 2326 296 192 242 16 West Siang 5 163 65 28 22425 7597 4809 328 428 429
Total 21 1380 528 223 195590 64071 42553 3790 3494 3823 PPS – Pre-Primary Schools PS – Primary Schools MS – Middle Schools HS/HSS/Intermediate - High School/ Hr. Secondary Schools/ Intermediate Schools

E.9
ASSAM
Total Population: 26,655,528 (as per 2001 Census) Estimated 2005 Population: 28273 (in 000) Literacy Rates: Total : 63.25 Male : 71.28
Female : 54.61
A: School Education
No. of Institutions: (Figures in numbers) Number of Schools Years
Primary Upper Primary Secondary Sr. Secondary 2001-02 33236 8019 4136 696 2002-03 30045 7704 3719 1017 2003-04 30068 8143 4607 731 2004-05 30068 8143 4629 745 2005-06 30499 9716 4776 751
Enrolment (Figures in numbers) Enrolment in Classes Years
I-V VI-VIII IX-X XI-XII 2001-02 4080610 1518648 592647 329888 2002-03 3128986 1058295 497500 192586 2003-04 3232547 1338210 621025 345806 2004-05 3510665 1389755 624501 174891 2005-06 3550745 1463177 636733 179312
Gross Enrolment Ratio Gross Enrolment Ratio in Classes Years
I-V VI-VIII IX-XII 2001-02 117.43 70.63 35.98 2002-03 86.83 51.22 29.65 2003-04 88.16 63.65 40.83 2004-05 105.20 69.70 32.23 2005-06 107.11 72.83 32.08
Drop-out Rates Drop-out Rates in Classes Years
I-V I-VIII I-X 2001-02 48.64 69.21 75.61 2002-03 61.17 68.76 74.91 2003-04 53.15 70.81 74.84 2004-05 50.07 73.38 74.96 2005-06 47.78 73.48 76.66
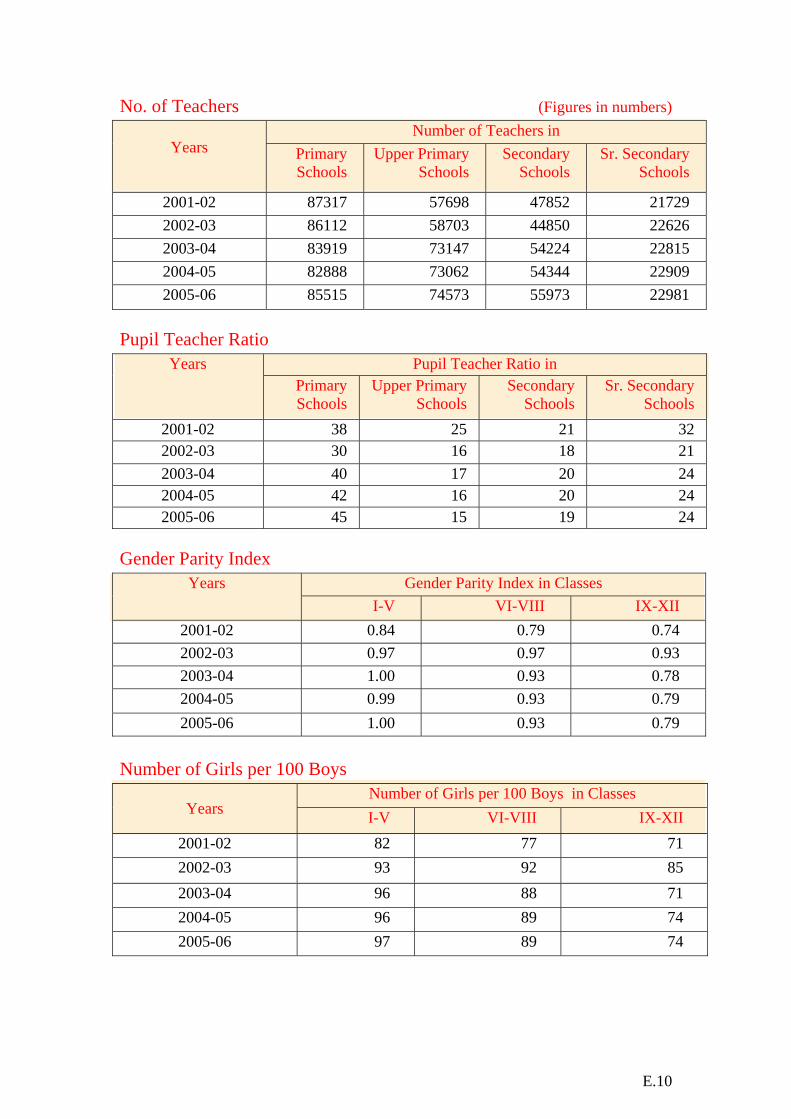
E.10
No. of Teachers (Figures in numbers) Number of Teachers in
Years
Primary Schools
Upper Primary Schools
Secondary Schools
Sr. Secondary Schools
2001-02 87317 57698 47852 21729 2002-03 86112 58703 44850 22626 2003-04 83919 73147 54224 22815 2004-05 82888 73062 54344 22909 2005-06 85515 74573 55973 22981
Pupil Teacher Ratio
Pupil Teacher Ratio in Years Primary
Schools Upper Primary
Schools Secondary
Schools Sr. Secondary
Schools 2001-02 38 25 21 32 2002-03 30 16 18 21 2003-04 40 17 20 24 2004-05 42 16 20 24 2005-06 45 15 19 24
Gender Parity Index
Gender Parity Index in Classes Years I-V VI-VIII IX-XII
2001-02 0.84 0.79 0.74 2002-03 0.97 0.97 0.93 2003-04 1.00 0.93 0.78 2004-05 0.99 0.93 0.79 2005-06 1.00 0.93 0.79
Number of Girls per 100 Boys
Number of Girls per 100 Boys in Classes Years I-V VI-VIII IX-XII
2001-02 82 77 71 2002-03 93 92 85 2003-04 96 88 71 2004-05 96 89 74 2005-06 97 89 74

E.11
B. Tertiary Education: Number of Institutions (Figures in number) Institutions/Universities 2001-02 2002-03 2003-04 2004-05 2005-06 Universities 5 5 5 5 5 Deemed to be Universities 0 1 1 1 1 Instt. of National Importance 1 1 1 1 1 Research Institutes 0 0 0 0 0 Colleges for General Education 298 309 317 317 348 Engg., Tech & Arch. Collages 3 3 3 3 4 Medical Colleges (Allo./ Ayur./ Homeo/ Unani)
7 7 7 7 10
Enrolment (Figures in number)
Enrolment during the year Courses 2001-02 2002-03 2003-04 2004-05 2005-06
Ph.D/D.Sc./D.Phill. 744 750 752 746 437 M.A. 7442 7504 7531 7612 5307 M.Sc. 3944 3976 3994 3832 2099 M.Com. 1077 1085 1094 1002 362 B.A,/B.A. (Hons) 139919 14151
5 144605 142284 153927
B.Sc./B.Sc.(Hons.) 33346 30693 31507 28743 26030 B.Com./B.Com(Hons.) 18051 16234 16696 15014 10967 B.E./B.Sc.(Engg/B.Arch.) 4137 3807 3810 3354 2768 Medicine, Dentistry, Nursing, Pharmacy, Ayurvedic & Unani etc.
2550 2552 2556 2595 3007
B.Ed. 2943 2340 2387 2345 2553 Open. - - - - 00 Polytechnic - - - - 3379 Others 10351 32295 7378 6815 6815 Total 224504 242751 222310 214342 217652
C: Expenditure on Education: Year Gross State
Domestic Product (GSDP)
Expenditure on Education
Expenditure on Education as percentage of GSDP
2001-02 38913 2010.50 5.17 2002-03 43407 2001.65 4.61 2003-04 47305 2511.13 5.31 2004-05 52920 2624.27 4.96 2005-06 57543 3722.00 6.47

E.12
D: District-wise Statistics: 2005-06 (Fig. in numbers)
No. of Schools Enrolment Teachers
District Name PPS PS MS
HS/H
SS/
INTE
RMED
IATE
I-V VI-VIII IX-XII PPS/PS MS
HS/H
SS/
INTE
RMED
IATE
1 2 3 4 5 6 7 8 9 10 11 12 1 Barpeta 17 1840 693 342 229357 101983 57378 4173 5125 5768
2 Bongaigaon 5 966 340 207 111538 44992 27596 2591 2429 2411
3 Cachar 2 1610 408 249 195690 81453 37452 3889 3422 4229
4 Darrang 11 1523 450 273 184594 77834 40464 3991 3503 3759
5 Dhemaji 9 847 302 241 63425 36695 14940 2261 2532 2806
6 Dhubri 0 1449 607 194 254548 60706 33607 2998 3519 2823
7 Dibrugarh 12 1335 322 183 141024 55928 33205 3588 2266 2686
8 Goalpara 7 942 302 166 119102 38699 20350 2248 2015 2078
9 Golaghat 0 1004 343 191 99056 51665 30283 2442 2261 2970
10 Hailakaudi 2 1003 323 60 84844 28470 8020 2584 2441 1034
11 Jorhat 18 1570 449 287 101518 70135 54383 3391 3141 4571
12 Kamrup 49 2182 762 595 234198 141719 98668 6896 6283 8300
13 Karbi- Anglong 0 1416 372 211 192550 52182 13917 2890 2067 2277
14 Karimganj 4 1245 327 118 194477 52996 22873 2795 2448 2035
15 Kokrajhar 2 1076 323 150 92106 42680 19522 2481 2488 1969
16 Lakhimpur 1 1378 648 371 106660 61097 50866 5023 5400 4543
17 Morigaon 0 816 283 158 113573 50378 21822 1899 2123 1967
18 N.C.Hill 21 712 214 88 43915 16157 5610 2879 1401 1065
19 Nagaon 9 2038 651 367 324365 105070 59594 5903 5129 6331
20 Nalbari 0 1484 598 346 128170 86673 60277 4793 4788 5290
21 Sibsagar 12 1713 472 241 151664 75025 47423 9296 5406 3685
22 Sonitpur 13 1386 314 279 248300 80327 33723 3757 2640 3790
23 Tinsukia 5 964 213 210 136071 50313 24072 2747 1746 2567
Total 199 30499 9716 5527 3550745 1463177 816045 85515 74573 78954 PPS – Pre-Primary Schools PS – Primary Schools MS – Middle Schools HS/HSS/Intermediate - High School/ Hr. Secondary Schools/ Intermediate Schools

E.13
BIHAR
Total Population: 82,998,509 (as per 2001 Census) Estimated 2005 Population: 89264 (in 000) Literacy Rates: Total : 47.00 Male : 59.68 Female : 33.12
A: School Education
No. of Institutions: (Figures in numbers) Number of Schools Years
Primary Upper Primary Secondary Sr. Secondary 2001-02 39299 9691 2899 676 2002-03 40511 9783 3041 785 2003-04 40337 9922 2939 685 2004-05 39347 10963 2944 685 2005-06 38161 12328 2948 689
Enrolment (Figures in numbers) Enrolment in Classes Years
I-V VI-VIII IX-X XI-XII 2001-02 7809112 1913709 846095 286865 2002-03 9413646 1756898 777856 453054 2003-04 9471186 1815562 845835 373282 2004-05 10042119 2208989 928831 374153 2005-06 10525321 2384485 973017 358595
Gross Enrolment Ratio Gross Enrolment Ratio in Classes Years
I-V VI-VIII IX-X 2001-02 78.70 30.07 15.27 2002-03 73.52 24.98 17.39 2003-04 72.57 25.33 16.90 2004-05 83.75 32.43 32.23 2005-06 87.20 34.27 16.02
Drop-out Rates Drop-out Rates in Classes Years
I-V I-VIII I-X 2001-02 61.64 74.79 82.87 2002-03 62.31 79.01 83.60 2003-04 59.03 78.03 82.58 2004-05 51.59 74.69 83.06 2005-06 46.55 73.37 83.07
E.14
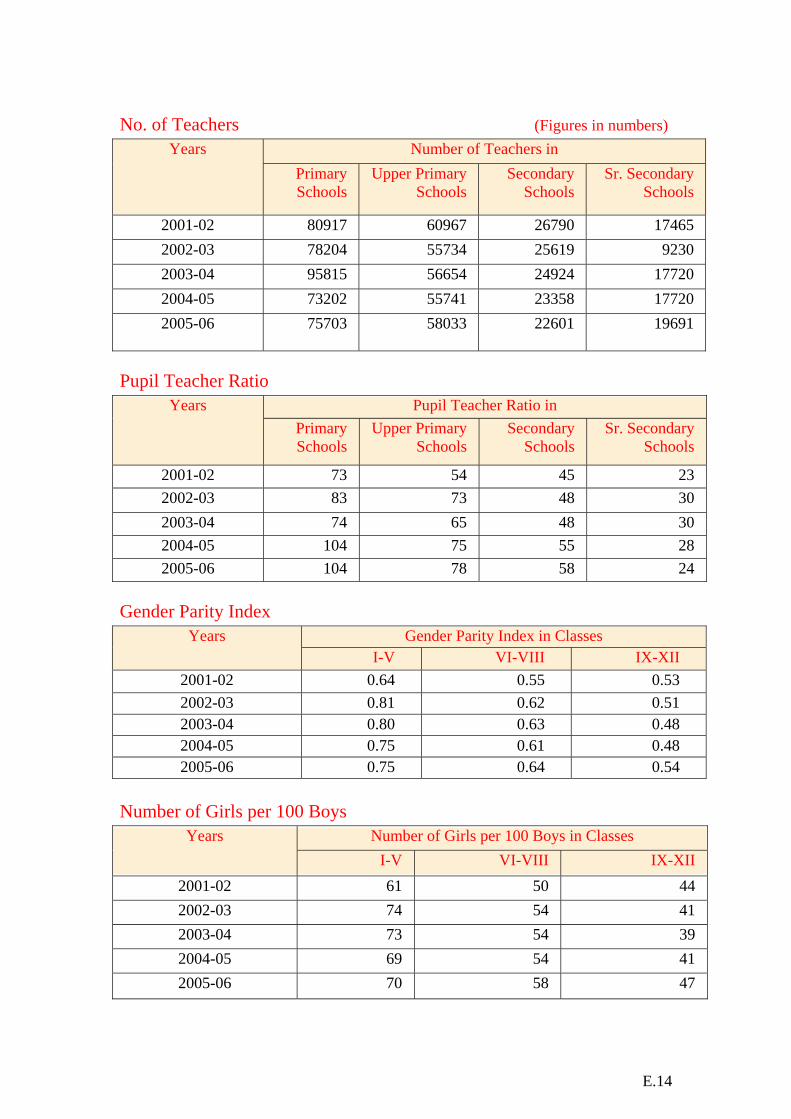
No. of Teachers (Figures in numbers)
Number of Teachers in Years Primary
Schools Upper Primary
Schools Secondary
Schools Sr. Secondary
Schools
2001-02 80917 60967 26790 17465 2002-03 78204 55734 25619 9230 2003-04 95815 56654 24924 17720 2004-05 73202 55741 23358 17720 2005-06 75703 58033
22601 19691
Pupil Teacher Ratio
Pupil Teacher Ratio in Years Primary
Schools Upper Primary
Schools Secondary
Schools Sr. Secondary
Schools
2001-02 73 54 45 23 2002-03 83 73 48 30 2003-04 74 65 48 30 2004-05 104 75 55 28 2005-06 104 78 58 24
Gender Parity Index
Gender Parity Index in Classes Years I-V VI-VIII IX-XII
2001-02 0.64 0.55 0.53 2002-03 0.81 0.62 0.51 2003-04 0.80 0.63 0.48 2004-05 0.75 0.61 0.48 2005-06 0.75 0.64 0.54
Number of Girls per 100 Boys
Number of Girls per 100 Boys in Classes Years I-V VI-VIII IX-XII
2001-02 61 50 44 2002-03 74 54 41 2003-04 73 54 39 2004-05 69 54 41 2005-06 70 58 47
E.15
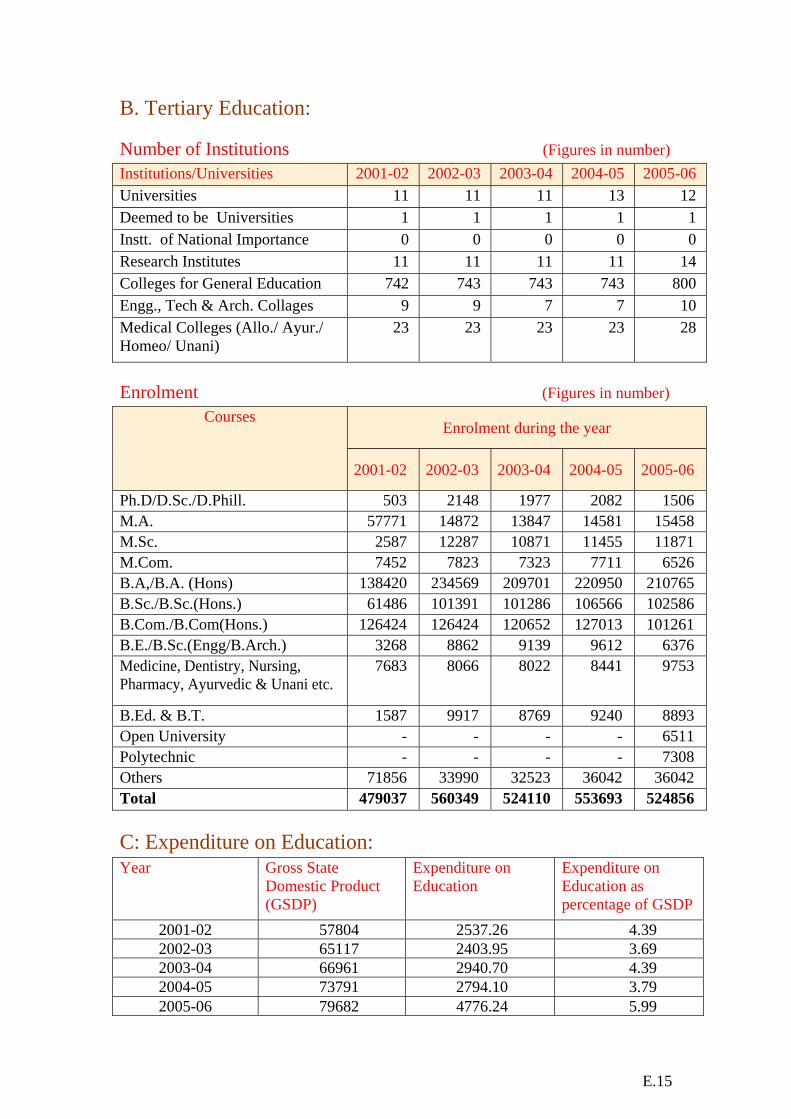
B. Tertiary Education: Number of Institutions (Figures in number) Institutions/Universities 2001-02 2002-03 2003-04 2004-05 2005-06 Universities 11 11 11 13 12 Deemed to be Universities 1 1 1 1 1 Instt. of National Importance 0 0 0 0 0 Research Institutes 11 11 11 11 14 Colleges for General Education 742 743 743 743 800 Engg., Tech & Arch. Collages 9 9 7 7 10 Medical Colleges (Allo./ Ayur./ Homeo/ Unani)
23 23 23 23 28
Enrolment (Figures in number)
Enrolment during the year Courses
2001-02 2002-03 2003-04 2004-05 2005-06
Ph.D/D.Sc./D.Phill. 503 2148 1977 2082 1506 M.A. 57771 14872 13847 14581 15458 M.Sc. 2587 12287 10871 11455 11871 M.Com. 7452 7823 7323 7711 6526 B.A,/B.A. (Hons) 138420 234569 209701 220950 210765 B.Sc./B.Sc.(Hons.) 61486 101391 101286 106566 102586 B.Com./B.Com(Hons.) 126424 126424 120652 127013 101261 B.E./B.Sc.(Engg/B.Arch.) 3268 8862 9139 9612 6376 Medicine, Dentistry, Nursing, Pharmacy, Ayurvedic & Unani etc.
7683 8066 8022 8441 9753
B.Ed. & B.T. 1587 9917 8769 9240 8893 Open University - - - - 6511 Polytechnic - - - - 7308 Others 71856 33990 32523 36042 36042 Total 479037 560349 524110 553693 524856 C: Expenditure on Education: Year Gross State
Domestic Product (GSDP)
Expenditure on Education
Expenditure on Education as percentage of GSDP
2001-02 57804 2537.26 4.39 2002-03 65117 2403.95 3.69 2003-04 66961 2940.70 4.39 2004-05 73791 2794.10 3.79 2005-06 79682 4776.24 5.99
E.16
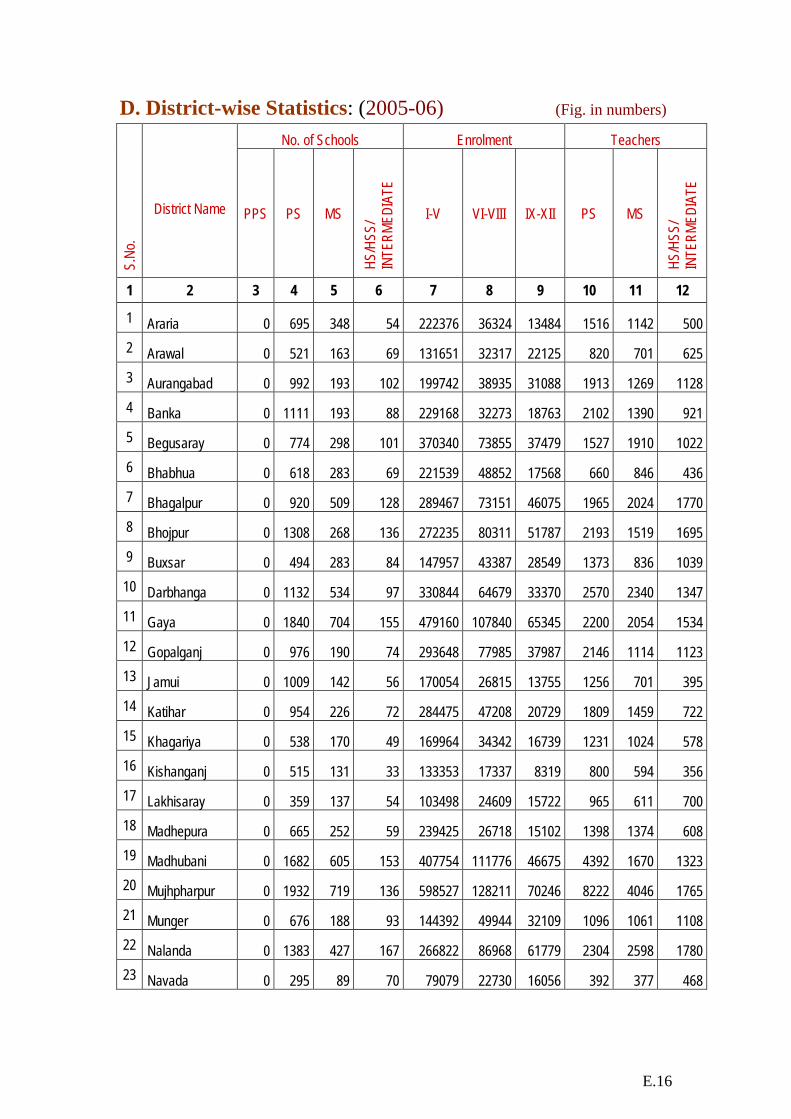
D. District-wise Statistics: (2005-06) (Fig. in numbers)
No. of Schools Enrolment Teachers S
.No.
District Name PPS PS MS
HS/H
SS/
INTE
RMED
IATE
I-V VI-VIII IX-XII PS MS
HS/H
SS/
INTE
RMED
IATE
1 2 3 4 5 6 7 8 9 10 11 12
1 Araria 0 695 348 54 222376 36324 13484 1516 1142 500 2 Arawal 0 521 163 69 131651 32317 22125 820 701 625 3 Aurangabad 0 992 193 102 199742 38935 31088 1913 1269 1128 4 Banka 0 1111 193 88 229168 32273 18763 2102 1390 921 5 Begusaray 0 774 298 101 370340 73855 37479 1527 1910 1022 6 Bhabhua 0 618 283 69 221539 48852 17568 660 846 436 7 Bhagalpur 0 920 509 128 289467 73151 46075 1965 2024 1770 8 Bhojpur 0 1308 268 136 272235 80311 51787 2193 1519 1695 9 Buxsar 0 494 283 84 147957 43387 28549 1373 836 1039 10 Darbhanga 0 1132 534 97 330844 64679 33370 2570 2340 1347 11 Gaya 0 1840 704 155 479160 107840 65345 2200 2054 1534 12 Gopalganj 0 976 190 74 293648 77985 37987 2146 1114 1123 13 Jamui 0 1009 142 56 170054 26815 13755 1256 701 395 14 Katihar 0 954 226 72 284475 47208 20729 1809 1459 722 15 Khagariya 0 538 170 49 169964 34342 16739 1231 1024 578 16 Kishanganj 0 515 131 33 133353 17337 8319 800 594 356 17 Lakhisaray 0 359 137 54 103498 24609 15722 965 611 700 18 Madhepura 0 665 252 59 239425 26718 15102 1398 1374 608 19 Madhubani 0 1682 605 153 407754 111776 46675 4392 1670 1323 20 Mujhpharpur 0 1932 719 136 598527 128211 70246 8222 4046 1765 21 Munger 0 676 188 93 144392 49944 32109 1096 1061 1108 22 Nalanda 0 1383 427 167 266822 86968 61779 2304 2598 1780 23 Navada 0 295 89 70 79079 22730 16056 392 377 468
E.17
No. of Schools Enrolment Teachers S
.No.
District Name PPS PS MS
HS/H
SS/
INTE
RMED
IATE
I-V VI-VIII IX-XII PS MS
HS/H
SS/
INTE
RMED
IATE
1 2 3 4 5 6 7 8 9 10 11 12
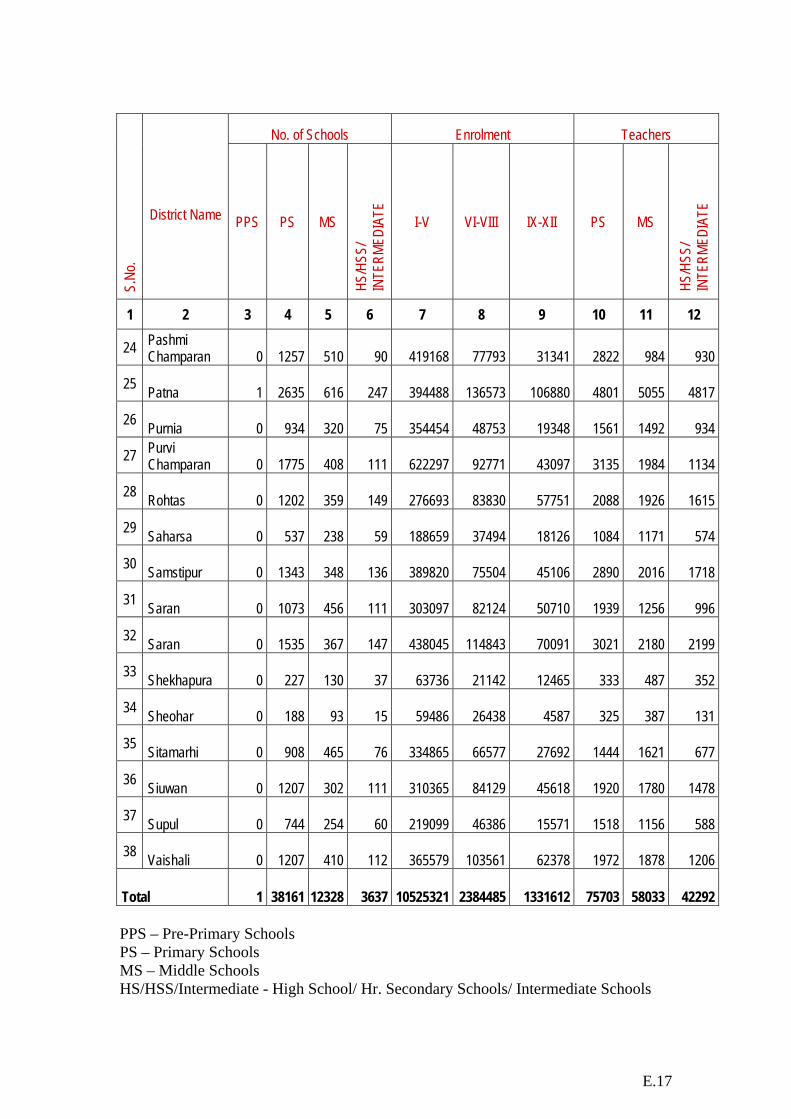
24 Pashmi Champaran 0 1257 510 90 419168 77793 31341 2822 984 930
25 Patna 1 2635 616 247 394488 136573 106880 4801 5055 4817
26 Purnia 0 934 320 75 354454 48753 19348 1561 1492 934
27 Purvi Champaran 0 1775 408 111 622297 92771 43097 3135 1984 1134
28 Rohtas 0 1202 359 149 276693 83830 57751 2088 1926 1615
29 Saharsa 0 537 238 59 188659 37494 18126 1084 1171 574
30 Samstipur 0 1343 348 136 389820 75504 45106 2890 2016 1718
31 Saran 0 1073 456 111 303097 82124 50710 1939 1256 996
32 Saran 0 1535 367 147 438045 114843 70091 3021 2180 2199
33 Shekhapura 0 227 130 37 63736 21142 12465 333 487 352
34 Sheohar 0 188 93 15 59486 26438 4587 325 387 131
35 Sitamarhi 0 908 465 76 334865 66577 27692 1444 1621 677
36 Siuwan 0 1207 302 111 310365 84129 45618 1920 1780 1478
37 Supul 0 744 254 60 219099 46386 15571 1518 1156 588
38 Vaishali 0 1207 410 112 365579 103561 62378 1972 1878 1206
Total 1 38161 12328 3637 10525321 2384485 1331612 75703 58033 42292 PPS – Pre-Primary Schools PS – Primary Schools MS – Middle Schools HS/HSS/Intermediate - High School/ Hr. Secondary Schools/ Intermediate Schools

E.18
CHHATTISGARH
Total Population: 20,833,803 (as per 2001 Census) Estimated 2005 Population: 2225 (in 000) Literacy Rates: Total : 64.66 Male :77.38 Female :51.85
A: School Education
No. of Institutions: (Figures in number) Number of Schools Years Primary Upper Primary Secondary Sr. Secondary
2001-02 31023 6358 1149 1383 2002-03 23951 6293 1207 1564 2003-04 32556 9350 1227 1439 2004-05 33595 10799 1231 1439 2005-06 31670 9677 1877 2029
Enrolment (Figures in numbers) Enrolment in Classes Years I-V VI-VIII IX-X XI-XII
2001-02 2972595 1061631 343967 2260082002-03 2751573 1146145 371441 1867032003-04 3397795 1158587 396228 2604792004-05 3405502 1209994 420855 2788882005-06 3167677 1054895 381246 226112
Gross Enrolment Ratio Gross Enrolment Ratio in Classes Years I-V VI-VIII IX-XII
2001-02 116.12 68.01 30.67 2002-03 104.45 71.12 31.13 2003-04 123.29 70.52 35.92 2004-05 131.84 79.87 37.30 2005-06 122.26 69.13 31.47
Drop-out Rates Drop-out Rates in Classes Years I-V I-VIII I-X
2001-02 - - - 2002-03 - - - 2003-04 - - - 2004-05 - - - 2005-06 35.18 - -

E.19
No. of Teachers (Fig. In numbers)
Number of Teachers in Years
Primary Schools
Upper Primary Schools
Secondary Schools
Sr. Secondary Schools
2001-02 73871 22212 6627 15669 2002-03 58348 25954 7902 24763 2003-04 68512 25213 7935 16650 2004-05 68819 26058 9443 19443 2005-06 71705 27709 8873 16949
Pupil Teacher Ratio
Pupil Teacher Ratio in Years
Primary Schools
Upper Primary Schools
Secondary Schools
Sr. Secondary Schools
2001-02 44 44 42 28 2002-03 43 37 29 32 2003-04 47 45 45 33 2004-05 48 46 38 25 2005-06 41 47 49 13
Gender Parity Index
Gender Parity Index in Classes Years I-V VI-VIII IX-XII
2001-02 0.87 0.72 0.61 2002-03 0.95 0.79 0.64 2003-04 0.99 0.79 0.66 2004-05 0.94 0.79 0.68 2005-06 0.77 0.87 0.71
Number of Girls per 100 Boys
Number of Girls per 100 Boys in Classes Years I-V VI-VIII IX-XII
2001-02 89 72 57
2002-03 93 76 59
2003-04 92 76 61
2004-05 92 76 65
2005-06 76 84 68
E.20
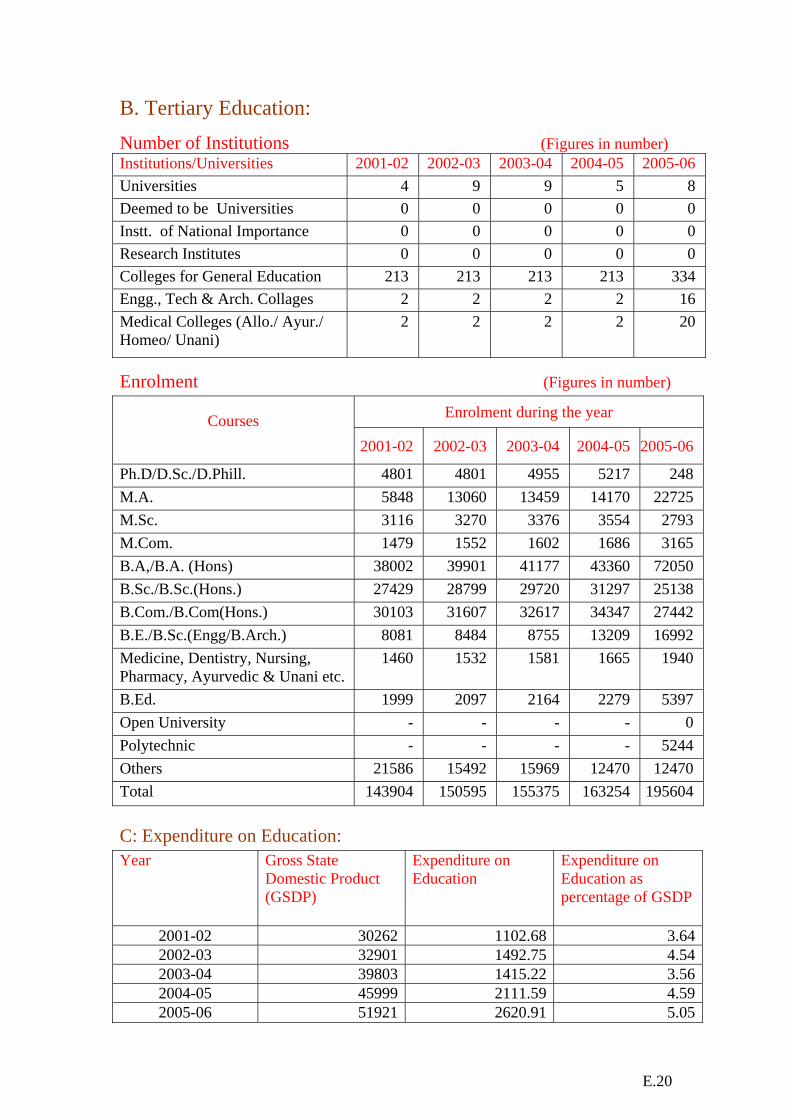
B. Tertiary Education:
Number of Institutions (Figures in number) Institutions/Universities 2001-02 2002-03 2003-04 2004-05 2005-06 Universities 4 9 9 5 8 Deemed to be Universities 0 0 0 0 0 Instt. of National Importance 0 0 0 0 0 Research Institutes 0 0 0 0 0 Colleges for General Education 213 213 213 213 334 Engg., Tech & Arch. Collages 2 2 2 2 16 Medical Colleges (Allo./ Ayur./ Homeo/ Unani)
2 2 2 2 20
Enrolment (Figures in number)
Enrolment during the year Courses 2001-02 2002-03 2003-04 2004-05 2005-06
Ph.D/D.Sc./D.Phill. 4801 4801 4955 5217 248 M.A. 5848 13060 13459 14170 22725 M.Sc. 3116 3270 3376 3554 2793 M.Com. 1479 1552 1602 1686 3165 B.A,/B.A. (Hons) 38002 39901 41177 43360 72050 B.Sc./B.Sc.(Hons.) 27429 28799 29720 31297 25138 B.Com./B.Com(Hons.) 30103 31607 32617 34347 27442 B.E./B.Sc.(Engg/B.Arch.) 8081 8484 8755 13209 16992 Medicine, Dentistry, Nursing, Pharmacy, Ayurvedic & Unani etc.
1460 1532 1581 1665 1940
B.Ed. 1999 2097 2164 2279 5397 Open University - - - - 0 Polytechnic - - - - 5244 Others 21586 15492 15969 12470 12470 Total 143904 150595 155375 163254 195604 C: Expenditure on Education: Year Gross State
Domestic Product (GSDP)
Expenditure on Education
Expenditure on Education as percentage of GSDP
2001-02 30262 1102.68 3.642002-03 32901 1492.75 4.542003-04 39803 1415.22 3.562004-05 45999 2111.59 4.592005-06 51921 2620.91 5.05

E.21
D. District-wise Statistics: 2005-06 (Fig. in numbers)
No. of Schools Enrolment Teachers
S.N
o.
District Name PPS PS MS
HS/H
SS/
INT
ERME
DIAT
E
I-V VI-VIII IX-XII PS MS
HS/H
SS/
INTE
RMED
IATE
1 2 3 4 5 6 7 8 9 10 11 12
1 Ambikapur 92 1636 424 146 134590 48692 26002 3233 1388 1309
2 Bastar 3 3164 530 176 115827 35383 20696 2889 998 1021
3 Bemetra 0 796 323 154 124546 30714 20374 1411 484 409
4 Bilaspur 111 2666 931 398 344364 120948 60505 7936 2677 3856
5 Dantewada 99 1838 333 88 118060 20943 15922 2438 1151 708
6 Dhamtari 0 979 487 118 133227 45650 21119 2333 1145 712
7 Durg 42 2824 826 412 238800 91894 47023 4612 1800 1512
8 Janjgir 37 712 642 373 210871 52232 32872 4236 964 1164
9 Jaspur 2 1622 457 141 111547 44175 27137 3464 1273 1182
10 Kanker 0 1479 342 129 116601 35557 20681 3090 1189 1246
11 Kawardha 26 1035 319 110 134982 28208 8466 2391 1021 672
12 Korba 0 1453 352 157 122542 30042 25497 3060 1347 1428
13 Koriya 72 963 313 140 104348 39014 23214 2257 1249 1084
14 Mahasamund 0 1325 418 172 134607 56265 28580 3324 1541 1251
15 Raigarh 99 1795 485 283 177953 53008 52423 4556 1973 1638
16 Raipur 0 3085 1295 501 459113 196401 106822 11044 3751 3970
17 Rajnandgaon 52 1967 720 251 188927 79842 39708 4834 2109 1400
18 Ramanujganj 5 1109 236 72 98666 20852 14191 2370 734 439
19 Surajpur 86 1222 244 85 98106 25075 16126 2227 915 821
Total 726 31670 9677 3906 3167677 1054895 607358 71705 27709 25822 PPS – Pre-Primary Schools PS – Primary Schools MS – Middle Schools HS/HSS/Intermediate - High School/ Hr. Secondary Schools/ Intermediate Schools

E.22
GOA
Total Population: 1,347,668 (as per 2001 Census) Estimated 2005 Population: 1449 (in 000) Literacy Rates: Total : 82.01 Male :88.42 Female :75.37
A: School Education
No. of Institutions: (Figures in numbers) Number of Schools Years Primary Upper Primary Secondary Sr. Secondary
2001-02 1033 84 361 81 2002-03 1037 75 344 81 2003-04 1009 79 363 80 2004-05 1003 73 364 81 2005-06 1001 72 345 81
Enrolment (Figures in numbers) Enrolment in Classes Years I-V VI-VIII IX-X XI-XII
2001-02 120066 72653 38724 22868 2002-03 111926 74555 38531 21793 2003-04 107875 73465 37642 23743 2004-05 106828 73446 38046 23820 2005-06 104512 71570 37543 22929
Gross Enrolment Ratio Gross Enrolment Ratio in Classes Years I-V VI-VIII IX-X
2001-02 62.86 70.54 46.76 2002-03 104.22 105.34 63.04 2003-04 97.96 101.23 62.55 2004-05 110.13 100.61 57.82 2005-06 107.74 98.04 56.52
Drop-out Rates Drop-out Rates in Classes Years I-V I-VIII I-X
2001-02 5.73 4.19 42.21 2002-03 2.69 5.54 39.68 2003-04 0.00 9.43 37.94 2004-05 2.43 6.90 40.65 2005-06 0.37 4.95 42.84
E.23
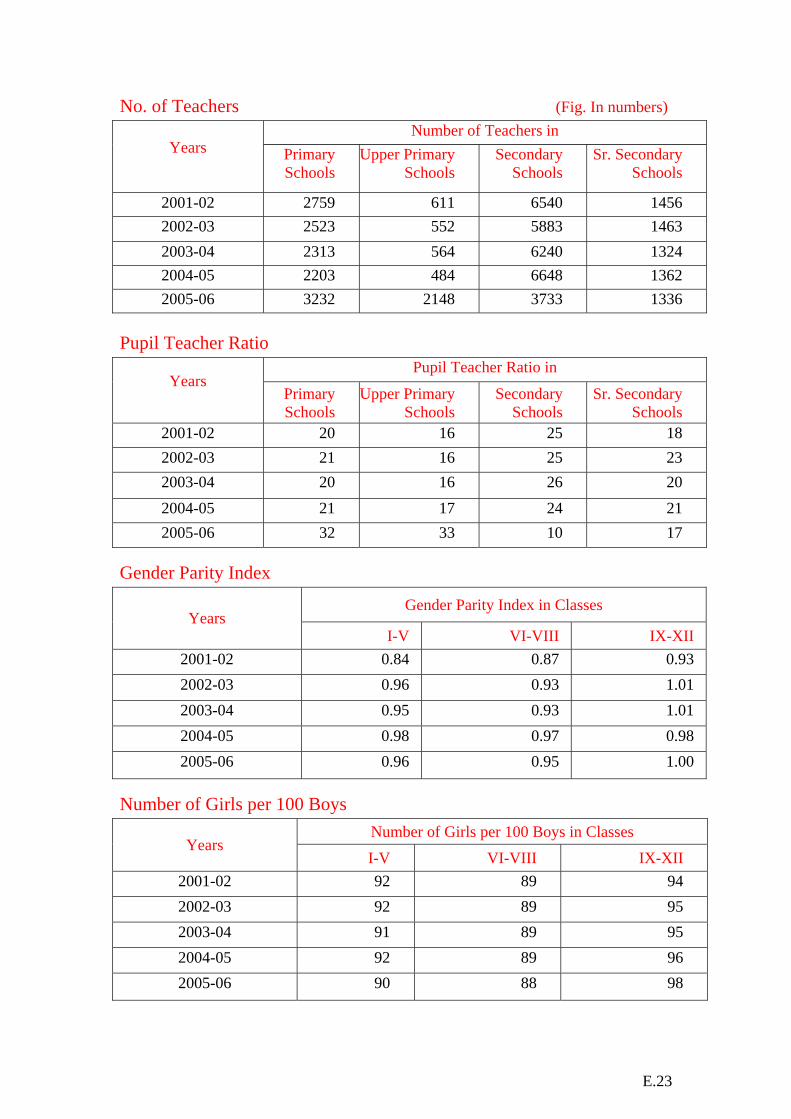
No. of Teachers (Fig. In numbers) Number of Teachers in
Years
Primary Schools
Upper Primary Schools
Secondary Schools
Sr. Secondary Schools
2001-02 2759 611 6540 1456 2002-03 2523 552 5883 1463 2003-04 2313 564 6240 1324 2004-05 2203 484 6648 1362 2005-06 3232 2148 3733 1336
Pupil Teacher Ratio
Pupil Teacher Ratio in Years
Primary Schools
Upper Primary Schools
Secondary Schools
Sr. Secondary Schools
2001-02 20 16 25 18 2002-03 21 16 25 23 2003-04 20 16 26 20 2004-05 21 17 24 21 2005-06 32 33 10 17
Gender Parity Index
Gender Parity Index in Classes Years
I-V VI-VIII IX-XII 2001-02 0.84 0.87 0.93 2002-03 0.96 0.93 1.01 2003-04 0.95 0.93 1.01 2004-05 0.98 0.97 0.98 2005-06 0.96 0.95 1.00
Number of Girls per 100 Boys Number of Girls per 100 Boys in Classes
Years I-V VI-VIII IX-XII
2001-02 92 89 94 2002-03 92 89 95 2003-04 91 89 95 2004-05 92 89 96 2005-06 90 88 98

E.24
B. Tertiary Education: Number of Institutions (Figures in number)
Institutions/Universities 2001-02 2002-03 2003-04 2004-05 2005-06Universities 1 1 1 1 1
Deemed to be Universities 0 0 0 0 0
Instt. of National Importance 0 0 0 0 0
Research Institutes 0 0 0 0 0
Colleges for General Education 22 24 24 23 23
Engg., Tech & Arch. Collages 3 4 4 4 5
Medical Colleges (Allo./ Ayur./ Homeo/ Unani)
9 9 7 7 7
Enrolment (Figures in number)
Enrolment during the year Courses
2001-02 2002-03 2003-04 2004-05 2005-06
Ph.D/D.Sc./D.Phill. 126 103 88 68 68 M.A. 292 262 262 390 390 M.Sc. 286 326 347 493 493 M.Com. 62 61 70 191 191 B.A,/B.A. (Hons) 3034 3116 3232 3477 3477 B.Sc./B.Sc.(Hons.) 2417 2153 2533 2776 2776 B.Com./B.Com(Hons.) 7094 8004 8337 8331 8331 B.E./B.Sc.(Engg/B.Arch.) 1626 2442 2816 3163 2688 Medicine, Dentistry, Nursing, Pharmacy, Ayurvedic & Unani etc.
944 1044 1114 952 952
B.Ed. & B.T. 199 200 201 200 200 Open. _ - - - 0 Polytechnics - - - - 2580 Others 3165 1366 3106 1602 1602 Total 19245 19077 22106 21643 23748

E.25
C: Expenditure on Education: Year Gross State
Domestic Product (GSDP)
Expenditure on Education
Expenditure on Education as percentage of GSDP
2001-02 7097 255.05 3.59
2002-03 8100 298.63 3.69
2003-04 9301 306.63 3.30
2004-05 11482 355.00 3.09
2005-06 12400 372.50 3.00
D. District-wise Statistics (2005-06):
(Fig. in numbers)
No. of Schools Enrolment Teachers
S.N
o.
District Name
PPS PS MS
HS/H
SS/
INTE
RMED
IATE
I-V VI-VIII IX-XII PPS/ PS MS
HS/H
SS/
INTE
RMED
IATE
1 2 3 4 5 6 7 8 9 10 11 12
1 North Goa 0 595 46 265 55413 39251 33698 1718 1336 2903
2 South Goa 0 406 26 161 49099 32319 26774 1514 812 2166
Total 0 1001 72 426 104512 71570 60472 3232 2148 5069
PPS – Pre-Primary Schools PS – Primary Schools MS – Middle Schools HS/HSS/Intermediate - High School/ Hr. Secondary Schools/ Intermediate Schools
E.26
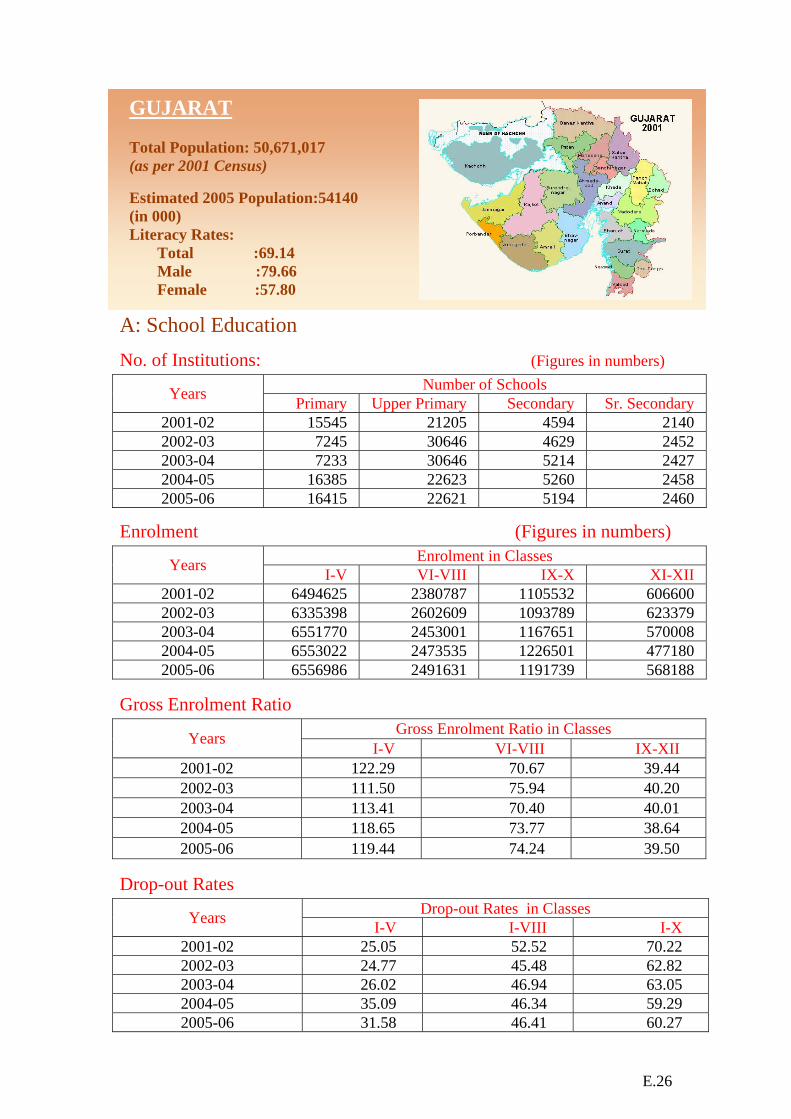
GUJARAT
Total Population: 50,671,017 (as per 2001 Census) Estimated 2005 Population:54140 (in 000) Literacy Rates: Total :69.14 Male :79.66 Female :57.80
A: School Education
No. of Institutions: (Figures in numbers) Number of Schools Years Primary Upper Primary Secondary Sr. Secondary
2001-02 15545 21205 4594 2140 2002-03 7245 30646 4629 2452 2003-04 7233 30646 5214 2427 2004-05 16385 22623 5260 2458 2005-06 16415 22621 5194 2460
Enrolment (Figures in numbers) Enrolment in Classes Years I-V VI-VIII IX-X XI-XII
2001-02 6494625 2380787 1105532 606600 2002-03 6335398 2602609 1093789 623379 2003-04 6551770 2453001 1167651 570008 2004-05 6553022 2473535 1226501 477180 2005-06 6556986 2491631 1191739 568188
Gross Enrolment Ratio Gross Enrolment Ratio in Classes Years I-V VI-VIII IX-XII
2001-02 122.29 70.67 39.44 2002-03 111.50 75.94 40.20 2003-04 113.41 70.40 40.01 2004-05 118.65 73.77 38.64 2005-06 119.44 74.24 39.50
Drop-out Rates Drop-out Rates in Classes Years I-V I-VIII I-X
2001-02 25.05 52.52 70.22 2002-03 24.77 45.48 62.82 2003-04 26.02 46.94 63.05 2004-05 35.09 46.34 59.29 2005-06 31.58 46.41 60.27
E.27
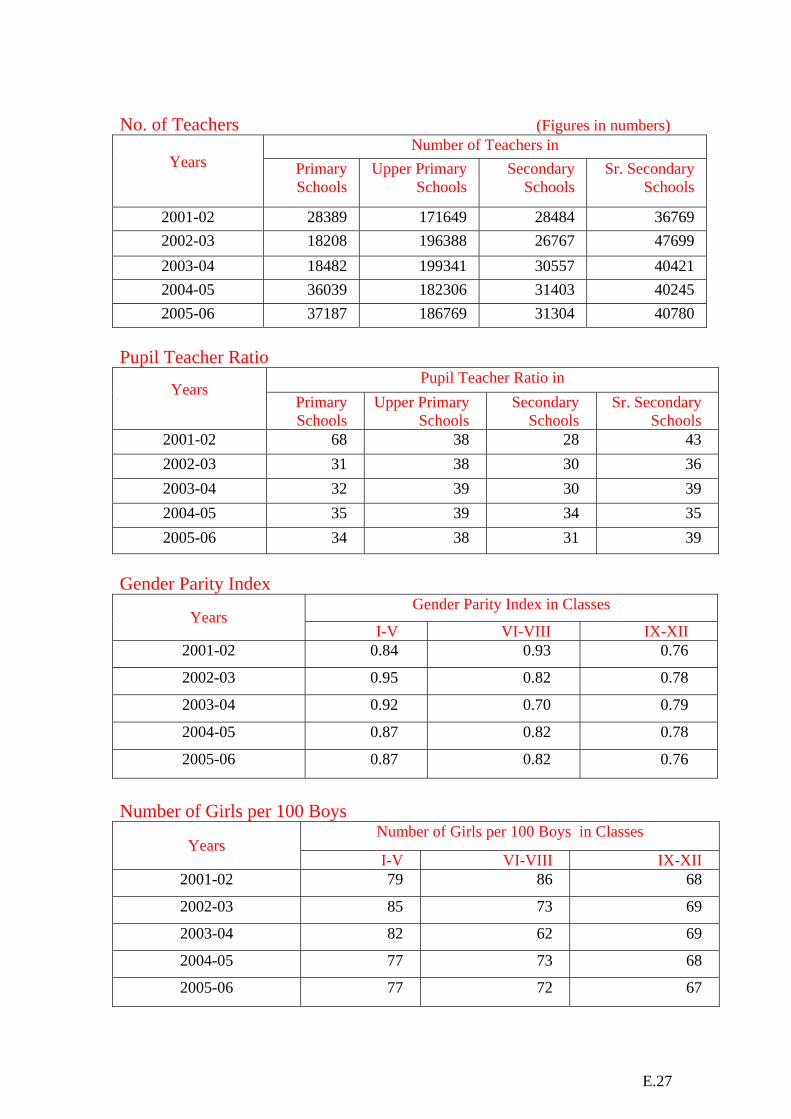
No. of Teachers (Figures in numbers)
Number of Teachers in Years
Primary Schools
Upper Primary Schools
Secondary Schools
Sr. Secondary Schools
2001-02 28389 171649 28484 36769 2002-03 18208 196388 26767 47699 2003-04 18482 199341 30557 40421 2004-05 36039 182306 31403 40245 2005-06 37187 186769 31304 40780
Pupil Teacher Ratio
Pupil Teacher Ratio in Years
Primary Schools
Upper Primary Schools
Secondary Schools
Sr. Secondary Schools
2001-02 68 38 28 43 2002-03 31 38 30 36 2003-04 32 39 30 39 2004-05 35 39 34 35 2005-06 34 38 31 39
Gender Parity Index
Gender Parity Index in Classes Years
I-V VI-VIII IX-XII 2001-02 0.84 0.93 0.76
2002-03 0.95 0.82 0.78
2003-04 0.92 0.70 0.79
2004-05 0.87 0.82 0.78
2005-06 0.87 0.82 0.76
Number of Girls per 100 Boys
Number of Girls per 100 Boys in Classes Years
I-V VI-VIII IX-XII 2001-02 79 86 68
2002-03 85 73 69
2003-04 82 62 69
2004-05 77 73 68
2005-06 77 72 67

E.28
B. Tertiary Education: Number of Institutions (Figures in number) Institutions/Universities 2001-02 2002-03 2003-04 2004-05 2005-06 Universities 10 10 10 13 15 Deemed to be Universities 2 2 2 3 2 Instt. of National Importance 0 0 0 0 0 Research Institutes 16 16 16 17 16 Colleges for General Education 422 422 422 507 518 Engg., Tech & Arch. Collages 29 31 32 44 45 Medical Colleges (Allo./ Ayur./ Homeo/ Unani)
41 41 41 57 52
Enrolment (Figures in number)
Enrolment during the year Courses
2001-02 2002-03 2003-04 2004-05 2005-06
Ph.D/D.Sc./D.Phill. 1549 1619 1808 2501 1286 M.A. 25473 27146 30250 28709 33286 M.Sc. 5362 7137 7962 6018 6426 M.Com. 12386 13971 15588 25220 44893 B.A,/B.A. (Hons) 178240 198727 221539 191080 204516 B.Sc./B.Sc.(Hons.) 52173 54781 61161 35333 64720 B.Com./B.Com(Hons.) 166386 166235 185630 143035 147175 B.E./B.Sc.(Engg/B.Arch.) 28573 31749 32948 34828 32056 Medicine, Dentistry, Nursing, Pharmacy, Ayurvedic & Unani etc.
11040 13134 14652 9549 12313
B.Ed. 4406 5079 2343 10179 12533 Open University - - - - 29786 Polytechnic - - - - 39950 Others 6303 18156 26181 159236 35407 Total 491891 537734 600062 645688 664347
C: Expenditure on Education: Year Gross State
Domestic Product (GSDP)
Expenditure on Education
Expenditure on Education as percentage of GSDP
2001-02 123573 3444.31 2.79 2002-03 141534 4076.09 2.88 2003-04 168080 4535.19 2.70 2004-05 186181 4551.99 2.44 2005-06 216651 4599.04 2.12
E.29
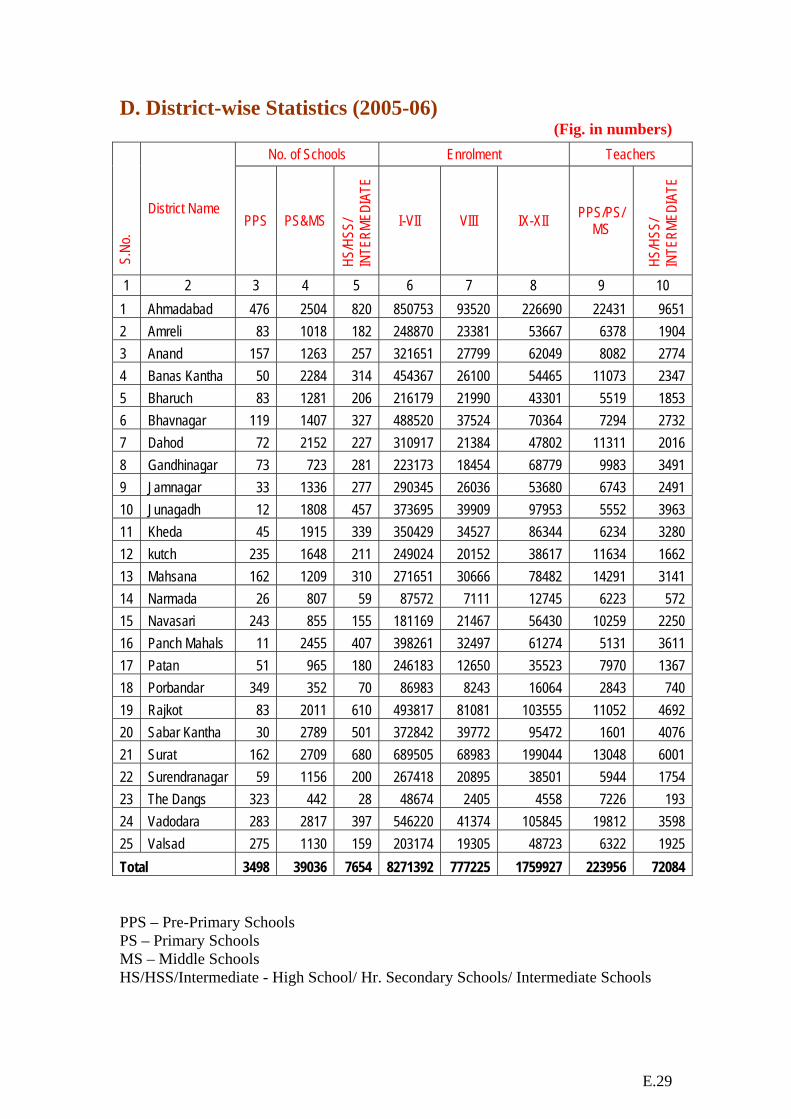
D. District-wise Statistics (2005-06) (Fig. in numbers)
No. of Schools Enrolment Teachers
S.N
o.
District Name PPS PS&MS
HS/H
SS/
INTE
RMED
IATE
I-VII VIII IX-XII PPS/PS/ MS
HS/H
SS/
INTE
RMED
IATE
1 2 3 4 5 6 7 8 9 10 1 Ahmadabad 476 2504 820 850753 93520 226690 22431 9651 2 Amreli 83 1018 182 248870 23381 53667 6378 1904 3 Anand 157 1263 257 321651 27799 62049 8082 2774 4 Banas Kantha 50 2284 314 454367 26100 54465 11073 2347 5 Bharuch 83 1281 206 216179 21990 43301 5519 1853 6 Bhavnagar 119 1407 327 488520 37524 70364 7294 2732 7 Dahod 72 2152 227 310917 21384 47802 11311 2016 8 Gandhinagar 73 723 281 223173 18454 68779 9983 3491 9 Jamnagar 33 1336 277 290345 26036 53680 6743 2491 10 Junagadh 12 1808 457 373695 39909 97953 5552 3963 11 Kheda 45 1915 339 350429 34527 86344 6234 3280 12 kutch 235 1648 211 249024 20152 38617 11634 1662 13 Mahsana 162 1209 310 271651 30666 78482 14291 3141 14 Narmada 26 807 59 87572 7111 12745 6223 572 15 Navasari 243 855 155 181169 21467 56430 10259 2250 16 Panch Mahals 11 2455 407 398261 32497 61274 5131 3611 17 Patan 51 965 180 246183 12650 35523 7970 1367 18 Porbandar 349 352 70 86983 8243 16064 2843 740 19 Rajkot 83 2011 610 493817 81081 103555 11052 4692 20 Sabar Kantha 30 2789 501 372842 39772 95472 1601 4076 21 Surat 162 2709 680 689505 68983 199044 13048 6001 22 Surendranagar 59 1156 200 267418 20895 38501 5944 1754 23 The Dangs 323 442 28 48674 2405 4558 7226 193 24 Vadodara 283 2817 397 546220 41374 105845 19812 3598 25 Valsad 275 1130 159 203174 19305 48723 6322 1925 Total 3498 39036 7654 8271392 777225 1759927 223956 72084 PPS – Pre-Primary Schools PS – Primary Schools MS – Middle Schools HS/HSS/Intermediate - High School/ Hr. Secondary Schools/ Intermediate Schools

E.30
HARYANA
Total Population: 21,144,564 (as per 2001 Census) Estimated 2005 Population: 22884 (in 000) Literacy Rates: Total : 67.91 Male : 78.49 Female : 55.73
A: School Education
No. of Institutions: (Figures in numbers) Number of Schools Years Primary Upper Primary Secondary Sr. Secondary
2001-02 11208 1847 3143 1436 2002-03 9619 2263 3446 1636 2003-04 11500 2171 3344 1776 2004-05 11800 2269 3382 1840 2005-06 12152 2168 3262 2055
Enrolment (Figures in numbers) Enrolment in Classes Years I-V VI-VIII IX-X XI-XII
2001-02 1969544 988889 527646 349282 2002-03 2124184 1099410 553236 376927 2003-04 2010659 1089747 540992 366853 2004-05 2073939 1184814 539421 344313 2005-06 1997491 1159836 541057 331649
Gross Enrolment Ratio Gross Enrolment Ratio in Classes Years I-V VI-VIII IX-XII
2001-02 76.43 65.84 46.40 2002-03 80.98 67.33 47.52 2003-04 75.25 65.51 45.53 2004-05 82.23 76.39 43.60 2005-06 79.61 74.83 42.22
Drop-out Rates Drop-out Rates in Classes Years I-V I-VIII I-X
2001-02 30.51 12.35 35.94 2002-03 6.89 9.90 29.14 2003-04 13.31 21.26 26.54 2004-05 4.81 24.51 32.48 2005-06 5.40 10.63 42.37
E.31
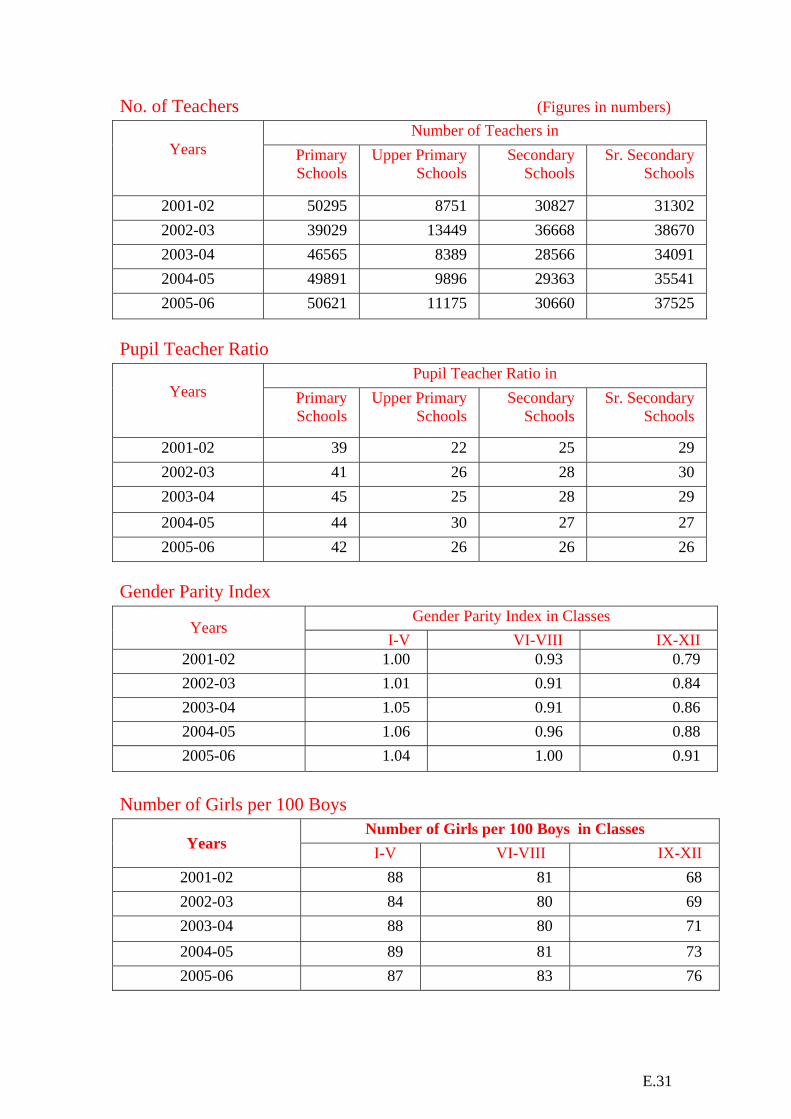
No. of Teachers (Figures in numbers) Number of Teachers in
Years
Primary Schools
Upper Primary Schools
Secondary Schools
Sr. Secondary Schools
2001-02 50295 8751 30827 31302 2002-03 39029 13449 36668 38670 2003-04 46565 8389 28566 34091 2004-05 49891 9896 29363 35541 2005-06 50621 11175 30660 37525
Pupil Teacher Ratio
Pupil Teacher Ratio in Years
Primary Schools
Upper Primary Schools
Secondary Schools
Sr. Secondary Schools
2001-02 39 22 25 29 2002-03 41 26 28 30 2003-04 45 25 28 29 2004-05 44 30 27 27 2005-06 42 26 26 26
Gender Parity Index
Gender Parity Index in Classes Years
I-V VI-VIII IX-XII 2001-02 1.00 0.93 0.79 2002-03 1.01 0.91 0.84 2003-04 1.05 0.91 0.86 2004-05 1.06 0.96 0.88 2005-06 1.04 1.00 0.91
Number of Girls per 100 Boys
Number of Girls per 100 Boys in Classes Years I-V VI-VIII IX-XII
2001-02 88 81 68 2002-03 84 80 69 2003-04 88 80 71 2004-05 89 81 73 2005-06 87 83 76

E.32
B. Tertiary Education:
Number of Institutions (Figures in number) Institutions/Universities 2001-02 2002-03 2003-04 2004-05 2005-06 Universities 4 4 4 5 5 Deemed to be Universities 1 3 3 3 3 Instt. of National Importance 0 0 0 0 0 Research Institutes 0 0 0 0 0 Colleges for General Education 154 155 163 166 168 Engg., Tech & Arch. Collages 28 41 41 69 45 Medical Colleges (Allo./ Ayur./ Homeo/ Unani)
8 8 8 8 35
Enrolment (Figures in number)
Enrolment during the year Courses
2001-02 2002-03 2003-04 2004-05 2005-06
Ph.D/D.Sc./D.Phill. 972 856 1113 1371 1925 M.A. 8150 8511 9678 8586 11112 M.Sc. 2179 1991 4142 3238 4294 M.Com. 1345 1247 2026 2281 2182 B.A,/B.A. (Hons) 131534 136990 130871 122145 124390 B.Sc./B.Sc.(Hons.) 18816 19262 22183 20513 20867 B.Com./B.Com(Hons.) 27592 28966 26607 30427 26711 B.E./B.Sc.(Engg/B.Arch.) 22152 29771 31187 38942 48424 Medicine, Dentistry, Nursing, Pharmacy, Ayurvedic & Unani etc.
2504 2512 2571 2661 4706
B.Ed. 1858 2897 398 3375 3843 Open University - - - - 0 Polytechnic - - - - 18900 Others 22115 14263 20251 30792 30792 Total 239217 257266 251027 264331 298146 C: Expenditure on Education: Year Gross State
Domestic Product (GSDP)
Expenditure on Education
Expenditure on Education as percentage of GSDP
2001-02 65505 1637.66 2.50 2002-03 72544 1680.07 2.32 2003-04 82468 1785.17 2.16 2004-05 93627 1894.47 2.02 2005-06 106385 2375.15 2.23

E.33
D. District-wise Statistics (2005-06) (Fig. in numbers)
No. of Schools Enrolment Teachers
S.No
.
District Name PPS PS MS
HS/H
SS/
INTE
RMED
IATE
I-V VI-VIII IX-XII PPS/PS
MS/HS/HSS
HS/H
SS/
INTE
RMED
IATE
1 2 3 4 5 6 7 8 9 10 11 12
1 Ambala 1 588 100 214 64318 69685 51820 1891 277 3731
2 Bhiwani 5 1003 222 586 163516 119297 74849 4314 577 8124
3 Faridabad 0 1298 120 591 224192 112657 76054 5704 736 9431
4 Fatehabad 0 361 75 193 62343 39491 29161 1486 457 1479
5 Gurgaon 1 954 63 227 170812 40339 35443 4098 209 3136
6 Hisar 1 587 134 481 118829 76301 59525 2734 1115 5480
7 Jhajjar 0 565 123 314 113464 55603 46644 2916 781 3353
8 Jind 1 683 134 343 135507 78351 52795 3154 813 3604
9 Kaithal 3 519 108 167 100470 47520 34156 2741 321 1585
10 Karnal 1 636 130 226 110135 65882 52660 2318 757 2820
11 Kurukshetra 2 611 103 157 76119 45977 38921 2075 363 1703
12 Narnaul (Mahendragarh) 1 817 133 205 113646 42624 34429 2750 475 2365
13 Panchkula 0 289 64 95 33917 23479 16648 949 351 1134
14 Panipat 0 294 70 181 65192 40094 35408 1314 462 2038
15 Rewari 0 536 89 164 63119 45258 37442 1914 526 1754
16 Rohtak 1 399 60 313 86805 51834 48267 2491 864 3293
17 Sirsa 5 587 143 243 96463 58003 42260 2412 721 2223
18 Sonipat 5 700 154 373 118484 99739 68116 3186 1165 5521
19 Yamunanagar 0 725 143 244 80160 47702 38108 2174 205 5411
Total 27 12152 2168 5317 1997491 1159836 872706 50621 11175 68185 PPS – Pre-Primary Schools PS – Primary Schools MS – Middle Schools HS/HSS/Intermediate - High School/ Hr. Secondary Schools/ Intermediate Schools
E.34
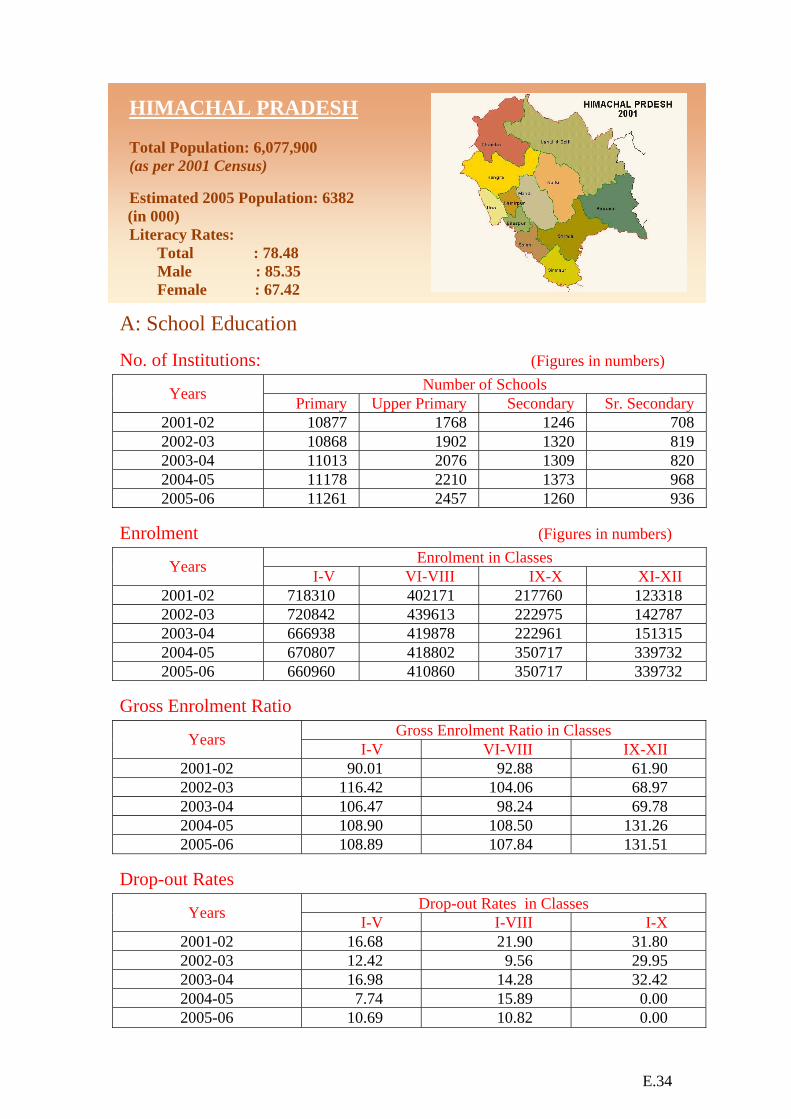
HIMACHAL PRADESH
Total Population: 6,077,900 (as per 2001 Census) Estimated 2005 Population: 6382
(in 000) Literacy Rates: Total : 78.48 Male : 85.35 Female : 67.42
A: School Education
No. of Institutions: (Figures in numbers) Number of Schools Years Primary Upper Primary Secondary Sr. Secondary
2001-02 10877 1768 1246 708 2002-03 10868 1902 1320 819 2003-04 11013 2076 1309 820 2004-05 11178 2210 1373 968 2005-06 11261 2457 1260 936
Enrolment (Figures in numbers) Enrolment in Classes Years I-V VI-VIII IX-X XI-XII
2001-02 718310 402171 217760 123318 2002-03 720842 439613 222975 142787 2003-04 666938 419878 222961 151315 2004-05 670807 418802 350717 339732 2005-06 660960 410860 350717 339732
Gross Enrolment Ratio Gross Enrolment Ratio in Classes Years I-V VI-VIII IX-XII
2001-02 90.01 92.88 61.90 2002-03 116.42 104.06 68.97 2003-04 106.47 98.24 69.78 2004-05 108.90 108.50 131.26 2005-06 108.89 107.84 131.51
Drop-out Rates Drop-out Rates in Classes Years I-V I-VIII I-X
2001-02 16.68 21.90 31.80 2002-03 12.42 9.56 29.95 2003-04 16.98 14.28 32.42 2004-05 7.74 15.89 0.00 2005-06 10.69 10.82 0.00

E.35
No. of Teachers (Figures in numbers)
Number of Teachers in Years
Primary Schools
Upper Primary Schools
Secondary Schools
Sr. Secondary Schools
2001-02 29201 7836 11053 13614 2002-03 29018 9900 13242 17754 2003-04 28738 9199 11761 15093 2004-05 28201 13747 13735 16654 2005-06 30948 13417 12415 19490
Pupil Teacher Ratio
Pupil Teacher Ratio in Years
Primary Schools
Upper Primary Schools
Secondary Schools
Sr. Secondary Schools
2001-02 23 16 28 28
2002-03 22 15 24 24
2003-04 21 17 28 26
2004-05 24 30 26 20
2005-06 23 15 30 27
Gender Parity Index Gender Parity Index in Classes
Years I-V VI-VIII IX-XII
2001-02 0.83 0.87 0.84 2002-03 1.00 0.95 0.92 2003-04 1.01 0.97 0.93 2004-05 0.99 0.97 0.93 2005-06 1.01 0.97 0.94
Number of Girls per 100 Boys Number of Girls per 100 Boys in Classes
Years I-V VI-VIII IX-XII
2001-02 93 91 86 2002-03 91 90 87 2003-04 92 92 88 2004-05 91 91 88
2005-06 91 90 88
E.36
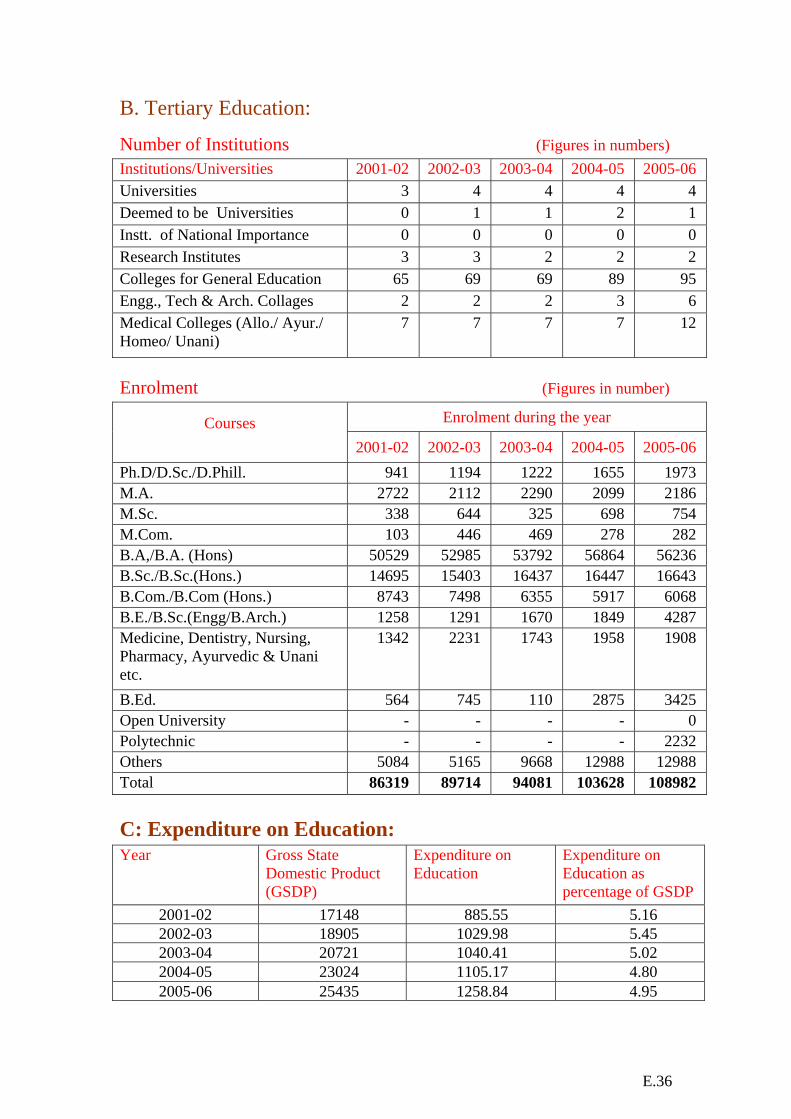
B. Tertiary Education:
Number of Institutions (Figures in numbers) Institutions/Universities 2001-02 2002-03 2003-04 2004-05 2005-06 Universities 3 4 4 4 4 Deemed to be Universities 0 1 1 2 1 Instt. of National Importance 0 0 0 0 0 Research Institutes 3 3 2 2 2 Colleges for General Education 65 69 69 89 95 Engg., Tech & Arch. Collages 2 2 2 3 6 Medical Colleges (Allo./ Ayur./ Homeo/ Unani)
7 7 7 7 12
Enrolment (Figures in number)
Enrolment during the year Courses 2001-02 2002-03 2003-04 2004-05 2005-06
Ph.D/D.Sc./D.Phill. 941 1194 1222 1655 1973 M.A. 2722 2112 2290 2099 2186 M.Sc. 338 644 325 698 754 M.Com. 103 446 469 278 282 B.A,/B.A. (Hons) 50529 52985 53792 56864 56236 B.Sc./B.Sc.(Hons.) 14695 15403 16437 16447 16643 B.Com./B.Com (Hons.) 8743 7498 6355 5917 6068 B.E./B.Sc.(Engg/B.Arch.) 1258 1291 1670 1849 4287 Medicine, Dentistry, Nursing, Pharmacy, Ayurvedic & Unani etc.
1342 2231 1743 1958 1908
B.Ed. 564 745 110 2875 3425 Open University - - - - 0 Polytechnic - - - - 2232 Others 5084 5165 9668 12988 12988 Total 86319 89714 94081 103628 108982 C: Expenditure on Education: Year Gross State
Domestic Product (GSDP)
Expenditure on Education
Expenditure on Education as percentage of GSDP
2001-02 17148 885.55 5.16 2002-03 18905 1029.98 5.45 2003-04 20721 1040.41 5.02 2004-05 23024 1105.17 4.80 2005-06 25435 1258.84 4.95

E.37
D: District-wise Statistics (2005-06) (Fig. in numbers)
No. of Schools Enrolment Teachers
S.No
.
District Name PPS PS MS
HS/H
SS/
INTE
RMED
IATE
I-V VI-VIII IX-XII PPS/PS MS
HS/H
SS/
INTE
RMED
IATE
1 2 3 4 5 6 7 8 9 10 11 12
1 Bilaspur 1 666 149 138 34508 22823 41555 1701 837 1956
2 Chamba 1 1110 232 149 60868 31047 40989 2816 1290 2173
3 Hamirpur 0 597 166 195 41895 26931 58562 1976 930 2917
4 Kangra 1 1915 447 366 140331 88483 153193 5459 2471 5438
5 Kinnaur 0 202 40 43 8888 5155 7949 529 244 608
6 Kullu 0 752 121 119 47762 29661 37857 2154 685 1564
7 Lahul and Spiti 0 208 37 28 2903 1649 2385 506 227 430
8 Mandi 1 1840 412 392 96789 62615 110254 5154 2143 5721
9 Shimla 2 1638 354 344 71443 43568 86313 3891 1794 4818
10 Sirmaur 4 977 182 130 52923 34342 41754 2570 1017 1850
11 Solan 0 789 180 147 54807 34152 60318 2289 1006 2215
12 Una 0 567 137 145 47843 30434 49320 1903 773 2215
Total 10 11261 2457 2196 660960 410860 690449 30948 13417 31905 PPS – Pre-Primary Schools PS – Primary Schools MS – Middle Schools HS/HSS/Intermediate - High School/ Hr. Secondary Schools/ Intermediate Schools
E.38
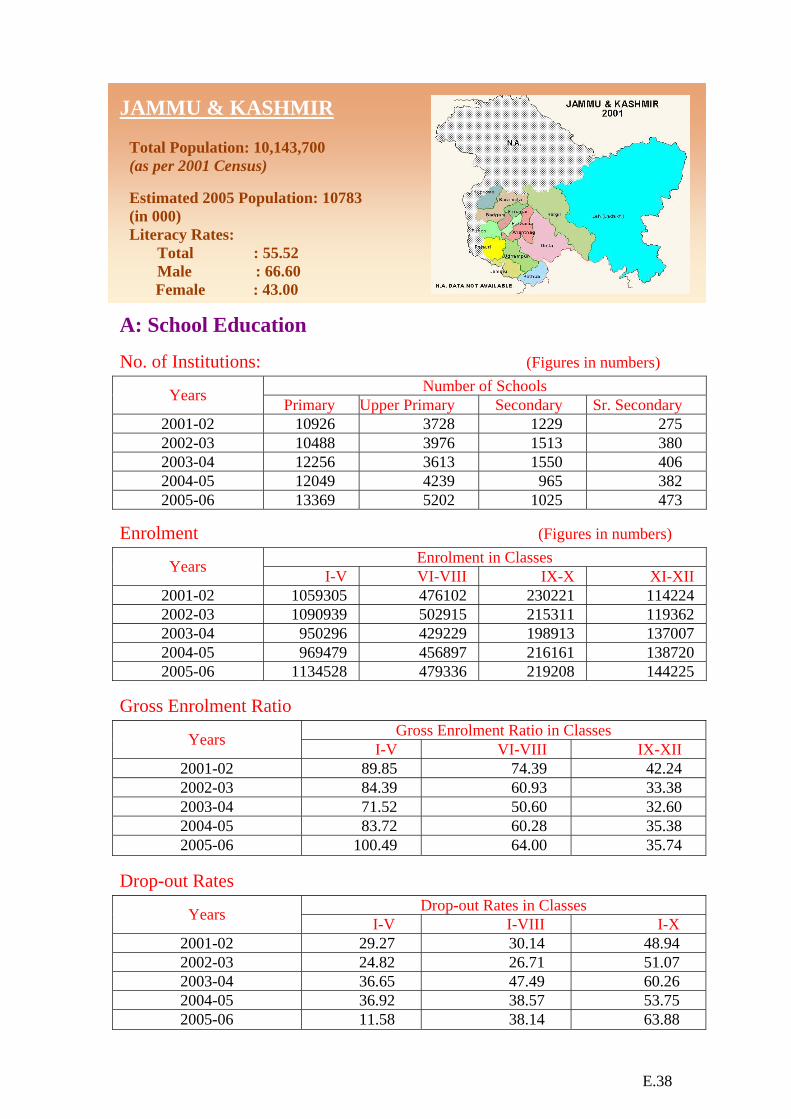
JAMMU & KASHMIR
Total Population: 10,143,700 (as per 2001 Census) Estimated 2005 Population: 10783 (in 000) Literacy Rates: Total : 55.52 Male : 66.60
Female : 43.00
A: School Education No. of Institutions: (Figures in numbers)
Number of Schools Years Primary Upper Primary Secondary Sr. Secondary 2001-02 10926 3728 1229 275 2002-03 10488 3976 1513 380 2003-04 12256 3613 1550 406 2004-05 12049 4239 965 382 2005-06 13369 5202 1025 473
Enrolment (Figures in numbers) Enrolment in Classes Years I-V VI-VIII IX-X XI-XII
2001-02 1059305 476102 230221 114224 2002-03 1090939 502915 215311 119362 2003-04 950296 429229 198913 137007 2004-05 969479 456897 216161 138720 2005-06 1134528 479336 219208 144225
Gross Enrolment Ratio Gross Enrolment Ratio in Classes Years I-V VI-VIII IX-XII
2001-02 89.85 74.39 42.24 2002-03 84.39 60.93 33.38 2003-04 71.52 50.60 32.60 2004-05 83.72 60.28 35.38 2005-06 100.49 64.00 35.74
Drop-out Rates Drop-out Rates in Classes Years I-V I-VIII I-X
2001-02 29.27 30.14 48.94 2002-03 24.82 26.71 51.07 2003-04 36.65 47.49 60.26 2004-05 36.92 38.57 53.75 2005-06 11.58 38.14 63.88
E.39
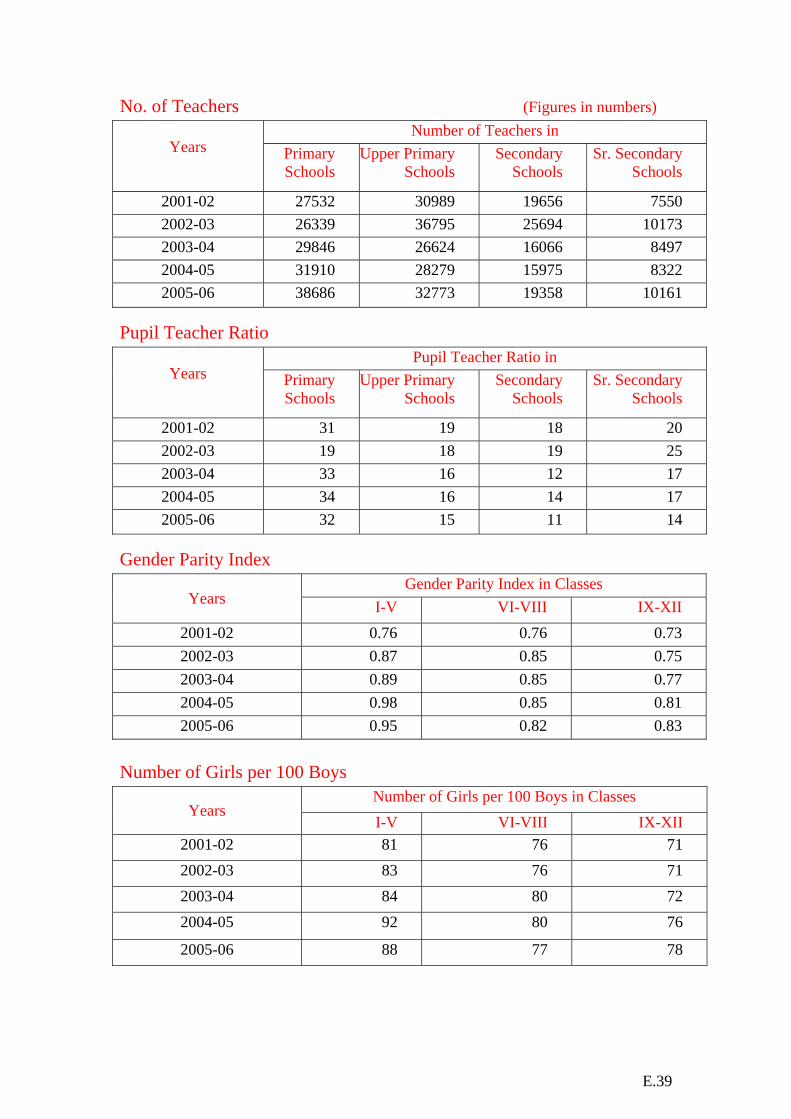
No. of Teachers (Figures in numbers) Number of Teachers in
Years
Primary Schools
Upper Primary Schools
Secondary Schools
Sr. Secondary Schools
2001-02 27532 30989 19656 7550 2002-03 26339 36795 25694 10173 2003-04 29846 26624 16066 8497 2004-05 31910 28279 15975 8322 2005-06 38686 32773 19358 10161
Pupil Teacher Ratio Pupil Teacher Ratio in
Years
Primary Schools
Upper Primary Schools
Secondary Schools
Sr. Secondary Schools
2001-02 31 19 18 20 2002-03 19 18 19 25 2003-04 33 16 12 17 2004-05 34 16 14 17 2005-06 32 15 11 14
Gender Parity Index Gender Parity Index in Classes
Years I-V VI-VIII IX-XII 2001-02 0.76 0.76 0.73 2002-03 0.87 0.85 0.75 2003-04 0.89 0.85 0.77 2004-05 0.98 0.85 0.81 2005-06 0.95 0.82 0.83
Number of Girls per 100 Boys
Number of Girls per 100 Boys in Classes Years
I-V VI-VIII IX-XII 2001-02 81 76 71 2002-03 83 76 71 2003-04 84 80 72 2004-05 92 80 76
2005-06 88 77 78
E.40
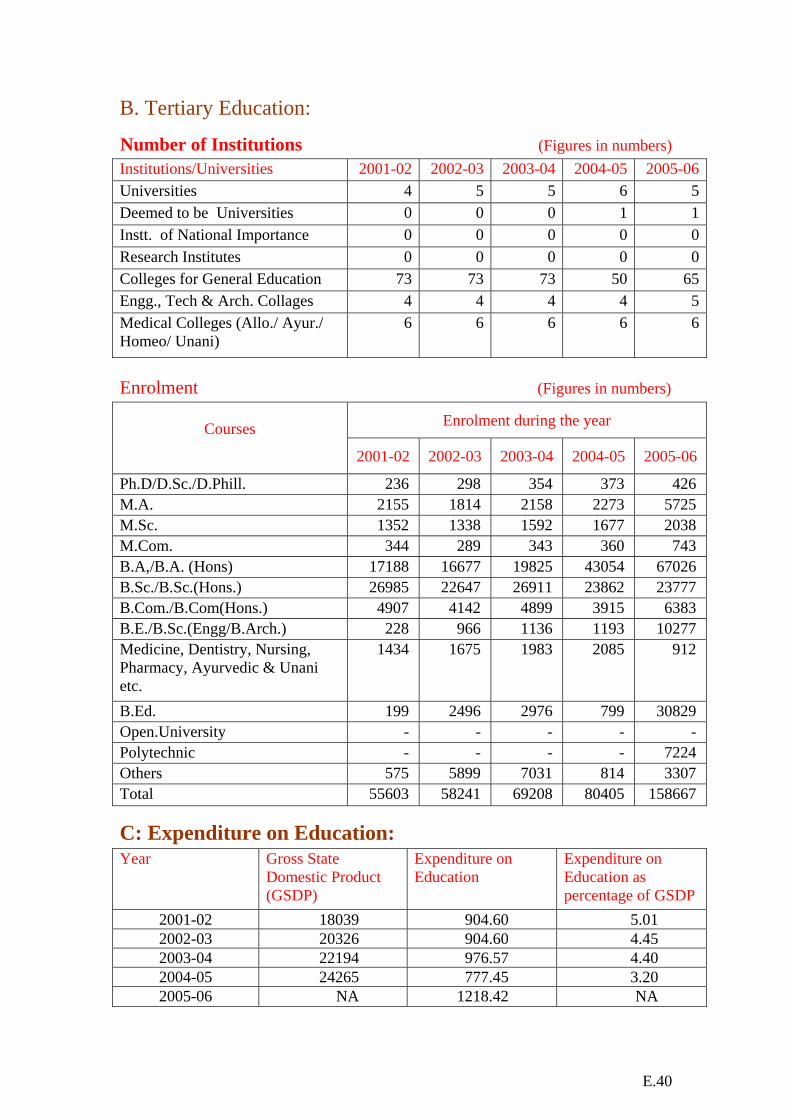
B. Tertiary Education:
Number of Institutions (Figures in numbers) Institutions/Universities 2001-02 2002-03 2003-04 2004-05 2005-06Universities 4 5 5 6 5Deemed to be Universities 0 0 0 1 1Instt. of National Importance 0 0 0 0 0Research Institutes 0 0 0 0 0Colleges for General Education 73 73 73 50 65Engg., Tech & Arch. Collages 4 4 4 4 5Medical Colleges (Allo./ Ayur./ Homeo/ Unani)
6 6 6 6 6
Enrolment (Figures in numbers)
Enrolment during the year Courses 2001-02 2002-03 2003-04 2004-05 2005-06
Ph.D/D.Sc./D.Phill. 236 298 354 373 426 M.A. 2155 1814 2158 2273 5725 M.Sc. 1352 1338 1592 1677 2038 M.Com. 344 289 343 360 743 B.A,/B.A. (Hons) 17188 16677 19825 43054 67026 B.Sc./B.Sc.(Hons.) 26985 22647 26911 23862 23777 B.Com./B.Com(Hons.) 4907 4142 4899 3915 6383 B.E./B.Sc.(Engg/B.Arch.) 228 966 1136 1193 10277 Medicine, Dentistry, Nursing, Pharmacy, Ayurvedic & Unani etc.
1434 1675 1983 2085 912
B.Ed. 199 2496 2976 799 30829 Open.University - - - - - Polytechnic - - - - 7224 Others 575 5899 7031 814 3307 Total 55603 58241 69208 80405 158667
C: Expenditure on Education: Year Gross State
Domestic Product (GSDP)
Expenditure on Education
Expenditure on Education as percentage of GSDP
2001-02 18039 904.60 5.01 2002-03 20326 904.60 4.45 2003-04 22194 976.57 4.40 2004-05 24265 777.45 3.20 2005-06 NA 1218.42 NA

E.41
D. District-wise Statistics- 2005-06 No. of Schools Enrolment Teachers
S.No
.
District Name PPS PS MS
HS/H
SS/
INTE
RMED
IATE
I-V VI-VIII IX-XII PPS/PS MS
HS/H
SS/
INTE
RMED
IATE
1 2 3 4 5 6 7 8 9 10 11 12
1 Anantnag 0 1619 614 135 144337 70225 43392 3967 4313 2807
2 Baramulla 0 1224 541 176 113514 54267 47250 3767 3038 2643
3 Budgam 0 630 283 86 64624 31506 17811 2291 1430 1188
4 Doda 0 1191 376 143 104703 29932 19726 1032 1099 996
5 Jammu 0 1233 757 178 197262 91012 80367 5358 6640 7020
6 Kargil 0 313 136 49 11199 6345 5995 940 636 700
7 Kathua 0 773 330 103 42694 23994 19084 1619 1648 1048
8 Kupwara 0 874 376 81 53748 25836 17159 2988 1684 1362
9 Leh 0 225 71 38 4173 1895 3145 472 290 473
10 Poonch 0 1047 313 63 61313 18580 13076 2202 1370 1185
11 Pulwama 0 919 314 96 62793 32914 22425 2015 1873 1352
12 Rajouri 0 798 442 103 90443 22097 18829 2072 2506 2177
13 Srinagar 0 418 224 105 64549 30425 29043 2197 2749 3839
14 Udhampur 0 2105 425 142 119176 40308 26131 7766 3497 2729
Total 0 13369 5202 1498 1134528 479336 363433 38686 32773 29519 PPS – Pre-Primary Schools PS – Primary Schools MS – Middle Schools HS/HSS/Intermediate - High School/ Hr. Secondary Schools/ Intermediate Schools

E.42
JHARKHAND
Total Population: 26,945,829 (as per 2001 Census) Estimated 2005 Population: 28846 (in 000) Literacy Rates: Total : 53.56 Male :67.30 Female :38.87
A: School Education
No. of Institutions: (Figures in numbers) Number of Schools Years Primary Upper Primary Secondary Sr. Secondary
2001-02 16643 4187 1048 109 2002-03 17059 4270 1161 331 2003-04 16417 4324 966 122 2004-05 16572 4933 1068 128 2005-06 16186 6232 1045 117
Enrolment (Figures in numbers) Enrolment in Classes Years I-V VI-VIII IX-X XI-XII
2001-02 2854183 776449 313339 12279 2002-03 2919790 698085 287932 45784 2003-04 3140252 847119 329731 44334 2004-05 3446984 924259 350135 30621 2005-06 3827742 986383 372540 41849
Gross Enrolment Ratio Gross Enrolment Ratio in Classes Years I-V VI-VIII IX-XII
2001-02 88.56 37.56 13.52 2002-03 74.79 31.46 20.71 2003-04 79.09 37.54 14.80 2004-05 94.80 43.41 14.80 2005-06 105.19 45.77 15.54
Drop-out Rates Drop-out Rates in Classes Years I-V I-VIII I-X
2001-02 - - - 2002-03 - - - 2003-04 - - - 2004-05 - - - 2005-06 50.18 - -

E.43
No. of Teachers: (Figures in numbers)
Number of Teachers in Years
Primary Schools
Upper Primary Schools
Secondary Schools
Sr. Secondary Schools
2001-02 31432 26498 9845 2735 2002-03 30193 26301 10750 7335 2003-04 31150 26536 9828 3682 2004-05 30102 28242 9472 3873 2005-06 32764 31619 10006 4472
Pupil Teacher Ratio
Pupil Teacher Ratio in Years
Primary Schools
Upper Primary Schools
Secondary Schools
Sr. Secondary Schools
2001-02 65 53 44 25 2002-03 59 57 42 32 2003-04 73 60 46 29 2004-05 81 61 54 20 2005-06 79 63 52 29
Gender Parity Index
Gender Parity Index in Classes Years
I-V VI-VIII IX-XII 2001-02 0.76 0.70 0.63 2002-03 0.84 0.73 0.64 2003-04 0.82 0.76 0.69 2004-05 0.84 0.75 0.67 2005-06 0.86 0.75 0.67
Number of Girls per 100 Boys
Number of Girls per 100 Boys in Classes Years I-V VI-VIII IX-XII
2001-02 74 65 54
2002-03 79 67 56
2003-04 78 70 60
2004-05 80 70 61
2005-06 83 70 62
E.44
B. Tertiary Education:
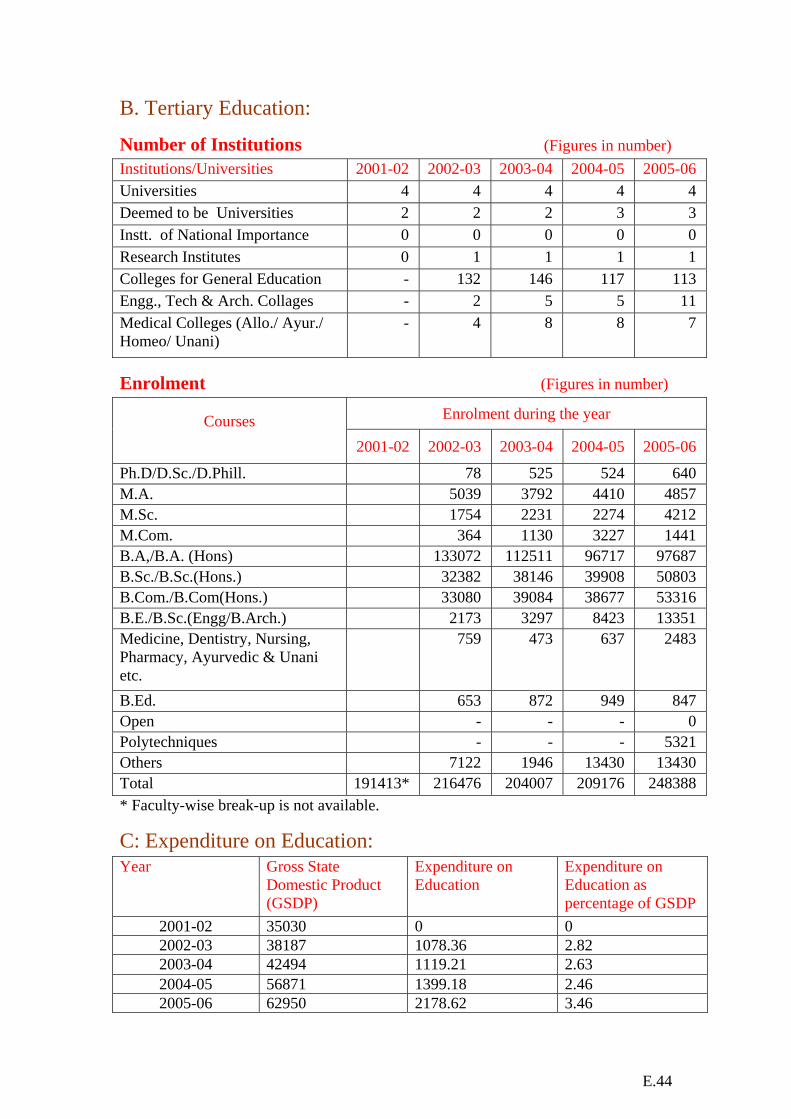
Number of Institutions (Figures in number) Institutions/Universities 2001-02 2002-03 2003-04 2004-05 2005-06 Universities 4 4 4 4 4 Deemed to be Universities 2 2 2 3 3 Instt. of National Importance 0 0 0 0 0 Research Institutes 0 1 1 1 1 Colleges for General Education - 132 146 117 113 Engg., Tech & Arch. Collages - 2 5 5 11 Medical Colleges (Allo./ Ayur./ Homeo/ Unani)
- 4 8 8 7
Enrolment (Figures in number)
Enrolment during the year Courses 2001-02 2002-03 2003-04 2004-05 2005-06
Ph.D/D.Sc./D.Phill. 78 525 524 640 M.A. 5039 3792 4410 4857 M.Sc. 1754 2231 2274 4212 M.Com. 364 1130 3227 1441 B.A,/B.A. (Hons) 133072 112511 96717 97687 B.Sc./B.Sc.(Hons.) 32382 38146 39908 50803 B.Com./B.Com(Hons.) 33080 39084 38677 53316 B.E./B.Sc.(Engg/B.Arch.) 2173 3297 8423 13351 Medicine, Dentistry, Nursing, Pharmacy, Ayurvedic & Unani etc.
759 473 637 2483
B.Ed. 653 872 949 847 Open - - - 0 Polytechniques - - - 5321 Others 7122 1946 13430 13430 Total 191413* 216476 204007 209176 248388 * Faculty-wise break-up is not available.
C: Expenditure on Education: Year Gross State
Domestic Product (GSDP)
Expenditure on Education
Expenditure on Education as percentage of GSDP
2001-02 35030 0 0 2002-03 38187 1078.36 2.82 2003-04 42494 1119.21 2.63 2004-05 56871 1399.18 2.46 2005-06 62950 2178.62 3.46
E.45
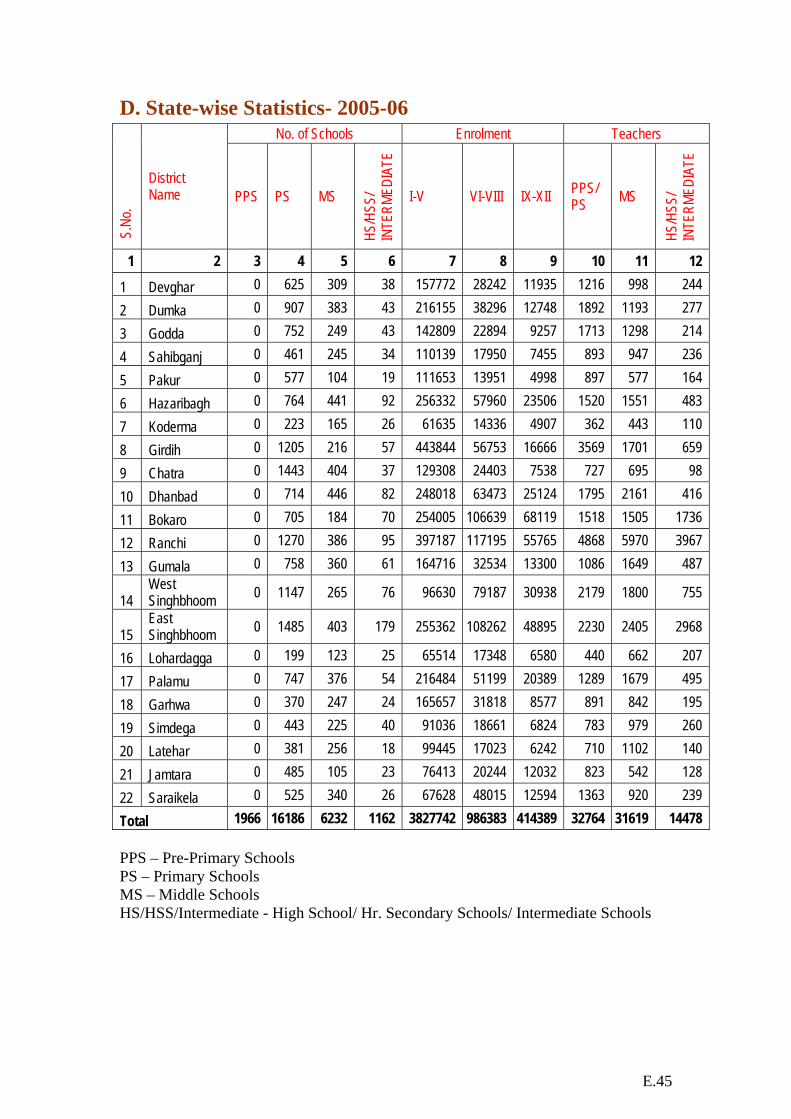
D. State-wise Statistics- 2005-06 No. of Schools Enrolment Teachers
S.N
o.
District Name PPS PS MS
HS/H
SS/
INTE
RMED
IATE
I-V VI-VIII IX-XII PPS/PS MS
HS/H
SS/
INTE
RMED
IATE
1 2 3 4 5 6 7 8 9 10 11 12
1 Devghar 0 625 309 38 157772 28242 11935 1216 998 244
2 Dumka 0 907 383 43 216155 38296 12748 1892 1193 277
3 Godda 0 752 249 43 142809 22894 9257 1713 1298 214
4 Sahibganj 0 461 245 34 110139 17950 7455 893 947 236
5 Pakur 0 577 104 19 111653 13951 4998 897 577 164
6 Hazaribagh 0 764 441 92 256332 57960 23506 1520 1551 483
7 Koderma 0 223 165 26 61635 14336 4907 362 443 110
8 Girdih 0 1205 216 57 443844 56753 16666 3569 1701 659
9 Chatra 0 1443 404 37 129308 24403 7538 727 695 98
10 Dhanbad 0 714 446 82 248018 63473 25124 1795 2161 416
11 Bokaro 0 705 184 70 254005 106639 68119 1518 1505 1736
12 Ranchi 0 1270 386 95 397187 117195 55765 4868 5970 3967
13 Gumala 0 758 360 61 164716 32534 13300 1086 1649 487
14 West Singhbhoom 0 1147 265 76 96630 79187 30938 2179 1800 755
15 East Singhbhoom 0 1485 403 179 255362 108262 48895 2230 2405 2968
16 Lohardagga 0 199 123 25 65514 17348 6580 440 662 207
17 Palamu 0 747 376 54 216484 51199 20389 1289 1679 495
18 Garhwa 0 370 247 24 165657 31818 8577 891 842 195
19 Simdega 0 443 225 40 91036 18661 6824 783 979 260
20 Latehar 0 381 256 18 99445 17023 6242 710 1102 140
21 Jamtara 0 485 105 23 76413 20244 12032 823 542 128
22 Saraikela 0 525 340 26 67628 48015 12594 1363 920 239
Total 1966 16186 6232 1162 3827742 986383 414389 32764 31619 14478 PPS – Pre-Primary Schools PS – Primary Schools MS – Middle Schools HS/HSS/Intermediate - High School/ Hr. Secondary Schools/ Intermediate Schools
E.46
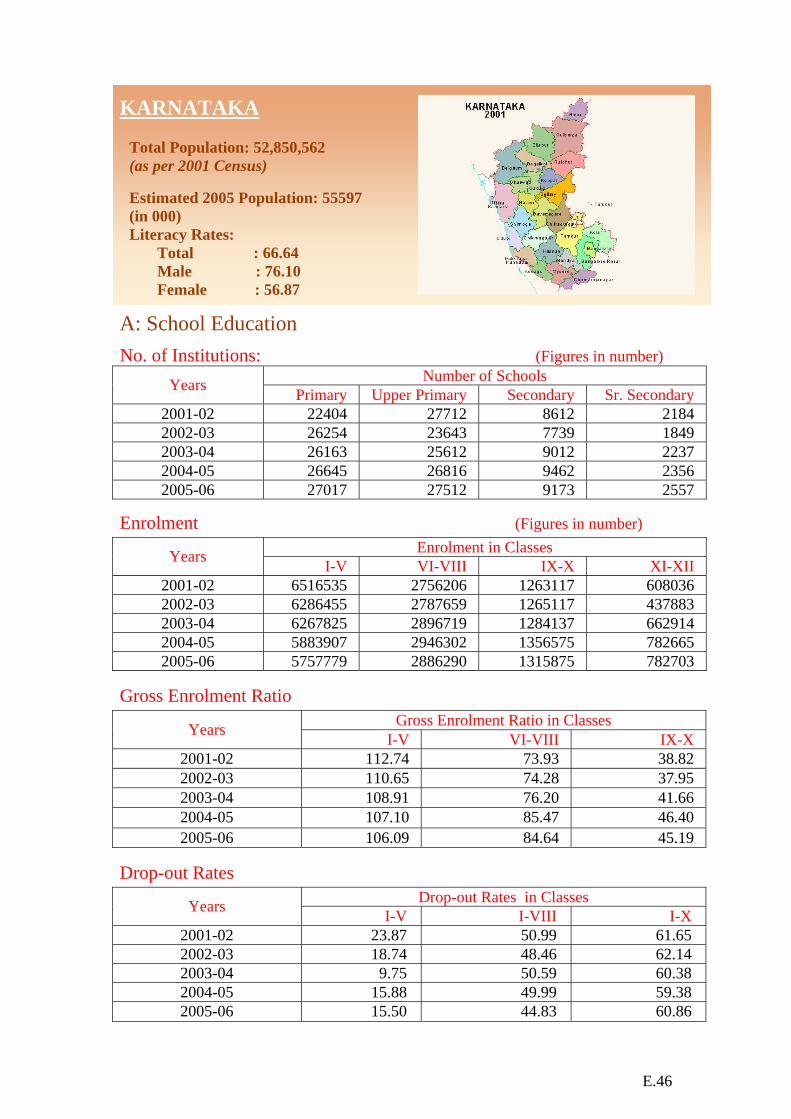
KARNATAKA
Total Population: 52,850,562 (as per 2001 Census) Estimated 2005 Population: 55597 (in 000) Literacy Rates: Total : 66.64 Male : 76.10 Female : 56.87
A: School Education
No. of Institutions: (Figures in number) Number of Schools Years Primary Upper Primary Secondary Sr. Secondary
2001-02 22404 27712 8612 2184 2002-03 26254 23643 7739 1849 2003-04 26163 25612 9012 2237 2004-05 26645 26816 9462 2356 2005-06 27017 27512 9173 2557
Enrolment (Figures in number) Enrolment in Classes Years I-V VI-VIII IX-X XI-XII
2001-02 6516535 2756206 1263117 608036 2002-03 6286455 2787659 1265117 437883 2003-04 6267825 2896719 1284137 662914 2004-05 5883907 2946302 1356575 782665 2005-06 5757779 2886290 1315875 782703
Gross Enrolment Ratio Gross Enrolment Ratio in Classes Years I-V VI-VIII IX-X
2001-02 112.74 73.93 38.82 2002-03 110.65 74.28 37.95 2003-04 108.91 76.20 41.66 2004-05 107.10 85.47 46.40 2005-06 106.09 84.64 45.19
Drop-out Rates Drop-out Rates in Classes Years I-V I-VIII I-X
2001-02 23.87 50.99 61.65 2002-03 18.74 48.46 62.14 2003-04 9.75 50.59 60.38 2004-05 15.88 49.99 59.38 2005-06 15.50 44.83 60.86

E.47
No. of Teachers (Figures in numbers) Number of Teachers in
Years
Primary Schools
Upper Primary Schools
Secondary Schools
Sr. Secondary Schools
2001-02 47504 186596 79347 10481 2002-03 61004 167451 72048 30723 2003-04 51308 189768 76852 18940 2004-05 64271 192418 76929 16482 2005-06 55973 197603 89168 16527
Pupil Teacher Ratio
Pupil Teacher Ratio in Years
Primary Schools
Upper Primary Schools
Secondary Schools
Sr. Secondary Schools
2001-02 30 39 25 58 2002-03 26 37 27 35 2003-04 34 39 17 35 2004-05 26 37 18 47 2005-06 26 32 24 47
Gender Parity Index
Gender Parity Index in Classes Years I-V VI-VIII IX-XII
2001-02 0.93 0.90 0.85 2002-03 0.97 0.92 0.88 2003-04 0.97 0.93 0.94 2004-05 0.98 0.95 0.94 2005-06 0.98 0.97 0.95
Number of Girls per 100 Boys
Number of Girls per 100 Boys in Classes Years I-V VI-VIII IX-XII
2001-02 90 89 82
2002-03 94 88 81
2003-04 94 89 87
2004-05 94 90 88
2005-06 94 92 89
E.48
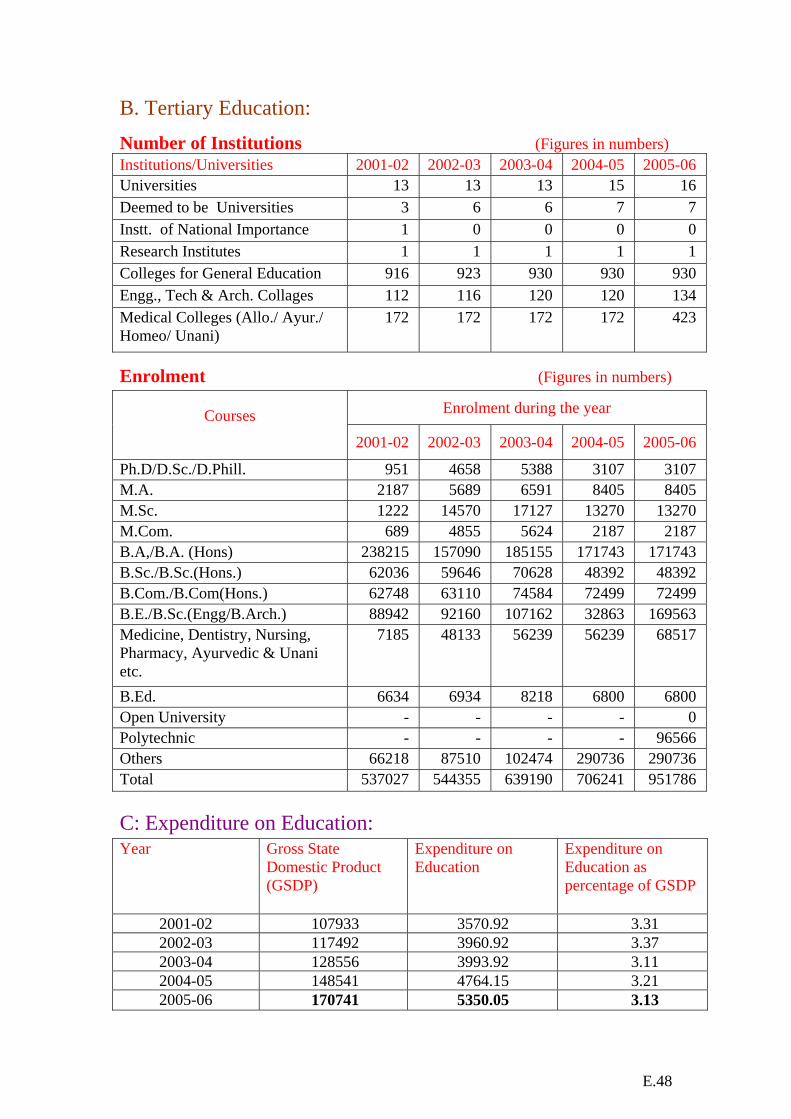
B. Tertiary Education:
Number of Institutions (Figures in numbers) Institutions/Universities 2001-02 2002-03 2003-04 2004-05 2005-06 Universities 13 13 13 15 16 Deemed to be Universities 3 6 6 7 7 Instt. of National Importance 1 0 0 0 0 Research Institutes 1 1 1 1 1 Colleges for General Education 916 923 930 930 930 Engg., Tech & Arch. Collages 112 116 120 120 134 Medical Colleges (Allo./ Ayur./ Homeo/ Unani)
172 172 172 172 423
Enrolment (Figures in numbers)
Enrolment during the year Courses 2001-02 2002-03 2003-04 2004-05 2005-06
Ph.D/D.Sc./D.Phill. 951 4658 5388 3107 3107 M.A. 2187 5689 6591 8405 8405 M.Sc. 1222 14570 17127 13270 13270 M.Com. 689 4855 5624 2187 2187 B.A,/B.A. (Hons) 238215 157090 185155 171743 171743 B.Sc./B.Sc.(Hons.) 62036 59646 70628 48392 48392 B.Com./B.Com(Hons.) 62748 63110 74584 72499 72499 B.E./B.Sc.(Engg/B.Arch.) 88942 92160 107162 32863 169563 Medicine, Dentistry, Nursing, Pharmacy, Ayurvedic & Unani etc.
7185 48133 56239 56239 68517
B.Ed. 6634 6934 8218 6800 6800 Open University - - - - 0 Polytechnic - - - - 96566 Others 66218 87510 102474 290736 290736 Total 537027 544355 639190 706241 951786 C: Expenditure on Education: Year Gross State
Domestic Product (GSDP)
Expenditure on Education
Expenditure on Education as percentage of GSDP
2001-02 107933 3570.92 3.31 2002-03 117492 3960.92 3.37 2003-04 128556 3993.92 3.11 2004-05 148541 4764.15 3.21 2005-06 170741 5350.05 3.13

E.49
D: State-wise Statistics; 2005-06 (Fig. in numbers)
No. of Schools Enrolment Teachers S.
No.
District Name PPS PS MS
HS/H
SS/
INTE
RMED
IATE
I-V VI-VIII IX-XII
PRIM
ARY
AND
MIDD
LE HS
1 2 3 4 5 6 7 8 9 10 11 1 Bagalkot 0 613 859 335 210538 98411 62836 9328 2632 2 Bangalore (R) 0 1837 1066 478 170083 101519 87582 11844 3819 3 Banglore (U) 0 1335 2608 1711 618315 317533 276138 11957 19238 4 Belgaum 0 1661 1960 757 524048 272646 175887 21288 6890 5 Bellary 0 801 908 347 275261 119205 71931 9881 2922 6 Bidar 0 488 866 354 212126 87730 53981 9381 2910 8 Bijapur 0 926 1178 430 290936 120372 76020 10653 3157 9 Chamarajnagar 0 446 482 192 86263 50403 35899 4452 1466 10 Chikmagalur 0 931 746 258 96060 51175 36953 6089 1914 11 Chitradurga 0 989 895 393 163987 92724 70807 8363 3255
12 Dakshin Kannad 0 412 992 455 180246 113819 97759 8432 4305
13 Dharwad 0 323 691 283 158133 83666 56460 9878 4104 14 Davanagore 0 843 984 486 199606 108281 81419 7498 2674 15 Gadag 0 256 480 237 108563 57347 39749 5021 1933 16 Gulbarga 0 1491 1310 514 410216 138387 71926 13131 3385 17 Hassan 0 1638 1186 410 148663 81759 66896 9866 2938 18 Haveri 0 499 762 320 164586 85816 61327 7034 2746 19 Kodagu 0 201 311 151 50408 27351 25005 2976 1313 25 Kolar 0 2416 1440 446 251988 135559 96708 14940 4391 21 Koppal 0 564 503 226 152504 61842 30338 4638 1191 22 Mandya 0 1116 1052 430 143873 89789 77516 8652 3391 23 Mysore 0 1148 1361 604 258354 144300 116415 13077 4684 24 Raichur 0 924 596 269 252462 78008 42092 6696 1689 25 Shimoga 0 1127 1162 407 166416 91398 68053 9011 3279 26 Tumkur 0 2325 1581 675 227711 134637 100883 14892 5151 27 Udipi 0 322 626 267 95189 64198 60259 5204 2525 28 Uttar Kannad 0 1385 907 295 141244 78415 57739 9414 2757
Total 0 27017 27512 11730 5757779 2886290 2098578 253576 89168 PPS – Pre-Primary Schools PS – Primary Schools MS – Middle Schools HS/HSS/Intermediate - High School/ Hr. Secondary Schools/ Intermediate Schools

E.50
KERALA
Total Population: 31,841,374 (as per 2001 Census) Estimated 2005 Population: 32989
(in 000) Literacy Rates: Total : 90.86 Male : 99.24 Female : 87.72
A: School Education
No. of Institutions: (Figures in numbers) Number of Schools Years Primary Upper Primary Secondary Sr. Secondary
2001-02 6754 2983 2805 1491 2002-03 6697 2988 1419 1596 2003-04 6717 2975 2871 1286 2004-05 6827 3049 3093 2309 2005-06 6817 3044 3107 2365
Enrolment (Figures in numbers) Enrolment in Classes Years I-V VI-VIII IX-X XI-XII
2001-02 2523879 1765699 1056441 401851 2002-03 2496100 1704991 1040489 436047 2003-04 2492430 1662436 1065738 85185 2004-05 2543422 1628030 1057664 323286 2005-06 2545323 1601297 1045855 421340
Gross Enrolment Ratio Gross Enrolment Ratio in Classes Years I-V VI-VIII IX-XII
2001-02 85.50 97.77 57.17 2002-03 98.11 97.07 62.24 2003-04 96.92 93.64 48.00 2004-05 93.61 98.19 60.15 2005-06 93.85 97.94 64.63
Drop-out Rates
Drop-out Rates in Classes Years I-V I-VIII I-X 2001-02 0.00 0.00 16.64 2002-03 0.00 0.00 12.90 2003-04 0.00 0.00 8.58 2004-05 0.00 0.00 7.15 2005-06 0.00 0.00 4.98

E.51
No. of Teachers (Figures in numbers)
Number of Teachers in Years
Primary Schools
Upper Primary Schools
Secondary Schools
Sr. Secondary Schools
2001-02 45810 48851 94100 20712 2002-03 42497 46544 40746 72225 2003-04 40559 45164 92731 14413 2004-05 41458 45396 95705 38635 2005-06 41751 46481 95280 34503
Pupil Teacher Ratio Pupil Teacher Ratio in
Years
Primary Schools
Upper Primary Schools
Secondary Schools
Sr. Secondary Schools
2001-02 28 28 29 19 2002-03 28 28 27 30 2003-04 29 27 28 21 2004-05 28 27 27 15 2005-06 27 26 27 20
Gender Parity Index Gender Parity Index in Classes
Years I-V VI-VIII IX-XII
2001-02 0.99 0.95 1.10 2002-03 0.99 0.95 1.08 2003-04 0.99 0.96 1.01 2004-05 1.00 0.95 1.04 2005-06 1.00 0.95 1.03
Number of Girls per 100 Boys Number of Girls per 100 Boys in Classes
Years I-V VI-VIII IX-XII
2001-02 95 91 107 2002-03 96 91 106 2003-04 96 91 99 2004-05 96 91 102
2005-06 96 92 100
E.52
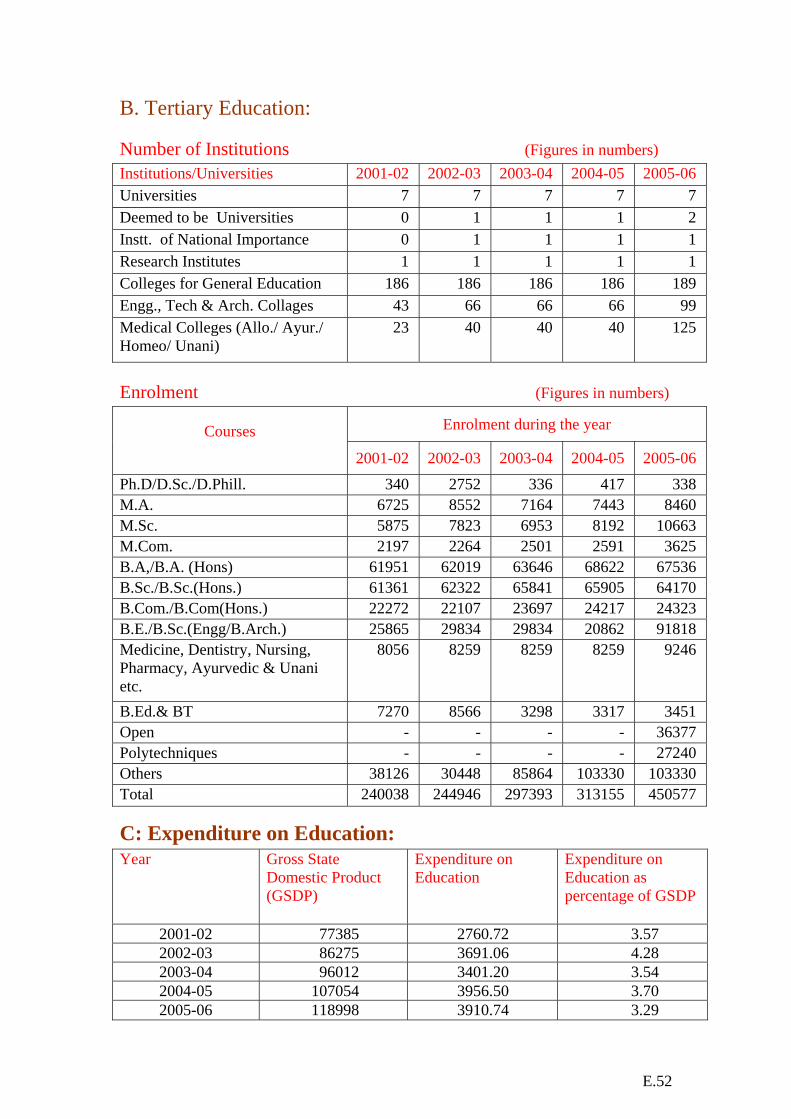
B. Tertiary Education: Number of Institutions (Figures in numbers) Institutions/Universities 2001-02 2002-03 2003-04 2004-05 2005-06 Universities 7 7 7 7 7 Deemed to be Universities 0 1 1 1 2 Instt. of National Importance 0 1 1 1 1 Research Institutes 1 1 1 1 1 Colleges for General Education 186 186 186 186 189 Engg., Tech & Arch. Collages 43 66 66 66 99 Medical Colleges (Allo./ Ayur./ Homeo/ Unani)
23 40 40 40 125
Enrolment (Figures in numbers)
Enrolment during the year Courses 2001-02 2002-03 2003-04 2004-05 2005-06
Ph.D/D.Sc./D.Phill. 340 2752 336 417 338 M.A. 6725 8552 7164 7443 8460 M.Sc. 5875 7823 6953 8192 10663 M.Com. 2197 2264 2501 2591 3625 B.A,/B.A. (Hons) 61951 62019 63646 68622 67536 B.Sc./B.Sc.(Hons.) 61361 62322 65841 65905 64170 B.Com./B.Com(Hons.) 22272 22107 23697 24217 24323 B.E./B.Sc.(Engg/B.Arch.) 25865 29834 29834 20862 91818 Medicine, Dentistry, Nursing, Pharmacy, Ayurvedic & Unani etc.
8056 8259 8259 8259 9246
B.Ed.& BT 7270 8566 3298 3317 3451 Open - - - - 36377 Polytechniques - - - - 27240 Others 38126 30448 85864 103330 103330 Total 240038 244946 297393 313155 450577
C: Expenditure on Education: Year Gross State
Domestic Product (GSDP)
Expenditure on Education
Expenditure on Education as percentage of GSDP
2001-02 77385 2760.72 3.57 2002-03 86275 3691.06 4.28 2003-04 96012 3401.20 3.54 2004-05 107054 3956.50 3.70 2005-06 118998 3910.74 3.29
E.53
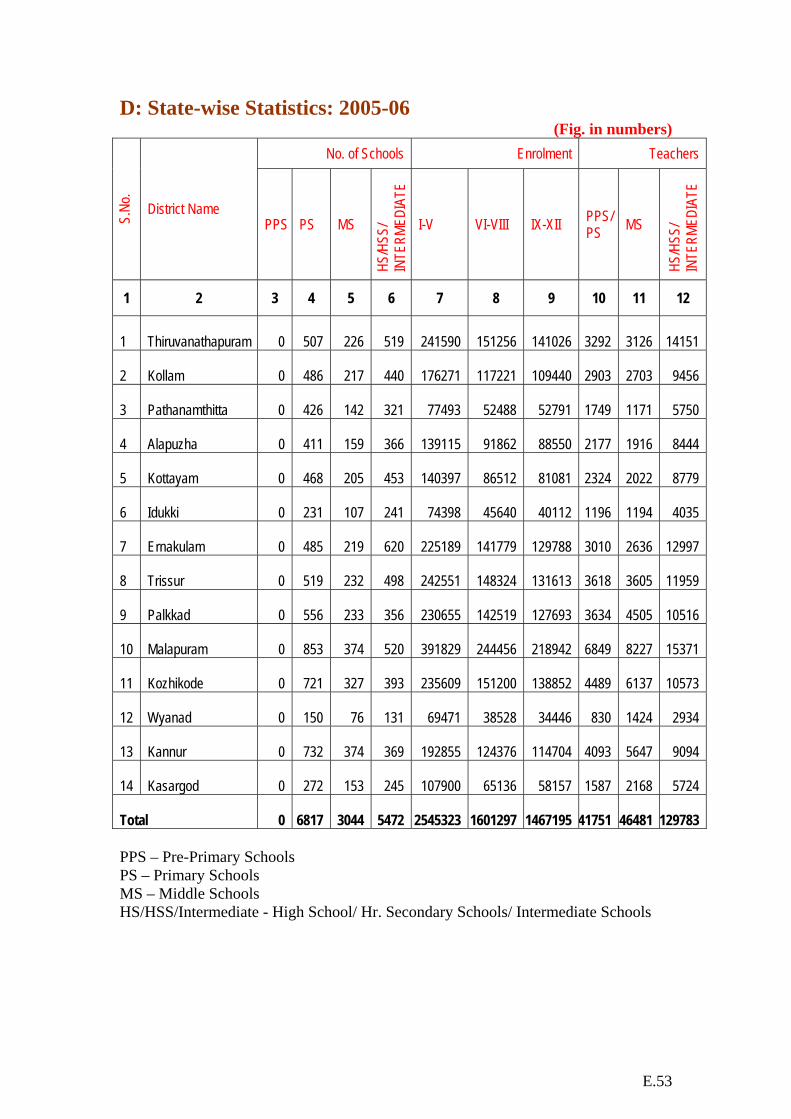
D: State-wise Statistics: 2005-06 (Fig. in numbers)
No. of Schools Enrolment Teachers
S.No
.
District Name PPS PS MS
HS/H
SS/
INTE
RMED
IATE
I-V VI-VIII IX-XII PPS/ PS MS
HS/H
SS/
INTE
RMED
IATE
1 2 3 4 5 6 7 8 9 10 11 12
1 Thiruvanathapuram 0 507 226 519 241590 151256 141026 3292 3126 14151
2 Kollam 0 486 217 440 176271 117221 109440 2903 2703 9456
3 Pathanamthitta 0 426 142 321 77493 52488 52791 1749 1171 5750
4 Alapuzha 0 411 159 366 139115 91862 88550 2177 1916 8444
5 Kottayam 0 468 205 453 140397 86512 81081 2324 2022 8779
6 Idukki 0 231 107 241 74398 45640 40112 1196 1194 4035
7 Ernakulam 0 485 219 620 225189 141779 129788 3010 2636 12997
8 Trissur 0 519 232 498 242551 148324 131613 3618 3605 11959
9 Palkkad 0 556 233 356 230655 142519 127693 3634 4505 10516
10 Malapuram 0 853 374 520 391829 244456 218942 6849 8227 15371
11 Kozhikode 0 721 327 393 235609 151200 138852 4489 6137 10573
12 Wyanad 0 150 76 131 69471 38528 34446 830 1424 2934
13 Kannur 0 732 374 369 192855 124376 114704 4093 5647 9094
14 Kasargod 0 272 153 245 107900 65136 58157 1587 2168 5724
Total 0 6817 3044 5472 2545323 1601297 1467195 41751 46481 129783 PPS – Pre-Primary Schools PS – Primary Schools MS – Middle Schools HS/HSS/Intermediate - High School/ Hr. Secondary Schools/ Intermediate Schools

E.54
MADHYA PRADESH
Total Population: 60,348,023 (as per 2001 Census) Estimated 2005 Population: 65202
(in 000) Literacy Rates: Total : 63.74 Male : 76.06 Female : 50.29
A: School Education
No. of Institutions: (Figures in numbers) Number of Schools Years Primary Upper Primary Secondary Sr. Secondary
2001-02 62530 25090 4321 4150 2002-03 54233 27643 4101 3986 2003-04 66648 30592 4495 4211 2004-05 96737 34641 4246 4055 2005-06 94890 35133 4325 4179
Enrolment (Figures in numbers) Enrolment in Classes Years I-V VI-VIII IX-X XI-XII
2001-02 8265147 2687300 960318 556095 2002-03 7710358 3068217 1121822 493930 2003-04 8830733 3122698 1228265 651870 2004-05 10351093 3826948 1320948 701066 2005-06 11274071 4253269 1423520 771479
Gross Enrolment Ratio Gross Enrolment Ratio in Classes Years I-V VI-VIII IX-XII
2001-02 111.24 59.27 28.07 2002-03 95.02 63.50 30.61 2003-04 106.59 63.30 34.89 2004-05 132.16 83.29 35.74 2005-06 143.67 91.67 37.64
Drop-out Rates Drop-out Rates in Classes Years I-V I-VIII I-X
2001-02 29.55 50.11 69.88 2002-03 31.43 46.94 63.79 2003-04 23.78 46.81 63.81 2004-05 10.21 43.95 64.70 2005-06 0.29 42.32 65.01

E.55
No. of Teachers (Figures in numbers) Number of Teachers in
Years
Primary Schools
Upper Primary Schools
Secondary Schools
Sr. Secondary Schools
2001-02 173770 96050 27372 51382 2002-03 146766 148333 36276 72585 2003-04 197102 132183 36181 63467 2004-05 238868 129437 34633 59710 2005-06 230653 129445 35028 58211
Pupil Teacher Ratio
Pupil Teacher Ratio in Years
Primary Schools
Upper Primary Schools
Secondary Schools
Sr. Secondary Schools
2001-02 44 29 29 27 2002-03 36 28 25 28 2003-04 41 27 29 18 2004-05 43 30 32 16 2005-06 49 33 36 16
Gender Parity Index
Gender Parity Index in Classes Years I-V VI-VIII IX-XII
2001-02 0.85 0.66 0.60 2002-03 0.92 0.7 0.64
2003-04 0.90 0.75 0.66 2004-05 0.95 0.86 0.64 2005-06 0.96 0.87 0.65
Number of Girls per 100 Boys
Number of Girls per 100 Boys in Classes Years I-V VI-VIII IX-XII
2001-02 81 62 52 2002-03 86 65 53 2003-04 84 68 55 2004-05 89 77 56 2005-06 90 80 58

E.56
B. Tertiary Education: Number of Institutions (Figures in numbers) Institutions/Universities 2001-02 2002-03 2003-04 2004-05 2005-06 Universities 14 14 14 14 14 Deemed to be Universities 2 3 3 3 3 Instt. of National Importance 0 0 0 0 0 Research Institutes 0 0 0 0 0 Colleges for General Education 513 513 513 760 712 Engg., Tech & Arch. Collages 30 30 56 60 74 Medical Colleges (Allo./ Ayur./ Homeo/ Unani)
28 28 28 28 97
Enrolment (Figures in number)
Enrolment during the year Courses
2001-02 2002-03 2003-04 2004-05 2005-06
Ph.D/D.Sc./D.Phill. 15038 9093 12656 12656 2357 M.A. 18317 28464 32406 22504 15981 M.Sc. 9761 16994 19348 6999 5862 M.Com. 4633 14265 16244 6310 5527 B.A,/B.A. (Hons) 119031 128575 144082 101012 85194 B.Sc./B.Sc.(Hons.) 85914 90209 102726 52168 43447 B.Com./B.Com(Hons.) 94290 96329 109692 54662 50607 B.E./B.Sc.(Engg/B.Arch.) 25311 25817 29422 26550 79815 Medicine, Dentistry, Nursing, Pharmacy, Ayurvedic & Unani etc.
4574 6815 7761 7760 11914
B.Ed. & BT 6262 5575 6347 6347 4695 Open Universities - - - - 177602 Polytechnic - - - - 24309 Others 67611 50037 57005 461450 461450 Total 450742 472173 537690 758418 968760 C: Expenditure on Education: Year Gross State
Domestic Product(GSDP)
Expenditure on Education
Expenditure on Education as percentage of GSDP
2001-02 86745 2741.70 3.16 2002-03 86832 3249.76 3.74 2003-04 102839 3214.03 3.13 2004-05 107282 3503.47 3.27 2005-06 116322 3993.62 3.43
E.57
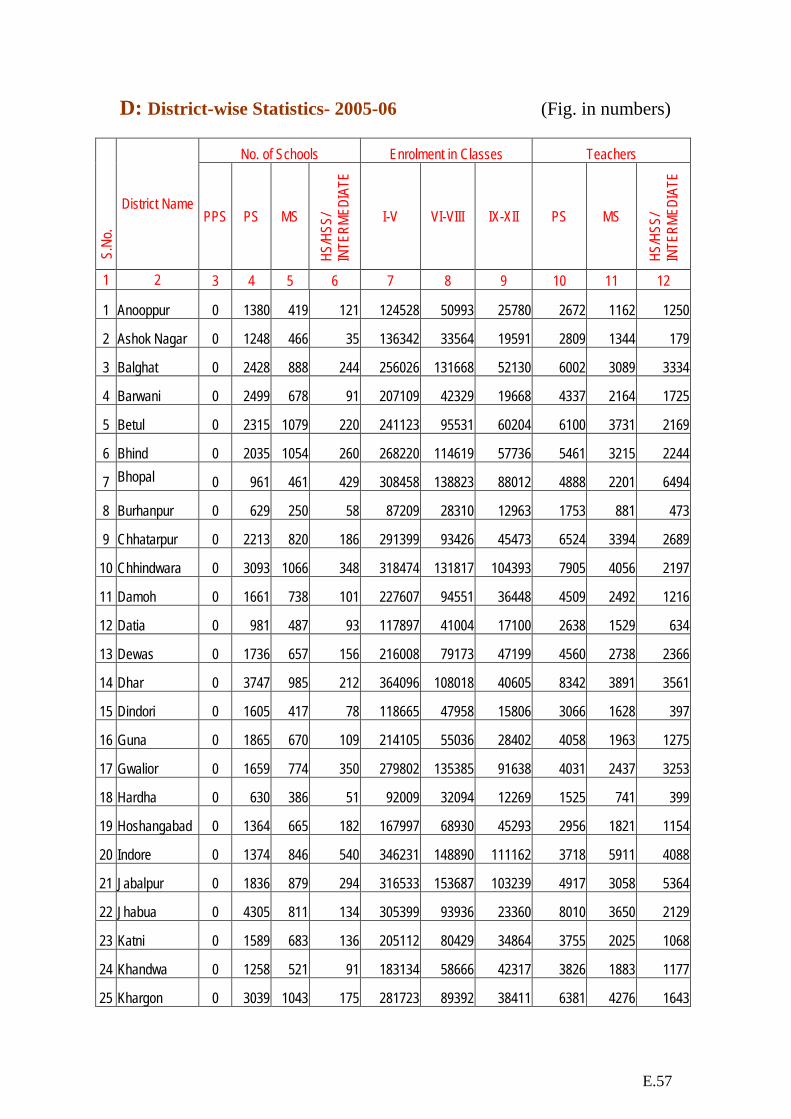
D: District-wise Statistics- 2005-06 (Fig. in numbers)
No. of Schools Enrolment in Classes Teachers
S.N
o.
District Name PPS PS MS
HS/H
SS/
INTE
RMED
IATE
I-V VI-VIII IX-XII PS MS
HS/H
SS/
INTE
RMED
IATE
1 2 3 4 5 6 7 8 9 10 11 12
1 Anooppur 0 1380 419 121 124528 50993 25780 2672 1162 1250
2 Ashok Nagar 0 1248 466 35 136342 33564 19591 2809 1344 179
3 Balghat 0 2428 888 244 256026 131668 52130 6002 3089 3334
4 Barwani 0 2499 678 91 207109 42329 19668 4337 2164 1725
5 Betul 0 2315 1079 220 241123 95531 60204 6100 3731 2169
6 Bhind 0 2035 1054 260 268220 114619 57736 5461 3215 2244
7 Bhopal 0 961 461 429 308458 138823 88012 4888 2201 6494
8 Burhanpur 0 629 250 58 87209 28310 12963 1753 881 473
9 Chhatarpur 0 2213 820 186 291399 93426 45473 6524 3394 2689
10 Chhindwara 0 3093 1066 348 318474 131817 104393 7905 4056 2197
11 Damoh 0 1661 738 101 227607 94551 36448 4509 2492 1216
12 Datia 0 981 487 93 117897 41004 17100 2638 1529 634
13 Dewas 0 1736 657 156 216008 79173 47199 4560 2738 2366
14 Dhar 0 3747 985 212 364096 108018 40605 8342 3891 3561
15 Dindori 0 1605 417 78 118665 47958 15806 3066 1628 397
16 Guna 0 1865 670 109 214105 55036 28402 4058 1963 1275
17 Gwalior 0 1659 774 350 279802 135385 91638 4031 2437 3253
18 Hardha 0 630 386 51 92009 32094 12269 1525 741 399
19 Hoshangabad 0 1364 665 182 167997 68930 45293 2956 1821 1154
20 Indore 0 1374 846 540 346231 148890 111162 3718 5911 4088
21 Jabalpur 0 1836 879 294 316533 153687 103239 4917 3058 5364
22 Jhabua 0 4305 811 134 305399 93936 23360 8010 3650 2129
23 Katni 0 1589 683 136 205112 80429 34864 3755 2025 1068
24 Khandwa 0 1258 521 91 183134 58666 42317 3826 1883 1177
25 Khargon 0 3039 1043 175 281723 89392 38411 6381 4276 1643

E.58
No. of Schools Enrolment in Classes Teachers S
.No.
District Name PPS PS MS
HS/H
SS/
INTE
RMED
IATE
I-V VI-VIII IX-XII PS MS
HS/H
SS/
INTE
RMED
IATE
1 2 3 4 5 6 7 8 9 10 11 12
26 Mandla 0 2390 717 125 172282 65354 32718 4880 2323 1203
27 Mandsur 0 1457 580 181 200161 70171 26065 3913 2084 903
28 Morena 0 2026 564 231 397089 148859 72370 5329 2485 1982
29 Narsinghpur 0 1424 577 126 153109 58623 32435 3713 2121 868
30 Neemach 0 1006 480 108 110439 37487 18683 2568 1786 849
31 Panna 0 1918 824 94 153541 71665 29045 3948 1962 1328
32 Raisen 0 2101 800 147 222251 83797 34111 6444 4017 2410
33 Rajgarh 0 2182 927 168 235386 83713 48463 5426 3091 1139
34 Ratlam 0 1914 658 155 233481 68890 34639 5090 2859 1784
35 Rewa 0 3757 865 431 423975 203037 127554 8292 4810 5859
36 Sagar 0 2481 1031 240 352097 145808 70308 6485 3758 2658
37 Satna 0 3045 1093 295 339801 134262 75517 6788 4680 3165
38 Sehore 0 1616 701 146 221372 91773 39334 4652 2857 1046
39 Seoni 0 2555 863 161 214914 80328 42306 5998 3405 1496
40 Shahdol 0 1868 525 143 153394 54474 33220 3784 1523 1502
41 Shajapur 0 1779 915 153 253941 96681 30287 4774 2887 1246
42 Sheopur 0 905 246 30 109920 27388 18142 1996 890 364
43 Shivpuri 0 2528 882 135 307261 101343 34048 6250 2616 1209
44 Sidhi 0 3718 1429 234 397098 125687 83780 8138 4838 4057
45 Tikamgarh 0 2084 717 99 212803 80472 34367 5511 2167 1317
46 Ujjain 0 1654 782 201 394332 155201 53993 5230 3577 2783
47 Umaria 0 898 497 57 101536 45983 17874 1629 1334 450
48 Vidisha 0 2134 717 150 238682 74044 31677 5072 2095 1143 Total 0 94890 35133 8504 11274071 4253269 2194999 230653 129445 93239
PPS – Pre-Primary Schools PS – Primary Schools MS – Middle Schools HS/HSS/Intermediate - High School/ Hr. Secondary Schools/ Intermediate Schools
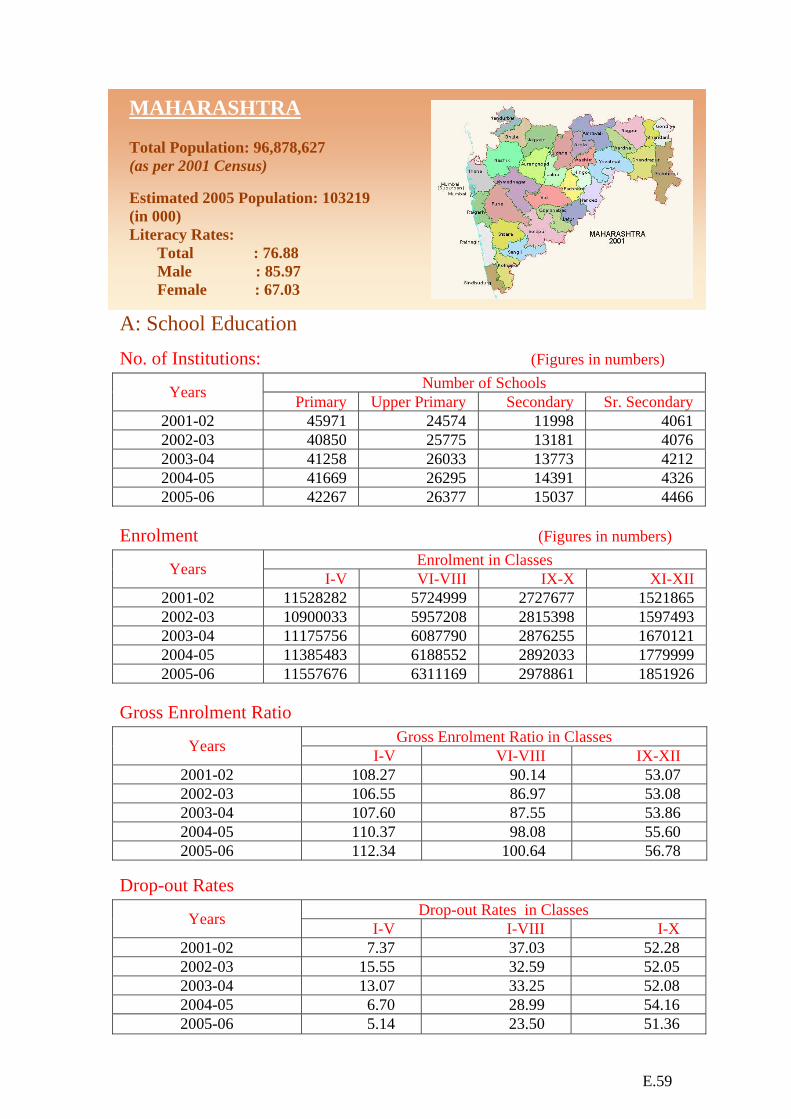
E.59
MAHARASHTRA
Total Population: 96,878,627 (as per 2001 Census) Estimated 2005 Population: 103219 (in 000) Literacy Rates: Total : 76.88 Male : 85.97 Female : 67.03
A: School Education
No. of Institutions: (Figures in numbers) Number of Schools Years Primary Upper Primary Secondary Sr. Secondary
2001-02 45971 24574 11998 4061 2002-03 40850 25775 13181 4076 2003-04 41258 26033 13773 4212 2004-05 41669 26295 14391 4326 2005-06 42267 26377 15037 4466
Enrolment (Figures in numbers) Enrolment in Classes Years I-V VI-VIII IX-X XI-XII
2001-02 11528282 5724999 2727677 1521865 2002-03 10900033 5957208 2815398 1597493 2003-04 11175756 6087790 2876255 1670121 2004-05 11385483 6188552 2892033 1779999 2005-06 11557676 6311169 2978861 1851926
Gross Enrolment Ratio Gross Enrolment Ratio in Classes Years I-V VI-VIII IX-XII
2001-02 108.27 90.14 53.07 2002-03 106.55 86.97 53.08 2003-04 107.60 87.55 53.86 2004-05 110.37 98.08 55.60 2005-06 112.34 100.64 56.78
Drop-out Rates Drop-out Rates in Classes Years I-V I-VIII I-X
2001-02 7.37 37.03 52.28 2002-03 15.55 32.59 52.05 2003-04 13.07 33.25 52.08 2004-05 6.70 28.99 54.16 2005-06 5.14 23.50 51.36

E.60
No. of Teachers (Figures in numbers)
Number of Teachers in Years Primary
Schools Upper Primary
Schools Secondary
Schools Sr. Secondary
Schools 2001-02 176526 242265 95191 108234 2002-03 123392 189583 154345 101953 2003-04 187819 186821 155368 117289 2004-05 190473 192482 158118 120427 2005-06 189195 203046 160917 123584
Pupil Teacher Ratio
Pupil Teacher Ratio in Years
Primary Schools
Upper Primary Schools
Secondary Schools
Sr. Secondary Schools
2001-02 39 30 54 41 2002-03 36 37 34 39 2003-04 37 38 34 41 2004-05 37 37 35 42 2005-06 37 36 35 43
Gender Parity Index
Gender Parity Index in Classes Years I-V VI-VIII IX-XII
2001-02 0.96 0.91 0.83 2002-03 0.98 0.94 0.91 2003-04 0.99 0.96 0.93 2004-05 1.00 0.98 0.91 2005-06 0.98 1.02 0.92
Number of Girls per 100 Boys
Number of Girls per 100 Boys in Classes Years I-V VI-VIII IX-XII
2001-02 92 87 76 2002-03 91 87 78 2003-04 92 88 80 2004-05 93 90 92 2005-06 93 90 92
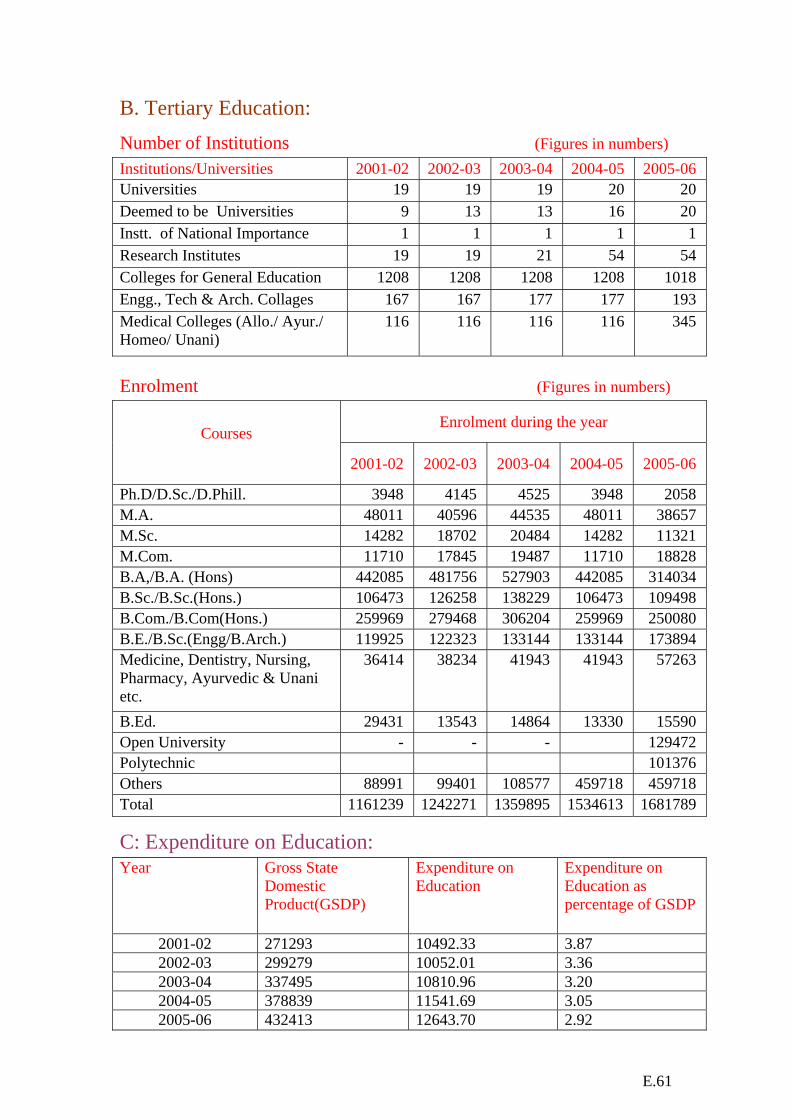
E.61
B. Tertiary Education:
Number of Institutions (Figures in numbers) Institutions/Universities 2001-02 2002-03 2003-04 2004-05 2005-06 Universities 19 19 19 20 20 Deemed to be Universities 9 13 13 16 20 Instt. of National Importance 1 1 1 1 1 Research Institutes 19 19 21 54 54 Colleges for General Education 1208 1208 1208 1208 1018 Engg., Tech & Arch. Collages 167 167 177 177 193 Medical Colleges (Allo./ Ayur./ Homeo/ Unani)
116 116 116 116 345
Enrolment (Figures in numbers)
Enrolment during the year Courses
2001-02 2002-03 2003-04 2004-05 2005-06
Ph.D/D.Sc./D.Phill. 3948 4145 4525 3948 2058 M.A. 48011 40596 44535 48011 38657 M.Sc. 14282 18702 20484 14282 11321 M.Com. 11710 17845 19487 11710 18828 B.A,/B.A. (Hons) 442085 481756 527903 442085 314034 B.Sc./B.Sc.(Hons.) 106473 126258 138229 106473 109498 B.Com./B.Com(Hons.) 259969 279468 306204 259969 250080 B.E./B.Sc.(Engg/B.Arch.) 119925 122323 133144 133144 173894 Medicine, Dentistry, Nursing, Pharmacy, Ayurvedic & Unani etc.
36414 38234 41943 41943 57263
B.Ed. 29431 13543 14864 13330 15590 Open University - - - 129472 Polytechnic 101376 Others 88991 99401 108577 459718 459718 Total 1161239 1242271 1359895 1534613 1681789
C: Expenditure on Education: Year Gross State
Domestic Product(GSDP)
Expenditure on Education
Expenditure on Education as percentage of GSDP
2001-02 271293 10492.33 3.87 2002-03 299279 10052.01 3.36 2003-04 337495 10810.96 3.20 2004-05 378839 11541.69 3.05 2005-06 432413 12643.70 2.92
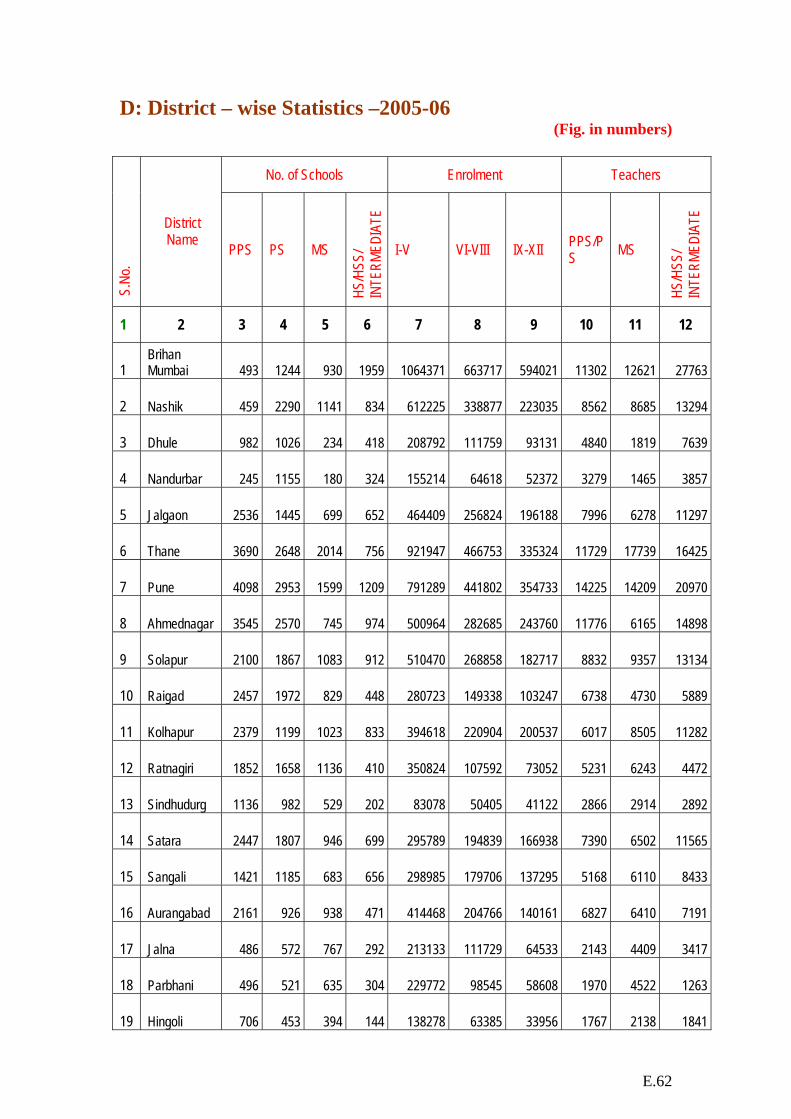
E.62
D: District – wise Statistics –2005-06 (Fig. in numbers)
No. of Schools Enrolment Teachers
S.N
o.
District Name PPS PS MS
HS/H
SS/
INTE
RMED
IATE
I-V VI-VIII IX-XII PPS/PS MS
HS/H
SS/
INTE
RMED
IATE
1 2 3 4 5 6 7 8 9 10 11 12
1 Brihan Mumbai 493 1244 930 1959 1064371 663717 594021 11302 12621 27763
2 Nashik 459 2290 1141 834 612225 338877 223035 8562 8685 13294
3 Dhule 982 1026 234 418 208792 111759 93131 4840 1819 7639
4 Nandurbar 245 1155 180 324 155214 64618 52372 3279 1465 3857
5 Jalgaon 2536 1445 699 652 464409 256824 196188 7996 6278 11297
6 Thane 3690 2648 2014 756 921947 466753 335324 11729 17739 16425
7 Pune 4098 2953 1599 1209 791289 441802 354733 14225 14209 20970
8 Ahmednagar 3545 2570 745 974 500964 282685 243760 11776 6165 14898
9 Solapur 2100 1867 1083 912 510470 268858 182717 8832 9357 13134
10 Raigad 2457 1972 829 448 280723 149338 103247 6738 4730 5889
11 Kolhapur 2379 1199 1023 833 394618 220904 200537 6017 8505 11282
12 Ratnagiri 1852 1658 1136 410 350824 107592 73052 5231 6243 4472
13 Sindhudurg 1136 982 529 202 83078 50405 41122 2866 2914 2892
14 Satara 2447 1807 946 699 295789 194839 166938 7390 6502 11565
15 Sangali 1421 1185 683 656 298985 179706 137295 5168 6110 8433
16 Aurangabad 2161 926 938 471 414468 204766 140161 6827 6410 7191
17 Jalna 486 572 767 292 213133 111729 64533 2143 4409 3417
18 Parbhani 496 521 635 304 229772 98545 58608 1970 4522 1263
19 Hingoli 706 453 394 144 138278 63385 33956 1767 2138 1841

E.63
No. of Schools Enrolment Teachers S
.No.
District Name PPS PS MS
HS/H
SS/
INTE
RMED
IATE
I-V VI-VIII IX-XII PPS/PS MS
HS/H
SS/
INTE
RMED
IATE
20 Beed 2391 1268 809 586 332357 169999 118957 5692 6132 6712
21 Nanded 2114 1134 1202 579 430653 178556 135649 5344 8730 6238
22 Osmanabad 1487 435 655 430 181564 106594 73943 3088 4698 4693
23 Latur 346 725 881 592 326614 183517 129393 2763 6881 6716
24 Amravati 1023 1128 768 596 302046 176607 129752 4629 5962 9347
25 Buldhana 551 960 632 458 264052 157368 111018 3815 5099 7699
26 Akola 1052 726 442 399 196511 113145 88521 3379 3289 5852
27 Washim 1015 567 420 216 121479 72576 58648 2411 2031 4008
28 Yavatmal 2295 1271 912 596 318337 156587 110207 5445 6147 5780
29 Nagpur 1069 1606 900 899 439643 271933 207282 7178 7340 14881
30 Wardha 961 767 323 264 118445 79177 62092 3041 2338 6007
31 Bhandara 1048 603 327 293 115511 76255 71675 2700 2317 4940
32 Gondia 1083 543 454 321 127758 84941 77868 2480 3248 4289
33 Chandrapur 2238 1138 682 483 235382 141597 111535 5458 4983 6300
34 Gadchiroli 1467 923 465 294 117975 65215 49517 3114 3030 3517
Total 53829 42267 26377 19503 11557676 6311169 4830787 189195 203046 284501 PPS – Pre-Primary Schools PS – Primary Schools MS – Middle Schools HS/HSS/Intermediate - High School/ Hr. Secondary Schools/ Intermediate Schools

E.64
MANIPUR
Total Population: 21, 66,788 (as per 2001 Census) Estimated 2005 Population: 2280 (in 000) Literacy Rates: Total : 70.53 Male : 80.33 Female : 60.53
A: School Education
No. of Institutions: (Figures in numbers) Number of Schools Years Primary Upper Primary Secondary Sr. Secondary
2001-02 2573 796 564 95 2002-03 2552 794 540 147 2003-04 2552 832 540 112 2004-05 2552 831 588 118 2005-06 2552 831 603 102
Enrolment (Figures in numbers) Enrolment in Classes Years I-V VI-VIII IX-X XI-XII
2001-02 298371 126905 67244 16982 2002-03 356799 124910 62921 37826 2003-04 339110 132910 70910 21238 2004-05 348897 137300 73565 23178 2005-06 360055 141691 75924 23918
Gross Enrolment Ratio Gross Enrolment Ratio in Classes Years I-V VI-VIII IX-XII
2001-02 99.13 77.86 40.49 2002-03 146.88 80.46 51.32 2003-04 137.51 84.33 46.24 2004-05 151.69 94.69 48.61 2005-06 157.92 97.92 49.43
Drop-out Rates Drop-out Rates in Classes Years I-V I-VIII I-X
2001-02 27.06 37.75 53.90 2002-03 25.60 32.93 60.54 2003-04 26.41 30.61 49.02 2004-05 31.18 32.80 43.02 2005-06 31.06 35.97 41.91
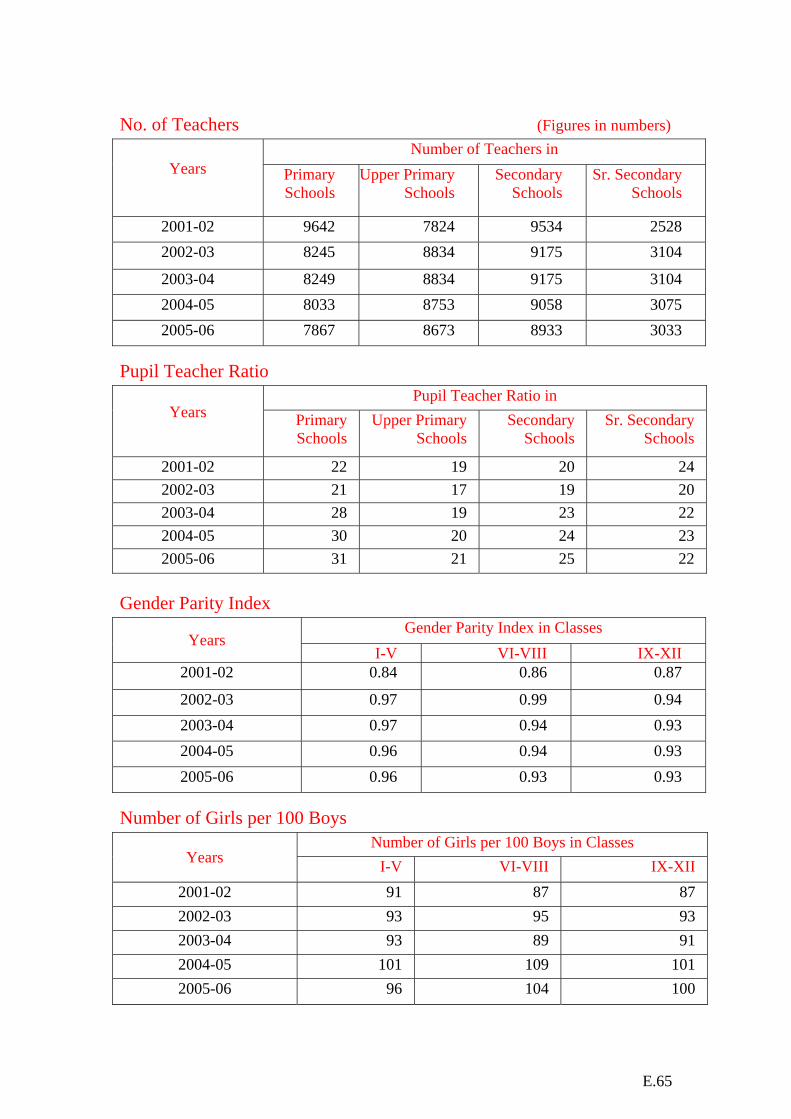
E.65
No. of Teachers (Figures in numbers)
Number of Teachers in Years
Primary Schools
Upper Primary Schools
Secondary Schools
Sr. Secondary Schools
2001-02 9642 7824 9534 2528 2002-03 8245 8834 9175 3104
2003-04 8249 8834 9175 3104 2004-05 8033 8753 9058 3075 2005-06 7867 8673 8933 3033
Pupil Teacher Ratio Pupil Teacher Ratio in
Years Primary
Schools Upper Primary
Schools Secondary
Schools Sr. Secondary
Schools
2001-02 22 19 20 24 2002-03 21 17 19 20 2003-04 28 19 23 22 2004-05 30 20 24 23 2005-06 31 21 25 22
Gender Parity Index
Gender Parity Index in Classes Years
I-V VI-VIII IX-XII 2001-02 0.84 0.86 0.87
2002-03 0.97 0.99 0.94 2003-04 0.97 0.94 0.93 2004-05 0.96 0.94 0.93 2005-06 0.96 0.93 0.93
Number of Girls per 100 Boys Number of Girls per 100 Boys in Classes
Years I-V VI-VIII IX-XII 2001-02 91 87 87 2002-03 93 95 93 2003-04 93 89 91 2004-05 101 109 101 2005-06 96 104 100

E.66
B. Tertiary Education: Number of Institutions (Figures in numbers) Institutions/Universities 2001-02 2002-03 2003-04 2004-05 2005-06
Universities 2 2 2 2 2
Deemed to be Universities 0 0 0 0 0
Instt. of National Importance 0 0 0 0 0
Research Institutes 0 0 0 0 0
Colleges for General Education 50 58 58 58 58
Engg., Tech & Arch. Collages 0 1 1 1 1
Medical Colleges (Allo./ Ayur./ Homeo/ Unani)
1 1 1 1 1
Enrolment (Figures in numbers)
Enrolment during the year Courses
2001-02 2002-03 2003-04 2004-05 2005-06
Ph.D/D.Sc./D.Phill. 84 438 182 192 755 M.A. 851 408 594 627 760 M.Sc. 75 351 590 621 640 M.Com. 90 80 135 142 156 B.A,/B.A. (Hons) 16425 14579 6497 6839 5770 B.Sc./B.Sc.(Hons.) 6831 11059 5369 5650 4850 B.Com./B.Com(Hons.) 871 887 374 394 358 B.E./B.Sc.(Engg/B.Arch.) 0 306 437 459 368 Medicine, Dentistry, Nursing, Pharmacy, Ayurvedic & Unani etc.
604 615 156 164 105
B.Ed. 332 341 290 306 290 Open University - - - - 0 Polytechnic - - - - 840 Others 1928 6496 22108 23285 23285 Total 28091 35560 36732 38679 38177

E.67
C: Expenditure on Education: Year Gross State
Domestic Product(GSDP)
Expenditure on Education
Expenditure on Education as percentage of GSDP
2001-02 3369 305.95 9.08 2002-03 3506 300.39 8.57 2003-04 3979 266.27 6.69 2004-05 5050 332.18 6.58 2005-06 5714 430.74 7.54
D: District-wise Statistics- 2005-06
(Fig. in numbers)
No. of Schools Enrolment Teachers
S.No
.
District Name PPS PS MS
HS/H
SS/
INTE
RMED
IATE
I-V VI-VIII IX-XII PPS/PS MS
HS/H
SS/
INTE
RMED
IATE
1 3 4 5 6 7 8 9 10 11 12
1 Imphal- West 1 342 148 156 66117 34646 30467 1587 2568 4071
2 Imphal- East 0 367 132 140 65867 28954 19813 1106 1054 1671
3 Thoubal 0 315 85 110 56204 26868 15576 1024 945 1657
4 Bishnupur 0 196 66 59 33757 14609 10443 590 697 873
5 Ukhrul 0 225 72 47 25285 6076 4393 594 618 680
6 Tamenglong 0 216 53 24 22640 3944 3144 712 381 376
7 Senapati 0 410 99 67 36583 12142 6712 622 1007 843
8 Churachandpur 0 274 113 79 31486 10724 7066 1105 953 1390
9 Chandel 0 207 63 23 22116 3728 2228 527 450 405
Total 1 2552 831 705 360055 141691 99842 7867 8673 11966 PPS – Pre-Primary Schools PS – Primary Schools MS – Middle Schools HS/HSS/Intermediate - High School/ Hr. Secondary Schools/ Intermediate Schools

E.68
MEGHALAYA
Total Population: 2,318,822 (as per 2001 Census) Estimated 2005 Population: 2440
(in 000) Literacy Rates: Total : 62.56 Male :65.43 Female :59.61
A: School Education
No. of Institutions: (Figures in number) Number of Schools Years Primary Upper Primary Secondary Sr. Secondary
2001-02 5646 1041 574 69 2002-03 5807 1083 513 128 2003-04 5851 1559 575 80 2004-05 5851 1759 631 80 2005-06 5851 1759 575 80
Enrolment (Figures in number) Enrolment in Classes Years I-V VI-VIII IX-X XI-XII
2001-02 327132 96110 36151 20420 2002-03 391730 104420 44056 29456 2003-04 360907 122027 38396 25834 2004-05 467955 136840 48037 26162 2005-06 508205 153689 51073 29634
Gross Enrolment Ratio Gross Enrolment Ratio in Classes Years I-V VI-VIII IX-XII
2001-02 112.42 60.83 28.13 2002-03 116.19 53.08 32.61 2003-04 105.51 61.14 28.09 2004-05 147.62 76. 45 33.27 2005-06 162.37 86.34 35.71
Drop-out Rates Drop-out Rates in Classes Years I-V I-VIII I-X
2001-02 56.96 76.99 83.44 2002-03 56.51 71.67 80.93 2003-04 53.42 71.13 83.24 2004-05 49.97 64.21 79.15 2005-06 42.38 64.02 78.09
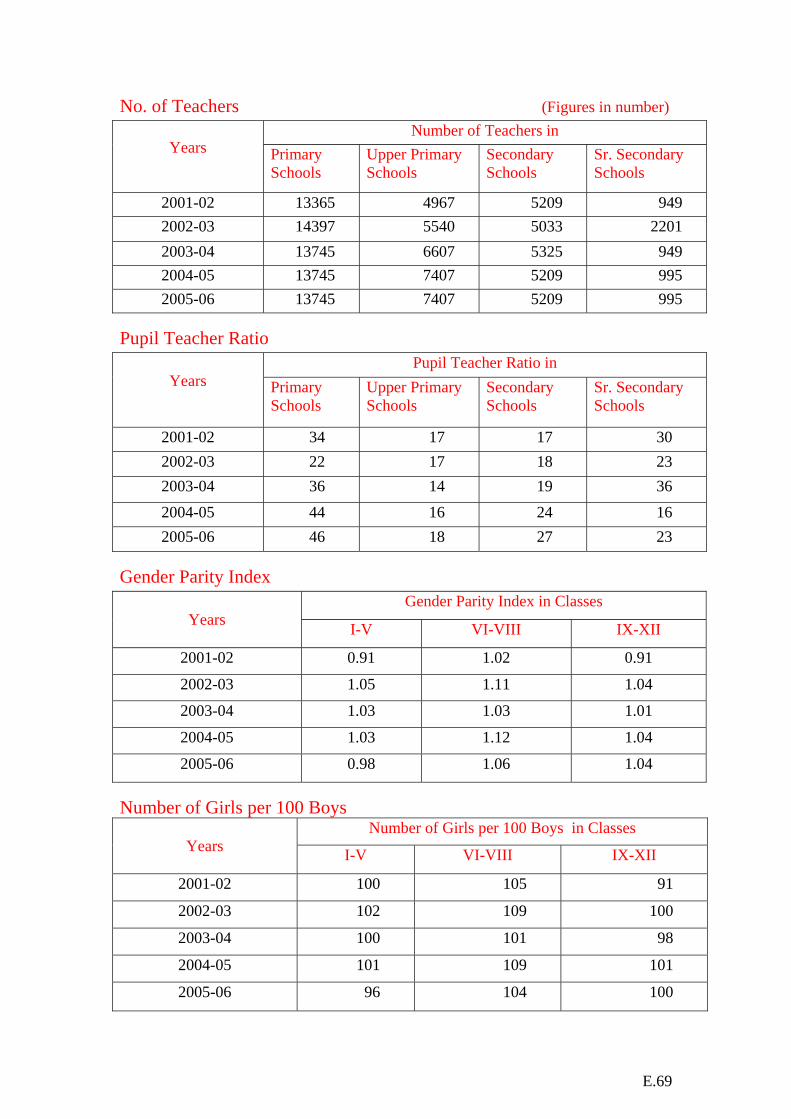
E.69
No. of Teachers (Figures in number) Number of Teachers in
Years
Primary Schools
Upper Primary Schools
Secondary Schools
Sr. Secondary Schools
2001-02 13365 4967 5209 949 2002-03 14397 5540 5033 2201 2003-04 13745 6607 5325 949 2004-05 13745 7407 5209 995 2005-06 13745 7407 5209 995
Pupil Teacher Ratio Pupil Teacher Ratio in
Years
Primary Schools
Upper Primary Schools
Secondary Schools
Sr. Secondary Schools
2001-02 34 17 17 30 2002-03 22 17 18 23 2003-04 36 14 19 36 2004-05 44 16 24 16 2005-06 46 18 27 23
Gender Parity Index Gender Parity Index in Classes
Years I-V VI-VIII IX-XII
2001-02 0.91 1.02 0.91
2002-03 1.05 1.11 1.04
2003-04 1.03 1.03 1.01
2004-05 1.03 1.12 1.04
2005-06 0.98 1.06 1.04
Number of Girls per 100 Boys Number of Girls per 100 Boys in Classes
Years I-V VI-VIII IX-XII
2001-02 100 105 91
2002-03 102 109 100
2003-04 100 101 98
2004-05 101 109 101
2005-06 96 104 100

E.70
B. Tertiary Education:
Number of Institutions (Figures in number) Institutions/Universities 2001-02 2002-03 2003-04 2004-05 2005-06 Universities 1 1 1 1 1 Deemed to be Universities 0 0 0 0 0 Instt. of National Importance 0 0 0 0 0 Research Institutes 0 0 0 0 0 Colleges for General Education 46 44 48 54 54 Engg., Tech & Arch. Collages 0 0 0 0 1 Medical Colleges (Allo./ Ayur./ Homeo/ Unani)
0 0 0 0 0
Enrolment (Figures in number)
Enrolment during the year Courses
2001-02 2002-03 2003-04 2004-05 2005-06
Ph.D/D.Sc./D.Phill. 322 385 498 387 311 M.A. 806 1015 1075 1112 1119 M.Sc. 253 279 323 337 382 M.Com. 54 66 84 90 87 B.A,/B.A. (Hons) 11936 13595 14114 14480 20863 B.Sc./B.Sc.(Hons.) 2684 2750 2801 2826 2841 B.Com./B.Com(Hons.) 1526 1603 2056 2059 2176 B.E./B.Sc.(Engg/B.Arch.) 0 161 0 0 768 Medicine, Dentistry, Nursing, Pharmacy, Ayurvedic & Unani etc.
0 0 0 0 0
B.Ed. 157 178 291 292 354 Open University - - - - 0 Polytechnic - - - - 624 Others 0 8009 8907 9133 9133 Total 17738 28041 30149 30716 38658
C: Expenditure on Education: Year Gross State
Domestic Product(GSDP)
Expenditure on Education
Expenditure on Education as percentage of GSDP
2001-02 4615 254.59 5.52 2002-03 4900 234.14 4.78 2003-04 5504 259.20 4.71 2004-05 5980 289.58 4.84 2005-06 6470 358.67 5.54

E.71
D: District-wise Statistics- 2005-06 (Figures in numbers)
No. of Schools Enrolment Teachers
S.No
.
District Name PPS PS MS
HS/H
SS/
INTE
RMED
IATE
I-V VI-VIII IX-XII PPS/PS MS
HS/H
SS/
INTE
RMED
IATE
1 2 3 4 5 6 7 8 9 10 11 12
1 East Khasi Hills 0 617 234 62 134745 45742 26919 2954 1497 2394
2 Ri Bhoi 0 1096 355 209 27368 8004 2678 1029 778 317
3 West Khasi Hills 0 1155 304 95 85297 29994 6419 2553 1266 703
4 Jaintia 0 751 219 65 35960 17087 6418 1793 1020 568
5 East Garo Hills 0 1345 336 159 62698 8888 10188 1671 928 637
6 WestGargo 0 421 122 32 131232 36172 24017 2865 1406 1350
7 South Garo 0 466 189 33 30905 7802 4068 880 512 235
Total 0 5851 1759 655 508205 153689 80707 13745 7407 6204
PPS – Pre-Primary Schools PS – Primary Schools MS – Middle Schools HS/HSS/Intermediate - High School/ Hr. Secondary Schools/ Intermediate Schools

E.72
MIZORAM
Total Population: 888,573 (as per 2001 Census) Estimated 2005 Population: 934 (in 000) Literacy Rates: Total : 88.80 Male : 90.72
Female : 86.75
A: School Education
No. of Institutions: (Figures in numbers) Number of Schools Years Primary Upper Primary Secondary Sr. Secondary
2001-02 1377 851 370 33 2002-03 1253 848 339 49 2003-04 1504 908 443 71 2004-05 1481 939 445 67 2005-06 1688 1121 484 76
Enrolment (Figures in numbers) Enrolment in Classes Years I-V VI-VIII IX-X XI-XII
2001-02 134547 49572 27162 8975 2002-03 134150 51349 21878 11341 2003-04 127057 51096 25685 10539 2004-05 123705 51514 26795 10283 2005-06 162302 74332 25066 10555
Gross Enrolment Ratio Gross Enrolment Ratio in Classes Years I-V VI-VIII IX-XII
2001-02 119.07 79.95 45.92 2002-03 128.70 78.47 40.61 2003-04 120.17 76.98 43.66 2004-05 127.53 81.77 44.67 2005-06 169.06 117.99 41.91
Drop-out Rates Drop-out Rates in Classes Years I-V I-VIII I-X
2001-02 59.31 59.89 69.73 2002-03 56.38 58.31 75.68 2003-04 55.61 64.19 69.74 2004-05 49.84 66.84 66.95 2005-06 31.58 64.86 73.73
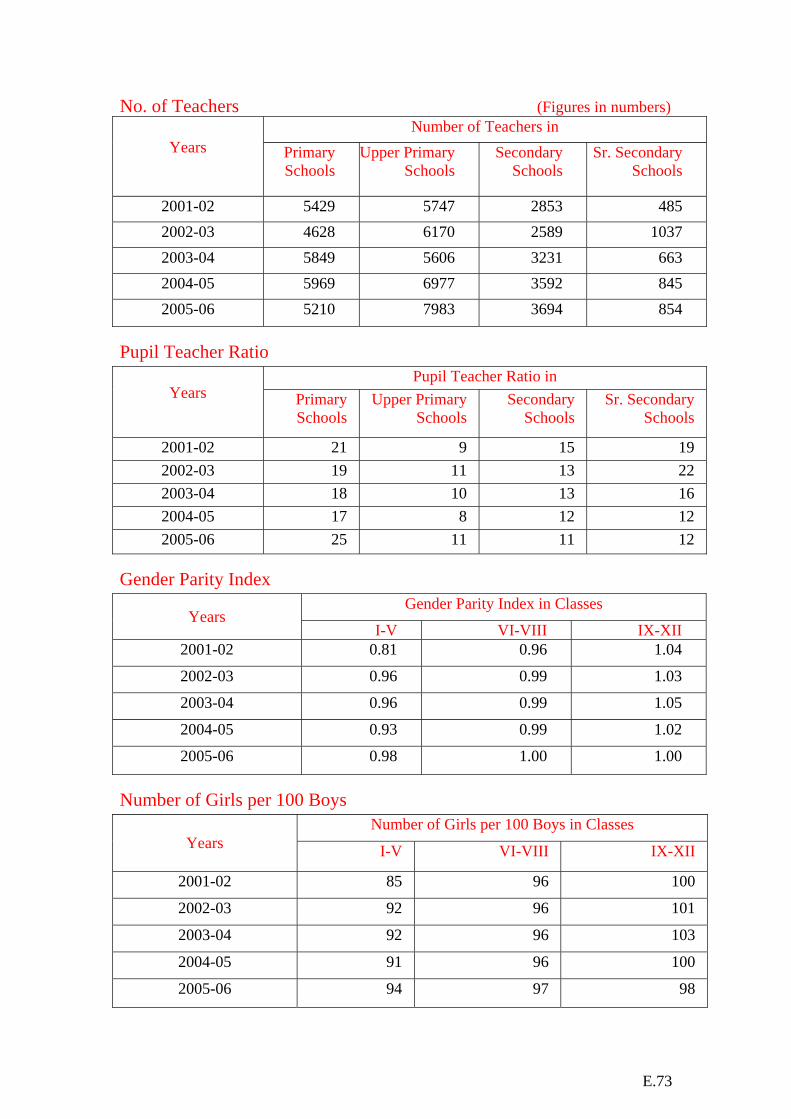
E.73
No. of Teachers (Figures in numbers) Number of Teachers in
Years
Primary Schools
Upper Primary Schools
Secondary Schools
Sr. Secondary Schools
2001-02 5429 5747 2853 485 2002-03 4628 6170 2589 1037 2003-04 5849 5606 3231 663 2004-05 5969 6977 3592 845 2005-06 5210 7983 3694 854
Pupil Teacher Ratio Pupil Teacher Ratio in
Years
Primary Schools
Upper Primary Schools
Secondary Schools
Sr. Secondary Schools
2001-02 21 9 15 19 2002-03 19 11 13 22 2003-04 18 10 13 16 2004-05 17 8 12 12 2005-06 25 11 11 12
Gender Parity Index Gender Parity Index in Classes
Years I-V VI-VIII IX-XII
2001-02 0.81 0.96 1.04
2002-03 0.96 0.99 1.03
2003-04 0.96 0.99 1.05
2004-05 0.93 0.99 1.02
2005-06 0.98 1.00 1.00
Number of Girls per 100 Boys Number of Girls per 100 Boys in Classes
Years I-V VI-VIII IX-XII
2001-02 85 96 100
2002-03 92 96 101
2003-04 92 96 103
2004-05 91 96 100
2005-06 94 97 98
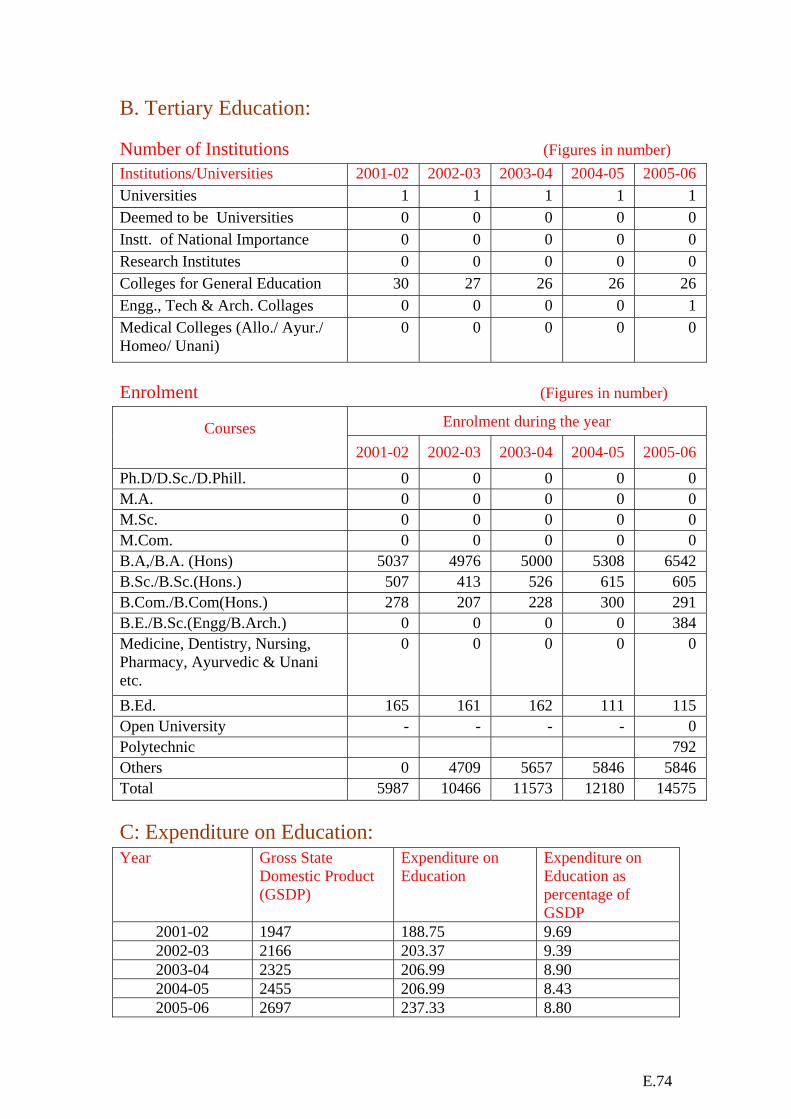
E.74
B. Tertiary Education: Number of Institutions (Figures in number) Institutions/Universities 2001-02 2002-03 2003-04 2004-05 2005-06 Universities 1 1 1 1 1 Deemed to be Universities 0 0 0 0 0 Instt. of National Importance 0 0 0 0 0 Research Institutes 0 0 0 0 0 Colleges for General Education 30 27 26 26 26 Engg., Tech & Arch. Collages 0 0 0 0 1 Medical Colleges (Allo./ Ayur./ Homeo/ Unani)
0 0 0 0 0
Enrolment (Figures in number)
Enrolment during the year Courses 2001-02 2002-03 2003-04 2004-05 2005-06
Ph.D/D.Sc./D.Phill. 0 0 0 0 0 M.A. 0 0 0 0 0 M.Sc. 0 0 0 0 0 M.Com. 0 0 0 0 0 B.A,/B.A. (Hons) 5037 4976 5000 5308 6542 B.Sc./B.Sc.(Hons.) 507 413 526 615 605 B.Com./B.Com(Hons.) 278 207 228 300 291 B.E./B.Sc.(Engg/B.Arch.) 0 0 0 0 384 Medicine, Dentistry, Nursing, Pharmacy, Ayurvedic & Unani etc.
0 0 0 0 0
B.Ed. 165 161 162 111 115 Open University - - - - 0 Polytechnic 792 Others 0 4709 5657 5846 5846 Total 5987 10466 11573 12180 14575 C: Expenditure on Education: Year Gross State
Domestic Product (GSDP)
Expenditure on Education
Expenditure on Education as percentage of GSDP
2001-02 1947 188.75 9.69 2002-03 2166 203.37 9.39 2003-04 2325 206.99 8.90 2004-05 2455 206.99 8.43 2005-06 2697 237.33 8.80
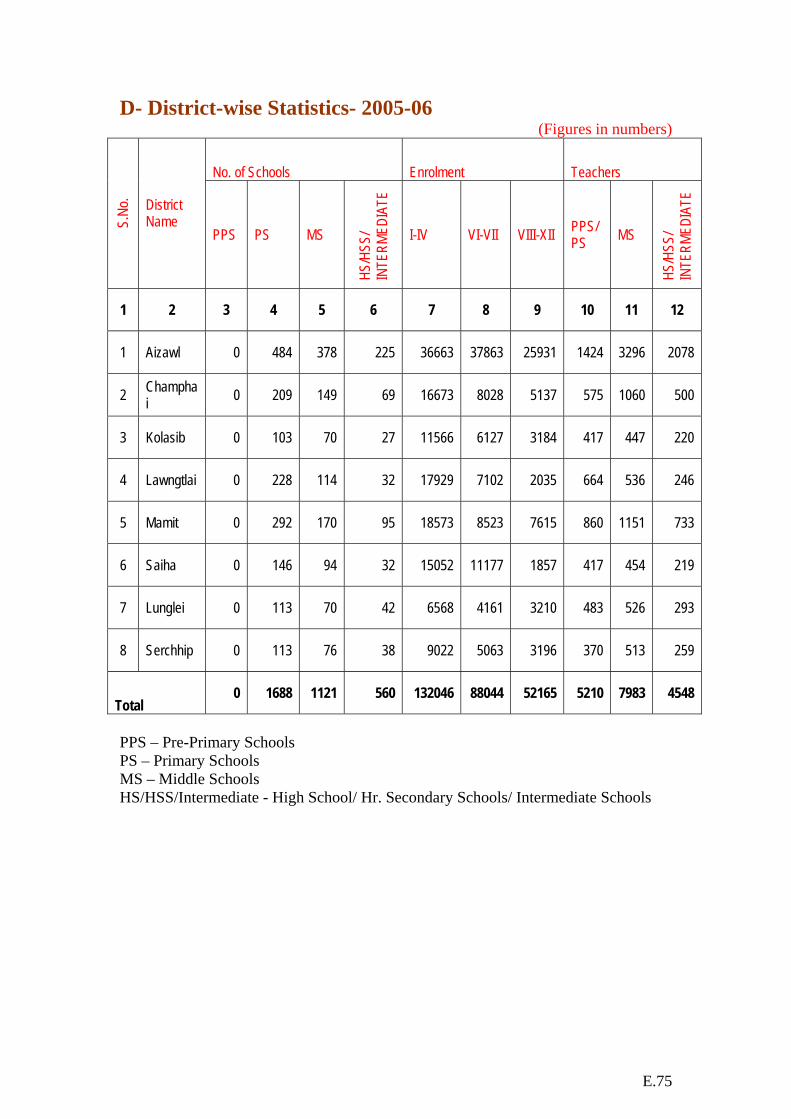
E.75
D- District-wise Statistics- 2005-06 (Figures in numbers)
No. of Schools Enrolment Teachers
S.No
. District Name
PPS PS MS
HS/H
SS/
INTE
RMED
IATE
I-IV VI-VII VIII-XII PPS/PS MS
HS/H
SS/
INTE
RMED
IATE
1 2 3 4 5 6 7 8 9 10 11 12
1 Aizawl 0 484 378 225 36663 37863 25931 1424 3296 2078
2 Champhai 0 209 149 69 16673 8028 5137 575 1060 500
3 Kolasib 0 103 70 27 11566 6127 3184 417 447 220
4 Lawngtlai 0 228 114 32 17929 7102 2035 664 536 246
5 Mamit 0 292 170 95 18573 8523 7615 860 1151 733
6 Saiha 0 146 94 32 15052 11177 1857 417 454 219
7 Lunglei 0 113 70 42 6568 4161 3210 483 526 293
8 Serchhip 0 113 76 38 9022 5063 3196 370 513 259
Total 0 1688 1121 560 132046 88044 52165 5210 7983 4548
PPS – Pre-Primary Schools PS – Primary Schools MS – Middle Schools HS/HSS/Intermediate - High School/ Hr. Secondary Schools/ Intermediate Schools

E.76
NAGALAND
Total Population:1,990,036 (as per 2001 Census) Estimated 2005 Population: 2093 (in 000) Literacy Rates: Total : 66.59 Male : 71.16
Female : 61.46
A: School Education
No. of Institutions: (Figures in numbers) Number of Schools Years Primary Upper Primary Secondary Sr. Secondary
2001-02 1499 479 321 23 2002-03 1352 427 227 52 2003-04 1495 480 331 52 2004-05 1520 480 336 43 2005-06 1520 481 398 51
Enrolment (Figures in numbers)
Enrolment in Classes Years I-V VI-VIII IX-X XI-XII 2001-02 212454 65683 28429 10831 2002-03 167972 59244 21579 8239 2003-04 210410 76539 25074 15291 2004-05 224246 85620 29921 17750 2005-06 224715 92271 35056 19579
Gross Enrolment Ratio Gross Enrolment Ratio in Classes Years I-V VI-VIII IX-XII
2001-02 105.70 60.26 28.17 2002-03 65.22 35.10 13.54 2003-04 80.48 44.66 18.06 2004-05 87.94 55.60 21.28 2005-06 88.82 60.31 24.07
Drop-out Rates Drop-out Rates in Classes Years I-V I-VIII I-X
2001-02 41.50 53.36 64.94 2002-03 51.80 53.38 77.47 2003-04 32.81 44.83 71.97 2004-05 42.69 42.49 67.29 2005-06 38.43 38.10 65.51
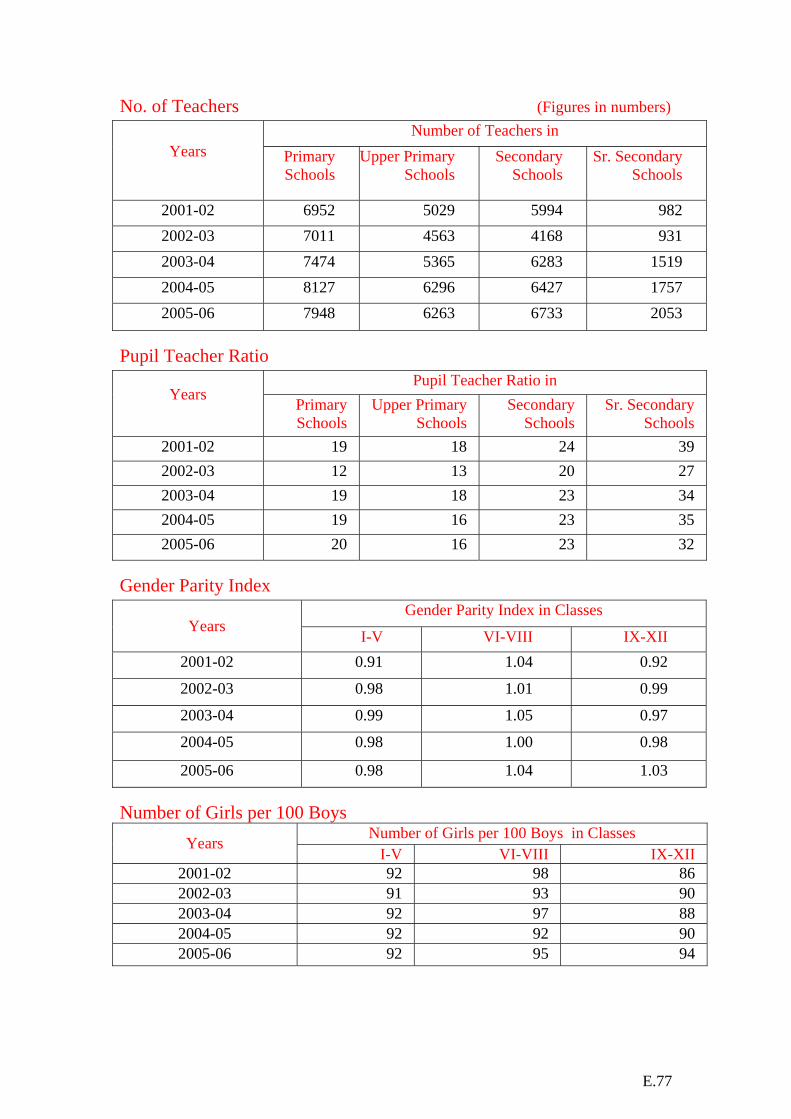
E.77
No. of Teachers (Figures in numbers) Number of Teachers in
Years
Primary Schools
Upper Primary Schools
Secondary Schools
Sr. Secondary Schools
2001-02 6952 5029 5994 982 2002-03 7011 4563 4168 931 2003-04 7474 5365 6283 1519 2004-05 8127 6296 6427 1757 2005-06 7948 6263 6733 2053
Pupil Teacher Ratio Pupil Teacher Ratio in
Years Primary
Schools Upper Primary
Schools Secondary
Schools Sr. Secondary
Schools 2001-02 19 18 24 39 2002-03 12 13 20 27 2003-04 19 18 23 34 2004-05 19 16 23 35 2005-06 20 16 23 32
Gender Parity Index Gender Parity Index in Classes
Years I-V VI-VIII IX-XII
2001-02 0.91 1.04 0.92
2002-03 0.98 1.01 0.99
2003-04 0.99 1.05 0.97
2004-05 0.98 1.00 0.98
2005-06 0.98 1.04 1.03
Number of Girls per 100 Boys Number of Girls per 100 Boys in Classes Years
I-V VI-VIII IX-XII 2001-02 92 98 86 2002-03 91 93 90 2003-04 92 97 88 2004-05 92 92 90 2005-06 92 95 94
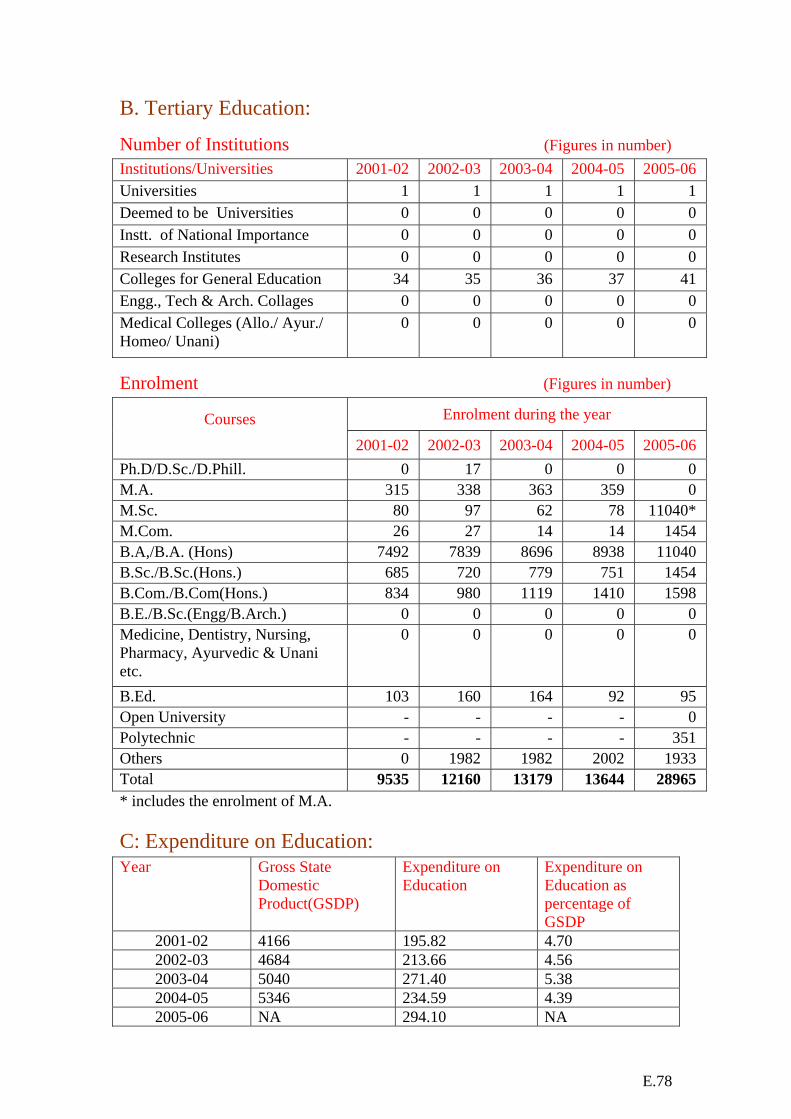
E.78
B. Tertiary Education:
Number of Institutions (Figures in number) Institutions/Universities 2001-02 2002-03 2003-04 2004-05 2005-06 Universities 1 1 1 1 1 Deemed to be Universities 0 0 0 0 0 Instt. of National Importance 0 0 0 0 0 Research Institutes 0 0 0 0 0 Colleges for General Education 34 35 36 37 41 Engg., Tech & Arch. Collages 0 0 0 0 0 Medical Colleges (Allo./ Ayur./ Homeo/ Unani)
0 0 0 0 0
Enrolment (Figures in number)
Enrolment during the year Courses 2001-02 2002-03 2003-04 2004-05 2005-06
Ph.D/D.Sc./D.Phill. 0 17 0 0 0 M.A. 315 338 363 359 0 M.Sc. 80 97 62 78 11040* M.Com. 26 27 14 14 1454 B.A,/B.A. (Hons) 7492 7839 8696 8938 11040 B.Sc./B.Sc.(Hons.) 685 720 779 751 1454 B.Com./B.Com(Hons.) 834 980 1119 1410 1598 B.E./B.Sc.(Engg/B.Arch.) 0 0 0 0 0 Medicine, Dentistry, Nursing, Pharmacy, Ayurvedic & Unani etc.
0 0 0 0 0
B.Ed. 103 160 164 92 95 Open University - - - - 0 Polytechnic - - - - 351 Others 0 1982 1982 2002 1933 Total 9535 12160 13179 13644 28965 * includes the enrolment of M.A. C: Expenditure on Education: Year Gross State
Domestic Product(GSDP)
Expenditure on Education
Expenditure on Education as percentage of GSDP
2001-02 4166 195.82 4.70 2002-03 4684 213.66 4.56 2003-04 5040 271.40 5.38 2004-05 5346 234.59 4.39 2005-06 NA 294.10 NA
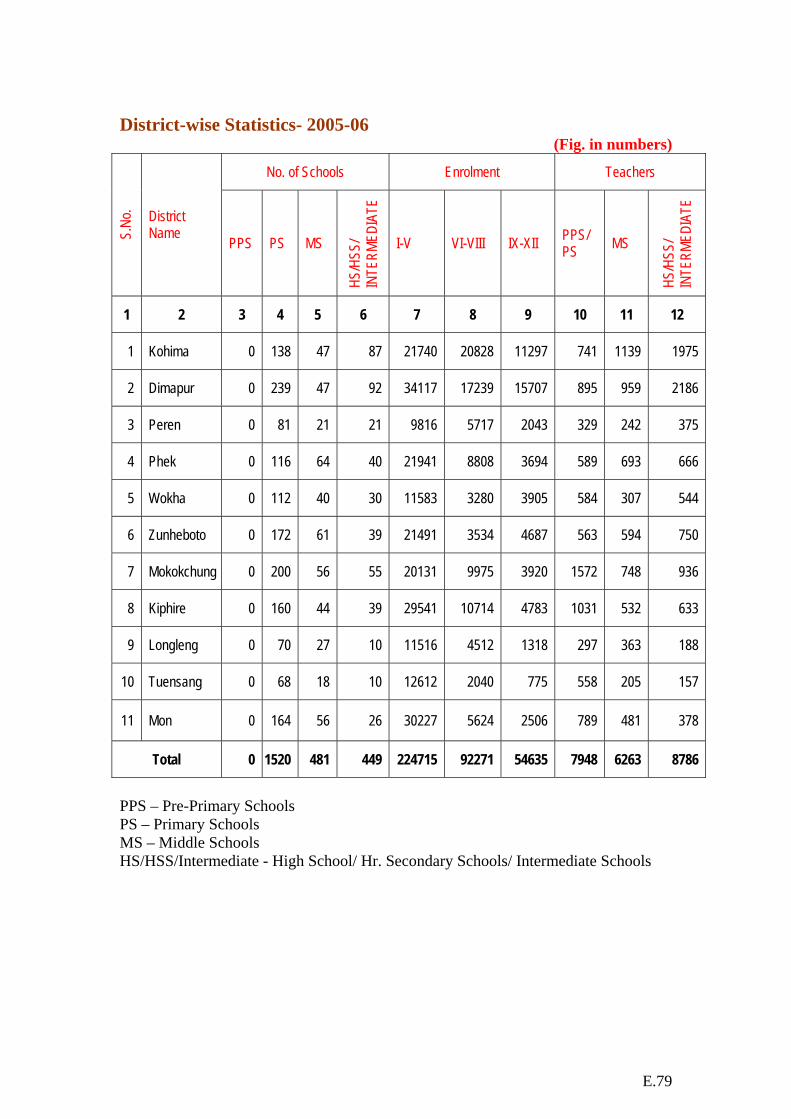
E.79
District-wise Statistics- 2005-06
(Fig. in numbers)
No. of Schools Enrolment Teachers
S.No
. District Name
PPS PS MS
HS/H
SS/
INTE
RMED
IATE
I-V VI-VIII IX-XII PPS/PS MS
HS/H
SS/
INTE
RMED
IATE
1 2 3 4 5 6 7 8 9 10 11 12
1 Kohima 0 138 47 87 21740 20828 11297 741 1139 1975
2 Dimapur 0 239 47 92 34117 17239 15707 895 959 2186
3 Peren 0 81 21 21 9816 5717 2043 329 242 375
4 Phek 0 116 64 40 21941 8808 3694 589 693 666
5 Wokha 0 112 40 30 11583 3280 3905 584 307 544
6 Zunheboto 0 172 61 39 21491 3534 4687 563 594 750
7 Mokokchung 0 200 56 55 20131 9975 3920 1572 748 936
8 Kiphire 0 160 44 39 29541 10714 4783 1031 532 633
9 Longleng 0 70 27 10 11516 4512 1318 297 363 188
10 Tuensang 0 68 18 10 12612 2040 775 558 205 157
11 Mon 0 164 56 26 30227 5624 2506 789 481 378
Total 0 1520 481 449 224715 92271 54635 7948 6263 8786
PPS – Pre-Primary Schools PS – Primary Schools MS – Middle Schools HS/HSS/Intermediate - High School/ Hr. Secondary Schools/ Intermediate Schools
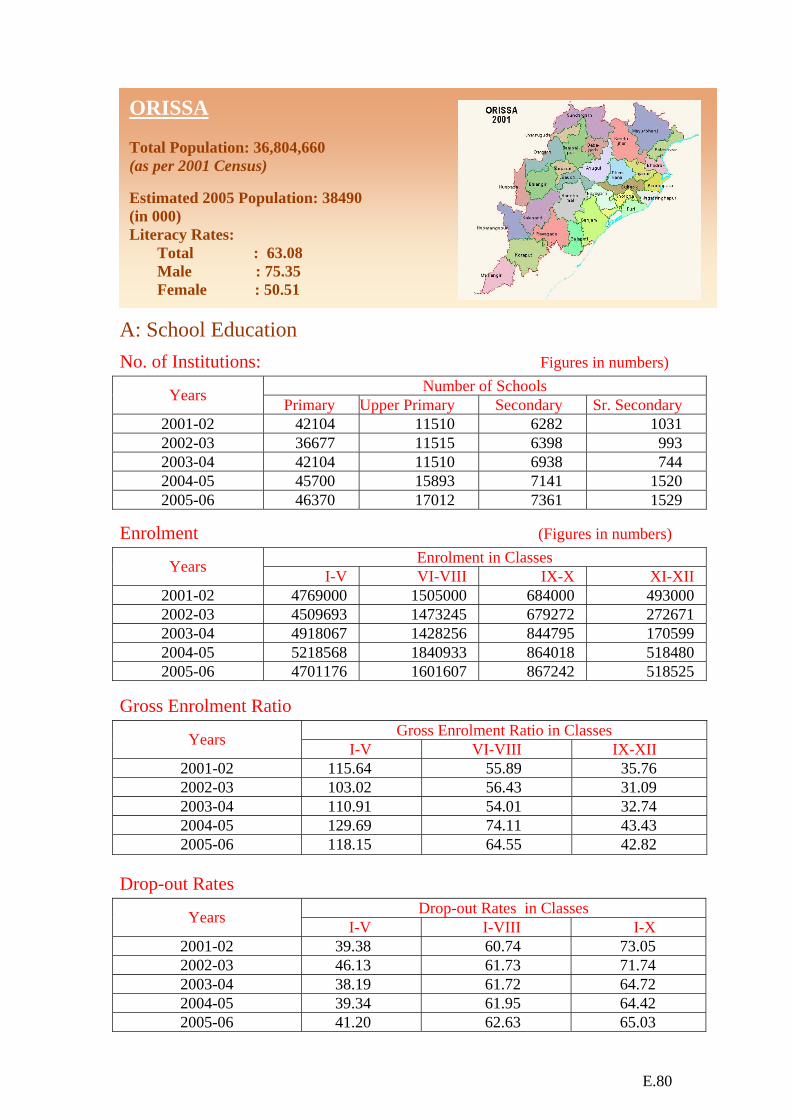
E.80
ORISSA
Total Population: 36,804,660 (as per 2001 Census) Estimated 2005 Population: 38490 (in 000) Literacy Rates: Total : 63.08 Male : 75.35 Female : 50.51
A: School Education
No. of Institutions: Figures in numbers) Number of Schools Years Primary Upper Primary Secondary Sr. Secondary
2001-02 42104 11510 6282 1031 2002-03 36677 11515 6398 993 2003-04 42104 11510 6938 744 2004-05 45700 15893 7141 1520 2005-06 46370 17012 7361 1529
Enrolment (Figures in numbers) Enrolment in Classes Years I-V VI-VIII IX-X XI-XII
2001-02 4769000 1505000 684000 493000 2002-03 4509693 1473245 679272 272671 2003-04 4918067 1428256 844795 170599 2004-05 5218568 1840933 864018 518480 2005-06 4701176 1601607 867242 518525
Gross Enrolment Ratio Gross Enrolment Ratio in Classes Years I-V VI-VIII IX-XII
2001-02 115.64 55.89 35.76 2002-03 103.02 56.43 31.09 2003-04 110.91 54.01 32.74 2004-05 129.69 74.11 43.43 2005-06 118.15 64.55 42.82
Drop-out Rates Drop-out Rates in Classes Years I-V I-VIII I-X
2001-02 39.38 60.74 73.05 2002-03 46.13 61.73 71.74 2003-04 38.19 61.72 64.72 2004-05 39.34 61.95 64.42 2005-06 41.20 62.63 65.03
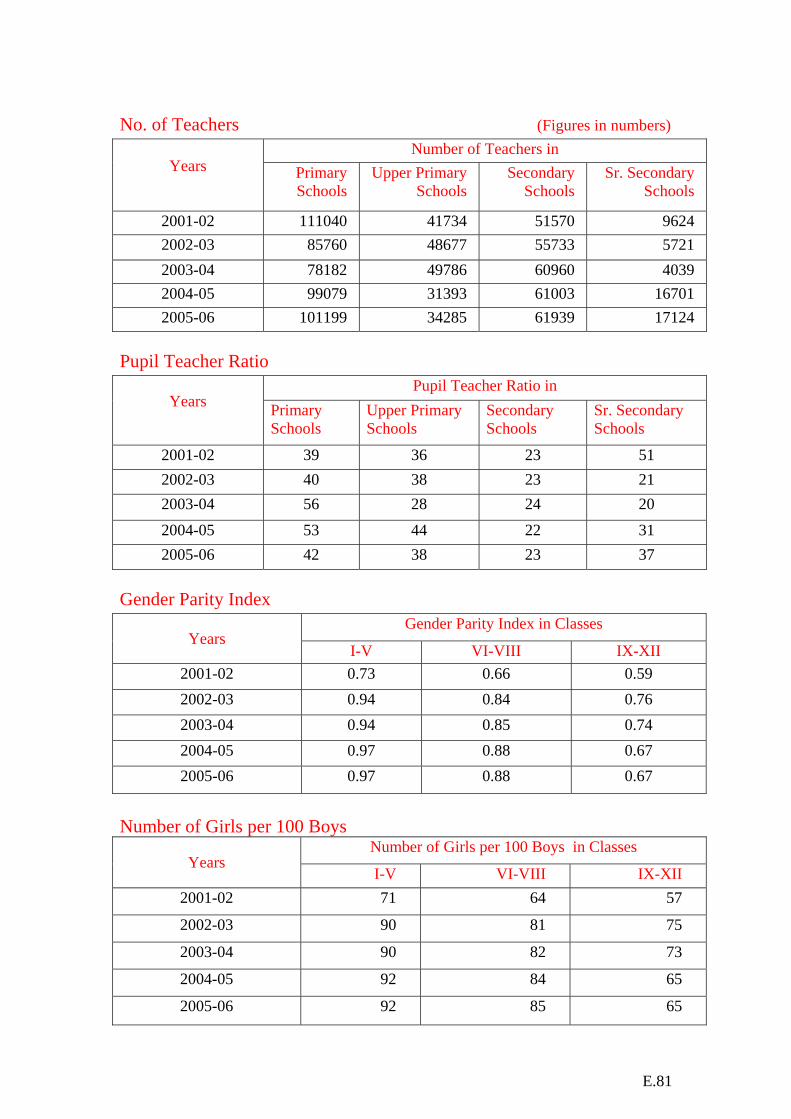
E.81
No. of Teachers (Figures in numbers)
Number of Teachers in Years
Primary Schools
Upper Primary Schools
Secondary Schools
Sr. Secondary Schools
2001-02 111040 41734 51570 9624 2002-03 85760 48677 55733 5721 2003-04 78182 49786 60960 4039 2004-05 99079 31393 61003 16701 2005-06 101199 34285 61939 17124
Pupil Teacher Ratio
Pupil Teacher Ratio in Years
Primary Schools
Upper Primary Schools
Secondary Schools
Sr. Secondary Schools
2001-02 39 36 23 51 2002-03 40 38 23 21 2003-04 56 28 24 20 2004-05 53 44 22 31 2005-06 42 38 23 37
Gender Parity Index
Gender Parity Index in Classes Years
I-V VI-VIII IX-XII 2001-02 0.73 0.66 0.59 2002-03 0.94 0.84 0.76 2003-04 0.94 0.85 0.74 2004-05 0.97 0.88 0.67 2005-06 0.97 0.88 0.67
Number of Girls per 100 Boys
Number of Girls per 100 Boys in Classes Years
I-V VI-VIII IX-XII 2001-02 71 64 57
2002-03 90 81 75
2003-04 90 82 73
2004-05 92 84 65
2005-06 92 85 65
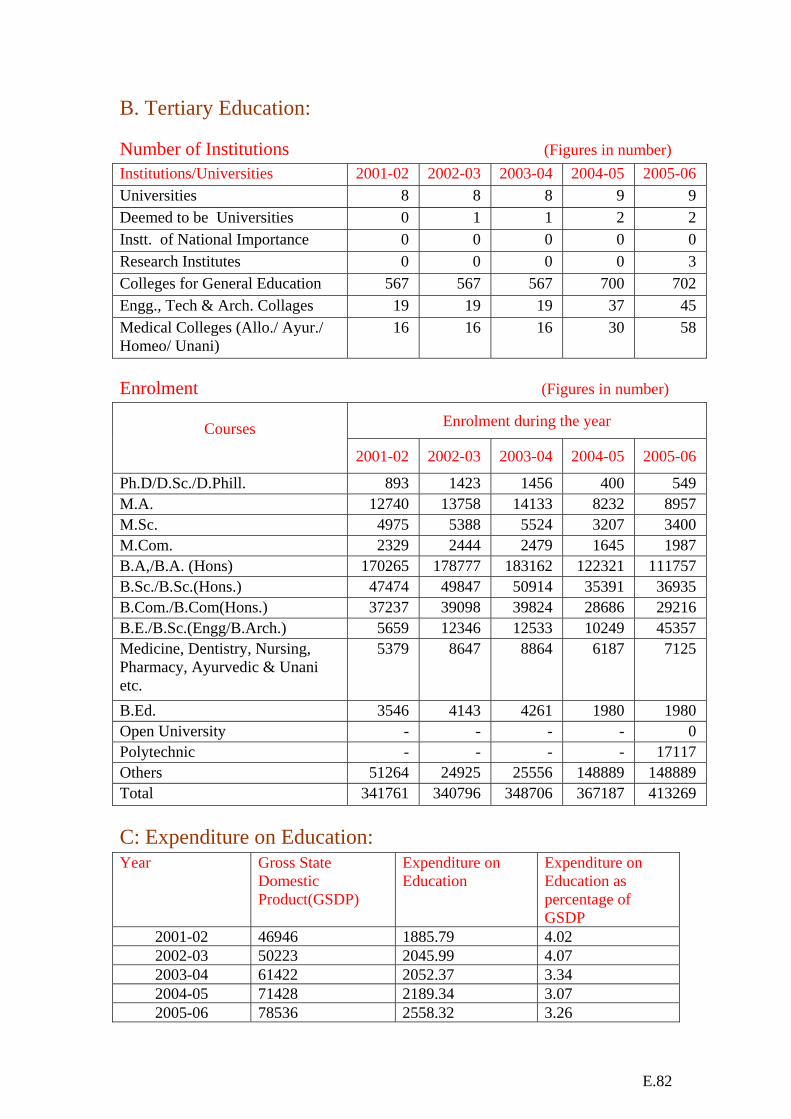
E.82
B. Tertiary Education: Number of Institutions (Figures in number) Institutions/Universities 2001-02 2002-03 2003-04 2004-05 2005-06 Universities 8 8 8 9 9 Deemed to be Universities 0 1 1 2 2 Instt. of National Importance 0 0 0 0 0 Research Institutes 0 0 0 0 3 Colleges for General Education 567 567 567 700 702 Engg., Tech & Arch. Collages 19 19 19 37 45 Medical Colleges (Allo./ Ayur./ Homeo/ Unani)
16 16 16 30 58
Enrolment (Figures in number)
Enrolment during the year Courses 2001-02 2002-03 2003-04 2004-05 2005-06
Ph.D/D.Sc./D.Phill. 893 1423 1456 400 549 M.A. 12740 13758 14133 8232 8957 M.Sc. 4975 5388 5524 3207 3400 M.Com. 2329 2444 2479 1645 1987 B.A,/B.A. (Hons) 170265 178777 183162 122321 111757 B.Sc./B.Sc.(Hons.) 47474 49847 50914 35391 36935 B.Com./B.Com(Hons.) 37237 39098 39824 28686 29216 B.E./B.Sc.(Engg/B.Arch.) 5659 12346 12533 10249 45357 Medicine, Dentistry, Nursing, Pharmacy, Ayurvedic & Unani etc.
5379 8647 8864 6187 7125
B.Ed. 3546 4143 4261 1980 1980 Open University - - - - 0 Polytechnic - - - - 17117 Others 51264 24925 25556 148889 148889 Total 341761 340796 348706 367187 413269 C: Expenditure on Education: Year Gross State
Domestic Product(GSDP)
Expenditure on Education
Expenditure on Education as percentage of GSDP
2001-02 46946 1885.79 4.02 2002-03 50223 2045.99 4.07 2003-04 61422 2052.37 3.34 2004-05 71428 2189.34 3.07 2005-06 78536 2558.32 3.26
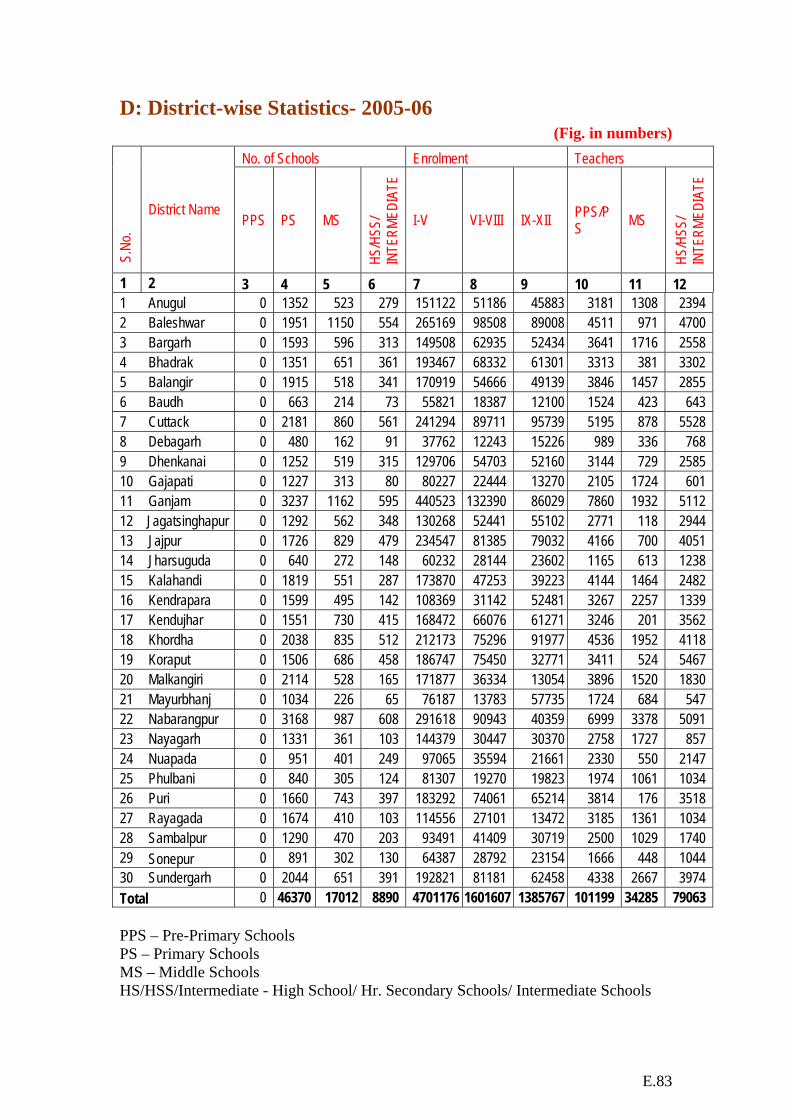
E.83
D: District-wise Statistics- 2005-06 (Fig. in numbers)
No. of Schools Enrolment Teachers
S.N
o.
District Name PPS PS MS
HS/H
SS/
INTE
RMED
IATE
I-V VI-VIII IX-XII PPS/PS MS
HS/H
SS/
INTE
RMED
IATE
1 2 3 4 5 6 7 8 9 10 11 12 1 Anugul 0 1352 523 279 151122 51186 45883 3181 1308 2394 2 Baleshwar 0 1951 1150 554 265169 98508 89008 4511 971 4700 3 Bargarh 0 1593 596 313 149508 62935 52434 3641 1716 2558 4 Bhadrak 0 1351 651 361 193467 68332 61301 3313 381 3302 5 Balangir 0 1915 518 341 170919 54666 49139 3846 1457 2855 6 Baudh 0 663 214 73 55821 18387 12100 1524 423 643 7 Cuttack 0 2181 860 561 241294 89711 95739 5195 878 5528 8 Debagarh 0 480 162 91 37762 12243 15226 989 336 768 9 Dhenkanai 0 1252 519 315 129706 54703 52160 3144 729 2585 10 Gajapati 0 1227 313 80 80227 22444 13270 2105 1724 601 11 Ganjam 0 3237 1162 595 440523 132390 86029 7860 1932 5112 12 Jagatsinghapur 0 1292 562 348 130268 52441 55102 2771 118 2944 13 Jajpur 0 1726 829 479 234547 81385 79032 4166 700 4051 14 Jharsuguda 0 640 272 148 60232 28144 23602 1165 613 1238 15 Kalahandi 0 1819 551 287 173870 47253 39223 4144 1464 2482 16 Kendrapara 0 1599 495 142 108369 31142 52481 3267 2257 1339 17 Kendujhar 0 1551 730 415 168472 66076 61271 3246 201 3562 18 Khordha 0 2038 835 512 212173 75296 91977 4536 1952 4118 19 Koraput 0 1506 686 458 186747 75450 32771 3411 524 5467 20 Malkangiri 0 2114 528 165 171877 36334 13054 3896 1520 1830 21 Mayurbhanj 0 1034 226 65 76187 13783 57735 1724 684 547 22 Nabarangpur 0 3168 987 608 291618 90943 40359 6999 3378 5091 23 Nayagarh 0 1331 361 103 144379 30447 30370 2758 1727 857 24 Nuapada 0 951 401 249 97065 35594 21661 2330 550 2147 25 Phulbani 0 840 305 124 81307 19270 19823 1974 1061 1034 26 Puri 0 1660 743 397 183292 74061 65214 3814 176 3518 27 Rayagada 0 1674 410 103 114556 27101 13472 3185 1361 1034 28 Sambalpur 0 1290 470 203 93491 41409 30719 2500 1029 1740 29 Sonepur 0 891 302 130 64387 28792 23154 1666 448 1044 30 Sundergarh 0 2044 651 391 192821 81181 62458 4338 2667 3974 Total 0 46370 17012 8890 4701176 1601607 1385767 101199 34285 79063 PPS – Pre-Primary Schools PS – Primary Schools MS – Middle Schools HS/HSS/Intermediate - High School/ Hr. Secondary Schools/ Intermediate Schools

E.84
PUNJAB
Total Population: 24,358,999 (as per 2001 Census) Estimated 2005 Population: 25724 (in 000) Literacy Rates: Total : 69.65 Male : 75.23 Female : 63.36
A: School Education
No. of Institutions: (Figures in number) Number of Schools Years Primary Upper Primary Secondary Sr. Secondary
2001-02 13074 2512 2227 1674 2002-03 13340 2546 2230 1921 2003-04 13265 2493 2282 1695 2004-05 13352 2503 2283 1697 2005-06 13291 2481 2323 1720
Enrolment (Figures in numbers) Enrolment in Classes Years I-V VI-VIII IX-X XI-XII
2001-02 2073388 992701 553909 302584 2002-03 1890013 1007386 502393 331868 2003-04 1979294 1038388 553388 290526 2004-05 1901408 1042094 551212 302086 2005-06 1872162 1063612 534081 327976
Gross Enrolment Ratio Gross Enrolment Ratio in Classes Years I-V VI-VIII IX-XII
2001-02 76.91 64.88 41.78 2002-03 71.12 59.09 39.12 2003-04 73.45 60.06 39.03 2004-05 77.20 65.42 39.60 2005-06 77.46 67.53 39.76
Drop-out Rates Drop-out Rates in Classes Years I-V I-VIII I-X
2001-02 20.34 36.99 38.62 2002-03 25.29 32.75 48.01 2003-04 22.03 35.19 43.45 2004-05 23.96 33.67 44.06 2005-06 23.66 32.98 46.02

E.85
No. of Teachers (Figures in numbers) Number of Teachers in
Years Primary
Schools Upper Primary
Schools Secondary
Schools Sr. Secondary
Schools 2001-02 40981 13920 29420 38509 2002-03 41524 13737 28991 42030
2003-04 40805 13543 29196 38836 2004-05 38676 13206 28222 38782 2005-06 37028 12910 28060 38451
Pupil Teacher Ratio Pupil Teacher Ratio in
Years
Primary Schools
Upper Primary Schools
Secondary Schools
Sr. Secondary Schools
2001-02 44 17 26 29 2002-03 38 18 25 27 2003-04 42 18 27 30 2004-05 43 19 28 29 2005-06 44 20 28 30
Gender Parity Index Gender Parity Index in Classes
Years I-V VI-VIII IX-XII
2001-02 1.01 0.99 0.95 2002-03 1.08 1.05 1.06 2003-04 1.08 1.03 1.01 2004-05 1.08 1.06 1.02 2005-06 1.08 1.05 1.00
Number of Girls per 100 Boys Number of Girls per 100 Boys in Classes
Years I-V VI-VIII IX-XII
2001-02 89 88 83
2002-03 89 90 90
2003-04 88 88 86
2004-05 88 88 86
2005-06 87 86 84
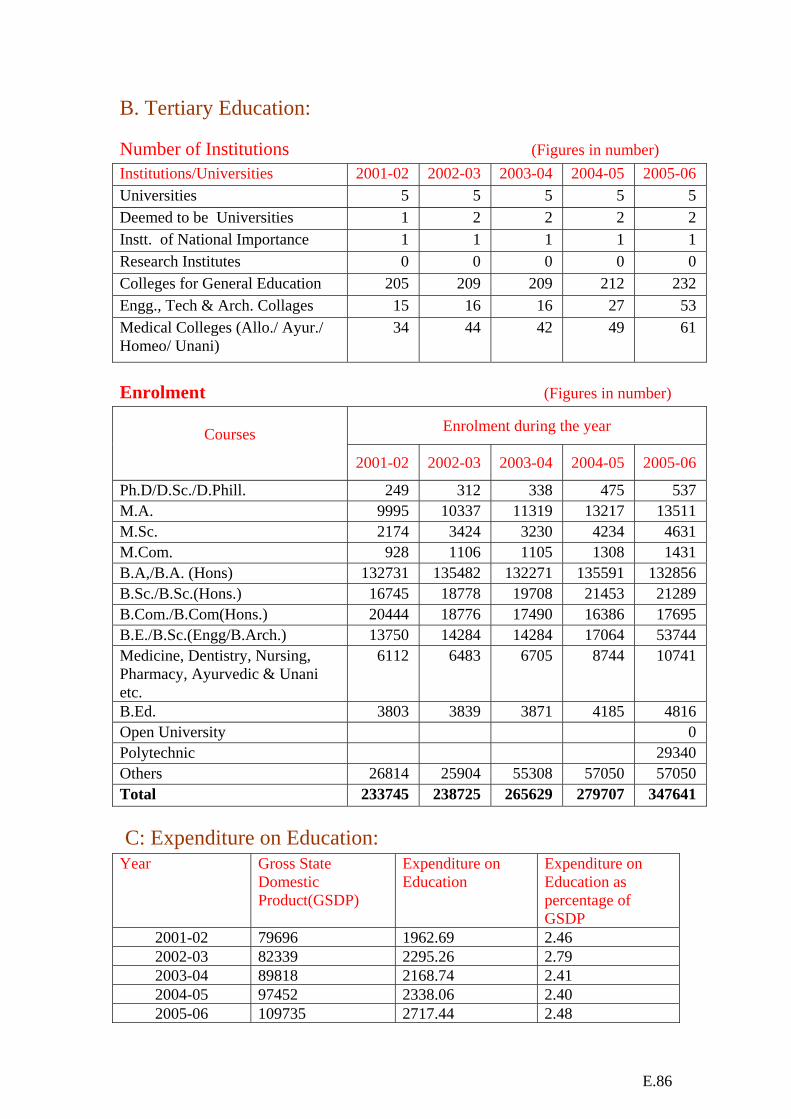
E.86
B. Tertiary Education: Number of Institutions (Figures in number) Institutions/Universities 2001-02 2002-03 2003-04 2004-05 2005-06 Universities 5 5 5 5 5 Deemed to be Universities 1 2 2 2 2 Instt. of National Importance 1 1 1 1 1 Research Institutes 0 0 0 0 0 Colleges for General Education 205 209 209 212 232 Engg., Tech & Arch. Collages 15 16 16 27 53 Medical Colleges (Allo./ Ayur./ Homeo/ Unani)
34 44 42 49 61
Enrolment (Figures in number)
Enrolment during the year Courses 2001-02 2002-03 2003-04 2004-05 2005-06
Ph.D/D.Sc./D.Phill. 249 312 338 475 537 M.A. 9995 10337 11319 13217 13511 M.Sc. 2174 3424 3230 4234 4631 M.Com. 928 1106 1105 1308 1431 B.A,/B.A. (Hons) 132731 135482 132271 135591 132856 B.Sc./B.Sc.(Hons.) 16745 18778 19708 21453 21289 B.Com./B.Com(Hons.) 20444 18776 17490 16386 17695 B.E./B.Sc.(Engg/B.Arch.) 13750 14284 14284 17064 53744 Medicine, Dentistry, Nursing, Pharmacy, Ayurvedic & Unani etc.
6112 6483 6705 8744 10741
B.Ed. 3803 3839 3871 4185 4816 Open University 0 Polytechnic 29340 Others 26814 25904 55308 57050 57050 Total 233745 238725 265629 279707 347641 C: Expenditure on Education: Year Gross State
Domestic Product(GSDP)
Expenditure on Education
Expenditure on Education as percentage of GSDP
2001-02 79696 1962.69 2.46 2002-03 82339 2295.26 2.79 2003-04 89818 2168.74 2.41 2004-05 97452 2338.06 2.40 2005-06 109735 2717.44 2.48

E.87
D: District-wise Statistics- 2005-06
(Fig. in numbers) No. of Schools Enrolment Teachers
S.No
.
District Name PPS PS MS
HS/H
SS/
INTE
RMED
IATE
I-V VI-VIII IX-XII PPS/PS MS
HS/H
SS/
INTE
RMED
IATE
1 2 3 4 5 6 7 8 9 10 11 12
1 Gurdaspur 0 1685 249 342 213817 88813 87583 4803 1299 6183
2 Amritsar 0 1452 267 439 243013 125015 130566 5535 1835 7125
3 Kapurthala 0 485 113 150 53833 36445 26020 1349 526 2446
4 Jalandhar 0 989 177 365 130608 106925 96873 2449 881 5839
5 Nava Shehar 0 427 92 12 36278 31049 25174 1025 286 1781
6 Hoshiarpur 0 1266 188 292 88079 83528 63009 2462 1000 4583
7 Ropar 0 865 120 198 78752 50395 37655 1756 708 3523
8 Ludhiana 0 1027 200 436 181129 103530 90380 3130 1033 8597
9 Firozpur 0 1063 206 255 163524 68349 48795 2335 992 4140
10 Faridkot 1 227 90 94 47937 26631 17918 924 522 1743
11 Mukatsar 0 360 79 154 75998 29708 22286 1251 370 1796
12 Moga 1 390 84 183 78189 46194 31111 1551 440 2215
13 Bathinda 0 542 108 219 123777 55307 39085 2093 668 3668
14 Mansa 0 299 84 103 62934 29051 18839 1066 293 1013
15 Sangrur 0 817 191 313 138237 79239 51194 2396 692 4402
16 Patiala 0 947 167 286 124580 78309 57355 2132 923 6051
17 Fateh G. Sahib 0 450 66 91 31477 25124 18214 771 442 1406
Total 2 13291 2481 4043 1872162 1063612 862057 37028 12910 66511 PPS – Pre-Primary Schools PS – Primary Schools MS – Middle Schools HS/HSS/Intermediate - High School/ Hr. Secondary Schools/ Intermediate Schools
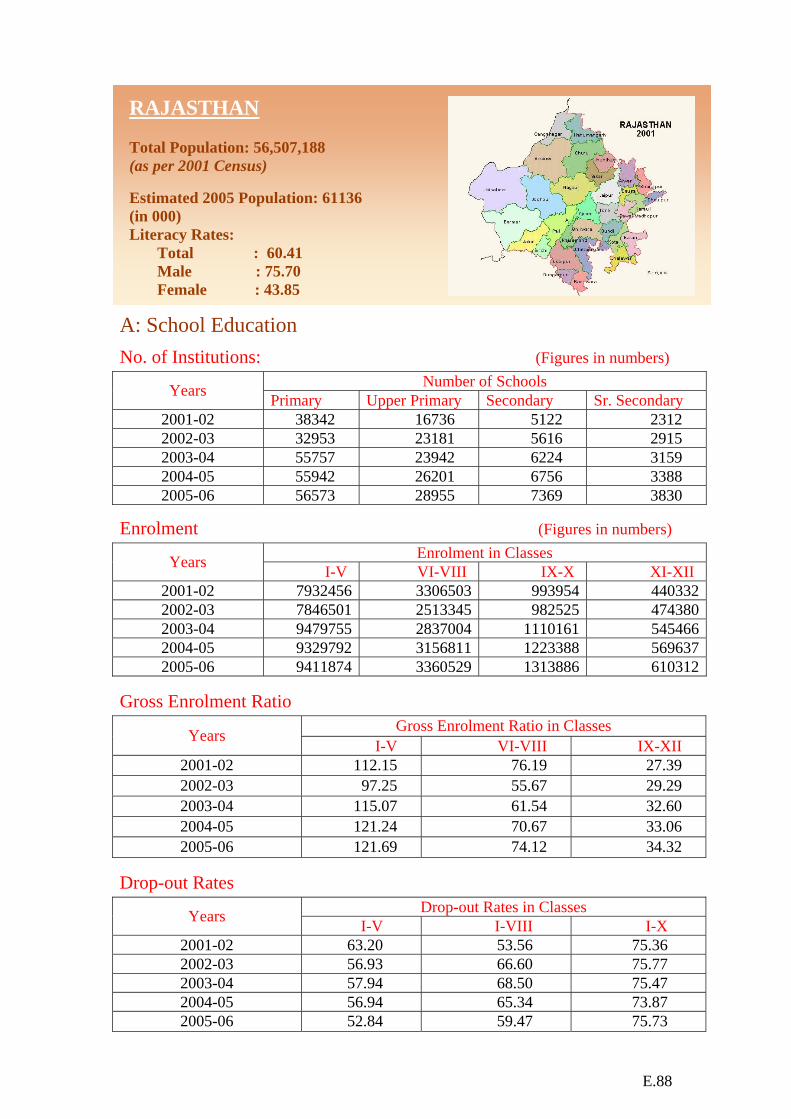
E.88
RAJASTHAN
Total Population: 56,507,188 (as per 2001 Census) Estimated 2005 Population: 61136 (in 000) Literacy Rates: Total : 60.41 Male : 75.70 Female : 43.85
A: School Education
No. of Institutions: (Figures in numbers) Number of Schools Years Primary Upper Primary Secondary Sr. Secondary
2001-02 38342 16736 5122 2312 2002-03 32953 23181 5616 2915 2003-04 55757 23942 6224 3159 2004-05 55942 26201 6756 3388 2005-06 56573 28955 7369 3830
Enrolment (Figures in numbers) Enrolment in Classes Years I-V VI-VIII IX-X XI-XII
2001-02 7932456 3306503 993954 4403322002-03 7846501 2513345 982525 4743802003-04 9479755 2837004 1110161 5454662004-05 9329792 3156811 1223388 5696372005-06 9411874 3360529 1313886 610312
Gross Enrolment Ratio Gross Enrolment Ratio in Classes Years
I-V VI-VIII IX-XII 2001-02 112.15 76.19 27.39 2002-03 97.25 55.67 29.29 2003-04 115.07 61.54 32.60 2004-05 121.24 70.67 33.06 2005-06 121.69 74.12 34.32
Drop-out Rates Drop-out Rates in Classes Years I-V I-VIII I-X
2001-02 63.20 53.56 75.36 2002-03 56.93 66.60 75.77 2003-04 57.94 68.50 75.47 2004-05 56.94 65.34 73.87 2005-06 52.84 59.47 75.73
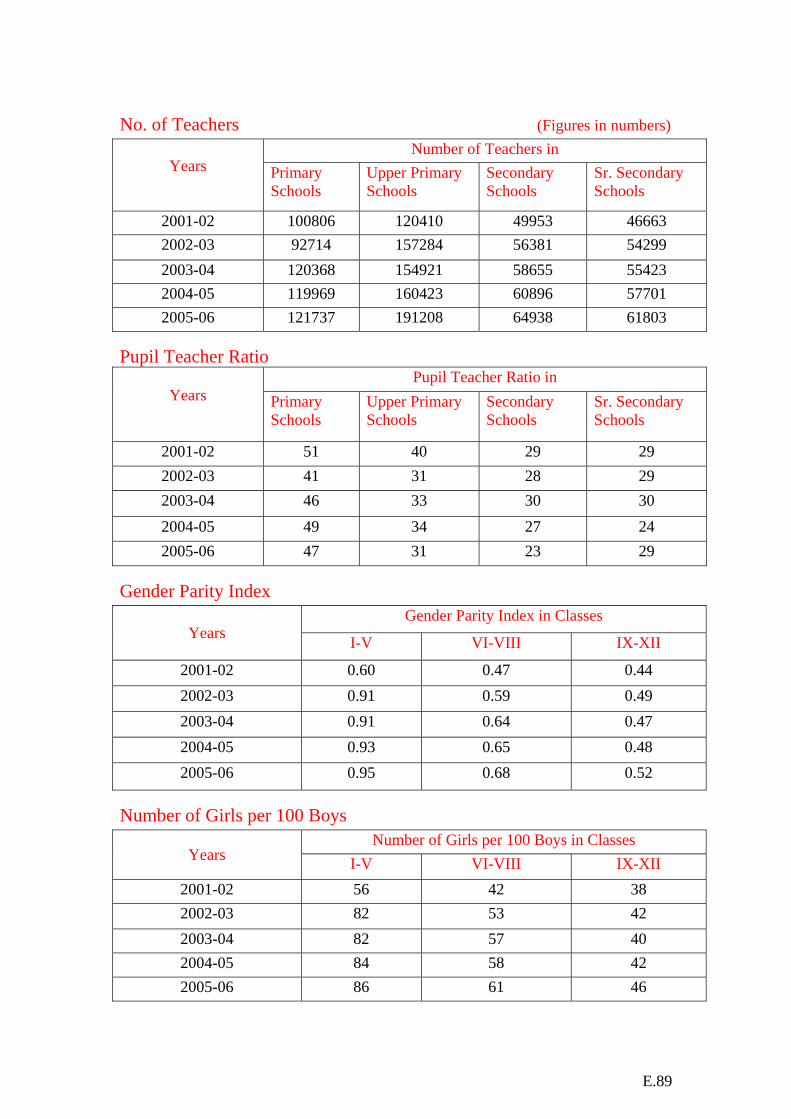
E.89
No. of Teachers (Figures in numbers)
Number of Teachers in Years
Primary Schools
Upper Primary Schools
Secondary Schools
Sr. Secondary Schools
2001-02 100806 120410 49953 46663 2002-03 92714 157284 56381 54299 2003-04 120368 154921 58655 55423 2004-05 119969 160423 60896 57701 2005-06 121737 191208 64938 61803
Pupil Teacher Ratio Pupil Teacher Ratio in
Years
Primary Schools
Upper Primary Schools
Secondary Schools
Sr. Secondary Schools
2001-02 51 40 29 29 2002-03 41 31 28 29 2003-04 46 33 30 30 2004-05 49 34 27 24 2005-06 47 31 23 29
Gender Parity Index Gender Parity Index in Classes
Years I-V VI-VIII IX-XII
2001-02 0.60 0.47 0.44 2002-03 0.91 0.59 0.49 2003-04 0.91 0.64 0.47 2004-05 0.93 0.65 0.48 2005-06 0.95 0.68 0.52
Number of Girls per 100 Boys Number of Girls per 100 Boys in Classes
Years I-V VI-VIII IX-XII 2001-02 56 42 38 2002-03 82 53 42 2003-04 82 57 40 2004-05 84 58 42 2005-06 86 61 46
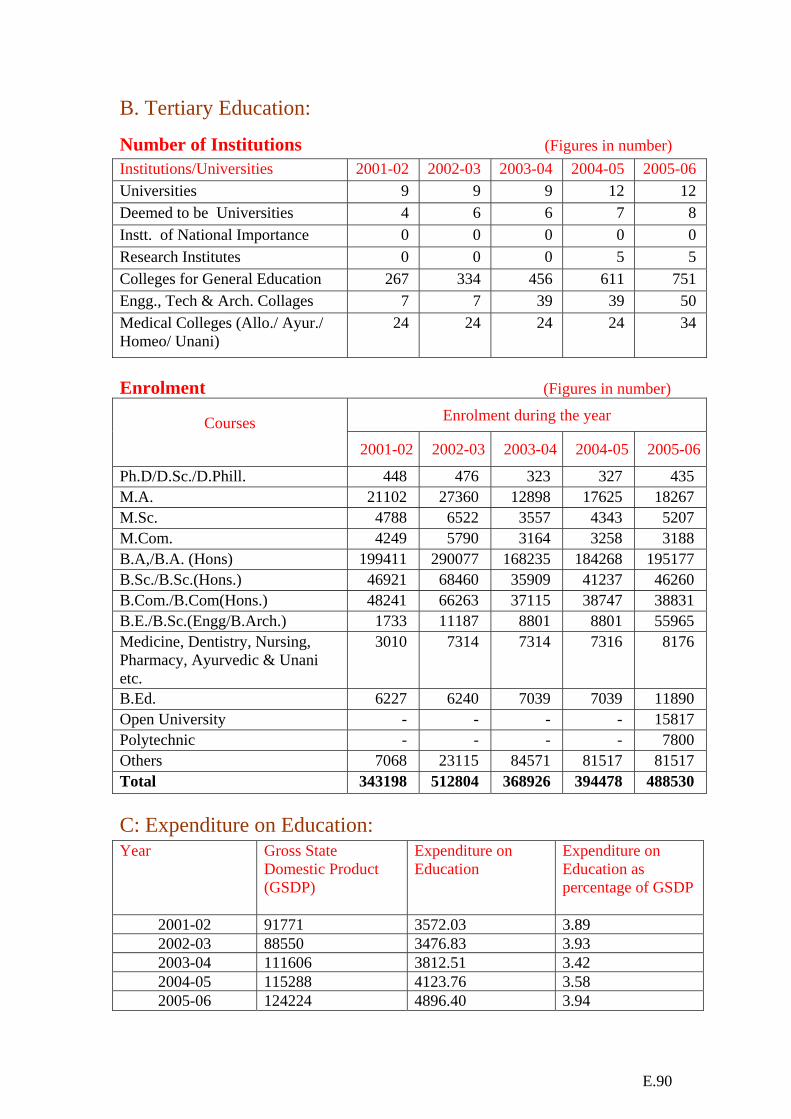
E.90
B. Tertiary Education:
Number of Institutions (Figures in number) Institutions/Universities 2001-02 2002-03 2003-04 2004-05 2005-06 Universities 9 9 9 12 12 Deemed to be Universities 4 6 6 7 8 Instt. of National Importance 0 0 0 0 0 Research Institutes 0 0 0 5 5 Colleges for General Education 267 334 456 611 751 Engg., Tech & Arch. Collages 7 7 39 39 50 Medical Colleges (Allo./ Ayur./ Homeo/ Unani)
24 24 24 24 34
Enrolment (Figures in number)
Enrolment during the year Courses 2001-02 2002-03 2003-04 2004-05 2005-06
Ph.D/D.Sc./D.Phill. 448 476 323 327 435 M.A. 21102 27360 12898 17625 18267 M.Sc. 4788 6522 3557 4343 5207 M.Com. 4249 5790 3164 3258 3188 B.A,/B.A. (Hons) 199411 290077 168235 184268 195177 B.Sc./B.Sc.(Hons.) 46921 68460 35909 41237 46260 B.Com./B.Com(Hons.) 48241 66263 37115 38747 38831 B.E./B.Sc.(Engg/B.Arch.) 1733 11187 8801 8801 55965 Medicine, Dentistry, Nursing, Pharmacy, Ayurvedic & Unani etc.
3010 7314 7314 7316 8176
B.Ed. 6227 6240 7039 7039 11890 Open University - - - - 15817 Polytechnic - - - - 7800 Others 7068 23115 84571 81517 81517 Total 343198 512804 368926 394478 488530 C: Expenditure on Education: Year Gross State
Domestic Product (GSDP)
Expenditure on Education
Expenditure on Education as percentage of GSDP
2001-02 91771 3572.03 3.89 2002-03 88550 3476.83 3.93 2003-04 111606 3812.51 3.42 2004-05 115288 4123.76 3.58 2005-06 124224 4896.40 3.94
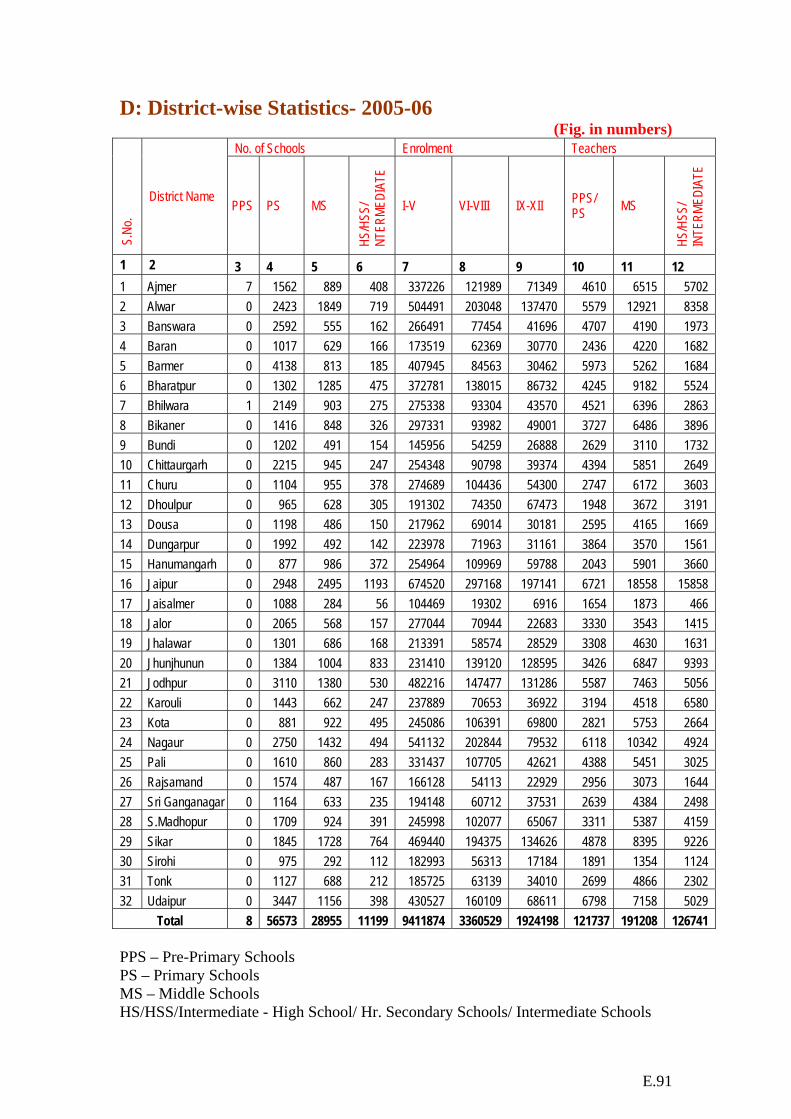
E.91
D: District-wise Statistics- 2005-06 (Fig. in numbers)
No. of Schools Enrolment Teachers S
.No.
District Name PPS PS MS
HS/H
SS/
NTER
MEDI
ATE
I-V VI-VIII IX-XII PPS/ PS MS
HS/H
SS/
INTE
RMED
IATE
1 2 3 4 5 6 7 8 9 10 11 12 1 Ajmer 7 1562 889 408 337226 121989 71349 4610 6515 5702 2 Alwar 0 2423 1849 719 504491 203048 137470 5579 12921 8358 3 Banswara 0 2592 555 162 266491 77454 41696 4707 4190 1973 4 Baran 0 1017 629 166 173519 62369 30770 2436 4220 1682 5 Barmer 0 4138 813 185 407945 84563 30462 5973 5262 1684 6 Bharatpur 0 1302 1285 475 372781 138015 86732 4245 9182 5524 7 Bhilwara 1 2149 903 275 275338 93304 43570 4521 6396 2863 8 Bikaner 0 1416 848 326 297331 93982 49001 3727 6486 3896 9 Bundi 0 1202 491 154 145956 54259 26888 2629 3110 1732 10 Chittaurgarh 0 2215 945 247 254348 90798 39374 4394 5851 2649 11 Churu 0 1104 955 378 274689 104436 54300 2747 6172 3603 12 Dhoulpur 0 965 628 305 191302 74350 67473 1948 3672 3191 13 Dousa 0 1198 486 150 217962 69014 30181 2595 4165 1669 14 Dungarpur 0 1992 492 142 223978 71963 31161 3864 3570 1561 15 Hanumangarh 0 877 986 372 254964 109969 59788 2043 5901 3660 16 Jaipur 0 2948 2495 1193 674520 297168 197141 6721 18558 15858 17 Jaisalmer 0 1088 284 56 104469 19302 6916 1654 1873 466 18 Jalor 0 2065 568 157 277044 70944 22683 3330 3543 1415 19 Jhalawar 0 1301 686 168 213391 58574 28529 3308 4630 1631 20 Jhunjhunun 0 1384 1004 833 231410 139120 128595 3426 6847 9393 21 Jodhpur 0 3110 1380 530 482216 147477 131286 5587 7463 5056 22 Karouli 0 1443 662 247 237889 70653 36922 3194 4518 6580 23 Kota 0 881 922 495 245086 106391 69800 2821 5753 2664 24 Nagaur 0 2750 1432 494 541132 202844 79532 6118 10342 4924 25 Pali 0 1610 860 283 331437 107705 42621 4388 5451 3025 26 Rajsamand 0 1574 487 167 166128 54113 22929 2956 3073 1644 27 Sri Ganganagar 0 1164 633 235 194148 60712 37531 2639 4384 2498 28 S.Madhopur 0 1709 924 391 245998 102077 65067 3311 5387 4159 29 Sikar 0 1845 1728 764 469440 194375 134626 4878 8395 9226 30 Sirohi 0 975 292 112 182993 56313 17184 1891 1354 1124 31 Tonk 0 1127 688 212 185725 63139 34010 2699 4866 2302 32 Udaipur 0 3447 1156 398 430527 160109 68611 6798 7158 5029
Total 8 56573 28955 11199 9411874 3360529 1924198 121737 191208 126741 PPS – Pre-Primary Schools PS – Primary Schools MS – Middle Schools HS/HSS/Intermediate - High School/ Hr. Secondary Schools/ Intermediate Schools

E.92
SIKKIM
Total Population: 540,851 (as per 2001 Census) Estimated 2005 Population: 569 (in 000) Literacy Rates: Total : 68.81 Male :76.04 Female : 60.40
A: School Education
No. of Institutions: (Figures in numbers) Number of Schools Years Primary Upper Primary Secondary Sr. Secondary
2001-02 501 129 77 33 2002-03 497 129 94 44 2003-04 497 126 82 41 2004-05 684 185 111 50 2005-06 733 205 112 50
Enrolment (Figures in numbers) Enrolment in Classes Years I-V VI-VIII IX-X XI-XII
2001-02 77003 24622 8246 4577 2002-03 79058 28083 11507 6178 2003-04 76799 24802 9288 5744 2004-05 86149 28683 10766 7217 2005-06 90687 31983 11504 7269
Gross Enrolment Ratio Gross Enrolment Ratio in Classes Years I-V VI-VIII IX-XII
2001-02 114.93 66.55 27.78 2002-03 121.68 65.19 32.83 2003-04 116.51 56.75 27.51 2004-05 143.58 66.70 33.30 2005-06 151.15 74.38 34.76
Drop-out Rates
Drop-out Rates in Classes Years I-V I-VIII I-X 2001-02 61.76 63.41 88.39 2002-03 52.06 69.66 75.12 2003-04 53.85 73.29 80.82 2004-05 49.44 71.22 82.30 2005-06 17.84 63.17 82.63

E.93
No. of Teachers (Figures in numbers)
Number of Teachers in Years
Primary Schools
Upper Primary Schools
Secondary Schools
Sr. Secondary Schools
2001-02 3490 1701 1531 1069 2002-03 2746 1661 1926 1703
2003-04 5031 1140 444 268 2004-05 5121 1172 978 419 2005-06 5388 1177 1010 467
Pupil Teacher Ratio
Pupil Teacher Ratio in Years
Primary Schools
Upper Primary Schools
Secondary Schools
Sr. Secondary Schools
2001-02 16 18 20 18 2002-03 12 15 18 19 2003-04 19 22 21 21 2004-05 22 25 11 18 2005-06 22 27 11 16
Gender Parity Index Gender Parity Index in Classes
Years I-V VI-VIII IX-XII
2001-02 0.95 1.15 0.97 2002-03 1.02 1.10 1.02 2003-04 1.00 1.18 1.04 2004-05 0.99 1.17 1.01 2005-06 0.97 1.17 1.02
Number of Girls per 100 Boys Number of Girls per 100 Boys in Classes
Years I-V VI-VIII IX-XII 2001-02 98 109 90 2002-03 101 106 97 2003-04 99 115 99 2004-05 99 112 101 2005-06 97 112 102
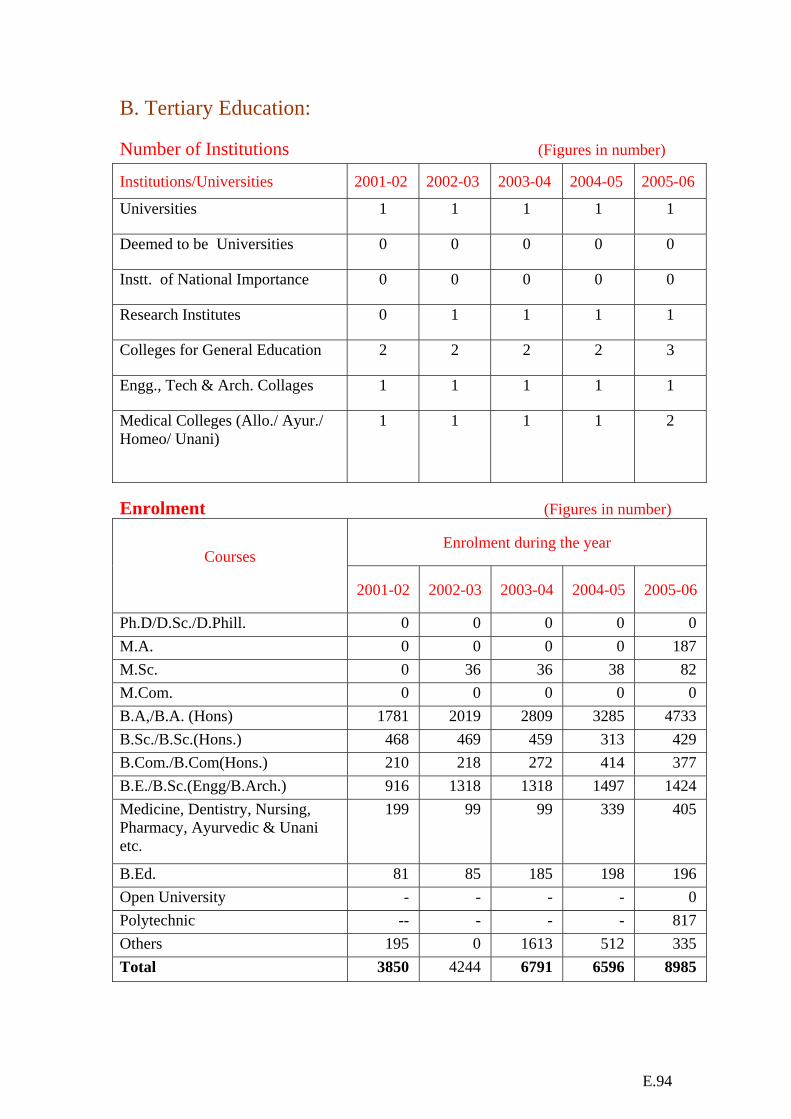
E.94
B. Tertiary Education: Number of Institutions (Figures in number)
Institutions/Universities 2001-02 2002-03 2003-04 2004-05 2005-06
Universities 1 1 1 1 1
Deemed to be Universities 0 0 0 0 0
Instt. of National Importance 0 0 0 0 0
Research Institutes 0 1 1 1 1
Colleges for General Education 2 2 2 2 3
Engg., Tech & Arch. Collages 1 1 1 1 1
Medical Colleges (Allo./ Ayur./ Homeo/ Unani)
1 1 1 1 2
Enrolment (Figures in number)
Enrolment during the year Courses
2001-02 2002-03 2003-04 2004-05 2005-06
Ph.D/D.Sc./D.Phill. 0 0 0 0 0 M.A. 0 0 0 0 187 M.Sc. 0 36 36 38 82 M.Com. 0 0 0 0 0 B.A,/B.A. (Hons) 1781 2019 2809 3285 4733 B.Sc./B.Sc.(Hons.) 468 469 459 313 429 B.Com./B.Com(Hons.) 210 218 272 414 377 B.E./B.Sc.(Engg/B.Arch.) 916 1318 1318 1497 1424 Medicine, Dentistry, Nursing, Pharmacy, Ayurvedic & Unani etc.
199 99 99 339 405
B.Ed. 81 85 185 198 196 Open University - - - - 0 Polytechnic -- - - - 817 Others 195 0 1613 512 335 Total 3850 4244 6791 6596 8985

E.95
C: Expenditure on Education: Year Gross State
Domestic Product (GSDP)
Expenditure on Education
Expenditure on Education as percentage of GSDP
2001-02 1136 124.73 10.98 2002-03 1276 135.51 10.62 2003-04 1430 143.17 10.01 2004-05 1602 168.62 10.53 2005-06 1803 196.76 10.91
D: District-wise Statistics- 2005-06
(Figures in numbers)
No. of Schools Enrolment Teachers
S.No
.
District Name PPS PS MS
HS/H
SS/
INTE
RMED
IATE
I-V VI-VIII IX-XII PPS/PS MS
HS/H
SS/
INTE
RMED
IATE
1 2 3 4 5 6 7 8 9 10 11 12
1 East District 356 221 72 65 37981 15471 10180 2182 521 671
2 West District 316 229 51 37 23224 7170 3628 1375 272 327
3 North District 109 72 20 18 6625 2064 1171 455 100 95
4 South District 313 211 62 42 22857 7278 3794 1376 284 384
Total 1094 733 205 162 90687 31983 18773 5388 1177 1477
PPS – Pre-Primary Schools PS – Primary Schools MS – Middle Schools HS/HSS/Intermediate - High School/ Hr. Secondary Schools/ Intermediate Schools
E.96
TAMIL NADU
Total Population: 62,405,679 (as per 2001 Census) Estimated 2005 Population: 64623 (in 000) Literacy Rates: Total : 73.45 Male : 82.42 Female : 64.43
A: School Education
No. of Institutions: (Figures in numbers) Number of Schools Years Primary Upper Primary Secondary Sr. Secondary
2001-02 31488 5809 4903 3608 2002-03 33394 6544 4356 4065 2003-04 32242 6825 4859 4136 2004-05 33470 7111 5004 4230 2005-06 34208 8017 5046 4536
Enrolment (Figures in numbers) Enrolment in Classes Years I-V VI-VIII IX-X XI-XII
2001-02 5673757 3524036 1586257 898429 2002-03 6468257 3517039 1680747 984516 2003-04 6591113 3697858 1760110 1015229 2004-05 6403416 3697858 1898649 1053705 2005-06 6378319 3633616 1924961 1083311
Gross Enrolment Ratio Gross Enrolment Ratio in Classes Years I-V VI-VIII IX-XII
2001-02 97.81 92.57 48.36 2002-03 115.50 99.08 55.15 2003-04 116.51 100.41 56.85 2004-05 118.41 107.00 62.08 2005-06 120.07 106.81 63.79
Drop-out Rates Drop-out Rates in Classes Years I-V I-VIII I-X
2001-02 27.24 40.07 57.66 2002-03 15.37 42.85 46.80 2003-04 3.23 25.15 58.82 2004-05 0.94 23.96 55.19 2005-06 0.00 22.11 42.45
E.97
No. of Teachers (Figures in numbers)
Number of Teachers in Years
Primary Schools
Upper Primary Schools
Secondary Schools
Sr. Secondary Schools
2001-02 121483 59922 50914 105493 2002-03 123369 56086 57467 134621 2003-04 121236 60079 68212 139789 2004-05 119969 56958 69065 142362 2005-06 115568 62156 74168 152574
Pupil Teacher Ratio
Pupil Teacher Ratio in Years
Primary Schools
Upper Primary Schools
Secondary Schools
Sr. Secondary Schools
2001-02 33 37 36 34 2002-03 34 40 30 33 2003-04 35 37 28 32 2004-05 33 41 29 33 2005-06 34 38 26 32
Gender Parity Index Gender Parity Index in Classes
Years I-V VI-VIII IX-XII
2001-02 1.00 0.98 0.88 2002-03 0.98 0.98 1.00 2003-04 0.98 0.96 0.99 2004-05 0.98 0.96 0.98 2005-06 0.99 0.97 1.02
Number of Girls per 100 Boys Number of Girls per 100 Boys in Classes
Years I-V VI-VIII IX-XII
2001-02 96 94 84
2002-03 93 92 95
2003-04 93 91 94
2004-05 93 91 94
2005-06 94 92 97
E.98
B. Tertiary Education: Number of Institutions (Figures in number) Institutions/Universities 2001-02 2002-03 2003-04 2004-05 2005-06 Universities 15 16 16 17 17 Deemed to be Universities 8 9 9 16 16 Instt. of National Importance 2 2 2 2 2 Research Institutes 1 1 1 1 1 Colleges for General Education 426 478 441 445 693 Engg., Tech & Arch. Collages 96 96 96 222 269 Medical Colleges (Allo./ Ayur./ Homeo/ Unani)
97 97 97 97 198
Enrolment (Figures in number)
Enrolment during the year Courses
2001-02 2002-03 2003-04 2004-05 2005-06
Ph.D/D.Sc./D.Phill. 2870 3410 3770 3346 3500 M.A. 15596 11015 12206 13343 15371 M.Sc. 25291 47793 52761 29324 35341 M.Com. 6440 21173 23124 8072 14929 B.A,/B.A. (Hons) 136504 91455 101122 106097 103861 B.Sc./B.Sc.(Hons.) 238043 185265 204456 188486 211689 B.Com./B.Com(Hons.) 90138 93343 102622 93805 104317 B.E./B.Sc.(Engg/B.Arch.) 57402 90109 96625 49466 329271 Medicine, Dentistry, Nursing, Pharmacy, Ayurvedic & Unani etc.
16182 12010 13264 47685 39131
B.Ed. 4277 2922 3246 4078 9826 Open University - - - - 17222 Polytechnic - - - 174237 Others 104601 134457 146543 265664 265664 Total 697344 692952 759739 809366 1324359 C: Expenditure on Education: Year Gross State
Domestic Product (GSDP)
Expenditure on Education
Expenditure on Education as percentage of GSDP
2001-02 149074 5019.27 3.37 2002-03 158370 4713.64 2.98 2003-04 175897 4953.73 2.82 2004-05 200781 5506.89 2.74 2005-06 223528 5826.80 2.61

E.99
D: District-wise Statistics- 2005-06 (Fig. in numbers)
No. of Schools Enrolment Teachers S.
No.
District Name PPS PS MS
HS/H
SS/
INTE
RMED
IATE
I-V VI-VIII IX-XII PPS/PS MS
HS/H
SS/
INTE
RMED
IATE
1 2 3 4 5 6 7 8 9 10 11 12 1 Chennai 0 708 187 743 248193 138718 246366 3642 1698 25056 2 Coimbatore 0 1567 420 625 392357 323382 212322 5752 3522 15084 3 Cuddalore 0 1241 307 318 251794 225767 117396 4049 2197 7040 4 Dharmapuri 0 954 245 202 169086 65062 56394 2886 1451 3842 5 Dindugal 0 1276 233 263 221186 113548 78087 4107 2142 5563 6 Erode 0 1562 270 365 203276 82880 105124 4529 2016 7704 7 Kancheepuram 0 1260 327 520 233121 166275 139059 4692 2717 9113 8 Karur 0 688 121 146 102138 38152 38032 1948 861 2913 9 Krishnagiri 0 1242 269 223 184255 104825 125049 3822 1369 4692 10 Madurai 0 1254 319 391 149322 63333 100782 5048 3544 13708 11 Nagapattinam 0 920 257 194 188349 117469 65876 3146 2137 4105 12 Nagercoil 0 526 154 383 143084 69508 84784 2683 991 7473 13 Namakkal 0 823 171 257 68164 33106 36784 2581 1248 8374 14 Nilgiris 0 424 90 181 140978 75017 51601 1299 641 3770 15 Peramballur 0 734 183 197 163707 102840 57934 2490 1299 3569 16 Pudukottai 0 1236 314 235 162512 74378 52167 3483 1843 3851 17 Ramnad 0 1045 216 179 363800 99725 147729 3430 1493 3655 18 Salem 0 1427 279 402 136315 72618 59929 6147 1338 9978 19 Sivaganga 0 1015 222 203 224523 129992 106218 2842 1602 3972 20 Thanjavur 0 1292 298 314 123317 91791 49903 4273 2355 6649 21 Theni 0 493 155 171 131379 87742 50521 2132 1730 3855 22 Thiruvarur 0 820 190 160 329125 216820 94067 3963 3011 8562 23 Tirunelveli 0 1752 416 404 219870 177531 151273 5967 3555 13016 24 Tiruvallur 0 1138 295 484 243059 134199 111158 3744 2040 3085 25 Tiruvannamalai 0 1505 360 318 225319 161059 147897 2594 1586 8795 26 Trichy 0 1268 322 339 169269 115251 65130 4522 2719 8420 27 Tuticorin 0 1179 291 251 402958 177556 192019 3655 2312 5072 28 Vellore 0 1986 441 488 351922 204964 124457 6918 3231 8367 29 Villupuram 0 1725 467 398 228062 103749 71072 5311 3694 12240 30 Virudhunagar 0 1148 198 228 207879 66359 69142 3913 1814 5219 Total 0 34208 8017 9582 6378319 3633616 3008272 115568 62156 226742
PPS – Pre-Primary Schools PS – Primary Schools MS – Middle Schools HS/HSS/Intermediate - High School/ Hr. Secondary Schools/ Intermediate Schools
E.100
TRIPURA
Total Population: 3,199,203 (as per 2001 Census) Estimated 2005 Population: 3365 (in 000) Literacy Rates: Total : 73.19 Male : 81.02 Female : 64.91
A: School Education No. of Institutions: (Figures in numbers)
Number of Schools Years Primary Upper Primary Secondary Sr. Secondary 2001-02 2095 432 402 234 2002-03 2054 435 403 240 2003-04 2075 453 409 242 2004-05 1776 1001 409 243 2005-06 1863 1004 419 248
Enrolment (Figures in numbers) Enrolment in Classes Years I-V VI-VIII IX-X XI-XII
2001-02 460507 165591 76559 27583 2002-03 449465 180513 82637 29861 2003-04 451731 186651 87298 30708 2004-05 461209 187590 87812 31097 2005-06 500284 197186 90155 32613
Gross Enrolment Ratio Gross Enrolment Ratio in Classes Years I-V VI-VIII IX-XII
2001-02 101.88 67.59 33.33 2002-03 123.85 71.42 36.89 2003-04 122.76 72.84 38.16 2004-05 131.03 78.16 38.86 2005-06 143.35 82.50 39.86
Drop-out Rates Drop-out Rates in Classes Years I-V I-VIII I-X
2001-02 50.53 69.02 76.92 2002-03 42.97 65.19 74.27 2003-04 44.80 64.29 74.31 2004-05 43.20 64.15 73.36 2005-06 28.76 55.88 74.89
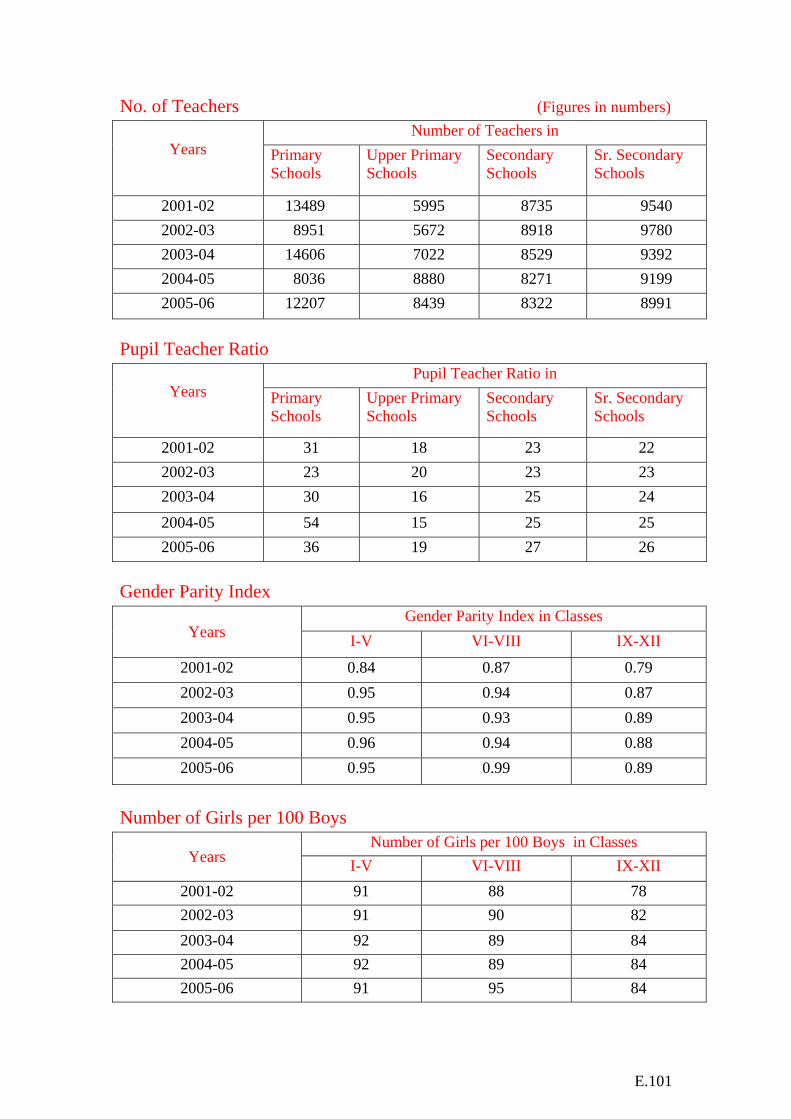
E.101
No. of Teachers (Figures in numbers) Number of Teachers in
Years
Primary Schools
Upper Primary Schools
Secondary Schools
Sr. Secondary Schools
2001-02 13489 5995 8735 9540 2002-03 8951 5672 8918 9780 2003-04 14606 7022 8529 9392 2004-05 8036 8880 8271 9199 2005-06 12207 8439 8322 8991
Pupil Teacher Ratio
Pupil Teacher Ratio in Years
Primary Schools
Upper Primary Schools
Secondary Schools
Sr. Secondary Schools
2001-02 31 18 23 22 2002-03 23 20 23 23 2003-04 30 16 25 24 2004-05 54 15 25 25 2005-06 36 19 27 26
Gender Parity Index
Gender Parity Index in Classes Years I-V VI-VIII IX-XII
2001-02 0.84 0.87 0.79 2002-03 0.95 0.94 0.87 2003-04 0.95 0.93 0.89 2004-05 0.96 0.94 0.88 2005-06 0.95 0.99 0.89
Number of Girls per 100 Boys
Number of Girls per 100 Boys in Classes Years I-V VI-VIII IX-XII
2001-02 91 88 78 2002-03 91 90 82 2003-04 92 89 84 2004-05 92 89 84 2005-06 91 95 84

E.102
B. Tertiary Education:
Number of Institutions (Figures in number)
Institutions/Universities 2001-02 2002-03 2003-04 2004-05 2005-06 Universities 1 1 1 1 1
Deemed to be Universities 0 0 0 0 0
Instt. of National Importance 0 0 0 0 0
Research Institutes 0 0 0 0 0
Colleges for General Education 14 14 14 14 14
Engg., Tech & Arch. Collages 1 1 1 1 2
Medical Colleges (Allo./ Ayur./ Homeo/ Unani)
1 1 1 1 3
Enrolment (Figures in number)
Enrolment during the year Courses
2001-02 2002-03 2003-04 2004-05 2005-06
Ph.D/D.Sc./D.Phill. 8 16 15 8 11 M.A. 627 701 856 929 942 M.Sc. 195 200 241 221 285 M.Com. 93 88 101 77 81 B.A,/B.A. (Hons) 13464 14329 14926 14853 16072 B.Sc./B.Sc.(Hons.) 2893 2667 2806 2992 2871 B.Com./B.Com(Hons.) 1547 1394 1405 1365 1288 B.E./B.Sc.(Engg/B.Arch.) 573 625 648 637 915 Medicine, Dentistry, Nursing, Pharmacy, Ayurvedic & Unani etc.
193 192 47 87 198
B.Ed. 120 151 318 312 472 Open University - - - - 0 Polytechnic - - - - 744 Others 842 - 193 966 966 Total 20555 20363 21556 22447 24845
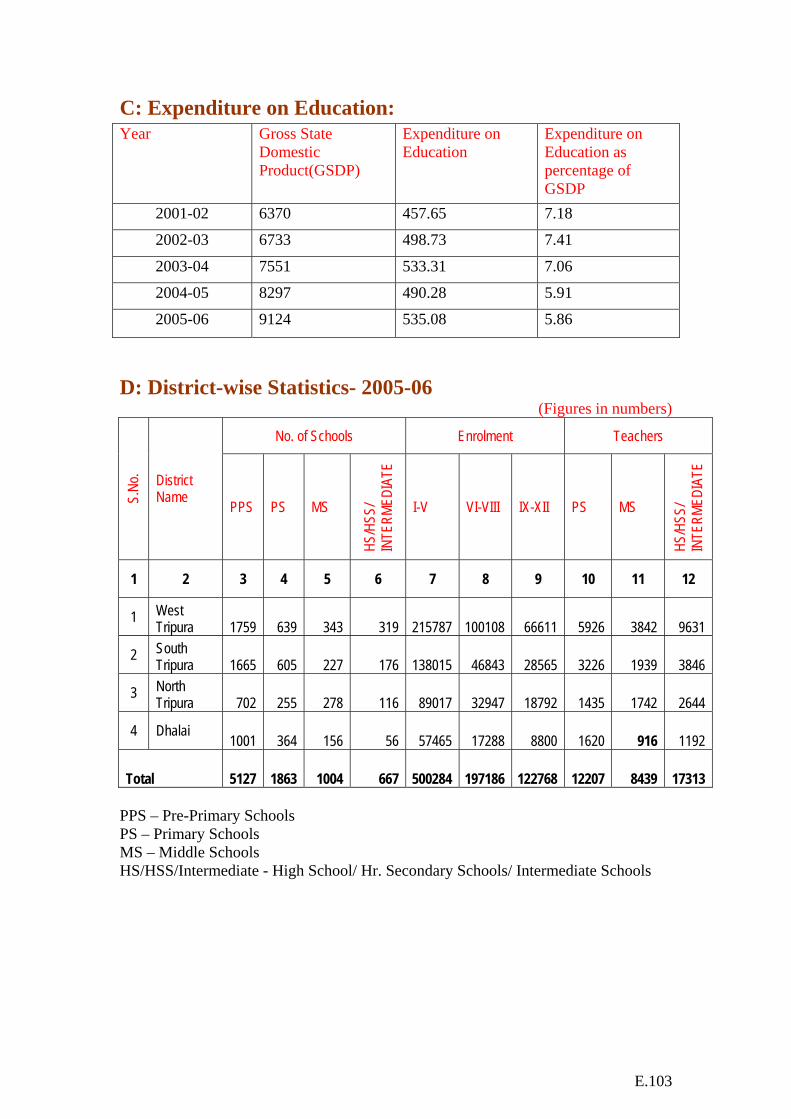
E.103
C: Expenditure on Education: Year Gross State
Domestic Product(GSDP)
Expenditure on Education
Expenditure on Education as percentage of GSDP
2001-02 6370 457.65 7.18
2002-03 6733 498.73 7.41
2003-04 7551 533.31 7.06
2004-05 8297 490.28 5.91
2005-06 9124 535.08 5.86
D: District-wise Statistics- 2005-06
(Figures in numbers)
No. of Schools Enrolment Teachers
S.No
. District Name PPS PS MS
HS/H
SS/
INTE
RMED
IATE
I-V VI-VIII IX-XII PS MS
HS/H
SS/
INTE
RMED
IATE
1 2 3 4 5 6 7 8 9 10 11 12
1 West Tripura 1759 639 343 319 215787 100108 66611 5926 3842 9631
2 South Tripura 1665 605 227 176 138015 46843 28565 3226 1939 3846
3 North Tripura 702 255 278 116 89017 32947 18792 1435 1742 2644
4 Dhalai 1001 364 156 56 57465 17288 8800 1620 916 1192
Total 5127 1863 1004 667 500284 197186 122768 12207 8439 17313 PPS – Pre-Primary Schools PS – Primary Schools MS – Middle Schools HS/HSS/Intermediate - High School/ Hr. Secondary Schools/ Intermediate Schools
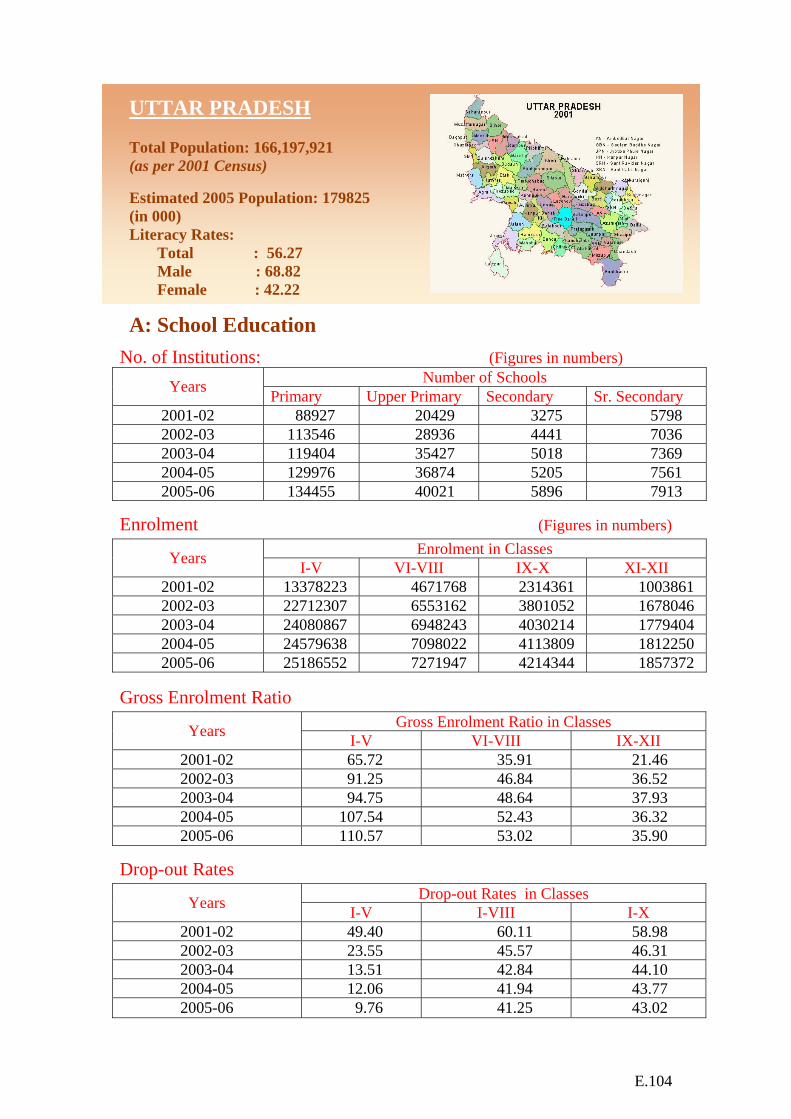
E.104
UTTAR PRADESH
Total Population: 166,197,921 (as per 2001 Census) Estimated 2005 Population: 179825 (in 000) Literacy Rates: Total : 56.27 Male : 68.82 Female : 42.22
A: School Education
No. of Institutions: (Figures in numbers) Number of Schools Years Primary Upper Primary Secondary Sr. Secondary
2001-02 88927 20429 3275 5798 2002-03 113546 28936 4441 7036 2003-04 119404 35427 5018 7369 2004-05 129976 36874 5205 7561 2005-06 134455 40021 5896 7913
Enrolment (Figures in numbers) Enrolment in Classes Years I-V VI-VIII IX-X XI-XII
2001-02 13378223 4671768 2314361 1003861 2002-03 22712307 6553162 3801052 1678046 2003-04 24080867 6948243 4030214 1779404 2004-05 24579638 7098022 4113809 1812250 2005-06 25186552 7271947 4214344 1857372
Gross Enrolment Ratio Gross Enrolment Ratio in Classes Years I-V VI-VIII IX-XII
2001-02 65.72 35.91 21.46 2002-03 91.25 46.84 36.52 2003-04 94.75 48.64 37.93 2004-05 107.54 52.43 36.32 2005-06 110.57 53.02 35.90
Drop-out Rates Drop-out Rates in Classes Years I-V I-VIII I-X
2001-02 49.40 60.11 58.98 2002-03 23.55 45.57 46.31 2003-04 13.51 42.84 44.10 2004-05 12.06 41.94 43.77 2005-06 9.76 41.25 43.02
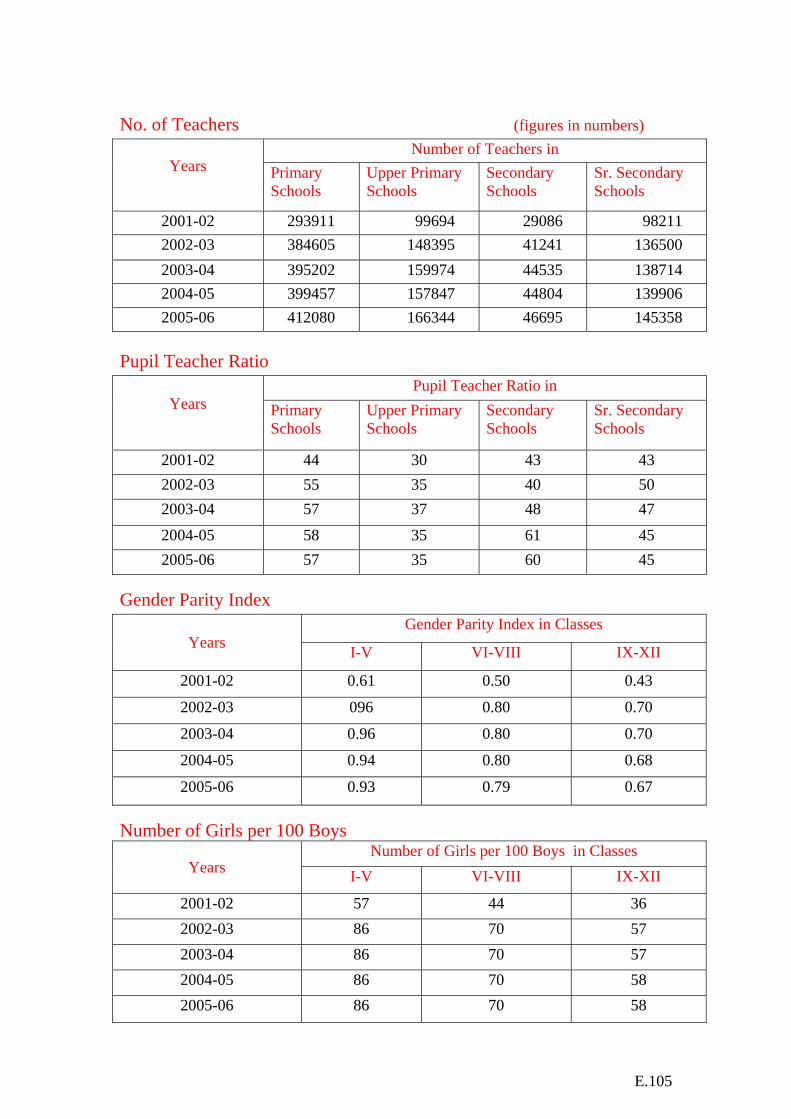
E.105
No. of Teachers (figures in numbers)
Number of Teachers in Years
Primary Schools
Upper Primary Schools
Secondary Schools
Sr. Secondary Schools
2001-02 293911 99694 29086 98211 2002-03 384605 148395 41241 136500 2003-04 395202 159974 44535 138714 2004-05 399457 157847 44804 139906 2005-06 412080 166344 46695 145358
Pupil Teacher Ratio
Pupil Teacher Ratio in Years
Primary Schools
Upper Primary Schools
Secondary Schools
Sr. Secondary Schools
2001-02 44 30 43 43 2002-03 55 35 40 50 2003-04 57 37 48 47 2004-05 58 35 61 45 2005-06 57 35 60 45
Gender Parity Index Gender Parity Index in Classes
Years I-V VI-VIII IX-XII
2001-02 0.61 0.50 0.43
2002-03 096 0.80 0.70
2003-04 0.96 0.80 0.70
2004-05 0.94 0.80 0.68
2005-06 0.93 0.79 0.67
Number of Girls per 100 Boys Number of Girls per 100 Boys in Classes
Years I-V VI-VIII IX-XII
2001-02 57 44 36 2002-03 86 70 57 2003-04 86 70 57 2004-05 86 70 58 2005-06 86 70 58
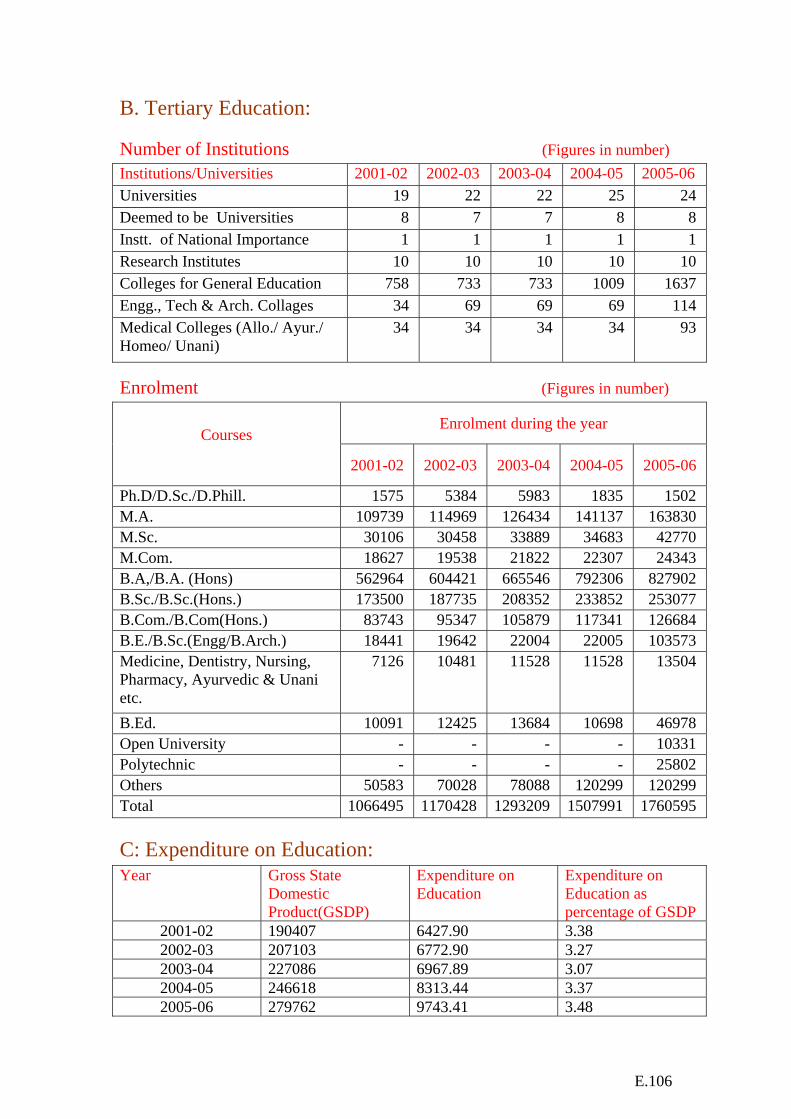
E.106
B. Tertiary Education: Number of Institutions (Figures in number) Institutions/Universities 2001-02 2002-03 2003-04 2004-05 2005-06 Universities 19 22 22 25 24 Deemed to be Universities 8 7 7 8 8 Instt. of National Importance 1 1 1 1 1 Research Institutes 10 10 10 10 10 Colleges for General Education 758 733 733 1009 1637 Engg., Tech & Arch. Collages 34 69 69 69 114 Medical Colleges (Allo./ Ayur./ Homeo/ Unani)
34 34 34 34 93
Enrolment (Figures in number)
Enrolment during the year Courses
2001-02 2002-03 2003-04 2004-05 2005-06
Ph.D/D.Sc./D.Phill. 1575 5384 5983 1835 1502 M.A. 109739 114969 126434 141137 163830 M.Sc. 30106 30458 33889 34683 42770 M.Com. 18627 19538 21822 22307 24343 B.A,/B.A. (Hons) 562964 604421 665546 792306 827902 B.Sc./B.Sc.(Hons.) 173500 187735 208352 233852 253077 B.Com./B.Com(Hons.) 83743 95347 105879 117341 126684 B.E./B.Sc.(Engg/B.Arch.) 18441 19642 22004 22005 103573 Medicine, Dentistry, Nursing, Pharmacy, Ayurvedic & Unani etc.
7126 10481 11528 11528 13504
B.Ed. 10091 12425 13684 10698 46978 Open University - - - - 10331 Polytechnic - - - - 25802 Others 50583 70028 78088 120299 120299 Total 1066495 1170428 1293209 1507991 1760595 C: Expenditure on Education: Year Gross State
Domestic Product(GSDP)
Expenditure on Education
Expenditure on Education as percentage of GSDP
2001-02 190407 6427.90 3.38 2002-03 207103 6772.90 3.27 2003-04 227086 6967.89 3.07 2004-05 246618 8313.44 3.37 2005-06 279762 9743.41 3.48
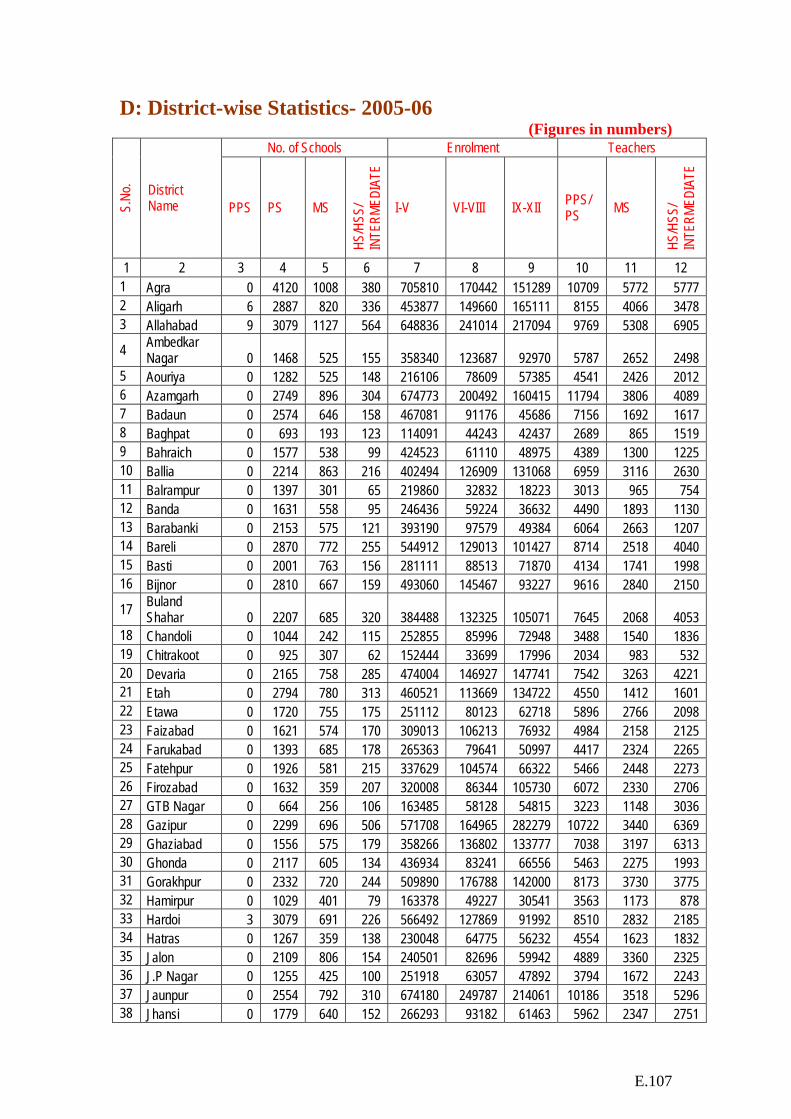
E.107
D: District-wise Statistics- 2005-06 (Figures in numbers)
No. of Schools Enrolment Teachers S.
No. District
Name PPS PS MS
HS/H
SS/
INTE
RMED
IATE
I-V VI-VIII IX-XII PPS/ PS MS
HS/H
SS/
INTE
RMED
IATE
1 2 3 4 5 6 7 8 9 10 11 12 1 Agra 0 4120 1008 380 705810 170442 151289 10709 5772 5777 2 Aligarh 6 2887 820 336 453877 149660 165111 8155 4066 3478 3 Allahabad 9 3079 1127 564 648836 241014 217094 9769 5308 6905
4 Ambedkar Nagar 0 1468 525 155 358340 123687 92970 5787 2652 2498
5 Aouriya 0 1282 525 148 216106 78609 57385 4541 2426 2012 6 Azamgarh 0 2749 896 304 674773 200492 160415 11794 3806 4089 7 Badaun 0 2574 646 158 467081 91176 45686 7156 1692 1617 8 Baghpat 0 693 193 123 114091 44243 42437 2689 865 1519 9 Bahraich 0 1577 538 99 424523 61110 48975 4389 1300 1225 10 Ballia 0 2214 863 216 402494 126909 131068 6959 3116 2630 11 Balrampur 0 1397 301 65 219860 32832 18223 3013 965 754 12 Banda 0 1631 558 95 246436 59224 36632 4490 1893 1130 13 Barabanki 0 2153 575 121 393190 97579 49384 6064 2663 1207 14 Bareli 0 2870 772 255 544912 129013 101427 8714 2518 4040 15 Basti 0 2001 763 156 281111 88513 71870 4134 1741 1998 16 Bijnor 0 2810 667 159 493060 145467 93227 9616 2840 2150
17 Buland Shahar 0 2207 685 320 384488 132325 105071 7645 2068 4053
18 Chandoli 0 1044 242 115 252855 85996 72948 3488 1540 1836 19 Chitrakoot 0 925 307 62 152444 33699 17996 2034 983 532 20 Devaria 0 2165 758 285 474004 146927 147741 7542 3263 4221 21 Etah 0 2794 780 313 460521 113669 134722 4550 1412 1601 22 Etawa 0 1720 755 175 251112 80123 62718 5896 2766 2098 23 Faizabad 0 1621 574 170 309013 106213 76932 4984 2158 2125 24 Farukabad 0 1393 685 178 265363 79641 50997 4417 2324 2265 25 Fatehpur 0 1926 581 215 337629 104574 66322 5466 2448 2273 26 Firozabad 0 1632 359 207 320008 86344 105730 6072 2330 2706 27 GTB Nagar 0 664 256 106 163485 58128 54815 3223 1148 3036 28 Gazipur 0 2299 696 506 571708 164965 282279 10722 3440 6369 29 Ghaziabad 0 1556 575 179 358266 136802 133777 7038 3197 6313 30 Ghonda 0 2117 605 134 436934 83241 66556 5463 2275 1993 31 Gorakhpur 0 2332 720 244 509890 176788 142000 8173 3730 3775 32 Hamirpur 0 1029 401 79 163378 49227 30541 3563 1173 878 33 Hardoi 3 3079 691 226 566492 127869 91992 8510 2832 2185 34 Hatras 0 1267 359 138 230048 64775 56232 4554 1623 1832 35 Jalon 0 2109 806 154 240501 82696 59942 4889 3360 2325 36 J.P Nagar 0 1255 425 100 251918 63057 47892 3794 1672 2243 37 Jaunpur 0 2554 792 310 674180 249787 214061 10186 3518 5296 38 Jhansi 0 1779 640 152 266293 93182 61463 5962 2347 2751
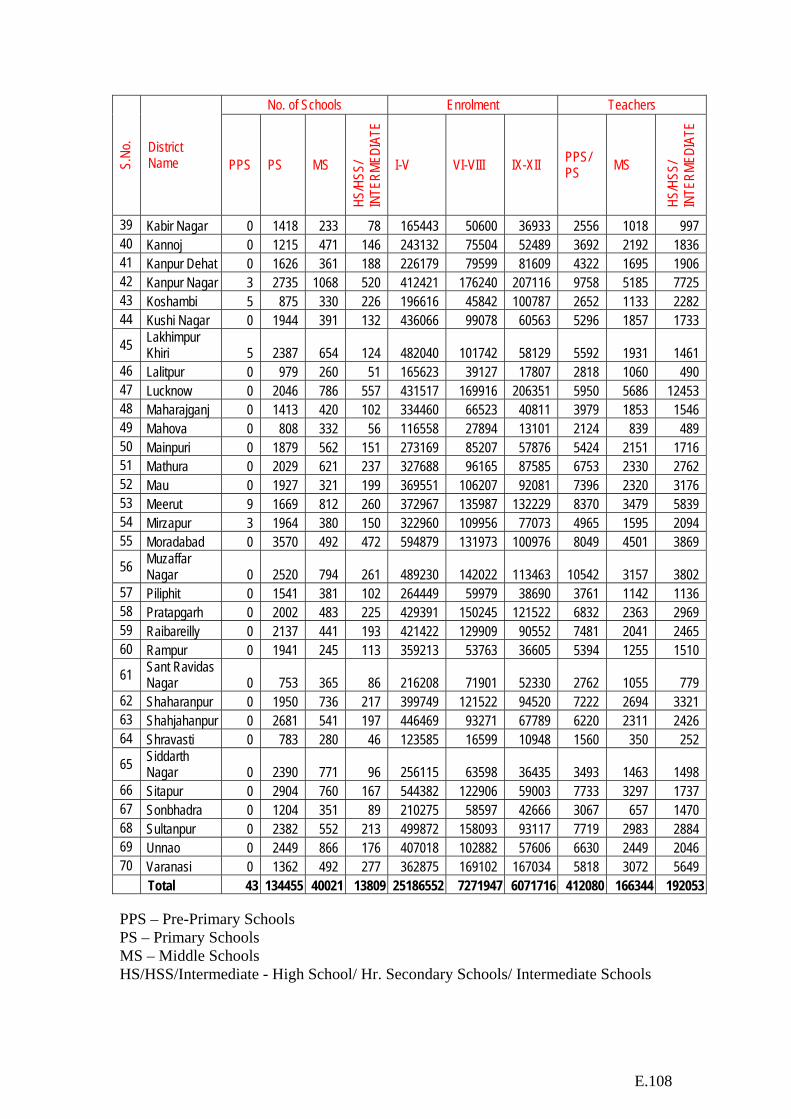
E.108
No. of Schools Enrolment Teachers S.
No. District
Name PPS PS MS
HS/H
SS/
INTE
RMED
IATE
I-V VI-VIII IX-XII PPS/ PS MS
HS/H
SS/
INTE
RMED
IATE
39 Kabir Nagar 0 1418 233 78 165443 50600 36933 2556 1018 997 40 Kannoj 0 1215 471 146 243132 75504 52489 3692 2192 1836 41 Kanpur Dehat 0 1626 361 188 226179 79599 81609 4322 1695 1906 42 Kanpur Nagar 3 2735 1068 520 412421 176240 207116 9758 5185 7725 43 Koshambi 5 875 330 226 196616 45842 100787 2652 1133 2282 44 Kushi Nagar 0 1944 391 132 436066 99078 60563 5296 1857 1733
45 Lakhimpur Khiri 5 2387 654 124 482040 101742 58129 5592 1931 1461
46 Lalitpur 0 979 260 51 165623 39127 17807 2818 1060 490 47 Lucknow 0 2046 786 557 431517 169916 206351 5950 5686 12453 48 Maharajganj 0 1413 420 102 334460 66523 40811 3979 1853 1546 49 Mahova 0 808 332 56 116558 27894 13101 2124 839 489 50 Mainpuri 0 1879 562 151 273169 85207 57876 5424 2151 1716 51 Mathura 0 2029 621 237 327688 96165 87585 6753 2330 2762 52 Mau 0 1927 321 199 369551 106207 92081 7396 2320 3176 53 Meerut 9 1669 812 260 372967 135987 132229 8370 3479 5839 54 Mirzapur 3 1964 380 150 322960 109956 77073 4965 1595 2094 55 Moradabad 0 3570 492 472 594879 131973 100976 8049 4501 3869
56 Muzaffar Nagar 0 2520 794 261 489230 142022 113463 10542 3157 3802
57 Piliphit 0 1541 381 102 264449 59979 38690 3761 1142 1136 58 Pratapgarh 0 2002 483 225 429391 150245 121522 6832 2363 2969 59 Raibareilly 0 2137 441 193 421422 129909 90552 7481 2041 2465 60 Rampur 0 1941 245 113 359213 53763 36605 5394 1255 1510
61 Sant Ravidas Nagar 0 753 365 86 216208 71901 52330 2762 1055 779
62 Shaharanpur 0 1950 736 217 399749 121522 94520 7222 2694 3321 63 Shahjahanpur 0 2681 541 197 446469 93271 67789 6220 2311 2426 64 Shravasti 0 783 280 46 123585 16599 10948 1560 350 252
65 Siddarth Nagar 0 2390 771 96 256115 63598 36435 3493 1463 1498
66 Sitapur 0 2904 760 167 544382 122906 59003 7733 3297 1737 67 Sonbhadra 0 1204 351 89 210275 58597 42666 3067 657 1470 68 Sultanpur 0 2382 552 213 499872 158093 93117 7719 2983 2884 69 Unnao 0 2449 866 176 407018 102882 57606 6630 2449 2046 70 Varanasi 0 1362 492 277 362875 169102 167034 5818 3072 5649 Total 43 134455 40021 13809 25186552 7271947 6071716 412080 166344 192053 PPS – Pre-Primary Schools PS – Primary Schools MS – Middle Schools HS/HSS/Intermediate - High School/ Hr. Secondary Schools/ Intermediate Schools
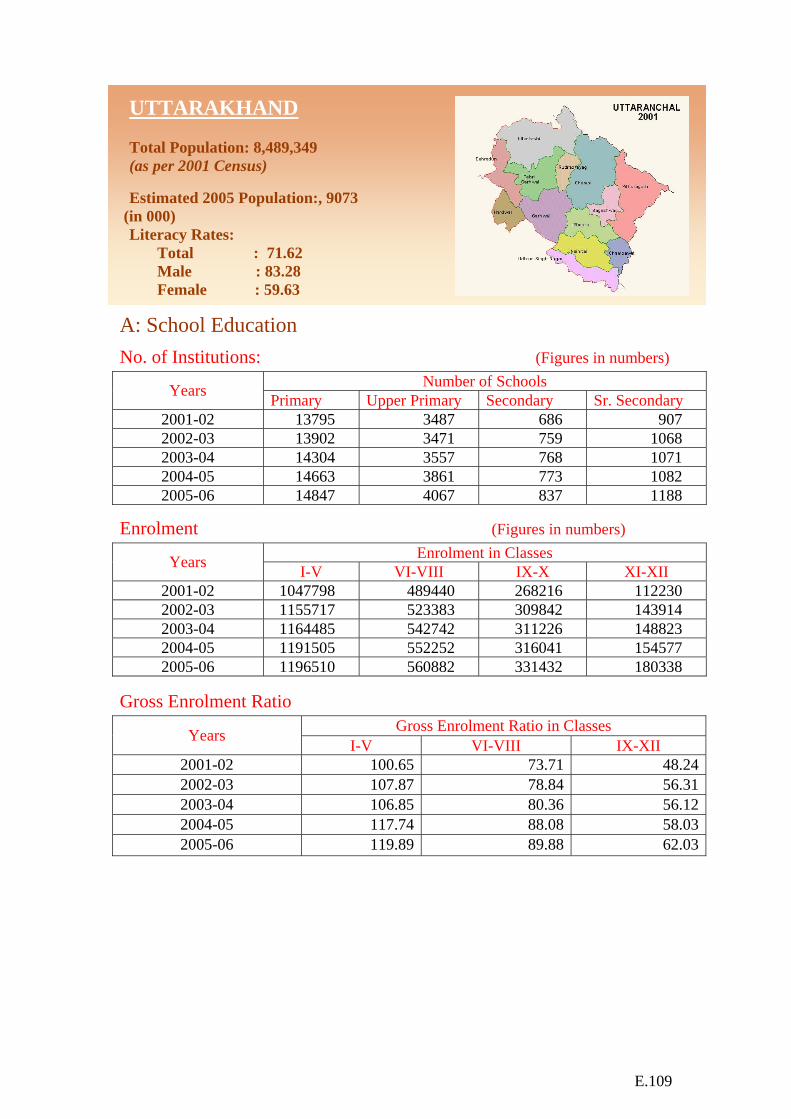
E.109
UTTARAKHAND
Total Population: 8,489,349 (as per 2001 Census) Estimated 2005 Population:, 9073
(in 000) Literacy Rates: Total : 71.62 Male : 83.28 Female : 59.63
A: School Education
No. of Institutions: (Figures in numbers) Number of Schools Years Primary Upper Primary Secondary Sr. Secondary
2001-02 13795 3487 686 907 2002-03 13902 3471 759 1068 2003-04 14304 3557 768 1071 2004-05 14663 3861 773 1082 2005-06 14847 4067 837 1188
Enrolment (Figures in numbers) Enrolment in Classes Years I-V VI-VIII IX-X XI-XII
2001-02 1047798 489440 268216 112230 2002-03 1155717 523383 309842 143914 2003-04 1164485 542742 311226 148823 2004-05 1191505 552252 316041 154577 2005-06 1196510 560882 331432 180338
Gross Enrolment Ratio Gross Enrolment Ratio in Classes Years I-V VI-VIII IX-XII
2001-02 100.65 73.71 48.242002-03 107.87 78.84 56.312003-04 106.85 80.36 56.122004-05 117.74 88.08 58.032005-06 119.89 89.88 62.03
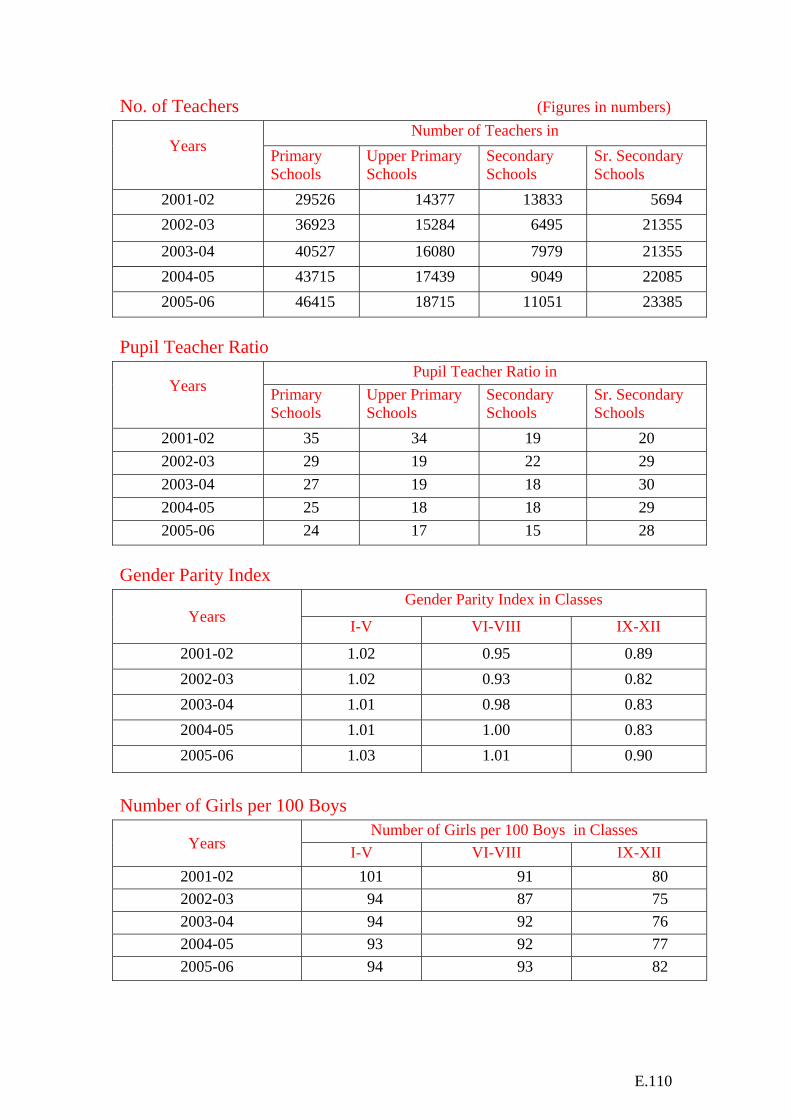
E.110
No. of Teachers (Figures in numbers) Number of Teachers in
Years Primary
Schools Upper Primary Schools
Secondary Schools
Sr. Secondary Schools
2001-02 29526 14377 13833 5694 2002-03 36923 15284 6495 21355
2003-04 40527 16080 7979 21355 2004-05 43715 17439 9049 22085 2005-06 46415 18715 11051 23385
Pupil Teacher Ratio
Pupil Teacher Ratio in Years
Primary Schools
Upper Primary Schools
Secondary Schools
Sr. Secondary Schools
2001-02 35 34 19 20 2002-03 29 19 22 29 2003-04 27 19 18 30 2004-05 25 18 18 29 2005-06 24 17 15 28
Gender Parity Index
Gender Parity Index in Classes Years I-V VI-VIII IX-XII
2001-02 1.02 0.95 0.89 2002-03 1.02 0.93 0.82 2003-04 1.01 0.98 0.83 2004-05 1.01 1.00 0.83 2005-06 1.03 1.01 0.90
Number of Girls per 100 Boys
Number of Girls per 100 Boys in Classes Years I-V VI-VIII IX-XII
2001-02 101 91 80 2002-03 94 87 75 2003-04 94 92 76 2004-05 93 92 77 2005-06 94 93 82
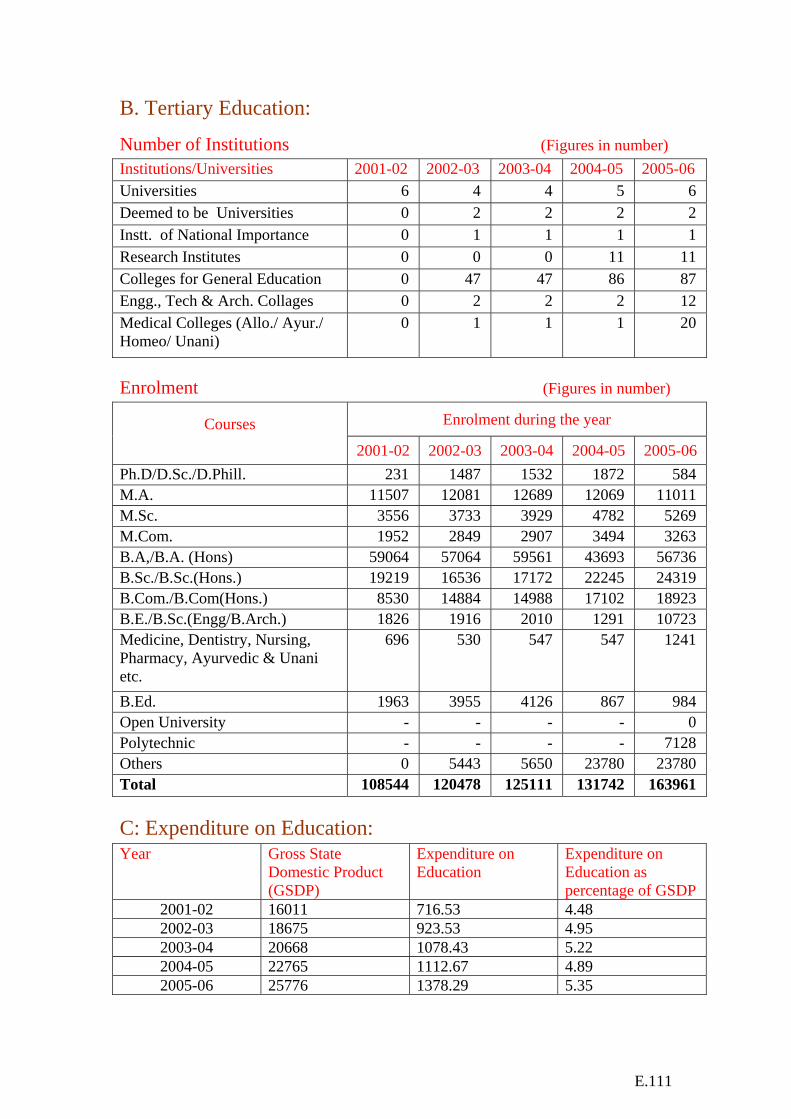
E.111
B. Tertiary Education:
Number of Institutions (Figures in number) Institutions/Universities 2001-02 2002-03 2003-04 2004-05 2005-06 Universities 6 4 4 5 6 Deemed to be Universities 0 2 2 2 2 Instt. of National Importance 0 1 1 1 1 Research Institutes 0 0 0 11 11 Colleges for General Education 0 47 47 86 87 Engg., Tech & Arch. Collages 0 2 2 2 12 Medical Colleges (Allo./ Ayur./ Homeo/ Unani)
0 1 1 1 20
Enrolment (Figures in number)
Enrolment during the year Courses 2001-02 2002-03 2003-04 2004-05 2005-06
Ph.D/D.Sc./D.Phill. 231 1487 1532 1872 584 M.A. 11507 12081 12689 12069 11011 M.Sc. 3556 3733 3929 4782 5269 M.Com. 1952 2849 2907 3494 3263 B.A,/B.A. (Hons) 59064 57064 59561 43693 56736 B.Sc./B.Sc.(Hons.) 19219 16536 17172 22245 24319 B.Com./B.Com(Hons.) 8530 14884 14988 17102 18923 B.E./B.Sc.(Engg/B.Arch.) 1826 1916 2010 1291 10723 Medicine, Dentistry, Nursing, Pharmacy, Ayurvedic & Unani etc.
696 530 547 547 1241
B.Ed. 1963 3955 4126 867 984 Open University - - - - 0 Polytechnic - - - - 7128 Others 0 5443 5650 23780 23780 Total 108544 120478 125111 131742 163961 C: Expenditure on Education: Year Gross State
Domestic Product (GSDP)
Expenditure on Education
Expenditure on Education as percentage of GSDP
2001-02 16011 716.53 4.48 2002-03 18675 923.53 4.95 2003-04 20668 1078.43 5.22 2004-05 22765 1112.67 4.89 2005-06 25776 1378.29 5.35
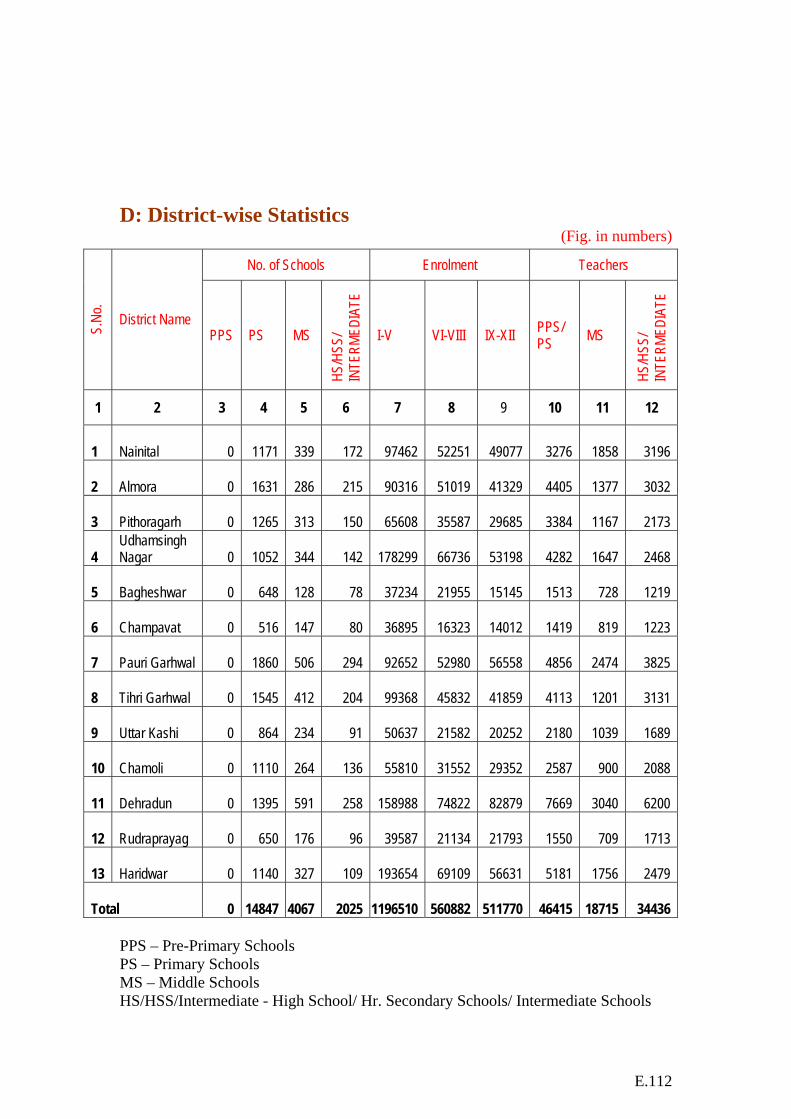
E.112
D: District-wise Statistics
(Fig. in numbers) No. of Schools Enrolment Teachers
S.No
.
District Name PPS PS MS
HS/H
SS/
INTE
RMED
IATE
I-V VI-VIII IX-XII PPS/
PS MS
HS/H
SS/
INTE
RMED
IATE
1 2 3 4 5 6 7 8 9 10 11 12
1 Nainital 0 1171 339 172 97462 52251 49077 3276 1858 3196
2 Almora 0 1631 286 215 90316 51019 41329 4405 1377 3032
3 Pithoragarh 0 1265 313 150 65608 35587 29685 3384 1167 2173
4 Udhamsingh Nagar 0 1052 344 142 178299 66736 53198 4282 1647 2468
5 Bagheshwar 0 648 128 78 37234 21955 15145 1513 728 1219
6 Champavat 0 516 147 80 36895 16323 14012 1419 819 1223
7 Pauri Garhwal 0 1860 506 294 92652 52980 56558 4856 2474 3825
8 Tihri Garhwal 0 1545 412 204 99368 45832 41859 4113 1201 3131
9 Uttar Kashi 0 864 234 91 50637 21582 20252 2180 1039 1689
10 Chamoli 0 1110 264 136 55810 31552 29352 2587 900 2088
11 Dehradun 0 1395 591 258 158988 74822 82879 7669 3040 6200
12 Rudraprayag 0 650 176 96 39587 21134 21793 1550 709 1713
13 Haridwar 0 1140 327 109 193654 69109 56631 5181 1756 2479
Total 0 14847 4067 2025 1196510 560882 511770 46415 18715 34436 PPS – Pre-Primary Schools PS – Primary Schools MS – Middle Schools HS/HSS/Intermediate - High School/ Hr. Secondary Schools/ Intermediate Schools
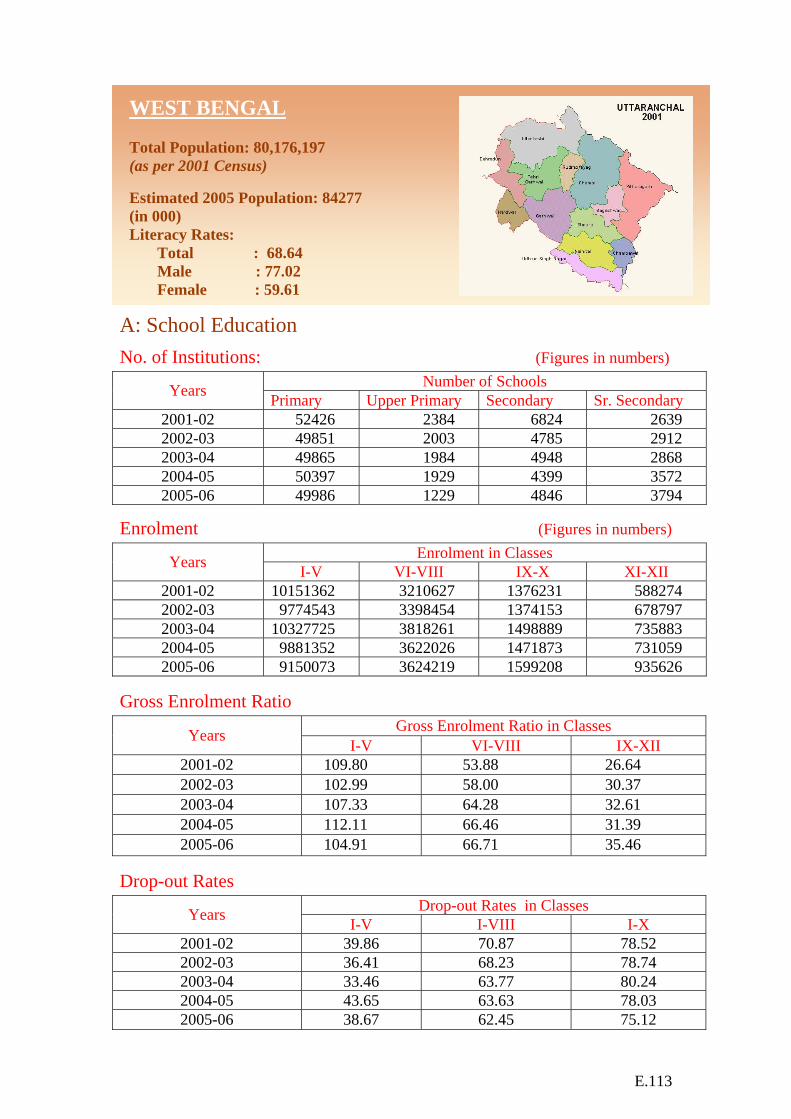
E.113
WEST BENGAL
Total Population: 80,176,197 (as per 2001 Census) Estimated 2005 Population: 84277 (in 000) Literacy Rates: Total : 68.64 Male : 77.02 Female : 59.61
A: School Education
No. of Institutions: (Figures in numbers) Number of Schools Years Primary Upper Primary Secondary Sr. Secondary
2001-02 52426 2384 6824 2639 2002-03 49851 2003 4785 2912 2003-04 49865 1984 4948 2868 2004-05 50397 1929 4399 3572 2005-06 49986 1229 4846 3794
Enrolment (Figures in numbers) Enrolment in Classes Years I-V VI-VIII IX-X XI-XII
2001-02 10151362 3210627 1376231 588274 2002-03 9774543 3398454 1374153 678797 2003-04 10327725 3818261 1498889 735883 2004-05 9881352 3622026 1471873 731059 2005-06 9150073 3624219 1599208 935626
Gross Enrolment Ratio Gross Enrolment Ratio in Classes Years I-V VI-VIII IX-XII
2001-02 109.80 53.88 26.64 2002-03 102.99 58.00 30.37 2003-04 107.33 64.28 32.61 2004-05 112.11 66.46 31.39 2005-06 104.91 66.71 35.46
Drop-out Rates Drop-out Rates in Classes Years I-V I-VIII I-X
2001-02 39.86 70.87 78.52 2002-03 36.41 68.23 78.74 2003-04 33.46 63.77 80.24 2004-05 43.65 63.63 78.03 2005-06 38.67 62.45 75.12
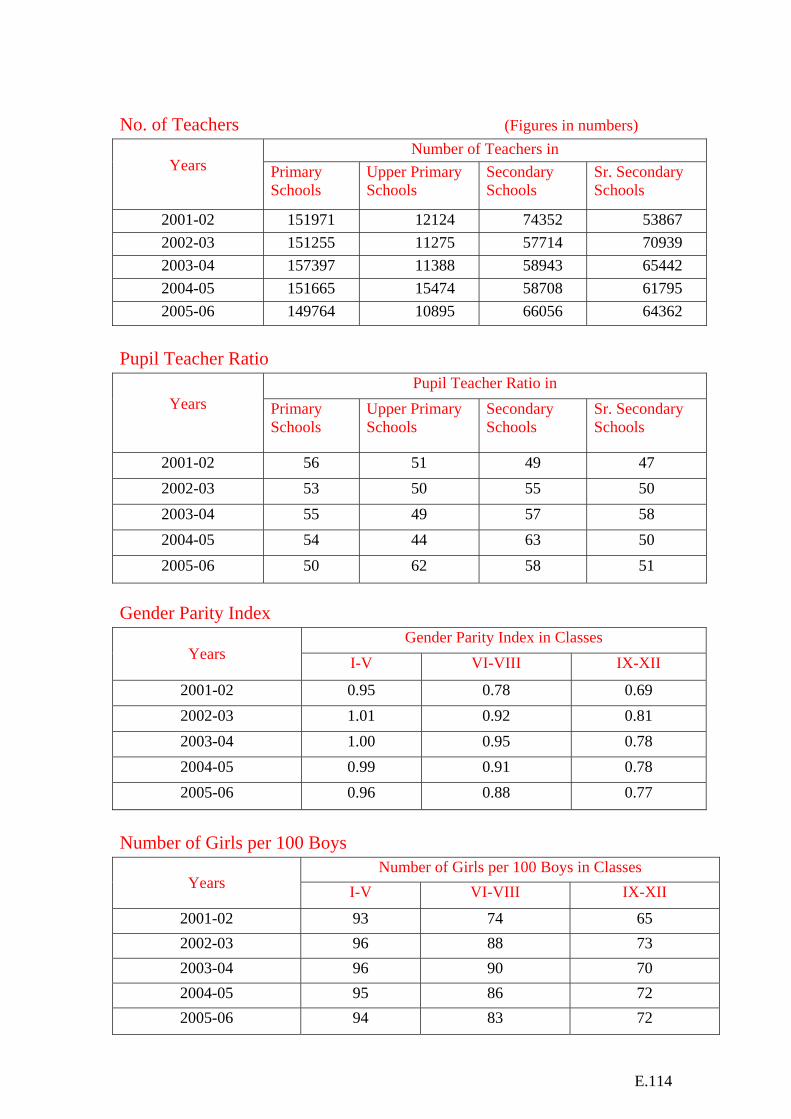
E.114
No. of Teachers (Figures in numbers)
Number of Teachers in Years
Primary Schools
Upper Primary Schools
Secondary Schools
Sr. Secondary Schools
2001-02 151971 12124 74352 53867 2002-03 151255 11275 57714 70939 2003-04 157397 11388 58943 65442 2004-05 151665 15474 58708 61795 2005-06 149764 10895 66056 64362
Pupil Teacher Ratio
Pupil Teacher Ratio in Years
Primary Schools
Upper Primary Schools
Secondary Schools
Sr. Secondary Schools
2001-02 56 51 49 47 2002-03 53 50 55 50 2003-04 55 49 57 58 2004-05 54 44 63 50 2005-06 50 62 58 51
Gender Parity Index
Gender Parity Index in Classes Years I-V VI-VIII IX-XII
2001-02 0.95 0.78 0.69 2002-03 1.01 0.92 0.81 2003-04 1.00 0.95 0.78 2004-05 0.99 0.91 0.78 2005-06 0.96 0.88 0.77
Number of Girls per 100 Boys
Number of Girls per 100 Boys in Classes Years I-V VI-VIII IX-XII
2001-02 93 74 65 2002-03 96 88 73 2003-04 96 90 70 2004-05 95 86 72 2005-06 94 83 72

E.115
B. Tertiary Education:
Number of Institutions: (Figures in number) Institutions/Universities 2001-02 2002-03 2003-04 2004-05 2005-06 Universities 14 14 14 16 16 Deemed to be Universities 1 1 1 2 2 Instt. of National Importance 2 2 2 2 2 Research Institutes 11 11 11 11 11 Colleges for General Education 354 354 354 374 374 Engg., Tech & Arch. Collages 43 43 43 54 60 Medical Colleges (Allo./ Ayur./ Homeo/ Unani)
19 19 19 19 68
Enrolment (Figures in number)
Enrolment during the year Courses 2001-02 2002-03 2003-04 2004-05 2005-06
Ph.D/D.Sc./D.Phill. 350 2210 612 398 398 M.A. 19819 36400 36400 48366 48366 M.Sc. 6428 13977 13977 18958 18958 M.Com. 3404 6441 6441 7090 7090 B.A,/B.A. (Hons) 325984 322643 345297 337630 337630 B.Sc./B.Sc.(Hons.) 104079 105785 105785 100027 100027 B.Com./B.Com(Hons.) 227039 128208 128208 107951 107951 B.E./B.Sc.(Engg/B.Arch.) 8248 43498 43498 48686 54619 Medicine, Dentistry, Nursing, Pharmacy, Ayurvedic & Unani etc.
3770 3957 3957 3957 3957
B.Ed. 7758 8288 8288 8605 8605 Open University - - - - 16246 Polytechnic 18540 Others 7018 22654 6441 64841 64841 Total 713897 694061 698904 746509 787228 C: Expenditure on Education: Year Gross State
Domestic Product (GSDP)
Expenditure on Education
Expenditure on Education as percentage of GSDP
2001-02 157136 5682.02 3.62 2002-03 168047 4673.03 2.78 2003-04 189099 4769.38 2.52 2004-05 208578 5184.63 2.49 2005-06 236044 5863.30 2.48

E.116
D: District-wise Statistics- 2005-06 (Fig. in numbers)
No. of Schools Enrolment Teachers S.
No. District
Name PPS PS MS
HS/H
SS/
INTE
RMED
IATE
I-V VI-VIII IX-XII PPS/PS
MS HS/H
SS/
INTE
RMED
IATE
1 2 3 4 5 6 7 8 9 10 12 1 Bankura 0 3462 45 428 397716 152620 97628 9294 689 5606 2 Barrackpore 0 0 27 387 58074 138830 97645 0 168 9419 3 Birbhum 0 2373 49 367 392860 141693 77435 7894 467 4643 4 Burdwan 0 3974 74 823 714760 292465 160761 14794 542 14747 5 Calcutta 0 1445 60 665 525476 252768 298328 5536 472 10684 6 Cooch Behar 0 1800 51 237 357379 141610 72496 5953 468 3270
7 Dakshin Dinajpur 0 1182 6 162 232164 65314 33472 3944 137 2666
8 Darjeeling 0 775 43 90 155004 45842 32483 2616 361 1121 9 Hooghly 0 2965 59 614 489706 225053 234677 9768 497 8961 10 Howrah 0 2129 48 521 409877 201612 110497 8270 235 7403 11 Jalpaiguri 0 2032 36 276 444391 160766 89445 7067 369 3794 12 Malda 0 1886 39 296 481332 119744 59259 6451 320 3562 13 Murshidabad 0 3166 61 457 602128 209285 231078 6077 647 5807 14 Nadia 0 2644 64 407 557409 241921 170492 8175 734 6457
15 North 24 - Parganas 0 3758 68 516 677062 249258 172415 12042 468 10037
16 Midnapore Paschim 0 4687 123 654 557351 250603 149345 11433 1223 9101
17 Midnapore Purba 0 3219 133 563 490087 228628 158584 9607 1096 7692
18 Purulia 0 2967 72 273 348330 100317 58900 6362 436 3764 19 Siliguri 0 399 17 61 72791 35394 23335 827 111 1057
20 South 24 - Parganas 0 3670 113 686 824430 283431 159488 8900 1072 8379
21 Uttar Dinajpur 0 1453 41 157 361746 87065 47071 4754 383 2248
Total 0 49986 1229 8640 9150073 3624219 2534834 149764 10895 130418 PPS – Pre-Primary Schools PS – Primary Schools MS – Middle Schools HS/HSS/Intermediate - High School/ Hr. Secondary Schools/ Intermediate Schools
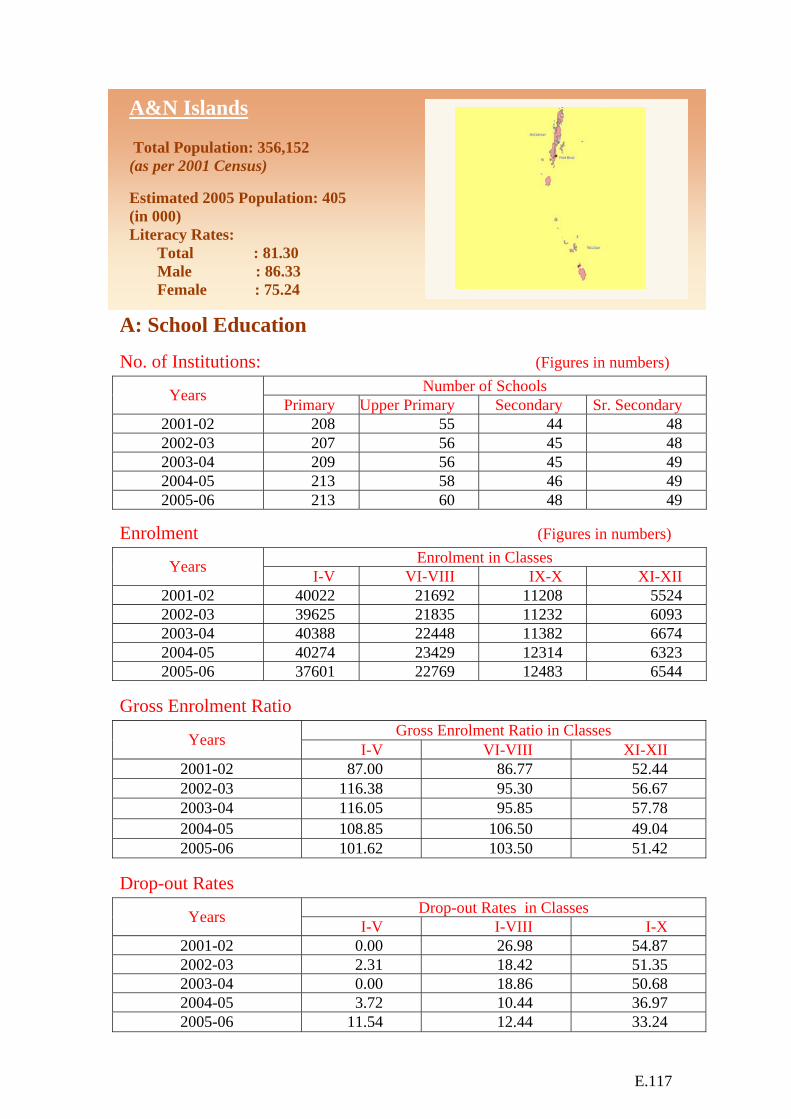
E.117
A&N Islands Total Population: 356,152 (as per 2001 Census) Estimated 2005 Population: 405 (in 000) Literacy Rates: Total : 81.30 Male : 86.33 Female : 75.24
A: School Education
No. of Institutions: (Figures in numbers) Number of Schools Years Primary Upper Primary Secondary Sr. Secondary
2001-02 208 55 44 48 2002-03 207 56 45 48 2003-04 209 56 45 49 2004-05 213 58 46 49 2005-06 213 60 48 49
Enrolment (Figures in numbers) Enrolment in Classes Years I-V VI-VIII IX-X XI-XII
2001-02 40022 21692 11208 5524 2002-03 39625 21835 11232 6093 2003-04 40388 22448 11382 6674 2004-05 40274 23429 12314 6323 2005-06 37601 22769 12483 6544
Gross Enrolment Ratio Gross Enrolment Ratio in Classes Years I-V VI-VIII XI-XII
2001-02 87.00 86.77 52.44 2002-03 116.38 95.30 56.67 2003-04 116.05 95.85 57.78 2004-05 108.85 106.50 49.04 2005-06 101.62 103.50 51.42
Drop-out Rates Drop-out Rates in Classes Years I-V I-VIII I-X
2001-02 0.00 26.98 54.87 2002-03 2.31 18.42 51.35 2003-04 0.00 18.86 50.68 2004-05 3.72 10.44 36.97 2005-06 11.54 12.44 33.24

E.118
No. of Teachers (Fig. in numbers)
Number of Teachers in Years
Primary Schools
Upper Primary Schools
Secondary Schools
Sr. Secondary Schools
2001-02 900 738 896 1938 2002-03 788 723 888 1905 2003-04 956 737 892 1852 2004-05 954 723 959 1882 2005-06 891 726 950 1742
Pupil Teacher Ratio
Pupil Teacher Ratio in Years
Primary Schools
Upper Primary Schools
Secondary Schools
Sr. Secondary Schools
2001-02 20 18 18 19 2002-03 17 17 18 19 2003-04 19 19 18 21 2004-05 20 18 19 21 2005-06 19 17 19 22
Gender Parity Index
Gender Parity Index in Classes Years I-V VI-VIII IX-XII
2001-02 1.00 0.97 1.09 2002-03 0.95 0.93 1.06 2003-04 0.95 0.91 1.09 2004-05 0.98 1.06 1.05 2005-06 1.00 1.07 0.99
Number of Girls per 100 Boys
Number of Girls per 100 Boys in Classes Years I-V VI-VIII IX-XII
2001-02 91 90 94 2002-03 92 89 95 2003-04 92 88 99 2004-05 93 88 95
2005-06 95 89 94
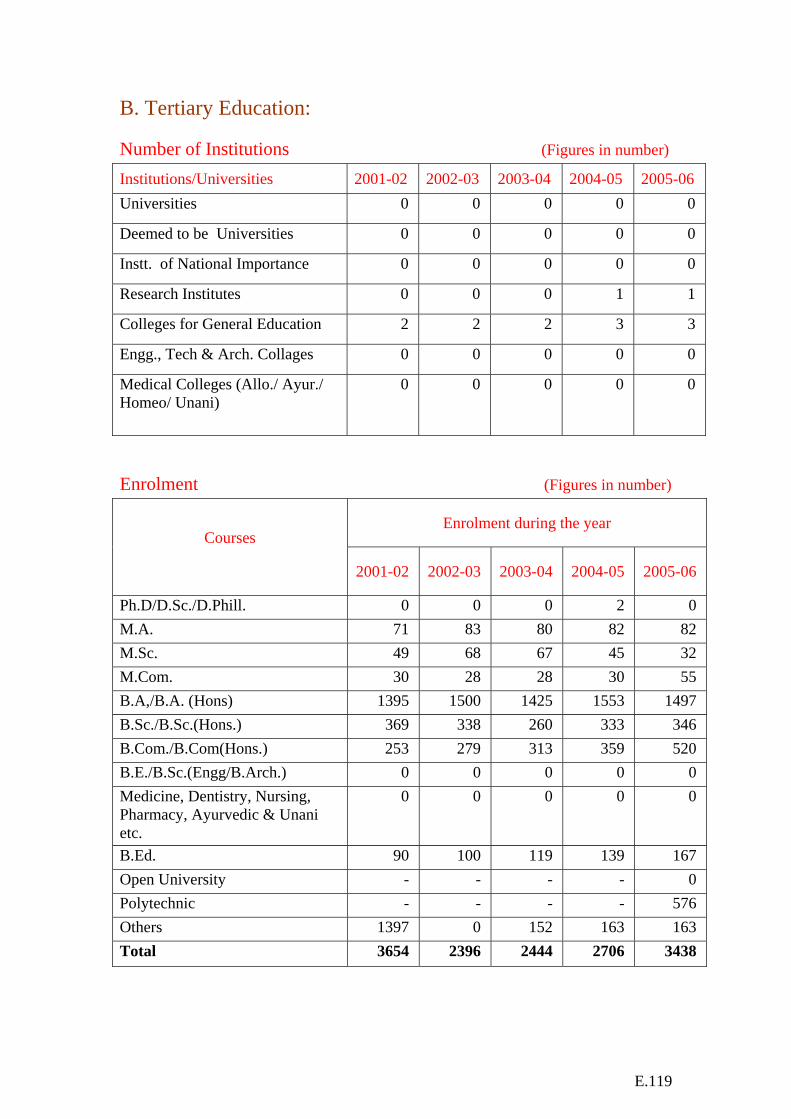
E.119
B. Tertiary Education: Number of Institutions (Figures in number)
Institutions/Universities 2001-02 2002-03 2003-04 2004-05 2005-06 Universities 0 0 0 0 0
Deemed to be Universities 0 0 0 0 0
Instt. of National Importance 0 0 0 0 0
Research Institutes 0 0 0 1 1
Colleges for General Education 2 2 2 3 3
Engg., Tech & Arch. Collages 0 0 0 0 0
Medical Colleges (Allo./ Ayur./ Homeo/ Unani)
0 0 0 0 0
Enrolment (Figures in number)
Enrolment during the year Courses
2001-02 2002-03 2003-04 2004-05 2005-06
Ph.D/D.Sc./D.Phill. 0 0 0 2 0 M.A. 71 83 80 82 82 M.Sc. 49 68 67 45 32 M.Com. 30 28 28 30 55 B.A,/B.A. (Hons) 1395 1500 1425 1553 1497 B.Sc./B.Sc.(Hons.) 369 338 260 333 346 B.Com./B.Com(Hons.) 253 279 313 359 520 B.E./B.Sc.(Engg/B.Arch.) 0 0 0 0 0 Medicine, Dentistry, Nursing, Pharmacy, Ayurvedic & Unani etc.
0 0 0 0 0
B.Ed. 90 100 119 139 167 Open University - - - - 0 Polytechnic - - - - 576 Others 1397 0 152 163 163 Total 3654 2396 2444 2706 3438

E.120
C. District-wise Statistics-(2005-06) (Figures in number)
No. of Schools Enrolment Teachers
S.No
.
District Name
PPS PS MS
HS/H
SS/
INTE
RMED
ATE I-V VI-VIII IX-XII PPS/
PS MS
HS/H
SS/
INTE
RMED
IATE
1 2 3 4 5 6 7 8 9 10 11 12
1 Andamans 23 173 49 79 34294 20939 17202 827 652 2476
2 Nicobars 1 40 11 18 3307 1830 1825 64 74 216
Total 24 213 60 97 37601 22769 19027 891 726 2692 PPS – Pre-Primary Schools PS – Primary Schools MS – Middle Schools HS/HSS/Intermediate - High School/ Hr. Secondary Schools/ Intermediate Schools
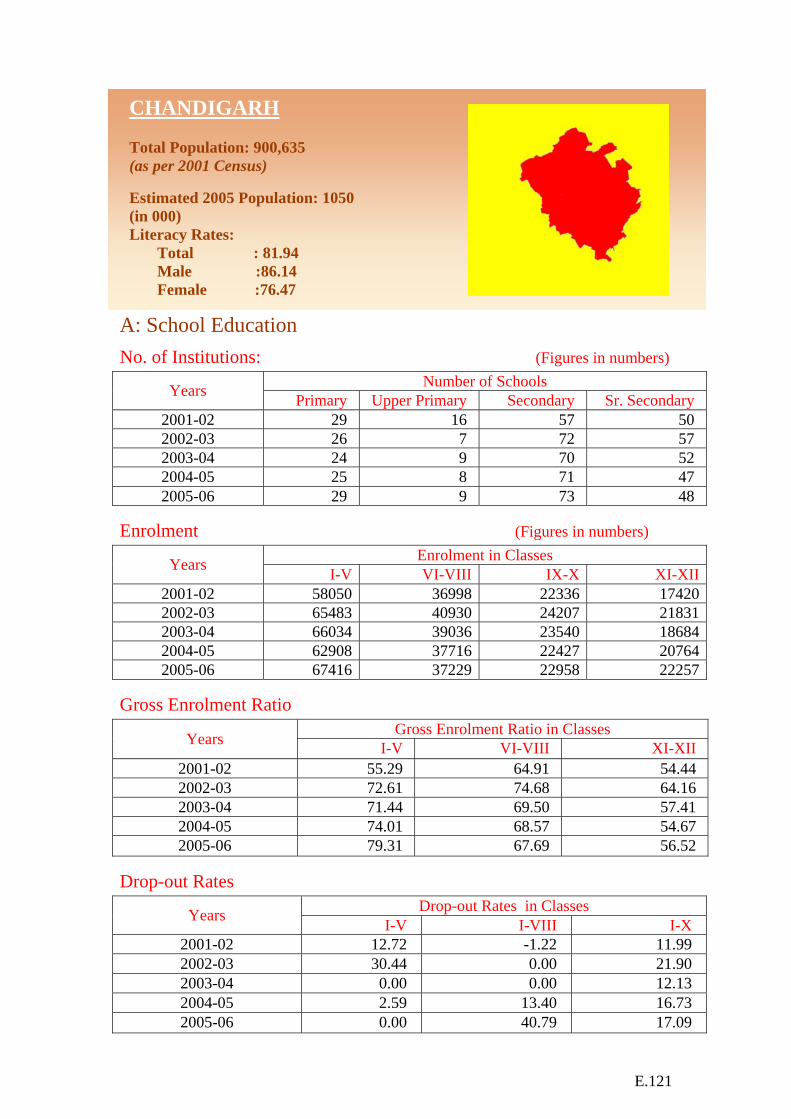
E.121
CHANDIGARH
Total Population: 900,635 (as per 2001 Census) Estimated 2005 Population: 1050 (in 000) Literacy Rates: Total : 81.94 Male :86.14 Female :76.47
A: School Education
No. of Institutions: (Figures in numbers) Number of Schools Years Primary Upper Primary Secondary Sr. Secondary
2001-02 29 16 57 50 2002-03 26 7 72 57 2003-04 24 9 70 52 2004-05 25 8 71 47 2005-06 29 9 73 48
Enrolment (Figures in numbers) Enrolment in Classes Years I-V VI-VIII IX-X XI-XII
2001-02 58050 36998 22336 174202002-03 65483 40930 24207 218312003-04 66034 39036 23540 186842004-05 62908 37716 22427 207642005-06 67416 37229 22958 22257
Gross Enrolment Ratio Gross Enrolment Ratio in Classes Years I-V VI-VIII XI-XII
2001-02 55.29 64.91 54.44 2002-03 72.61 74.68 64.16 2003-04 71.44 69.50 57.41 2004-05 74.01 68.57 54.67 2005-06 79.31 67.69 56.52
Drop-out Rates Drop-out Rates in Classes Years I-V I-VIII I-X
2001-02 12.72 -1.22 11.99 2002-03 30.44 0.00 21.90 2003-04 0.00 0.00 12.13 2004-05 2.59 13.40 16.73 2005-06 0.00 40.79 17.09
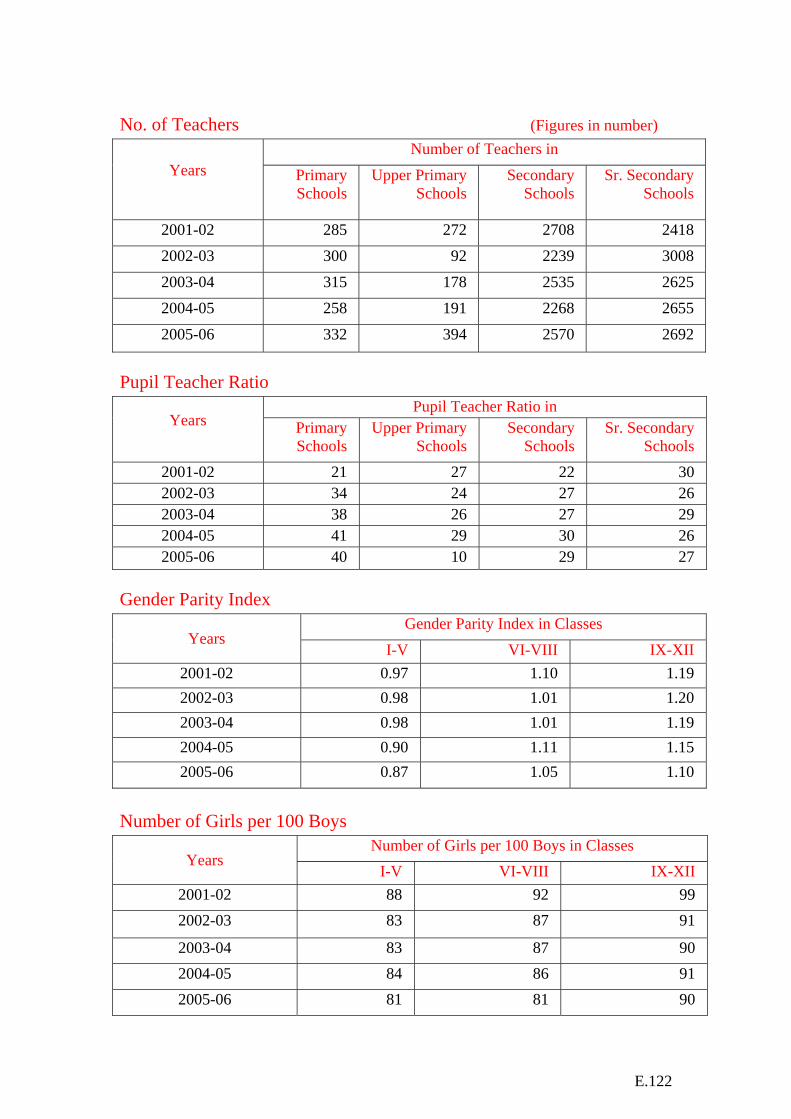
E.122
No. of Teachers (Figures in number)
Number of Teachers in Years
Primary Schools
Upper Primary Schools
Secondary Schools
Sr. Secondary Schools
2001-02 285 272 2708 2418 2002-03 300 92 2239 3008 2003-04 315 178 2535 2625 2004-05 258 191 2268 2655 2005-06 332 394 2570 2692
Pupil Teacher Ratio
Pupil Teacher Ratio in Years
Primary Schools
Upper Primary Schools
Secondary Schools
Sr. Secondary Schools
2001-02 21 27 22 30 2002-03 34 24 27 26 2003-04 38 26 27 29 2004-05 41 29 30 26 2005-06 40 10 29 27
Gender Parity Index
Gender Parity Index in Classes Years
I-V VI-VIII IX-XII 2001-02 0.97 1.10 1.19 2002-03 0.98 1.01 1.20 2003-04 0.98 1.01 1.19 2004-05 0.90 1.11 1.15 2005-06 0.87 1.05 1.10
Number of Girls per 100 Boys
Number of Girls per 100 Boys in Classes Years
I-V VI-VIII IX-XII 2001-02 88 92 99 2002-03 83 87 91
2003-04 83 87 90 2004-05 84 86 91 2005-06 81 81 90
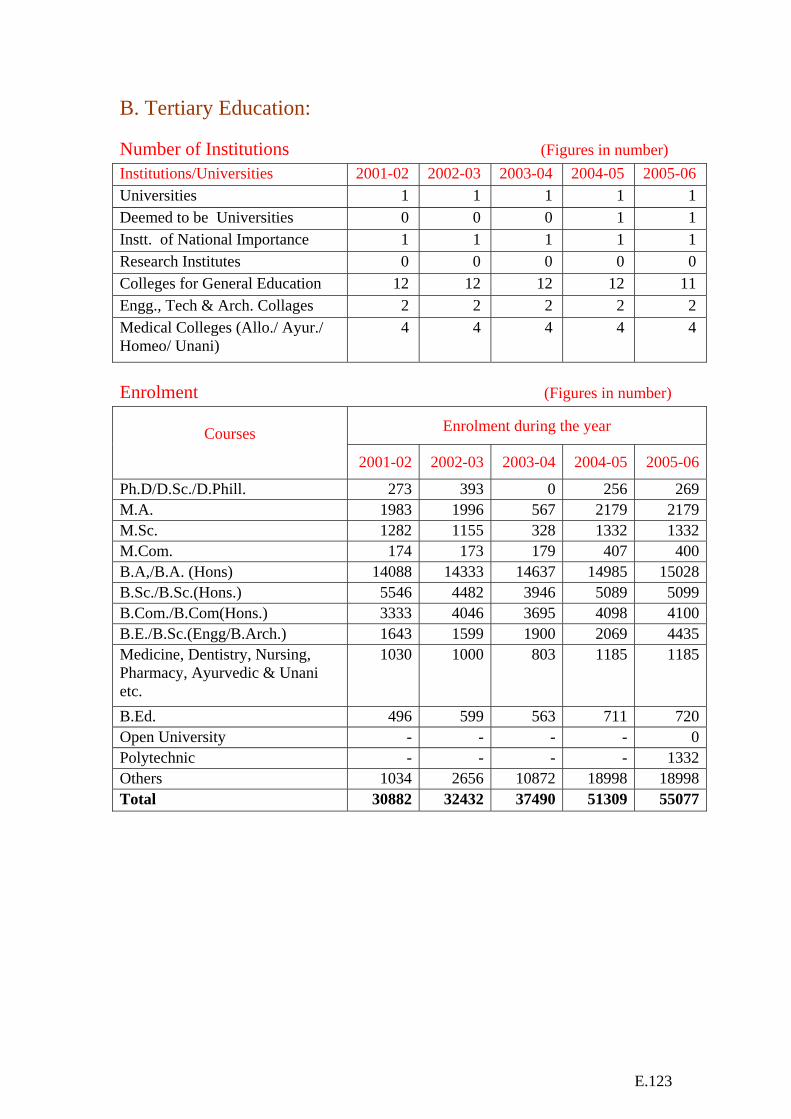
E.123
B. Tertiary Education: Number of Institutions (Figures in number) Institutions/Universities 2001-02 2002-03 2003-04 2004-05 2005-06 Universities 1 1 1 1 1 Deemed to be Universities 0 0 0 1 1 Instt. of National Importance 1 1 1 1 1 Research Institutes 0 0 0 0 0 Colleges for General Education 12 12 12 12 11 Engg., Tech & Arch. Collages 2 2 2 2 2 Medical Colleges (Allo./ Ayur./ Homeo/ Unani)
4 4 4 4 4
Enrolment (Figures in number)
Enrolment during the year Courses 2001-02 2002-03 2003-04 2004-05 2005-06
Ph.D/D.Sc./D.Phill. 273 393 0 256 269M.A. 1983 1996 567 2179 2179M.Sc. 1282 1155 328 1332 1332M.Com. 174 173 179 407 400B.A,/B.A. (Hons) 14088 14333 14637 14985 15028B.Sc./B.Sc.(Hons.) 5546 4482 3946 5089 5099B.Com./B.Com(Hons.) 3333 4046 3695 4098 4100B.E./B.Sc.(Engg/B.Arch.) 1643 1599 1900 2069 4435Medicine, Dentistry, Nursing, Pharmacy, Ayurvedic & Unani etc.
1030 1000 803 1185 1185
B.Ed. 496 599 563 711 720Open University - - - - 0Polytechnic - - - - 1332Others 1034 2656 10872 18998 18998Total 30882 32432 37490 51309 55077
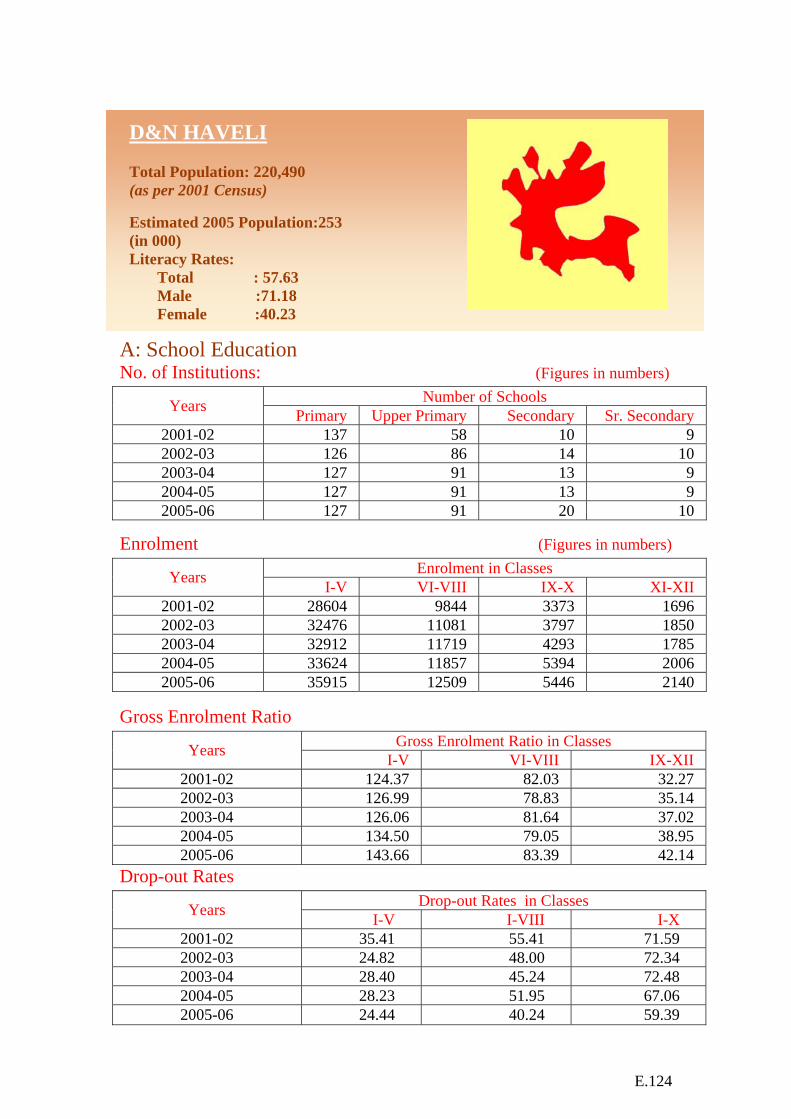
E.124
D&N HAVELI
Total Population: 220,490 (as per 2001 Census) Estimated 2005 Population:253 (in 000) Literacy Rates: Total : 57.63 Male :71.18 Female :40.23
A: School Education No. of Institutions: (Figures in numbers)
Number of Schools Years Primary Upper Primary Secondary Sr. Secondary 2001-02 137 58 10 9 2002-03 126 86 14 10 2003-04 127 91 13 9 2004-05 127 91 13 9 2005-06 127 91 20 10
Enrolment (Figures in numbers) Enrolment in Classes Years I-V VI-VIII IX-X XI-XII
2001-02 28604 9844 3373 1696 2002-03 32476 11081 3797 1850 2003-04 32912 11719 4293 1785 2004-05 33624 11857 5394 2006 2005-06 35915 12509 5446 2140
Gross Enrolment Ratio Gross Enrolment Ratio in Classes Years I-V VI-VIII IX-XII
2001-02 124.37 82.03 32.27 2002-03 126.99 78.83 35.14 2003-04 126.06 81.64 37.02 2004-05 134.50 79.05 38.95 2005-06 143.66 83.39 42.14
Drop-out Rates Drop-out Rates in Classes Years I-V I-VIII I-X
2001-02 35.41 55.41 71.59 2002-03 24.82 48.00 72.34 2003-04 28.40 45.24 72.48 2004-05 28.23 51.95 67.06 2005-06 24.44 40.24 59.39

E.125
No. of Teachers (Fig. In numbers) Number of Teachers in
Years
Primary Schools
Upper Primary Schools
Secondary Schools
Sr. Secondary Schools
2001-02 213 521 59 222 2002-03 225 612 145 265
2003-04 678 213 158 165 2004-05 541 278 225 71 2005-06 553 288 241 75
Pupil Teacher Ratio Pupil Teacher Ratio in
Years
Primary Schools
Upper Primary Schools
Secondary Schools
Sr. Secondary Schools
2001-02 49 46 30 32 2002-03 40 44 34 32 2003-04 49 55 27 11 2004-05 62 43 24 28 2005-06 55 48 39 29
Gender Parity Index Gender Parity Index in Classes
Years I-V VI-VIII IX-XII
2001-02 0.72 0.62 0.66 2002-03 0.86 0.66 0.80 2003-04 0.88 0.69 0.81 2004-05 0.93 0.74 0.73 2005-06 0.96 0.75 0.79
Number of Girls per 100 Boys
Number of Girls per 100 Boys in Classes Years I-V VI-VIII IX-XII
2001-02 79 62 66 2002-03 84 61 69 2003-04 85 63 68 2004-05 86 65 65 2005-06 89 66 63

E.126
DAMAN & DIU
Total Population: 158,204 (as per 2001 Census) Estimated 2005 Population: 205 (in 000) Literacy Rates: Total : 78.18 Male : 86.76 Female : 65.61
A: School Education
No. of Institutions: (Figures in numbers) Number of Schools Years Primary Upper Primary Secondary Sr. Secondary
2001-02 53 22 20 6 2002-03 50 24 20 6 2003-04 53 24 22 6 2004-05 53 24 22 6 2005-06 53 24 22 6
Enrolment (Figures in numbers) Enrolment in Classes Years I-V VI-VIII IX-X XI-XII
2001-02 15877 7777 3444 2303 2002-03 16258 8374 3507 2065 2003-04 16222 8120 3735 1632 2004-05 16321 8160 4493 1766 2005-06 16204 8778 4336 2054
Gross Enrolment Ratio Gross Enrolment Ratio in Classes Years I-V VI-VIII IX-XII
2001-02 93.39 86.41 49.99 2002-03 114.00 102.81 47.02 2003-04 111.35 97.62 44.24 2004-05 136.01 116.57 69.54 2005-06 135.03 125.40 79.88
Drop-out Rates Drop-out Rates in Classes Years I-V I-VIII I-X
2001-02 0.00 16.68 36.55 2002-03 0.00 14.83 45.24 2003-04 0.00 17.36 50.45 2004-05 0.84 17.03 43.43 2005-06 2.56 7.34 34.87
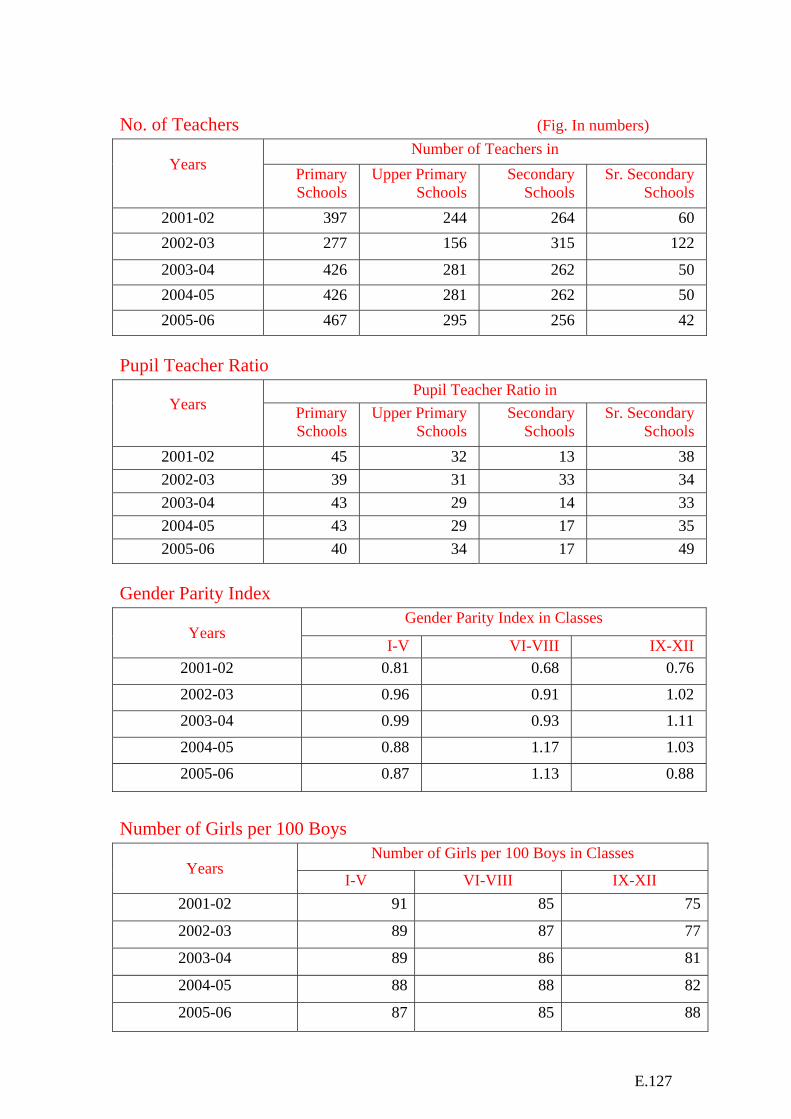
E.127
No. of Teachers (Fig. In numbers)
Number of Teachers in Years
Primary Schools
Upper Primary Schools
Secondary Schools
Sr. Secondary Schools
2001-02 397 244 264 60 2002-03 277 156 315 122
2003-04 426 281 262 50 2004-05 426 281 262 50 2005-06 467 295 256 42
Pupil Teacher Ratio
Pupil Teacher Ratio in Years
Primary Schools
Upper Primary Schools
Secondary Schools
Sr. Secondary Schools
2001-02 45 32 13 38 2002-03 39 31 33 34 2003-04 43 29 14 33 2004-05 43 29 17 35 2005-06 40 34 17 49
Gender Parity Index
Gender Parity Index in Classes Years
I-V VI-VIII IX-XII 2001-02 0.81 0.68 0.76
2002-03 0.96 0.91 1.02
2003-04 0.99 0.93 1.11
2004-05 0.88 1.17 1.03
2005-06 0.87 1.13 0.88
Number of Girls per 100 Boys
Number of Girls per 100 Boys in Classes Years
I-V VI-VIII IX-XII 2001-02 91 85 75
2002-03 89 87 77
2003-04 89 86 81
2004-05 88 88 82
2005-06 87 85 88
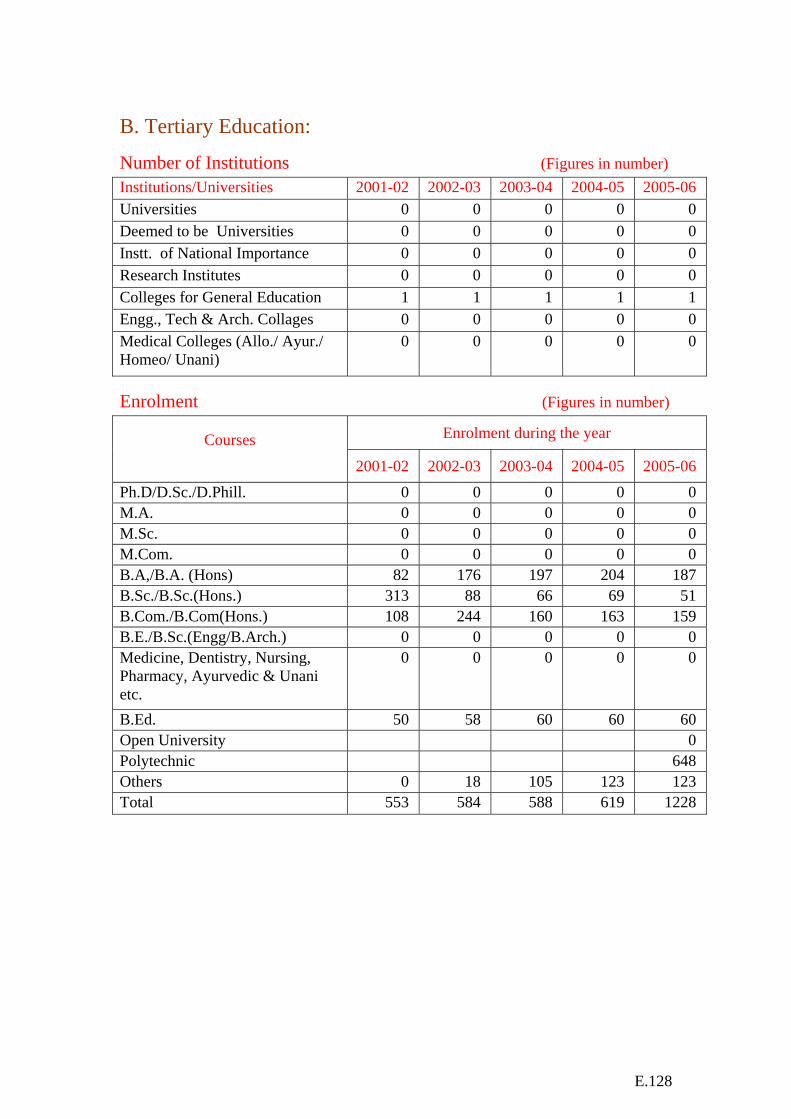
E.128
B. Tertiary Education:
Number of Institutions (Figures in number) Institutions/Universities 2001-02 2002-03 2003-04 2004-05 2005-06 Universities 0 0 0 0 0 Deemed to be Universities 0 0 0 0 0 Instt. of National Importance 0 0 0 0 0 Research Institutes 0 0 0 0 0 Colleges for General Education 1 1 1 1 1 Engg., Tech & Arch. Collages 0 0 0 0 0 Medical Colleges (Allo./ Ayur./ Homeo/ Unani)
0 0 0 0 0
Enrolment (Figures in number)
Enrolment during the year Courses 2001-02 2002-03 2003-04 2004-05 2005-06
Ph.D/D.Sc./D.Phill. 0 0 0 0 0 M.A. 0 0 0 0 0 M.Sc. 0 0 0 0 0 M.Com. 0 0 0 0 0 B.A,/B.A. (Hons) 82 176 197 204 187 B.Sc./B.Sc.(Hons.) 313 88 66 69 51 B.Com./B.Com(Hons.) 108 244 160 163 159 B.E./B.Sc.(Engg/B.Arch.) 0 0 0 0 0 Medicine, Dentistry, Nursing, Pharmacy, Ayurvedic & Unani etc.
0 0 0 0 0
B.Ed. 50 58 60 60 60 Open University 0 Polytechnic 648 Others 0 18 105 123 123 Total 553 584 588 619 1228
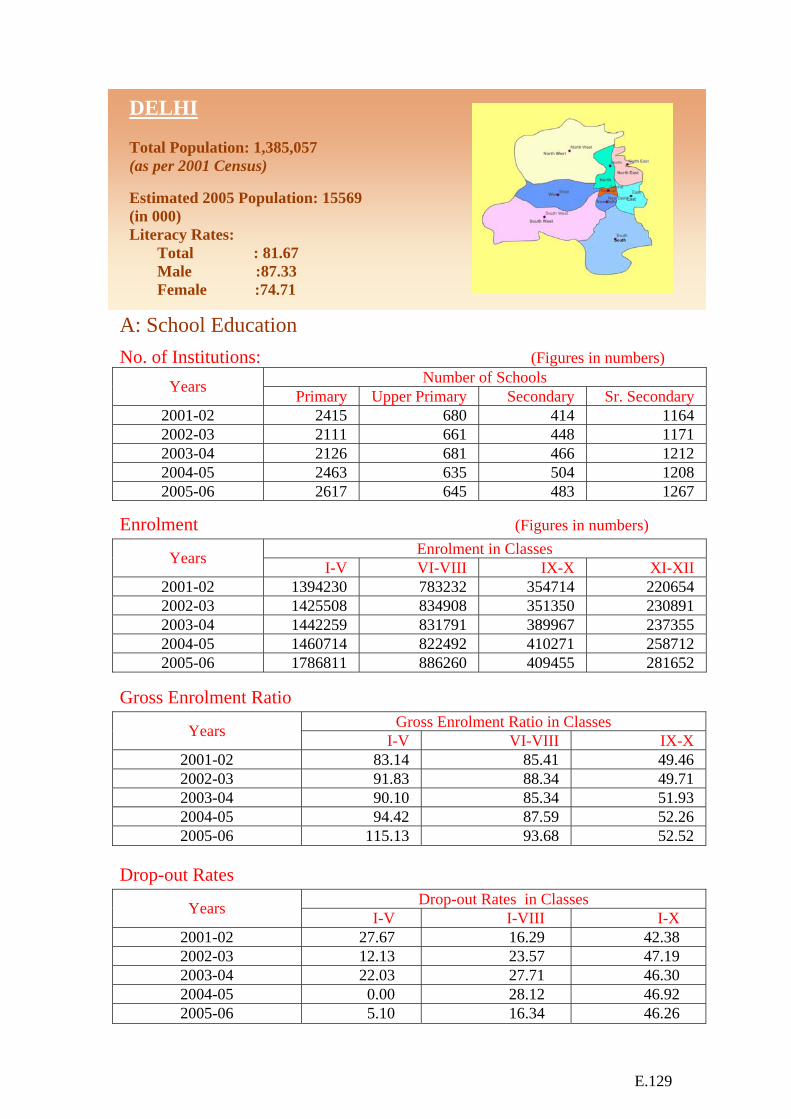
E.129
DELHI
Total Population: 1,385,057 (as per 2001 Census) Estimated 2005 Population: 15569 (in 000) Literacy Rates: Total : 81.67 Male :87.33 Female :74.71
A: School Education
No. of Institutions: (Figures in numbers) Number of Schools Years Primary Upper Primary Secondary Sr. Secondary
2001-02 2415 680 414 1164 2002-03 2111 661 448 1171 2003-04 2126 681 466 1212 2004-05 2463 635 504 1208 2005-06 2617 645 483 1267
Enrolment (Figures in numbers) Enrolment in Classes Years I-V VI-VIII IX-X XI-XII
2001-02 1394230 783232 354714 220654 2002-03 1425508 834908 351350 230891 2003-04 1442259 831791 389967 237355 2004-05 1460714 822492 410271 258712 2005-06 1786811 886260 409455 281652
Gross Enrolment Ratio Gross Enrolment Ratio in Classes Years I-V VI-VIII IX-X
2001-02 83.14 85.41 49.46 2002-03 91.83 88.34 49.71 2003-04 90.10 85.34 51.93 2004-05 94.42 87.59 52.26 2005-06 115.13 93.68 52.52
Drop-out Rates Drop-out Rates in Classes Years I-V I-VIII I-X
2001-02 27.67 16.29 42.38 2002-03 12.13 23.57 47.19 2003-04 22.03 27.71 46.30 2004-05 0.00 28.12 46.92 2005-06 5.10 16.34 46.26
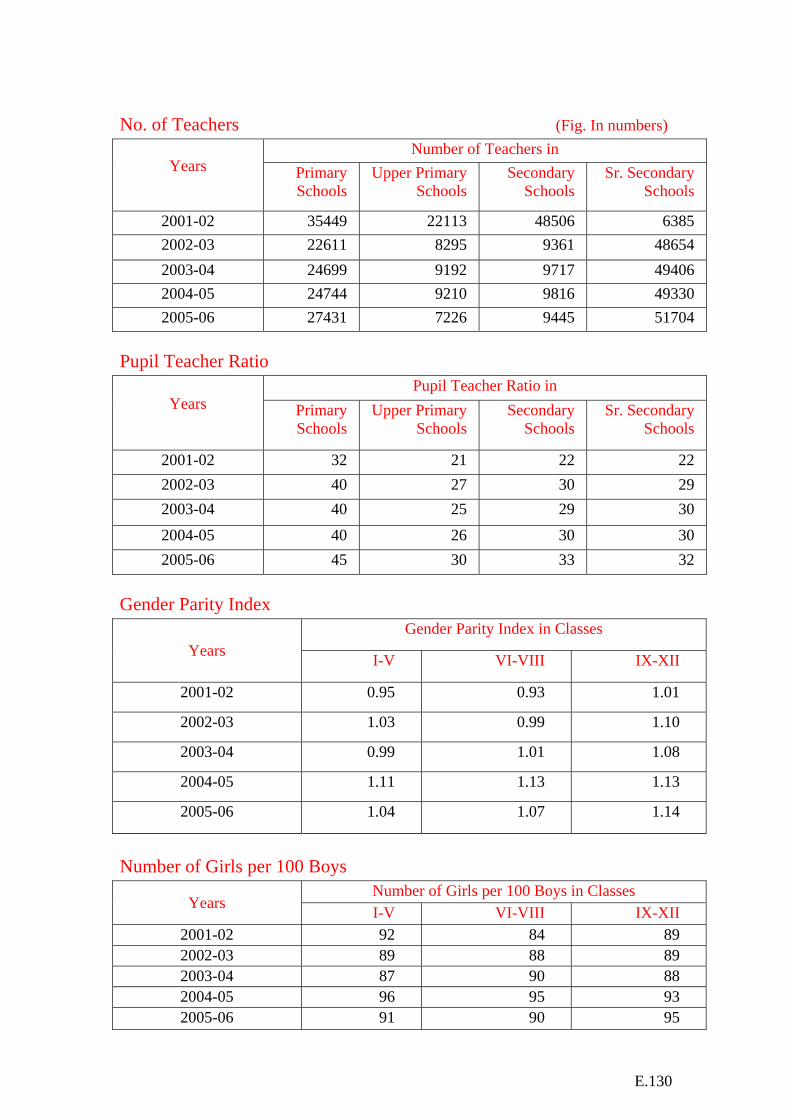
E.130
No. of Teachers (Fig. In numbers)
Number of Teachers in Years
Primary Schools
Upper Primary Schools
Secondary Schools
Sr. Secondary Schools
2001-02 35449 22113 48506 6385 2002-03 22611 8295 9361 48654 2003-04 24699 9192 9717 49406 2004-05 24744 9210 9816 49330 2005-06 27431 7226 9445 51704
Pupil Teacher Ratio
Pupil Teacher Ratio in Years
Primary Schools
Upper Primary Schools
Secondary Schools
Sr. Secondary Schools
2001-02 32 21 22 22 2002-03 40 27 30 29 2003-04 40 25 29 30 2004-05 40 26 30 30 2005-06 45 30 33 32
Gender Parity Index
Gender Parity Index in Classes Years I-V VI-VIII IX-XII
2001-02 0.95 0.93 1.01
2002-03 1.03 0.99 1.10
2003-04 0.99 1.01 1.08
2004-05 1.11 1.13 1.13
2005-06 1.04 1.07 1.14
Number of Girls per 100 Boys
Number of Girls per 100 Boys in Classes Years I-V VI-VIII IX-XII
2001-02 92 84 89 2002-03 89 88 89 2003-04 87 90 88 2004-05 96 95 93 2005-06 91 90 95
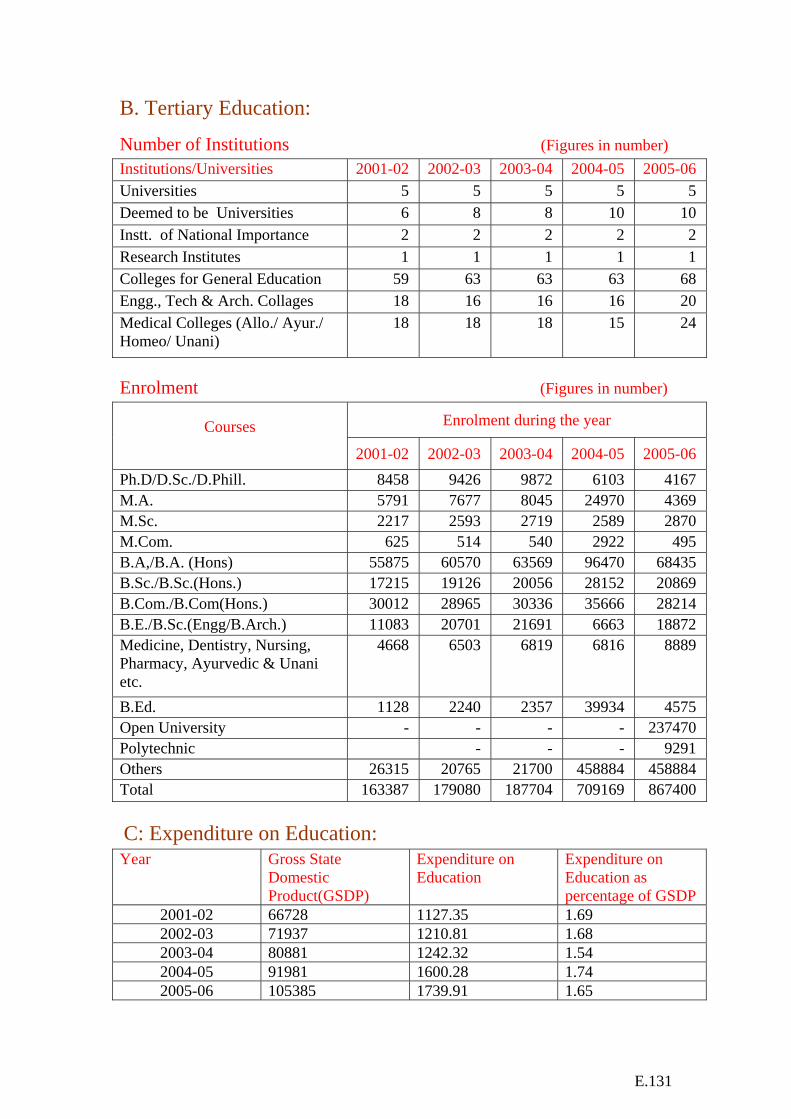
E.131
B. Tertiary Education:
Number of Institutions (Figures in number) Institutions/Universities 2001-02 2002-03 2003-04 2004-05 2005-06 Universities 5 5 5 5 5 Deemed to be Universities 6 8 8 10 10 Instt. of National Importance 2 2 2 2 2 Research Institutes 1 1 1 1 1 Colleges for General Education 59 63 63 63 68 Engg., Tech & Arch. Collages 18 16 16 16 20 Medical Colleges (Allo./ Ayur./ Homeo/ Unani)
18 18 18 15 24
Enrolment (Figures in number)
Enrolment during the year Courses 2001-02 2002-03 2003-04 2004-05 2005-06
Ph.D/D.Sc./D.Phill. 8458 9426 9872 6103 4167 M.A. 5791 7677 8045 24970 4369 M.Sc. 2217 2593 2719 2589 2870 M.Com. 625 514 540 2922 495 B.A,/B.A. (Hons) 55875 60570 63569 96470 68435 B.Sc./B.Sc.(Hons.) 17215 19126 20056 28152 20869 B.Com./B.Com(Hons.) 30012 28965 30336 35666 28214 B.E./B.Sc.(Engg/B.Arch.) 11083 20701 21691 6663 18872 Medicine, Dentistry, Nursing, Pharmacy, Ayurvedic & Unani etc.
4668 6503 6819 6816 8889
B.Ed. 1128 2240 2357 39934 4575 Open University - - - - 237470 Polytechnic - - - 9291 Others 26315 20765 21700 458884 458884 Total 163387 179080 187704 709169 867400 C: Expenditure on Education: Year Gross State
Domestic Product(GSDP)
Expenditure on Education
Expenditure on Education as percentage of GSDP
2001-02 66728 1127.35 1.69 2002-03 71937 1210.81 1.68 2003-04 80881 1242.32 1.54 2004-05 91981 1600.28 1.74 2005-06 105385 1739.91 1.65

E.132
LAKSHADWEEP
Total Population: 60,650 (as per 2001 Census) Estimated 2005 Population: 70 (in 000) Literacy Rates: Total : 86.66 Male : 92.53 Female : 80.47
A: School Education
No. of Institutions: (Figures in numbers) Number of Schools Years Primary Upper Primary Secondary Sr. Secondary
2001-02 20 3 9 4 2002-03 4 20 7 5 2003-04 20 4 9 4 2004-05 21 6 7 4 2005-06 21 5 4 8
Enrolment (Figures in numbers) Enrolment in Classes Years I-V VI-VIII IX-X XI-XII
2001-02 8002 4768 2336 804 2002-03 7353 4867 2555 961 2003-04 7161 4553 2594 1068 2004-05 7053 4110 2949 1191 2005-06 7474 4354 2705 1587
Gross Enrolment Ratio Gross Enrolment Ratio in Classes Years I-V VI-VIII IX-XII
2001-02 100.03 97.51 53.86 2002-03 110.99 105.44 63.40 2003-04 106.37 97.09 64.99 2004-05 58.78 58.71 46.00 2005-06 62.28 62.20 47.69
Drop-out Rates
Drop-out Rates in Classes Years I-V I-VIII I-X 2001-02 17.23 23.42 54.18 2002-03 3.03 4.48 24.13 2003-04 3.03 4.90 42.24 2004-05 7.62 16.41 18.88 2005-06 10.08 7.57 21.17
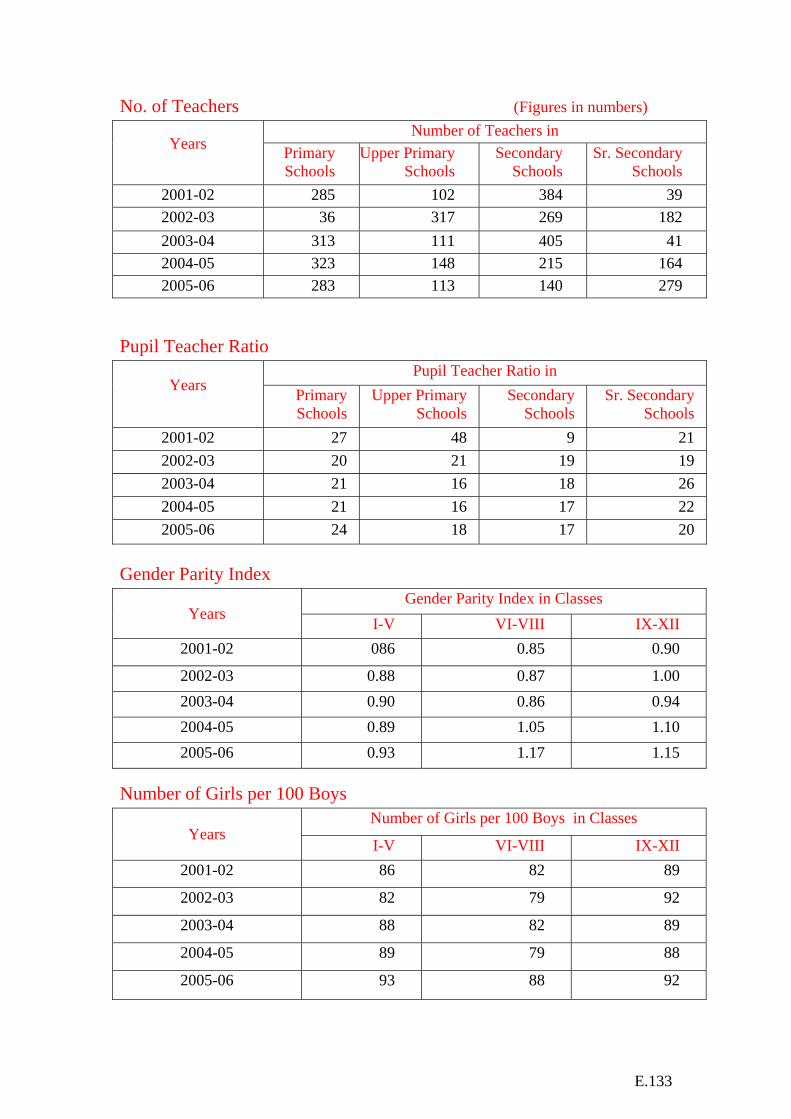
E.133
No. of Teachers (Figures in numbers) Number of Teachers in
Years Primary
Schools Upper Primary
Schools Secondary
Schools Sr. Secondary
Schools 2001-02 285 102 384 39 2002-03 36 317 269 182 2003-04 313 111 405 41 2004-05 323 148 215 164 2005-06 283 113 140 279
Pupil Teacher Ratio
Pupil Teacher Ratio in Years
Primary Schools
Upper Primary Schools
Secondary Schools
Sr. Secondary Schools
2001-02 27 48 9 21 2002-03 20 21 19 19 2003-04 21 16 18 26 2004-05 21 16 17 22 2005-06 24 18 17 20
Gender Parity Index
Gender Parity Index in Classes Years I-V VI-VIII IX-XII
2001-02 086 0.85 0.90
2002-03 0.88 0.87 1.00 2003-04 0.90 0.86 0.94 2004-05 0.89 1.05 1.10 2005-06 0.93 1.17 1.15
Number of Girls per 100 Boys Number of Girls per 100 Boys in Classes
Years I-V VI-VIII IX-XII
2001-02 86 82 89
2002-03 82 79 92
2003-04 88 82 89
2004-05 89 79 88
2005-06 93 88 92

E.134
PUDUCHERRY
Total Population: 974,345 (as per 2001 Census) Estimated 2005 Population: 1056
(in 000) Literacy Rates: Total : 81.24 Male : 88.62 Female : 73.90
A: School Education
No. of Institutions: (Figures in numbers) Number of Schools Years Primary Upper Primary Secondary Sr. Secondary
2001-02 319 132 129 68 2002-03 319 133 130 75 2003-04 329 125 138 77 2004-05 328 127 147 80 2005-06 327 119 152 89
Enrolment (Figures in numbers) Enrolment in Classes Years I-V VI-VIII IX-X XI-XII
2001-02 101348 66257 33575 16767 2002-03 97177 66712 35061 18695 2003-04 102021 67258 36943 20147 2004-05 103999 67096 38869 21250 2005-06 106069 66421 40240 22364
Gross Enrolment Ratio Gross Enrolment Ratio in Classes Years I-V VI-VIII IX-XII
2001-02 76.20 92.00 54.83 2002-03 116.17 120.27 70.68 2003-04 120.37 119.68 74.06 2004-05 131.64 108.22 76.10 2005-06 134.26 107.13 79.25
Drop-out Rates
Drop-out Rates in Classes Years I-V I-VIII I-X 2001-02 0.00 2.92 25.26 2002-03 0.00 0.00 21.69 2003-04 0.00 0.00 22.96 2004-05 0.00 0.00 16.89 2005-06 0.00 0.00 13.69

E.135
No. of Teachers (Figures in numbers)
Number of Teachers in Years
Primary Schools
Upper Primary Schools
Secondary Schools
Sr. Secondary Schools
2001-02 2356 1574 2346 2889 2002-03 1754 1593 2172 2643 2003-04 2876 1593 2444 3113 2004-05 2969 1622 2644 3161 2005-06 2853 1534 2748 3297
Pupil Teacher Ratio
Pupil Teacher Ratio in Years
Primary Schools
Upper Primary Schools
Secondary Schools
Sr. Secondary Schools
2001-02 25 23 27 28 2002-03 21 23 27 32 2003-04 24 22 27 29 2004-05 24 21 26 29 2005-06 26 20 25 30
Gender Parity Index Gender Parity Index in Classes
Years I-V VI-VIII IX-XII
2001-02 0.82 0.88 0.95 2002-03 0.98 0.96 1.02 2003-04 0.97 0.96 1.05 2004-05 0.87 0.92 0.99 2005-06 0.88 0.91 0.99.
Number of Girls per 100 Boys
Number of Girls per 100 Boys in Classes Years
I-V VI-VIII IX-XII 2001-02 91 93 98
2002-03 94 92 99
2003-04 93 92 101
2004-05 94 92 102
2005-06 95 91 102

E.136
B. Tertiary Education:
Number of Institutions (Figures in number) Institutions/Universities 2001-02 2002-03 2003-04 2004-05 2005-06 Universities 1 1 1 1 1 Deemed to be Universities 0 0 0 0 0 Instt. of National Importance 0 0 0 0 0 Research Institutes 0 0 0 0 0 Colleges for General Education 11 11 11 11 17 Engg., Tech & Arch. Collages 5 5 5 5 5 Medical Colleges (Allo./ Ayur./ Homeo/ Unani)
5 6 0 6 9
Enrolment (Figures in number)
Enrolment during the year Courses 2001-02 2002-03 2003-04 2004-05 2005-06
Ph.D/D.Sc./D.Phill. 384 282 284 299 474 M.A. 664 866 880 927 728 M.Sc. 595 785 795 837 725 M.Com. 140 220 225 236 199 B.A,/B.A. (Hons) 2925 3096 3181 3355 5496 B.Sc./B.Sc.(Hons.) 2485 2820 2894 3051 3145 B.Com./B.Com(Hons.) 1137 1662 1703 1796 2758 B.E./B.Sc.(Engg/B.Arch.) 1168 4390 4356 4577 7821 Medicine, Dentistry, Nursing, Pharmacy, Ayurvedic & Unani etc.
1192 1600 1610 1693 2742
B.Ed. 1168 1167 1202 1269 2147 Open University - - - - 0 Polytechnic - - - - 2760 Others 0 2036 2052 2159 2159 Total 11858 18924 19182 20199 31154


![Act 46 of 2013 - dti2 No. 37271 GOVERNMENT GAZETTE, 27 January 2014 Act No. 46 of 2013 Broad-Based Black Economic Empowerment Amendment Act, 2013 GENERAL EXPLANATORY NOTE: []Words](https://static.fdocuments.in/doc/165x107/5e7bf66b2469b864f574c07b/act-46-of-2013-2-no-37271-government-gazette-27-january-2014-act-no-46-of-2013.jpg)


