State Pre-K: Effectiveness, Access, and Support for Quality Milagros Nores, PhD Steve Barnett, PhD.
14
State Pre-K: Effectiveness, Access, and Support for Quality Milagros Nores, PhD Steve Barnett, PhD
-
Upload
dulce-mott -
Category
Documents
-
view
214 -
download
0
Transcript of State Pre-K: Effectiveness, Access, and Support for Quality Milagros Nores, PhD Steve Barnett, PhD.

State Pre-K: Effectiveness, Access, and Support for Quality
Milagros Nores, PhDSteve Barnett, PhD

Why invest in Pre-K?
First 5 years are a time of rapid brain development
Early experience substantially influences development
Pre-K has been demonstrated to produce short- and
long-term positive impacts
Later compensatory efforts face reduced plasticity and
higher costs
Early failure & success are self-reinforcing

Potential Gains from Investments in Early Education
Educational Success and Economic Productivity Achievement test scores Special education and grade repetition High school graduation Behavior problems, delinquency, and crime Employment, earnings, and welfare dependency Smoking, drug use, depression Decreased Costs to Government Schooling costs Social services costs Crime costs Health care costs (teen pregnancy and smoking)

ECD programs 0-5 in the US produce long-term gains: 123 studies since 1960
Treatment End Ages 5-10 Age >100
0.1
0.2
0.3
0.4
0.5
0.6
0.7
0.8
0.9
1
All Designs HQ Designs HQ Programs
Age at Follow-Up
Eff
ec
ts (
sd
)
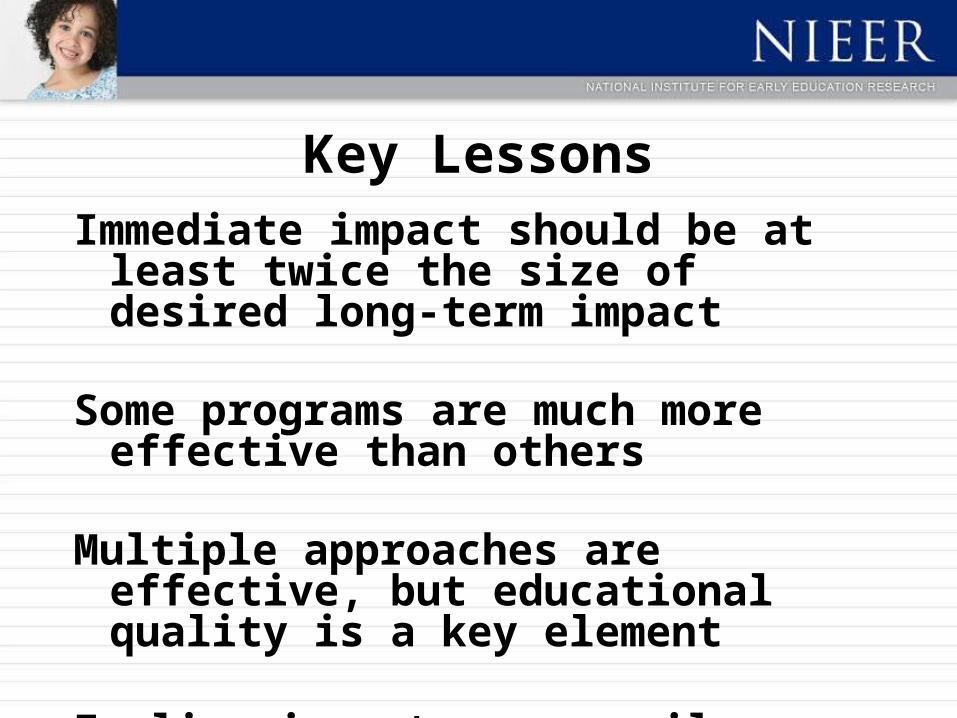
Key Lessons Immediate impact should be at least twice
the size of desired long-term impact
Some programs are much more effective than others
Multiple approaches are effective, but educational quality is a key element
Earlier is not necessarily higher payoff
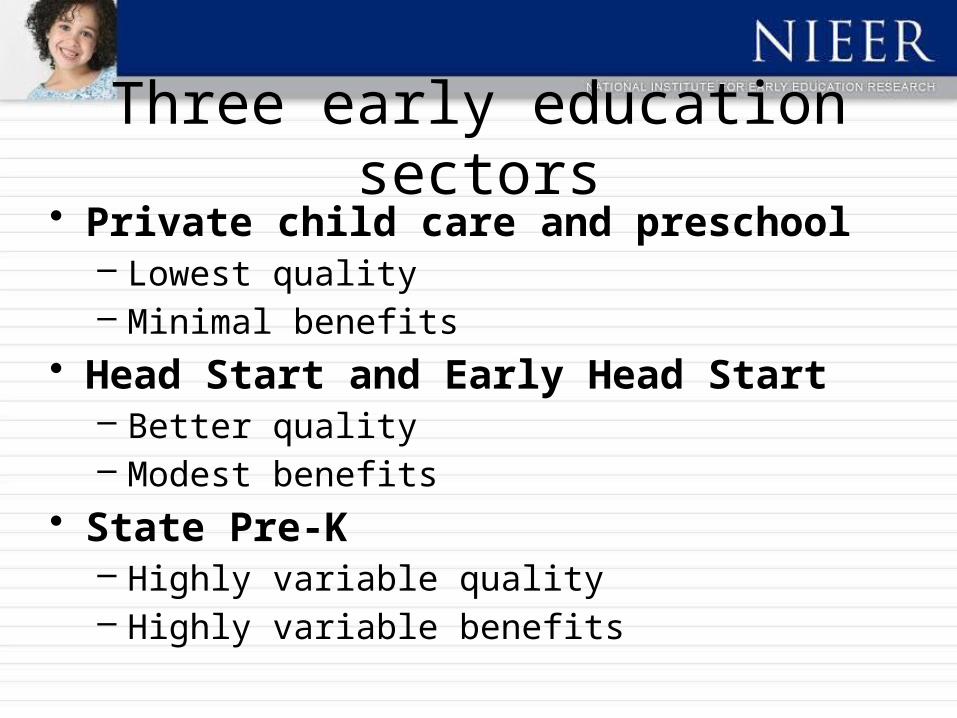
Three early education sectors• Private child care and preschool
– Lowest quality– Minimal benefits
• Head Start and Early Head Start– Better quality– Modest benefits
• State Pre-K– Highly variable quality– Highly variable benefits

Preschool Quality in California
Private Head Start Public Pre-K0%
5%
10%
15%
20%
25%
30%
35%
40%
45%
Percent Good or Better
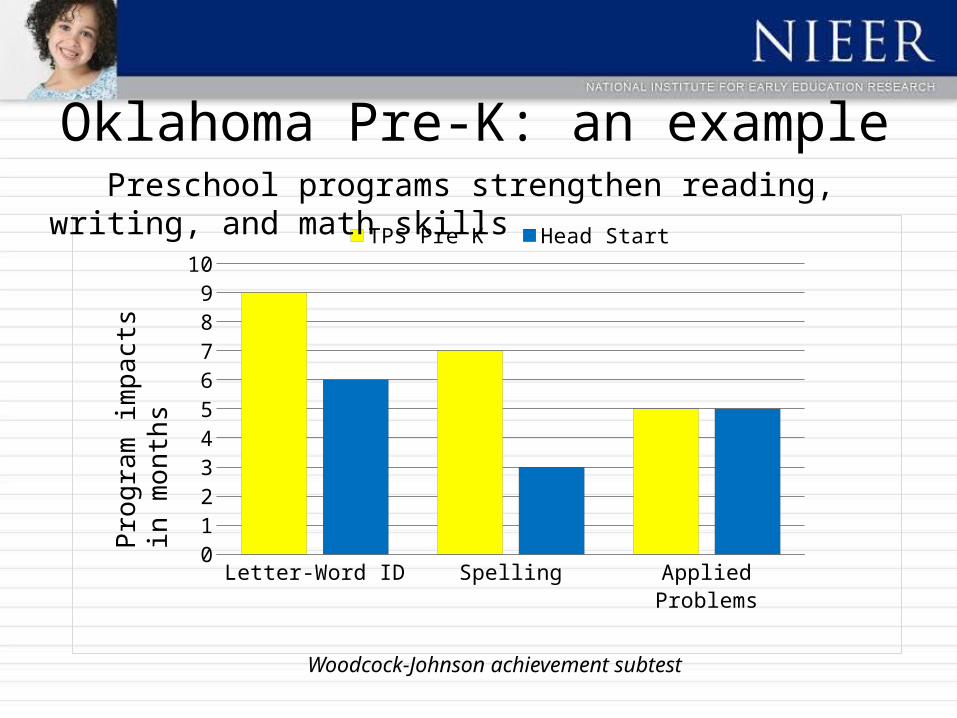
Oklahoma Pre-K: an example
Letter-Word ID Spelling Applied Problems0123456789
10TPS Pre K Head Start
Pro
gram
impa
cts
in
mon
ths
Preschool programs strengthen reading, writing, and math skills
Woodcock-Johnson achievement subtest


States at Risk• California cut spending per child by 10% for 2010-11, achieves
only 3 of 10 benchmarks & threatens further budget reductions.• Florida ranks first in access (76%) but near last in support for
quality. Class size limits raised, & further cuts may be coming.• Georgia met all 10 benchmarks then cut its pre-K school
calendar by 1 month & increased class size to 22. • Illinois reduced enrollment has funding troubles.• North Carolina moved pre-K out of education, reduced staffing
and enrollment. May face more cuts. • Oklahoma a national leader cut spending by more than 10%.• Pennsylvania had made strong gains but the new governor made
serious cuts over 10% per child in 2010-11.
10 Years of State Pre-K• 600,000 child increase in state pre-K enrollment
since 2001-02. Especially important for Hispanics who depend heavily on state programs .
• Enrollment at age 3 barely budged.• Spending per child $715 lower than in 2001-02.• Adoption of statewide comprehensive early learning
standards nearly universal.
• Less progress in raising standards for teachers.

Conclusions Pre-K can be a strong public investment
Cut the achievement gap by 40 percent
Increase job and GDP growth
Intensity and quality are the keys to high returns
More progress on enrollment than on quality.
Some states moved backwards sharply due to the recession.
Quality costs—but failing to invest in quality early education costs far more