State Owned Financial Institutions in Europe and Central...
15
State Owned Financial Institutions in Europe and Central Asia A selective first glimpse from a recent WBG survey Ilias Skamnelos Lead Financial Sector Economist Finance & Markets Global Practice Kuala Lumpur September 19, 2017
Transcript of State Owned Financial Institutions in Europe and Central...

State Owned Financial Institutions
in Europe and Central AsiaA selective first glimpse
from a recent WBG survey
Ilias Skamnelos
Lead Financial Sector Economist
Finance & Markets Global Practice
Kuala Lumpur
September 19, 2017
Table of Contents
Context and perspective
Design and caveats
A selective first glimpse

Why Europe and Central Asia… the historic context and perspective

Table of Contents
Context and perspective
Design and caveats
A selective first glimpse

• State ownership >50 percent (e.g. plus 1 voting rights share)
• Assigned to one of three geographic areas – Benchmark
Europe (B-Europe), West ECA (W-ECA) and East ECA (E-ECA)
• Commercial SOFIs (C-SOFIs) – state commercial and hybrids;
Development SOFIs (D-SOFIs) – state development banks,
agencies or narrow institutions.
• Quantitative information at three time points: 2007, 2011
and 2015
10
2
12
6
4
7
0 5 10 15frequency
Benchmark Europe
WEST ECA
EAST ECA
Development
Commercial
Development
Commercial
Development
Commercial
Design
• Sample of 41 institutions distributed across 22 countries
• 15 institutions classified as C-SOFIs and 26 as D-SOFIs
• W-ECA sample holds highest number of SOFIs (18), followed
by an almost equal share in B-Europe (12) and E-ECA (11)
• Representation of sample in terms of sector or SOB assets
varies considerably
• D-SOFIs make up more than 80 percent of the sample in B-
Europe and 60 percent in W-ECA, while C-SOFIs account for
more than 60 percent of the sample in E-ECA
Sample
As with all surveys, the sample’s interpretation needs to be approached with caution

Table of Contents
Context and perspective
Design and caveats
A selective first glimpse
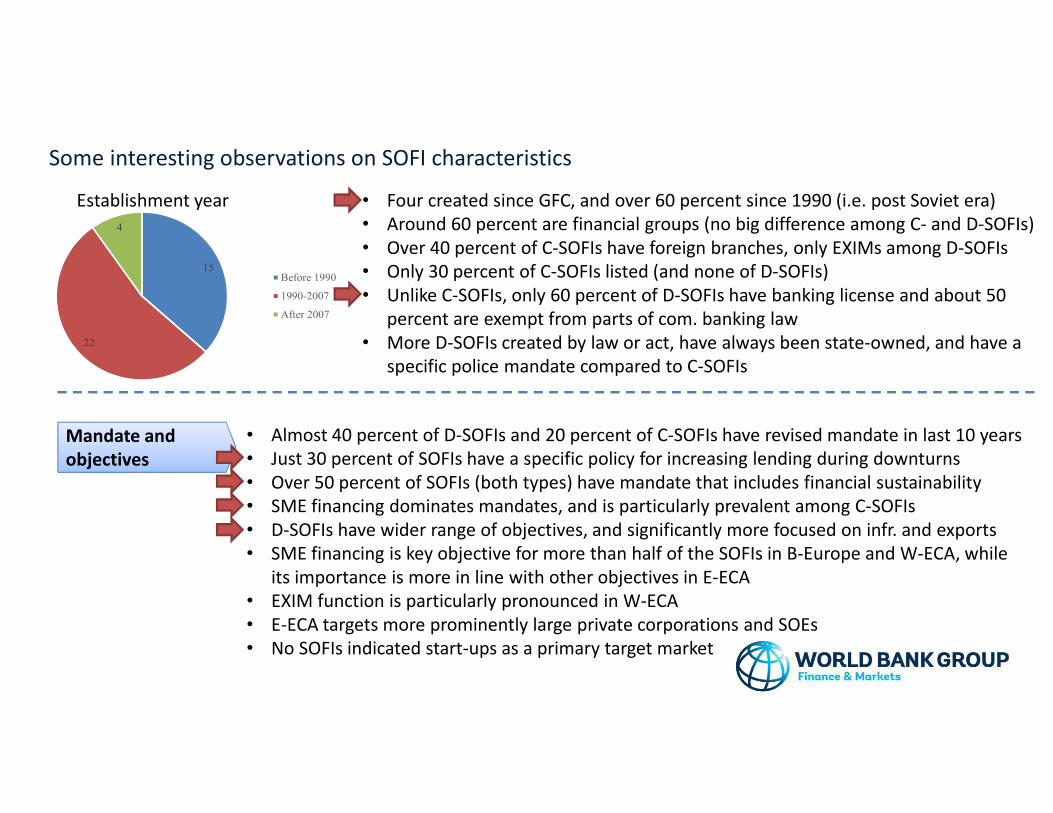
Some interesting observations on SOFI characteristics
15
22
4
Before 1990
1990-2007
After 2007
• Four created since GFC, and over 60 percent since 1990 (i.e. post Soviet era)
• Around 60 percent are financial groups (no big difference among C- and D-SOFIs)
• Over 40 percent of C-SOFIs have foreign branches, only EXIMs among D-SOFIs
• Only 30 percent of C-SOFIs listed (and none of D-SOFIs)
• Unlike C-SOFIs, only 60 percent of D-SOFIs have banking license and about 50
percent are exempt from parts of com. banking law
• More D-SOFIs created by law or act, have always been state-owned, and have a
specific police mandate compared to C-SOFIs
Establishment year
Mandate and
objectives
• Almost 40 percent of D-SOFIs and 20 percent of C-SOFIs have revised mandate in last 10 years
• Just 30 percent of SOFIs have a specific policy for increasing lending during downturns
• Over 50 percent of SOFIs (both types) have mandate that includes financial sustainability
• SME financing dominates mandates, and is particularly prevalent among C-SOFIs
• D-SOFIs have wider range of objectives, and significantly more focused on infr. and exports
• SME financing is key objective for more than half of the SOFIs in B-Europe and W-ECA, while
its importance is more in line with other objectives in E-ECA
• EXIM function is particularly pronounced in W-ECA
• E-ECA targets more prominently large private corporations and SOEs
• No SOFIs indicated start-ups as a primary target market

Some interesting observations on SOFI characteristics
Instruments
and portfolio
• About 20 percent of C-SOFIs also do on-lending, and almost 70 percent of D-SOFIs do a
combination of direct and on-lending
• About 60 percent of D-SOFIs offer subsidized products (term or rate) vs 20 percent among C-
SOFIs, and D-SOFIs are significantly more likely to risk-share with private banks
• Technical assistance is offered by just 25 percent of all SOFIs
• Almost all C-SOFIs offer guarantees, and about 40 percent offer leasing and factoring
• More than a third of D-SOFIs provide equity financing and venture capital financing
• Very few SOFIs offer matching grants, and most introduced the product after 2007
• Venture capital financing is significantly more prevalent in B-Europe, as is leasing and factoring in
E-ECA (possible given the higher presence of commercial banks)
• B-Europe’s top lending sector is energy, W-ECA’s manuf., and E-ECA’s manuf. and energy
• Agriculture is consistently present, but low compared to other sectors

Some interesting observations on SOFI characteristics
Fin. structure &
performance
• C-SOFIs rely mostly on general public and corporate deposits, and D-SOFIs on government,
multilaterals and securities
• Both types of SOFIs have been receiving EU fund support
• Receiving government funding is more prevalent in E-ECA, multilateral funding in W-ECA, and B-
Europe and E-ECA SOFIs rank bonds as a significant source of funding
• C-SOFIs were considerably more profitable than D-SOFIs in 2007
• Profitability suffered since 2007, but trend stabilizes after 2011 (mostly W-ECA)
• Income appears to be dropping fast, with only a lagged and relatively muted response in
operating expenses
• NPLs exposure has increased significantly, driven primarily by direct lending operations
• C-SOFIs experienced NPL spike earlier than D-SOFIs
• SOE related NPL rate is consistently low
• Since the crisis, several SOFIs have been recapitalized
• Capital adequacy ratios are relatively high among SOFIs, with the highest observed among D-
SOFIs that have actually experienced an upward trend

Some interesting observations on SOFI characteristics
Governance• Sup. Board is mostly appointed by the shareholder, but in 22 percent of the cases by a legislative
body, and appears to be often subject to multiple actors, layers or steps
• 40 percent of SOFIs indicate “other” as means of appointment for the Chairman, followed by 36
percent by the Sup. Board and 20 percent by the Minister of Finance
• About 80 percent of SOFIs have formal requirements for Sup. Board and senior management
members, offer Sup. Board members fixed-terms contracts, and evaluate senior management
performance
• Over 80 percent of SOFIs have in place several review functions, but just half have a risk
committee, and just 60 percent of D-SOFIs have an internal control function
Monitoring &
evaluation
• About 90 percent of all SOFIs are audited by professional external auditor and about 80 percent
have IFRS based audit report
• Impact evaluation units are scarcely present among SOFIs, and less than 20 percent undertake
impact evaluations
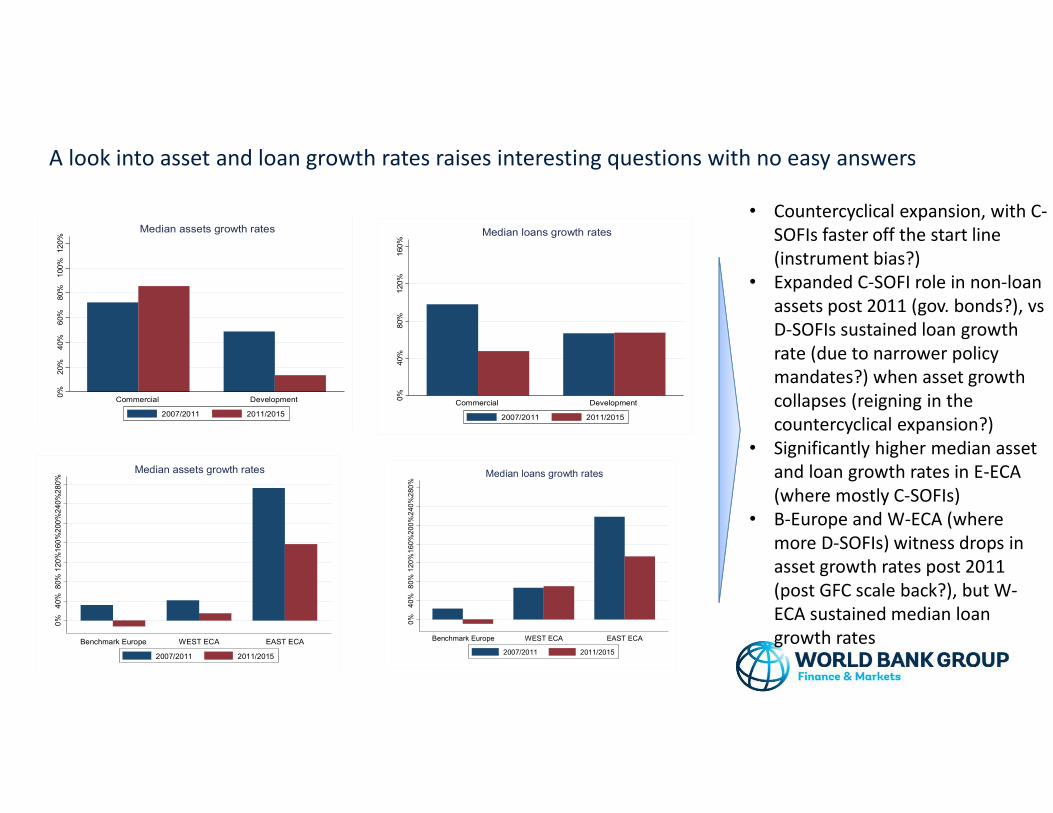
A look into asset and loan growth rates raises interesting questions with no easy answers
0%
20%
40%
60%
80%
100%
120%
Commercial Development
Median assets growth rates
2007/2011 2011/2015
0%
20%
40%
60%
80%
100%
120%
Commercial Development
Median assets growth rates
2007/2011 2011/2015
0%
40%
80%
120%
160%
Commercial Development
Median loans growth rates
2007/2011 2011/2015
0%
40%
80%
120%
160%
Commercial Development
Median loans growth rates
2007/2011 2011/2015
0%
40%
80%
120
%1
60
%2
00
%2
40
%2
80
%
Benchmark Europe WEST ECA EAST ECA
Median assets growth rates
2007/2011 2011/2015
0%
40%
80%
120
%1
60
%2
00
%2
40
%2
80
%
Benchmark Europe WEST ECA EAST ECA
Median loans growth rates
2007/2011 2011/2015
• Countercyclical expansion, with C-
SOFIs faster off the start line
(instrument bias?)
• Expanded C-SOFI role in non-loan
assets post 2011 (gov. bonds?), vs
D-SOFIs sustained loan growth
rate (due to narrower policy
mandates?) when asset growth
collapses (reigning in the
countercyclical expansion?)
• Significantly higher median asset
and loan growth rates in E-ECA
(where mostly C-SOFIs)
• B-Europe and W-ECA (where
more D-SOFIs) witness drops in
asset growth rates post 2011
(post GFC scale back?), but W-
ECA sustained median loan
growth rates

Extra slides
(not for presentation)

Country Geography Num of Institutions% country banking
assets
Bosnia and Herz. West ECA 3 <1Bulgaria West ECA 2 3.2Croatia West ECA 1 5.0Czech Rep. West ECA 1 <1France Benchmark Europe 2 <1Germany Benchmark Europe 3 5.1Hungary West ECA 2 4.0Kyrgyz Rep. East ECA 2 18.6Latvia Benchmark Europe 1 1.3Macedonia West ECA 1 <1�etherlands Benchmark Europe 2 3.6Poland West ECA 1 2.7Portugal Benchmark Europe 1 24.8Rep. of Belarus East ECA 3 51.1Romania West ECA 2 7.5Russia East ECA 3 21.8Slovenia West ECA 1 23.3Spain Benchmark Europe 2 2.7Turkey West ECA 4 10.1Ukraine East ECA 3 11.4United Kingdom Benchmark Europe 1 <1Total 41

SOFI Country
The Development Bank of The Federation of Bosnia and Herzegovina Bosnia and HerzegovinaThe Republic of Srpska Investment-Development Bank Bosnia and HerzegovinaUnion banka d.d. Sarajevo Bosnia and HerzegovinaBULGARIAN DEVELOPMENT BANK BulgariaMunicipal Bank AD BulgariaCroatian Bank for Reconstruction and Development - Hrvatska banka za obnovu i razvitak (HBOR) CroatiaCzech-Moravian Guarantee and Development Bank Czech RepublicAgence France Locale FranceSociété de Financement Local FranceBayerische Landesbank GermanyLandeskreditbank Baden-Württemberg - Förderbank - (L-Bank) GermanyNRW.BANK GermanyHungarian Export-Import Bank Plc. HungaryMFB Hungarian Development Bank Plc. HungaryOJSC "Ayil Bank" KyrgyzstanOpen Joint-Stock Company "RSK Bank" KyrgyzstanJSC Development Finance Institution Altum LatviaMacedonian Bank for Development Promotion MacedoniaBNG Bank NetherlandsNWB Bank NetherlandsBank Gospodarstwa Krajowego PolandCaixa Geral de Depósitos, S.A. PortugalBelinvestbank JSC Republic of BelarusJoint Stock Company «Savings Bank «Belarusbank» Republic of BelarusJoint-Stock Company “Development Bank of the Republic of Belarus” Republic of BelarusBanca de Export-Import a Romaniei EXIMBANK S.A. RomaniaCEC Bank SA RomaniaEximbank of Russia RussiaVnesheconomhank RussiaVTB Bank RussiaNova Ljubljanska banka d.d., Ljubljana SloveniaICF - Institut Català de Finances SpainInstituto de Crédito Oficial (ICO) SpainDevelopment Bank TurkeyHalk Bank TurkeyT.C. ZİRAAT BANKASI A.Ş. TurkeyTürkiye İhracat Kredi Bankası A.Ş. (Turk Eximbank) TurkeyJoint Stock Company "The State Export-Import Bank of Ukraine" UkraineJSB "UKRGASBANK" UkraineOschadbank UkraineUK Green Investment Bank plc United Kingdom

Table 1: State intervention rationale
State Intervention Rationale Example
(i) Market failures. Financing financially profitable projects that do not
get financed due to market failures (e.g. asymmetric information).
SMEs, Agriculture, R&D and capital intensive sectors. International trade. Long term finance (including infrastructure).
(ii) Social goals. Financing financially unprofitable projects that are
socially valuable.Rural and isolated areas.
(iii) Countercyclical/ safe haven. Financing financially profitable
projects that do not get financed when private bank risk appetite
Labor intensive sectors. Wide geographic branch presence.
(iv) Competition. Guaranteeing competitive behavior in a collusive
banking sector.Broader commercial banking.
(v) Trust. Promoting intermediation in a context of a general mistrust of
private banks.Broader commercial banking.
(vi) Return. Provide returns to the state as shareholder. Broader commercial banking
Table 2: Typology of SOFIs
Typology State Intervention Rationale(i) State commercial banks. They do not have a policy mandate, and are
profit maximizers with operations virtually indistinguishable from those
of private commercial banks. They collect deposits from the public and
use them to directly lend to firms and individuals. In some cases, they
are universal banks - directly or through affiliates.
(i) Return; (ii) Countercyclical/ safe haven; (iii) Competition; (iv) Trust
(ii) State hybrid banks. They have a policy mandate, but perform
commercial banking activities. They collect deposits from the public and
use them to directly lend to firms and individuals. They act as a
government agent in administering state subsidies and other programs.
(i) Return; (ii) Countercyclical/ safe haven; (iii) Competition; (iv) Trust; (v) Market failures; (vi) Social goals
(iii) State development banks. They have a policy mandate. They do not
take deposits and are funded by IFIs, bonds or government transfers.
They on-lend or lend directly to firms in specific sectors (SMEs, exports,
agriculture, etc.).
(i) Countercyclical; (ii) Market failures; (iii) Social goals
(iv) State development agency. They have a policy mandate. They make
no loans and do not collect deposits. They provide technical assistance,
issue partial guarantees, matching grants, and subsidies.
(i) Countercyclical; (ii) Market failures; (iii) Social goals
(v) State narrow financial institutions. Their mandate, ultimately, is to
mobilize savings. They collect deposits, but make no loans and invest
only in government paper. Typically postal offices.
(i) Market failures; (ii) Social goals
Table 3: Typology of SOFIs financial instrumentsTypology Benefits
(i) Direct lending (also kwon as first-tier, retail). Direct provision of
finance to the ultimate beneficiary. Finance can be a regular loan,
leasing, or factoring.
Targeted approach, when ultimate beneficiary or location is too expensive for private financial intermediaries to serve.
(ii) On-lending (also kwon as second-tier, wholesale). On-lending to
financial intermediaries for their direct provision of finance to the
ultimate beneficiary. Finance can be a regular loan, leasing, or factoring.
Lower cost and risk management burden. Limited scope for political interference and market distortion. Higher demonstration effect.
(iii) Risk sharing facilities. Offering of credit guarantees that partially
offset loan losses by private financial intermediaries upon the ultimate
beneficiary’s default.
Leverage public resources. Alleviate enterprise collateral constraints and financial intermediary risk aversion.
(iv) Grants. Direct or indirect (through third parties) provision of
grants.
Achieve socially desired objectives, ensure equitable income distribution.
(v) �on-lending products. Offering advisory services, capacity building,
and training programs to financial intermediaries or ultimate
beneficiaries.
Strengthen financial intermediaries or ultimate beneficiaries, typically complemented by financing.


![ECA [UandiStar.org]](https://static.fdocuments.in/doc/165x107/55cf9008550346703ba28dee/eca-uandistarorg.jpg)