State Oi/,Spill Preparedness andResponse · State Oi/,Spill Preparedness andResponse How Can the...
115
State Oi/,Spill Preparedness and Response How Can the State Better Address the Problem of Small, Chronic Oil Spills? ' SiIicethe accidental release of a large quantity of oil from the tanker Exxon Valdez in March 1989, much ,attention has been focused on the possibility of another major offshore oil spill near . the United States coastline. Although California has not experi- enced a spill of this magnitude, the extensive amount of oil development and transport off the state coast certainly raises the question of whether such an event could happen here and what its
Transcript of State Oi/,Spill Preparedness andResponse · State Oi/,Spill Preparedness andResponse How Can the...

State Oi/,Spill Preparednessand Response
How Can the State Better Address the Problem of Small,Chronic Oil Spills? '
SiIicethe accidental release ofa large quantity ofoil from thetanker Exxon Valdez in March 1989, much ,attention has beenfocused on the possibility of another major offshore oil spill near.the United States coastline. Although California has not experienced a spill of this magnitude, the extensive amount of oildevelopment and transport offthe state coastcertainly raises thequestionofwhether such an event could happen here and what its

254/ Part IV: Major Issues Facing the Legislature
consequences would be. The potential environmental and economic effects of this kind of accident clearly warrant seriousconcern and require substantial preventive and preparednessefforts.
Even before the Alaskan mishap, however; the state, localgovernments and private industry had begun to put significanteffort into improving systems for major oil spill prevention,preparation and response. Since the consequences of a "catastrophic"cspillWOl.lldbe quite large, thisprobleIll appear.,~to haveoversha.dowedar~latedibutless visible one: tlle chronic, sometime~,unqete~tedl:lischar~e ofmucll 'smaller ,quantities' ,of oil,ofteninonshol'e are,as. Given that thl'lse smallerspillsarekno",nto occur more frequently and, in the aggregate, pose significantproblems to the environment, the Legislature should considerways to better address this problem.
In this analysis, we review the history of major offshore oilspills ,near California and the..efforts to ensure a reasonable levelof safety and environmental protection in this area. We thencontrast this with the current system to handle smaller, mostlyonshore oil spills in the state.Finally,wepresentsomealterna-
·Uves to. consider in attempting to improve this' system.
MAJOR OFFSHORE Q.ILSPILLS HAVE BEE~RELATIVI:LV FEW
Although each incident received substantial notoriety at thetime, historically there have been only a few oil spills in the PacificOceanthat c.~nbe considered"major." i\part from the Valdez spill,involving the release ofover 11 million gallons of crude oil, thelargest and mostinfamous was the platform blowout inthe' SantaBarbara Channelin 1969. Although the actual amount is uncer-
·tain, according to some estimates this accident released about 3million gallons ofcrude oil into ocean waters, resulting in significant environmental damage.
Since 1969, however, there have not been any spills of thismagnitllde offfhe Cal~forniacoast. The nextlargest spill occurredin 1971, whentwo tankers collided in dense fogjust outside ofSanFrancisco Bay, spilling a total of800,OOO gallons ofcrude oil. Thisaccident led to the use of radar as part of the onshore VesselTracking System. In 1984, the tanker Puerto Rican exploded 12
·.mileswest ofthe GoldenGate Bridge, spilling 1.3,milliqn gallons'of fuel oil at sea. Although considered a major spill, its environmental impact was considered minimal; relative to, its size, because there was relatiy:ely little impact on wildlife or the coastalarea.
In 1987, two cargoships collided inthe SantaBarbara channel, with one of them, the Pdcbaroness, spilling about 150,000

StateOilSpill Preparedness and Response /255
gallons ofits own fuel oil before sinking. In 1988, a barge collidedwith its tug offthe Washington state coast, leaking about 230,000gallons offuel oil into the water, much ofwhich eventuallywashedup on hundreds of miles of beaches in Washington and Canada.
Most recently, the tanker American Trader spilled an estimated 400,000 gallons of ,crude oil in attempting to unload at amarine ternlinal near Huntington Beach in February1990. At thetime of our review, the effects of this spill had not yet beendetermined.
MEASURES HAVE BEEN TAKEN TO ADDRESS MAJOR SPILLS
As the prEilceding brief history indicates, large offshore oilspills-while posing a very real threat to the coastline-have notbeen common. Nevertheless, it is clear that,under certain condi
. tions, even one major spill could be disastrous for the marine andcoastal environments, fishing, tourism and the oil industry itself.
Recognizing this situation, governments and industry havetaken'steps since 1969 to{l) improve operational safety in offshore oil development and transport and (2) establish adequatepreparedness and response plans aimed at cleaning up amajor oilspill. For example, the State Lands Commission (SLC), whichmanages oil arid gas leases in state waters (zero to three milesoffshore), has an extensive regulatory program designed to prev~ntspills at platforms, marine terminals, processing facilitiesand pipelines within this jurisdiction. Various state and federalagencies also conduct surprise "spill drills" to test the adequacy ofthe industry operators' spill containment and cleanup plans. Ina9.cli,tion, new technologies have been put into place to improve thesafety of platform drilling and tanker transport.
Alth()ugh it is difficult to determine how much of the safetyrecord foroffshore oil in recent years is attributable to thesemeasures or simply to goodluck, the vast majority ofoffshore spilliIiCidents during t:Pis·tiIIle have been very small. The SLC indicates that, during the past three yeaTS, only 21 such incidentswere rep()rted at oil fl:icilities leased in state waters, totaling 267gallons of oil, primarily from routine offshore oil operations. Thefederal Minerals Management Service, which manages oil andgas leases in Outer Continental Shelf (OCS) waters (3to 12 miles
,offshore), reports that over thepast 10 years, about 90 percent ofoil spills from these operatIons in the OCS r~gion were less thanone barrel (42 gallons), averaging about five gallons each. Thelargest sing~e,recordedspIll during this period was about 700gallons. These. amounts seem even less significant when compared to natural seepage of oil, occurring along fault lines undercoastal waters, at an estimated rate of2,500 to 25,000 gallons per

256/ Part IV: Major Issues Facing the Legislature
day in Southern California alone. (There is, however, a differenceecologically between oil seeping through the ocean floor and oilspilled on ·surface waters;)
State Oil Spill Response Measures
A 1972 amendment to the California Emergency Services Actof 1970 allows the Governor to establish Ii state oil spill contingency plan. Pursuant to this authority, the StateInteragency OilSpill Committee (SIOSC) was created during the 1970s, with theaim of developing a coordinated state plan for responding to oilspills, both onshore ahd offshore, but primarily those from offshore oil platforms, pipelines or tankers. As described in thestate's Oil Spill Contingency Plan, the SIOSC consists of representatives of 13 state agencies that are responsible for variousaspects· of oil spill response in the .state. The STOSC· itself isresponsible for: (1) establishing and maintaining liaison withfederal and local agencies and with public and private organizations engaged in oil pollution prevention and control and (2)coordinating day-to-day procedures between state agencies andother organizations regarding prevention and mitigation of oilpollution.
The committee meets formally at least once a year, in part toensure that the contingency plan is up to date. The plan was lastofficially revised in May 1983, and a new revisioll isnowunderway.
The SIOSC made the administrative decision to make theDepartment ofFish and Game (DFG}the lead stateagencyfor oilspills, mainly because of the threat spills pose to the state'snatural resources. As such, the DFGis responsible for directingthe overall operations of all state agenciesengaged in combatingan oil spill. In addition to day-to-day response coordination, theDFG has contracted on behalfofthe SIOSC fora study evaluatingcurrent. oil spill response plans and. technology to deal withoffshore.oil spills, as requiredby Government Code Section8574.6(Ch 1251/86-SB 2495, Marks). TheDFGexpects to present thisstudy to the Legislature in March 1990.
Other Response Plans
The DFG is also the state's representative· on the federalRegional Response Team (RRT), established toprovide acoordinated federal response to major oil spills. The RRT also includesthe U.S. Coast Guard and the U.S. Environmental ProtectionAgency. The Coast Guard usually is on the scene of a majoroffshore spill, even if it occurs iIi state waters.
State Oil Spill Preparedness and Response /257
In addition, members ofthe oil industry have created severalprivately funded cleanup cooperatives locateci along the California coastline, due in Pii~to state agency req1.lirements.Eachhaspersonnel and equipment available around the clock to respond toa major offshore spill in certain coastal areas.
Legislative Proposals
One reaction to the Exxon Valdez accident has been a numberof state and federal proposals to address the risk of a major oilspill, in the hopes of preventing another such accident andmiriimizingthe problems experienced with the cleanup efforts inAlaska. These are summarized in Figure 1.
SOME POSSIBILITY OF MAJOROFFSHORE OIL. SPILL WILL REMAIN
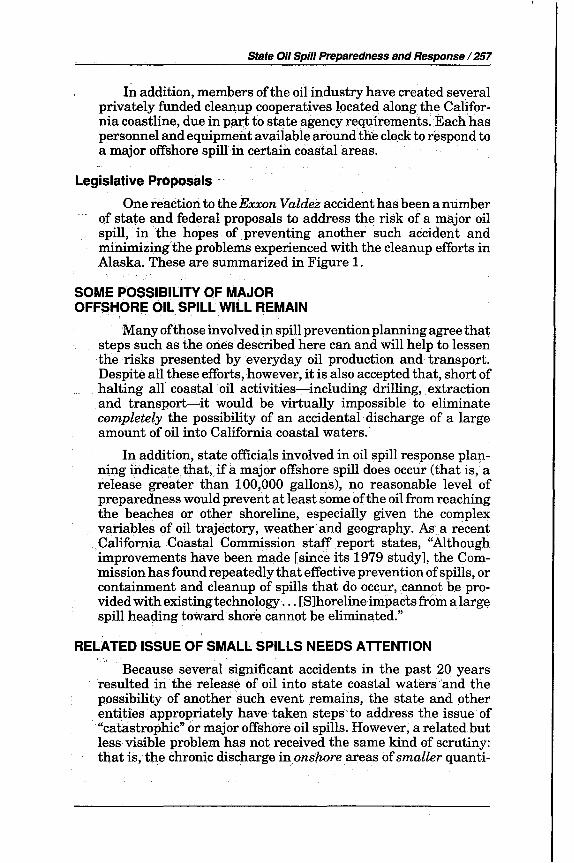
Many ofthose involved in spill prevention planning agree thatsteps such as the ones described here can and will help to lessenthe risks presented by everyday oil production and transport.Despite all these efforts, however, it is also accepted that, short ofhalting all coastal oil activities-including drilling, extractionand transport-it would be virtually impossible to eliminatecompletely the possibility of an accidental discharge of a largeamount of oil into California coastal waters.
In addition, state officials involved in oil spill response planning indicate. that, if a major offshore spill does occur (that is, arelease greater than 100,000 gallons), no reasonable level ofpreparedness would prevent at least some ofthe oil from reachingthe beaches or other shoreline, especially given the complexvariables of oil trajectory, weather· and geography. Asa recent.California Coastal Commission staff report states, "Althoughimprovements have been made [since its 1979 study], the Commission has found repeatedly that effective prevention ofspills, orcontainment and cleanup of spills that do occur,cannot be provided with existingtechnology ... [S]horelineimpactsfrom a largespill heading toward shore cannot be eliminated."
RELATED ISSUE OF SMALL SPILLS NEEDS ATTENTION
Because several significant accidents in the past 20 yearsresulted in the release of oil into state coastal waters and thepossibility of another such event remains, the state and otherentities appropriately have taken steps to address the issue of"catastrophic" or major offshore oil spills. However, a related butless visible problem has not received the Same·kind of scrutiny:that is, the chronic dischargeinonshore areas ofsmaller quanti-

258 I Part IV: Major Issues Facing the Legislature
AB 2603 (Lempert)
SB 1194 (Marks)
AB 893 (O'Connell)
.AB 36 (Hauser)
Environmental Protection Act of199Q-lnitiativeStatute
Federal Proposals
HR 1465 (Jones)
S 686 (Mitchell)
Pending (A)NaturalResourcesCommittee
(A) Inactive file
Pending (S)GovernmentalOrganizationCommittee
Pending (S)GovernmentalOrganizationCommittee
In Circulationfor Nov. 1990statewide ballot
Conference (withS 686)
Conference (withHR 1465)
Expands the SLC's reglJlatoryandinspection authority to improve prevention ofoffshore oil spills; creates a specific Officeof Oil Spill Response within theDFG todirect cleanup operations and training;establishes an oil transport fee to fund$500 million oil spill "Super:fund" aspotential source for cleanup costs; andadds civil fines and potential criminalpenalties for oil spills.8 ..
Prohibits large oil tankers from enterihgstate bays and harbors unlessaccompanied by tugboat. .
Adds areas in state waters off the SantaBarbara Coast to an existing sanctuary.
Adds state waters off the .coasts ofMendocino and Humboldt CoUnties toexisting sanctuaries.
Oil spill prevention and respcJnseprovisions similar to AB 2603. Also createsa Marine Resources Sanctuary in all statewaters along the coast, in which any newoil or gas leasing wouid be prohibited. b
Oil spill liabilit{and compensationlegislation: creates a $1 billion oil spillcleanup fund from oil fees; requires doublehulls on oil tankers; and continues to allowstates to set their own liability standards.
Contains many provisions similar to thosein HR 1465,
8 A virtually identical bill, S8 1482 (Keene), failed to clear the Senate .before the first-housedeadline. The author's office indicates that he will introduce a modified version of the bill by theend of February 1990. '
b In December 1989, the SLC administratively established such asanetuary zone, covering allstate coastfll waters not currently leasEld or already within existing sanctuary zones. In addition,the President now is considering a recent federal task force report on options for a possibleleasing moratorium in federal coastal waters.

SUite Oil Spil/Preparedness anl!Response /259
ties.ofoil, much ofwhich isnot contained or cleaned up and whichcan end up in: the state's streams, rivers, and eventually coastalwaterl3. These small spills result in water and air pollution, deathoffish and wildlife, damage to natural habitat, and human healthand safety problems. Neglect of such spills leads to continual,incremental damage to the environment. These spills are not justisolated incidents; they occur on a daily basis, .throughout thestate.
Extent of Small Oil Spills
A1tho~gh the nature ofthese smallspills makes it difficult toget a precise picture of the extent of the problem, the availabledata from two main sources suggest the general magnitude oftheproblem.
OES Warning Center. First, the state's Office ofEmergencyServices (OES) operates an emergency warning" center, whichreceives notification of-among other things-hazardous material incidents in the state. Most of these notifications are telephoned in by the parties responsible for hazardous materialllischarges, as required under existing law, or by local responseagencies suchas fire departments. During calendarYear1988, thewarning center received over 4,000 such calls..Of these, approximately one-halfinvolved petroleum and related, products (mostly.diesel fuel, gal3oline, or petroleum oillubri,cants).
These numbers, however, understate the total number ofspills.OES staffbelieve that many ot~er small hazardous material spills were not reported to the warning center by responsibleparties or local agencies~ In addition, state and federal agenciesthat respond to such incidents, often the DFG and the CoastGuard, are not required to contact the OES warning center aboutthese spills.
Hazardous IncidentReporting~·In addition to the immediate OES spill notification required of the responsible party, adesignated "admimstering agency" within localgoverrimentls required to send a detailed form to the OES after each spilHn theagency'sjurisdiction. The OES compiles this data in its CaliforniaHazardous Material Jncident ReportingSystem (CHMIRS). Thedraft ofthe latest CHMIRS summary cites 2,756 such forms filedduring .ca.1endar year 1988. Although many incidents conveyed tothe OES warning center·clearly are not being reported. throughthe CHMIRS;the draft report doesproviderev~alinginformationon common types ofconditions under which hazardousmaterials,includingoils, are spilled. AccordiIlgto the summary report, abouttwo-thirds ofall thereported incidents illvolved a spill in one ofthefollqwip.g circumstances: unauthorized dumping or abap.clonment; motor vehicle accident; in storage; normal manufacturing
260/ Part IV: Major Issues Facing the Legislature
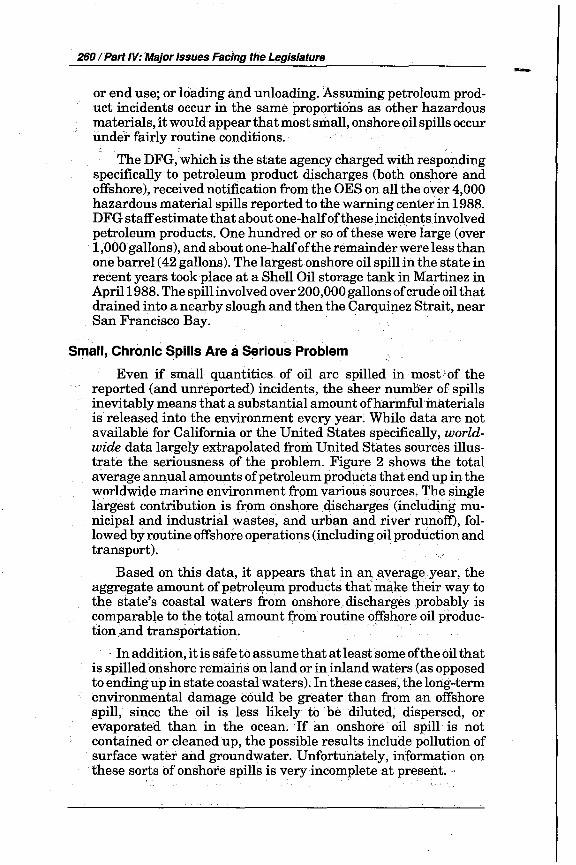
or end use; or loading and unloading. Assuming petroleum product incidents occur in the same proportions as· other hazardousmaterials, itwould appear thatmost small, onshore oil spills occurunder fairly routine conditions.
The DFG, which is the state agency charg~dwith respondingspecifically to petroleum product discharges (both onshore andoffshore), received notification from the OES on all the over 4,000hazardous material spills reported to the warning center in 1988.DFG staffestimate that about one-halfoftheseincidents involvedpetroleum products. One hundred or so of these were large (over1,OOOgallons), and about one-halfofthe remainder were less thanone barrel (42 gallons). The largest onshore oil spill in the state inrecent years took place at a Shell Oil storage tank in Martinez inApril 1988. The spill involved over200,000 gallons ofcrude oil thatdrained into a nearby slough and then the Carquinez Strait, nearSan Francisco Bay.
Small,Chronic Spills Are aSerious Problem
Even if small quantities of oil are spilled in most of thereported (and unreported) incidents, the sheer numoer of spillsinevitably means that a substantial amount ofharmfuhnaterialsis released into the environment every year: While data are notavailable for California or the United States specifically, worldwide data largely extrapolated from United States sources illustrate the seriousness of the problem. Figure 2 shows the totalaverage annual amounts ofpetroleum products that end up in theworldwide marine environment from various sources. The singlelargest contribution is fromonsh.oredischarges (including municipal and industrial wastes, and urban and river runofl), followed by routine offshore operations (including oil production andtransport).
Based on this data, it appears that in an. average year, theaggregate amount of petrolEilum products that make their way toth~ state's coastal waters from onshore discharges probably iscomparable to the total amount from routine offshore oil produc-tionand transportatIon. . ..
.. In addition, it is safe to assume that at least some ofthe oil thatis spilled onshore remains on land or in inland waters (as opposedto endingup in state coastalwaters). In these cases, the long-termenvironmental damage could be greater than from an offshorespill, since the oil is less likely to ·be diluted, dispersed, orevaporated than in the ocean. If an onshore oil spill· is· notcontained or cleaned up, the possible results include pollution ofsurface water ahd groundwater. Unfortunately, information onthese sorts of onshore spills is very incomplete at present.
-

State Oil Spill Preparedness and Response /261
. -
Chronic Onshore Oil Spills Are aSignificant Marine Pollution Source
Gallons peryear(millions)
400
350
300
250
200
150
100
50
Routine Marine Air pollution Onshore Naturaloffshore acCidentsb deposits dischargesc sources
oil operations'
Source of Petroleum in Ocean Waters(Worldwide)
a Includes: offshore oil production (platform drilling and extraction); tanker operations; marineterminals; and bilge and fuel oils.
b Includes: oil platform, marine terminal, tanker and other offshore accidents.
c Includes: municipal wastes; refineries; otherindustrial wastes; urban and river runoff includingspills; and dumping of wastewater sludge.
Source: Oi/ln The Sea (National Research Council, 1985). Amounts are for worldwide sources,but largely were extrapolated from data for United States only.
The overall hazards posed by theseongoing smalloilspills canhave serious effects in many areas: contamination ofwater andair; loss of fish and other wildlife; and even threats to humanhealth and safety, especially on land.
CONCERNS WITH THE CURRENT SYSTEM'SABILITY TO DEAL WITH THIS PROBLEM
Our review ofthe state's current process to respond to smallspills indicates several problem areas.

262/ Partl.V: Majorlssues Facing the Legislature
Communication and Reporting Shortcomings
As noted above, the state's current system to gain knowledgeof small oil spills has some significant gaps. The OES warningcenter is not informed of.~veryspillbyth.e responsible party, asrequired by law, or by local, stateor federal agellcies(which arecurrently exempt from this reporting requirement). IIi addition,the affected local response agencies that eventually will have torespond at the scene ofthe spill (such as a fire department) oftenare not immediately notified of the incident. Furthermore, insome-perhaps many-eases, local agencies do not file the required CHMIRS forms with the OES after a spill, which makeslater statistical analysis incomplete. Finally, while records existin its field offices, theDFG does not keep a'c,eIl.tralrecord andsummary of its reactions to OES warning cellter notificationswhat was the nature 6fthe spill, to what extentdidthe field staffrespond, and soon. This makes it difficult to determ~lle accuratelythe magnitude of the small spill problem and the overall level ofstate resources required for an ad~quate statewide response.
Lead Agency Has few Resources
Although small onshore oil spills are a problem which isconsidered in the state's official Oil Spill Contingency Plan, inpractice the state has allocated few resources to respond to them.As indicated earlier, the DFG il1lthe state's lead agency forresponse to oil spills threatening to affect any waters ofthe state.However, the department currently has only two permanentpositions dedicated to this responsibility-one for northern California and one for southern California. These two staffmembersrely on DFG wardens and other field personnel for moston~thescene activities, such as the initial investigation andcoormnation
'of cleanup efforts by other entities. (Currently, the p'epartmentalso has one temporary position which primarily is involved inspecific projects such as the contract for the oil spill reportrequired by Chapter 1251. The department has requested in the1990-91 budget that this position be made permanent and thattwo additional positio:J}s be provided to help manage oil spillresponse, specifically for small o:q.shore spills.)
Because of the' number of reported oil spills-again" morethan 2,000 in 1988-and the other ongoing workload demands onthe field staff, the DFGis able to respond only to the larger or moreenvironmentally hazardous spills~Consequently, they must leavemany "minor" spills to take dire ofthemselves. Finally,DFG staffalso believe that a number ofsmall ,oil spills are not discovered atall. .
State Oil Spill Preparedness and Response /263
Difficulty in Funding Cleanup Costs
The DFG mainly attempts to make the party responsible fora spill clean it up. Under existing law, the principle of strictliability requires the responsible party to pay for cleanup, even ifanother entity has done the actual work. However, in manysituations, the responsible party is not always known or is notfinancially able to pay. IIi this event, the DFG may draw upon itsFish and Wildlife Pollution Cleanup and Abatement Account,funded from any recovered cleanup payments and civil penaltiesand continuously appropriated to.the department. At the end of1988-89, the account held about $600,000, an amount which couldbe depleted in cleaning up one major spill.
Other State Agencies Have Limited Involvement
In relation to the DFG, other. departments currently havelimited roles in responding to the small spills problem.
State Water Resources Control Board (SWRCB). .TheSWRCBand the regional water boards provide technical assistance on the potential impact ofan oil spill on water resources, andmay provide cleanup funding from several special funds underSWRCB control if surface or ground waters are threatened.
Department of Health Services (DHS). The DHS maybecome involved in the response to an incident if it poses animmediate threat to public health,and may contribute cleanupfunds from the state Hazardous Substance Account if the oil iscontaminated with a state-designated hazardous substance.
California Highway.Patrol (CHP) and Department ofTransportation (Caltrcins). The CHP acts as the state's onscene coordinator for oil spills onfreeways, state highways, and onroadways in most unincorporated areas of the state. In addition,
. the CHP provides traffic control at these spills. Caltrans isresponsible for ensuring spill cleanup on state roadways and theirrights-of-way.
OtherAgencies. Other state agenCies, such asthe SLC, theDivision of Oil and Gas (DOG), or the Attorney General's Office,provide advice or legal assistance to the DFGin the event ofa spill.
Lack of Emphasis on Prevention
Looking at the problem from the other end, it appears that thestate has made relatively little effort to increase prevention ofthese kinds of oil spills. The DFG's responsibility is effectivelylimited to assessing a spill after the fact and coordinating thecleanup work ofothers ifit deems thiswork necessary. Other stateagencies involved in oil and gas industry safety regulation, such

264 /Part IV: Major Issues,Facing the Legislature
as the SLC, DOG or Coastal Commission, do not have the re~
sources (or often the jurisdiction) to monitor a large number ofpotential sources ofsmall oil spills. There arealso a large numberofpotential sources that are not directly related to the oil and gasindustry, such 'as manufacturing plants, trucking, and smallstorage tanks., Finally, since a sizeable portion of actual spillsappMr to be intentional but surreptitious, much ofthe burden ofprevention falls on local and state law enforcement, which maynot have sufficient resources to adequately serve as a deterrent.
local Agencies Not Always Adequately Involved'
Small local governments usually do not have the personnel ortechnical resources that would enable them to help prevent orrespond effectively to small oil spills and minimize environmentalliamage. Additionally, local agencies do not commonly have theirown specific oil spill response plans (as part of their overallemergency planning), nordo they often participate with state andfederal agencies in oil spill response planning drillsthat can helpimprove interagency coordination in actual spills where thisbecomes necessary. Furthermore, incases where the local respOnse agency is not the first to learn ofa spill, it sometimes is notinformed.of the incident until a significant amount of time haslaRsed.
HOW CAN THE STATE IMPROVE SMAllOil SPill PREVENTION AND RESPONSE?
In, addition to measures to address the possibility ofanothermajor offshor.e oil spill, the Legislature should give someattentionto the more common, but less visible problem ofchronic, relativelysmall oil spills. In so doing, the Legislature first needs to addressthe following questions: '
.• Is the current system essentially sound, needing onlymarginal changes to improve the state's role in preventing and responding to this problem; or .
• Is the current system ineffective, warranting a closer look,at alternative systems for small spill prevention and response?
In either case, the Legislature has options to improve small ,oilspill prevention and response.
Changes to the Current System
Ifthe current system is retained, the Legislature may wish toconsider the follow:ing possible changes to address the system'sshortcomings. ,

State Oil Spill Preparedness and Response /265
More Emphasis on Small Spill Prevention. As in the areaof major offshore oil spills, one focus of state activity should belesseningthenumber of actual spills to which the stateneeds torespond by strengthening ways to prevent small oil spills fromoccurring. Toward this end, it is critical that individuals and firmsface strong incentives to prevent spills. This could be achievedthrough various means: tougher enforcement by various stateagencies (such·as theDFG and the SWRCB) ofexisting regulations and statutes concerning oil discharges; more field patrol andsurveillance; and the active use of existing state liability laws toprosecute for damages when a responsible party can be identified.
Improved Communic;ati~nand Reporting. As describedabove, complet~ information on the extent arid magnitude of thesmall oil spill problem is not available under the current system.In part, this could beimproved by:. (1) more publicity about andenforcement ofexisting law req~iring responsible parties to report spills immediately to the OES warning center; and (2)requiring all state agencies involved in oil spill responseto reportincidents to the OES, since the OESalready is set up to act' as acommunications center. These steps' would provide more timelynotice of spills.
In addition,efforts to (l) increase local agencyunderstandingofand compliance with the QHMIRS reporting requireJnents and(2) ensure· that all DFG field reports on spills are forwarded toDFG headquarters for summation would provide better data onwhich to base decisions to adjust the state's response systems.Finally, for those Gaseswhere a local agencyisnot the first on thescene, the OES should contact the proper local agency as quicklyas pos~ible to inform it ofthe incident. .
More Resources for Response. Although the DFG is thelead state agency for oil spill response, it lacks sufficient resourcesto perform this function effectively. Additional field staff wouldgive thethe DFGtheability to require the cleanup ofmany spillsthat it now must trust nature alone to take care of, and to discoverspills that now go undetected. Funding for this staff could comefrom increased penalty revenues to the DFG's Pollution Cleanupand AbatementAccount or from assessments on producers, transporters and users of specified kinds. of oil. Regardless of themethods used, however,. any proposals to improve theDFG'sresponse·· to oil spills should inclUde specifically the small. spillissue as part of the plan, so that, in addition to resources toaddress the possibility ofmajor offshore oil spills, resources can befocused on this issue.

266/ Part IV: Major Issues Facing the Legislature
Alternatives to. the Current System
If, on the other hand, the Legislature concludes that thecurrent system is inadequate, it may wish tocohsider the follow-ing alternatives. . .
Change in Lead Response Agency. The currentorganizational structure, designed primarily to cope with large coastalspills, may not be the appropriate one for coordinating a statewideresponse to daily small· spills. The State Interagency Oil SpillCommittee (SIOSC) made an administrative decision to select theDFG as the lead agency for both purposes. The Legislature,how~ver,has not expressed its preferences. In our view, the DFGmaynot be the most fitting lead agencyfor this purpose, since fishand wildlife and theirhabitat is onlyone concern out ofmany. (Inaddition, in our reView of the DFG in the,Ana'lysis ofthe 1990-91Budget Bill, we note that the department is having SOttle severefiscal problems. These problems are likely to affect the depart.ment's ability to direct resources to small spin response.) .Otherpossible lead agencies include the SLC, the OES, the SWRCB, orthe Environmental Mfairs AgeIl'«y. Alternatively, the SIOSCcould be charged with developing a new, more effective stateorganizational structure to improve response to small spills.
Increased Local Response Efforts. The local level may bethe~ostappropriate one for many small oil spill prevention andresponse activities,~incemost incidents ofthis type begin in andoften are confined to a relatively small area, and do not Crossjurisdictionalbolihdaries. The state could provide increased training andtechnical.assistance to localagencie.s to help improve theirefforts in the areas of prevention and response preparedness. Inaddition, it may be appropriate to require loc~lgovernments to (1)incorporate a specific oil spill response plan into· their localcontingency planning and (2) participate in oil spill responseplanning drills with state agencies, to help ensure timely and
.suitable measures in the event of a spilL Such requirementspotentially would constitute state-reimbursable mandates.
SUMMARY
Major offshoreoil spillsare a very real cOIlCeminCalifornia,and steps can be. and are being taken to address this issue.However, the less visible issue ofchronic, small oilspills, many ofwhich occur onshore, also warrants attention because of thecumulative environmental consequences. There are several alternatives for the Legislature to consider that would Improve thestate's role in preventing and responding to these small spills.

Health Care in Rural California
How Can the Legislature Improve Health Care Services inRural California?
INTRODUCTION
Over th.e past several~ears, tlleLegislature has taken numerous actioIlB to adqress problem~ :\V~th rural health, ,services. Primarily, these actions have been in response t6.rural hospitalclosures, (:ontjuued financial.distress of 'curr~nt fa~ilities, anddifficulties in recruiting and retaining health profes~ionals:Ourreview indicates that, despite these legislative efforts, currentstate programs do not address these problems in a comprehensiveway.

268/Part IV: Major Issues Facing the Legislature
In the following pages, we examine health care services inrural areas within the state. Specifically, we (1) review thecharacteristics of rural areas and health care services in theseareas, (2) discuss current state programs, (3) highlight specificproblems we identified within the existing services, and (4)suggest ways the Legisl.ature could improve the provision ofhealth care services to rural areas.
WHAT ARE THE CHARACTERISTICS OF RURAL AREAS?
Defining "Rural"
There are Ilumerous inconsistent definitions of"rural" in useby different state andfederal programs. For this analysis, we havechosen to focus on counties that (1) are not classified as a Metropolitan Statistical Area (MSA), (2), are not part ofa ConsolidatedMetropolitan Statistical Area (CMSA), and (3) have a total population of 200,000 or les$. Under this definition, 25 of the 58counties in California, are considered rural. FIgure 1 lists thesecounties and displays data on the population and the number ofhospitals and clinics in each county.
This definition has the limitation of excluding rural areaswithin urban counties. We did not include these areas becausemost of the data are available only by county. We recognize thatthese areas within urban counties share many ofthe characteristics and problems of rural counties.
Low PopUlation Density
Rural counties in California are sparsely populated. Theaverage population density for these 25 counties is 29 pers0B-s persquare mile with a range of1 (Alpine) to 99 (Colusa) persons persquare mile. In comparison, the density is 2,131 persons persquare mile in Los Angeles, 568 in Sacramento; and 16,251 in SanFrancisco. The totalpermanentpopulation living in rural coun-ties is 4 percent 'of the state's population. ' .
PopUlation Swings
Some rural areas experience large swings in their population.Seasonal workers, for example, contribute totemporary population growth in counties where' agriculture is a major economicactivity. Counties with national and state parks and other resortareas a.lso host significant numbers of seasonal tourists andworkers;

Health Care in Rural California /269
Figure 1
Alpine 1,190Amador 29,150 1 2Calaveras 32,400 1Colusa 15,500 1Del Norte 20,400 1Glenn 23,600 1 1Humboldt 116,800 6 4Imperial 115,700 3 4Inyo 18,200 2 1Kings 96,000 4Lake 52,100 2 1Lassen 28,800 1 4Madera 83,800 2 3MariposCl. 14,800 1Mendocino 76,900 5 5Modoc 9,375 2 1Mono 9,800 2Nevada 78,800 2Plumas 20,050 4 2San Benito 35,250 1 1Sierra 3,600 1 1Siskiyou 43,750 2 3Tehama 47,250 3Trinity 14,000 1Tuolumne 49,000 3
a Source: Department of Finance 1989 population estimates.
b Source: Office ofStatewide Health Planning and Development (OSHPD) Licensed Services andUtilization Profiles, .19.88.
c Source: OSHPD 1985 Annual Report of Clinics. as reported in Community Clinic Fact Book,1987.

Health Care in Rural California /271
Most rural hospitals are small. All but two ofthe 51 hospitalsin rural counties have fewer than 100 beds; and one-half havefewer than 50 beds. The occupancy rate for acute care beds inthese hospitals is low, averaging 33 percent in 1988. In compari"son, the statewideoccu.pancyrate was 53 percent. The occupancyrate for rural hospitiils varies significantly from day to daY,and·many facilities experience seasonal fluctuations associated withthe influx oftourists and workers. Rural hospitals generally focuson primary care and emergency services. For instance, 63 percentof these hospitals have licensed intensive care units, and 55percent have designated obstetrical beds. These hospitals gener~ally do not have extensive specialty departments.
Many Rural Hospitals Are Financially Distressed. In1988,29 out of 42 rural hospitals (data were not available on theother 9) had negative operating margins. In other words, patientservice revenue did not cover operating expenses. On the average,patient service revenues for 28 ofthe 29 hospitals were 7.3 percentbelow operating expenses. (We excluded Mono General Hospitalbecause it had one-time revenue problems that gave it an extremely low operating margin.)
. Generally, this gap is made up with nonpatient revenue suchas district tax revenue (for district hospitals), private contributiotts, and county contributions(for county hospitals). Over time,operating shortfalls mean that the hospitals are unableto maintain the physical plant, replace equipment, and make· othercapital improvements. For some hospitals, it leads to closure. (Tenrural hospitals have closed during the last 13 years.)
The reasons for this financial distress appear to be:
• Difficulty in Covering Fixed Costs. Hospitals cannotcover their fixed costs due to low patient volume. Fixedcosts are those incurred by the hospital regardless ofhowmany patients they hav;e.
.• Costly Supplemental Services. Hospitals that areunable to cover their fixed costs may further contribute totheir financial distress by adding costly supplementalservices. This is in response to cOIllmunity demandsfor afull range. of services, and the hospitals'· attempts toattract and retain health professionals. For example,some hospitals purchase· sophisticated medical equipment, such as computerized tomography (CT) scalln~rs.
In some cases, however, these hospitals do not have thepatient volume to support such expenditures or sGrvices.
• Cash-Flow Problems. Rural hospitals have rtllativelysmall budgets that cannot easily absorb fluctuations in

270 I Part IV: Major Issues Facing the Legislature
Isolated·Communities and Sparse Services
Rural counties characteristically,have sparse services, andtheir communities .are relatively isolated. from one another interms of miles and physical terrain: Travel along a limitednetwork ofroads is made even more difficultby rain, fog, or snow.For example, winter conditions in Modoc County can close theroads into Cedarville, leaving that community isolated for days ata time.
Weak Economies
Rural counties generally have weaker economies than therest ofthe state. Economic growth in California has occurred inindustries that, for the most part, are not located in rural counties.For example, 'the statewide job growth rate during the 1980s was18 percent. Eighty percent of this growth occurred in the service(primarily business and. financial services), trade, and financeindustries. These sectors account for a very-small part of theeconomic activity in rural areas. The economic bl;ise in most ruralcounties includes manufacturing, agriculture, tourist ser-vices,mining,. and govern,ment. In. the past decade, manufacturingemployment grew by only 5 percent, employment in bothagriculture and miIiing actually fell, and government employmentincreased only modestly.
In a large nUIllber ofthe 25 rural counties, the'llnemploynlEmtrate andthe percentage ofthe population living below the povertylevel are higher than the statewide average.. Based on 1988Employmellt Development Department dfita, 23 ofthe 25 ruralcounties. had an unemployment. rate higher than the statewideaverage. In 1987-88, 17 of the 25 rural counties had highermonthly average AFDC caseloads per capita than the statewideaverage.
WHAT ARE THE CHARACTERISTICSOF RURAL HEALTH SERVICES?
Our review of rural health services is based on visits to 30facilities in16 counties; discussions with lcicai ptoviders: programadministrators, and otherinterested parties; and examination ofda.ta on rural health services. We discuss our findings below.
Inpatient Care
There are 51 hospitals in the 25 rural counties. All of thecounties except Alpine have at least one hospital. Distancesbetween hospitals can be as great as 100 miles.

272/ Part IV: Major Issues Facingt,.,eLegisllltU,.~
revenues. Theseflu:ctuationsare due to swings in gccupancy and delays in Medi~Caland Medicare reimbursements. These revenue fluctuations create cash-flow problems for many of these hospitals.
• High PersonneIC~sts.Rural hospitals are affe~tedbythe statewide nursingshortage. As a result, many ofthemhire "registry" nurses provided by personnel agencies ona temporary basis at a higher cost than permanent nursing staff.
• Difficulty Attracting Personnel. Hospitals have difficulty in attrElctinghealth professiona~sand administra
" tors clueto geographic)solatioI;l and llmitedresources to, Qffercompetitive wage~. WithQqt suffkient personnel, ahospi~al can lose patients and,' therefore, reyenue.
• Variations inAdministrativeEffectiveness. Hospitaladmiriistratorshav~varying levels of sophistication andknowledge of stateprogramswhich,in turn, determinethe extent to'which they are' successful in securing technical assistance andfUIlding;.Administrators also vary intheir ability to deal with regulatory and reimbursementrequ.irements,'as'well as the day-to-day operati6ii of the;hospital.
Emerg~mcy Medic~1 S~rvices
There are two components of emergency medical services:.pre-hospital emergency care and hospital emergency room care.Pre-hospital emergency care includes ambulance services andemergency medical personnel. Because of the. distances betweenhospitalsin ruralareas, pre-hospital emergency care is critical.
One of the primary funct~ons of the rural hospitals .. is toprovide emergency services. All rural hospitals have emergencyrooms where patients can be stabilized Brior to their transfedo afacility with comprehensive medical serv:ic~~.
The Availability o.fEmergencyVehi.clf!s and Their Staffing l{ary Am~ng the COU1J#f!s. In some counties,emergencyvehicles,aresta,ffed,with paramedics, who are, able to provideadval1ced ,life s1-1pport services. In. other counties, emergencyvehicles are staffed with emergency medical technician-lIs (EMTlIs), who can provide "limited" life support services, or E:MT~Il"!,
who can provide ''basic'' life support services only.' ',.
Outpatient Servic~s
Rural co~:rJ.tieshave high populahon-to-physician ratios. Theaverage ratio is 1,034 persons per physician in rural counties,

Health''Care"in Rural California / 273
with a range of 371 persons per physician in Inyo to 3,371 inGlenn. Byco~parison, the.ratio is 3~,~, inLos AIlgeles; 497 inSacramento,'~*d161 i~~o/tFrancisco:Accordingto the Office"ofStatewide Health Plaririingand Development's (OSHPD's) 1987
,CaliforniaE;tate HealthPllln, ~OoftherUralcb~ntiesdo not meetthe OSijPD's standard ofadequacy f()r primary care physicians,..,no more than 1,205 persons per ,primaIJ7 care physician. (Note:These ratios do not reflect the availability of other professionalswho practice in conjunction with physicians.)
Outpatient services are also provided by community clinics.As Figure 1 shows, there were 35 such clinics in16 ofthe 25 ruralcounties in 1985. Nine of the counties did nothave a clinic.
Certain Outpatient SerlJices A~e Difjic';'lt to Find. Access to specIalty services such as orthopedics and obstetrics oftenis particularly linlited.Fot example, duringourvisit to MendocinoCounty, we found that there are no practicing obstetricians
, providing prenatal services.. ,;
Access problems are even more difficult for Medi-Cal recipients. In Needles, for example, none of the three local physiciansaccept new Medi-Cal patients, nor does the hospital provideoutpatient services. In this case; a ilewMedi-Cal patient has totravellong distances to see a physician who accepts Medi-Cal.
WHAT PR()Gj=lAM$ CURRENTLY .AFFECT RURAL HEALTH SERVICES?
Figure 2 pr,ovides specific information'on state programs thataffect rural health services. Below we discuss some of theseprograms.
Department of He~Uth Services
Licensing and (Jertification~The Licensing and Certifica.. tion Division licenses health facilities Il,n,d,peIformscertification
reviews on behalfofthe federal government at facilities that seekto qualify for Medicare or Med:i.-Calf1i:ridi:ng.
'I ..,
In addition to its licensing and. certification functions, the,division conducts other programs that benefit rural facilities.Under the "swingbed" program, ruralhospitals with up to 50 bedsdesignate ,certain licensed general acute care beds that maY,beused as skilled nursing beds. For rural hospitals that have a lowac~te ,c::are .patient load, the,.program allows filling a bed thatwould·,have been empty otherwise. According to 1988 data, thestate has 202 designated swing beds located in 14 rural facilities.
The division has also had for many years the authority toallow facilities to use alternate approaches and techniques to

274 /Part IV: Major Issues Facing the Legislature
Figure 2
Department of ffealth ServicesLicensing and "swing bed" programcertification
Medical care 1. Provides reimbursement for medical'services services
2. Supplerilentaryrates for outpatientservices provided by rural hospitals
3. Distinct-part skilled nursing facility andswing bed reimbursement programs
Rural and 1. County Medical Services Programcommunityhealth
2. Other AS 75 provisions
3. Rural Health, Indian Health,Farmworker Health, and ClinicsPrograms
4. Hospital and medical standardsprogram
Family health Variousservices
Unknown amount for ruralareas
$4 million
Unknown amount for ruralareas
$60 million General Fund;$10 million from AS 75(Proposition 99) funds; $4million from ImmigrationReform and Control Act(IRCA) funds
Share of $82 million forcounty capital outlay; $7million for hospital .uncompensated care
$9 million General Fund;$23 million from IRCAfunds; share of $20 millionfrom AS 75
Unknown amount for ruralareas
Depends on amount ofexcess Cal-Mortgagereserves; not implementedyet
Office ofStatewide Health' Planning and Development
1. "Programflexibility"
2. Reviewof state regulations applicableto small and rural hospitals
3. Alternative Rural HospitalDemonstration Project
4. Health professions development
5. Song-SrownFamily Physician Trainin $2.9 millionProgram
6. Rural Hospital Grant Program

Health Care in Rural California /275
Financial support for rural regionalemergency medical services agencies
California Health Facilities Financing Authority
1. County Health Facilities RinancingAssistance Fund
2. Hospital Equipment Loan Program
3. Short~term .adjustable'rate taxablesecurities
4. Pilot program providing loans forcapital expenditures required by stateregulations
$10 million one-time funds
$3.9 million one-time funds
Not fixed--'Clepends on loanapplications; started 1989
Total 01$3 milliOn over fouryears; started 1989
meet statutoryrequiremen~sor regulations. Chapter 67, Statutesof 1988 CAB 1458,.Jones), transferred the responsibility for reviewing "program :Vexibility" requests bysIllall and rural h,ospi-tals to the OSHPD. .. . . .
Medi-Cal. Medi-Cal reimburses necessary health, care services provided to public assistance recipients and to other individuals who meet the program's income requirements. Medi-Calis an important source of revenue for many rural providers. Forexample, on average, Medi-Cal represents 17 percent of patientrevenues for the 42 rural hospitals for which data were available.Generally, Medi-Cal reimburses inpatient services in rUral hospitals based on facility-specific costs. Outpatientservices, includingphysician and clinical services, are reimbursedoh a fllit':rate fee-for-service basis. .
In addition to these general reim~ursements,the Medi-CalProgram has two provisions directed specifically towards iuralproviders. First, Medi-Cal currentlyprovides,sllpplementary ratesfor outpatient services provided by small arid rural hospitals.Chapter1476, Statutes of1987 CSB 1458, Keene), establil;lhed theprogram with a one-time appropriation of $4 IIiimon ($2 millionGeneral Fund). Each of the eligible hospitals ,received rate augmentations based on their share· of paid Qutpatient servicesclaims. This augmentation has been continued in later BudgetActs and the 1990 Budget Bill.
. In addition to hospital,physician, and ,clini,cal services, theMedi-Cal Program reimburses skillednursirig· services. Somerural hospitals have coilVerteda wing to a "distinct-part skillednursing facility" CPP/SNF). Because skilled nursing .pl;ltientsgenerally stay longer than. acute care patients, DP/SNFs provide

276/ Part IV: Major Issues Facing the Legislature
the hospital with a more stable patientbase. Other rural hospitalsparticipate in the swing bed progrllID. (discussed above).
Ruraland CommunityHealth. The Ruraland CommunityHealth (RCH) Division distributes funds to counties and localproviders through various prograIllS.
The Medically Indigent Services Program (MISP) funds counties to provide health care for indigents. Through the CountyMedical Services Program (CMSP), the state provides theseservices in counties with populations ofless than 300,000 (basedon the 1980 census) that Wish to participate. All but two (Lake andMendocino) ofthe 25 rural counties we identified for this analysisare partiCipants in the CMSP. Funding for theCMSP in 1989-90is $60.4 million from the General Fund. and $4 million fromImmigration Reform and ControlAct (IRCA) funds for services tonewly legalized persons.
The CMSPhas been expanded in the current year under Ch133l/89 (AB 75, Ise:n1:>erg), which implemented the Tobacco Taxand Health Protection Act of 19.88 (Proposition 99) and established a variety of programs. For 1989-90, AB 75 includes $10million to expand the scope of benefits covered under CMSP andreimburse health care providers in CMSP counties for emergencyservi'ces provided toout~of-county indigent patients. Some of
, these funds are being used to encourage innovative approaches toproviding rural health services, such as rotating dentists throughmulti-county.areas.
Assembly Bill 75 also includes $82 million for county capitaloutlay, a portion ofwhich will go to rural counties, and $7 millionto re!mbur~eCMSP counties and providers for uncompensatedcare.
'.. .'. The Rural Health, Indian, Health, Farmworker Health, andClinics Programsproyidegrants to counties, clinics, and otherproviders forseryj,cesto spec~al populations primarily in ruralareas. General Funq support. for these programs had remainedvirtually unchanged for the past five years at $9.5 million, withessentially the saine providers receiving grants each year. In thecurrent year, tQis furiding was reduced to $8.5 million due to theI.\vailabilityof'IRCA funds. In addition to receiving a share ofIRCA funds, rural clinics receive a share ofAB 75 funds.
In addition to distributing funds to counties and health careproviders, the. RCH Division provides technical assistance to~otintiE~sand facilities. Some ofthis assistance is provided byRCHstaff ill the cOllrseof administering the various grant programs.Chapter 1209, Statutes 9f 1985(SB 2549, Keene), required thedepartment to (1) establish a process for identifying stratemcally

Health Care in Rural California /277
located, high-risk rural hospitals and (2) provide expert technicalassistance forthose hospitals. Although this program, called theHospital and Medical Standards Program, provides technicalassistance to rural hospitals in distress, a specific listing ofstrategically located, high-risk rural hospitals has not yet beendeveloped.
Family Health. The Family Health Services Division addresses the special needs ofwomen and children through variousprograms. Although funds are not targeted specifically at ruralproviders, they provide a major source of funds. for many ruralcommunity clinics.
"Safety Net Policy." The Department of Health Services(DH$) established a "safety net" policy in 1988, under whichcounty facilities, providers serving a disproportionate· share ofMedi-Cal patients, community clinics, and other "safety net"providers have priority for obtaining financial and technicalassistance and flexibility in the application of licensing statutesand,regulations. Under this policy, a number of financially distressed rural facilities have been assisted by licensing and certification, Medi-Cal, and public health program staff.
Office of Statewide Health Planning and Development
Demonstration Projects. In addition to transferring responsibility for reviewing "program flexibility" requests from theDHS to the OSHPD, Ch 67/88 required the OSHPD to:
• Undertake a comprehensive evaluation ofsmall and ruralhospital licensing and building regulations.
• Adopt emergency regulations waiving or modifying unnecessary or unduly burdensome requirements for smalland rural hospitals.
• Report to the Legislature on whether or not alternativestandards for small and rural hospitals should be adoptedpermanently.
Pursuant to Chapter 67, the OSHPD is also designing analternative rural hospital model pilot project. The model wouldemphasize regulatory relief rather than increased reimbursement. Under this project, participatinghospitalswould be subjectto a different set ofstate requirements. For example, they wouldprovide five "core" services deemed minimally necessary to ensurebasic health services in rural areas. In addition, they wouldemploy a new health profession category. In connection withdeveloping the model, the OSHPD is reviewing licensing requirements that apply to small and rural hospitals.

278/ PartIV: Maj,,-r l~sI.JEJ~FaciTJg the Legislature
Hea,lth Professions DevelopTnf!nt. Th~ office administers. vari<;>ushel:l,lth occupat~onspilot projects, some, of which are
specifically oriented to addre!)s I1l,ral needs. For, exa:mple, 1980.pilot projects demonstrated that it was safe for ambulance drivers
"to. ,perfqr:r;nselect,ed m~dical l:l,ndnursing procedure~ on traumaand heart attack patients before they reached the hospital. Thisresulted in a 1981 statute recognizing emergency medical technicianIIs. Other pilot projects resulted in the recognition'ofnurse'practitioners andmlrse midwives} as well as regulations allowingappropriately,trained physician assistants to furnish and, dispellsedrugs. "
The office also administers programsdesigned to increase andiriiikov'e the recruitment and retention of health professionals.The largest program is the SO:l1g~BrdwnFamily Physician Training Program: In,the current year,the program has $2:9 million
.from the General Fund to supportthe training ofapproximiltely300 family physicia.ns, family' physician assistants; and familyn~rse pract~tiollers.TheSbng~Brownprogram is not specificallydesigne'dforrural areas. Rather, it helps rural areas to the extent
. ·"that itsupports th:etraining offamily practitioners~Based on ourvisits and 1987 OSHPD data, family practitioners provide most ofthe physician care in rural counties.
Facilities iJev~lJpment.'Theoffice ieviews health facilitiesconstruction projects to assure that they conform with federal,state,and Iocal building requirements, includirig seismic safetyrequirements:Facilities may seek"pr6gram flexibility" on building requirements from the office., - ,":.' ,.;' , '. ~. ,. ',' '
The office also administers the California Health FacilitiesConstruction Loan,Insurallce .(Cal-Mort~age),Progra:m, whichinsures facility loans. The program is funded by annual premiumspaid by insured health' facility projects. Under Qh 898/89 (SB1293, Maddy), any excess Cal-Mortgage reserve funds are available to support the Rural Hospital Grant Program. Small andruralhospital projects meeting specified criteria would be eligiblefor grants of up to $250,000 from this program, when, and if, itbecomes operational..
E'Jlergel1cy'M~dical'Services Authority
The Emergency Medical Services (EMS) Authority reviewslocal emergency medical services programs and establishes statewide standards for.·emergency personnel. The authority ,alsoadministers General Fund support for certain rural regional EMSagencies. The1989 Budget Act includes $1.2 millionfor five ruralregional EMS agencies.Each agency may receive up to one~halfofthe total cost ofoperating a minimal EMS system for that region,as defined by the authority.

Health Care in Rural California /279
California Health Facilities Financing Authority·
The California Health Facilities Financing Authority (CHFFA)issues reyenue bonds to assist nonprofit agencIes,. counties, andhospital districts in financing the construction and renovation ofhealth facilities. Because ofits ability to issue tax-exempt bonds,the CHFFA provides lower-cost financing to qualified institutionsthan they would be able to secure on the open market.
Inthe Pl;ist, some rural counties and providers have found ithard to take advantage of this source of funds due to their,difficulty in provi])g they can repay the bonds. In some cases, theCal-Mortgage Program has guaranteed repayment of coveredfacility loans in the event ofa default. In addition, the CHFFAhasinitiated several special programs targeted at county facilitiesand small and rural hospitals (detailed in Figure 2). The Legislature has also passed legislation toassist rural facilities in obtaining CHFFA funding. Through these efforts, rriany rural facilitieshave received limited financial assistance.
The Federal Government
In this section, we briefly highlight four federal programs andpolicies that affect rural health care: the Medicare Program, theNationalHealth ServiceCorps, the Rural Health Clinic Act, andthe Office of Rural Health Policy.
The Medicare Program. The Medicare Program isa major~evenue source for rural providers. Medicare represents, on the
. average, 34 percent ofpatient revenues for the 42 rural hospitalsfor which data were available. In 1983, Medicare established afixed payment schedule for hospitals based on a patient cla.,ssification system known as Diagnostic Related Groups (DRGs).Thissystefu assumes that, on average, actual costs will be covered byDRG reimbursement levels; However, low-volume providers(including most rural hospitals) face a higher degree of financialrisk than high-volume proViders because they see a relativelysmall number ofMedicare patients and they experience dramaticfluctuations in patient volume. As a result, their chances ofoffsetti:p.g high-cost cases with profits from low~r-cQst cases overa given time period are diminished. ..
Tn addition, rural hospitals receive a lower reimbursementrate for the same diagnosis than urban hospitals. Overall, averageMedicare payments to rural hospitals are 40 percent less thanthoseto urban hospitals. Rural providers and others have arguedthat this reimbursement differential does not reflect actual costsof providing. healthca.re in :J;Ural areas. In ,response to. this,Congress has taken steps to narrow· the differential. betweenurban and rural reimbursement rates.

280/ Part IV: Major Issues Facing the Legislature
Different reimbursement formulas apply to hospitals designated as Sole Community Hospitals (SCHs) or Rural ReferralCenters (RRCs). SCHs receive a partia.lly cost-based reimbursement rate and additiona.I payment protections. Currently, 40hospitals in California are designatedSCHs (not allofthem arerural). Being designated an SCH is not always an advantage,however; a hospital with relatively low costs may' get a higherlevel of reimbursemen.tunder the DRG system..
Hospitals qualifying as RRCs are reimbursed at the higherurban rate. However, in order to qualify, a facility must have atleast 275 beds. This requirement precludesrura.I facilities inCalifornia from obtainiIigRRC status, beca.use all have fewerthan 275 beds.
Medicare is currently administering a two"year Rural HealthCare Transition Grant Program to assist sma.II ruralhospitals inmodifying their services to adjust for changes'in service population, clinical practice patterns, ~nd other factors. Each hospitalmay receive a grant of up to $50,000 a year. Four Californiahospitals have received grants to date, three ofwhich are in ruralcounties. ' ,
For physician services, 'Medicare generally determines a"reasonable charge" and reimbl1rSe$ physicians 80 percent ofthisamount. To the extent that physlciims' charges' for thEl sameservices vary both across and within communities, Medicarereimbursements vary.
. National Hea.lth Service Corps (NHSC). The NHSC was,designed to provide .health personnel to designated health
',. manpOWer shortage areas. TI).e NHSC consists of two programs.The scholarship program pays tUitionformedica.I, dental, andother allied health students in return for a minimum two years of,service in a designated shortage area after completion oftraining.The second program provides up to $20,000 a Year to practitionersat the end of their trainingto pay offschool loans. In exchange,they commit to serve a minimum of twoyeais in a designatedshortage area.
Although the NHSC ha.s played a significant role in providingpersonnel to rural areas, this role has been declining dramaticallyin recent years because overall funding for the"prQgram hasdeclined, the scholarship program is being phased out, and theloan repayment program·is limited. '
.Rural Health Clinic Act (Public Law 95-~10). The RuralHealth Clinic Act of 1977 (Public Law 95-210) increa.sed theMedicare and Medicaid reimbursement rates for clinics thatprovide services in rural, medica.Ily tinderserved areas and employ

Health Care in Rural California /281
a nurse practitioner or physician assistant. Currently, there are47 designated "957210 clinics" in 39 medically underserved ruralareas in California. One obstacle to expanding the number ofdesignated clinics is the limited information about the program atboth the local and state levels. Apparently, the paperwork requiredfor qualification also discourages many clinics from pursuing thisoption.
Office ofRural Health Policy (ORHP). The ORHP wasestablished in 1988 to (1) advise the Department of Health andHuman Services (DHHS) on the effects that Medicare and Medicaid programs have on access to health care for rural populations;(2) coordinate rural health research within DHHS and administera grant program; (3) provide staff support to the National Advisory Committee on Rural Health, which was established in September 1988 to advise the Secretary of DHHS on rural healthissues; and (4) develop a national clearinghouse for the collectionand dissemination of rural health information.
The office maintains contact with state agencies on an "adhoc" basis.
Counties
Under Section 17000 of the Welfare and Institutions Code,counties are considered the "providers of last resort" for healthservices to indigent residents. The funds provided to countiesthrough the MISP, CMSP, and other state programs assist counties in meeting this obligation. Most state program funds allocated to counties may be distributed at county discretion. Urbancounties generally playa major role in providing health servicesto indigent persons. Although the level of involvement variesamong rural counties, most of them playa more limited role inhealth care service delivery.
WHAT ARE THE OUTSTANDING ISSUESIN CURRENT STATE PROGRAMS?
As described above, there are many governmental programsdesigned to improve access to health care services iIi rural areas.In the following discussion, we identify problems that limit theeffectiveness of these programs. We frame our discussion withinthe four main roles ofthe state: leadership, support, regulation,and reimbursement. .
Leadership Role
Our review indicates that there are several problems with theway the state currently implements existing programs.
13-80283

282/ Part IV: Major Issues Facing the Legislature
State Programs Are Not Coordinated. Current state programs intended to improve access to health servicesin ruralareasdo so in a piecemeal and fragmented fashion. As described above,there are several divisions within several state departments, allproviding services to rural areas. However, the various programsare not coordinated by a lead agency, thereby resultinginduplication of certain services and gaps in others. For example, thereare several programs that are aim~dat rural hospitals in distressbut no existing program providing ongoing funding for hospitals.Additionally, multiple definitions ofthe term"rural" contribute toinconsistencies in eligibility requirements between programs. Asa consequence, providers have difficulties determining whatprograms exist and whether they are eligible for assistance.
The State Provides LimitedAssistance. Providers cannottake full advantage of existing programs because, inaddition tothe lack of coordination and varying eligibility requirements,information regarding these programs is not readily available.From our field visits, we found that many rural health careproviders were not aware of state programs designed to assistthem. Currently, for example, although the RCH Division hasimplemented several programs for assisting rural clinics. andhospitals, it provides technical assistance primarily in response tospecific requests from facilities. Thus, facilities that are not awarethat technical assistance is available from RCH may go without it.Moreover, the state has not assisted providers by making available information on federal programs. For example, no agency hastaken an active role in assisting clinics to qualify for designationunder federal Public Law 95-210.
The State Has Not Provided Certain Key Central Services. Certain activities, such as designing data collection systems, evaluating services, and providing technical assistance, aremore efficient and effective ifcarried out centrally. However, thestate has not done this. For example,$tatewide evaluation of theadequacy of emergency medical services is very difficult becausethe state has not yet developed a uniform, standardized datacollectionsystem for the availability and utilization ofemergencymedical services. As· a result, although the local EMS agenciesmaintain some data, these data cannot be used to draw conclusions about the status of the state's EMS system.
The State CouldFoster More Innovation. Various departments are currently implementing innovative programs and policies to improve health care services in rural areas, such as theDHS "safety net" policy, the OSHPD's alternative rural hospitaldemonstration project, and AB 75 rural health projects. Of theseprograms, the OSHPD's alternative rural hospital demonstrationproject appears to be the most promising because of its potential

Health Care in Rural California /283
to permanently address some ofthe regulatory problems ofsmalland rural hospitals. The future ofAB 75projects,onthe otherhand, will be uncertain unless funding is extended at the end ofthe budget year. Despite these creative steps, there are manyother ways the state could help foster· innovation. For instance,the state could encourage the development ofthird-party billing,rotating specialists,:aIldrisk pools.
Support Role
Band-AidApproach to AssistingHospitals. State effortsto assist hospitals through routipe. or e;qlergency fUllding havebeen haphazard. The state has taken a ''band-aid" approach byproviding funding to hospitals on a reactive, eni~rgencybasis, asopposed to "stepping back" to assess such issues as whether thefacility is critical .. to health care· access and whether financialassistance isthe solution to the facility's. problem. For example,the Hospital and Medical Standards Program has not identifiedstrategically located, high-risk rural hospitals as required byCh 1209/88.
Problems. in Program Implementation. At tiIl,lel;l, program implementation limits the impact state assistance programs could have. on rural healthseryices. For exaIIlple, theclinics programs have continued to fund the same providers yearafter year without reexamining the need for the subsidy. Thereare also state programs that, for various reasons; have not beenimplemented, Forexample, the RCH Division never implementedthe California Health Services Corps, authorized in 1976. Thiswas because of limited funding and problems with the programdesign (that is,implementing the program· through state civilservice).
Some. Program llequirements Preclude P(l,rlicipationby Rural Providers. Rural facilities have difficultIes in obtaining funding under some programs due, in part, to specificprogramrequirements. For example, some loan programs sponsored by theCHFFA have minimum loan amount requirements that ruralfacilities cannot meet. AlthoughtheCHFFA has~taken steps toallow smalland rural hospitals to take. advantage ·ofcertain loanprograms, these programs are generally limited in scope.
RegulatoryRole,
I,.icensing Regulations Do Not Recogniz(# UniquJCharacteristics oflluralProviders. Current DHS licensing regulations make no distinction between. rural. and urban facilities.Given that rural facilities are a small percentage oftotal hospitalsin·California (the 51:rural hospitals in the 25 counties\ve exam-

284 / Part IV: Major Issues Facing the Legislature
ined account for only 10 percent ofCalifornia's generalacute carehospitals), regulations do not distinguish between urban andrural facilities. In some cases, these regulations may not addressthe circumstances in which rural providers find themselves. Forexample, by regulation, a general acute care hospital must include surgery as a basic service. However, sortle rural hospitalscannot economically equip and staff the number of operatingrooms required by regulations because of their low occupancyrate. In addition, the hospitals may have trouble recruitingqualified surgical staff.. One of the hospitals we visited hasoperatIng rooms that have not been used in years because it doesnot have. the required staff to perform surgery. The OSHPD iscurrently reviewing regulations that apply to small and ruralhospitals in view ofthis conflict.
Inconsistentlnterpretation ofRegulations. A number ofrural hospital administrators we interviewed cited inconsistentinterpretation and enforcement of regulations as a major problem. They also expressed frustration with the lack of assistanceprovided by inspectors in addressing regulatory problems. Wehave no basis for detel1llining how widespread these concerns are.Licensing and certification staff acknowledged, however, thatthere have been some problems. The department indicated it istaking steps to assure consistentinterpretation and enforcementof regulations.
Information Flow to Rural Providers Insufficient. Although there are a variety of programs designed to addressregulatory problems ofrural providers, we found that administrators are not always well informed ofstate regulatory changes, newlegislation, and special policies like "program flexibility;" Hospitals receive most of their information from organizations and associations, which require membership fees ofthousands of dollars. There is minimal information that comes directly from thestate.
Reimbursement Role
Reimbursement Procedures Are Complex and TechnicalAssistanceIs Limited. Reimbursement procedures for stateprograms"'-"-primarily Medi-Cal-eontinue to be complex and burdensome for some rural providers. Billing errors result in payment delays, which contribute to the cash-flow problems ofmanyrural providers. We found that many rural health care providersfelt they had no recourse at the state level to address billingproblems. They could not determine whom to call to resolvequestions or billing problems in a timely fashion.
Medi-Cal Reimbursements May Not Cover Current Costs.Although the Medi-Cal reimbursement rate for most rural provid-

Health Care in Rural California /285
ers is cost~based,payments to facilities may not cover the currentcosts for Medi-Cal patients. This is because oftwo reasons. First,the payment formula includes adjustments for previous years'disallowed claims. Second, facilities' actual costs may not becovered because the maximum inpatient reimbursement level(MIRL) caps Medi-Cal reimbursements. The MIRL caps the levelofincrease in a facility's reimbursement rate based on a complexfonnula involving case mix and other factors. While these adjustments may be justified, a rural hospital may not have sufficientreserves to cover shortfalls in payments.
HOW CAN THE LEGISLATURE IMPROVEDELIVERY OF RURAL HEALTH CARE SERVICES?
Our review indicates that rural areas share common characteristics. Generally, rural areas tend to be geographically isolated, sparsely populated, and have relatively weak economies.These areas also share common problems with respect to thedelivery ofhealth care services. Specifically, they have a limitednumber of health care providers, hospitals are financially distressed, emergency medical services and specialty care are limited, and it is difficult to attract health professionals.
There is a strong state interest, as shown by the plethora ofexisting programs, in maintaining and improving access to healthcare in rural areas. In order to address the problem areas described above, we believe there are several steps the Legislaturecan take to improve health service delivery in rural areas.
Major Legislative Decisions
As a first step to improving access to health care in ruralareas, the Legislature should. explicitly address the followingissues:
- RuralAreas and Rural Health Facilities. The existingvariationin definitions ofrural counties and areas andrural health facilities leads to confusing and overlappingcategories. The state needs to develop a statewide definition of rural areas and rural health facilities.
-Adequate Access to Health Services. The state needsto definethe minimum level ofhealth services it is willingto ensure in rural areas. Adequate access needs to bedefined in terms that take into account the isolation,weather, and road conditions that characterize ruralareas.
- Distinctions Among Rural providers. The state alsoneeds to determine ifall rural providers should be treated

286/ Part IV: Major Issues Facing the Legislature
equally. It may be that certain ruralproviders(for example, geographically isolated ones) should be given priority in state assistance programs.
• Fund.ing Commitment. Finally, the state must decidethe level of funding dedicated to rural health services.
Strengthen the. State's Leadership Role
We recommend that the Legislature designate a leadagency to coordinate the state's rural health programs.
The state needs to exercise a greater coordinating role toensure that existing and future programs improve health care inrural areas without duplicating services. Accordingly, we recommend thatthe Legislatur~designate alead agency to coordinatethese programs. The lead agency's mission should be to implement the major legislative decisions discussed above with respectto rural health care.
In addition, the lead agency shouldbe responsible for overseeing technicalassistance, coordinating state programs, providinginformation on rural health assistance programs, and rankingproviders for purposes of targeting state assistance programs.Specifically, the functions of the lead agency should include, butnot be limited to, the following:
• Provide Information on State and Federal ProgramsAvailable toAssistRuralProviders. For example, thelead agency could assist interested rural facilities inqualifying for programs that allow them to receive higherreimbursement rates or regulatory relief.
• Establish Standards for EMS Adequacy. To assureavailability and access to EMS services, the lead agencycould direct the EMS Authority to (1) establish standardsof adequacy for EMS services, (2) identify ~unmet" EMSneeds,· and (3) evaluate· alternatives to address theseneeds.
• Lead in the Development ofMore Efficient ServiceDelivery Mechanisms. In light ofthe shortage ofhealthprofessionals in rural areas and .the .. limited resourcesavailable to rural facilities, it is criticaLthat rural providers deliver services as efficiently as possible. The leadagency could identify better ways to make use ofexistingresources through such means as: the development ofcooperative ventures to purchase equipment, the rotationofpractitioners among counties, and the establishment ofa referral system among providers. In addition to the self-

Health Care in Rural California /287
insurance program for clinics currently supported by thestate, the lead agency could promote and support selfinsurance programs for other types of providers.
• Develop More Alternative Service Delivery Models.In addition to expanding the implementation of existingpilots, the lead agency could develop pilot models for othercomponents ofhealth care, like. rotating specialists or newlicensure categories.
Improve Support to Rural Health Care Providers
We recommend that the lead agency develop a systematic approach to assisting rural providers.
In order to address the diverse needs of rural providers, werecommend that the lead agency implement existing legislationby identifying strategically located, high-risk rural hospitals. Inaddition, we recommend the agency develop a similar system forranking other rural providers. This ranking would enable thestate to systematically target its assistance programs.
Review of Regulatory and Reimbursement Systems
We recommend that state agencies evaluate adjustments to the regulatory and reimbursement systems.
As discussed above, some regulatory and reimbursementprocedures and requirements do not take into account the uniquecharacteristics and needs ofrural health care providers. A reviewand adjustment ofexisting regulations could ease the burden forrural providers of complying with inapplicable regulations. Adjustments to existing reimbursement rates and procedures couldhelp relieve hospitals in financial distress. The OSHPD's reviewof regulations that apply to rural providers is illustrative of stateefforts to make adjustments in its regulatory system. Other stateefforts could include:
• A Review of Medi-Cal Regulations That Apply toRural Providers. Similar to what is currently beingdone by the OSHPD, Medi-Cal regulations could be reviewed to take into account existing problems and needsof rural providers. For example, rural hospitals withdistinct-part skilled nursing facilities (SNFs) could beexempt from the Medi-Cal patient transfer requirementsto freestanding SNFs. Distinct-part SNFs help ruralhospitals maintain a more stable revenue stream andoccupancy rate. This option would result innet costs to theMedi-Cal Program since Medi-Cal reimbursement ratesare higher for distinct-part SNFs than freestanding SNFs.

288/ Part IV: Major Issues Facing the Legislature
• Encouraging Providers to Use Centralized BillingServices. To reduce the burden of cumbersome billingprocedures, the state could encourage providers to useprivately operated billing services or even assist ruralproviders in establishing contracts with a centralizedbilling service. This option would bean efficient billingstrategy for rural providers at minimal cost to the state.Another option is for the state to expand technical assistance on billing matters. This would require additionalfunds.

Long-Term Health Care
What Issues Will the Legislature Face in Promoting AdequateAccess to Nursing Facility Services Over the Next Decade?
Long-term carein nursing facilities will continue to be one ofthe Legislature's major challenges· over the next decade. Theprimary issue before the Legislature is how it can promote accessto long-term care services in nursing facilities for the state's population. Our review indicates that the need for these serviceswillincrease in California due to a growing aged population and agrowing population with long-term disabling diseases like AIDS.Growth in the supply ofnursing facility beds is highly dependenton reimbursement policies of the Medi-Cal system, which provides about three-fifths of the revenues to the nursing facilitiesindustry. Should it decide to do so, the Legislature has a good

290/ Part IV: Major Issues Facing the Legislature
opportunity to make changes in the Medi-Cal rate-setting systemin 1990-91. This is because on October 1, 1990, new federalrequirements (resulting from the Omnibus Budget ReconciliationAct of 1987) that affect the Medi-Cal rate-setting methodologymust be implemented.
In this section, we provide a perspective on long-term careservices in nursing facilities. Specifically, we discuss (1) thestate's role in long-term health care delivery, (2) the characteristics of nursing facilities,(3) the economics of the nursing facilityindustrY,and (4) legislative options for proIllOtingadequate access to nursing facility services over the n.ext decade.
BACKGROUND
Long-term care refers. to various social, medical, and supportservices provided over an extended period of time to persons whodepend on others for care. These persons include those withchronic illness or disability. According to Section 9390.l(c) of theWelfare and Institutions Code, long-term care means:
...a coordinated continuum of preventive, diagnostic,therapeutic, rehabilitative, supportive, and maintenanceservices that address the health, social, and personalneeds of individuals who have restricted self-carecapabilities.
Long-term care may be provided by formal and informalsupport systems. The more visible long-term care providers-likenursing facilities· and residential care facilities-are part of formal support systems. Essentially, formal systems are those whichreceive payments for the services they provide. Services providedby family members, friends, and relatives are usually not paid,and are part of informal support systems.
Although long-term care has both health and social aspects,the following discussion will be limited to services that emphasizehealth, specifically nursing facility services, rather than socialservices. Hence, we will not cover social service models like inhome supportive services, residential care, foster care, and others.
WHAT IS THE STATE'S ROLE IN THE DELIVERYOF NURSING FACILITY SERVICES?
The state plays three main roles in the delivery of nursingfacility services: regulation, certification, and reimbursement.
RegUlation
The Department of Health Services (DHS) licenses nursingfacilities that operate in the state and ensures that the facilities

Long-Term Health Care /291
are' adhering to regulations. The regulations.cover such ite~s asstaffing,·medical records maintenance, and infection.control.
Nursing facilities also have to meet minimum earthquake,fire, and life safety standards established under state buildingstandards. To assure compliancewith these standards, the Officeof Statewide Health Planning and Development (OSHPD) reviews all plans for construction. These reviews take a few weeksto several months, depending on the quality of the plan and thesize of the· project.
The state also regulates nursing facility personnel. The DHScertifies nurse aides' compliance with state training requirements. Certified nurse aides (CNAs) are the primary caregivers inlong-term health clil"e.facilitie&. In addition,.the.Department ofConsumer Affair& licen&es nursing facility adm.in,istr~tors, nurses,and physicians. . . . .
Certification
All health facilities that seek funding under Title XVIII(Medicare) and Title XIX (Medi-Cal) must be certified by thefederal government. The DHS conducts the certification reviewsto evaluate the facilities' compliance with Medicare and Medi-Cal"conditioI),sofparticipation"oll behalfofthe federal government.Underth~GOmnibusBudget Reconciliation Act (OBRA) of1987,the DHSihaYconduct certification reviews only for non-stateoperated facilities. The federal government conducts certificationreviews for state hospita.ls and developm.ental centers.
Medi-Cal Reirtlbu.rsern~nt
The Californil:i. MedicalAssistance program (Medi-Cal) is ajoint federal-state program intended to assu.rethe provision ofnecessary health care servicesto public assistance recipients andto other individualswho cannot afford to pay for these servicesthemselves. Medi-Cal reimburses nursing facilities on a per diembasis. This reimbursement covers the services the facilities provide, such as nursing care, food, laundry, etc. Physician services,drugs, and acute care hospital services are reimbursed separately.
Medi-Cal is a major payor of nursing facility services in thestate. According to data from a one-day census· conducted inDecember 1988 by the OSHPD, Medi-Cal funded the stay of 62
. percent ofthe residents in nursing facilities in the state. The DRSestimatesthat Medi;;,Cal expenditures for nursing facility serviceswill be $1.9 billion in 1990-91. (This amount does not include therate increasesdue to the facilities startingAugust 1990.) Nursing

292/ Part IV: Major Issues Facing the Legislature
facility residents account for a disproportionately large share ofthe Medi-Cal budget relative to their numbers. They accourit for25 percent of the total Medi-Cal budget for health services and 2percent ofthe total Medi-Cal caseload.
Long-term care expenditures are not only a large portion ofthe Medi-Cal budget, they are growing rapidly, as is the budget asa whole.
Figure 1 shows Medi-Cal expenditures for long-term careservices over the past decade.
Medi-Cal Long-Term Expendituresand Expenditures for All Services
1980-81 through 1990-91All Funds (dollars in billions)
$8
7
6
5
4
3
2
• LTC expenditures
• All other expenditures
80-81 81-82 82,83 83-84 84-85 85-86 86-87 87-88 88-89 89-90 90-91(est.)(prop0)8
a The budget does not reflect the cost of long-term increasesthat will be effective August 1990.
WHO PROVIDES LONG-TERM HEALTHCARE SERVICES IN CALIFORNIA?
Long-term health care services are available in various settings, ranging from institutions to the client's home. Nursingfacilities, however, provide a majority oflong-term health care.Nursing facilities include skilled nursing facilities and intermediate care facilities; According to 1988 OSHPD data, about 72

Long-Term Health Care /293
percent of the residents in these facilities are aged 75 and over.Nursing facilities admit 76 percent ofth.eirresidents fromho~pitals. From there they go home (23 percent), go to the hospital (40percent), or die (23 percent). (No discharge data are available onthe remaining 14 percent of residents.) Seventy-one percent ofthose admitted stay at these facilities. for six months or less.
·In this section, we describethe.variouscateg()ries offormallong-term health care services. First, we describe 24-hour carefacilities, the main providers oflong-term care. Figure 2 summarizes these services and shows the number ofbeds licensed undereach category. We then describe certain community-based services, which provide alternatives to 24-hour care.
Skilled Nursing Facilities (SNFs)
SNFs provide "continuous skilled nursing and supportivecare to patients with primary need of skilled nursing services onan extended basis." Licensing regulations require SNFs to provide an average of at least three nursing hours per patient-day.Typical SNF patients include those who are incontinent, in needof tube feedings or wound dressings, and have other conditionsthat require 24-hour observation and constant availability ofskilled nursing services. There are two general classifications ofSNFs: "freestanding" and hospital-based.
Fre~stdndingSNFs.· .... A.s the name implies,· freestandingSNFs are those which are not attached to a hospital from alicensing perspective. According to the OSHPD, 91 percent ofthestate's skilled nursing beds in 1988 were located in freestandingSNFs. During that year, there were 1,137 freestanding SNFs inthe state, representing a total ofl04,185 licensed beds. These facilitieshad a 90 percent occupancy rate.
In order to accommodate the skillednursing needs ofmentallyill individuals, the state developed a category known as skillednursing facility / special treatment programs (SNF/STPs).Theseare freestanding facilities that provide programs designed to rneetspecial treatment needs ofmentally ill individuals. Instead oftheminimum requirement of three nursing hours per patient-day,SNF/STPs are only required to provide 2.3 nursing hours perpatient-day in addition to the staffing requirements ofthe specialtreatment program. SNF/STPs account for an additional :4,295freestanding SNF beds.
Hospital-Based SNFs. Hospital-based skilled nursing services may be provided through distinct-part skilled nursing facilities (DP / SNFs) or swing beds. The DP/SNFs are those which arelocated in an identifiable area of an acute hospital with a set

294IPart IV:Majorlssues.Facing the Legislature
Registered nurse(RN) or licensedvocational nurse
. (LVN) on duty 24hours, 7 days perweek, average 3nursing hours perclient~day
SNF/special Continuous 24-hour RN orLVN on 41 4,295treatment nursing care for duty 24 hOLJrs, 7pr~rams mentally ill clients days per. week,(S' F/STP) average 2.3
nursing hourS perclient-day, piusSTP staffing
Distinct-part SameasSNF Same as SNF 131 7,061(excluding state.irli;titution~) .
Swing bed Same as SNF ~ameasSNF 14" 202
INTERMEDIATE CARE FACILITIES (ICFs)
Freestandin~ Intermittent 24-hbur RN orLVN on 140 3)96nursing care duty 8 hours per
day, 7 days perweek, average1.1nursing hourSperclient~day
Distinct-part Same as free- Same as free- 3 25(excluding state standing ICF standing ICFinstitutions)
ICFforthe Intermittent 24-hour RN o~ LVN on 33 2,7~0developmentally nursing care for DD ,duty8 hoursperdisabled (ICF/DD) clients '. day; 7 days per
week, average2.7 nursing hoursper client-day
Distinct-~art rCF/ Same as ICF/DD Same as leF/DD 49DD (exc uding stateinstitutions) .
numberofbeds licensedfor SNF services. Although most hospitalbased SNF services are delivered in DP/SNFs, some hospitals thatdo not have DP/SNFs may provide these services through swingbeds. Small and rural hospitals located in areas with a shortage

Long-Term Health Care /295
Figure 2 CONTINUED
ICF/DD-habilitative Intermittent Qualified mental 329 2,450habilitative and retardationnursing care for 4 professionals 1.5to 15 DD clients hours per c1ient-
week; direct carehours vary from 4to 8.5 per c1ient-day
ICF/DD-nursing Intermittent Direct care hours _b _b
developmental and vary from 5 to 7nursing care for 4 hours per client-to 15 DD clients dayb
STATE INSTITUTIONS
Distinct-part SNF Same as free- Same as free- 10 2,911standing SNF standing SNF
Distinct-part ICF Same as free- Same as free- 5 3,686standing ICF standing ICF
Distinct-part Same as ICF/DD Same as ICF/DD 7 5,263ICF/DD
CONGREGATE LIVING HEALTH FACILITY
Congregate livingt)ealth facility
Continuous orintermittent nursingcare for up to 6clients; residentialsetting
RN or LVN 24hours, 7 days perweek, average 8to 12 nursinghours per clientdayb
5 49
a As 01 December 31, 1988.b The Departmenfol Health Services has not yet developed permanent regulations.
of skilled nursing beds and a surplus of acute care beds maydesignate a certain number oftheir acute beds to "swing" to skilled
•nursing when the need arises. There were 7,061 DP/SNF beds inthe state (excluding state institutions) and 202 swing beds in1988, according to OSHPD statistics.
Intermediate Care Facilities (ICFs)
ICFs provide "inpatient care to clients who need skillednursing supervision and supportive care needs but do not requirecontinuous nursing care." Thus, ICF services differ from SNFservices in that ICFs provide intermittent, instead ofcontinuous,

?96 / Part IV: Majoilssues Facing the Legislature
nursing care. The state requires ICFs to provide an average ofatleast 1.1 nursinghours perpatient-day. The needs ofthe residents·in ICFs are typically less than those in SNFs.
ICFs may be freestanding or a distinct-part (DPIICF) of ahospital or a SNF. In 1988 there were 9,796freestanding and 25DPIICF beds (excluding state institutions) in the state,with ~99percent occupancy rate.
The state also licenses ICFs in one of three other categories.
ICFs for the Developmentally Disabled (ICFfDDs). Thesefacilities provide 24-hour care, habilitation, developmental, andsupport health services to developmentally disabled residentswhose primary need is for developmental services and who havea recurring, but intermittent,need for skilled nursing services. Inaddition to intermittent nursing care, ICFIDD services illclude adevelopmental program. On the average, these facilities provideat least 2.7 nursing hours per client-day. Patients in these facilities 'typically ~eed specialized developmental and training services. In 1988there were 2,730 freestanding and 49 DPIICFIDDbeds (excluding state institutions).
ICFs for the Developmentally Disabled-Habilitative (ICFfDD-Hs). These facilities provide habilitation, developmental,and supportive health services to 15 or fewer developmentally disabled persons who have intermittent recurring needs for nursing·servicesbut do not require continuous skilled nursingcare. Thesefacilities also provide active treatment programs. Minimum direct-care staffing requirements vary from four hours per clientday for facilities with four clients to 8.5 hours per client-day forfacilities with 15 clients. The residents in thesefacilities typicallyhave two or more developmental disabilities. Clients with seriousaggressive or selfinjurious behavior or serious nursing needs arenot accepted in ICFIDD-Hs.
ICFs for the Developmentally Disabled-Nursing (ICFfDD-Ns). This is the most recently establishedICF category.These facilities provide 24-hour personal care, developmentalservices, and nursing superVision to 15 or fewer developmentallydisabled persons who haveintermittent recurring needs for nursing services but do not require continuous skilled nursing care.Minimum direct-care staffing requirements varyfrom five hoursto seven hourS per client-day. Typical ICFIDD-N residents includethose who have two or more developmental disabilities and a needfor nursing· services, such as colostomy care or gastrostomyfeeding,on an intermittent basis.

tong-Term Health Care /297
State Institutions
State hospitals and developmental centers provide both SNFandICF services. In1988, 11 institutions had a totalof2,911 SNF,3,686 ICF, and 5,263 ICFIDD beds. They had an average occupancy rate of 84 percent. All 11 state institutions are licensed asacute hospitals because they have acutemedical/surgical wards.
Congregate Living Health Facilities (CLHFs)
CLHFs provide services to six or fewer residents who needskilled nursing care on a. recurring, intermittent, extended, orcontinuous basis. These facilities are distinct from the SNFs andICFs in that each CLHF must specialize in serving ventilatordependent, terminally ill, or catastrophically or severely disabledpersons. Presumably,the level ofcare provided by CLHFs is moreintense than an SNF but less intense than an acute care hospital.However, Ch 1393/89 (AB 68, Polanco) redefined this category,and the DHS has not yet developed regulations in response tothese statutory changes.
Community-Based Long-Term Care
All the above services are provided in around-the-clOck facilities. There. are other types oflong-term care providers, however,servingas alternatives to 24-hour facilities. Most ofthese alternatives are "community-based," which· mean.s that they provideservices to clients who live in their homes. These communitybased alternatives evolved in recognition that some clients canavoid, or at least delay, nursing facility admission if alternativesare available.
Adult Day Health Centers (ADHCs).ADHCs provide analternative to institutionalization for older impaired persons orthose with functional impairments who are capable of living athome with the help of health care Qr. rehabilitative or socialservices. ADHC services include planned recreational and socialactivities and rehabilitation, medical, nursing, nutrition, psychiatric or psychological, social work, and transportation services.According to the DHS, there are currently 63 licensed ADHCs. inthe state.
Home Health Agencies (HHAs). HRAs also fill the skillednursjng needs ofthose who wish to remain in the commuJ;lity butcannotgo toADHCs. Inaddition to skillednursing services, HRAsmay provide physical, speech, or occupational therapy; medicalsocial services; and home health aide services. There are currently449 licensed HRAs in the state. However, the DHS advises thatthis number may increase dramatically in the next year because

298 /Part IV: Major Issues Facing the Legislature
ofthe HHA licensing requirement revisions under Ch 856/89 (AB2266, Connelly). Under Chapter856, additional HHAs are subjectto licensure.
Licensing and Reimbursement Categories
The services discussed above are licensed by theDHS. Virtually all ofthem are also Medi-Cal reimbursement categories. Theonly exception is the CLHF, which is currently not considered aMedi-Cal benefit. Other differences include institutions for mental diseases (IMDs) and hospice services, both ofwhich are MediCal reimbursement categories but are not licensing categories.IMDs are SNF/STPs that have been designated as IMDs by thefederal Health Care Financing Administration. Federal law prohibits Medi-Cal from reimbursing for IMD services provided tobeneficiaries between the ages of21 and 65. Hospice services arenursing, medical, and counseling services provided to terminallyill clients. Hospice servicesmay be provided by hospitals, nursingfacilities, HHAs, or other providers certified to provide hospiceservices by Medicare.
WHAT FACTORS AFFECT THE DEMANDFOR NURSING FACILITY BEDS?
There are three major factors affecting demand for nursingfacility beds. Two of these involve· the users of nursing facilityservices, while the other deals with the availability of otheralternatives.
With regard to the users, the need for long-term health careservices is measured by a person's dependence o.n· others inperforming activities of daily living (ADL) and the frequency ofrequired medical and nursing attention. Activities of daily livinginclude bathing, dressing, using the toilet, getting in or out of abed or chair, continence, and eating. Two groups ofpeople tend tohave high ADL dependencies and require higher frequencies ofmedical and nursing services: the elderly and people with longterm impairments.
The Elderly
The most obvious and the greatest source of demand is theelderly population. This is primarily because more chronic problems set in as people grow older. lIenee, the bigger the elderlypopulation, the higher the demand for long-term care services.
Statistics show that the state's elderly population has beengrowingrapidly and this growth is projected to continue over thenext decade. According to Department of Finance (DOF) estimates, the state's 75-and-older population (which accounts for

Long-Term Health Care /299
•almost three-fourths ofthe nursing facilities population) was 1.3million in 1988,anincrease of300,000 persons, or 32 percentsince1980. The DOF projects that the 75-and-older population willgrow to 1.8 million by 2000, an increase of 520,000 persons (42percent).
The elderly population has grown and is projected to growfaster than the state's population as a whole. The 75-and~0Ider
group constituted 4 percent of the total population in 1980, 4.5percent in 1988, and the DOF projects that the figure will reach5.4 percent in 2000.
People With Long-Term Impairments
.The other group of people who have high ADL dependenciesand require frequent medical and nursing attention are thosewith long-term impairments. These clients may be younger. Theyinclude; people in advanced stages of AIDS and Alzheimer'sdisease', among others. An increasing population of people withthese and other chronic diseases, combined with improvements inmedical techpology to prolong life, will increase the demand fornursing facility services.
Availability of Alternatives
The other factor that affects demand for 24-hour nursingfacility services is the availability of community-based alternatives. As we have noted in an earlier analysis ofstate programs forolder Californians (please see The 1989-90Budget: Perspectivesand Issues,page 279), the availability of formal communitybased alternatives may be a factor in explaining why Californiahas a relatively low institutionalization rate among the state'seldfarly population. Only 2.8 percent of the state's 65-and-olderpopulation.resided in nursing facilities in December 1988, compared to 5 percent nationwide. We note, however, that whilecommunity-based alternatives delay institutional placement inmany cases, theydo not totally eliminate the need for institutionallon~-termcare services.
WHAT FACTORS AFFECT ;THESUPPLY OF NURSING FACILITY BEDS?
IntJ:1Emursing facility industry, 84 percent ofthe facilities are.investor-owned. Consequently, as in any private market, the mostimportant factor affecting the supply of nursing facility beds isprofitability, TheOSHPD reports profitability data on nursingfacilities. That information indicates that, based on statewiderate-of-return figures, the industry has experienced very lowlevels of profitability. Unfortunately, the OSHPD data haveserious shortcomings (for example, it is unaudited data and

300 I Part IV: Major Issues Facing the Legislature
presented in a way that makes it difficult to assess the financialhealth of the company providing the nursing facility services).Consequently, we are unable to draw conclusions from the OSHPDdata about the profitability of the industry.
The key factors affecting profitability are the costs the industry faces in providing nursi:q.g care services and the source ofrevenues (or reimbursements) to facilities.
Industry CostsThe industry incurs two types of costs: entry costs and
operating costs. The industry's entry costs are affected by thedirect costs ofconstruction and construction delays resulting fromextended regulatory reviews, plus uncertainties associated withregulatory processes, includingzoning. Entry costs have beenreduced somewhat since 1987, when certificate-of-need requirements were eliminated. Previously, health facility constructioncould notproceed until the OSHPD certified that the facility wasneeded.
The industry's operating costs are mainly a function oflaborcosts, its biggest operating cost component. In fact, according tothe OSHPD, labor costs for nursing services alone account for 45percent of operating expenses in nursing facilities.
Industry RevenuesThere are two primary sources.ofnursing facility revenues in
the state. The first, and by far the larger ofthe two, is Medi-Cal.As discussed earlier, Medi-Cal covers about 60 percent ofnursingfacility residents. The other is private sources, which cover about30 percent of nursing facility residents. Medicare, the Veteran'sAdministration, Lifecare, private insurance, andothers covel' theremainder. The combined influence ofthe two main payor sourcesdrives the revenue picture of the industry.
Medi-Cql Reimbursement Methodology_ Medi-Cal. currently reimburses nursingfacility costs on a prospective, flat-ratebasis. The DHS classifies nursing facilities into certain peergroups based on their category (SNF, DP/SNF, ICF, state hospital), size, and geographic location and annually sets each group'srate at the adjusted median cost of the facilities in that group.
For example, to set the reimbursement rate of peer group A,which has 75 facilities, Medi-Cal would array the adjusted costsof the 75 facilities from lowest to highest. The adj'usted costs foreach facility are derived from cost report data submitted by thefacility, adjusted to reflect disallowed costs (based on audits of asample ofall facilities) and inflationary factors. The adjusted costof the 38th (median) facility, say $60.00 per, day, would be the

Long-Term Health Care / 301
Medi-Cal reimbursement for the 75 facilities in that group, regardless of the amount each facility actually spends.
Under this reimbursement system, profitability of a givenfacility depends on many factors:
• The relationship of that facility's adjusted costs to themedian adjusted costs (by. definition, Medi-Cal reimburses about half ofthe facilities in a given peer groupabove their adjusted costs and the other half at or belowtheir adjusted costs).
• The relationship of actual cost increases to the inflationary adjustments used in rate development (for example, afacility may not have provided staffsalary increases in theamount assumed in the inflation adjustment).
• The mix of patients by type of patient (a facility with agreater proportion of "heavy-care" patients will. have amore difficult time making ends meet than a facility witha lighter-care caseload due to staffing requirements).
Figure 3 shows the average Medi-Cal reimbursement ratesfor various nursing facility categories for the prior and current
... years. It shows that the reimbursement rate for freestanding
Figure 3
Freestanding or distinct-part ICF
ICF or distinct-part ICF for thedevelopmentally disabled (ICF/DD)
ICF/DD-habilitative
ICF/DD-nursing .
UISllnct-mm ICF/D[) (st~te institution)
Congregate living health facility
a These facilities are ~ot eligible for Medi-Cal reimbursement.
38.62
59.42
78.45
44.22
66.16
91.83
116.01
NN

302/ Part IV: Major Issues Facing the Legislature
SNFs (which account for the vastmajority ofbeds) is $60 per day.By comparison, the rates for hO$pital-based SNFs are two andthree times as much.
Comparison of Costs and Revenues
According to 1988 OSHPD data, freestanding nursing facilities spent an average of$57.35 daily (for anpatients-Medi-Cal,private-pay, etc.) on nursing serviGes, while. Medi-Cal paid anaverage ofonly $48.32 daily. Although these averages imply thatfacilities which accept Medi-Cal clients operate at a loss, a 1987study by the Auditor General on the state's Medi-Cal reimbursement system showed that the industry earned 11 positive marginon about two-thirds of the Medi~Cal patient-days in 1985. Thestudy indicates that Medi-Cal patients tend to be concentrated infacilities that earn a positive margin on Medi-Calpatients. Thissuggests that these facilities are either more efficient (that is,lower-cost) than the average or provide fewer services than theaverage.
Private sources also funded a large portion ofnursing facilityservices. On the average, reimbursements from private sourcesare higher than Medi-Cal reimbursements and average facilitycosts. While Medi-Cal paid only $4R32 per day to cover nursingservices costs of$57.35 per day, private sources paid an averl;lgeof $71.23 per day. I(private-payand Medi.~Cal pat~entshllVesimilar needs and receive.. similar services, then thehigh,ertheratio·ofprivate~payresidents afacilityhas,Jhe greatettheprofit.margin. .
WHAT ISSUES WILL THE LEGISLATUREFACE OVER THE NEXT DECADE?
In this section, we discuss issues that the Legislature willlikely face over the next decade.
Nursing Facility Bed Supply
The adequacy of the state's nursing facility bed supply willdepend on the interaction of the factors discussed above. It tsdifficult to project the actual supply and demand dynamics overthe next decade because ofthe lack ofreliable data. However, thecommon perception is that the nursing bed supply has been, andis expected to remain, extremely tight. This appears to have beenthe case throughout the early 1980s, when statewide occupancyrates reached 94 percent.
Since that time, occupancy rates have declined, dropping toabout 90 percent in 1988. OSHPD data suggest that this declinewas a result ofno growthin total patient-days in combination with

Long-Term Health Care/303
an increase in the number ofbeds (between 1980 and 1988, about20,000 beds were added to supply). One factor in this lack ofgrowth in patient-days may have been increased availability ofcommunity-based alternatives. Despite the decline in the statewide occupancy rate, regional shortages may exist.
State agency projections ofthe number ofnew nursing facilitybeds needed by the year 2000 range from almost34,000 (OSHPD,1989) to almost 51,000 (Health and Welfare Agency, 1988). Giventhese demand estimates (especially at the high end), and theactual increase in bed supply between 1980 and 1988 (20,000), itis possible that the state could face a shortage ofbeds by the year2000. We note, however, that certificate-of-need requirementsthatregulated health facility construction in the state until 1987may have limited the growth of bed supply during most of the1980-through-1988 period.
Access to Nursing Facility Beds for Medi-Cal Clients
The current Medi-Cal reimbursement system may be a barrierto access to nursing facility beds for Medi-Cal clients. Nursingfacilities tend to favor private-pay and Medicare patients overMedi-Cal clients because of their higher reimbursement rates.Hence, Medi-Cal clients have more difficulty in finding a bed thanthese other two groups.
Access problems may even be more acute for heavy-care MediCal clients. Heavy-care patients generally have nasal gastrictubes or decubiti (bed sores), or are incontinent or ventilatordependent. Because Medi-Cal's flat-rate reimbursement systemdoes not recognize various levels ofcare, facilities prefer to acceptlighter-care patients as their care is less costly. Heavy-car~clientsusually remain in hospitals until Medi-Cal staff or the hospital'sdischarge planning staff arrange nursing facility placements.
There are no readily available data that quantifY Medi-Calclients' access problems. However, two factors suggest that theseproblems exist.
Relative Decline in Medi-Cal Share of Clients. First,Medi-Cal clients make up a diminishing proportion ofthe population in nursing facilities. In a 1980 on~-daycensus, 71 percent ofnursing facility clients were Medi-Cal clients. By 1988, thisnumberhad decreased to 62 percent. On the one hand, this declinecould mean that more Medi-Cal clients are using communitybased alternatives instead of entering a nursing facility. On theother hand, it could suggest that nursing facilities are fillingwhatever increase inbed supply there was during this period withprivately sponsored patients. We believe that the decline was aresult ofa combination of the two factors. While more Medi-Cal
304/ Part IV: Major Issues Facing the Legislature
clients may be taking advantage of community-based alternatives, the disparity in reimbursement rates between Medi-Caland private sources in a predominantly for-profit industry suggests that there are significant incentives for nursing facilities tofavor privately sponsored clients over Medi-Cal clients. The studyby the Auditor General corroborated this hypothesis when itfound that hospital discharge planners ranked Medi-Cal clientsas considerably harder to place than privately sponsored clients.
High Use ofAdministrative Days. The second factor thatsuggests access problems for Medi-Cal clients is the state's highutilization of acute "administrative days." Clients are placed on"administrative status" when they stay in a facility that providesa higher level of care than the client needs. Generally, Medi-Calplaces clients on administrative status in acute care hospitalswhen the client is awaiting nursing facility placement. In 198889, Medi-Cal authorized 84,000 administrative days (the equivalent of about 230 beds). These stays vary from a few days tomonths, depending on how difficult it is to place a client.
To address this problem, the DHS established a "subacute" reimbursement category under Medi-Cal. The subacute level ofcareis more intensive than skilled nursing care but not as intensive ashospital acute care. To date, only a few providers have participated in this program. The most frequently cited reason for thislow participation rate is that the criteria for determining whethera fa.cility can receive a subacute rate for a particular patient weretoo narrowly defined. The DHS has taken steps to revise thesecriteria. .
Perverse Incentives in the Medi-Cal Reimbursement System
The current Medi-Cal long-term care rate reimbursementsystem offers perverse incentives to providers. In this section, wediscuss some of the effects of the system on patient care, access,and costs.
In his 1987 study, the Auditor General found that Medi-Cal'sprospective flat-rate reimbursement system, while effective atcontrolling costs, has several weaknesses. The system is a goodcost control mechanism in that it encourages nursing facilities tospend below the reimbursement rate: the system rewards operators who run their facilities efficiently. However, a flat-ratesystem also rewards operators who provide minimal patient careand penalizes operators who provide additional. services. Therates have no direct relationship to the level of service actuallyprovided.

Long-Term Health Care / 305
An example of the effects of the current flat-rate reimbursement system is demonstrated by the rate differential between DP/SNFs and freestanding SNFs. As Figure 3 shows, there is a widedisparity in reimbursement rates between DP/SNFs and freestanding SNFs. The average DP/SNF reimbursement in thecurrent year is $147 per patient-day, while the average reimbursement rate for freestanding facilities is $60.
The rate differential is associated with two problems. First,the higher rates result in significantly higher Medi-Cal costs,without any requirement for a greater level of services. Thedifferential in rates reflects differences in costs of operating thetwo c types of facilities. On the average, in DP/SNFs patientsreceive a higher level of services and staff receive higher wagesthan in freestanding SNFs. However, DP/SNFs are subject to thesame regulations as freestanding SNFs; they do not have toprovide any additional services or to accept heavier-care patientsto justify receiving a higher rate.
Second, this disparity in reimbursement rates is a problembecause it provides an incentive for freestanding SNFs to becomeDP/SNFs by licensing in association with an acute care hospital.(We note that until recently, Medi-Cal trIed to control DP/SNFutilization through a policy to approve DP/SNF stays only whena client could not be placed in freestanding facilities within ac~rtainradius or travel time. Medi-Cal recently suspended thispolicy in response to a suit challenging this transfer policy.)
Without changes in the Medi-Cal reimbursement system,these problems will likely continue, and perhaps get worse, in thefuture.
WHAT OPTIONS DOES THE LEGISLATURE HAVETO PROMOTE ADEQUATE ACCESS TO NURSINGFACILITY SERVICES OVER THE NEXT DECADE?
The Legislature has several options to address the issuesdiscussed in the earlier section. The Legislature could promoteadequacy ofnursing facility beds by either reducing demand and!or increasing supply. In this section, we provide a brief overviewofsome ofthe alternatives available to the Legislature to promoteadequate access to nursing facility beds over the next decade.
Changes in the Medi-Cal Reimbursement System
The current Medi-Cal reimbursement system is primarilydesigned to control costs. It is not designed to ensure an adequatesupply ofMedi-Cal beds. In addition, the current reimbursementsystem (1) does not relate the level ofreimbursements to the level

306/ Part IV: Major Issues Facing the Legislature
ofservices facilities provide, (2) may contribute to access problemsfor Medi-Cal clients, and (3) creates incentives for building themore expensive distinct-part facilities.
The Auditor General study identified three alternatives to thecurrent reimbursement system: a case-mix system, an outcomeoriented system, and a facility-specific system.
A case-mix reimbursement system sets reimbursement ratesbased on the level of services required by each patient. Anoutcome-oriented reimbursement system ties the rates to certain"outcomes," or quality of care. A facility-specific system, on theother hand, reimburses a facility based onits own costs, not on themedian of its peer group. Ofthe three, the study recommendedthat the state adopt a facility-specific system. The study alsorecommended a supplementary rate for heavy-care Medi-Calclients. The facility-specific system would tie reimbursementmore directly to the facility's spending and provide more nursingfacility bed access to heavy-care clients. A similar system isproposed by SB 1087 (Mello), which was in conference committeeat the time this analysis was prepared.
The actual cost of such a system would depend on how it isstructured. However, the system could cost significantly morethan the current flat-rate system because (1) facilities would haveincentives to spend moreon care, (2) facilities would have incentives to classify clients as heavy-care in order to receive the higherreimbursement rate, and (3) this system is more complicated and,therefore, more difficult to administer.
The Legislature has a good opportunity to effect major changesin the reimbursement methodology in the budget year, should itdecide to do so. This is because effective October 1, 1990, theOmnibus Budget Reconciliation Act (OBRA)of 1987 requires aconsolidation ofthe SNF and ICF reimbursement categories intoone. As Figure 3 shows, average SNF and ICF rates currentlydiffer by about $16 daily. Under the OBRA, ICF staffing andphysical plant standards would be upgraded to the SNF level.These new standards would require the DHS to make changes inits rate-setting system, as SNF and ICF rates are currentlydevised separately. These changes could vary from minor adjustments to an overhaul of the. whole system. The Legislature hasdemonstrated interest in changing the whole system through theadvancement ofSB 1087. The Medi-Cal reimbursementmethodology eventually adopted in conjunction with the OBRA-mandated changes will have a significant influence on the supply of,and access to, nursing facility beds in the state over the nextdecade.

Long-Term Health Care / 307
Expand Community-Based Programs
In order to reduce demand for nursing facilities, the Legislature also could expand community-based alternatives to avoid orat least delay entry into nursing facilities. For example, theLegislature has encouraged such expansion in the past by providing "start-up" grants of $50,000 for each new adult day healthcenter. We note that community-based programs are not necessarily less expensive than nursing facility services. However, tothe extent that they prevent or delay institutionalization, theyhelp reduce the pressure on nursing facility bed supply.
Expand the Availability of Long-Term Care Insurance
Another option for increasing bed supply is to expand theavailability of long-term care insurance, thereby increasing theproportion ofpatients who are funded from non-Medi-Cal sources.Currently, private funding comes primarily from clients' ownsavings and other resources. Many privately funded clients become eligible for Medi-Cal within a matter of months afterenteringa facility because the high cost ofnursing facility servicesdepletes their resources. According to a 1987 report by the Houseof Representatives Select Committee on Aging, 47 percent ofsingle Californians age 65 and older who live alone are at risk ofimpoverishment after 13 weeks of nursing facility stay. A longterm care insurance program would be effective only to the extentthat (1) it covers the target population and (2) the premiums areaffordable. Hence, financing ofsuch a programbecomes an important issue. The extent of the state's involvement in an insuranceprogram is a policy decision that the Legislature would have tomake if it chooses to pursue this option further.

308/ Part IV: Major Issues Facing the Legislature

Proposition 99: An Update
What Is the Status of Proposition 99 Implementation?
In November 1988, thevoters approved Proposition 99, theTobacco Tax and Health Protection Act, which established asurtax of 25 cents PElr package on cigarettes and an equivalentamount on all other tobacco products sold in California. Proposition 99 provides a major new funding source-over $550 millionannually-for health services, health education, and resourcesprograms.
In this analysis, we (1) provide background on the provisionsofProposition 99 andthe Legislature's actions in implementing it;(2) review the 1990-91 budget proposal for Proposition 99 funds;

310/ Part IV: Major Issues Facing the Legislature
(3) provide a status report on programs established by AB 75 (Ch1331189, Isenberg), which allocated 90 percent of Proposition 99funds; and (4) identify outstanding issues facing the Legislaturein 1990 regarding Proposition 99.
BACKGROUND
Proposition 99 required that revenues from the surtax bedeposited in the Cigarette and Tobacco Products Surtax Fund(C&T Fund) establish~dby the act, and allocated specified percentages ofthe fund to six accounts. The act further requir~dthatrevenues allocatedto the six accounts be expended for specifiedpurposes. Figure 1 identifies the six accourits,the percent ofsurtax revenues allocated to each, and the specified purposes foreach account.
Figure 1
Health Education 20 Prevention and reduction of tobacco use,primarily among children, through schooland community health education programs
Hospital Services 35 To pay hospitals for the treatment of pa-tients who cannot afford to pay, and forwhompayment will not be made through privatecoverage or federally funded programs
Physician Services 10 To pay physicians for medical care servicesprovided to patients who cannot afford to pay,and for whom payment will not be madethrough private coverage or federallyfunded programs
Public Resources 5 To be equally divided between programs that(1) protect, restore, enhance, or maintainfish, waterfowl, and other wildlife habitatareas and (2) improve state and local parkland recreation resources
Research 5 To fund tobacco-related disease research
Unallocated 25 May be used for any of the specificpurposes described above

Proposition 99: An Update /311
The surtax went into effect on January 1, 1989. However,none ofthe revenues raised in the lasthalfof1988-89 (almost $330million) wer~ spent in 1988-89.
During 1989 the Legislature took the following actions toprovide for the expenditure of Proposition 99 funds:
• AssemblyBill 75 allocated revenu~sfrom 1988-89,198990, and 1990-91 from the Unallocated, Physician Services, Hospital Services, and Health Educ~tionAccounts.
The act appropriated $1.2 billion ($703 million for expenditure in 1989-90 and $510 million for expenditure in1990-91) to establish a variety of new health programsand expand existing programs.
• The 1989 Budget Act allocated funds available in theResearch Account and the Public· Resources Account tovarious programs. The Budget Act also allocated$25.3 million from the Unallocated Account.
• Chapter 1168, Statutes of1989 (AB 60, Isenberg), established the California Major Medical Insurance Program and transferred $250,000 from the UnallocatedAccountto begin developing rules and regulations and tocarry out other activiti~s necessary to implement theprogram. Chapter 1168 also specifies that the programshall be funded by transferring $30 million first frominterest accrued on unspent funds and, ifnecessary, fromthe unspent balances in the Hospital Services, PhysicianServices, and Unallocated Accounts. Chapter 1168 alsocontinuously appropriates $30 million annually from theUnallocated Account, beginning in 1991-92, to fund theprogram.
BUDGET OVERVIEW
Overall, the budget proposes expenditures of $630 million, areduction of $182 million, or 22 percent, from the current year.The proposed reduction results primarily from the artificiallyhigh current-year total, which included one-time funds carriedover from 1988-89.
Figure 2 displays the distribution of Proposition 99 funds in1989-90 and proposed for 1990-91. The Governor's Budget andBudget Summary contain detailed schedules for the individualaccounts.
In the following sections, we discuss in greater detail therevenue outlook and outline the spending plan for Proposition 99funds proposed in the budget.
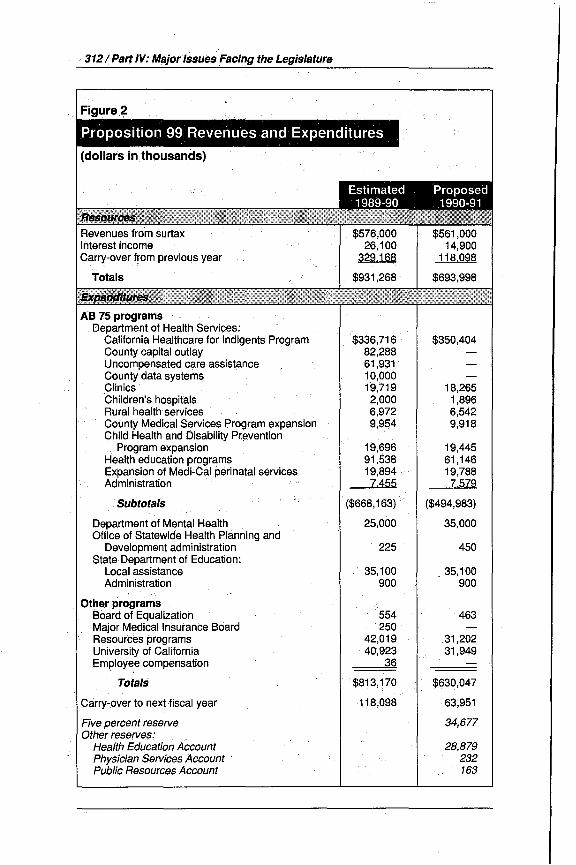
312/ PartlV: Major IssuesFacing the Legislature
AS 75 programsDepartment of Health Services:
California Healthcare for Indigents ProgramCounty capital outlayUncompensated care assistanceCounty data systemsClinicsChildren's hospitalsRural health servicesCounty Medical Services Program expansionChild Health and Disability Pr~vention
Program expansionHealth education programsExpansion of Medi~Cal perinatalservicesAdministration
.Subtotals
Department of Mental HealthOffice of Statewide Health Planning and
Development administrationState Department of Education:
Local assistanceAdministration
Other programsBoard of EqualizationMajor Medical Insurance BoardResources programsUniversity of CaliforniaEmployee compensation
Totals
Carry-over to next fiscal year
Five percent reserveOther reserves: . .
Health Education AccountPhysician Services Account· .Public Resources Account
$336,71682,28861,93110,00019,7192,0006,9729,954
19,69691,53819,8947.455
($668,163)
25,000
225
35,100900
554250
42,01940,923
36
$813,170
118,098
$350,404
18,2651,8966,5429,918
19,44561,14619,7887,579
($494,983)
35,000
450
35,100900
463
31,20231,949
$630,047
63,951
34,677
28,879232163

Proposition 99: An Update /313
Revenue Outlook
Surtax Revenues. The budget estimates that surtax revenues will total $576 million for the current year. This representsa reduction of $27 million, or 4.5 percent, below the amountprojected last May. Revenues are lower than anticipated becauseper-capita cigarette sales have diminished more quickly thananticipated since imposition of the surtax in January 1989.(Revenue from the sale of cigarettes accounts for more than 95percent of surtax revenue.) .
Data provided by the State Board of Equalization indicatethat per-capita cigarette sales fell by 11 percent in 1988-89. Thebudget's revenue estimate for the current year is based on adecre.ase of 6.8 percent for 1989-90. These figur('ls.represent asubstantially.sharper rate ofdecline than the 3.6 percentaverageannual decrease· that occurred over th~ period from 1982-83 •through 1987-88. Theprimary reason for these large declines in '"smoking is the effect of the price increases associated with theimposition of the surtax.
The budget estimates that surtax revenue for 1990-91 willtotal $561 million, based on a projected decline of 4.5 percent inper-capita cigarette sales. The projected decline in smoking for1990-91 is less than the declines in the past year and the currentyear because the one-time effect of the surtax price increases onpeople's behavior will have passed. Nevertheless, the 4.5 percentdecline in smoking assumed in the budget estimate still represents a greater rate ofdecline than the pre-surtax annual declinerate of 3.6 percent. The major reasons for the anticipated fasterdecline in smoking include increased educational efforts toreducesmoking and additional restrictions on smoking in public placesand work areas. (Because the budget expects population growthto partially offset reduced per-capita sales, the projection forsurtax revenues of$561 million represents a decrease ofonly 2.6percent for 1990-91.)
Over the longer term, surtax revenues are expected to gradually diminish. Based on the Department ofFinance's estimates forcurrent-year revenue, its projections for population growth, andassuming that the decline in per~capitacigarette sales it expectsfor 1990-91 continues at the same rate, we estimate surtaxrevenues would be on the order of $500 million in 1994-95 (a 12percent reduction).
Interest Income. The budget reflects interest income of$439,000 in 1988-89, $26;1 million in the current year, and$14.9 million in 1990-91. Actual interest income on surtax revenues was much higher in 1988-89 ($4.7 million) than the $439,000
14-80283

314 I Part IV: Major Issues Facing the Legislature
reflected in the budget. However, the General Fund received$4.3 million of the interest earnings because the administrativeactions necessary for theC&TFund subaccounts to retain interest earnings did not occur until July 1989.
Comparison to AB 75 Revenue Assumptions. The spending plan includedin AB 75 assumed that available revenues forthe three-year period 1988-89 through 1990-91 would total $1.5billion ($294 million in 1988-89, $603 million in 1989-90, and$572.9 million in 1990-91), all from surtax collections. TheAB 75spending plan did not reflect any interest income.
The current projection ofsurtax revenues for the three-yearperiod is about $4 million less-actual revenues of$329 millionin 1988-89 and projected revenues of$576 million in 1989-90 and$561 million in 1990-91. The significant redllctions in: anticipated current-year and 1990-91 surtax revenuesdueto decliningconsumption are offset by an increase of$35 niillionin 1988-89collections above the amount anticipated. This increase was dueto a one-time accrual adjustment.
The budget's estimate oftotal revenues available in the threeyear period is $37 million above the amount anticipated when theLegislature enacted AB 75. This is the net effect of (1) interestincome of $41 million, offset by the reduction of $4 million insurtax revenue.
Expenditures
Figure 2 (above) displays the budget's spending plan forProposition 99 funds for 1989-90 and 1990-91.
Assembly Bill 75 Programs. Assembly Bill 75 establishedthe spending plan for funds in the Health Services, PhysicianServices, Health Education, and Unallocated Accounts for boththe current and budget years. (Below we describe the implementation of programs supported by these funds.) The 1990 BudgetBill includes funds for administration in the· Office of StatewideHealth Planning and Development, the Department of HealthServices (DHS), State Department of Education, and countyboards of education. The Governor's Budget proposes augmentations of $10 million for local mental health programs and$34.6 million for the California Healthcare for Indigents Program (CHIP) in the DHS.
Public Resources Programs. The 1989 Budget Act appropriated $42 million from the Public Resources Account for avariety ofone-time projects and some continuing support costs invarious state agencies. The 1990 Budget Bill proposes$31.2 million for similar purposes. The proposed allocation ofPublic Resources Account funds in the 1990 Budget Bill is consis-

·. Proposition 99: An.Updatel315
tent with the Proposition 99 requirement that 50 percent of thefunds be allocatedto wildlife habitatl:!nd 50 percentto state andlocal park and recreation resources. .
Research Programs. The 1989 Budget Act appropriated$42.6 million from the Research Account to expand the cancerregistry in the DHS and support research at the University ofCalifornia. The 1990 Budget Bill proposes $31.9 million to continue these expenditures.
Reserves. The budget proposesca.rrying over into 1991-92 a5 percent reserve in all accounts plus $29.3 million in additionalreserves. Of these additional reserves, $28.9 IIlillion are in theHealth Education Account.
STATUS REPORT ON.. AB. 75PROGFlAMS
B~lbwwedescribeeach program established by AB 75 andprovidea status report. Generally, the threeagencies involved aremaking ~ood progress in implementing AB 75.
California Healthcare for Indigents Program (CHIP)
, . Assembly Bill 75 appropriated $336.7 millionin 1989-90 and$315.8 million in 1990-91 to support the CHIP. In addition, the1990 Budget Bill proposes an au~entationof$34.6 million forthe program. Assembly Bill 75 reqUires that CHIP funds bedistributed to countiesoperating MISPs based on specified per-
c; ,centa,ge shares. The department reports that itis impleIIlentingthe, program and that approximately one-half (or about$170 million) of:fundsapprQpriated for the current year havebeen distributed. Th.e department released guidelines forexpenditureofprogram funds to counties iI) December 1989;.
The Hospital Services Account funds ($200 million in 1989-90and $188.8 million inJ990-91) are to be divided into county
.hospital andnoncounty hospital portions within each countybased on each group's .share of uncompensated care costs. Thecounty hospital portion may be used for county hospital 'servicesor noncounty hospital services, as determined by the county. Fiftypercent ,of the noncounty hospital portion are to be' allocateddirectly to those hospitals based onuncompensa,ted care data. Theremaining50 percent is available to maintain access to emergencycare and to purchase other necessary hospital services for medi-cally indigent persons. .
The Physiqian$ervicesAccount funds ($41.1 million. in 198990 i .and $38Amillion in 1990-91) will pay for unreimbursedphysician services. Counties must use at least. 50 percent of theay~ilablefund,s to payfor unreimbursed emergency services. The

·3161Part IV: Major Issues Facing the Legislature
measure caps these reimbursements at 50 percent of thephysician's losses. Counties may use the remaining funds to payfor new contracts with physicians to provide emergency, obstetric,and pediatric services in noncounty facilities where service accessis limited. .
The Unallocated Account funds ($95.3 million in 1989-90and $88.7 million in 1990-91) are available at the county's discretion to provide health services for patients unable to pay andservices that are not covered by private insurance or by fully orpartially federal-funded programs.
County Capital Outlay
The act allocated. $82.3 million in 1989-90 to fund capitaloutlay at county health facilities. Ninety percent ofthe availablefunds goes to Medically Indigent Services Program (MISP) counties; the remaining 10 percent goes to County Medical ServicesProgram (CMSP) counties. The act permits countie.s to use aportion of their allocations to replenish specified reserve funds.
The DHS reports that expenditure applications and guidelines currently are being developed but that no funds. have yetbeen distributed.
Uncompensated Care Assistance
The act provided $37 million in 1989-90 for uncompensatedcare at county and noncounty hospitals, to be allocated to hospitals based On financial data reported to the Office of StatewideHealth Planning and Development (OSHPD). In addition,AB 75allocated $24.9 million in 1989-90 to MISP counties for uncompensated physician services. Counties must use at least 50 percent oftheir allocation for unreimbursed emergency services. Themeasure caps these reimbursements at 50 percent of the physi.cian's losses. Up to 50 percent of each county's allocation may beused for new contracts with private physicians to provid~ emergency, obstetric, and pediatric services in noncounty facilitieswhere s~rvice access is limited.
The DHS and the OSHPD report that all funds for uncompensated care assistance have been distributed.
County Data Systems
The act allocated $10 million in 1989-90 to develop andimplement county medically indigent care reporting systems. Toreceive funding, counties must submit applications to theDHS.The department reports thatit is currently developing criteria fordistributing the funds. The department indicates it plans todisburse all funds on May 1.

Proposition 99: An Update /317
Clinics
The measure appropriated $19.7 million in 1989~90and $18.3million in 1990-91 for medical services and preventive services,including smoking prevention and cessation health education,rendered by primary care clinics to persons with incomes at orbelow 200 percent of the federal poverty level. Clinics servingmedically underserved areas or populations have priority forfunds. Up to $10 million of the 1989-90 funds may support cliniccapital outlay grants.
The department reports that all staffbudgeted to implementthe program in the current year have been hired. The departmenthas issued requests for application tocounties for funds appropriated by the act. However, no funds have yet been distributed.
Children's Hospitals
Assembly Bill 75 appropriated $2 million in 1989-90 and $1.9million in 1990-91 for distribution to seven children's hospitalsbased on their share of the uncompensated.care. costs of allchildren's hospitals in the state. The department has issuedapplications to the hospitals for their use in requesting currentyear funds, and expects to disburse the funds in February.
Rural Health Services
Assembly Bill 75 provided $7 million in 1989-90· and $6.5million in 1990-91 for services in CMSP counties. Funds from theHospital Services Account are to be distributed to hospitals basedon their share of the county's uncompensated care costs. Fundsfrom the Physician Services Account are to support unreimbursedmedically necessary emergency, obstetric, and pediatric physician services. Funds from the Unallocated Account are to supportexpanded emergency medical transportation and public healthservices.
The departmenthas setup claimingprocedures and is holdingworkshops to assist providers in claiming additional funds. Thedepartment indicates it will begin distributing these funds inearly February.
County Medical Services Program (CMSP) Expansion
The act allocated $10 million in 1989-90 and $9.9 million in1990-91 to expand the scope of services under CMSP and tocompensate hospitals and other emergency providers for emergency services rendered to out-of-county indigent patients. Thedepartment reports that in both 1989-90 and 1990-91,itis using$5 million of the funds to expand services (particularly dental

318/ Part IV: Major Issues Facing the Legislature
services) covered under the CMSP and the remaining $5 millionto reimburse providers for out-of-county care.The expanded scopeofservices tookeffect January 1,1990. The department has set upclaiming procedures for out-of~county care. costs and is holdingworkshops to assist providers in clliiriling these funds.
ChildHealth and DisabilityPrevention (CHOP) Program Expansion
The act allocated $19.7 million in 1989-90 and $19.4 millionin 1990-91. to extend CHDP Program ,eligibility .to additionalchildren. This program provides medical examinations to children. The actalso adds an anti-tobacco education component inthe CHDP medical examin,ation.
The department reports that it has (1) hired five of the sixpositions provided for program implementation, (2) developeditsrevised pIal]. requirements for county plans and provider billing,and (3) received revised plans for some counties requesting.Proposition 99 funds. The department also reports that it iswo:rking with local nonprofit agencies to determine how theseagencies can provide smoking education materials to local healthdepartments in order to prevent the departments from having todevelop duplicative materials. .
Health Education Programs
Oversight, Data, Analysis. The act.created the TobaccoEducati6nOversight Committeeto advise the DHS and the StateDepartment ofEducation on C&T-funded tobacco education programs. The act requires the coInmittee to develop a comprehensive master plan for statewide tobacco education programs. Tofurid the committee's expenses, the act appropriated $2.3 millionin 1989-90.
The DHS reports that it has selected a contractor to conducta baseline survey that will be used to evaluate the effectiveness ofthe ed~cationprograms:· .
Media Campaign. The act provided $14.3 million inboth1989-90 and 1990-91 for a public information campaign. Themeasure specifies that programs directed at children ages 6 to 14have priority for funding and that the media used for the campaigns shall be effective in reaching this target population. Thedepartment reports that it will begin contract negotiations inFebruary.
Competitive Grants. The act provided. $41.6 million in1989-90 and $1l.4 million in 1990-91 for a grant program administeredby the DHS to fund health education and promotion

Proposition 99: An Update /319
activities designed to reduce tobacco use and tobacco-relateddiseases among target groups. The act allows nonprofit organizations, including school districts, to receive grants under thisprogram for efforts to reduce tobaccouse. In school districts, thesemust be nonclassroom, district-wide programS. The departmentindicates it intends to issue requests for proposals by March, butit does not expect to encumber these funds until June.
High-Risk Programs. The act appropriated $35.6 million in1989-90 and $35.4 million in 1990-91 for allocation to designatedlocal lead agencies for tobacco use prevention and reductionprograms for high-risk population groups. To receivefunds, locallead agencies must submit local program plans to the DHS forreview and approval.
The department reports that it has issued guidelines requiredby the act and has begun holding workshops to assist counties indeveloping their plans.
School Programs. The act provided $32.6 million in 198990 and another $32.6 million in 1990-91 for a grants programadministered by the State Department ofEducation (SDE) to fundhealth education and tobacco information activities designed toreduce tobacco use among school children. (This annual amountdoes not include $2.5 million for local assistance to county boardsofeducation provided in the 1989 Budget Act and proposed in the1990 Budget Bill.) The SDE has indicated that these fundswhich it expects to allocate to districts in February-will be usedfor both program planning and program implementation purposes.
Assembly Bill 75 also directed the SDE to prepare guidelineson the use ofthese funds that require districts to select one or moremodel program designs. The SDE issued guidelines in November1989; however, the guidelines do not require the use of modelprograms. This situation may have resulted because ofthe SDE'sinability to fill several staffpositions. TheSDE indicates that oncethese positions are filled, it will proceed to develop a list ofmodelprogram designs. Itis unclear whether the SDE intends to revisethese guidelines to (1) make the use ofthese models mandatoryas envisioned by the legislation:-ar (2) otherwise include reference to these models when district plans are reviewed by countyoffices of education.
Expansion of Medi-Cal Perinatal Services
Assembly Bill 75 allocated $19.9 million in 1989-90 and $19.8million in 1990-91 to extend coverage for perinatal services underthe Medi-Cal Program to pregnant women with family incomesbetween 185 percent and 200 percent ofthe federal poverty level

320/ Part IV: Major Issu~sFacing the Legislature
and their infants up to one year ofage. The act required the DHSto conduct outreach activities to increaseparticipation and accessto these services.
The department reports that it implemented expanded eligibility for pregnancy-related services beginning October 1,1989.The department's plan to use C&T funds for perinatal outreachhas two components. First, it plans to use ftlIlds appropriated byAB75 to permit ~ountiesto station eligibilityworkers at locationsother than welfare offices. Second, the department is developinga request for proposals to hire a public relations contractor to (1)develop a campaign to encourage providers to participate in MediCal and (2) develop and i~plement a statewide campaign toinform women about Medi-Cal coverage ofperinatal services andto encourage them to receive early prenatal care.
Mental·Health
The act appropriated $25 million in 1990-91 for local mentalhealth servic~s. In addition, the 1990 Budget Bill proposes anaugmentation of $10 million for this purpose. The 1989 BudgetActincluded a $25 million appropriation fromthe C&T Fund formental health services in 1989-90. In the current year,$12.5 million was allocated to counties on the basis of the poverty/population formula and $12.5 million was allocated to counties as a cost-of-living adjustment. Assembly Bill 75 does notspecify how the funds will be allocated in 1990-91.
OUTSTANDING ISSUES
Assembly Bill 75 Will Sunset in June 1991
Assembly Bill 75 sunsets in June 1991. Consequently, theLegislature faces decisions regarding how to allocate Proposition99 funds from the four accounts affected by AB 75 beginning in1991-92. One option is to use the funds to provide health coverageto uninsured Californians. Both the Governor and legislativeleaders have expressed their intent to develop legislation implementing sucha program.
Proposed BUdget Augmentations CompeteWith Health Insurance Program for Interest Funds
As indicated earlier, the amount offunds currently projectedto b~ available for expenditure in 1989-90 and 1990-91 exceeds by$37.2 million the amount anticipated when the Legislatureenacted AB 75, due to the net effect of reductions in surtaxrevenues and accounting for interest income.

Proposition 99: An Update /321
The Governor's Budget projects that as a result of thesechanges, $30.5 million in additional funds will beavailable in thefour accounts affected by AB 75. The Governor's Budget alsoidentifies an additional $14.1 million available as a resultof(1)spending $12.3 million that was not allocated byAB 75 (that is,reducing the carry-over reserve) and (2) reducing anticipatedfundiIlg for administration. Thus, the budget identifies a total of$44.6 million in additional funds available for expenditure in thefour accounts affected..by AB 75. .
The budget proposes to use these monies to fund augmentatiOIis to local mental health programs ($10 million) and the CHIP($34.6 million). The budget does not propose to fund the MajorMedical Insurance Program established by Ch 1168/89 (AB 60,Isenberg). Chapter 1168 specified that the program should befunded first by transferring $30 million from aCcrued interest
. earnings and, if necessary, from unspent balances in the Physician Services, Hospital Services, and Unallocated Accounts.However, the act did not explicitly require a transfer of interestearnings to occur in 1988-89,1989-90, or 1990-91. Beginning in1991-92, the act requires the transfer of $30 million annuallyfrom the Unallocated Account to the Major Medical InsuranceFund for the purpose of funding the program.
Accordingly, the Legislature faces some choices. It mustdecide whether it will fund the Major Medical Insurance Programat the intended level, agree to the augmentations proposed by theGovernor, or use the funds available for different purposes entirely.
No Ju~tification Submitted for Department Support Funding
The budget proposes $7.4 million from various accounts oftheC&T Fund for support costs in the departments associated withimplementing AB 75. Of this amount, the budget proposes$5.9 million for the DHS, $900,000 for the SDE, and $450,000 forthe OSHPD.
At the time we prepared our analysis, the DHS and theOSHPD had not submitted justification for their proposed support expenditures. Specifically, the departments had not provided(1) fiscal details of their proposals, (2) information on activitiesproposed, or (3) estimated workload. Therefore, we have withheldrecommendation on the budget proposals until the departmentssubmit the necessary information. (Please see Items 4140 and4260 in the Analysis of the 1990-91 Budget Bill.)

322/ Part IV: Major Issues Facing the Legislature
Allocation Method Not Specifiedfor Mental Health and CHIP Funds
The budget proposes an augmentation of$1 0 million from theC&T Fund for these mental health programs. This brings totalC&T funding for local programs to $35 million for 1990-91.However, AB 75 does not specifY and the Department of MentalHealth has not specified how these funds would be allocated tocounties. Similarly, the budget proposes an additional$34.6 million for the CHIP. Assembly Bill 75 does not specifY andthe DHS has not specified how these funds will be allocated.(Please see Items 4260 and 4440 in the Analysis for additionaldiscussion oftheseissues.)
Concerns Over Clinics Program Implementation
In the process of implementing AB 75, the department hasestablished a statewide uniform reimbursement rate for outpatient visits ($65) and case management services ($6.50). It hasalso issued a request for application (RFA) to over 500 clinics inlateDecember. The RFA consists of two parts: part I for fundingexpanded services and part II for funding clinic modernization orcapacity expansion.
We are concerned that the implementation activities currently underway by the department may reduce program effectiveness. Specifically:
• The department has not established specific fundingpriorities.
• The department has not provided any documentationsupporting the statewide uniform rates it has developed.
• The RFA specifies that a clinic may only receive as muchin modernization or capacity expansion funds as it receives in expanded services funds. This precludes clinicsfrom submitting proposals that would expand access butdo not comply with this criterion.
(Please see Item 4260 in the Analysis for further discussion ofthis issue.)

.VariatiorJs In County Fiscal Capacity
Howand Why Does Fiscal Capacity Vary Among the State'sCounties? What Options Does the Legislature Have forImproving It? _ '
324/Part IV: Major Issues Facing the Legislature
In September 1989, Butte County officials announced thatthe county could not balance its 1989-90 budget, and thereforeplanned to· seek bankruptcy protection in federal court. Whilesubsequent state relief and budgetary reductions by the countyallowed it to finance projected 1989-90 expenditures, these actions did not provide a long-term solution to the county's fiscaldilemma. Butte County officials currently are projecting an $8million." deficit for 1990-9L (Please see o'llr recent Policy BriefCount:Y'Fiscal Distress: A Look at Butte County for more informa-tion.)· ..
While it is tem.pting to isolate Butte County as a lone exampleofa California county in fiscal straits, our analysis indicates thatmany other counties are experiencing serious fiscal difficulties.Furthermore, our review indicates that this is not merely a ruralcounty problem.
The state has a clear interest in maintaining the fiscalviability ofcounty governments. They are the entities which serveall Californians through programs of statewide interest (such ashealth, corrections, and welfare programs). In addition, theyprovide to residents ofunincorporated areas suchlocal services assheriffand library services. In this piece, we,examine countyfiscalcapacity-the ability of counties to respond to these needs.
First, we describe the county-state relationship and discussour framework for identifyingvariations incounty.fiscal capacity.Second, we provide our findings regarding the fiscal capacity ofcounties, and discuss some of the counties· which rate belowaverage in this regard. Third, we identify the primary factors thatcontribute to low fiscal capacity. Finally, we offer several alternatives.that the Legislature may wish to use to improve the fiscalcapacity ofCalifornia's counties.
BACKGROUND: A FRAMEWORK FORCOMPARING COUNTY FISCAL CAPACITY
For the purposes of this analysis, we define county fiscal capacity broadly asthe ability of a county to meet whatever publicservice needs may arise in its comrn.unity withthe resources it hasavailable to it. Low fiscal capacity leads to fiscal distress when theimbalance between resources and responsibilities leads the countyto have severe difficulty addressing service ne,eds.
The Dual Role of Counties
COUIlties in California play adualrole in providing services totheir residents. First, counties are charged with the responsibilityto administer avariety ofprograms required by state law. These

Variations In County Fiscal Capacity! 325
state-required programs include welfare (such as Aid to Familieswith Dependent Children-AFDC-and general assistance),county health services, In-Home Supportive Services (IHSS),community mental health, corrections and the trial courts. Second, the counties administer a variety of local programs. Theseinclude some programs ofstate interest, such as public health andsocial services, and others ofprimarily local import, such as themunicipal-type services provided to residents of unincorporatedareas (for example, fire and sheriff services).
The state provides substantial funding for many, but not all,ofits required programs. Inmany cases, specific county contributions are also required. Such programs include AFDC, countyhealth services, community mental health, IHSSand the trialcourts. The counties bear the primary fiscal responsibility forother state-required programs, because the state in these casesdoes not provide funding specifically for these purposes. Suchprograms include general relief, probation, indigent legal defense, and corrections.
County Revenue Sources
Counties pay for their share of state-required program costsand for local programs out ofthe revenue they have available forgeneral county purposes. County general purpose revenue (GPR)comes from a variety ofsources, including the property tax, stategeneral purpose subventions (such as vehicle license fees), andthe sales.tax. Due to the constraints imposed by Proposition 13,counties have very limited power to increase GPR. For example,counties cannot increase their property tax rate, and must getvoter approvalto iilcreaseother taxes.
As service demands or costs grow over time, state-requiredprograms and local programs compete for the growth in theexisting GPR base. Because counties have relatively limitedcontrol over the costs ofstate-required programs, these programsmay absorb an increasing share ofGPR over time. Thus, the GPRavailable for local purposes may decline over time, requiringcounties to restrict spending on local programs.
Fiscal Capacity Indicators
Based upon our review of county financial data, we· haveidentified three useful indicators ofthe fiscal capacity ofcounties:
• Local Purpose Revenues· (LPR). The first indicator isthe total GPR available for local pUrposes, afterexpenditures on state-required programs are accounted for. Werefer to this residual as local purpose revenue, or LPR.

326(Part'lV: Major Issues Facing the Legislature
.This measure E1hows the residual fiscal capacity of coun" ties to meet local n.eeds after meeting state requirements.
• Cha,nge in LPR. Another important iildicator"is thechange in tPR bver tiIlle. Adecline in LPR showsthat acounty's revenues are notgrowing atthesame'pace as thecosts of state-required programs, and, suggests that thecounty, may be faced with difficult trade-offs betweenstate prograII!s and local service levels.'
• ProportionofGPR Dedicated to State-Required Programs.'Athirdindicatbris the percentage oftotal GPR'spent on'state-requiredprograms. .The advantage of thismeasure is that it enables one to compare the relative load
. that varib~s.coUIlties carry inthe financing of state-required programs. " '
For purposes of this analysis, all of these measures arecomputed on a per capita basis, unless otherwise indicated.
Our review of county fiscal capacityIS based on county revenue and expenditures from 1984-85 to 1987-88 (the latter is themost recent year for which complete data are available). Weobtained data oncounty:financial transactions from the State
, Cbntroller's Office, the Department ofMental Health, theDepartment ofHealtb, Servi<les, and the Department ofSocial Services.Our analysis.excludesSanFrancisco because, as a city/county, itis not directly comparable to other counties. For exaIIlple, SanFrancisco's charter city powers allow it greater ability to raise
'. local revenues.
FINDINGS REGARDING COUNTY FISCAL CAPACITY
Statewide, the capacity of county governments to meet localneeds with local revenues did not keep pace with the growth inpopulation and the cost ofIiving over the period 1984-85 through1987-88. On a statewide basis, county LPR increased 12 percentduring this period.:After adjusting '. for population '. growth andinflation; however, LPRdeclined 6.5 percent over the period.
Counties also bore an increasing share of costs for state-required programs. In 1984-85, counties ~~edapproxiJIlately50
percent of their general purpose revenues to support state~re
quired programs. By1987-88, this share had increased to 55percent. .This trend is attributable to the fact that, statewide, thecost increases in state-requiredprograms outpaced local revenuegrowth. Between 1984-8,5and1987-88, the costsofstate-requiredprograms increased 40 percent, while general purpose revenueincreased by only 26 percent. ' ,

Variations In County Fiscal Capacity / 327
Variations in County Fiscal Capacity
The statewide trends mask considerable variation in fiscal capacity among counties. The cOllntiesvary in terms of t4eir totalLPR, as well as in the growth ordecline ofthis funding base overtime. .
As Figure 1 shows, in 1987-88, the average county had LPR of$108 per capita. However, county LPR ranged from Solano County,with only $57, to Sierra County, with $599. Alpine County is anoutlier in this comparison, with LPR of $1,83'7. Alpine Countyexhibits much higher per capita LPR because it receives a relatively large share of the local property tax (68 percent), has anextremely small population, and spends relatively lower amountsfor state-required programs.
The counties alsoshow considerable variation as to changes intheir LPR overtime. For example, Solano County experienced a33 percent decline in LPR between 1984-85 and 1987-88, whileAlameda County experienced a 50 percent increase during thesame period. In all, 23 counties experienced a decline in LPRduring this period, while 14 of these counties. experienced adouble-digit decline in this revenue. In contrast, 34 counti!i)sexperienced an increase in LPR, with 20 ofthese counties experiencing a double-digit increase in thisrevenue.
Figure 2 identifies the counties which experienced a doubledigit decline inLPRbetween 1984-85 and1987-88. These countiesare of interest because they appear to have shifted a relativelylarge share of general purpose revenue from local purposes tosupport state-required programs. It is interesting to note thatmany of these counties are clustered in the northern centralvalley.
County Fiscal Capacity and Fiscal Distress
It is difficult to determine whether a county is experiencingfiscal distress based purely on these measures of fiscal capacity.Clearly, a county with low fiscal capacity is more likely to experience fiscal distress; however, the level of distress depends on theunique circumstances of each county. For example, a countywhich has a high level ofLPR may be better equipped to sustaina decline inLPR without serious detriment to its residents. On theother hand, if the residents demand a high level oflocal services,the county may face practical difficulty in limiting services, andresidents may feel deprived if traditionally local resources areshifted to support state-required programs. Conversely, a countywith high growth in LPR may still have difficulty "making endsmeet" ifthe absolute level ofsuch resources was low to begin with.

328/ Part IV: Major Issues Facing the Legislature
1987-88 (dollars)
Small rural (populationless than 100,000)
11II Medium (population between100,000 and 350,000)
• Large (population greaterthan 350,000)
County Size
STATE AVERAGESolanoShasta
AlamedaSan Diego
ButteStanislaus
OrangeSanta Clara
San BernardinoTulare
San Joaquin
Imperial ~~~i!JYolo !!!!
YubaRiverside'
,Fresno
Contra Costa I===~Santa CruzMercedVentura
San MateoLos Angeles
San BenitoSacramento
MontereySanta Barbara
SutterSonoma
HumboldtMadera
TehamaNapaKingsGlenn
NevadaDel NorteEI Dorado
MarinKern'Lake
LassenPlacer
MendocinoSan Luis Obispo
TuolumneCalavera's
AmadorColusa
SiskiyouMariposa
InyoTrinityModoc
Plumas
Mono ~~~~~~~~~~~~~~~~~~~~~~~~Sierra b100 200 300 400 500 600
Note: Alpine County is excluded because LPR is off this chart at $1.837 per capita.San Francisco County is excluded due to lack of comparability.
Source: Legislative Analyst Office estimate.

Variations In County Fiscal Capacltyl329
Source: Legislative Analyst's estimate.

330/ Part .IV: Major Issues Facing the Legislature
Counties are particularly likely to face fiscal distress whenthey experience both a low level ofLPR, and a decline in that level.For example, Butte County experienced a double-digit decline inLPR between 1984-85 and 1987-88. At the sametime, BlltteCounty had the fifth-lowest per capita LPR in the state in 198788. Butte County also spends less than the state average (measured on a per-capita basis) for a variety of local programs,including general administration, public health, social services,and recreation/cultural programs. Thus, the county has lessflexibility to implement local service reductions in response to theincreasing expenditures required in state-required programs. AsFigure 3 shows, 10 counties are characterized by both a belowaverage amount of LPR, and a decline in LPR between 1984-85and 1987-88.
Counties Characterized by BothBelow-Average and Declining LPR
1987-88
• Butte
• Fresno
• San Bernardino
• San JoaqUin
• ~anta Clara
Source: Legisl1itivl:J Analyst estimates
Santa Cruz
• Shasta
• Solano
• Tulare
Yolo
Low Fiscal Capacity-Not Just a Rural County Problem
In the past, rural counties have appeared to be particularlyplagued by the gap between resource availability and servicerequirements, and state programs have been established to address the unique problems of such counties. For example, theHomicide Trials Program primarily benefits small rural countiE;ls.The 1990-91 Governor's Budget also reflects the perception thatlow fiscal capacity is a particularly rural problem, and calls for a"Rural County Review" to examine the situation. Our analysisindicates, however, that the problem oflow fiscal capacity is notmerely a rural county problem.

Variations In County Fiscal Capacity / 331
Figure 4 provides information about changes in LPR for smallrural, mediuIIl-sized, and large countie~.Small rural counties aredefined as'those with populations tinde,r 100,000, medium-sizedcOUIltiesas havingpopulationsbetween100,000 and 350,000; andlarge counties as those with populations in excess of 350,000. Ineach category of county size the figures indicate that there arecounties withimproving as well as declining fiscal capacity. Forexample, among small rural counties (upper pane!), change inLPR varies from a 31 percent decline (Lake County) to a 38percent increase (lnyo County). Among medium-sized counties(middle pane!), it varies from a 33 percent decline (Solano County)to a 36 percent increase (Monterey County). Among large counties(lower pane!), San Joaquin experienced a 16 percent decline inLPR, while Alameda County experienced a 50 percent increase.
Further, some of theJarger counties which show declines inLPR also have a relatively low base amount of LPR (please referto Figure 1). These counties include SantaClara, San Bernardino,and Fresno. Thus, these data indicate that the problems of lowand declining fiscal capacity are not confined to the rural counties.
The Role of State Fiscal Relief in Preventing Fiscal Decline
In 1987-88, the state established one-time block grants forcounty fiscal reliefunder Chapter1286, Statutes of1987 (AB 650,Costa). This program provided $110 million to California's counties. Of the total, $89 million was allocated to counties based ontheir relative shares of certain county health services grants,discretionary COLAs, and population. An additional $21 millionwas allocated based ona "revenue stabilization" formula established by Chapter 1286. Specifically, these grants were intendedto stabilize the percentage ofcounty GPR expended for the countyshare of costs in AFDC (exclusive of Foster Care), the IHSSprogram, the Com]JlUnity MentallIealth program, and the FoodStamps program. In addition to the grants provided under Chapter 1286, several rural counties received state grants in 1987-88for the reimbursement ofcertain homicide trial costs ($2 million)and for marijuana eradication ($2.8 million).
Our analysis indicates that the fiscal relief provided in 198788 reduced the magnitude of the fiscal decline experienced bycounties between 1984-85 and 1987-88. In the absence of thisrelief, counties would have experienced a 10 percent decline ininflation-adjusted LPR, rather than the 6.5 percent decline theydid experience. Thus, state fiscal relief appeared to have a marginal positive effect on overall county fiscal capacity in 1987-88.
The state fiscal relief provided in 1987-88 played a moreimportant role in improving the fiscal capacity of the smaller

332/Part IV: Major Issues Facing the Legislature
1984·85 to ·1987-88
-20
Small Rural Counties(population la•• than 100,000)
LakeColusaGlennSierra
LassenPlumas
MonoSutter
MariposaTehamaNevadaAmador
YubaTuolumn'e
MaderaTrinity
MendocinoKings
San BenitoSiskiyou
ModocAlpine
CalaverasDel Norte
Inyo}- .-__----i
-40 20 40 60
SolanoYolo
TulareSanta Cruz
MercedButte
ShastaEl Dorado
Santa BarbaraPlacer
ImperialSan~uis Obispo
NapaMarin
HumboldtStanislausMontaray,-_.,--_,- _
Medium-Sized Counties(population batwaen 100,000
and 350,000
-40 -20 20 40 60
Large Counties(population greater than 350,000)
San JoaquinSanta Clara
San BernardinoSonoma
Kern
Fresno
Ventura
San Diego
Orange
los Angeles
RiversideSacramento
Contra Costa
San Mateo
Alameda ,----,--.,----c-I""'..,-40 -20 o
Percent20 40 60
Source: Legislative Anaiyst estimates.

Variations In County Fiscal Capacity / 333
counties. These counties were the primary recipients of the $21million in revenue stabilization grants, as well as the grants forhomicide trials reimbursement and marijuana eradication.. In1987-88, small ru:ralcounties received$16 per capita in this statefiscal relief, compared to $5 per capita received bymediuIll-sizedcounties, and $3 per capita received by large counties. In theabsence ofthis relief, small rural counties would have experienceda 5 percent decline in LPR, rather than the 3 percent increase thatactually occurred.
It is important to note that, following 1987-88, counties didnot receive large block grants for fiscal relief. In 1988-89 andsubsequent years,however, counties did begin to receive newstate assistance underthe .TrialCourt Funding Program. Although information is not yet available to measure the impact ofthis program on individual counties, it is unlikely to provide thesame level of relief to cQunties with low fiscal capacity. This isbecause the Trial Court Funding program provides its assistancein proportion to the number of judges in each county, and thisbears little relationship to relative fiscal capacity.
FACTORS CONTRIBUTING TO LOW FISCAL CAPACITY
The specific factors contributingto low fiscal capacity varyconsiderably from county to county. For example, Butte Countyhas experienced a decline in LPR primarily because of slowgrowth in local revenue sources. In contrast, San BernardinoCounty's declining LPR appears to stem primarily from dramaticgrowth in expenditures .for state-required programs. Between1984-85 and 1987"88, San Bernardino's expenditures for staterequired programs grew at almost double the statewide pace-77percent compared to 40 pergent. Generally speaking, however,low fiscal capacity stems from some combination oflimited revenue growth and increasing expenditures for state-required programs. As discussed below,counties have only limited control overthese factors.
Limited or Low-Growth in Revenue
Our analysis suggests that a number ofcounties were characterized by low GPR, or by low growth in GPR, during the studyperiod. Figure 5 shows the 10 counties with the lowest total GPRper capita in 1987,88 (upper panel), and the 10 with the lowestgrowth (or actual declines) in GPR between 1984-85 and 1987-88(lower panel). The counties with low-growth or declining GPRinclude primarily smaller counties. There are, however, severallarge counties with low absolute levels of GPR (San Diego, Orange, San Bernardino, and Riverside Counties). Only one countyYolo-was in the bottom 10 both in terms of absolute level and
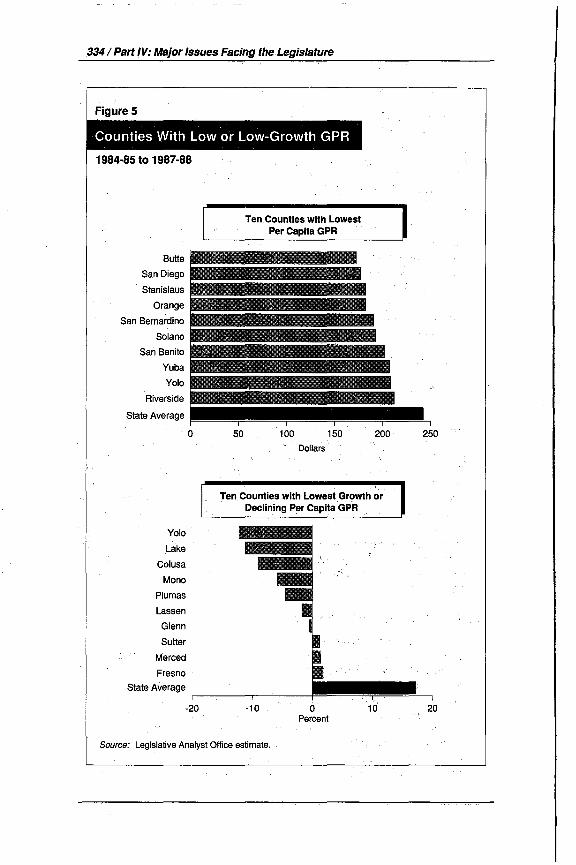
334/ Part IV: Major Issues Facing the Legislature
1984·85 to 1987-88
Ten.Counties with LowestPer Capita GPR
Butte liiilliiiilliii~San Diego
Stanislaus
Orange
San Bernardino
Solano
San Benito
Yuba iiii!iiii!liiiii~Yolo
Riverside
State Average
o 50 100Dollars
150 200 250
Yolo
Lake
Colusa
Mono
Plumas
Lassen
Glenn
Sutter
Merced
Fresno
State Average
Ten Counties with Lowest Growth orDeclining Per Capita GPR
-20 -10 o.Percent
10 20
Source: Legislative Analyst Office estimate.

Variations In County Fiscal Capacity /335
changes to GPR during the study period. As discussed. below, avariety of factors are responsible for a county experiencing a lowlevel of GPR, or low growth in that base.
Economic Characteristics. The county's characteristics,such as its economic base and the pace and pattern ofdevelopmentwithin its boundaries, are critical factors in determining GPR. Forexample, counties with primarily agricultural economiestend tohave lower property values and retail sales and, therefore, morelimited revenue. Even if a county has a growing economy, it willreceive only limited fiscal benefit from this growth if commercialor industrial growth occurs within city boundaries.
Actions ofOther Entities Within the County. The actionsof overlying governmental entities can have an important effecton county resources. For example, Yolo County's decline in GPRduring the study period is largely attributable to theinco:rporation of the City of West Sacramento in January 1987. While acounty may experience some reduction in service responsibilitiesas a result of incorporation, thes.e reductions are not alwayscommensurate with its loss 9frevenues. In addition, city redevelopment policies can have an effect on county revenue. This isbecause current law allows redevelopment agencies to retain mostofthe increased property tax revenues (tax increment) occurringwithin a redevelopment project area.
State Policies. State policies also can affect county resourceavailability. One of the most important of these is the allocationof county property tax revenues established by state law. Underthe AB 8 property tax allocation formula (enacted following thevoters' approval of Proposition 13), the share of the property taxallocated to each local agency is based on its share of the totalamount ofproperty taxes collected in the county during the threefiscal years prior to 1978-79. Many counties imposed low propertytax rates during this period and, therefore, currently receive arelatively low share of countywide property tax revenues. Whilecounties receive on average 33 percent of total property taxrevenues, county shares range from 18 percent in Orange Countyto 68 percent in Alpine County.
As discussed above, counties have extremely limited access toindependent revenue sources. One potential revenue source forsmaller counties is the sales tax. Chapter 1257, Statutes of1988and Chapter 277, Statutes of 1989 (both AB 999, Farr), allowcounties with populations under 350,000 to increase sales taxesby one-half cent, subject to voter approval. Counties have haddifficulty, however, obtaining voter approval for general sales taxincreases. In all, 16 county measures have sought sales taxincreases under these provisions. Only two of these measureshave succeeded (in San Benito and Monterey Counties).

336/ Part IV: Major Issues Facing the Legislature
High or Rapidly Increasing Costs forState-Required Programs
Our analysis indicates that a number of counties expend adisproportionate amount per capita for state-required programs.Figure 6 shows the 10 counties with the highest per capitaexpenditures for state-required programs (upper panel), and the10 with the highest growth in per-capita expenditures for staterequired programs (lower panel). While many ofthe counties withhigh or increasing costs for state-required programs are smallrural counties, several larger counties are also included (Alameda,Sacramento and San Bernardino Counties). Three counties showboth extremely high and rapidly increasing costs for state-required programs (Trinity, Sierra and Mariposa Counties). Ofthese, only two are characterized bydecliningLPR (Mariposa andSierra Counties). Trinity County did not experience a decline inLPR primarily because its increase in GPR outpaced cost increases during this period.
A variety of factors contribute to a county experiencing highor rapidly increasing expenditures for state-required programs.
Population Characteristics. Counties face high costs forstate-required programs in large part because oflocal populationcharacteristics. For example, in 1987-a8, AFDC caseloads rangedfrom six cases per thousand residents in Marin County, to 50 casesper 1,000 in Del Norte and Yuba Counties. Counties also havediffering populations in need of specialized services; such aselderly individuals or recent immigrants.
Local Program Choices. Counties can exert some influenceover program costs through decisions regarding program administration, access to services and service levels.. The ability ofcounties to determine eligibility and service levels varies, however, from program to program and from county to county. Forexample, counties have extremely limited control over expenditures in AFDC because the eligibility criteria and grant levels areestablished by the state and federal government. Counties generally have more control over general assistance expendituresbecause the state does not impose specific standards in thisprogram. County decisions regarding law enforcement also havea substantial impact on their costs for administration ofthe courtsand correctional facilities.
Court Actions. In· many counties, the courts have established guidelines for state-required programs which restrict thecounty's ability to control program costs. For example, anumberofcounties face court-imposed minimum eligibility standards andgrant levels for general assistance. The courts also have imposed

Variations In County Fiscal Capacity / 337
Counties with High or IncreasingCosts for State-Required Programs
1984·85 to 1987-88
Ten Counties with HighestPer Capita Expenditures forState Required Programs
Sierra
Mono
Alpine
Trinity
Mariposa
Inyo
Kern
Alameda
Del Norte
Sacramento
100 200 300 400 500 600Dollars
Ten Counties with HighestGrowth in Expenditures forState-Required Programs
Mariposa
Modoc
Trinity
Lake
San Luis Obispo
San Bernardino
Santa Cruz
Tuolumne
Sonoma
Solano
State Aver,age _
20 40 60 80 100 120 140Percent
Source: Legislative Analyst Office estimate,

338/ Part IV: Major Issues Facing the Legislature
population caps on correctional facilities in 19 counties, requiringthose counties to incur increased costs for staffing and operationsof new or expanded correctional facilities.
Actions ofOther Governments~The actions of other governmental entities also affect county expenditures for requiredprograms. For example, the state is constitutionally required toreimburse counties for the costs ofnew programs or higher levelsof service imposed after 1975. This requirement specifically doesnot apply, however, in the case ofcomity program costs resultingfrom changes in crimes and infractions. Thus, county court andcorrectional costs are sensitive to state criminaljustice policies. Inaddition, the law enforcement actions of cities, whose policedepartments operate independently of counties, can increasecounty costs by placing demands on the courts and jail facilities.
Variations in State Funding Affect Fiscal Capacity
As we discussed above, targeted state fiscal reliefplayed a rolein mitigating fiscal decline in 1987-88. Ironically, differences instate grants also may contribute to county fiscal disparities.Figure 7 illustrates the per capita state assistance provided tocounties in 1987-88. This measure includes general purpose statesubventions as well as state grants for programs such as mentalhealth, county health services, and social service administration.It excludes payments for programs providing direct grant payments to individuals (such as the Supplemental Security Income/State Supplementary Program and AFDC). It also excludes statepayments for social service program costs that are primarilycaseload driven. We exclude these caseload-driven paymentsbecause they are directly related to the service population and,therefore, would distort county-by-county comparisons.
As Figure 7 demonstrates, state assistance payments varyconsiderably, from $100 per capita inVentura County, to $300 percapita in Colusa County. To the extent that these variations do notaccurately reflect variations in county service requirements orfiscal need, they may contribute to county fiscal strain.
Our analysis indicates that this may in fact be the case, for tworeasons. First, funding for many programs is allocated in proportion to each county's relative level of expenditure during a "baseyear." For example, the subvention for county public healthservices is based partially on the level of "net county costs" forhealth programs during the 1977-78 fiscal year. Counties whichchose to provide higher levels of service that year, at countyexpense, are now rewarded by higher allocations of state fundsthan counties that were providing lower levels of services at thattime. As these allocations are fixed, they do not respond to changes

Variations In County Fiscal Capacity /339
1987-88
ColusaTrini,tyModoc
InyoDel Norte
MonoMadera
MendocinoYolo
MariposaSutter
Siskiyou ,;;;;;;;;1;;=;=Plumas ~GlennLake
HumboldtFresno
TuolumneStanislaus
Tulare '"iii!ii!ii!ii!ii!ii!ii!~~Amador I!!!TehamaLassen
KingsEI Dorado
Santa Cruz. Imperial
Calaveras
Napa ~iiiiiiiiiiiiliiMerced !!Alameda
Santa ClaraSacramentoLos Angeles
Yuba.Santa Barbara
RiversideSan Joaquin
San BenitoSan Luis Obispo
SolanoButte
San DiegoMann
PlacerNevadaSonoma
KernMonterey
ShastaContra Costa
San Mateo,Orange
San BernardinoVentura
f------~-----r-c-----I-----,-----'----____,
a 100 200 300
Note: Alpine and Sierra Countie.s excluded because they are off the chart at $1 ,094 and $831,respectively; San Francisco County excluded due to lack of comparability.
Source: Legislative Analyst Office estimates.

3401 Part IV: Major Issues Facing the Legislature
in service demands over time. Second, some programs, such as thestate's alcohol and drug programs, provide a minimum amount ofassistance regardless of population.This results in a higllerpercapita allocation of program. funds for the less-populous ruralcounties. ".
These differences in state funding levels can have the effect ofrequiring counties to bear differing burdens for state programs.For example, state payments for community mental health underthe ShortIDoyle Act vary considerably from county to county.Until recently, these grant levels had notbeen adjusted to betterreflect current county. populations in need of these services.Counties which receive relatively low grant levels may find itnecessary to increase expenditures to respond totheir increasingservice needs. As a result, they may bear a higher share ofprogram costs than counties receiving higher levels of stateassistance. This differential in county costs for state-requiredprograms is responsible for some ofthe difference in LPR betweencounties shown in our data.
CONCLUSIONS
In sum, while county fiscal capacity varies considerablythroughout the state, our analysis indicates that a number ofcounties are characterized by low fiscal capacity. Low fiscalcapacity is not confined to small ruralcounties, as anumber ofthelarger counties also are characterized by low or declining LPR.While the specific contributingfactors vary from county to county,low-capacity counties generally experience some combination oflimited revenue, low growth in revenue, and/or high orincreasingcosts for state-required programs. In addition, the state maycontribute to fiscal disparities to the extent that the state aid itprovides does not reflect current county fiscal conditions.
Low fiscal capacity can have many negative ramifications. Aswe describe in The 1989-90 Budget: Perspectives and Issues(please see p. 348), low fiscal· capacity may require counties torestrict local services, or result in counties having difficultymeeting statewide objectives in programs ofstate interest. It alsoresults in pressure to increaseJocal revenue, and this may have anundue influence on local land use decisions. Moreover, counties'revenue constraints may hamper their ability to respond to futureinfrastructure needs and to facilitate local economic development.Fiscally distressed counties also may have difficulty providingadequate funding levels for state programs with matching requirements, which can result. in them not meeting state objectives. For example, some counties may not have the fiscal resources to aggressively pursue child support collections, whichmay result in higher net state costs for AFDC. At the extreme, a
Variations In County Fiscal Capacity /341
countymay considerbankruptcy action infederal court. Given thelack of precedence and the complex issues involved, the statewould face considerable uncertainty as to the outcome of such anaction. .
How Can the Legislature Improve County Fiscal Conditions?
The fiscal difficulties faced by counties are long-term andstructural in nature. They result from the programmatic relationship between the state and counties, as well as the revenueconstraints imposed by Proposition 13. Given the complexity offactors involved, and the diversity ofCalifornia's counties, it willnot be an easy task to find long-term solutions to county fiscaldistress. In the short term, however, the Legislature should takeintoaccount the fiscal difficulties faced by counties when considering the Governor's budget proposals, many of which may havea negative impact on counties (see Figure 8 for the major proposals).
In addition, the Legislature will need to examine its optionsfor providing short-term fiscal relief, as well as investigate longerterm solutionf'l to the county fiscal dilemma. Figure 9 summarizessome of the alternatives for providing fiscal relief to counties.Three of these options are shorter-term in nature, arid could beimplemented in the budget year. These include the provision oftargeted relief, reduction in county match requirements for staterequired programs (or increased funding levels), and the reallocationofprogram funding (or allocation offuture funding) based onmeasures of current program service requirements.
Our analysis indicates that increased funding and expandedprogram coverage for the existing County Revenue Stabilizationprogram is an effective means ofproviding targeted fiscal relieftocounties. This is because the statutorily determined grants provided by this program are designed to refl~ct the impact of stateprogram requirements on the revenue available for local purposes. The Governor's Budget proposes to provide $15 million forthis program. Our analysis indicates, however, that to fully"stabilize" revenues in the manner contemplated by the statutoryformulas would require considerably more than this aIIlount(please see our discussion of this program in the Analysis of the1990"91 Budget Bill, Item 9210).
While these options may close the gap between revenue andresponsibilities in the short term, they are unlikely to solve thelong-term structural budget problem experienced by counties. Inthe longer term, the Legislature should examine more permanentsolutions to the county fiscal dilemma. As Figure 9 indicates,potential longer-term options include modification ofthe current

342/ Part IV: Major Issues Faqing the Legislature
IIU:.:.:.I.·w
II' ~~~v~~t~~~~i~~ c~~~ti:t~~d:~~~Williamson Act
Increased funding for the CommunityMental Health Program
Increasedfuriding for the CaliforniaHealthcare for the Indigent Program(CHIP)
Shift the responsibility for mentalhealth and residential services forchildren, as required by Ch 1747/84(AB 3632, Brown) arid Ch 1274/85(AB 882, Brown), from theDepartment of Mental Health andDepartment of Social Services to theDepartment of Education
Reduction in payments to countiesunder the AB ..8 County HealthServices Program .
One-year suspension of the statutorycost-of-Iiving adjustments for AB 8health services grants
$5 million
$10 million
$35 million
Unknownpositiveimpact
$23.5 million
Item 9100
Item 4440
Item 4260
Item 6110
Reduction in payments. to counties $25 million Item 4260under the Medically Indigent ServicesProgram
Program growth "adjustment" under $24 million Item 5180the. Child Welfare Services program
Deferral of paymentforthe prior-year $40 million Item 8885costs for certain mandates until theBudget Acts of 1991 , 1992, and 1993

Variations In County Fiscal Capacity I 343
Legislativ~ Options for ImprovingCounty Fiscal Conditions
Provide additional targeted relief (for example,increase funding provided under the revenuestabilization program).
Reduce county match requirements or increaseoverall funding levels in state programs.
Reallocate state program funding, or allocate futureincreases in funding, based on measures of currentprogram requirements. (Note: Current law requiresincreases in funding for community mental health tobe allocated.based on an "equity" formula.)
Provide additional independent revenue sources(for example, extend AS 999 to large counties).
Realign state/local program responsibilities.
county property tax allocations, provision of additional independent revenue sources, or the realignment of relative state andlocal program responsibilities. These options should be considered, however, in the context ofthe overall county-state relationship and the programmatic goals ofthe state social service system.As such, these options merit additional study prior to state action.

344/ Part IV: Major Issues Facing the Legislature

Proposition 103--0ne YearLater
What Has Been Done to Implement Proposition 103 Duringthe Last Year and What Issues Are Still Outstanding?
15-80283

346/ Part IV: Major Issues Facing the Legislature
Almost 14 months ago, California voters approved Proposition 103,which required insurance premium rate rollbacks, ongoing regulation ofrates for all property/casualty insurance companies, and changes in the way individual premiums are set forautomobile insurance. Last year we examined Proposition 103(please see "Insurance Reform," The 1989-90Budget: Perspectivesand Issues, page 289) in order to assess the effects ofthe initiativeon the· automobile insurance market. We concluded then that:
• TheJulleffects ofProposition 103 on buyers ofinsurance(prices andavailability) and sellers ofinsurance (profitability and regulatory environment) would be known onlyafter the measure is fully implemented.
• The insurance industry exhibits many characteristics ofacompetitive industry and we were unaware ofevidence ofpersistently high or "excessive" profits on an industrywide basis.
• Costs.ofinsurance claimsare a key factor inexplainingincreasing premiums.
During the last year, a number of events related to the implementation of the initiative have occurred, most involving theDepartment of Insurance and its Commissioner. However, formanyre~sonsthe full implications ofProposition 103 still are notyet known. (For a discussion of the budget implications of delaysby the department, please see ourAnalysis ofthe 1990-91 BudgetBill, pages 238-40.) Given the far-reaching implications forinsurance buyers and sellers of these implementation activities,in this analysis we· update where things currently stand andidentify the key issues that are being dealt with. Our analysisagain focuses on automobile insurance since that remains thesegment receiving the greatest amount of attention.
First, we discuss the status of the 20 percent rollbacks specified in the proposition. Second, we examine theimplications oftheCommissioner's regulations governing "rating methodology"the way insurance companies price insurance to groups ofdrivers.Third, we review the issues under consideration during the"generic" rulemaking hearings currently underway. (The purposeof these hearings is to determine the appropriate overall level ofrevenues that insurance companies should be per:mitted to realize.) Finally, we examine two issues not directly addressed byProposition 103 but that have an important impact on the overalllevel of automobile insurance rates-the assigned risk plan andfactors affecting the cost of claims.

Proposition 103.·0neYearLater / 347
BACKGROUNDFigure 1 provides asllmmary ofthemaj()I" provisions ofPropo"
sition 103, takingint()accoun~t.lieSupreme Court's May1989 de"cision regardingtheinitiat~ve;Whilethe courtupheld mqst oftheprovisions ofProposition 103, itmodified the measure iIi severalimportant ways; Themost significant cha!J.ge wa.s the 9.eten;nination that companies are entitledto a fair and reasonable profit.Additionally, the court ruled that during the period fromNovember 8,1988 through November 7, 1989, companies could changepremiums upon filing a notice with the Department ofInsurance(this is known as a "file and use" system). Finally, the court ruledunconstitutional the creation of a nonprofit consumer advocacycorporation. .
Figure 2 provides a chronology ofthe significant events associated with the implementation ofthe initiative since its passage.Several areas of activity are especially noteworthy: (1) the SupremeCourt decision {referenced above), (2) the 20 percentrollbacks, (3) the Commissioner's rating methodology. regulations, (4) consolidated hearingsthat dealwith generic issues, and(5) the assigned risk plan premiur,n rate increase decision.
Supreme Court Decision. The court's finding that companies are entitled to a fair and reasonable returnis particularly im-
···portant because it overturned the "substantially threatened withinsolvency" standard found in theinitiative. The court found thatthe solvency standard was "confiscatory" in accordahce with along chain ofD.S.Supreme Court rulings· regarding the right ofcompanies subject to regulation to earn "normal" profits. (Theterm "normal" profits essentiallymeans that companies should beallowed to both cover their costs ahdalso have a profit margin leftover equivalent to what cOllld be earned elsewhere in the economy.) While this roling aPIllied specifically to the rollbacks, it alsohas applicability to future "prior approyal" rate filings. Thus,determination of appropriate profit levels is one of the key decisions driving the implementation proceedings discussed below.
20 Percent Rollbacks. Proposition 103 requires insurancecompanies to reduce their premiums by 20percent. Once the courtupheld this provision, the Commissioner issued regulations specifying the data required from companies in order to requestexemptions from the rollbacks. The resulting exemption requests,which virtually all ins.urancecQmpaniesfiled by the June 5, 1989deadline, were then reviewed by the department. Based on thatreview, the Commissioner ordered hearings for seven of thelargest insurers to determine whether they should be required toroll back rates. These hearings were originally expected to be theprimary forum for developing the basic regulations that would

348 / Part IV: Major Issues Facing the Legislature
Rate Changes:Initial rollback
Additionalchanges
020% below rates in effect on November 8, 1987 forall policies written or renewed after November 8,1988, subject to a "fair and reasonable" return oninvestment standard
o "File and use" rates until November 8, 1989o Additional 20% reduction in auto insurance rates for
all "good drivers" beginning November 8, 1989
a These provisions generally apply to all lines of insurance covered bYProposition 103(including auto, fire and liability).

Proposition 103--Dne Year Later/349
Figure 2
June5
June19-23
Supreme Court Upholds Proposition 103The court, however, rules that rollbacks can be exempted if companies aredenied a reasonable return and that companies can use a "file and use"process for rate increases until November 8, 1989.
Rollback Exemption Filings DeadlineDeadline for filing rollback exemption petitions. Virtually all companies filefor partial or total exemptions.
Implementation HearingsThe Commissioner holds public hearings on general implementationissues.
August1
Rollback Exemption DecisionThe Commissioner announces the 11.2 percent profit rate standard,accepts many exemption requests, and rejects exemption requests of 7large insurers. .
November
August14-18
October2
December5
Rating Methodology HearingsThe Commissioner holds a series of public hearings to help determine themethods by which insurers could set individual premium rates.
Interim Rate Increase FreezeTh,e Commissioner imposes a six-month rate freeze in response to almost500 ''file-and-use''requests and to provide time to develop prior approvaland rating methodology regulations.
Generic Issues Consolidated Hearing(GICH), Rating Methodology Phase 'The Commissioner initiates a series of hearings to determine genericregulations for rating methodology.
Rating Methodology RulesThe Commissioner releases' emergency regulations governing ratingmethodology; Key provisions required reduced emphasis on territory insetting individual rates and imposed a cap on future rate increases.
December Assigned Risk Pool Decision18 The Commissioner denies the assigned risk pool rate increase request
because it does not consider the new rating methodology rules andinsurance affordability.
December- GICH, General Regulation PhasePresent The Commissioner initiates a series of hearings to determine generic
regulations for rollbacks and prior approval regulation process.

350/Part IV: Major Issues Facing the Legislature
govern the industry under Proposition 103. However, the hearings have never been held.
RatingMethodologyhecisiiJn. :bl.lringthetitn~thatthe department was reviewing the rollback exemption requests, it wasalso attempting to write the regulations that. would govern theway insurers developed individual rates for automobile insurance(referred to as the "rating methodology"). Proposition 103 mandates specific individual characteristics that must be given precedence in the development of rates. The weighting of the mandatory factors is quit~ different from that used by the insuranceindustry prior to enactment ofthe initiative. The regulationswereannounced by the Commissioner in December of 1989. followinghearings in August. and November of 1989. .
Generic Rulemaking Proceedings. There· are two mainelements to the department's new regUlatory program: (1) therollbacks and (2) the "prior. approval" regulatory program mandated to begin in November of 1989. Under prior approval,insurance companies must obtain approval of proposed ratesbefore they can use them. As we indicated above, the Commissioner attempted to use the Eieven-compa:p.y rollback hearings asa way to develop the regulations that would be needed to administer the prior approval regUlatory progrlil,m. Once it became clearthat this approach to the development of regulations would notwork, the Commissioner called for a set ofhearings that began inDecember 1989. These hearings-ealled the genericissues consolidated hearings (GICH)-areexpected to provide the data andconcepts needed to develop the basic regUlatory structure to beused by the department.The hearings are expected to last into thespring of1990.
AssignedRisk PoolRatefiling. California, like most states,has provisions for the use ofa pooling arrangement to allocate''bad'' risk and otherwise uninsurable drivers among automobileinsurers. The California arrangement is known as the CaliforniaAut9mobile Assigned Risk Plan (CAARP) and is managed by theinsurance industry. The CAARP's rateshave long been determined using a form ofprior approval regulation. In recent years,the. C.A1\RP rate increase requests havebeeIllarge and theCommissioner (as well as her predecesspr) has systematicallyauthorized smaller increases than have been request~d.Holdingdown CAARP rates relative to rate increases in the regularma~kethas resulted in both increasing enxollments,and irtcreas"ini deficits in the plan. While Proposition 103 does not directlyaddress the CAARP, there are issues (related to the role andpurpose of CAARP) raised by a December 1989 CAARPrateincrease decision that affect the regulation of insurance companies pursuant to Proposition 103.
Proposition 103--0ne Year Later /351
WHAT IS HAPPENING WITH THE20 PERCENT RATE ROLLBACKS?
Under the provisions of Proposition 103 as enacted by thevoters, insurance companies were required to reduce rates to alevel 20 percent below the rates in effect on November 8, 1987unless the company was substantially threatened with insolvency.As noted earlier, the Supreme Court ruled that the threat ofinsolvency was too strict a standard and replaced it with the fairand reasonable return standard commonto other regulated industries. As noted earlier, this standard means that a company isentitled to a "normal" profit rate.
Exemption Filings
Once the' court upheld the central,provisions of Proposition103, implementation ofthe initiative began. Within a week afterthe court ruling, the Commissioner released regulations specifYing: (1) how insurance companies were to file for exemptions fromthe rollbacks and (2) the information and data needed in order tosupport an exemption filing. About 450 insurance companiesvirtually the entire industry-filed a total of more than 4,000individualline-of-business (such as automobile, homeowners,commercial liability) exemption requests. These requests wereexamined by the department and the Commissioner's initialrulings were announced August 1.
At the same time, the Commissioner announcedthe profitability standard the department would use for evaluating the exemption filings. The department adopted a profit rate ofll.2 percent as the basis for determining whether company profits wereexcessive. Using that standard, the Commissioner agreed with asignificant number ofthe exemption requests, withheld on manyothers, and found that seven of the largest insurers (includingState Farm, Allstate, USAA and California State AutomobileAssociation) would be subject to rollbacks of varying amounts.Rollbacks were ordered for a number ofinsurance lines-including automobile insurance. The largest percentage-of-premiumrollbacks, however, generally were ordered for earthquake,homeowners, and inland marine insurance. Only relatively smallrollbacks (less than 6 percent) were ordered for private passengerautomobile insurance (with one exception, USAA, which wasordered to reduce rates by about 16 percent). Each of the sevencompanies that was ordered to roll back rates petitioned for ahearing.

352/ Part IV: Major.lssues Facing the Legislature
Rollback Hearings
The purpose ofthe hearing process was to determine ,whetherthe department's analysis of and conclusions regarding the exemption filing was justified. The usual practice in regulatoryagencies is to have an already established setofbasic regulationsto govern the industry. Rather than issue these regulations priorto beginning the rollback hearings, however, the Commissionerchose to use the individual company hearings themselves as theforum for developing basic regulations. Among the basic issuesthat the hearings needed to resolve were: (1) the methods forcalculating both actual and allowable profits, (2) the method forallocating owners' equity (insurance regulators and companiescall this "surplus") between lines ofbusiness, and (3) the generalregulatory approach (discussed below).
The Commissioner's approach to developing regulationsquickly became bogged downby challenge~fromthe companies.These challenges delayed the, start of the hearings (in fact, thesehearings have not yet been rescheduled) and led the Commissioner to propose a setofconsolidated hearings to produce Ii set ofgeneric regulations to govern both the rollbacks and future priorapproval regulation. The generic issues consolidated hearingswhich resulted from this decision are discussed later.
Summary Regarding Rollbacks
Virtually all insurers filed for exemptions from the rollbacksfor automobile insurance (and many other lines, as well). TheCommissioner ordered rollbacks for a number of the largestinsurers, which then requested hearings. These hearings were tobe the forum for developing basic regulations governing theindustry. Problems with this approach, however, put the rollbacks "on hold" indefinitely.
WHAT ARE THE IMPLICATIONS OF THERATING METHODOLOGY REGULATIONS?
In December of1989 the Commissioner released regulationson the subject of"rating methodology;" This section discusses thepossible effects of those regulations.
Why Is Rating Methodology Important?
Rating methodology refers tothl'l techniques used by insurance companies to determine premium rates for individual policyholders. Because development of truly unique rates for eachindividual would be too costly and because probabilities ofclaimsoccurring must be used, insurance companies typically assign

Proposition103--0ne Year Later / 353
each policyholder to a group of individuals that exhibit similardegrees ofrisk for incurring ch:dms costs. This process is importanttoth~financialviability ofa company. Therefore, companiesuse statistical techniques, usually under the. direction of anexperienced actuary, to evaluate various individual characteristics thatwould allow the company to determine a driver's approximate degree of risk.
Anlong the characteristics reviewed are: driving records,number of years of driving, use ofvehicle, miles driven, geographic location of drivers, and automobile characteristics (suchas make and· model of vehicle, engine size, safety features, andcompany experience with the vehicle). The companies assignweights to each significan~factor, which are then used in calculating actual premiums. In the past, the most significant weight (upto 50 percent) was given to "territory" (that is, where a person livesbased on groups of zip codes). However, there has been disagreement about the proper relative weighing between territory andother factors.
What Are the Regulations Proposed by the Commissioner?
The rating methodology regulations describe both the mandatory and the optional factors insurers can use, and the relativeweighting ofthese factors.· The regulations also provided a cap onrate increases.
Mandated Factors Given Precedence. Proposition 103identified three factors that must be considered before any optional factors could be used when developing premiums. Thesemandated factors are (1) driving record (includingboth traffic violations and at-fault accidents), (2) number of miles drivenannually, and (3) number ofyears ofdriving experience. The Commis-
·sioner ruled that the second factor (miles driven) could have nomore weight than the first factor (driving record), and that thethird factor (years of driving experience) could have no moreweight than the second factor.
OptionalFactors Specified. The Commissionerbanned theuse of territory, gender, age, sex and certain other factors whenmakingindividual rates. In their place, the Commissioner identified 22 optional factors that could be used by companies to help setpremiums after the mandated factors are considered. All oftheseoptional factors affect the cost of paying a claim (such as cost ofrepairs, theft rates, litigation rates, average medical costs in anarea; and vehicle characteristics-including safety features).Additionally, some factors are also territory-related (such aspopulation density and vehicle density). Before any optionalfactor is used, however,companies must show that it bears a

354/ Part IV: Major Issues Facing the Legislature
substantial relationship to the risk of loss. Significantly, theCommissioner also ruled that the combined weight of all of theoptional factors could have no more weight than the third mostimportant mandated factor listed above. This effectively limitsthe total weight ofall optional factors to less than 25 percent.
Cap on Rate Increases. As we discuss below, it is likely thatany given individual's premium rates under the Proposition 103rating methodology. will be different from what they are now.Arguing that Proposition 103 called forlower-not higher-rates,the Commissioner ruled that no rate could be increased in anyyear by more than the California Consumer Price Index (CCPI).
How Will These Regulations Affect the Price of Auto Insurance?
The rating methodology is the basis for all individual premium rates. Substantially changing the existing rating methodology is likely to have significant effects on the rates someindividuals pay. We have identified two such effects: (1) potentially substantial cross-subsidies between different groups ofinsurers (due to the reduced weighting of the optional factors),and (2) overall limitation of premium increases to less-thanactual increases in the cost of providing coverage.
Cross-Subsidies. Cross-subsidies occur when one group ofconsumers is charged a premium that exceeds the cost ofproviding coverage to that group, while another group of consumers ischarged a premium that is below the cost ofproviding that group'scoverage. The group that pays insurance premiums that are inexcess ofthe cost of providing coverage, in effect, helps to pay for(that is, subsidize) the below-cost coverage provided to the othergroup,
There is wide agreement among actuaries that territory (as asurrogate for certain of the optional factors discussed above)should have a greater weight than is allowed by Proposition 103.The greater the difference between the true weight ofthe optionalfactors and the allowed weight, the greater the extent ofthe crosssubsidybetween consumers.
Figure 3 shows the department's rough estimate,ofcounty-bycounty average premium changes that would result by reducingthe importance of territory as a rating factor under the proposedregulations. We must caution the reader that it is impossible topredict the precise impact of the proposed changes for any givenpolicyholder. Nonetheless, the figure provides an indication ofthegeneral magnitude of the premium changes. It indicates thatdrivers in all but three counties would· experience premiumincreases and that the increases would be quite large in some

Proposition 103-0ne Year Later /355
Automobile Insurance Average Premium ChangesDue to Reduced Effect of Territory a
, '
Represent81lve Cille. In Lei. Ange'e. County
• DecreasesIII Counties with premium
increases (7.4 million v~hicles)
• Counties with premium 'decreases (4' million vehicles)
Modoc I!~!!llll!~'ri'"TehamaPlumas
TrinityShasta
SiskiyouColusa
Del NorteSierra
LassenButteYuba
GlennMendocino
SutterLake
CalaverasAmador
MariposaTuolumne
KingsNevada
HumboldtSan Luis Obispo
" TulareKern
NapaMerced
MonoEI Dorado
PlacerSanta Barbara
SonomaYolo
FresnoStanislaus
SacramentoMadera
MontereySolano
InyoContra Costa
Sania CruzSanta Clara
ImperialSan Diego
AlpineMarin
San BernardinoAlameda
San MateoRiverside
VenturaSan Joaquin
40%
[ill Increases
20-40%
o -20 40 60%
• Thiseslimate applies to liability coverages and assumes that the weight of territory as a rating fais reduced to 24,7 percent.
Source: California Department of Insurance 1987 Premium Data.

356/ Part IV: Major Issues Facing the Legislature
counties (primarily rural counties). The figure also provides abreakout of premium changes for selected locations within LosAngeles County. It shows thateven withinthe cOunty thatwould,on 3;verage, benefit the most from.the cliangeinmethodology,there are still many drivers who would. experience premiumincreases. .
CCPI Cap. The CCPI cap was imposed by the Commissionerprimarily to limit premium increases in counties adversely affected by the new rating methodology. A cap on premium increases could, however, threaten an insurance company's profitability in several ways:
• In response to the changes in rating methodology, companies probably would need to increase premiums in someparts of the state by many times the CCPI (which in thecurrentyear is expected to be in the range of4 to 5 percent)in order to compensate for mandated decreases in premiums elsewhere ifthey were to maintain their current levelof profitability.
• Many of the underlying costs of providing insurance areincreasing more rapidly than the CCPI. If the cap prevented companies from recovering these increasing costsin future rate proceedings (using the prior approval process specified in Proposition 103), then company profitswould decline, potentially resulting in some firms withdrawing from the market.
Summary Regarding the Rating Methodology
Proposition 103 required changes in the way individual ratesare set. Except for the rate cap, the Commissioner's regulationsfollow the basic requirements mandated by theinitiative. Theseregulations do, however, result in potentially significant subsidies to certain buyers of insurance at the expense ofother buyersofinsurance. Additionally,the rate cap could make it difficult forinsurers to earn a "fair.and reasonable" profit without challengingthe legality of the cap.
WHAT ARE THE KEY REGULATORYISSUES STILL TO BE RESOLVED?
As we indicated above, the Commissioner originally attemptedto develop regulations for the industry using individual companyrollback hearings. It quickly became apparent that this processwould not work, so the Commissionernext proposed a separate setofhearings (announced in October of1989) to determine genericrules for regulating the industry. The first phase of the GICHended with the promulgation of the rating methodology regulations discussed above. The second phase, currently underway, is
Proposition 103··0ne Year Later /357
expected to end in March of 1990 and to result in regulationsgoverning both the rollbacks and future prior approval ratefilings. This section presents an overview ofthe more fundamental issues that must be resolved before regulation can begin.
What Regulatory Approach ShOuld Be Taken?
The first step in developing a regulatory process is establishing the kind ofoversight ofinsurance companies to be exercised bythe department. This issue must be resolved before the otherissues under consideration during the GICH can be addressed.Since regulation generally is used to approximate the results onewould expect to find in a competitive market, the choice ofregulatory approach should be guided by (l) the degree to whichthe industry is already subject to competitive forces, (2) the extentto which "excessive" profits exist, and (3) the degree to which theinitiative allows competitive forces to be considered in regulatoryproceedings.
Degree ofCompetition. Last year.(please see The 1989-90Budget: Perspectives and Issues, pages 293-294) we examined theinsurance industry and found that competitive elements arepresent. Specifically, we found that there are many companiesselling insurance and there is significant freedom of "entry andexit" in the industry. Additionally, a survey of industry studies(produced by academics, consultants, and government agencies)indicates that most experts agree that the insurance industrygenerally exhibits competitive characteristics.
Profitability. In last year's review we also examined a number of automobile insurance profitability ,studies. We found thatthese studies do not support the view that the industry has beenearning excessive profits. This industry has a history of volatileprofitability, and in any given year some companies could beearning larger profits than would be normal for the long-run.However, over time, the industry as a whole appears to exhibitcompetitive performance. During the past year, we examinedadditional studies and have been unable .to' find evidence ofpersistent excess profits. The department's review of rollbackexemptionfilings (discussed above) provides additional support tothe view that automobile insurance profits have not beenexcessive.
Consideration of Competition. While the evidence suggests that competitive elements are present, the Commissionermay be prevented from considering these elements in the regulatory program. One ofthe stated purposes ofProposition103 is "...toencourage a competitive insurance marketplace... ." Elsewhere inthe initiative, however, the Commissioner is instructed to give

358/ Part IV: Majdr Issues Facing the Legislature
"...no consideration to the tlegree of competition..:' when approving insurance rates. If, in fact, the industry is competitive and theCommissioner must ignore that, fact, an inappropriate type ofregulatory oversight could result.
What Ratemaking Approach Is Appropriate? Someparticipants in the GICH argue that insurance companies requirevery ch>se scrutiny during rate review because the indvstry hasbeen exempt from antitrust oversight for many years (the initiative removed these exemptions). The regulatory approach proposedbythis group would include: (1)a formal public utility rateof-return ratemaking proceeding (perhaps some variation of theway in which the California Public Utilities Commission--CPUCregulates electric or gas utilities), (2) a close and detailed reviewofan company records, and (3) so-called "social" regulation (use ofthe regulatory processto achieve specified public policy goals suchas income redistribution,caps on certain expenses or"good serviceincentives"). . ,
Other participants in the GICH argue that insurance companies exist within, a basically competitive environment, thus requiring relatively less intrusive oversight by the department(suchas the waythe CPUC regUlates the trucking industry). Theregulatory approach proposed by this group would give the dep~rtmentmuch more discretiona.bout the intensity dfindividualcompany reviews. In essence, this approach would include moreemphasis ongeneral policies to guide reviews and the use ofbandsof rate flexibility within which companies could set their premiums without in-depth review.
There are many regulatory approaches that wouldflt withinthese two relativ(;lextremes. It is not clear at this time, however,what regulatory approach the ComIllissioner will choose.
As we noted last year, regulation of the insurance industry,like any industry,should proceed from a neutral perspective andfocus on the underlying economic realities ofthe industry. In ourview, the available evidence on the competitive forces in theindustry suggests that a less intrusive regulatory approach iswarranted.
How Will Profits Be Measured?
The court ruled that insurance companies are entitled to a fairand reasonable return. This requirement establishes the importance" of profit calculation in the regulatory process since theregulator must know both the standard to be used to,determineallowed profits and the method for calculating actual companyprofits. There are many technical factors thatmust be resolved in

Propositipn 103--0ne Year Later / 359
order that these calculations are performed in a manner that isconsistent with good economic analysis. The principal issues are:
• How to Measure Profits? In prior-approval ratemaking, profits must be determined so the regulator candetermine whether proposed premiums are too high or toolow to allow firms to earn an adequate rate of return.Several major issues need to be resolved before actualregulation can proceed in an appropriate manner. Theseinclude determination of: (1) the appropriate accountingstandards to use in measuring profits, (2) rules for allocating "owner's equity" and overhead costs between lines ofinsurance when computing their profitability, and (3) theappropriate time frame for calculating profit rates (forexample, should the focus be on past or projected futureprofits). .
• How to Establish the Level ofAllowable Profits? Inorder to determine whether an individual company isearning a fair and reasonable return, the regulator alsomust define a standard (so-called allowable profits) againstwhich to compare a company's actual profits. Some oftheissues yet to be resolved include: (1) whether differentstandards shoUld be used for rollback and for future rateproceedings, (2) whether allowable profits should be anindustry average versus company or line-of~businessaverages, and (3) what an adequate profit returnis in orderfor an insurance company to remain economically viableover time. .
Whatls a Fair and Reasonable Profit Rate? A fair andreasonable profit rate is that which is sufficient to attract neededfinancial capital to an industry and keep it there. Stated anotherway, it would be the profit rate that would make investors earn asmuchbyinvestingin an insurance company as they would in otherindustries having a similar degree of risk. This suggests thatproper regulation of the insurance industry requires ongoingadjustments of the allowable profit rate because economic forceschange from year to year and would affect investment decisions.,Additionally, since premiums in regulatory proceedings are setfor the coming year, iUs important that allowable profits take intoaccount future (that is, prospective) profits, rather than simply onhow companies have performed in the past.
As noted earlier, the Commissioner adopted an allowed profitrate ofl1.2 percentforuse during the department's reviews oftherollback exemption filings. This profit rate was arrived at bytaking a 15-year average of industry-wide return on equityincluding all investment income.

360/ Part IV: Majorlssues Fscingthe Legislature
The department's decision to use return on equity as a measure of allowable profits is appropriate. It is not clear to us,how-ever, whether.the department's approach in arriving at the11.2 percentfigure gives;
• Adequate consideration to thelonger-run profitability requirements ofthe industry;
• The pro:per recognition to future economic conditions; and
• Proper consideration to differences in the riskiness ofilldividual·lines-of-business.
The department's methodology in arriving at this standard currentlyis under review as part ofthe GICH.
How Will Reserves, Surplus, and Expenses Be Measured?
Once the regulatory approach and a method for measuringprofits are determined, another set of issues must be resolved.These issues generally relate to the treatment of certain criticalaccounting variables suchas loss reserves, surplus, and expenses.
Loss Reserves and Surplus. Loss reserves (funds set asideto pay .claims) and sp.rplus (under regulatory accounting rulessurplus is roughly equivalent to owners' equity) represent largepots of money which, some parties allege, could be subject tomanipulation.by the companies to the detriment ofpolicyholders.Specifically, these parties contend that insurance companiesfrequently place more funds into loss reserVes and surplus than isrequired on actuarial grounds. If true, the premiums paid byconsumers.would be higher than they otherwise would be whilereserves and surplus are being built up. On the other hand,regulators (and good pusiness practice) require companies to setaside an appropriate level of funds to assure that monies areavailable to payoff all claims. Specifically, unduly holding downthe size of reserves and surplus could increase tile danger that acompany might be unable to pay offclaims in a timely fashion ormight not be able to survive a large catastrophe.
A.llocation .ofSurplus. Accounting issues have beenraisedregarding· the allocation ofsurplus among the lines~of-business
for· the· purposes of determining the .profitability of· individuallines. Companies tyPically do not organize their accounting records in a waythat directly allows for a line-of-business division ofthe surplus; consequently, some method must be devised for doingthe allocation. Since surplusis treated as backing for premiumswritten (much the same way as banks hold loan reserves), anaturalmethod for allocating surplus among lines would be tousethe degree of risk· faced by each line-of-business. This kind ofallocation, however, is apparently very difficult to accomplish.

Proposition 103-0ne YearLater / 361
Hence, some other method for allocating the surplus must bedevised.
The'department proposes to use so called "premium-to~sur
plus norms" to allocate surplus among lines-of-business. A premium40-surplus norm represents the number ofdollars ofpremiums a company can write for each dollar of surplus held. Someparties have proposed the use'ofpremium-to-surplus ratios thatwere developed by regulators as "rules-of-thumb" to trigger closerexaminationofcompanies during solvency reviews. Hence, thesenorms represent the limit beyond which a company is thought tobecome sufficiently risky to merit closer evaluation. While thisapproach has some surface appeal because the norms are easy touse, the department has provided little analytical support for theuse ofthese norms. There are at least two problems with their use:
• Norms, in effect, establish a standard for the "correct"level of surplus and make· no allowance for operatingdifferences between companies.
• Companies that choose to hold "extra" surplus (to reducetheir exposure to large unanticipated losses) would be disadvantaged by having to accept a lower profit rate. This isbecause regulators would not permit premium increaseslarge enough to maintain this excess.
Should Companies Be Held to Efficiency Standards?Some participants in the GICH argue that expenses also should beev~luated using industry norms. Thus, all companies would, ineffect, be reviewed based on the behavior of the "average" or,alternatively, the lowest-cost (the most efficient) company. Use ofnorms or "efficiency standards" are proposed as a way to force lessefficient (higher cost) companies to improve theIr perfonIlance.Other participants argue that each company must be reviewedbased on its individual choices regarding the level of expenses itincurs. This view is based on the notion that companies in theindustry are diverse in many ways, and thus face different costs.Hence, norms could reduce incentives to innovate by forcing allcompanies to become more alike.
Shottld CerlainExpenses BeExclude,J orCapped? Someparticipants argue that Gertain expense items shouldbe capped orexcluded when settiI).g rates and computing profits. These itemsinclude political contributions, executive salaries, image advertising, and badfaith judgments. Other participants argue that thedepartment does not need to cap or exclude any expense categories because the market would exert discipline over managementto contain these,and all other, costs. InJanuary ofthis year, theCommissioner announced her intent to use such caps and exclusions.

362/ Part IV: Major Issues Facing the Legislature
Summary Regarding the Key Regulatory Issues
There are many generic issues yet to be resolved before Proposition 103 can be implemented fully. The previous discussiontouched on only the more important and, perhaps, contentiousissues. The GICH process is only the beginning. Once the Commissioner issues hergeneric regulations sometime in spring1990, shemust then apply them to indi.vidual company rollback and prior~pproval rate filings. It is not yet clear how difficult it will be tom~e the generic rules workable in the context of everydaycompany regulation. Most observers expect challenges both to thegeneric regulations and to their application to individual companies. Resolvffig those challenges likely will take some time.
OTHER KEY ISSUES RELATED TO PROPOSITION· 103
While we have focused above on the implementation ofProposition 103 during the last year, there are two closely relatedinsurance issues that are deserving ofthe Legislature's attention.These include:
• The role ofthe California Automobile Assigned Risk Plan(CAARP).
• How to gain control over the rising cost that companiesincur in order to provide insurance.
What Is the Purpose of CAARP?
We recommend that the Legislature review the statutesestablishingthe CaliforniaAutomobileAssignedRisk Planto clarify the Legislature's intent whether (1) the CAARPwas established as a self-supportingpool, (2) its purpose isto insure only bad drivers, and (3) it is to subsidize insurance to low-income drivers.
CAARP Deficits Are Large and Growing. As describedearlier, the CAARP was established to provide insurance for "bad"drivers (that is, drivers with extremely poor driving records). Inrecent years the number ofpolicyholders insured through CAARPhas been growing rapidly because of the plan's relatively lowrates. As recently as 1986 the CAARP provided insurance coverage for about 423,000 drivers (approximately 3 percent of allinsured drivers in California). The department estimates that atthe end of 1989 about 1.2 million drivers were in CAARP (morethan 10 percent ofall inSured drivers), and it further estimatesthat the enrollment could reach about 1.5 million by the end of1990. In recent years, the relatively low rates have caused theplan to change so that many, perhap~ most, of the drivers currently insured through the CAARP would be considered "good"

ProposItion t03··0ne 'leal' Cater /363
drivers under Proposition 103 (that is, no more than one movingViolation during the preVious three years). As mentioned above,these drivers appear to be choosing the CAARP, in part, because:(1) it offers lower premiums for basic coverage than >does theregular market and (2) insurers proViding regular coverage arereluctant to serve some of these customers. Currently, this practice is limited primarily to Los Angeles County but could become
. a concernin other urban areas in the future.
The CAARP admlnistrators estimate, and department staffconcur, that in. 1989 the expected cost of claims and expensesassociated with settling those claims from the CAARP policiesexceeded premium revenues by at least $600 million. The department staffestimate that the deficit could reach $1 billion in 1990given present trends. The funds needed to cover these deficitscome from the premiums paid by drivers purchasing insurance inthe regular market. In effect, the regular market is subsidizinginSurance 'coverage for both the good and bad drivers in CAARP.Those subsidized drivers, however, are not necessarily low-in-come indiViduals; !
1989 CAARP Rate Proceeding: In FebruarY 1989 the CAARPadministrators filed a request for an approximately 112 percentIncrease in the average assigne.d risk pool premium. Actuarialestimates done by the industry and confirmed by departmentactuaries indicate that this increase in average rates is requiredin order for the plan to cover its costs. The request was then set forhearings which focused on a number of issues including:
• whether concerns about the ability ofdrivers to afford insurance should affect the CAARP premiums,.and
• Whether passing the CAARP deficits through to. nonCAARP policyholders would establish "unfairly .discriminatory" premiumrates for the regular market (because ofthe~rosscsubsidies).. .
On December 4, .1989, the presiding Administrative LawJudge (ALJ) found that the CAARPrate increase request wasjustifiedbecause disallowing the requestwould result in a subsidyof CAARP policyholders by non-CAARP policyholders (the regu-
·larmarket). This subsidy would Violate proVisions CifProposition103 which mandate that voluntary market premiums cannot beunfairly discriJllinatory. Thus, theALJ concludedthat the currentCAARP rate structure is inadequate and the premium increase isjustified. ..
The Commissioner, in her decision filed December 18,1989,disagreed with theALJewhose findings are adVisory only) anddenied the CAARP rate request on the grounds that it did not
./'/
~---'--~---'----'----'-----'------'--~/'

/'
364./ Part IV: Major Issues Facing the Legislature
adequately takeinto consideration affordabilityconcerns raisedduring the hearings. Additionally, she found that the CAARPadministrators did not adequatelyjustifY their premium increaserequest since they failed to consider changesin rating methodology mandated by Proposition 103. The deficits identified in thepremium increase request could be partially offset by thesechanges. The Commissioner ordered the CAARP administratorsto submit a rating plan within60 days that includes two rate tiers:(1) a lower, subsidized tier for low-income drivers and (2) a second,nonsubsidized tier for other CAARP policyholders. The·decision,however, did not address whether lower-income bad driversshould be subsidized.
Summary Regarding CAARP. Proposition 103 does not directly address the CAARP. The relationship between, the initiative and the CAARP ratefiling became more explicit, however,when parties to the proceeding raised issues regarding the; purpose ofthe CAARP and its use as a meansto redistribute the costofinsurance among policyholders. Nevertheless, significantquestions remain regarding (1) whether the CAARP was establishedas a self-supporting pool, (2) whether its purpose was to insureonly bad drivers, and (3) whether iUs to subsidize insurance tolow-income drivers. Because CAARP was created by statute,these are basic policy issues which the Legislature can address.
Therefore, we recommend that the Legislature review thestatutes establishingthe CAARP and enact whatever changes areappropriate to clarifYthe Legislature's intentregarding the aboveissues. This would provide the necessary guidance to the Commissioner in regulating theCAARP..
How Can the Cost Side of Insurance Be Addressed?
Proposition 103 primarily focuses on: (1) improving competition (such as requiring the department to provide comparativepremium quotes, subjecting companies to antitrust statutes, andremoving some restrictions on who can sell insurance policies),and (2) regulating premiums charged by insurance companies.The costs ofproviding coverage and paying claims is not directlyaddressed by the initiative. Yet, as we concluded last year, thesecosts play an important role in the high and rapidly· increasingcost of insurance in California.
There are many factors that make up the cost of insurance.These include repair costs, medical costs, theft, fraud, type ofcarinsured, legal fees, wage loss, pain and suffering, selling expensesand operating expenses. Individualcompanies can directly affectsome ofthese cost components. Other cost components are not soeasily controlled by either insurance companies or drivers.
. "\""\-------------.,...-.,...-.,...-.,...--.,...-----..,,-
\,

Proposition 103··0ne Year LaterI365
Because there are mafty factors that affect insurance costs, avariety of differefttapproaches must be pursued to control costs.The following are most often identified as ways to gain somecontrol overinsurance costs.
Double Payments. Currently, individuals involved in anauto-related personal injury lawsuit may,receive awards whichinclude medical costs even though they have already receivedpaym.ent from theirmedical or disability insurer. This is because
, under the "collateral source rule," juries must ignore such payments when determining' awards. The problemisthat the medicalor disability insurer' has no 'direct way of knowing about thelawsuit award (the second pa.yment). One way of addressing theproblem of double payments is to require notification of medicaland other insurance companies ofthese awards. They could thenrecover'their costs by placing 'a ,lien on the award. This kind ofinsurance coordination currently exists for workers'compensationiIisurance. Eliminating double payments could reduce theincentive for individuals to bring suit hoping to profit from anaward by pocketing that part of the payment .representing economic damag'esalready paid by otherinsurers. Department stafffeel it is a significant cauSe oflitigationin some areas ofthe state.It is difficult to estimate the extra costs due to double payments.However, one actuarial c~msulting firm estimated in a, recentstu,dy that double, recoveries could have increased the cost ofautomobile insurance in California by between $176 million and$374 millio~in 1~89.
Fraud. Insurance fraud (including faked accidents, fakedinjuries, false repair cost estimates and other false statements) isoftennientioned as" a significant factor affecting the cost ofinsuraIice.. l\tlany kinds qffraud are difficultand costly to investigate and prosecute; therefore, iUs often cheaper to pay suspectclaims than topursue them. Chapter 1609, Statutes of1988 (SB'2344, Lockyer) established a surcharge on insurancepolicies thatwould be used by local prosecutors and the department to investigatElaIldprosecute fra,ud cases. Chapter1119, Statutes of1989(SB .n03,Robbins) incrElased the surcharge and applied it toinsurEld vehicles,'in order to double the amount ofmoney availablefor fraud investigations and prosecutions. This increased attentionby investigators and prosecutors should help to reduce theincidence of these crimes, thereby helping to reduce,premiumcosts.
TheftPrevention and Stolen Vehicle Tracking Equipment. Some insurance companies giVEl premium discounts for theuse oftheftpreventioneqMipmElrit (iri fa,ct, some companies makethe use ofthis equipment a, ~ondition ofcoverage for certain hightheft-rate v'ehicl~s).Technology currently exists that may make it

366/ Part IV: Major Issues Facing the Legislature
feasible for police to track stolen vehicles, though installing andoperating the· equipment is costly. ,Greater use of these devicesand greater incentives for tIle use oftheft prevention devices couldhelp reduce the cost of comprehensive insurance coverage if thisequipment proves to be cost effective.
No FaultInsurance. No fault insurance removes the need todetermine fault before insurance.claims are paid to injured parties. The U.S. Department of Transportation reviewed no faultplans and concluded that well-designed plans could help to limitthe rate of growth in costs. They concluded, however, that evenwith good plans it is unlikely that insurance costs:vvould deGreasein absolute terms since reduced litigation costs would be offset bylarger average payments toinjured parties. ClearlY,these planswould trade more frequent and higher average payouts toinjuredparties for the loss ofthe right of a .party to bring personaLinjurysuits (except for very serious injury or for death). No fault. planssometimes l:irecriticized for reducing.econ.omic incentives to be agood driver. While. this could occur, insurance companies couldtake account ofaccidents by increa!,!ing premiums for the partiescited in accidents. Thus,some incentive to avoid aCGidents wouldcontinue to be reflected in insurance premiums.
As far as we know, there is rio strong empiricalrecordJor oragainst the ability of no faultt6 control allto inswoance costs.Given the cost constraining potential 9fa. ~ell~designed andimplemented plan, however, no fault ,deserves more in-depthstudy to determine if an economically' beneficial plan can bedevised.
Improved Information. One of the ba'sic requirements ofcompetitive markets is that consumers must haveeno\lgh comparative product information to make informedde.~isions.Betterdecisionmaking and more. effective.shopping could·put pressureon insurance companies to be more efficient and innovative, thusholding premium costs below what they otherwise would be.Proposition 103 mandatesthat the depaitmEmt makeavailable tothe public an extensive comparative premium dat~ base. (Thisdata hase is expected to be available lateriri 1990.) This'data baseshould help eonsumers become more effective shoppers.
Another area inwhich the information available to consumersmight be improved is in reporting ofcomplaints. Many consumersbase insurance purchase decisions on service provided by insurers. Currently, it is difficult for consumers to obtain informationabout the behavior and servife quality ofinsurance eompanies atthe time they make purchase decisions. Improved monitoring andfrequent, periodic reporting ofcomplaints received bythe department (eross-referenced by company, by type of complaint and by

Proposition 103··0ne Year Later / 367
manner resolved) could provide important information to: (1)consumers, when shopping for insurance; (2) consumer groups,when evaluating companies; and (3) the Attorney General andlocal prosecutors, for use during consumer protection investigations. Regular reporting also could encourage companies, brokersand agents to improve their performance.
SUMMARY AND CONCLUSIONS
Our analysis ofthe past year's effort by the department to implementProposition 103 suggests that considerable time will passbefore the regulatory process has been fully developed and implemented. The department has proceeded slowly in developing thebasic regulations needed to govern the industry. Thus, there aremany procedures needed to regulate the industry that have notyet been developed. In effect, while much activity can be identifiedover the past year, the public is in essentially the same place aswhen the initiative passed. The GICH process, however, offerssome expectation that basic regulations ultimately will be formulated.
As we discussed above, one ofthe stated purposes ofProposition103 is to encourage a competitive insurance marketplace. Ouranalysis of the industry suggests that competitive elements arepresent in this industry and that it is not clear that California'shigh insurance rates are due to a noncompetitive insuranceindustry. Consequently, we feel that the insurance industry maynot require a very intrusive regulatory approach in order toadequately guard against noncompetitive performance. Whatever approach is used should take account ofa company's currentand projected financial position.
With regard to issues related to Proposition 103, we recommend that the Legislature review the statutes establishing CAARPto clarify the Legislature's intent regarding the plan's purpose. Inaddition, we recommend that the Legislature continue to reviewthe factors that affect the costs of insurance.