State of Wisconsin Public Service Commission of Wisconsin
41
State of Wisconsin Public Service Commission of Wisconsin Focus on Energy Evaluation Analysis of Consumer Electronics in Homes Final Report: February 19, 2010 Evaluation Contractor: PA Consulting Group, Inc. Prepared by: Tom Mauldin, Zack Tyler, and Lynn Hoefgen, NMR Group, Inc.
Transcript of State of Wisconsin Public Service Commission of Wisconsin

State of Wisconsin Public Service Commission of Wisconsin Focus on Energy Evaluation
Analysis of Consumer Electronics in Homes
Final Report: February 19, 2010
Evaluation Contractor: PA Consulting Group, Inc.
Prepared by: Tom Mauldin, Zack Tyler, and Lynn Hoefgen, NMR Group, Inc.

This report is the property of the state of Wisconsin, Public Service Commission of Wisconsin, and was funded through the Wisconsin Focus on Energy Program.
State of Wisconsin Public Service Commission
of Wisconsin Focus on Energy Evaluation
Analysis of Consumer Electronics in Homes
Final Report: February 19, 2010 © PA Knowledge Limited 2010
Liaison Contact: Dr. David Sumi PA Consulting Group Inc. 6410 Enterprise Lane, Suite 300 Madison, WI 53719 Tel: +1 608 316 3700 Fax: +1 608 661 5181 E-mail: [email protected]
Prepared by: Tom Mauldin, Zack Tyler, and Lynn Hoefgen, NMR Group Inc.
Acknowledgment: Ralph Prahl, Prahl & Associates, contributed critical review and analysis.

iii
Analysis of Consumer Electronics in Homes (Final). 2/19/10
TABLE OF CONTENTS
1. Executive Summary 1–1
2. Background 2–1
2.1 Methodology 2–1
3. Televisions and Accessories 3–1
3.1 Televisions 3–1 3.2 Television Accessories 3–4
4. Computers 4–1
5. Audio Electronics 5–1
6. Electricity Usage in Wisconsin 6–1
7. Comparison To Indiana 7–1
8. Demographics 8–1
8.1 Housing Characteristics 8–2 8.2 Social Attributes 8–3

1–1
Analysis of Consumer Electronics in Homes (Final). 2/19/10
1. EXECUTIVE SUMMARY
This report presents the findings of research conducted to understand the saturation and electricity usage of consumer electronics in Wisconsin homes. As part of the impact evaluation of the Focus on Energy ENERGY STAR® lighting program1 and the analysis of the market for compact fluorescent light bulbs (CFL) in Wisconsin2, on-site inventories of lighting products and consumer electronics were conducted. This report primarily draws upon these on-site inventories of consumer electronics at 75 homes in Wisconsin and 86 homes in Indiana, in addition to a review of published reports.
Table 1-1 compares key demographic information from the American Community Survey (ACS) three-year estimates (2005–2007) and the on-site participant sample for Wisconsin. The ACS data and on-site sample represent all types of homes in Wisconsin,including detached and attached single-family homes, as well as apartments and mobile homes (See Table 8-2 for more details).
Because the on-site data is weighted to reflect the population regarding homeownerhsip and education, the weighted on-site sample closely parallels the ACS data regarding these characterisitcs. However, on-site homes appear to be slightly larger in size but with fewer, somewhat older, household members, who earn slightly lower incomes than the population overall. Given the relatively minor differences, we believe that the weighted on-site sample adequately represents the population of Wisconsin.
Table 1-1. Demographic Comparison in Wisconsin (Base: All on-site respondents)
Demographic Variable Census (ACS)
On-sites (Weighted)
Homeownership: Percentage who own their home 70% 71%
Type of home: Percentage with single-family detached home 67% 65%
Home size: Percentage with four or more bedrooms 18% 27%
Household size: Average number of household members 2.5 2.2
Age: Percentage of householders over age 55 24% 32%
Income: Percentage ≥ $75,000 in annual household income 29% 22%
Education: Percentage with college degree or higher 25% 28%
Race/ethnicity: Percentage white 88% 95%
1 Lisa Wilson-Wright, Chris Russell, and Lynn Hoefgen, NMR Group. Residential Programs: Results of
the Multistate CFL Modeling Effort. Revised Draft Report. January 19, 2010.
2 Tom Mauldin, Greg Clendenning, and Lynn Hoefgen, NMR Group. The Market for CFLs in Wisconsin: Draft Report. December 31, 2009.

1. Executive Summary
1–2
Analysis of Consumer Electronics in Homes (Final). 2/19/10
Table 1-2 summarizes the household penetration of consumer electronics in Wisconsin, the average number of products in each home, the estimated annual electricity usage3, and the proportion of annual household electricity usage represented by each product. We assume that each household uses 7,560 kWh per year based on Energy Information Administration data. 4 Overall, the seventeen types of consumer electronics examined represent an estimated 12.1 percent of annual household electricity usage in Wisconsin. This figure is similar to an estimate from a recently completed Energy Center of Wisconsin (ECW) study of home plug-in devices in Minnesota which found that electronics represent about 12 percent of residential electricity usage. 5
The three products with the highest usage include cathode ray tube (CRT) televisions (2.6 percent), followed by cable set-top boxes (2.3 percent) and desktop computer hard-drives (1.9 percent). The remaining products each represent less than one percent of annual household consumption.
Twenty percent of Wisconsin homes have at least one each of the three products that use the most electricity (CRT television, desktop computer, and cable box). Twelve percent of Wisconsin homes have at least two CRT televisions, one desktop computer, and one cable box. These homes may provide a good opportunity for potential electricity savings with consumer electronics.
3 Final Field Research Report. Prepared by Ecos Consulting for the California Energy Commission.
October 31, 2006.
4 Energy Information Administration. Residential Energy Consumption Survey. 2005. Washington, DC.
Government Printing Office.
5 The ECW study estimated that plug-in devices account for 20 percent of home electricity usage and
that consumer electronics represent 60 percent of that figure, or 12 percent overall. However, the ECW study assumed a typical home uses 11,000 kWh per year, while we asssumed 7,560 kWh based on 2005 EIA data. Overall, ECW estimates that home electronics use about 1,320 kWh, while we estimate about 915 kWh. Because the ECW report is not available yet, we cannot determine how the 11,000 kWh figure was derived or which products are included under ‘home electronics’ in order to assess the comparability of the results. Scott Pigg and Ingo Bensch, Energy Center of Wisconsin. Scouting for Residential Electricity Savings. http://ecw.org/project.php?workid=3&resultid=410.

1. Executive Summary
1–3
Analysis of Consumer Electronics in Homes (Final). 2/19/10
Table 1-2. Household Penetration and Electricity Usage of Consumer Electronics in Wisconsin (Base: All on-site respondents)
Product
Percent of Homes with
Product
Average Number of
Products per Home (among
all homes)
Annual Electricity usage per
Home6 (kWh)
Percent of Annual
Household Electricity
Usage
Television
CRT 77% 1.57 193 2.6%
LCD 56% 0.68 53 0.7%
Plasma 1% 0.01 6 0.1%
TV accessories
Cable set-top box 48% 0.77 174 2.3%
Satellite set-top box 41% 0.45 56 0.7%
DVD player 47% 0.57 8 0.1%
VCR 32% 0.34 12 0.2%
Combination DVD/VCR 35% 0.38 11 0.2%
Game console 20% 0.23 4 0.1%
TiVo®/DVR 13% 0.18 65 0.9%
Computer
Desktop 39% 0.59 146 1.9%
Laptop 39% 0.58 48 0.6%
CRT monitor 35% 0.38 31 0.4%
LCD monitor 40% 0.50 35 0.5%
Audio electronics
Stereo set 30% 0.34 21 0.3%
Receiver/amplifier 22% 0.31 47 0.6%
CD player 21% 0.29 5 0.1%
6 Final Field Research Report. Prepared by Ecos Consulting for the California Energy Commission.
October 31, 2006.

1. Executive Summary
1–4
Analysis of Consumer Electronics in Homes (Final). 2/19/10
Below are a few suggestions to consider regarding potential energy-saving strategies for home electronics in Wisconsin.
• Encourage the replacement of CRT models with LCD models for both televisions and computer monitors. According to the California Energy Commission (CEC) study7, LCD televisions use about 37 percent less electricity than CRT televisions, while LCD monitors consume about 15 percent less electricity than CRT models. While the market has already begun shifting towards LCD technology, there are over twice as many CRT televisions as LCD televisions in each Wisconsin home (1.6 vs. 0.7 on average), while CRT and LCD monitors have a similar saturation, each about 0.5 per home. However, consumers tend to “trade up” smaller CRT televisions for larger LCD models, as evidenced by the fact that, in the on-sites, LCD televisions comprise a higher proportion of larger TVs than CRT models; this trend may negate some or all of the potential energy savings. 8 In addition, customers may simply move their old CRT TV to another room in their home after purchasing a new LCD model. One strategy may be to educate consumers about the energy usage of both large TVs and old CRT TVs and also encourage the purchase of ENERGY STAR-qualified TVs and monitors. Compared to a standard model, an ENERGY STAR television is estimated to save 52 kWh per year and an ENERGY STAR LCD monitor is estimated to save 35 kWh per year. 9
• Encourage the replacement of desktop computers with laptop computers. 10 According to the CEC study, laptops use about two-thirds less electricity than desktop hard-drive towers. A similar education message concerning the energy consumption of desktop vs. laptops may be an effective strategy, as well as promoting ENERGY STAR-qualified models. Compared to a standard model, an ENERGY STAR desktop computer is estimated to save 76 kWh per year and an ENERGY STAR laptop is estimated to save 11 kWh per year. 11 In addition, educating consumers about the energy savings from the appropriate power management settings for computers may be beneficial.12
7 Final Field Research Report. Prepared by Ecos Consulting for the California Energy Commission.
October 31, 2006.
8 The CEC study did not include data on energy usage of televisions by screen size. Therefore, we
cannot compare the energy usage of larger LCD models versus smaller CRT models.
9 Ron Swager, Patrick Engineering, Inc. Focus on Energy, Residential Deemed Savings Review.
February 2, 2009.
10 The on-site visits did not collect data regarding auxiliary devices that may be associated with laptop
computers, such as wireless routers. The addition of wireless routers might reduce the savings from switching to a laptop computer.
11 Ron Swager, Patrick Engineering, Inc. Focus on Energy, Residential Deemed Savings Review.
February 2, 2009.
12 We did not check the power management settings of computers during the on-site visits. However,
the recent ECW study in Minnesota found that 20 percent of 42 desktop computers were always on, 40

1. Executive Summary
1–5
Analysis of Consumer Electronics in Homes (Final). 2/19/10
• Consider working with local cable and satellite television providers to offer ENERGY STAR-qualified set-top boxes. ENERGY STAR-qualified set-top boxes are at least 30 percent more efficient than standard models, but do not appear to be available in Wisconsin yet, according to the ENERGY STAR website.13
• Educate the population about standby power loss (aka phantom load) and the benefits of smart power strips, which were not found in any homes in Wisconsin. Many consumer electronics draw standby power when turned off, and smart strips shut off power when products are not in use.
percent had long idle periods, 25 percent were turned off when not in use, and 15 percent were not used much.
13 http://www.energystar.gov/index.cfm?c=settop_boxes.settop_boxes.

2–1
Analysis of Consumer Electronics in Homes (Final). 2/19/10
2. BACKGROUND
This report presents the findings of research conducted to understand the saturation and electricity usage of consumer electronics in Wisconsin.
2.1 METHODOLOGY
This report drew upon several data sources: a random-digit dial (RDD) telephone survey among 503 households in Wisconsin and 600 households in Indiana, conducted by computer-assisted telephone interviewing (CATI). This telephone survey was followed by 75 on-site visits to Wisconsin households and 86 on-site visits to Indiana households, all recruited through the telephone surveys.
Because Indiana is similar to Wisconsin on many key demographic and socioeconomic characteristics, it was selected as the comparison state for Wisconsin.14 The consumer electronics data from Indiana is useful because it provides a point of comparison for judging whether the data found in Wisconsin is typical for the Midwest.
2.1.1 On-site visits
As part of the impact evaluation of the Focus on Energy ENERGY STAR lighting program15 and the analysis of the market for compact fluorescent light bulbs (CFL) in Wisconsin16, RDD telephone surveys and on-site lighting inventories were conducted in both Wisconsin and Indiana. After completing the telephone survey, the respondents were offered a $100 incentive to participate in an on-site visit. A total of 75 Wisconsin residents and 86 Indiana residents participated in an on-site inventory of consumer electronics.17 These on-site visits were conducted in July and August of 2009.
14 Tom Mauldin, Greg Clendenning, and Lynn Hoefgen, NMR Group. The Market for CFLs in
Wisconsin: Final Report. February 1, 2010. The key demographic and socioeconomic characteristics compared included the percent of the population that is white, percent of the population that is black, median household income, and the percent of the population that has a college degree or higher.
15 Lisa Wilson-Wright, Chris Russell, and Lynn Hoefgen, NMR Group. Residential Programs: Results of
the Multistate CFL Modeling Effort. Revised Draft Report. January 19, 2010.
16 Tom Mauldin, Greg Clendenning, and Lynn Hoefgen, NMR Group. The Market for CFLs in Wisconsin: Final Report. February 1, 2010
17 Because the inventory of consumer electronics was added after some respondents were already
recruited for the on-site lighting inventory, several participants refused to permit the auditor to collect data on electronics in their homes. Seven of the 82 Wisconsin on-site participants and two of the 88 Indiana on-site participants did not allow the auditors to collect electronics data.
2. Background
2–2
Analysis of Consumer Electronics in Homes (Final). 2/19/10
The on-site visits collected the following data regarding consumer electronics:
• Television type and size
• Combination features with television (e.g., DVD or VCR on television)
• DVD or VCR stand alone peripherals
• Cable or satellite boxes
• Digital video recorders
• Game consoles
• Laptops
• CRT and LCD monitors
• Stereo sets
• Stand alone receivers/amplifiers, CD players, and iPod® docking stations
• Smart strips (occupancy sensor power strips).
Figure 2-1 displays the locations of all 75 on-site visits in Wisconsin.

2. Background
2–3
Analysis of Consumer Electronics in Homes (Final). 2/19/10
Figure 2-1. Location of On-sites in Wisconsin
MilwaukeeMilwaukeeMilwaukeeMilwaukeeMilwaukeeMilwaukeeMilwaukeeMilwaukeeMilwaukee
MadisonMadisonMadisonMadisonMadisonMadisonMadisonMadisonMadison
Green BayGreen BayGreen BayGreen BayGreen BayGreen BayGreen BayGreen BayGreen Bay
43
10
12
29
41
90
29 29
53
14
2
13
2
2
53
27
61
27
63
29
8
54
8
1
2
3
5
Cities

2. Background
2–4
Analysis of Consumer Electronics in Homes (Final). 2/19/10
2.1.2 Data weighting
We selected weighting schemes to reflect the population using weighting factors based on American Community Survey18 (ACS) data for home ownership and education. Due to small on-site sample sizes for renters in both Wisconsin (13) and Indiana (23), we weighted by home ownership and also weighted only the home owners by education (Table 2-1).
Table 2-1. Population, Sample Sizes, and Weights by Homeownership and Education
Wisconsin Indiana
Population
(Households) Sample
Size Weight Population
(Households) Sample
Size Weight
State total 2,235,246 75 n/a 2,447,887 86 n/a
Owner-occupied, less than bachelors degree
1,117,347 32 1.2 1,317,275 38 1.2
Owner-occupied, bachelors degree or higher
454,210 28 0.5 447,405 24 0.7
Owner-occupied, don’t know education level
0 2 1.0 0 1 1.0
Renter-occupied 663,689 13 1.7 683,207 23 1.0
2.1.3 Sampling error
Table 2-2 shows the final sample sizes and the associated error margin at the 90 percent confidence level, assuming a 50/50 break in responses, for each of the on-site samples.
Table 2-2. Sample Size and Sampling Error
On-site Visits
Population (Households) Sample Size
Sampling Error at 90% Confidence
Interval
Wisconsin 2,235,246 75 ±9.6%
Indiana 2,447,887 86 ±8.9%
18 United States Bureau of the Census. 2005–2007 American Community Survey 3-Year Estimates.
http://factfinder.census.gov/servlet/DatasetMainPageServlet?_program=ACS&_submenuId=datasets_2&_lang=en.

2. Background
2–5
Analysis of Consumer Electronics in Homes (Final). 2/19/10
2.1.4 Secondary research
In addition to the on-sites, we also reviewed several reports in order to gather information regarding the home ownership trends for consumer electronics, as well as their annual electricity usage.
Ownership Trends. The data for ownership is derived from the Residential Energy Consumption Survey (RECS), administered by the Energy Information Administration (EIA) once every four years (1997, 2001, and 2005).19 The RECS information is presented for the East North Central division of the Midwest census region, which includes the following states: Wisconsin, Indiana, Michigan, Illinois, and Ohio.
RECS was designed to understand energy consumption of the residential sector in the United States. The survey is conducted in statistically selected areas of all 50 states and Washington D.C., in order to represent the overall population as accurately as possible. All of the statistics in RECS are estimates based on population values. Estimated values can be slightly (and randomly) inaccurate due to the fact that the survey is conducted with a only a subset of the total population.
There are several methodological differences that may affect the comparability of the results between RECS and the on-site inventories. First, RECS was conducted in 2005, whereas the on-site inventories were conducted in 2009; consumer electronics have evolved during the four years since RECS was conducted. In addition, RECS gathered data on consumer electronics primarily through in-person interviews; there was no visual identification of products by a trained auditor as there was for the on-sites. In addition, the RECS data includes several other states besides Wisconsin or Indiana in the East North Central division of the Midwest census region, as discussed earlier.
Consumer electronics is a rapidly evolving industry, with new products reaching the market on a regular basis. Therefore, there are several products included in the on-site inventory, such as digital video recorders, that were not part of the 2005 RECS.
Electricity Usage. We reviewed several reports in order to estimate the electricity consumption of consumer electronics.20,21 We decided to use data from the California Energy Commission (CEC) report because they metered and logged the electricity consumption for a wide range of products. While this study was conducted in California, we believe the results should be applicable to Wisconsin homes as we are not aware of regional differences in behavior that might affect electricity usage of consumer electronics.
19 Energy Information Administration. Residential Energy Consumption Survey. Washington, DC.
Government Printing Office. http://www.eia.doe.gov/emeu/recs/contents.html.
20 Energy Consumption by Consumer Electronics in U.S. Residences. Prepared by TIAX LLC for the
Consumer Electronics Association. January 2007.
21 Final Field Research Report. Prepared by Ecos Consulting for the California Energy Commission.
October 31, 2006.

2. Background
2–6
Analysis of Consumer Electronics in Homes (Final). 2/19/10
In this study, conducted in 2006, Ecos Consulting surveyed 300 residents in California regarding the number of various electronics in their homes. Of the 300 survey respondents, 75 had their homes monitored and metered using an instantaneous power measurement tool developed by Lawrence Berkeley National Laboratory. Finally, 50 of these homes were also monitored and metered using a logging protocol.

3–1
Analysis of Consumer Electronics in Homes (Final). 2/19/10
3. TELEVISIONS AND ACCESSORIES
In this section, we present data on the ownership trends, types, and sizes of televisions and accessories.
3.1 TELEVISIONS
3.1.1 Television ownership
Figure 3-1 displays the ownership trends of televisions (TVs) in the East North Central division of the Midwest census region, from 1997 to 2005. The average number of TVs in each home increased from 2.1 in 1997 to 2.6 in 2005, representing a 20 percent increase in the average number of TVs per home.22 Thirty-one percent of all households had only one color TV in 1997, compared to 21 percent in 2005. In contrast, only 11 percent of all households had four or more color TVs in 1997, while 20 percent of all households had four or more color TVs in 2005.
Figure 3-1. Color Television Ownership, EIA 1997–2005
22 RECS categorizes the number of televisions in the following categories: 1, 2, 3, 4, and 5 or more.
The “5 or more” category was assumed to have an average of 5.5 televisions in order to estimate the average number of televisions per household.
3. Televisions and Accessories
3–2
Analysis of Consumer Electronics in Homes (Final). 2/19/10
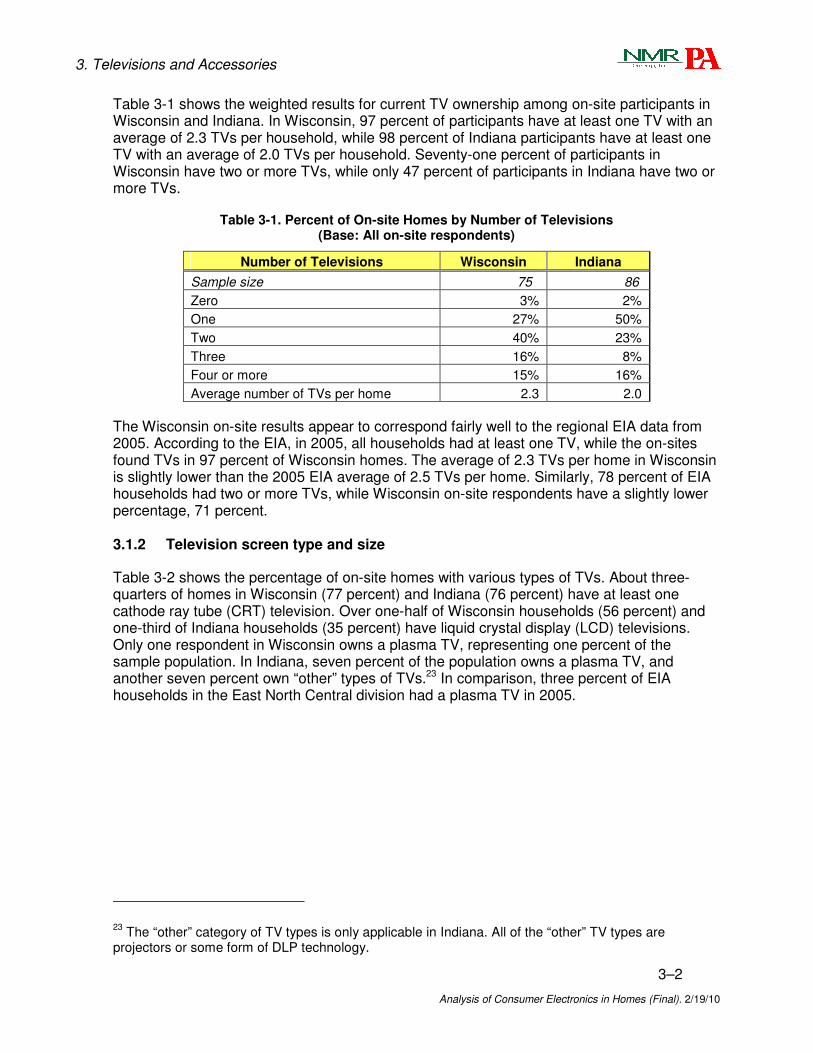
Table 3-1 shows the weighted results for current TV ownership among on-site participants in Wisconsin and Indiana. In Wisconsin, 97 percent of participants have at least one TV with an average of 2.3 TVs per household, while 98 percent of Indiana participants have at least one TV with an average of 2.0 TVs per household. Seventy-one percent of participants in Wisconsin have two or more TVs, while only 47 percent of participants in Indiana have two or more TVs.
Table 3-1. Percent of On-site Homes by Number of Televisions (Base: All on-site respondents)
Number of Televisions Wisconsin Indiana
Sample size 75 86
Zero 3% 2%
One 27% 50%
Two 40% 23%
Three 16% 8%
Four or more 15% 16%
Average number of TVs per home 2.3 2.0
The Wisconsin on-site results appear to correspond fairly well to the regional EIA data from 2005. According to the EIA, in 2005, all households had at least one TV, while the on-sites found TVs in 97 percent of Wisconsin homes. The average of 2.3 TVs per home in Wisconsin is slightly lower than the 2005 EIA average of 2.5 TVs per home. Similarly, 78 percent of EIA households had two or more TVs, while Wisconsin on-site respondents have a slightly lower percentage, 71 percent.
3.1.2 Television screen type and size
Table 3-2 shows the percentage of on-site homes with various types of TVs. About three-quarters of homes in Wisconsin (77 percent) and Indiana (76 percent) have at least one cathode ray tube (CRT) television. Over one-half of Wisconsin households (56 percent) and one-third of Indiana households (35 percent) have liquid crystal display (LCD) televisions. Only one respondent in Wisconsin owns a plasma TV, representing one percent of the sample population. In Indiana, seven percent of the population owns a plasma TV, and another seven percent own “other” types of TVs.23 In comparison, three percent of EIA households in the East North Central division had a plasma TV in 2005.
23 The “other” category of TV types is only applicable in Indiana. All of the “other” TV types are
projectors or some form of DLP technology.

3. Televisions and Accessories
3–3
Analysis of Consumer Electronics in Homes (Final). 2/19/10
Table 3-2. Percent of On-site Homes by Television Type** (Base: All on-site respondents)
Television Screen Type Wisconsin Indiana
Sample size 75 86
Cathode ray tube (CRT) 77% 76%
Liquid crystal display (LCD) 56% 35%
Plasma 1% 7%
Other 0% 7%
**Table may add to more than 100 percent as households may own more than one TV type.
In 2005, 29 percent of all households in the East North Central division owned at least one large screen TV, while five percent of households had at least two large screen TVs (Table 3-3).24 The EIA did not develop criteria regarding the definition of a large screen TV; instead, the definition of a large screen TV was interpreted by each of the interviewers.25
Table 3-3. Large Screen Televisions, EIA 2005
Number of Large Screen TVs East North
Central Division
One 24%
Two 3%
Three or more26
1%
Total 29%
Table 3-4 displays the percent of on-site homes with different sizes of TVs. In Wisconsin, 47 percent of the homes have TVs with a screen size between 24 and 30 inches; in Indiana, 42 percent of homes have 24 to 30 inch TVs while 41 percent have 18 to 23 inch TVs.
In order to compare the on-site results to the RECS data, we assume that a large screen TV has a screen size of at least 32 inches. According to Table 3-3, 29 percent of all households in the East North Central division had at least one large screen TV in 2005. In Wisconsin, among on-site respondents, 67 percent have a large screen TV of 32 inches or more in size.
24 For the five percent of homeowners with at least two or more large screen televisions, an assumption
was made that 0.2 million housing units had three or more large screen televisions.
25 Personal communication with Chip Berry, RECS Project Manager for the EIA. December 28, 2009.
26 The EIA did not publish this data because the relative standard error was greater than 50 percent or
fewer than 10 households were sampled. We deduced the missing values based on other data available from the EIA.

3. Televisions and Accessories
3–4
Analysis of Consumer Electronics in Homes (Final). 2/19/10
Table 3-4. Percent of On-site Homes by Size of Television** (Base: All on-site respondents)
TV Size (Inches) Wisconsin Indiana
Sample size 75 86
12” to 17” 20% 18%
18” to 23” 36% 41%
24” to 30” 47% 42%
32” to 40” 36% 36%
42” or more 36% 24%
**Table may add to more than 100 percent as households may own more than one TV size.
Table 3-5 shows the distribution of screen sizes and screen type by the percent of TVs, rather than the percent of homes. In both Wisconsin and Indiana, CRT models represent over 80 percent of the smaller sized TVs (30 inches or less). In contrast, LCD models account for one-half or more of the larger screen TVs (32 inches or more).
Table 3-5. Percent of Televisions by Size and Type for On-site Homes (Base: All on-site respondents)
Wisconsin Indiana TV Size (Inches) CRT LCD Plasma Other Total CRT LCD Plasma Other Total
Sample size 170 176
12 to 17 11% 1% 0% – 12% 9% 1% 1% 0% 11%
18 to 23 19% 4% 0% – 23% 29% 4% 0% 0% 33%
24 to 30 24% 6% 0% – 30% 18% 3% 1% 0% 22%
32 to 40 9% 9% 0% – 18% 12% 6% 2% 0% 20%
42 or more 6% 11% 1% – 18% 1% 7% 2% 4% 14%
Percent of all TV’s
69% 30% 1% – 100% 69% 21% 6% 4% 100%
3.2 TELEVISION ACCESSORIES
3.2.1 Cable and satellite units
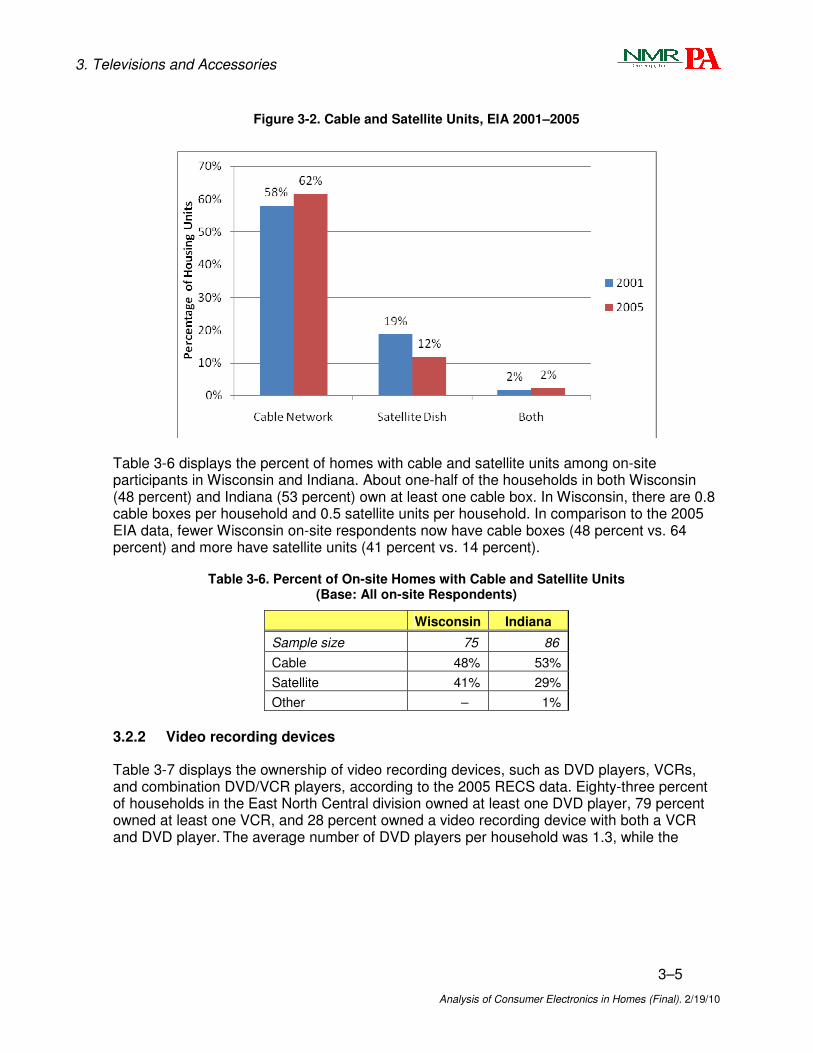
Figure 3-2 displays the ownership of cable and satellite TV units, according to RECS. In 2001, 60 percent of all households had cable units while 21 percent had satellite units. In 2005, the percentage of homes with cable rose to 64 percent, while the percentage with satellite declined to 14 percent.
3. Televisions and Accessories
3–5
Analysis of Consumer Electronics in Homes (Final). 2/19/10
Figure 3-2. Cable and Satellite Units, EIA 2001–2005
Table 3-6 displays the percent of homes with cable and satellite units among on-site participants in Wisconsin and Indiana. About one-half of the households in both Wisconsin (48 percent) and Indiana (53 percent) own at least one cable box. In Wisconsin, there are 0.8 cable boxes per household and 0.5 satellite units per household. In comparison to the 2005 EIA data, fewer Wisconsin on-site respondents now have cable boxes (48 percent vs. 64 percent) and more have satellite units (41 percent vs. 14 percent).
Table 3-6. Percent of On-site Homes with Cable and Satellite Units (Base: All on-site Respondents)
Wisconsin Indiana
Sample size 75 86
Cable 48% 53%
Satellite 41% 29%
Other – 1%
3.2.2 Video recording devices
Table 3-7 displays the ownership of video recording devices, such as DVD players, VCRs, and combination DVD/VCR players, according to the 2005 RECS data. Eighty-three percent of households in the East North Central division owned at least one DVD player, 79 percent owned at least one VCR, and 28 percent owned a video recording device with both a VCR and DVD player. The average number of DVD players per household was 1.3, while the

3. Televisions and Accessories
3–6
Analysis of Consumer Electronics in Homes (Final). 2/19/10
average number VCRs per household and combination VCR/DVD players per household were 1.2 and 0.4, respectively.27
Table 3-7. Home Ownership of Video Recording Devices, EIA 2005
Video Recording Device Number East North
Central Division
Zero 17%
One 54%
Two 20%
DVD players
Three or more 9%
Zero 21%
One 49%
Two 21%
VCRs
Three or more 9%
Zero 71%
One 24%
Two 4%
Combination DVD player/VCR
Three or more 1%
Table 3-8 displays the current ownership of video recording devices among on-site participants in both Wisconsin and Indiana. Almost one-half of the homes in each state own at least one DVD player and about 30 percent of households own at least one VCR. Finally, some households own a combination DVD/VCR player; 35 percent of households in Wisconsin do while 13 percent of households in Indiana do.
The on-site homes have fewer video recording devices compared to the 2005 RECS data for the East North Central division. In 2005, according to the EIA, households had an average of 1.3 DVD players and 1.2 VCRs in their homes, which is about twice the number of DVD players (0.6) and triple the number of VCRs (0.4) among Wisconsin on-site respondents.
27 RECS allocates the number of video recording devices in the following categories: 1, 2, and 3 or
more. The “3 or more” category was assumed to have an average of 3.5 video recording devices in order to estimate the average number of video recording devices per household.

3. Televisions and Accessories
3–7
Analysis of Consumer Electronics in Homes (Final). 2/19/10
Table 3-8. Percent of On-site Homes with Video Recording Devices (Base: All on-site respondents)
Video Recording Device Number Wisconsin Indiana
Sample size 75 86
Zero 53% 56%
One 33% 35%
Two 13% 5%
DVD players
Three or more 0% 5%
Zero 68% 69%
One 27% 30%
Two 5% 1%
VCRs
Three or more 0% 0%
Zero 65% 87%
One 27% 8%
Two 8% 3%
Combination DVD player/VCR
Three or more 0% 1%
Digital Video Recording Devices. Table 3-9 shows the percentage of on-site homes with TiVo®/DVR. In both Wisconsin and Indiana, the majority of the population (87 percent in Wisconsin and 77 percent in Indiana) has yet to adopt the TiVo/DVR technology. In Wisconsin, the average number of TiVo/DVRs per household is 0.2, while in Indiana the average is 0.3 per household.
Table 3-9. Percent of On-site Homes with TiVo/DVR (Base: All on-site respondents)
Number of Digital Video Recording Devices Wisconsin Indiana
Sample size 75 86
Zero 87% 77%
One 11% 22%
Two or more 3% 1%
Average number per home 0.2 0.3
3.2.3 Game consoles
Table 3-10 displays the home ownership of game consoles among the on-site respondents. The data is aggregated among various types of game consoles, which primarily consist of Xbox®, Nintendo Wii®, and PlayStation®. Twenty percent of on-site respondents in Wisconsin and 31 percent in Indiana own at least one game console.
According to RECS, 33 percent of homes in the East North Central division had some form of TV based game console in 2005. This is very similar to the 31 percent of on-site homes in Indiana though higher than the 20 percent in Wisconsin.

3. Televisions and Accessories
3–8
Analysis of Consumer Electronics in Homes (Final). 2/19/10
Table 3-10. Percent of On-site Homes with Game Consoles (Base: All on-site respondents)
Number of Game Consoles Wisconsin Indiana
Sample size 75 86
Zero 80% 69%
One 16% 27%
Two 3% 5%
Three or more 1% 0%
Average number per home 0.2 0.3

4–1
Analysis of Consumer Electronics in Homes (Final). 2/19/10
4. COMPUTERS
Figure 4-1 displays the percent of households with a personal computer in the East North Central division from RECS data. Between 1997 and 2005, home computer usage nearly doubled from 38 percent to 68 percent of households. During that span, the average number of computers in each home has risen from 0.5 in 1997 to 1.3 in 2005.28
Figure 4-1. Households with a Personal Computer, EIA 1997–2005
Between 2001 and 2005, there was an increase in the use of both desktop and laptop computers in homes (Figure 4-2).29 The percent of homes with a desktop increased from 51 percent to 68 percent, while laptop use rose from 13 percent to 19 percent.
28 RECS changed the categories for reporting the number of computers, from 1 and “2 or more” to 1, 2,
or “3 or more”. The “2 or more” category was assumed to have an average of 2.5 in order to estimate the average number per household. The “3 or more” category was assumed to have an average of 3.5 n order to estimate the average number per household.
29 The 1997 EIA data was excluded from Figure 4-2. The RECS reported personal computer use in
1997, but did not distinguish between desktops and laptops.

4. Computers
4–2
Analysis of Consumer Electronics in Homes (Final). 2/19/10
Figure 4-2. Households with Desktops/Laptop Computers, EIA 2001–2005
According to the on-sites, 39 percent of Wisconsin participants had a laptop computer and 28 percent of Indiana participants had a laptop computer (Table 4-1). In 2005, the East North Central division had a 19 percent laptop saturation rate, indicating a continuation of the trend towards higher laptop usage. In addition, the average number of laptops per household in Wisconsin is 0.6, which is double the 0.3 laptops per household reported by the EIA in 2005.
Table 4-1. Percent of Homes with Laptop Computers (Base: All on-site respondents)
Laptop Computers Wisconsin Indiana
Sample size 75 86
Zero 61% 72%
One 24% 19%
Two 12% 7%
Three or more 3% 3%
Average number per home 0.6 0.4
Computer Monitors. In 2005, 46 percent percent of households in the East North Central division owned a CRT monitor for a desktop computer, while 11 percent owned an LCD monitor for a desktop computer (Table 4-2). Twelve percent of all households had a laptop computer with an LCD screen in their home.

4. Computers
4–3
Analysis of Consumer Electronics in Homes (Final). 2/19/10
Table 4-2. Ownership of Computer Monitors, EIA 2005
Computer Monitors East North
Central Division
Desktop CRT 46%
Desktop LCD 11%
Laptop (LCD) 12%
According to the on-sites, 31 percent of Wisconsin participants own a CRT monitor and 43 percent own an LCD monitor (Table 4-3). In comparison, 27 percent of Indiana on-site participants own a CRT monitor and 33 percent own an LCD monitor. Compared to the EIA data, these figures suggest a trend of households shifting from CRT to LCD monitors, as might be expected.
Table 4-3. Percent of On-site Homes by Monitor Use Type (Base: All on-site respondents)
Wisconsin Indiana
Computer Monitors CRT LCD CRT LCD
Sample size 75 86
Zero 69% 57% 73% 67%
One 28% 35% 22% 26%
Two 1% 8% 5% 4%
Three or more 2% 0% 0% 3%
Average number per home 0.4 0.5 0.3 0.4

5–1
Analysis of Consumer Electronics in Homes (Final). 2/19/10
5. AUDIO ELECTRONICS
Figure 5-1 displays the household ownership of audio devices in the East North Central division, according to EIA data. Since 2001, there has been a slight increase in all audio technologies with the exception of compact stereo systems,30 which saw a five percent decrease in ownership from 2001 to 2005.
Figure 5-1. Household Ownership of Audio Devices, EIA 2001–2005
Table 5-1 displays the current use of audio electronics among on-site respondents in both Wisconsin and Indiana. In Wisconsin, 30 percent of on-site respondents own a stereo system while in Indiana only 14 percent of respondents do. This is similar to the 28 percent of homeowners in the East North Central division who owned a compact stereo system in 2005. Twenty-one percent of Wisconsin on-site participants have a receiver or amplifier, 20 percent have a CD player, and only one percent has an iPod docking station. In Indiana, 27 percent of on-site participants have a receiver or amplifier, 34 percent have a CD player, and 16 percent have an iPod docking station. These differences may be due to the higher proportion of younger people in Indiana households than Wisconsin households, who may be more likely to use iPods and less likely to use stereo systems and CD players (Table 8-9).
30 Generally, a compact stereo is a stereo system in which the speakers, receiver, CD player, etc. are
all connected in one piece. A component stereo is a stereo system in which the speakers, receiver, and other parts are detached from one another.

5. Audio Electronics
5–2
Analysis of Consumer Electronics in Homes (Final). 2/19/10
Table 5-1. Percent of On-site Homes with Stereo Systems and Receivers/Amplifiers (Base: All on-site respondents)
Audio Equipment Number Wisconsin Indiana
Sample size 75 86
Zero 71% 86%
One 25% 13%
Two 5% 1%
Three or more 0% 0%
Stereo systems
Average number per home 0.3 0.2
Zero 79% 73%
One 17% 24%
Two 4% 1%
Three or more 2% 1%
Receivers/amplifiers
Average number per home 0.3 0.3
Zero 80% 66%
One 16% 25%
Two 2% 4%
Three or more 3% 6%
CD players
Average number per home 0.3 0.5
Zero 99% 84%
One 1% 15%
Two 1% 1%
Three or more 0% 0%
iPod docking station
Average number per home <0.1 0.2

6–1
Analysis of Consumer Electronics in Homes (Final). 2/19/10
6. ELECTRICITY USAGE IN WISCONSIN
Table 6-1 summarizes the household penetration of consumer electronics in Wisconsin (according to the on-sites), the average number of products in each home (for homes with the product installed), and the estimated annual electricity usage per product.
Table 6-1. Consumer Electronics in Wisconsin Homes (Base: All on-site respondents)
Product Percent of Homes
with Product
Average Number of Products per Home (among Homes with
Product Installed)
Annual Electricity Usage per Product
31
(kWh)
Television
CRT 77% 2.0 123
LCD 56% 1.2 77
Plasma 1% 1.0 441
TV accessories
Cable set-top box 48% 1.6 226
Satellite set-top box 41% 1.1 124
DVD player 47% 1.2 14
VCR 32% 1.1 36
Combination DVD/VCR 35% 1.1 30
Game console 20% 1.2 17
TiVo/DVR 13% 1.3 36332
Computer
Desktop 39%33
1.433
248
Laptop 39% 1.5 83
CRT monitor 35% 1.1 82
LCD monitor 40% 1.3 69
31
Final Field Research Report. Prepared by Ecos Consulting for the California Energy Commission. October 31, 2006. Ecos consulting monitored a sample of each technology. In some cases, it was not possible to determine which power mode the product was using. This often resulted in two different annual energy consumption estimates for the same type of product: one value in which the operating mode was known, and another value in which the operating mode was not known. This table presents a weighted average of these cases.
32 Personal video recorder (PVR).
33 Data on desktop hard-drive towers was not collected during the onsites. However, data was
collected on the number of laptops, some of which might be connected to a computer monitor using a docking station; we assume that one-half of the laptops use a docking station. Therefore, we estimated the number of desktop hard-drive towers by subtracting one-half of the number of laptops from the total number of CRT and LCD monitors.

6. Electricity Usage in Wisconsin
6–2
Analysis of Consumer Electronics in Homes (Final). 2/19/10
Product Percent of Homes
with Product
Average Number of Products per Home (among Homes with
Product Installed)
Annual Electricity Usage per Product
31
(kWh)
Audio electronics
Stereo set 30% 1.2 6134
Receiver/amplifier 22% 1.4 15335
CD player 21% 1.5 1836
iPod docking station 2% 1.0 n/a
In Table 6-2, the average number of products in each home is calculated across all on-site participants. The third column displays the estimated annual electricity usage of each product per home, based on the average number of products per home and the annual electricity consumption of each product (see Table 6-1). We then estimated the proportion of annual household electricity usage represented by each product, assuming that each household uses 7,560 kWh.37
Overall, the seventeen products38 in Table 6-2 account for an estimated 12.1 percent of annual household electricity usage. This figure is similar to an estimate from a recently completed Energy Center of Wisconsin (ECW) study of home plug-in devices in Minnesota which found that electronics represent about 12 percent of residential electricity usage. 39
The three products with the highest usage include CRT televisions (2.6 percent), followed by cable set-top boxes (2.3 percent) and desktop computer hard-drives (1.9 percent). The remaining products each represent less than 1 percent of annual household consumption.
Twenty percent of Wisconsin homes have at least one each of the three products that use the most electricity (CRT television, desktop computer, and cable box). Twelve percent of
34
Audio mini-system.
35 Average among receivers and amplifiers.
36 Boom box.
37 Energy Information Administration. Residential Energy Consumption Survey. 2005. Washington, DC.
Government Printing Office. http://www.eia.doe.gov/emeu/recs/recs2005/c&e/appliances&lighting/pdf/tableap5.pdf
38 Excluding the iPod docking station, for which there is no electricity usage data.
39 The ECW study estimated that plug-in devices account for 20 percent of home electricity usage and
that consumer electronics represent 60 percent of that figure, or 12 percent overall. However, the ECW study assumed a typical home uses 11,000 kWh per year, while we asssumed 7,560 kWh based on 2005 EIA data. Overall, ECW estimates that home electronics use about 1,320 kWh, while we estimate about 915 kWh. Because the ECW report is not available yet, we cannot determine how the 11,000 kWh figure was derived or which products are included under “home electronics” in order to assess the comparability of the results. Scott Pigg and Ingo Bensch, Energy Center of Wisconsin. Scouting for Residential Electricity Savings. http://ecw.org/project.php?workid=3&resultid=410.
6. Electricity Usage in Wisconsin
6–3
Analysis of Consumer Electronics in Homes (Final). 2/19/10
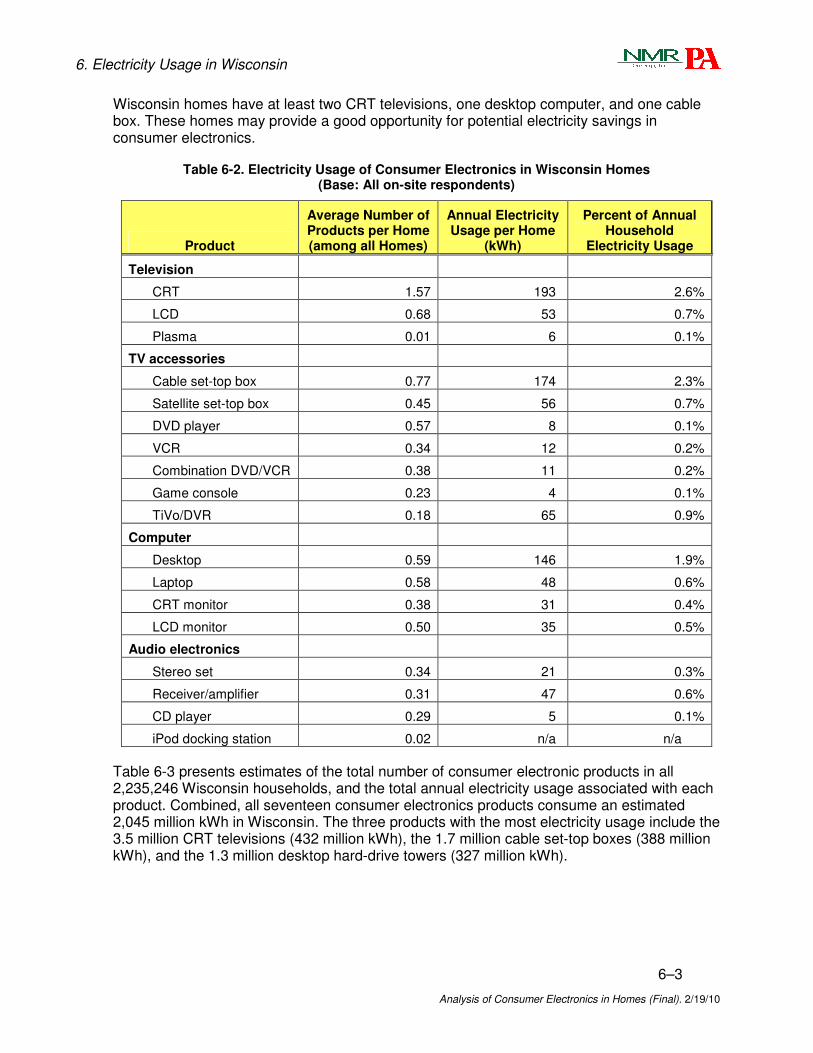
Wisconsin homes have at least two CRT televisions, one desktop computer, and one cable box. These homes may provide a good opportunity for potential electricity savings in consumer electronics.
Table 6-2. Electricity Usage of Consumer Electronics in Wisconsin Homes (Base: All on-site respondents)
Product
Average Number of Products per Home (among all Homes)
Annual Electricity Usage per Home
(kWh)
Percent of Annual Household
Electricity Usage
Television
CRT 1.57 193 2.6%
LCD 0.68 53 0.7%
Plasma 0.01 6 0.1%
TV accessories
Cable set-top box 0.77 174 2.3%
Satellite set-top box 0.45 56 0.7%
DVD player 0.57 8 0.1%
VCR 0.34 12 0.2%
Combination DVD/VCR 0.38 11 0.2%
Game console 0.23 4 0.1%
TiVo/DVR 0.18 65 0.9%
Computer
Desktop 0.59 146 1.9%
Laptop 0.58 48 0.6%
CRT monitor 0.38 31 0.4%
LCD monitor 0.50 35 0.5%
Audio electronics
Stereo set 0.34 21 0.3%
Receiver/amplifier 0.31 47 0.6%
CD player 0.29 5 0.1%
iPod docking station 0.02 n/a n/a
Table 6-3 presents estimates of the total number of consumer electronic products in all 2,235,246 Wisconsin households, and the total annual electricity usage associated with each product. Combined, all seventeen consumer electronics products consume an estimated 2,045 million kWh in Wisconsin. The three products with the most electricity usage include the 3.5 million CRT televisions (432 million kWh), the 1.7 million cable set-top boxes (388 million kWh), and the 1.3 million desktop hard-drive towers (327 million kWh).

6. Electricity Usage in Wisconsin
6–4
Analysis of Consumer Electronics in Homes (Final). 2/19/10
Table 6-3. Electricity Usage of Consumer Electronics in Wisconsin Homes (Base: All on-site respondents)
All Consumer Electronics
Total Number of Products in
Wisconsin Homes
Total Annual Electricity Usage
(Million kWh)
Television
CRT 3,516,042 432
LCD 1,528,908 118
Plasma 31,293 14
TV accessories
Cable set-top box 1,721,139 388
Satellite set-top box 1,012,566 125
DVD player 1,283,031 18
VCR 759,984 27
Combination DVD/VCR
844,923 25
Game console 523,048 9
TiVo/DVR 397,874 144
Computer
Desktop 1,316,560 327
Laptop 1,291,972 107
CRT monitor 840,452 69
LCD monitor 1,124,329 78
Audio electronics
Stereo set 762,219 46
Receiver/amplifier 683,985 105
CD player 648,221 12
iPod docking station 49,175 n/a

6. Electricity Usage in Wisconsin
6–5
Analysis of Consumer Electronics in Homes (Final). 2/19/10
Summary. Overall, the seventeen consumer electronics products inventoried during the on-sites represent an estimated 12.1 percent of annual household electricity usage in Wisconsin. The three products with the highest usage include CRT televisions (2.6 percent), followed by cable set-top boxes (2.3 percent) and desktop computer hard-drives (1.9 percent). The remaining products each represent less than one percent of annual household consumption.
Twenty percent of Wisconsin homes have at least one each of the three products that use the most electricity (CRT television, desktop computer, and cable box). Twelve percent of Wisconsin homes have at least two CRT televisions, one desktop computer, and one cable box. These homes may provide a good opportunity for potential electricity savings in consumer electronics. Below are a few suggestions to consider regarding potential energy saving strategies for home electronics.
• Encourage the replacement of CRT models with LCD models for both televisions and computer monitors. According to the CEC study, LCD televisions use about 37 percent less electricity than CRT televisions, while LCD monitors consume about 15 percent less electricity than CRT models. While the market has already begun shifting towards LCD technology, there are over twice as many CRT televisions as LCD televisions in each Wisconsin home (1.6 vs. 0.7 on average), while CRT and LCD monitors have a similar saturation, each about 0.5 per home. However, consumers tend to “trade up” smaller CRT televisions for larger LCD models, as evidenced by the fact that, in the on-sites, LCD televisions comprise a higher proportion of larger TVs than CRT models; this trend may negate some or all of the potential energy savings.40 In addition, customers may simply move their old CRT TV to another room in their home after purchasing a new LCD model. One strategy may be to educate consumers about the energy usage of both large LCD TVs and old CRT TVs and also encourage the purchase of ENERGY STAR-qualified TVs and monitors. Compared to a standard model, an ENERGY STAR television is estimated to save 52 kWh per yearand an ENERGY STAR LCD monitor is estimated to save 35 kWh per year. 41
• Encourage the replacement of desktop computers with laptop computers.42 According to the CEC study, laptops use about two-thirds less electricity than desktop hard-drive towers. A similar education message concerning the energy consumption of desktop vs. laptops may be an effective strategy, as well as promoting ENERGY STAR-qualified models. Compared to a standard model, an ENERGY STAR desktop computer is estimated to save 76 kWh per year and an
40 The CEC study did not include data on energy usage of televisions by screen size. Therefore, we
cannot compare the energy usage of larger LCD models versus smaller CRT models.
41 Ron Swager, Patrick Engineering, Inc. Focus on Energy, Residential Deemed Savings Review.
February 2, 2009.
42 The on-site visits did not collect data regarding auxiliary devices that may be associated with laptop
computers, such as wireless routers. The addition of wireless routers might reduce the savings from switching to a laptop computer.

6. Electricity Usage in Wisconsin
6–6
Analysis of Consumer Electronics in Homes (Final). 2/19/10
ENERGY STAR laptop is estimated to save 11 kWh per year. 43 In addition, educating consumers about the energy savings from the appropriate power management settings for computers may be beneficial. 44
• Consider working with local cable and satellite television providers to offer ENERGY STAR-qualified set-top boxes. ENERGY STAR-qualified set-top boxes are at least 30 percent more efficient than standard models, but do not appear to be available in Wisconsin yet, according to the ENERGY STAR website.45
• Educate the population about standby power loss (aka phantom load) and the benefits of smart power strips, which were not found in any homes in Wisconsin. Many consumer electronics draw standby power when turned off, and smart strips shut off power when products are not in use.
43 Ron Swager, Patrick Engineering, Inc. Focus on Energy, Residential Deemed Savings Review.
February 2, 2009.
44 We did not check the power management settings of computers during the on-site visits. However,
the recent ECW study in Minnesota found that 20 percent of 42 desktop computers were always on, 40 percent had long idle periods, 25 percent were turned off when not in use, and 15 percent were not used much.
45 http://www.energystar.gov/index.cfm?c=settop_boxes.settop_boxes.

7–1
Analysis of Consumer Electronics in Homes (Final). 2/19/10
7. COMPARISON TO INDIANA
For both Wisconsin and Indiana, Table 7-1 displays the percent of on-site homes with each product as well as the average number of products in each on-site home. Overall, the figures are fairly similar, except for a few products.
Table 7-1. Consumer Electronics in Wisconsin and Indiana Homes (Base: All on-site respondents)
Wisconsin Indiana
Product
Percent of Homes with
Product
Average Number of
Products per Home (among
all Homes)
Percent of Homes with
Product
Average Number of
Products per Home (among
all Homes)
Television
CRT 77% 1.57 76% 1.42
LCD 56% 0.68 35% 0.43
Plasma 1% 0.01 7% 0.09
Other (projection) 0% 0.00 7% 0.11
TV accessories
Cable set-top box 48% 0.77 53% 0.92
Satellite set-top box 41% 0.45 29% 0.61
DVD player 47% 0.57 45% 0.62
VCR 32% 0.34 31% 0.33
Combination DVD/VCR 35% 0.38 12% 0.19
Game console 20% 0.23 32% 0.34
TiVo/DVR 13% 0.18 23% 0.26
Computer
Desktop46
39% 0.59 51% 0.55
Laptop 39% 0.58 28% 0.41
CRT monitor 35% 0.38 27% 0.33
LCD monitor 40% 0.50 33% 0.43
46
Data on desktop hard-drive towers was not collected during the onsites. However, data was collected on the number of laptops, some of which might be connected to a computer monitor using a docking station; we assume that one-half of the laptops use a docking station. Therefore, we estimated the number of desktop hard-drive towers by subtracting one-half of the number of laptops from the total number of CRT and LCD monitors.

7. Comparison To Indiana
7–2
Analysis of Consumer Electronics in Homes (Final). 2/19/10
Wisconsin Indiana
Product
Percent of Homes with
Product
Average Number of
Products per Home (among
all Homes)
Percent of Homes with
Product
Average Number of
Products per Home (among
all Homes)
Audio electronics
Stereo set 30% 0.34 14% 0.15
Receiver/amplifier 22% 0.31 26% 0.33
CD player 21% 0.29 35% 0.51
iPod docking station 2% 0.02 16% 0.17

8–1
Analysis of Consumer Electronics in Homes (Final). 2/19/10
8. DEMOGRAPHICS
Table 8-1 compares key demographic information from the American Community Survey (ACS) three-year estimates (2005–2007) and the weighted on-site participants (collected during the RDD telephone surveys). The comparisons are intended to provide insight into how well the weighted on-site samples represent the population in each state.
The ACS data indicates that the populations of Wisconsin and Indiana are very similar on many key demographic and socioeconomic characteristics. In addition, the Wisconsin weighted on-site sample closely parallels the census data, though on-site homes tend to be larger (27 percent vs. 18 percent with 4+ bedrooms) and on-site households tend to have fewer members (2.2 vs. 2.5, on average), have a higher proportion of older members (32 percent vs. 24 percent over age 55), and be slightly lower income (22 percent vs. 29 percent earn more than $75,000).
Table 8-1. Demographic Comparison, Wisconsin and Indiana (Base: All on-site respondents)
Wisconsin Indiana
Demographic Variable Census
On-sites
(Weighted) Census
On-sites
(Weighted)
Homeownership: Percentage who own their home
70% 71% 72% 72%
Home size: Percentage with four or more bedrooms
18% 27% 18% 28%
Household size: Average number of household members
2.5 2.2 2.6 1.9
Age: Percentage of householders over age 55
24% 32% 23% 18%
Income: Percentage ≥ $75,000 in annual household income
29% 22% 26% 16%
Education: Percentage with college degree or higher
25% 28% 22% 23%
Race/ethnicity: Percentage white 88% 95% 86% 83%
Gender: Percentage female 50% 55% 51% 60%

8. Demographics
8–2
Analysis of Consumer Electronics in Homes (Final). 2/19/10
8.1 HOUSING CHARACTERISTICS
Because the on-site data are weighted to reflect the population on homeownership, the on-site results are similar to the ACS data regarding homeownership (Table 8-2).
Table 8-2. Homeownership Status and Type of Home (Base: All on-site respondents)
Wisconsin Indiana
Ownership Status Census On-sites
(Weighted) Census On-sites
(Weighted)
Sample size 2,235,246 75 2,447,887 86
Own/buying 70% 71% 72% 72%
Rent 30% 29% 28% 28%
Don’t know/refused – – – –
Type of Home
Single-family detached 67% 65% 72% 77%
Single-family attached (duplex, row home) 4% 6% 4% 7%
Apartment with 2–4 units 11% 9% 7% 8%
Apartment with 5+ units 14% 17% 12% 5%
Mobile home 4% 2% 6% 4%
Other 0% 2% 0% –
Don’t know/refused – – – –
In both Wisconsin and Indiana, on-site respondents appear to live in similarly aged homes as the overall population in each state (Table 8-3).
Table 8-3. Decade Home Was Built (Base: All on-site respondents)
Wisconsin Indiana
Decade Census On-sites
(Weighted) Census On-sites
(Weighted)
Sample size 2,533,518 61 2,753,363 72
1930s or earlier 22% 21% 19% 11%
1940s 6% 7% 7% 7%
1950s 12% 9% 12% 16%
1960s 10% 7% 12% 6%
1970s 16% 20% 15% 11%
1980s 10% 11% 10% 8%
1990s 14% 16% 15% 17%
2000 or later 10% 6% 10% 11%
Don’t know/refused – 2% – 13%

8. Demographics
8–3
Analysis of Consumer Electronics in Homes (Final). 2/19/10
In Wisconsin, 27 percent of on-site respondents reported having a home with four or more bedrooms, while 18 percent of Wisconsin residents overall have a home with four or more bedrooms (Table 8-4).
Table 8-4. Rooms in House (Base: All on-site respondents)
Wisconsin Indiana
Total Rooms Census On-sites
(Weighted) Census On-sites
(Weighted)
Sample size 2,235,246 75 2,447,887 86
One 1% – <1% –
Two 3% 4% 2% 5%
Three 8% 6% 7% 2%
Four 17% 15% 16% 8%
Five 23% 16% 24% 16%
Six 19% 17% 21% 25%
Seven 13% 18% 13% 15%
Eight 8% 9% 8% 17%
Nine 4% 9% 5%
Ten or more 8%
10% 6%
Don’t know/refused – 1% – –
Bedrooms
One 10% 9% 10% 5%
Two 29% 28% 28% 24%
Three 42% 36% 44% 44%
Four 15% 18% 15% 27%
Five 8% 1%
Six or more 3%
1% 3%
–
Don’t know/refused – – – –
8.2 SOCIAL ATTRIBUTES
As expected, the population and on-site participants are similar regarding education levels; the on-site homeowners were weighted by education. In Wisconsin, 28 percent of the on-site respondents have a college degree or higher, while 25 percent of the overall population has a college degree or higher. The results are similar in Indiana (Table 8-5).

8. Demographics
8–4
Analysis of Consumer Electronics in Homes (Final). 2/19/10
Table 8-5. Highest Level of Education, Wisconsin (Base: All on-site respondents)
Wisconsin Indiana
Education Census On-sites
(Weighted) Census On-sites
(Weighted)
Sample size 3,692,408 75 4,107,829 86
Less than ninth grade 4% 4% 5% 1%
Ninth to twelfth grade no diploma 8% 2% 7% 3%
High school graduate (includes GED) 35% 28% 35% 36%
Some college, no degree 20% 30% 20% 31%
Associates degree 9% 6% 7% 6%
Bachelors degree 17% 17% 14% 16%
Graduate or professional degree 8% 11% 8% 7%
Don’t know/refused – 2% – 1%
Twenty-two percent of on-site respondents in Wisconsin reported having a salary of $75,000 or more. This is somewhat lower than the overall Wisconsin population, in which 29 percent of the population has an income of $75,000 or more. A similar trend occurs in Indiana, where 16 percent of on-site respondents have a salary of $75,000 or more, compared to 26 percent for the overall population (Table 8-6).
Table 8-6. Household Income (Base: All on-site respondents)
Wisconsin Indiana
Household Income Census On-sites
(Weighted) Census On-sites
(Weighted)
Sample size 2,235,246 66 2,447,887 76
$9,999 or less 6% 3% 7% 12%
$10,000 to $14,999 6% 8% 6% 6%
$15,000 to $19,999 5% 7% 6% 16%
$20,000 to $29,999 11% 3% 12% 14%
$30,000 to $39,999 11% 12% 12% 12%
$40,000 to $49,999 10% 16% 10% 11%
$50,000 to $74,999 21% 30% 21% 15%
$75,000 to $99,999 13% 14% 13% 9%
$100,000 to $149,999 11% 6% 9% 5%
$150,000 or more 5% 2% 4% 2%
Refused – 5 – 10
Don’t know – 4 – –

8. Demographics
8–5
Analysis of Consumer Electronics in Homes (Final). 2/19/10
In terms of racial diversity, on-site respondents in Wisconsin are slightly more likely to be white than the population overall, while in Indiana the on-site respondents are slightly less likely to be white than the population overall (Table 8-7).
Table 8-7. Race and Ethnicity (Base: All on-site respondents)
Wisconsin Indiana
Race Census On-sites
(Weighted) Census On-sites
(Weighted)
Sample size 5,571,593 75 6,301,687 86
White 88% 95% 86% 83%
Black or African-American
6% 1% 9% 10%
American Indian, Native Hawaiian, or Alaska Native
1% – <1% 1%
Other 6% 4% 5% 5%
Don’t know/refused – – – –
On-site respondents in Wisconsin (55 percent) and Indiana (60 percent) are more likely to be female than the Wisconsin (50 percent) and Indiana (51 percent) populations as a whole (Table 8-8).
Table 8-8. Gender (Base: All on-site respondents)
Wisconsin Indiana
Language Census On-sites
(Weighted) Census On-sites
(Weighted)
Sample size 5,571,593 75 6,301,687 86
Female 50% 55% 51% 60%
Male 50% 45% 49% 40%
In Wisconsin, 32 percent of on-site respondents and 24 percent of the population as a whole fall are 55 or older. The average household is slightly smaller among on-site respondents in Wisconsin (2.2) as it is for the overall population (2.5). In Indiana, 18 percent of on-site respondents are 55 or over, while 23 percent of the overall population are in that age group. The average household size, among Indiana on-site participants is 1.9, which is lower than the average of 2.6 for the state as a whole (Table 8-9).

8. Demographics
8–6
Analysis of Consumer Electronics in Homes (Final). 2/19/10
Table 8-9. Number and Age Group of Persons Living in the Home (Base: All on-site respondents)
Wisconsin Indiana
Age Census On-sites
(Weighted) Census On-sites
(Weighted)
Sample size 5,571,593 75 6,301,687 86
17 and under* 24% 24% 25% 38%
18 to 24** 10% 11% 10% 3%
25 to 34 13% 9% 13% 13%
35 to 44 15% 11% 14% 11%
45 to 54 15% 14% 15% 17%
55 to 64 11% 16% 11% 8%
65 and over 13% 16% 12% 10%
Average household size
2.5 2.2 2.6 1.9
* Census category is age 19 or under. ** Census category is 20 to 24 years