State of the World’s SANITATION - UNICEF
48
State of the World’s SANITATION An urgent call to transform sanitation for better health, environments, economies and societies
Transcript of State of the World’s SANITATION - UNICEF

State of the World’sSANITATIONAn urgent call to transform sanitation for better health, environments, economies and societies

2 S TAT E O F T H E WO R L D ' S S A N I TAT I O N A C A L L T O T R A N S F O R M S A N I TAT I O N F O R B E T T E R H E A LT H , E N V I R O N M E N T S , E C O N O M I E S A N D S O C I E T I E S 3
Acknowledgements
This report is the result of collaboration between a large number of contributors, reviewers and editors. The development of the report was led by Brooke Yamakoshi (WASH Specialist, UNICEF) and Kate Medlicott (Sanitation and Wastewater Team Leader, World Health Organization), under the overall direction and guidance of Kelly Ann Naylor (Associate Director for WASH, UNICEF) and Bruce Gordon (WASH Coordinator, World Health Organization). The report was compiled and edited by Clarissa Brocklehurst and Simon Mead.
This document could not have been produced without the valuable contributions of authors who provided text and graphics, including:
• UNICEF Headquarters: Bisi Agberemi, Lizette Burgers, Guy Hutton and Leah Selim.
• UNICEF Togo Country Office: Tagha Assih and Fataou Salami.
• United Nations High Commissioner for Refugees: Eva Barrenberg and Ryan Schweitzer.
• WHO: Sophie Boisson, Betsy Engebretson, Fiona Gore, Mark Hoeke, Sofia Murad and Marina Takane.
• WHO/UNICEF Joint Monitoring Programme for Water Supply, Sanitation and Hygiene: Rob Bain, Rick Johnston, Francesco Mitis and Tom Slaymaker.
Thanks are due to Canisius Kanangire, Executive Secretary of the African Ministers’ Council on Water, who facilitated learning from the preparation of the African Sanitation Policy Guidelines, and to Amaka Godfrey who led the team in the development of the guidelines, which was underway in parallel with the drafting of this document. Particular acknowledgement is due to two of the authors of the guidelines, Goufrane Mansour and Peter Hawkins, who contributed text for the financing solutions and capacity building sections, respectively, and provided review of the document. Thanks are also due to Ann Thomas and Mitsunori Odagiri (UNICEF Indonesia), Siddhi Shrestha (UNICEF Nepal), Jolly Ann Maulit (UNICEF Regional Office for West and Central Africa), Gloria Lihemo (UNICEF Regional Office for South Asia), and Oliver Schmoll and Shinee Enkhtseteg (WHO Regional Office for Europe), who reviewed case studies included in the report. We acknowledge with thanks the detailed review provided by Jan Willem Rosenboom (Bill & Melinda Gates Foundation) and Andrés Hueso (WaterAid) and inputs from Leanne Burney and Cheng Li (UN-Water).
Published by UNICEF and WHOProgramme Division/WASH3 United Nations PlazaNew York, NY 10017 USAwww.unicef.org/wash
© United Nations Children’s Fund (UNICEF) and the World Health Organization (WHO), 2020
Suggested citation: State of the World’s Sanitation: An urgent call to transform sanitation for better health, environments, economies and societies. New York: United Nations Children’s Fund (UNICEF) and the World Health Organization, 2020.
UNICEF ISBN: 978-92-806-5187-4 WHO ISBN: 978-92-4-001447-3 Permission is required to reproduce any part of this publication. For more information on usage rights, please contact [email protected] The designations employed and the presentation of the material in this publication do not imply the expression of any opinion whatsoever on the part of UNICEF or WHO concerning the legal status of any country, territory, city or area or of its authorities, or concerning the delimitation of its frontiers or boundaries. Dotted or dashed lines on maps represent approximate border lines for which there may not yet be full agreement. The mention of specific companies or of certain manufacturers’ products does not imply that they are endorsed or recommended by UNICEF or WHO in preference to others of a similar nature that are not mentioned. Errors and omissions excepted, the names of proprietary products are distinguished by initial capital letters. All reasonable precautions have been taken by UNICEF and WHO to verify the information contained in this publication. However, the published material is being distributed without warranty of any kind, either expressed or implied. The responsibility for the interpretation and use of the material lies with the reader. In no event shall UNICEF or WHO be liable for damages arising from its use. The statements in this publication are the views of the author(s) and do not necessarily reflect the policies or the views of UNICEF or WHO.
Edited by Jeff Sinden. Publication design by Blossom and all graphs designed by Cecilia Silva Venturini.

4 S TAT E O F T H E WO R L D ' S S A N I TAT I O N A C A L L T O T R A N S F O R M S A N I TAT I O N F O R B E T T E R H E A LT H , E N V I R O N M E N T S , E C O N O M I E S A N D S O C I E T I E S 5
Contents
1 2 3 4 5 6
Acknowledgements
Foreword
Acronymsand abbreviations
Executive summary
Endnotes
WHY IS THIS REPORT NECESSARY?
1.1 Defining the challenge
1.2 Things you need to know before reading this report
WHAT ARE THE CONSEQUENCES OF POOR SANITATION?
2.1 Health impacts
2.2 Economic costs
2.3 Social impacts
WHAT IS THE STATUS OF POLICY AND FINANCE FOR SANITATION?
4.1 Status of sanitation policy
4.2The cost of achieving universal sanitation 4.3How much is being invested, and where is it coming from?
GOVERNMENTS CAN ACCELERATE SANITATION PROGRESS WITH PROVEN, EFFECTIVE APPROACHES
6.1 Good governance begins with leadership, effective coordination and regulation
6.2 Smart public finance unlocks effective household and private investment
6.3 Capacity at all levels drives progress and sustains services
6.4Reliable data support better decision-making and stronger accountability 6.5Innovation leads to better approaches and meets emerging challenges
IMAGINING A BETTER FUTURE: A DRAMATIC ACCELERATION IN PROGRESS IS POSSIBLE
WHAT PROGRESS HAS BEEN MADE TOWARDS UNIVERSAL ACCESS TO SANITATION?
3.1Sanitation in households
3.2Sanitation in schools
3.3 Sanitation in health care facilities
3.4 Sanitation for forcibly displaced persons
14
15
17
20
21
26
28
52
53
56
59
66
68
72
75
79
82
6230
31
42
46
49
3
8
10
11
90

6 S TAT E O F T H E WO R L D ' S S A N I TAT I O N A C A L L T O T R A N S F O R M S A N I TAT I O N F O R B E T T E R H E A LT H , E N V I R O N M E N T S , E C O N O M I E S A N D S O C I E T I E S 7
Tables, figures and boxes
TABLES TABLE 1: Disease burden linked directly or indirectly to inadequate sanitation, 2016
FIGURES FIGURE 1: Health risk can come from all steps of the sanitation service chainFIGURE 2: Economic losses associated with inadequate sanitation by region, as a percentage of GDP, 2019
FIGURE 3: JMP service ladder for global monitoring of sanitation in householdsFIGURE 4: Global sanitation coverage, 2000-2017FIGURE 5: Progress towards eliminating open defecation, 2000-2017FIGURE 6: Percentage of population practising open defecation and living in communities where at least one household practises open defecation, 2015-2018FIGURE 7: Trends in coverage of basic sanitation among the richest and poorest wealth quintiles, 2000-2017FIGURE 8: Percentage of population using sewer connections, septic tanks, latrines and other improved on-site systems in 2017, and percentage point change, 2000-2017FIGURE 9: Percentage of population using safely managed sanitation services, 2017FIGURE 10: Percentage of population with sanitation services in 2000 and 2017, and rate of change required to meet SDG targets by 2030FIGURE 11: Sanitation services ladder for schoolsFIGURE 12: Regional and global sanitation coverage in schools, 2015 and 2019FIGURE 13: Percentage of schools in rural sub-Saharan Africa where all sanitation facilities meet additional criteria, 2017FIGURE 14: Sanitation services ladder for health care facilitiesFIGURE 15: Percentage of health care facilities with elements of basic sanitation across three countries, 2019FIGURE 16: Percentage of health care facilities with no sanitation service, 2019FIGURE 17: Sanitation services available in refugee and non-refugee populations in Afghanistan
21
2426
33333436
37
39
4041
424344
47 47
4851
54
54
55
56576060
171819
2729
354551
6465
6869707174
78808183848587
FIGURE 18: Number of countries reporting formally approved policies supported by resourced plans, 2019FIGURE 19: Number of countries with urban policies and plans that address faecal sludge management, 2019FIGURE 20: Percentage of respondent countries with formal national standards for wastewater, on-site sanitation, faecal sludge and safe use, 2019FIGURE 21: Annualized costs of achieving universal sanitation globally, 2017-2030FIGURE 22: Annualized costs of achieving universal safely managed sanitation by SDG region, 2017-2030FIGURE 23: Annual rural/urban funding gap to reach national sanitation targets, 2018FIGURE 24: Percentage of countries indicating that more than 80 per cent of O&M costs are covered by tariffs, 2013-2018
TEXT BOXESBOX 1: SDG targets related to sanitationBOX 2: Sanitation terms and conceptsBOX 3: WHO/UNICEF JMP and the UN-Water Global Analysis and Assessment of Sanitation and Drinking-Water (GLAAS)
BOX 4: Reaping the economic benefits of improved sanitation in IndiaBOX 5: Recognizing the human right to safe sanitation
BOX 6: Eliminating open defecation in NepalBOX 7: Improving sanitation in schools in TogoBOX 8: Estimating access to sanitation service amongst forcibly displaced persons in Afghanistan
BOX 9: Setting goals for health-protective sanitation based on global research and practiceBOX 10: Strengthening government leadership for sanitation in Ethiopia
BOX 11: Support to all levels of government in IndonesiaBOX 12: Transformative leadership for sanitation successes in East AsiaBOX 13: Supporting policy development through the African Sanitation Policy GuidelinesBOX 14: Strengthened sanitation policy and planning for rapid progress in NepalBOX 15: Harnessing public private partnerships for sanitation: Safe wastewater use in Durban, South AfricaBOX 16: Protecting sanitation worker health and safety in BoliviaBOX 17: Monitoring safely managed sanitation in EcuadorBOX 18: Monitoring of policy identifies gaps in Botswana and NamibiaBOX 19: Taking a new approach to improving sanitation coverage in Eastern EuropeBOX 20: Developing integrated sanitation solutions for all though citywide inclusive sanitationBOX 21: Growing government commitment to solving rural sanitation in Kenya and TanzaniaBOX 22: Making every drop count through safe use of wastewater in Jordan

8 S TAT E O F T H E WO R L D ' S S A N I TAT I O N A C A L L T O T R A N S F O R M S A N I TAT I O N F O R B E T T E R H E A LT H , E N V I R O N M E N T S , E C O N O M I E S A N D S O C I E T I E S 9
Safe sanitation is one of the foundations of a healthy, comfortable and dignified life. Yet, the reality for billions of people is one of polluted environments, in which one or many of the links in the chain that makes up safe sanitation – toilets, waste treatment, disposal and safe re-use – is missing or out-of-reach.
Recognizing this, the global community is committed to achieving universal access to sanitation and hygiene by 2030, paying special attention to the needs of women, girls and those in vulnerable situations, and improving water quality and safe wastewater re-use.
But progress against the sanitation targets in Sustainable Development (SDG) 6 has been too slow. We need massive acceleration. And this challenge comes amid the trials of a global pandemic, an economic recession, and the on-going climate crisis.
As the world celebrates the tenth anniversary of the United Nations adoption of the human right to water and sanitation, and five years since sanitation was recognized as a distinct human right, we must ask: What will it take to close the inequality gap for sanitation in the next decade?
It is time to bend the arc of history and achieve sanitation for all within a generation.
All of us – individuals, communities and governments – must rise to the challenge. Sanitation benefits entire societies and must be treated as a common good, with every aspect of the sanitation chain addressed together. This calls for not only individual responsibility, but strong, coordinated national leadership. The collective benefit of sanitation cannot be fully achieved without government action in terms of robust policy, clear regulation and strategic, targeted investment that triggers and optimizes contributions from households and the private sector.
Although the challenge of meeting SDG 6 for sanitation is formidable, history shows us that countries can make tremendous gains in access to sanitation within just one generation. Governments that take action on sanitation will unlock further progress in health, education, food security, nutrition, employment and tourism. Success comes from demonstrated political will, adaptive planning and the engagement
Foreword of local governments, the private sector, civil society and households. Sometimes action begins with small incremental steps, but taking those first steps is key.
The COVID-19 pandemic has reminded us once again of the central role that water, sanitation and hygiene (WASH) play in protecting us from disease. The unprecedented levels of public investment in health and economic recovery from the pandemic create a once-in-a-lifetime opportunity to not only prevent future pandemics, but to imagine a more equitable future.
Progress is possible – we have seen many examples of countries dramatically improving sanitation through government leadership, political prioritization, partnerships and strategic public investment.
Learning from these successes, we can improve sanitation globally. But we must act now, work together and accelerate rapidly. We have no time to lose.
We are calling on Member States to rise to the challenge – to take action on sanitation and claim the many benefits to the health of their citizens, their economies and the environment. Our organizations are committed to supporting Member States as they meet this important challenge, and provide the strong, effective and lasting sanitation systems that communities deserve.
HENRIETTA H. FOREExecutive Director UNICEF
DR. TEDROS ADHANOM GHEBREYESUSDirector-General
World Health Organization
10 S TAT E O F T H E WO R L D ' S S A N I TAT I O N A C A L L T O T R A N S F O R M S A N I TAT I O N F O R B E T T E R H E A LT H , E N V I R O N M E N T S , E C O N O M I E S A N D S O C I E T I E S 11
Acronymsandabbreviations
AMCOW African Ministers’ Council on Water
CWIS citywide inclusive sanitation
DALY disability-adjusted life year
GDP gross domestic product
GRP gross regional product
GVA gross value added
GLAAS UN-Water Global Analysis of Sanitation and Drinking-Water
IDP internally displaced person
JMP WHO/UNICEF Joint Monitoring Programme for Water Supply, Sanitation and Hygiene
O&M operations and maintenance
PPP public-private partnership
SBM Swachh Bharat Mission
SDG Sustainable Development Goal
UHC universal health coverage
UNHCR United Nations High Commissioner for Refugees
WASH water, sanitation and hygiene
WHO World Health Organization
Executive Summary
The world is alarmingly off-track to deliver sanitation for all by 2030. Despite progress, over half of the world’s population, 4.2 billion people, use sanitation services that leave human waste untreated, threatening human and environmental health. An estimated 673 million people have no toilets at all and practise open defecation, while nearly 698 million school-age children lacked basic sanitation services at their school. The consequences of poor sanitation are devastating to public health and social and economic development.
With only 10 years left until 2030, the rate at which sanitation coverage is increasing will need to quadruple if the world is to achieve the SDG sanitation targets.
At the current rate of progress, it will be the twenty-second century before sanitation for all is a reality. Clearly this is too slow.
While the challenge is significant, history shows that rapid progress is possible. To accelerate progress, sanitation must be defined as an essential public good – one that is foundational for a healthy population and prosperous society. Many countries have made rapid progress in sanitation coverage within a generation, transforming lives, the environment and the economy. Every country that has made rapid progress has had strong political leadership, with government playing an important role in policy, planning, mobilizing investment and regulating services.
Sanitation is a human right. Everyone is entitled to sanitation services that provide privacy, ensure dignity and safety, and that are physically accessible and affordable. Sanitation is also a public good, providing benefits across society in improved health as well as economic and social development. The lack of safe sanitation leads to illness and disease that disproportionately affect children, including diarrhoea, worm infections and stunting. But poor sanitation affects everyone, and a polluted environment impacts the entire community, whether or not an individual household has a sanitation facility. In addition to hard-to-quantify effects on dignity, safety and gender equality, there are significant financial costs related to lack of sanitation,

12 S TAT E O F T H E WO R L D ' S S A N I TAT I O N A C A L L T O T R A N S F O R M S A N I TAT I O N F O R B E T T E R H E A LT H , E N V I R O N M E N T S , E C O N O M I E S A N D S O C I E T I E S 13
including increased health care costs, lost income, forgone educational opportunities and costs resulting from pollution. Poor sanitation disproportionately affects the most vulnerable and disadvantaged, particularly women and people living with disabilities. Sanitation workers, often stigmatized and marginalized, face unacceptable health risks and indignities in an unhealthy and unregulated environment.
Achieving universal access to safe sanitation will be expensive, but inaction brings greater costs. Investments in sanitation – particularly safely managed sanitation services – generate positive externalities across society. The economic benefits of sanitation have been estimated at about five times the cost – a cost-benefit ratio greater than that of water supply1. Strong government leadership is key to accelerating coverage of sanitation services and to ensuring that all of society reaps the benefits.
Investment in five key ‘accelerators’ – governance, financing, capacity development, data and information, and innovation – identified under the UN-Water SDG 6 Global Acceleration Framework – can be a pathway towards achieving universal and safe sanitation for all.
1. GOOD GOVERNANCE BEGINS WITH LEADERSHIP, EFFECTIVE COORDINATION AND REGULATION Governments must establish institutions to coordinate and regulate the activities of government, service providers and service users, and generate public benefits. Sanitation must be included in national policies, strategies and plans, and needs to be backed by human and financial resources. Many countries have significant policy gaps. For instance, in countries where open defecation is still practised, about one quarter lack specific policies and plans to address it. Similarly, the critical issue of faecal sludge management is not addressed in one quarter of urban sanitation policies and plans. Even where policies are in place, few countries have adequate human and financial resources to support them. While most countries are responding to the SDG imperative to ‘leave no one behind’ – over two thirds of countries reported policy measures to reach poor populations with sanitation – only one quarter have identified the means of funding these policies2. Safe sanitation can be delivered effectively through a mix of approaches and systems tailored to the local context. Coverage must include entire communities and extend beyond the household to schools, health care facilities, workplaces and public places. Well-balanced regulation is key to ensuring effective risk management, while also developing effective and innovative responses.
2. SMART PUBLIC FINANCE UNLOCKS EFFECTIVE HOUSEHOLD AND PRIVATE INVESTMENT Most countries report insufficient resources to meet their national sanitation targets. Identifying and mobilizing appropriate funding sources and financing instruments is critical if countries are to meet their aspirations in the most cost-effective and efficient manner. Public funding is important to lay the foundation for safe sanitation services that reach the poorest. There are multiple sources of funding for sanitation that governments can access and combine, including taxes, transfers from external donors, and tariffs and user fees. Government investments must be used strategically to attract and optimize other investments, recognizing that most funding for sanitation comes from households themselves. Various forms of repayable finance can be mobilized, such as loans, bonds and other financing instruments. Governments can enter into public-private partnerships (PPPs) to access financing and expertise from the private sector.
3. CAPACITY AT ALL LEVELS DRIVES PROGRESS AND SUSTAINS SERVICES Developing a strong sanitation sector will require a bigger workforce with better skills. Capacity development is more than training. It encompasses human resource development, organizational development, resourcing and research and innovation. National governments need the skills to develop and administer effective regulations, policies, strategies and costed plans. The adoption of new approaches to sanitation will require local government and utilities to have the necessary capacity to oversee and deliver more service oriented sanitation and to implement effective cost recovery mechanisms. Growing the private sector to capitalize on the ‘sanitation economy’ requires building the skills of service providers and their ability to respond to environmental conditions and climate change.
4. RELIABLE DATA SUPPORT BETTER DECISION-MAKING AND STRONGER ACCOUNTABILITY Accelerating progress on sanitation will require more comprehensive data on each aspect of the sanitation chain from toilet type to arrangements for storage, conveyance, treatment and reuse of human waste. Reliable, consistent and, wherever possible, disaggregated data are essential to stimulate political commitment, inform policy-making and decision-making, and enable well-targeted investments that maximize health, environmental and economic gains. Robust sanitation monitoring mechanisms to track policy and regulation are needed at the lowest administrative level, using existing structures and linked with reporting and accountability structures at the local and national level.
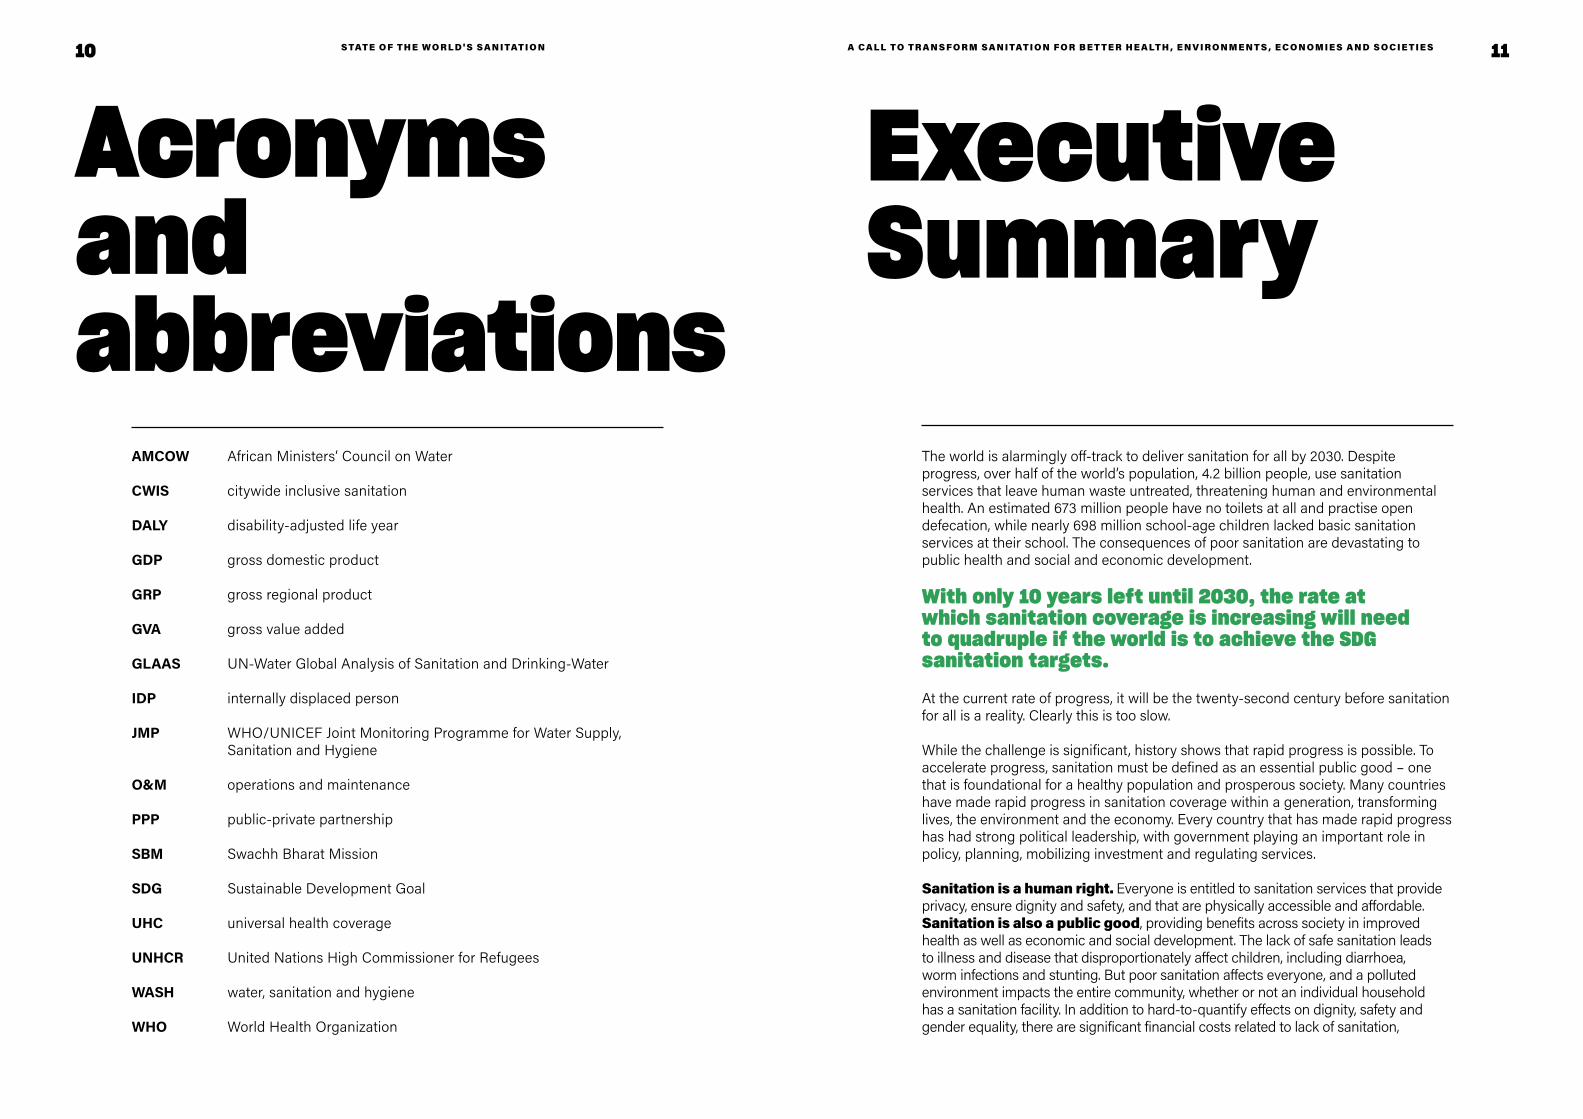
5. INNOVATION LEADS TO BETTER APPROACHES AND MEETS EMERGING CHALLENGES Achieving universal access to safe sanitation requires innovative solutions. New approaches and systems can ‘future-proof’ the sector against disease outbreaks, urbanization, climate change and increasing pressure on natural resources, with solutions that are practical, cost-effective and scalable. Adopting such innovations can also support equity and universality of services, helping extend sanitation to the hardest-to-reach areas and groups. Governments must think beyond conventional sewage systems, which are costly and time-consuming to install. Governments can enable innovation through sound regulation, performance criteria and standards that reduce risk but do not stifle new ideas and entrepreneurship.
This report presents the state of sanitation in the world today to increase awareness of the progress made towards achieving the SDG targets for sanitation, and the challenges that remain. It calls on Member States, the United Nations system and partners to rise to these challenges within the context of the SDG 6 Global Acceleration Framework.
By presenting best practices, case studies, successes and challenges, this report seeks to inspire Member States and all stakeholders to learn from each other and work together towards achieving universal access to safe sanitation by 2030.

14 S TAT E O F T H E WO R L D ' S S A N I TAT I O N 15
1Why is this report necessary?1.1 Defining the challenge
1.2 Things you need to know before reading this report
Defining the challenge1.1Sanitation is vital to health, child development, and social and economic progress. Safe sanitation is also a human right – essential for the fulfilment of child rights and the achievement of good physical, mental and social well-being – recognized as a distinct right by the General Assembly of the United Nations in 2015. In the same year, Member States committed to the 2030 Agenda for Sustainable Development, including target 6.2 of the SDGs: “By 2030, achieve access to adequate and equitable sanitation and hygiene for all and end open defecation, paying special attention to the needs of women and girls and those in vulnerable situations”.
Progress towards universal sanitation is alarmingly off track, and uneven in its coverage, resulting in inequalities and the further marginalization of the most vulnerable. With only 10 years left
before 2030, the rate at which sanitation coverage is increasing will need to quadruple to achieve SDG target 6.2. At the current rate of progress, it will be the twenty-second century before sanitation for all is a reality. This is too slow.
Sanitation suffers from chronic under-prioritization, lack of leadership, under-investment and a lack of capacity. While the majority of countries have national policies and plans to support sanitation, few have allocated adequate human and financial resources to actually implement them.3 Donors tend to prioritize water over sanitation. In fact, aid disbursements for sanitation were half that for drinking-water between 2010 and 2018. Within the larger water and sanitation sector (including, for example, water resources management and river basin development), aid disbursements for sanitation systems in the last nine
© W
HO
© U
NIC
EF/I
ndia
/Qad
ri

16 S TAT E O F T H E WO R L D ' S S A N I TAT I O N A C A L L T O T R A N S F O R M S A N I TAT I O N F O R B E T T E R H E A LT H , E N V I R O N M E N T S , E C O N O M I E S A N D S O C I E T I E S 17
years have never exceeded 15 per cent of the total.4 The total investment in sanitation from governments and donors is not enough to provide the sustainable, resilient, safely managed services that will bring about substantive benefits to health, the economy and the environment.
Achieving universal access to sanitation by 2030 will require dramatic acceleration in current rates of progress. Global rates of progress need to double to achieve basic sanitation for all, and universal access to safely managed sanitation requires them to quadruple. However, these global averages mask the fact that some countries, and some communities within countries, are starting from a much lower baseline. In these places, the rate of change must be even greater if the pledge to ‘leave no one behind’, made by Member States when they adopted the 2030 Agenda, is to be honoured.
Governments have a critical role to play. Sanitation is a public good in need of public funding that will allow everyone to benefit from improved health as well as social and economic development. Poor sanitation creates serious negative externalities, creating public health hazards and jeopardizing economic development for all. Conversely, good sanitation generates economic benefits and unlocks human productivity. Regulation throughout the sanitation chain is crucial to ensure that the benefits are realized by everyone.
History shows it can be done. There are many countries that have been successful in making rapid progress in sanitation coverage, transforming lives, the environment and the economy within a generation. With strong political leadership, sufficient resources and a ‘whole-of-government’, multi-stakeholder approach, governments can quickly transform sanitation and find ways to put the last first. In the 1960s and 1970s, Malaysia, the Republic of Korea, Singapore and Thailand produced rapid and remarkable results to achieve total
sanitation coverage. More recently, India has created a mass movement which has dramatically reduced and almost eliminated the undignified and dangerous practice of open defecation, which disproportionately affects the rural poor. Since 2000, Cambodia and Ethiopia reduced open defecation by more than 50 percentage points, and Cambodia, Indonesia, the Lao People’s Democratic Republic and Nepal increased the use of at least basic sanitation services by more than 40 percentage points. Governments in many other countries are helping individuals and communities move up the sanitation ladder towards universal access to safely managed sanitation services – by mobilizing communities, strengthening markets and service providers, deploying a range of funding and financing mechanisms to build resilient sanitation services that make better use of scarce resources, recycling waste for economic and environmental benefits, and building the circular economy.
The COVID-19 pandemic has exacerbated many sanitation challenges. People have been isolated at home, where they have unsafe sanitation facilities or are forced by their lack of sanitation facilities into unsafe, communal areas, such as poorly managed public latrines or open defecation areas. Sanitation workers, obliged to keep working as they perform an essential service, add one more health hazard to what is often a long list. The pandemic has reinforced what the evidence makes clear: poor sanitation puts everyone at risk.
This report presents the state of sanitation in the world today to increase awareness of the progress towards achieving the SDG target for sanitation, and the challenges that remain. Within the context of the recently-developed SDG 6 Global Acceleration Framework5, it presents best practices, successes and challenges. It calls on Member States, the United Nations system and other stakeholders to rise to the challenge, learn from one another and work together to achieve universal access to safe sanitation by 2030.
Things you need to know before reading this report
1.2
This report uses a variety of terms that the reader may not be familiar with. They are summarized in Box 2 to aid understanding of the report.
Box 1 summarizes the SDG targets most directly related to sanitation, which are the focus of this report. However, linkages have been identified between sanitation and 130 of the SDG 169 targets.6
SDG GLOBAL TARGETS SDG GLOBAL TARGETS
6.2: By 2030, achieve access to adequate and equitable sanitation and hygiene for all and end open defecation, paying special attention to the needs of women and girls and those in vulnerable situations
6.3: By 2030, improve water quality by reducing pollution, eliminating dumping and minimizing release of hazardous chemicals and materials, halving the proportion of untreated wastewater and substantially increasing recycling and safe reuse globally
6.2.1: Proportion of population using (a) safely managed sanitation services and (b) a handwashing facility with soap and water
Additional indicator for SDG 6.2: Proportion of population practising open defecation
6.3.1: Proportion of wastewater safely treated
1.4: By 2030, ensure all men and women, in particular the poor and vulnerable, have equal rights to economic resources as well as access to basic services…
1.4.1: Proportion of population living in households with access to basic services (including access to basic drinking-water, basic sanitation and basic handwashing facilities)
3.8: Achieve universal health coverage (UHC), including financial risk protection, access to quality essential health care services, and access to safe, effective, quality and affordable essential medicines and vaccines for all
[Proportion of health care facilities with basic water, sanitation and hygiene (WASH) services, including basic sanitation]
4.a: Build and upgrade education facilities that are child, disability and gender sensitive and provide safe, non-violent, inclusive and effective learning environments for all
4.a.1: Proportion of schools with access to…. (e) basic drinking-water, (f) single-sex basic sanitation facilities, and (g) basic handwashing facilities
BOX 1SDG targets related to sanitation

18 S TAT E O F T H E WO R L D ' S S A N I TAT I O N A C A L L T O T R A N S F O R M S A N I TAT I O N F O R B E T T E R H E A LT H , E N V I R O N M E N T S , E C O N O M I E S A N D S O C I E T I E S 19
BOX 3Two monitoring platforms have been mandated to monitor progress towards the achievement of the sanitation-related targets of SDG 6:
• The JMP produces internationally comparable estimates of progress on drinking-water, sanitation and hygiene and is responsible for monitoring the SDG targets related to WASH. Since the establishment of the SDGs, the JMP has published global baseline reports on WASH in households, schools and health care facilities, which are updated with progress reports every two years. The
data compiled by the JMP not only reveal progress, but highlight persistent inequalities in the sanitation sector.
• The GLAAS is implemented by WHO on behalf of UN-Water. It monitors components of WASH systems, including governance, monitoring, finance and human resources, necessary to sustain and extend WASH services to all, and especially to the most vulnerable. WHO, through GLAAS, also monitors the means of implementation targets for SDG 6.
WHO/UNICEF JMP and the UN-Water Global Analysis and Assessment of Sanitation and Drinking-Water (GLAAS)
SANITATION The management of human excreta, defined here as faeces, urine and menstrual blood.
SANITATION SERVICE CHAIN
The sanitation service chain includes the stages in a safe sanitation system: capture, containment, emptying, transport, treatment and safe disposal.
SANITATION LADDER The World Health Organization (WHO)/UNICEF Joint Monitoring Programme (JMP) for Water Supply, Sanitation and Hygiene defines five levels of service: open defecation; unimproved; limited; basic; and safely managed (see Chapter 3).
SAFELY MANAGED SANITATION
The indicator used to measure progress on SDG target 6.2 is the percentage of the population using “safely managed sanitation services”. To be safely managed, sanitation facilities should not be shared with other households, and the excreta produced should either be: treated and disposed in situ; stored temporarily and then emptied and transported to treatment off-site; or transported through a sewer with wastewater and then treated off-site.
SEWERED SANITATION
A sanitation system in which waterborne excreta (referred to as wastewater or sewage) is collected and transported to treatment before disposal or use. This type of system relies on sewers and flush water for transport. It is often referred to as ‘off-site’ sanitation as waste is transported away from the location where it is generated for treatment.
NON-SEWERED SANITATION
A sanitation technology or system in which excreta (referred to as faecal sludge) is collected and stored at the location where it is generated (for this reason it is sometimes referred to as ‘on-site’ sanitation). It is then either treated and disposed of on-site, or emptied and transported to another location for treatment and disposal. Examples include pit toilets, septic tanks and container-based systems.
DISABILITY-ADJUSTED LIFE YEAR (DALY)
A measure of overall disease burden, expressed as the number of years lost due to ill-health, disability or early death, and calculated by adding the number of years of life lost to the number of years lived with disability for a certain disease or disorder.
CIRCULAR ECONOMY An economy in which waste and pollution do not exist by design, products and materials are kept in use, and natural systems are regenerated. This is considered a key component of several SDGs.
BOX 2Sanitation terms and concepts
© W
ater
Aid
/Nya
ni Q
uarm
yne

20 S TAT E O F T H E WO R L D ' S S A N I TAT I O N 21
2What are the consequences of poor sanitation?2.1 Health impacts
2.2 Economic costs
2.3 Social and equality impacts
Health impacts2.1The lack of safe sanitation systems leads to a range of adverse health impacts, including:7
• Diarrhoea, a major public health concern and a leading cause of disease and death among children under five years of age in low- and middle-income countries. This includes cholera, an acute diarrhoeal disease that can kill within hours if left untreated.
• Neglected tropical diseases such as soil-transmitted helminth infections, schistosomiasis and trachoma, which account for a significant burden of disease globally.
• Vector-borne diseases such as West Nile virus or lymphatic filariasis (through poor sanitation facilitating the proliferation of Culex mosquitos).
• Stunting, which affects almost one quarter of children under five years of age globally through several mechanisms, including repeated diarrhoea, helminth infections and environmental enteric dysfunction related to unsanitary conditions, and leads to poor physical and cognitive development.
• Antimicrobial resistance, by increasing the risk of preventable infections that are treated with antibiotics and by spreading excreted resistant organisms in the environment though untreated wastewater and sludge.8
• Anaemia and spontaneous abortion and pre-term birth associated with soil-transmitted helminth infections (worms).9
Globally, it is estimated that 1.9 million deaths and the loss of over 120 million disability-adjusted life years (DALYs) could have been prevented with adequate WASH in 2016. Inadequate sanitation contributes directly or indirectly - via contaminated drinking-water and hands - to approximately 830,000 deaths and over 49 million DALYs due to diarrhoeal diseases and many more from other diseases and conditions including soil-transmitted helminth infections, malnutrition, trachoma, schistosomiasis, lymphatic filariasis and those linked to inadequate wastewater management practices (see Table 1).
DISEASE DEATHS DALYS (1,000S)
POPULATION-ATTRIBUTABLE FRACTION
Diarrhoeal diseases 828,651 49,774 0.60
Other diseases and conditions
Soil-transmitted helminth infections
6,248 3,431 1
Malnutrition2 28,194 2,995 0.16
Trachoma <10 244 1
Schistosomiasis 10,405 1,096 0.43
Lymphatic filariasis <10 782 0.67
Total other diseases 44,848 8,548 NA
1 Dis
ease
bur
den
estim
ates
and
pop
ulat
ion-
attr
ibut
able
frac
tion
are
pres
ente
d fo
r WA
SH c
ombi
ned.
Dis
ease
bur
den
estim
ates
are
for
LMIC
s; d
iarr
hoea
incl
ude
dise
ase
burd
en in
hig
h-in
com
e co
untr
ies.
2 Inc
lude
s di
seas
e bu
rden
of p
rote
in–e
nerg
y m
alnu
triti
on a
nd
cons
eque
nces
in c
hild
ren
< 5
year
s on
ly.
TABLE 1. Disease burden1 linked directly or indirectly to inadequate sanitation, 201610
© U
NIC
EF/U
N02
0217
1/So
khin

22 S TAT E O F T H E WO R L D ' S S A N I TAT I O N A C A L L T O T R A N S F O R M S A N I TAT I O N F O R B E T T E R H E A LT H , E N V I R O N M E N T S , E C O N O M I E S A N D S O C I E T I E S 23
What does the look like with and without progress on sanitation?
ACCELERATION
BUSINESS AS USUAL
CHILD SURVIVAL More children survive and grow up to be healthy adults.
CHILD SURVIVAL Every year 830,000 people will die from preventable diseases.
CHOLERA Elimination of cholera in 20 countries with recurrent outbreaks and no more uncontrolled outbreaks in fragile settings.
CHOLERA Outbreaks will continue in hotspots with poor sanitation. Precious funds will be spent on WASH for outbreak response that could be more sustainably spent on sanitation to fix the underlying cause.
INTESTINAL WORMS Achievement of global targets for control of neglected tropical diseases stand a greater chance of being met. Infections are less likely to rebound if drug administration is scaled back.
INTESTINAL WORMS Regular drug administration will keep infections at bay, but people will continue to be re-infected where open defecation and use of untreated wastewater for irrigation is practiced.
ANTIMICROBIAL RESISTANCE (AMR) Less antimicrobial use for preventable infections extending the useful life of last line of defense antimicrobials. Fewer untreatable sanitation related infections such as drug resistant typhoid.
ANTIMICROBIAL RESISTANCE (AMR) Hundreds of millions of doses of antimicrobials will be used each year for infections that could have been prevented with better sanitation. Wastewater laden with resistant bacteria will continue to spread AMR.
SAFETY AND MENTAL HEALTH Dignity, safety and less stress, contributing to a more equal world.
SAFETY AND MENTAL HEALTH Without sanitation at home, schools and workplaces, people, especially women and girls will continue to suffer from anxiety, shame and fear while trying to find a safe place to urinate, defecate and manage menstrual hygiene.
CLIMATE CHANGE Resilient sanitation services protect investments in essential sanitation services and ensure sanitation systems are better prepared to cope with future shocks.
CLIMATE CHANGE Sanitation system will become more vulnerable to flooding from storms and sea level rise or have less water for flushing and conveying sewage. Even small losses will affect the health of whole communities.
HEALTH SERVICES Less stress on health systems.Higher utilization of health services, particularly among women, due to better facilities. Fewer healthcare acquired infections.
HEALTH SERVICES Health services in communities with poor sanitation will be burdened with treating preventable infections. Where health centres lack sanitation, women will choose not to give birth there and there will be more infections among patients.
POLIO Polio could become the second human disease in history to be eradicated freeing humanity from a debilitating virus.
POLIO The goal of global eradication may remain just out of reach due to re-emergence in areas with poor sanitation.
NUTRITION Children can realize the full benefits of investment in better nutrition, are less stunted and learn and achieve more at school.
NUTRITION Repeated diarrhoea, caused by poor sanitation, resulting in poor gut function will prevent people, especially children, from absorbing the nutrients in food needed to grow and thrive.
FOOD SAFETY Safe use of wastewater and sludge in agriculture, horticulture and aquaculture can support nutrition and the circular economy and also reduce use of chemical fertilizers and recover some of the cost of sanitation services.
FOOD SAFETY Increasing water scarcity and urbanization will increase demand from peri-urban farms for water and nutrients. Unsafe use of wastewater and sludge will cause outbreaks and a increase in chronic foodborne diseases.
ENVIRONMENTAL JUSTICE Communities – particularly those with lower incomes – have a cleaner environment and healthier neighborhoods.
ENVIRONMENTAL JUSTICE Poor and marginalized groups, particularly in low lying areas, will continue to be disproportionately affected by other people’s unmanaged faecal sludge and sewage.
DECENT WORK Millions of new formalized jobs created that will sustain sanitation services, contribute to the green economy and protect public health.
DECENT WORK Sanitation workers, especially in the informal sector, will continue to suffer indignity and disease and even death though poor working conditions.
RECREATION Communities have clean environments and beaches for recreational activities, promoting public health, exercise and tourism.
RECREATION Beaches polluted with wastewater will continue to deter or sicken swimmers and damage economies in places that rely on clean water bodies for tourism and sports events.

24 S TAT E O F T H E WO R L D ' S S A N I TAT I O N A C A L L T O T R A N S F O R M S A N I TAT I O N F O R B E T T E R H E A LT H , E N V I R O N M E N T S , E C O N O M I E S A N D S O C I E T I E S 25
Sanitation systems can pose risks to health at all steps of the sanitation service chain
Without quality toilets that everyone uses, families and communities are at increased risk of disease, anxiety and violence.
Without proper on-site containment or treatment, water used for drinking, recreation and agriculture can be contaminated.
Workers without adequate protections face life-threatening risks when emptying pits and septic tanks and cleaning sewers. Waste spilled or dumped before treatment puts whole communities and food supplies at risk.
TOILETCONTAINMENT -STORAGE/ TREATMENT
CONVEYANCE→ → →
FIGURE 1
Adverse health outcomes stem not only from a lack of toilets but from failures and hazards all along the sanitation chain (see Figure 1). These failures are not included in the estimates of the disease burden shown in Table 1, making the actual burden of disease likely to be significantly higher.
Achieving the ambitious goals around safely managed sanitation systems (SDG target 6.2) and the treatment and use of wastewater (SDG target 6.3) is therefore critical to reducing the unacceptably high burden of sanitation-related disease.11
Communities are put at risk when untreated wastewater and sludge pollute beaches, drinking water, and water sources used for irrigation of food crops.
Drinking or coming into contact with untreated water perpetuates the cycle of infection – especially of intestinal worms and diarrhoea.
If wastewater and sludge are used safely, valuable water, nutrients and energy can be returned to the circular economy.
TREATMENT END USE/ DISPOSAL→
Access to safe sanitation systems – in homes, schools, workplaces, health facilities, public spaces and other institutional settings (such as prisons and camps for forcibly displaced persons) – is essential. Safe sanitation in health facilities is an indispensable component of quality
of care and infection prevention and control strategies, especially to prevent exposure of health service users and staff to infections, and particularly to protect pregnant women and newborns from infections that may lead to adverse pregnancy outcomes, sepsis and mortality.

26 S TAT E O F T H E WO R L D ' S S A N I TAT I O N A C A L L T O T R A N S F O R M S A N I TAT I O N F O R B E T T E R H E A LT H , E N V I R O N M E N T S , E C O N O M I E S A N D S O C I E T I E S 27
Economic costs 2.2Significant financial costs can result from sickness and death related to poor sanitation: out-of-pocket payments and travel costs for households seeking health care; government subsidies implicit in public health care provision; income losses associated with sickness; lost productivity due to time spent seeking a place for open defecation; and coping costs resulting from environmental and water resource pollution such as water treatment or switching to a more expensive but cleaner water source. Conversely, these can be quantified as the loss of the benefits and savings that would be accrued with a safely managed sanitation system, including time, income,
increased food production and increased educational opportunities.
A 2012 WHO study estimated the economic costs of not investing in water and sanitation in 135 low- and middle-income countries.12 It found that economic losses from poor sanitation and inadequate water supply would be equivalent to 0.5 per cent to 3.2 per cent of gross domestic product (GDP) between regions, or 1.3 per cent globally (see Figure 2). The highest impact was in sub-Saharan Africa. The study also found that investing in sanitation had a greater benefit-cost ratio (over five) than investing in water supply (around two).
The economic costs of poor sanitation are significant in all regions, particularly sub-Saharan Africa and South Asia
FIGURE 2
0.60.7
3.2
0.7
1.2
2.6
1.0
0.5
1.3 1.3
0
0.5
1.0
1.5
2.0
2.5
3.0
3.5
Cen
tral
Asi
a
Nor
ther
nA
frica
Sub-
Saha
ran
Afri
ca
Latin
Am
eric
a an
dth
e C
arib
bean
East
ern
Asi
a
Sout
hA
sia
Sout
h-Ea
st A
sia
Wes
tern
Asi
a
Oce
ania
Wor
ld
Perc
enta
ge o
f Gro
ss R
egio
nal R
egio
nal P
rodu
ct
Sour
ce: W
HO
, 201
2.
ECONOMIC LOSSES ASSOCIATED WITH INADEQUATE SANITATION BY REGION, AS A PERCENTAGE OF GDP, 2012
Many country-level studies have been published on the economic consequences of poor sanitation. A review of studies found the cost of poor sanitation exceeded 2 per cent of GDP in East Asia and the Pacific and sub-Saharan Africa, while in South Asia, it exceeded 4 per cent of GDP.13
The economic losses presented here, and the rate of return of investing in sanitation interventions, provide compelling evidence for policymakers to take action. Indeed, such a scale of loss must receive urgent attention from the highest levels of government.
BOX 4The Swachh Bharat Mission (SBM), also known as Swachh Bharat Abhiyan or ‘Clean India Mission’, was an India-wide campaign run from 2014 to 2019 to eliminate open defecation and improve solid waste management. SBM is considered to have been the world’s largest sanitation programme, which had high-level political support and catalysed a mass movement that engaged government, households and the private sector, and used community-led methodologies focussing on behaviour change to end open defecation.
A recent economic assessment of SBM drew on an economic survey implemented in over 10,000 households across the country.14 The study found annual cost savings per household of US$727, with medical cost savings, averted premature death, and the benefits of reduced travel time to places for open defecation all accounting for a significant share of the benefits.
A follow-up study estimated that India becoming open defecation free would result
in a significant reduction in economic costs nationwide. In the fiscal year 2018/2019, the economic cost of poor sanitation was estimated to be 3.87 per cent of gross value added (GVA), compared to 9.77 per cent of GVA if sanitation coverage had remained at 2013/2014 levels – a reduction in economic costs of 5.90 per cent of GVA over the five year period.15 The SBM is estimated to have led to annual economic savings of 7.35 per cent of GVA by 2019-2020, assuming India achieves 100 per cent improved sanitation usage in 2019-2020. The economic savings are estimated to increase to 8.55 per cent of GVA by 2023-2024, provided sustained investments in the sanitation sector to achieve 100 per cent safe faecal sludge management are maintained. The study showed additional economic benefits, as the sanitation input market (toilets, haulage and treatment facilities) and the sanitation output market (solid and liquid waste recycling) were each worth over 0.34 per cent of GDP at the height of the programme in 2017/2018, and employed 2.2 million full-time workers.
Reaping the economic benefits of improved sanitation in India
© W
ater
Aid
/CS
Shar
ada
Pras
ad/S
afai
Kar
mac
hari
Kav
alu
Sam
iti

28 S TAT E O F T H E WO R L D ' S S A N I TAT I O N A C A L L T O T R A N S F O R M S A N I TAT I O N F O R B E T T E R H E A LT H , E N V I R O N M E N T S , E C O N O M I E S A N D S O C I E T I E S 29
In addition to the economic costs, lack of sanitation has negative impacts that cannot easily be quantified. Impacts on dignity, poverty, disability, safety, gender and education represent unrealized human potential and are disproportionately borne by the most vulnerable and disadvantaged. • Dignity: The ability to manage
bodily functions, including urination, defecation and menstruation, is at the core of dignity. A complete lack of service, forcing people to resort to open defecation, presents the greatest indignity. Similarly, crowded or poorly-managed shared sanitation facilities may increase exposure to health risks and may lead to reduced dignity, privacy and safety, especially for women, girls and those with limited
mobility.16 A girl or woman without access to water, soap and a toilet, whether at home, school, or work, will face great difficulties in managing her menstrual hygiene with dignity.
• Poverty: The poor are less likely to benefit from public investments in sanitation, and their health is disproportionately impacted by lack of sanitation. Sanitation rates are lower in rural areas, and only a small minority of countries are on track to eliminate open defecation among the poorest rural dwellers. Poor and marginalized groups tend to live ‘downstream’, making them disproportionately affected by other people’s unmanaged faecal waste. While subsidies are intended to ensure that water and sanitation services are affordable for
Social impacts 2.3 ©
UN
ICEF
/Jor
dan/
Sam
an
BOX 5The United Nations General Assembly recognized the human right to water and sanitation in 2010, and sanitation as a distinct human right in 2015. This right is assured for all – regardless of income, gender, disability status, age or ethnicity. The human right to sanitation implies that people not only have the right to a hygienic toilet but also have the right not to be negatively affected by unmanaged faecal waste.
The human right to sanitation entitles everyone to sanitation services that provide privacy and ensure dignity, and that are physically accessible and affordable, safe, hygienic, secure, and socially and culturally acceptable. All dimensions of the human right to sanitation are equally important. Human rights criteria are reflected in global sanitation guidelines and SDG 6 monitoring frameworks.
Recognizing the human right to safe sanitation
the poor, they often end up benefiting wealthier households already connected to networked services.17
• Disability: People with disabilities and people who experience incontinence suffer additional affronts to their dignity from a lack of appropriate sanitation services.18 The poorest households are at higher risk of being affected by disability, and for example in Malawi were found to be more than three times more likely to lack adequate sanitation compared with the wealthiest households in the same country.19 This leaves people living with disabilities more susceptible to disease, and forces them to resort to harmful coping mechanisms. Inaccessible toilets can force people with disabilities to wait until dark to defecate, increasing their risk of abuse. Many have no choice but to crawl on the floor or ground to use a toilet20 and many, due to delaying, or waiting for assistance, soil themselves.21
• Safety: Poor access to sanitation services can expose vulnerable groups – particularly women and girls – to sexual, psychological and physical violence. The perceived threat of violence or harassment can cause psychosocial stress and prevent women and children from venturing outside the home to use toilets.
• Gender: Poor sanitation increases health risks that are specific to
women. For instance, women who suffer from worm infections and other diseases may become anaemic and undernourished, increasing the risk of maternal death. Women who lack sanitation may resort to harmful coping mechanisms, such as delayed urination or reduced water intake, resulting in urinary tract infections, which can in turn lead to increased risk of pre-eclampsia, miscarriage and anaemia. Workplaces that do not have adequate sanitation facilities can dissuade women from seeking employment, further reinforcing lower labour participation by women and their reduced access to resources. Similarly, lack of public toilets reduces women’s mobility and participation in public life and the economy.
• Education: Poor sanitation has been shown to act as a barrier to school attendance and enrolment in many countries. This affects girls in particular, especially after puberty, when their need for menstrual hygiene management may not be addressed.
Inequalities extend beyond homes and schools and into workplaces. Sanitation workers are critical for service provision, yet too often they are subject to conditions that expose them to the worst consequences of poor sanitation in their daily work, including debilitating infections, injuries, social stigma and even death.

30 S TAT E O F T H E WO R L D ' S S A N I TAT I O N 31
3What progress has been made towards universal access to sanitation? 3.1 Sanitation in households
3.2 Sanitation in schools
3.3 Sanitation in health care facilities
3.4 Sanitation for forcibly displaced persons
This chapter highlights the current state of sanitation in households, schools and health care facilities, and, where possible, provides information on rates of progress. Global data show that current rates of progress will not be sufficient to reach the SDGs, particularly for those in vulnerable situations. While global data are not available for other settings, such as public places, workplaces, prisons and markets, progress in these settings is also needed to ensure people can use a toilet when needed in all aspects of daily life.
The WHO/UNICEF Joint Monitoring Programme for Water Supply, Sanitation and Hygiene (JMP) uses national data to produce internationally comparable estimates of progress on drinking water, sanitation and hygiene which are used to monitor progress towards the SDG targets related to WASH. All data presented here come from recent data updates prepared by the JMP.22
Governments are expected to localize the global SDG targets related to WASH and set their own national targets for progressively reducing inequalities in services, taking into account national contexts, capacities and levels of development,
and respecting national policies and priorities.
Data availability for monitoring progress towards the SDG targets on sanitation remains limited in many countries. While almost all countries have comparable data on rates of open defecation and access to basic sanitation services, fewer than half have estimates for coverage of safely managed sanitation services. Estimates for open defecation and access to basic services can be disaggregated by rural and urban settings, sub-national region and wealth quintile, but very few countries have the disaggregated data needed to identify and address inequalities in safely managed services. Furthermore, the limited availability of time-series data makes it difficult to determine rates of progress.
While JMP estimates allow international comparison, they are not a substitute for national monitoring and reporting. Governments need to establish their own systems to routinely monitor progress on sanitation, with suitable levels of disaggregation that allow progress to be tracked within sub-sectors of the population (urban, rural, poor, minority groups, etc.).
© U
NIC
EF/U
N01
3947
4/Pr
insl
oo
© U
NIC
EF/U
N02
6791
8/La
tif

32 S TAT E O F T H E WO R L D ' S S A N I TAT I O N A C A L L T O T R A N S F O R M S A N I TAT I O N F O R B E T T E R H E A LT H , E N V I R O N M E N T S , E C O N O M I E S A N D S O C I E T I E S 33
Sanitation in households3.1The SDGs challenge Member States to achieve three progressively ambitious targets with respect to household sanitation: • Eliminating open defecation: this
is explicitly mentioned in the target text, and is particularly relevant to a small number of high-burden countries.
• Achieving universal access to basic sanitation services: most countries aim to provide at least a basic level of sanitation services to their entire populations within the SDG period.
• Achieving universal access to safely managed sanitation services: for many countries reaching universal coverage with safely managed sanitation by 2030 is
not a realistic target, but milestones and interim targets can still be set. Even for high- and middle-income countries, it is a challenge to reach entire populations with sanitation services that ensure proper management of excreta along the entire sanitation chain.
The JMP uses a sanitation service ladder to benchmark and compare progress across countries on sanitation in households (see Figure 3). The service ladder tracks how populations progress from practising open defecation and using unimproved technologies to using an improved sanitation facility that hygienically separates excreta from human contact.
Despite progress, 2 billion people still lack even a basic level of sanitation service. From 2000 to 2017, the global population increased by 1.4 billion people. During this period, the population using safely managed sanitation services doubled, from 1.7 billion (28 per cent of the global population) to 3.4 billion (45 per
cent) (see Figure 4). Over the same period, the population with either basic or safely managed sanitation increased from 3.4 to 5.5 billion, which means that the number of people lacking even a basic sanitation service decreased from 2.7 to 2.0 billion. The population practicing open defecation was cut in half, from 1.3 billion to 673 million.
JMP service ladder for global monitoring of sanitation in householdsFIGURE 3
SERVICE LEVEL DEFINITION
Safely managed Use of improved facilities that are not shared with other households and where excreta are safely disposed of in situ or transported and treated off-site.
Basic Use of improved facilities that are not shared with other households.
Limited Use of improved facilities that are shared with other households.
Unimproved Use of pit latrines without a slab or platform, hanging latrines or bucket latrines.
Open defecation Disposal of human faeces in fields, forests, bushes, open bodies of water, beaches or other open spaces, or with solid waste.
Note: Improved facilities include flush/pour to piped sewer systems, septic tanks or pit latrines, ventilated improved pit latrines, composting toilets or pit latrines with slabs.
Despite progress, 2 billion people still lack even a basic level of sanitation serviceFIGURE 4
21%1.3 billion
28%1.7 billion
28%1.7 billion
5%335 million
17%1 billion
20006.2 billion
45%3.4 billion
9%673 million
9%8%627 million
29%2.2 billion 701 million
20177.6 billion
Open defecationUnimprovedLimitedBasicSafely managed
GLOBAL SANITATION COVERAGE, 2000-2017
Note: Each square represents 10 million people.
© U
NIC
EF/I
ndia
/Sin
gh

34 S TAT E O F T H E WO R L D ' S S A N I TAT I O N A C A L L T O T R A N S F O R M S A N I TAT I O N F O R B E T T E R H E A LT H , E N V I R O N M E N T S , E C O N O M I E S A N D S O C I E T I E S 35
3.1.1 Ending open defecation Though the global average reduction in open defecation appears to be on track to eliminate the practice, much of the progress in eliminating open defecation is being driven by gains in a few high population countries.
Figure 5 shows that while 30 countries are on track to achieve open defecation free status, progress is too slow in 30 other countries, and in 10, open defecation is actually increasing as the population grows. This means that open defecation remains a persistent inequality, with nine out of ten open defecators living in rural areas, and poorer people much more likely to practise open defecation.
Few countries are on track to eliminate open defecation by 2030FIGURE 5
PROGRESS TOWARDS ELIMINATING OPEN DEFECATION, 2000-2017
-3
-2
-1
0
1
2
3
4
5
6
7
8
Ann
ual r
ate
of re
duct
ion,
200
0-20
17Pe
rcen
tage
poi
nts
per y
ear
0 20 40 60 80 100
OPEN DEFECATION IS INCREASING IN 10 COUNTRIES
30 COUNTRIESARE ON TRACK
PROGRESS IS TOO SLOW IN 30 COUNTRIES
NepalCambodia
India
Ethiopia
Lao PDR
The concept of ‘open defecation free’ communities is an important one. In these communities every member of every household uses hygienic sanitation facilities all the time, thus maintaining an uncontaminated environment for all. Research has shown that this is important to realize the health benefits of sanitation, since even a small number of households practising open defecation can compromise the health of the whole community. Safe disposal of faeces by one household prevents disease transmission to all households nearby23 and can also protect soil, water and food.24
However, the protective effects of community-wide coverage are not being realized by many households, even though they have invested in their own toilet. Data from household surveys reveal that even though the percentage of individual households in which open defecation is practised has been reduced in many countries, the percentage of households living in communities where at least one other household still practises open defecation remains high (see Figure 6).
BOX 6In 2019, Nepal announced that it had achieved open defecation free status after 10 years of concerted and coordinated government support to the sanitation sector. The initial impetus for action was a 2009 deadly cholera outbreak in Karnali Province. The regional government achieved consensus among civil society and stakeholders across the health, education and WASH sectors, and signed a joint commitment to move forward in sanitation, mobilizing ‘multiple levels, multiple sectors’. Political leaders and administrators in all districts organized sanitation conferences, where commitments were made to eliminate open defecation in their area.
WASH coordination committees were established at all administrative levels, involving representatives from civil society, nearly every sector and across the political spectrum. Karnali Province demonstrated that results at scale could be achieved through this approach, showing a 7 per cent increase in access to sanitation within a year.
The success in Karnali Province was reflected in the Government of Nepal’s 2011 Sanitation and Hygiene Master Plan. Sanitation conferences were initiated across the country and helped build momentum for a government-led social movement at the village, district, region and national levels. Instead of the previous heavy investment in
subsidies for sanitation, a no-subsidy approach was adopted, with support mechanisms for the most vulnerable groups. Government support for improved planning processes informed resource allocations and a dedicated budget line, and pooled funds for sanitation were created. Local WASH coordination committee leadership allowed a stronger focus on local contexts and needs and better utilization of local government resources and partner support to reach the most vulnerable. Local leadership fostered learning and adaptive management, with lessons shared through regional and national platforms.
The combined efforts of government and a broad range stakeholders to build a strong foundation for sanitation in Nepal have sustained progress through numerous setbacks, such as the 2015 earthquake, floods in 2017 and 2019, crippling political strikes and country-wide restructuring to a federal system of government. Since declaring open defecation status in 2019, Nepal has continued its journey on sustaining and addressing a wider scope of behaviors under its total sanitation manifesto. The government is focussed on moving households to higher levels of service, with recent household surveys showing that the proportion of the population using basic sanitation services has increased from 60 per cent in 2014 to 79 per cent in 2019.
Eliminating open defecation in Nepal
Sour
ce: W
orld
Ban
k, P
lan
Inte
rnat
iona
l, WSS
CC
, SN
V, W
ater
Aid,
UN
ICEF
, Del
iver
ing
Rura
l San
itatio
n Pr
ogra
ms
at S
cale
, w
ith E
quity
and
Sus
tain
abilit
y: A
Cal
l to
Actio
n, 2
019.

36 S TAT E O F T H E WO R L D ' S S A N I TAT I O N A C A L L T O T R A N S F O R M S A N I TAT I O N F O R B E T T E R H E A LT H , E N V I R O N M E N T S , E C O N O M I E S A N D S O C I E T I E S 37
3.1.2 Achieving universal coverage of basic services
Many countries have made progress in ensuring that people have at least a minimum level of sanitation that ensures excreta is hygienically separated from human contact. This basic level of service represents significant progress, as it means households have a toilet, such as a pit latrine, or a pour flush toilet emptying to a septic tank or pit, which is not shared with other households. To maintain this level of sanitation, facilities must be durable enough to last multiple seasons.
Some countries that have made significant progress on eliminating open
defecation have found it challenging to achieve basic sanitation. For instance, Ethiopia reduced open defecation from 79 per cent to 22 per cent between 2000 and 2017. However, in the same time period basic sanitation coverage increased from 3 per cent to just over 7 per cent. Similarly, Burkina Faso reduced open defecation by 25 percentage points over the same time period, while basic sanitation coverage increased by only 8 percentage points.
Another challenge has been to achieve progress in basic sanitation while also eliminating inequalities. As Figure 7 shows, some countries have reduced the coverage gap between the wealthiest and poorest households, while in other countries overall progress has been made, but the gap has widened.
Many people live in communities that are not open defecation freeFIGURE 6
PERCENTAGE OF POPULATION PRACTISING OPEN DEFECATION AND LIVING IN COMMUNITIES WHERE AT LEAST ONE HOUSEHOLD PRACTISES OPEN DEFECATION, 2015-2018
Sour
ce: S
elec
ted
natio
nal h
ouse
hold
sur
veys
0 20 40 60 80 100
Household open defecation Community open defecation
69 91
33 90
25 76
7424
5123
5012
489
5 15
5 63
1 8
Chad
Ethiopia
Haiti
Timor-Leste
Nigeria
Pakistan
Indonesia
Colombia
Malawi
Mexico
Progress in sanitation has sometimes been made at the expense of increasing inequalitiesFIGURE 7
TRENDS IN COVERAGE OF BASIC SANITATION AMONG THE RICHEST AND POOREST WEALTH QUINTILES, 2000-2017
Lao People's Democratic Republic
Cambodia Mongolia Thailand
BASIC SANITATION
Richest Poorest Gap between richest and poorest quintiles
2000 20172000 2017 2000 2017 2000 2017
41
98
5
29
77
92
0
15
95 95
37
4
1009494
92
© U
NIC
EF/I
ndia
/Qad
ri

38 S TAT E O F T H E WO R L D ' S S A N I TAT I O N A C A L L T O T R A N S F O R M S A N I TAT I O N F O R B E T T E R H E A LT H , E N V I R O N M E N T S , E C O N O M I E S A N D S O C I E T I E S 39
3.1.3 Accelerating progress towards safely managed sanitation services A range of technologies can be used to achieve safely managed sanitation, including sewerage systems, which transport waterborne waste through pipes to off-site treatment, and on-site systems. On-site, also called non-sewered, systems either provide treatment in-situ (such as simple pit latrines) or contain waste that can be transported to off-site treatment (such as septic tanks or emptiable latrines).
On-site facilities are effective and low-cost, and can provide safe sanitation for users when designed, built and used well, and when part of a functional sanitation service chain. However, on-site storage and treatment systems,
such as pit latrines and septic tanks, may be compromised due to a number of factors, including poor design, inadequate operation and maintenance, damage or flooding, high population density in urban areas and lack of appropriate regulation.
On-site systems are widely used and their use is growing in some regions. In 2017, 41 per cent of the world’s population reported using improved sanitation facilities with on-site storage, such as flush or pour-flush toilets connected to a septic tank, and dry or wet pit latrines (including facilities shared with other households). Use of on-site sanitation was more common in rural areas (51 per cent) than in urban settings (32 per cent). Use of sewers and on-site systems varies widely between regions, but on-site systems are clearly driving progress in least-developed countries (see Figure 8).
© U
NIC
EF/U
N03
5255
1/O
se
Data on the performance of on-site sanitation is hard to obtain, but is available from some household surveys and reports compiled by governments from periodic inspections. For example, the Environmental Protection Agency of Ireland is a rare example of an agency that publishes the results from periodic inspections of decentralized wastewater treatment systems, including septic tanks and small-scale secondary or tertiary treatment plants. Of the 6,000 systems inspected between 2013 and 2018 in Ireland, nearly half were issued
with an advisory notice, and one in four were found to present a risk to human health or the environment.25
Relatively few countries have sufficient data to report on safely managed sanitation. In 2017, there were 94 countries with national data, mostly countries with relatively small populations using on-site sanitation (see Figure 9). Despite the lack of data, it is clear that in many countries a low proportion of the population is using safely managed sanitation.
Sewer connections are driving progress in some regions, while on-site systems are predominant in others
FIGURE 8PERCENTAGE OF POPULATION USING SEWER CONNECTIONS, SEPTIC TANKS, LATRINES AND OTHER IMPROVED ON-SITE SYSTEMS IN 2017, AND PERCENTAGE POINT CHANGE, 2000-2017
0
10
20
30
Sewer Septic Latrine and other
0
20
40
-10
8 10
31
814 12 13
2833
48
2319
23
1017
9 9 612
1 412
3441
20 21
60
80
100
Sub-SaharanAfrica World
LeastDevelopedCountries
Australia andNew Zealand
Northern Africa and
Western Asia
Eastern and South-Eastern
Asia
Europe and Northern America
Latin Americaand the
Caribbean
Central and Southern
AsiaOceania
CHANGE IN USE OF IMPROVED SANITATION FACILITIES, BY TYPE, 2000-2017 (% PT)
USE OF IMPROVED SANITATION FACILITIES BY TYPE, 2017 (%)
17 3
-1 0-7
3
1722 22
5
-1
14
-2 -3
17
-1 -3
5
-2 -1
10 -1
1 710 9 6 5
5966
8488

40 S TAT E O F T H E WO R L D ' S S A N I TAT I O N A C A L L T O T R A N S F O R M S A N I TAT I O N F O R B E T T E R H E A LT H , E N V I R O N M E N T S , E C O N O M I E S A N D S O C I E T I E S 41
3.1.4 Current rates of progress Achieving universal access to sanitation by 2030 will require dramatic acceleration in current rates of progress. To achieve universal access to at least basic sanitation by 2030, global rates of progress would need to double (see Figure 10).
Achieving universal access to safely managed sanitation by 2030 would require quadrupling the current global rate of progress. But these are global averages; the required rate of change in least-developed countries is even higher. To achieve basic sanitation in these countries, the rate of change would have to increase from an estimated 0.7 percentage points per year to 5 percentage points per year, a seven-fold increase.
In many low-income countries, less than 50 per cent of the population uses safely managed sanitation
Achieving universal access by 2030 will require dramatic acceleration in current rates of progressFIGURE 9 FIGURE 10
PERCENTAGE OF POPULATION USING SAFELY MANAGED SANITATION SERVICES, 2017 PERCENTAGE OF POPULATION WITH SANITATION SERVICES IN 2000 AND 2017, AND RATE OF CHANGE REQUIRED TO MEET SDG TARGETS BY 2030
2000 2005 2010 2015 2020 2025 2030
Prop
ortio
n of
the
popu
latio
n (%
)
0
20
40
60
80
100
56
79
91
1x
2x
4x74
45
28
No open defecationBasic sanitationSafely managedsanitation
Accelerationrequired
100
© U
NIC
EF/U
N03
5257
0/O
se
© U
NIC
EF/U
N01
3945
4/Pr
insl
oo

42 S TAT E O F T H E WO R L D ' S S A N I TAT I O N A C A L L T O T R A N S F O R M S A N I TAT I O N F O R B E T T E R H E A LT H , E N V I R O N M E N T S , E C O N O M I E S A N D S O C I E T I E S 43
Nineteen per cent of schools worldwide were estimated to have no service in 2019.26 Children and teachers at these schools either rely on unimproved facilities, such as pit latrines without a slab or platform, hanging latrines or bucket latrines, or had no sanitation facility at all.
An estimated 367 million children attend a school in which there is no sanitation facility at all. Over half of these children live in two SDG regions: sub-Saharan Africa (213 million children) and Central and Southern Asia (200 million children).
Some countries have made progress in school sanitation. Between 2015 and
2019, Bhutan and Nigeria increased the proportion of schools with basic sanitation by 3 percentage points per year. South Sudan reduced the proportion of schools with no sanitation service by 4 percentage points per year over the same period.
However, achieving universal access to basic sanitation services in schools by 2030 will require a five-fold increase in the current rate of progress. Figure 12 shows the trends in reaching sanitation coverage in schools globally, in the eight SDG regions and in least-developed countries.
Sanitation in schools 3.2SDG 4 calls for the global community to “Ensure inclusive and quality education for all and promote lifelong learning”. The goal includes a range of targets related to educational outcomes from early years through to adulthood, and additional targets addressing the means of achieving them. Target 4.a focusses on school infrastructure and the need
to “Build and upgrade education facilities that are child, disability and gender sensitive and provide safe, non-violent, inclusive and effective learning environments for all”. One of the indicators used to track progress towards this target is the “Proportion of schools with access to single-sex basic sanitation facilities”.
Sanitation services ladder for schoolsFIGURE 11SERVICE LEVEL DEFINITION
Basic service Improved sanitation facilities at the school that are single-sex and usable (available, functional and private) at the time of the survey.
Limited service Improved sanitation facilities at the school that are either not single-sex or not usable at the time of the survey.
No service Unimproved sanitation facilities or no sanitation facilities at the school.
Analysis of data from rural schools in 12 sub-Saharan African countries revealed that many school toilets did not meet criteria for accessibility, quality or acceptability (see Figure 13). In particular, almost half did not have doors that locked from inside, and hardly any
had a bin with a lid inside the cubicle for garbage disposal. Both of these features are important to female students and staff who need a safe place to practise menstrual hygiene management. Two thirds of school toilets were not accessible to children with disabilities.
Globally, less than two thirds of schools have basic sanitationFIGURE 12
REGIONAL AND GLOBAL SANITATION COVERAGE IN SCHOOLS, 2015 AND 2019
2015 2019
Wor
ld
0
20
40
60
80
100
Leas
tD
evel
oped
Cou
ntrie
s
Aus
tral
ia a
ndN
ew Z
eala
nd
Nor
ther
nA
frica
and
Wes
tern
Asi
a
East
ern
and
Sout
h-Ea
ster
nA
sia
Oce
ania
Euro
pe a
ndN
orth
ern
Am
eric
a
Latin
Am
eric
aan
d th
eC
arib
bean
Cen
tral
and
Sout
hern
Asi
a
Sub-
Saha
ran
Afri
ca
43
27
30
47
27
27
47
13
40
47
13
40
56
20
24
64
20
16
78
11
10
75
19
6
79
10
11
87
310
98
10
99
10
100 100
33 32
48
27
25
51
28
22
2015 2019 2015 2019 2015 2019 2015 2019 2015 2019 2015 2019 2015 2019 2015 20192015 2019
60 63
17
23
18
19
No service Limited Basic Insu�icient data
© U
NIC
EF/U
N03
3691
/Arc
os

44 S TAT E O F T H E WO R L D ' S S A N I TAT I O N A C A L L T O T R A N S F O R M S A N I TAT I O N F O R B E T T E R H E A LT H , E N V I R O N M E N T S , E C O N O M I E S A N D S O C I E T I E S 45
In rural sub-Saharan Africa, many school toilets do not meet criteria for accessibility, quality or acceptability
FIGURE 13PERCENTAGE OF SCHOOLS IN RURAL SUB-SAHARAN AFRICA WHERE ALL SANITATION FACILITIES MEET ADDITIONAL CRITERIA, 2017
Sour
ce: S
urve
y of
san
itatio
n fa
cilit
ies
in ru
ral s
choo
ls in
Eth
iopi
a, G
hana
, Ken
ya, M
alaw
i, M
ali,
Moz
ambi
que,
Nig
er, R
wan
da,
Uga
nda,
Uni
ted
Repu
blic
of T
anza
nia,
Zam
bia
and
Zim
babw
e, W
orld
Vis
ion,
201
7.
* At least one facility accessible to the smallest children and children with limited mobility.
3
28
55
56
78
1
4
5
12
13
81
91
97
31
71
86
91
99
0 20 40 60 80 100
Proportion of schools where all sanitation facilities meet criteria
Private space for washing
No flies present
27No bad smell
No faeces present on floor, slab or walls
Doors that can be locked from inside
No major holes in superstructure
Acceptability
Bin with lid within cubicle
Soap available
Lid covering hole/slab
Water available
Functional lighting
Slab stable and not cracked or broken
No pit that is caving or flooded
No pit that is full
Quality
Accessible by children with limited mobility*
Always unlocked or key available
No barriers blocking entry or use
Accessible by smallest children*
Located on premises
Accessibility
BOX 7In Togo, the proportion of the country’s nearly 9,000 schools with basic sanitation facilities increased from 44 per cent in 2016 to 65 per cent in 2019. Strong government leadership in policy and planning for WASH in schools laid the foundation for this considerable increase. The Education Sector Plan (2014-2025) and the National Action Plan for the Water and Sanitation (2016-2030) both identify WASH in schools as a priority area and provide dedicated support and capacity building. The Ministry of Education has led the development of norms and standards to improve the quality of WASH infrastructure and hygiene promotion programmes and has incorporated WASH indicators into its Integrated Education Information System. The 2017 Roadmap for an Open Defecation Free Togo by 2025 also contributed to strengthening sanitation in schools by including school-led total sanitation as a key
strategy. School-led total sanitation has resulted in significant progress in sanitation and hygiene practices in over 2,000 schools.
Supported by the World Bank, between 2010 and 2019 the government implemented a school infrastructure construction programme that included the construction of at least 1,000 toilets in schools. WASH programmes funded by others, such as UNICEF, the French Development Agency and the Islamic Development Bank, also supported the construction of gender-separated toilets that enable adolescent girls to manage their menstruation. The Government of Togo plans to consolidate its achievements by focussing on sustainability, strengthening national-level coordination of WASH in schools under the leadership of the education sector, and mobilizing resources for capital and recurrent costs.
Improving sanitation in schools in Togo
© U
NIC
EF/U
NI2
8467
5/Pr
insl
oo

46 S TAT E O F T H E WO R L D ' S S A N I TAT I O N A C A L L T O T R A N S F O R M S A N I TAT I O N F O R B E T T E R H E A LT H , E N V I R O N M E N T S , E C O N O M I E S A N D S O C I E T I E S 47
In the global baseline report published in 2019, only 18 countries had sufficient data to estimate coverage of basic sanitation services in health care facilities in 2017.27 When WHO and UNICEF updated the global database in 2020, the number increased by 50 per cent. However, the 27 countries with sufficient data still represent only 12 per cent of the global population.28
To fully assess progress towards basic sanitation coverage, data are required
on the adequacy of facilities, including whether or not there are private toilets for men and women, accessible facilities for people with limited mobility and menstrual hygiene facilities. Lack of data mean that the actual situation is likely much worse than the available figures suggest. Figure 15 shows three contrasting countries, in which the proportion of health care facilities with elements of basic sanitation varies considerably.
While many countries lacked some of the data needed to report on basic sanitation services, they did have some information about how many health care facilities lacked any kind of improved sanitation facilities, and are classified as having no sanitation service (see Figure 16).
In 28 countries, more than 10 per cent of health care facilities had no sanitation service, and in the sub-Saharan African countries with data, 29 per cent of health care facilities had no sanitation service.
Sanitation services ladder for health care facilities
Sanitation in health care facilities varies considerably between countries
FIGURE 14
FIGURE 15
SERVICE LEVEL DEFINITION
Basic service Improved sanitation facilities are usable, with at least one toilet dedicated for staff, at least one sex-separated toilet with menstrual hygiene facilities, and at least one toilet accessible for people with limited mobility.
Limited service At least one improved sanitation facility is available, but not all requirements for basic service are met.
No service Toilet facilities are unimproved (e.g. pit latrines without a slab or platform, hanging latrines, bucket latrines) or there are no toilets.
PERCENTAGE OF HEALTH CARE FACILITIES WITH ELEMENTS OF BASIC SANITATION ACROSS THREE COUNTRIES, 2019
KUWAIT BRAZIL NIGER
Facility 100 100 -
Improved 100 100 74
& usable 100 84 29
& dedicated for staff 100 82 30
& dedicated for women 100 - 31
& menstrual hygiene management 100 - 0
& limited mobility 100 45 27
Basic 100 45 0
Sanitation in health care facilities
3.3
The availability of sanitation in health care facilities, especially in maternity and primary-care settings, supports health care quality and equity, helping ensure dignity for all people. Basic sanitation services in health care facilities are fundamental to providing quality care.
Evidence shows that lack of access to WASH in health care facilities may significantly compromise safe childbirth and access to primary health care. More than one million deaths each year are
associated with unclean births, while infections account for 26 per cent of neonatal deaths and 11 per cent of maternal mortality. An estimated 15 per cent of patients in low- and middle-income countries develop one or more infections during a hospital stay. Many of these patients are women who come to health facilities to deliver. Inadequate WASH in health care facilities has been linked to the spread of antimicrobial-resistant infections, placing patients and staff at risk of serious infections that are hard to treat.
© U
NIC
EF/U
N03
0643
1/A
bdul

48 S TAT E O F T H E WO R L D ' S S A N I TAT I O N A C A L L T O T R A N S F O R M S A N I TAT I O N F O R B E T T E R H E A LT H , E N V I R O N M E N T S , E C O N O M I E S A N D S O C I E T I E S 49
Sanitation for forcibly displaced persons
3.4
Achievement of SDG target 6.2 ‘for all’ implies the inclusion of refugees, asylum seekers, stateless people and IDPs. The world is currently witnessing the highest levels of human displacement on record. At the end of 2019, there were 79.5 million people globally who were forcibly displaced as a result of persecution, conflict, violence, human rights violations or other events.29 Approximately 26 million of these are refugees and another 45 million are internally displaced persons (IDPs). The vast majority, 85 per cent, of displaced people live in developing countries where access to safely managed water, sanitation and
hygiene services may be limited. In these situations, sanitation implementation approaches must take into consideration the weak institutional context and unique deprivations and vulnerabilities of the population to fulfil every individual’s right to sanitation.
The United Nations High Commissioner for Refugees (UNHCR) and its partners manage over 220 camps and settlements globally and collect data on WASH services in them. According to data from 175 of these sites in September 2020, only 32 per cent of households at the sites used basic sanitation services.30
© U
NIC
EF/U
N01
3597
/Geo
rgie
v
In 28 countries, more than ten per cent of health care facilities had no sanitation serviceFIGURE 16
PERCENTAGE OF HEALTH CARE FACILITIES WITH NO SANITATION SERVICE, 2019
Note: Not showing 21 countries reporting less than 1 per cent of health care facilities with no sanitation service.
16
78
410
10111212
33
13
23
18
1420
3236
45
1819
37
1155
77799111112
141616
1924242526
3649
5152
0 20 40 60 80 100
BhutanBangladesh
Sri LankaNepal
HondurasGuatemala
PeruHaiti
ParaguayNicaragua
ChinaTimor-Leste
Indonesia
SerbiaRomania
Russian Federation
TongaCook Islands
Papua New GuineaVanuatu
IraqLibya
LebanonArmenia
Sudan
ZimbabweRwanda
MaliDjibouti
Burkina FasoZambiaMalawi
BeninNamibia
Sierra LeoneMauritania
GuineaChad
KenyaSomaliaSenegalEthiopia
LiberiaUganda
NigerDemocratic Republicof the Congo
ComorosNigeria
United Republic of Tanzania
Sub-SaharanAfrica
Northern Africaand Western Asia
Oceania
Europe andNorthern America
Eastern and South-Eastern Asia
Latin Americaand the
Carribean
Central andSouthern Asia

50 S TAT E O F T H E WO R L D ' S S A N I TAT I O N A C A L L T O T R A N S F O R M S A N I TAT I O N F O R B E T T E R H E A LT H , E N V I R O N M E N T S , E C O N O M I E S A N D S O C I E T I E S 51
BOX 8At the end of 2018, there were over 2.7 million forcibly displaced persons in Afghanistan.33 There is only one managed camp in Afghanistan, which hosts less than 1 per cent of the forcibly displaced living in the country. In 2018, a survey was carried out to look at the needs of the 99 per cent of forcibly displaced who are dispersed throughout the country. The results show a dramatic disparity between refugees and the rest of the population, as shown in Figure 17. Only 28 per cent of refugees had access to basic sanitation, and as many as 55 per cent of refugee households practiced open defecation.34 These figures are in stark contrast to JMP figures for Afghanistan, which estimate that 43 per cent of the overall population had access to basic sanitation in 2017.35 Even in rural areas, only 17 per cent of households practiced open defecation.
The survey found a significant disparity in service between female- and male-headed households. Among the forcibly displaced, a significantly higher proportion of female-headed households (30 per cent) reported not having access to an improved latrine compared to male-headed households (21 per cent).
These disparities demonstrate the importance of ensuring that monitoring programmes systematically include vulnerable groups to generate the evidence needed to design and deliver programmes to reach them. In the absence systematic monitoring, there is a considerable risk that the most vulnerable will be left behind.
Estimating access to sanitation service amongst forcibly displaced persons in Afghanistan
Sour
ce: U
NH
CR
Sanitation services available in refugee and non-refugee populations in Afghanistan
FIGURE 17
0
20
40
60
80
100
Popu
latio
n (%
)National* Urban*Rural* Refugees
43
10
34
13
37
40
6
17
27
1
1
16
55
62
21
16
0
Open defecationUnimprovedLimitedBasicSafely managed
There are considerable practical challenges to reaching the SDG targets for sanitation in camps and settlements. One challenge is the lack of sufficient space for installing household facilities. A recent review found that globally 43 per cent of sites exceeded UNHCR population density standards.31 For example, in the Kutapalong camp in Bangladesh, the average population density is almost 44,000 people per square kilometre, making it one of the highest population densities on earth.32 In these situations, designing and installing improved sanitation systems, which are not shared between households, may not be feasible.
Instead, the focus should be on minimizing the number of individuals sharing a facility, and safe excreta management (transport and treatment off-site), while ensuring that the planning, design, location and management of facilities is done with full participation of the affected population.
An estimated 60 to 70 per cent of forcibly displaced persons live outside of camps and settlements. Unfortunately very few countries have disaggregated sanitation data for displaced populations which makes it difficult to track whether they are being left behind the rest of the population.
© U
NIC
EF/U
NI2
3897
6/C
hak

52 S TAT E O F T H E WO R L D ' S S A N I TAT I O N 53
4What is the status of policy and finance for sanitation?4.1 Status of sanitation policy
4.2 The cost of achieving universal sanitation
4.3 How much is being invested, and where is it coming from?
Status of sanitation policy4.1Sustainable and effective WASH service delivery is determined not only by the state of infrastructure, but also by complex institutional, governance and financial management systems. Governance and financing systems need to be articulated in policy, and must be coordinated and aligned, ensuring the sustainability of resources and institutions to support sanitation service delivery.
Recent insights into the status of policy and finance for sanitation are highlighted in the 2019 GLAAS report, which features data from 115 countries.36
The majority of countries have national policies and plans for sanitation, but few have adequate human and financial resources to implement them. Of the 115 countries participating in the GLAAS 2018/2019 cycle, only three had policies and plans for rural sanitation with sufficient resources to implement them, and only six had sufficient resources to implement urban sanitation plans. Three quarters of respondent countries cited the existence of a financing plan for sanitation. However, only about one quarter said they have financing plans that have been defined, agreed and consistently used.
© U
NIC
EF/I
ndon
esia
/Fau
zan
© ©
UN
ICEF
/UN
I1893
29/G
ilber
tson
VII
Phot
o

54 S TAT E O F T H E WO R L D ' S S A N I TAT I O N A C A L L T O T R A N S F O R M S A N I TAT I O N F O R B E T T E R H E A LT H , E N V I R O N M E N T S , E C O N O M I E S A N D S O C I E T I E S 55
Few countries have formally approved, adequately resourced sanitation policies
Not all urban sanitation policies and plans address faecal sludge management
FIGURE 18
FIGURE 19
Households that are most in need of faecal sludge management services (emptying, transport, treatment and end use or disposal) are often located in dense urban settings. However, faecal sludge management is not addressed in a quarter of urban sanitation policies or plans.
Governments need to recognize the important role of adequate faecal sludge management in achieving national sanitation targets and the SDGs by addressing the issue in sanitation policies and plans, and supporting them with sufficient resources for implementation.
NUMBER OF COUNTRIES REPORTING FORMALLY APPROVED POLICIES SUPPORTED BY RESOURCED PLANS, 2019
NUMBER OF COUNTRIES WITH URBAN POLICIES AND PLANS THAT ADDRESS FAECAL SLUDGE MANAGEMENT, 2019
104
67
51
46
5
0 20 40 60 80 100 120
Number of countriesUrban sanitation
101
63
48
44
3
020406080100
Number of countriesRural sanitation
Countries with formally approved policy and approved and costed plan
with su�icient financial and human resources
Countries with formally approved policy and
approved and costed plan
Countries with formally approved policy
and approved plan
Countries with formally approved policy
Countries with policies formally approved OR under revision
OR under development
38
50
49
59
74
77
0 10 20 30 40 50 60 70 80 90 100
Use of municipal wastewaterand faecal sludge
Faecal sludge emptyingand transport
Faecal sludge treatment
Number of countries
Urban policy or plan Rural policy or plan
Few countries have national standards for safe use of wastewater or faecal sludgeFIGURE 20
In countries where open defecation is still practised, approximately three quarters have specific measures in policies and plans to address open defecation.37 Two thirds of these countries have established national targets to eliminate open defecation. For example, the National Open Defecation Free Kenya 2020 Campaign Framework aims to “eradicate open defecation and to declare 100 per cent of villages and Kenya open defecation free by 2020”. Zambia recently launched the Open Defecation Free Zambia Strategy (2018–2030), which aims to end open defecation, especially among populations living in vulnerable situations.
Countries are responding to the SDG imperative to ‘leave no one behind’ by establishing policy measures to reach populations living in vulnerable situations. For example, in Senegal, the Action Plan for the Implementation of the National Policy for Rural Sanitation by 2025 proposes measures to ensure that the poorest can access sanitation, with payment based on their financial capacity. However, while over two thirds of countries report they have policy measures to reach poor populations
with sanitation, only one quarter have ways of financing them.
Governments are also challenged by regulation and standard setting. Over two thirds of countries have formal national standards for wastewater treatment, but far fewer have national standards for safe use of wastewater or faecal sludge. While 77 per cent of countries have a formal national standard for wastewater treatment, only 36 per cent of countries have a standard for safe use of wastewater and sludge for agriculture and other productive purposes.
The institutions tasked with oversight of sanitation standards are stretched, lacking sufficient funds and sufficient human resources to undertake the necessary surveillance and enforcement. Only 32 per cent of countries reported having sanitation/wastewater regulatory authorities that fully take corrective action in urban; and only 23 per cent in rural areas. Two thirds of countries reported that they have less than 50 per cent of the human resources they need for wastewater surveillance in urban areas.
PERCENTAGE OF RESPONDENT COUNTRIES WITH FORMAL NATIONAL STANDARDS FOR WASTEWATER, ON-SITE SANITATION, FAECAL SLUDGE AND SAFE USE, 2019
0 10 20 30 40 50 60 70 80 90 100
77
68
56
36Safe re-use (n=110)
Faecal sludge (n=111)
On-site sanitation (n=111)
Wastewater (n=112)

56 S TAT E O F T H E WO R L D ' S S A N I TAT I O N A C A L L T O T R A N S F O R M S A N I TAT I O N F O R B E T T E R H E A LT H , E N V I R O N M E N T S , E C O N O M I E S A N D S O C I E T I E S 57
The cost of achieving universal sanitation
4.2There are multiple ways in which sanitation can be funded, drawing on the resources of households, governments and international aid agencies. Government support has a catalytic role to play, triggering effective investments from households and the private sector. This does not mean, however, that the public purse has to bear all the costs. This is further discussed in Chapter 6.
A study of 140 low- and middle-income countries, published by the World Bank in 2016,38 and updated for this report,39
estimates that, from 2017 to 2030, the annual costs to achieve universal sanitation would be US$105 billion (see Figure 21).
The annual costs to achieve universal sanitation by 2030 are estimated to be US$105 billionFIGURE 21
ANNUALIZED COSTS OF ACHIEVING UNIVERSAL SANITATION GLOBALLY, 2017-2030
1.5
21
48
69
3.9
15
21
36
0
20
40
60
80
100
120
Elimination ofopen defecation
Basicsanitation
Safely managedsanitation
Total
US$
Bill
ion
Capital costsOperations and maintenance costs
Annual costs to achieve safely managed sanitation vary by region, and are highest in sub-Saharan AfricaFIGURE 22
Eliminating open defecation alone will require a capital outlay of US$1.5 billion annually, with significantly greater operations and maintenance (O&M) costs of US$3.9 billion annually due to the regular replacement of latrines.
The cost of achieving safely managed sanitation varies considerably between regions, as shown in Figure 22.
The region with by far the highest cost is sub-Saharan Africa, which would need an average of US$25.7 billion in annual capital spending, supported by an additional US$13.2 billion in annual O&M costs. The high cost of effective O&M is often not well anticipated and hence not sufficiently budgeted, leading to breakdowns and backsliding.
ANNUALIZED COSTS OF ACHIEVING UNIVERSAL SAFELY MANAGED SANITATION BY SDG REGION, 2017-2030
0
5,000
10,000
15,000
20,000
25,000
30,000
35,000
40,000
45,000
Capital costsOperations and maintenance costs
US$
Mill
ion
Latin Americaand the Caribbean
5,212
8,670
13,236
25,653
3,918
7,537
6,372
13,603
6,696
12,093
137
Sub-SaharanAfrica
Nothern Africaand Western Asia
Central andSouthern Asia
Eastern andSouth-Eastern Asia
Oceania
© U
NIC
EF/J
orda
n/Sa
man

58 S TAT E O F T H E WO R L D ' S S A N I TAT I O N A C A L L T O T R A N S F O R M S A N I TAT I O N F O R B E T T E R H E A LT H , E N V I R O N M E N T S , E C O N O M I E S A N D S O C I E T I E S 59
Regional costs of achieving basic and safely managed sanitation as a proportion of gross regional product (GRP) are estimated to be highest in sub-Saharan Africa (1.1 per cent for basic and 2.5 per cent for safe sanitation), with capital costs at US$10 billion per year and O&M costs of US$7.2 billion per year. Challengingly, sub-Saharan Africa also has fewer financial resources available than other regions. The proportions in other regions are significantly lower. In Eastern and South Eastern Asia, for example, it would cost 0.04 per cent of GRP to achieve basic sanitation and 0.13 per cent to achieve safely managed sanitation, with capital costs of US$3.6 billion per year and O&M costs of US$2.2 billion per year.
Globally, more than 70 per cent of basic sanitation costs are in urban areas, with the figure rising to more than 90 per cent in North Africa and Western Asia and Eastern and Southern Asia, and approximately 60 per cent in sub-Saharan Africa and Caucasus and Southern Asia. For safely managed sanitation, about 65 per cent of the globally costs are for urban areas, while one region – Caucasus and Southern Asia – has over 60 per cent accounted for by rural costs.
The total global average capital cost per beneficiary to gain access to safely managed sanitation is US$24, varying from US$13 per beneficiary in Caucasus and Southern Asia, to US$28 in sub-Saharan Africa, and over US$41 in Latin America and the Caribbean.
How much is being invested, and where is it coming from?
4.3
An analysis of data from 18 countries participating in the 2018/2019 GLAAS survey indicates that, on average, in those countries, households contribute the largest share of funding for sanitation through tariffs and self-supply expenditures on their own facilities. Across the 18 countries, households contributed an average 68 per cent of the current investment in sanitation, followed by governments, at 19 per cent.40
Sixty countries have provided information to GLAAS in the 2018/2019 survey on government budgets for WASH. Overall, the reported average WASH budget per capita was US$9, ranging from US$1 to US$150. Thirty countries were able provide information on their government budget for sanitation. Reported annual budgets ranged from US$75 million in Panama to less than US$1 million in some small countries. Overall, the average sanitation budget per capita for these 30 countries was US$1.43, less than one quarter of the overall WASH budget per capita.41
Government budgets on overall WASH are increasing at an average rate of 11.1 per cent per year. Detailed data on government sanitation budgets over time is very limited. Only nine countries reported comparable sanitation-specific government budget data in the last two GLAAS surveys. Five of those nine reported decreased sanitation budgets between surveys, with an average decrease of 1.2 per cent per year.42
Investments from external sources, such as donor grants and funds from
non-governmental organizations and foundations, amounted to only 1 per cent of the total investment in sanitation. However, they contribute, on average, 42 per cent of non-household expenditures in the 11 low-income countries that reported sanitation expenditure data.
The total disbursement of official development assistance grants and loans that is allocated to sanitation is difficult to estimate as external support agencies do not always disaggregate their data by sub-sector. It is estimated that support to sanitation has increased since 2010, and in 2018 was over US$1 billion, which is approximately half of the support reported for drinking-water. Grants were mainly targeted to low-income countries, with wealthier countries accessing repayable finance from development banks.
Eighty per cent of respondent countries reported insufficient funding to meet their national sanitation targets. Data from the 12 countries that were able to report quantitative funding gaps by sub-sector revealed that the funding gap was greatest in urban sanitation (74 per cent of the total investment needed to achieve national targets), but also significant for rural sanitation (59 per cent).
Fewer than half of the countries reported that the costs of operating and maintaining sanitation systems are covered through existing tariffs and user fees (see Figure 24). However, this proportion has been increasing over time.©
UN
ICEF
/UN
0348
917/
Mod
ola

60 S TAT E O F T H E WO R L D ' S S A N I TAT I O N A C A L L T O T R A N S F O R M S A N I TAT I O N F O R B E T T E R H E A LT H , E N V I R O N M E N T S , E C O N O M I E S A N D S O C I E T I E S 61
Eighty per cent of respondent countries reported insufficient funding to meet their national sanitation targets
FIGURE 23
Fewer than half of countries reported that the costs of operating and maintaining sanitation systems are covered through existing tariffs
FIGURE 24
ANNUAL RURAL/URBAN FUNDING GAP TO REACH NATIONAL SANITATION TARGETS, 2018
PERCENTAGE OF COUNTRIES INDICATING THAT MORE THAN 80 PER CENT OF O&M COSTS ARE COVERED BY TARIFFS, 2013-2018
Annual available fundsAnnual additional fundsneeded to reach targets
US$
Mill
ion
Urban sanitation(n=11)
Rural sanitation(n=11)
Funding gap(59%)
Funding gap(74%)
0
500
1000
1500
2000
2500
2013 (n=91) 2016 (n=64) 2018 (n=96)
Rural sanitation Urban sanitation
0
5
10
15
20
25
30
35
40
45
22
39 38
18
3432
© U
NIC
EF/U
NI16
5897
/Noo
rani

62 S TAT E O F S A N I TAT I O N R E P O R T 63
5Imagining a better future: a dramatic acceleration in progress is possible
Despite considerable progress in global sanitation coverage in recent years, achieving sanitation for all will require an ambitious and well-coordinated scale-up.
So what might be feasible in the next five years? An analysis done for WHO’s 2019-2023 five-year strategy categorized countries into five groups according to historical rates of progress for basic sanitation services and asked: How many more people could be reached if every country accelerated to match the highest achievers in their group?43 If countries below the group average were to match the group average, and countries already above the group average were to match the highest achievers in their group, an additional 200 million people would gain access in the next five years, an increase in coverage of 1.6 percentage points per
year, bringing the world much closer to the 2.0 percentage points per year needed to reach 100 per cent coverage by 2030.
This analysis shows that rapid progress is possible. It is feasible to change the story around sanitation from one of continued ill-health, indignity and economic losses to a public health success. But acceleration requires governments to leverage their role successfully, and that both public and private investments are well used and sustained.
Every country that has made rapid progress in sanitation has had strong political leadership, with government playing an important role in policy, planning, mobilizing investment and regulating services.
© U
NIC
EF/J
orda
n/Sa
man
© U
NIC
EF/I
ndia
/Qad
ri

64 S TAT E O F T H E WO R L D ' S S A N I TAT I O N A C A L L T O T R A N S F O R M S A N I TAT I O N F O R B E T T E R H E A LT H , E N V I R O N M E N T S , E C O N O M I E S A N D S O C I E T I E S 65
BOX 9In 2018, WHO published Guidelines on Sanitation and Health that collectively analysed over 1,000 studies to distil what needs to happen in sanitation to make a difference in health and well-being and lay a foundation for social and economic development. The core learnings and recommendations are:
Everyone, everywhere needs to have and use a decent toilet. Half measures that leave out people who are hard to reach and unable to change behaviour is both a violation of those individuals’ human rights and a social and public health risk that affects society at large. Sanitation interventions must be universal and achieve levels of service that will make a difference to the health and well-being of everyone. Poor quality facilities are not better than nothing – they can create more risks for the user, bring excreta nearer to where people live, and become a wasted investment when users revert to open defecation in disgust or because the toilets were easily damaged or filled and cannot be emptied. Reaching everyone in a community will sometimes necessitate shared and public toilet facilities, that also meet minimum service levels, as an incremental step when household facilities are not feasible. Providing hardware for toilets alone or working on behaviour change alone is not cost effective or sustainable. To reach everyone, both supply and demand approaches need to be delivered at the same time.
To properly protect heath, toilets must be connected to safe systems and services all the way from defecation to safe disposal and use. Safely managed sanitation systems are needed to really make a difference for health. Copying the dated sanitation service provision systems of developed countries is too slow, too costly, reaches too few, favours the most privileged, misses exciting opportunities for resource recovery and climate resilience, and delivers limited health benefits. Solutions for the future require a mix of technologies and services responding to the local context of physical, social and institutional conditions. In doing so, countries can leapfrog with a resilient mix of systems and services within the circular economy.
Many more sanitation workers are needed. Providing more formalized, safe, adequately paid and dignified jobs in the sanitation sector is key to providing safely managed sanitation services.
Efficient and sustainable sanitation needs to have a higher profile in its own right, and be addressed in coordination with other local services. One reason for slow progress on sanitation is because it has lacked visibility, investment and specialized skills. It suffers from being integrated with water supply, which is typically more appealing to the public and politicians. In recent years, sanitation has gained greater traction as a sub-sector in its own right. However, the interface and coordination with other services – such as water supply and hygiene, safe disposal of child faeces, drainage and management of domestic animals – is key for sustainability and health impact. Similarly, sanitation services can be more efficiently planned and financed when tackled as part of a package of locally-delivered services such as housing, water supply, solid waste management and transportation.
Health actors have critical functions to ensure sanitation protects health and reduces the burden on the health system. These include: • Integrating sanitation into all health policies
and programmes where sanitation is needed for primary prevention;
• Contributing to the development of sanitation norms and standards, ensuring they are protective of health and the environment;
• Using health surveillance to target sanitation investment in high-disease-burden areas and to prevent outbreaks;
• Including community level sanitation promotion and monitoring in local level health services; and
• Ensuring sanitation in healthcare facilities for patients, staff and carers.
Setting goals for health-protective sanitation based on global research and practice
The SDG 6 Global Acceleration Framework44, coordinated by UN-Water, has identified five accelerators to support the achievement of SDG 6:• Governance: Make SDG 6
everyone’s business through cross-sector and transboundary collaboration, clear roles, stakeholder involvement and effective and inclusive institutions.
• Financing: Optimize financing for water and sanitation, particularly for countries and communities with limited access to financial resources.
• Data and information: Build trust through data generation, validation, standardization and information exchange for decision-making and accountability.
• Capacity development: Focus on inclusive human and institutional capacities at all levels to deliver SDG 6.
• Innovation: Leverage and scale up innovative practices and technologies, including technologies that are accessible for rural areas and marginalized communities.
The accelerators provide a valuable framework for achieving accelerated progress on sanitation. There are promising examples of where investing in these five accelerators has been effective. For instance, the Government of Ethiopia has worked to take leadership of the sanitation sector, coordinate development partners, and streamline funding for the sector (see Box 10).
BOX 10In 2013, the Government of Ethiopia adopted the One WASH National Programme, a sector wide approach aimed at streamlining Ethiopia’s WASH programming to achieve universal access to WASH. The programme’s catchphrase ‘One Plan. One Budget. One Report.’ sums up its philosophy, detailed further in the guiding principles:• Integration of the water, health, education
and finance sectors, with the aim of creating synergy among the sectors through coordination and collaborative planning, implementation, monitoring and reporting.
• Alignment of partners’ activities with government systems, policies and priorities, ensuring that WASH is placed among the broader development programme.
• Harmonization aimed at moving away from discrete project-oriented endeavours to programmatic approaches to ultimately achieve one plan, one budget and one report in providing WASH services.
• Solidifying partnerships with development agencies and expanding partnerships to include more private sector actors and civil society organizations.
Increased sectoral integration is achieved through three programme pillars: • Creating an enabling environment and good
governance; • Maximizing availability and efficient use of
human and financial resources to create demand for better WASH services; and
• Capacity development for improved delivery of WASH services at all levels.
The Government of Ethiopia financed 47 per cent of phase 1 of the programme, with the remainder coming via a pooled fund of financing for WASH. This pooled fund is managed by the government, which contributes 10 per cent of all pooled finances. The government also provides matching funding of 20 to 30 per cent of donor contributions. Many stakeholders and development partners needed to completely reframe their ways of operating to respond to this dramatic shift in the role of government. There have also been challenges in implementation and coordination, but there has been significant progress. An acceleration in sanitation coverage has been achieved as a consequence of increased prioritization for the WASH sector, better sector coordination, avoiding duplication of efforts, stimulating donor interests to finance the sector, introducing key policies and strategies, and improving capacities. According to JMP data, between 2010 and 2017 the proportion of the population practising open defecation decreased from 44 per cent to 22 per cent, making Ethiopia the country with the fastest reduction of open defecation globally.
Strengthening government leadership for sanitation in Ethiopia
Sour
ce: O
ne W
ASH
Nat
iona
l Pro
gram
- A
Mul
ti-Se
ctor
al S
WAP
, Rev
iew
of P
hase
1, 2
018

66 S TAT E O F S A N I TAT I O N R E P O R T 67
6Governments can accelerate sanitation progress with proven, effective approaches 6.1 Good governance begins with leadership, effective coordination and regulation
6.2 Smart public finance unlocks effective household and private investment
6.3 Capacity at all levels drives progress and sustains services
6.4 Reliable data support better decision-making and stronger accountability
6.5 Innovation leads to better approaches and meets emerging challenges
This chapter outlines how strategic actions and investments in governance, financing, data, capacity development and innovation can help governments make rapid progress towards achieving universal access to safe sanitation.
National and local government can drive the uptake of new approaches to both rural and urban sanitation programmes, which must be backed with adequate human and financial resources. They must be inclusive, mobilize participation from across society, and be scalable. Governments can also nurture a learning culture, where monitoring and reviews lead to adaptation and innovation to reach those being left behind, respond more effectively to public health crises and increase climate resilience. Scaling up successful sanitation models also requires strengthened coordination
among the (often fragmented) government ministries, departments and agencies responsible for sanitation delivery as well as the private sector, civil society and households.
The choice of implementation approaches should be based on research and lessons learned from previous sanitation programmes, and should be determined by context, including the level of capacity and resources needed to support them. Where communities are remote and markets are weak, the sanitation implementation strategy is likely to be more community-based. Conversely, where markets are stronger, and sanitation access and expectations are higher, the strategy may promote more market-based solutions and embrace systems with higher management requirements.
© S
anita
tion
& W
ater
for A
ll
© U
NIC
EF/U
NI9
0586
/d'E
lbee

68 S TAT E O F T H E WO R L D ' S S A N I TAT I O N A C A L L T O T R A N S F O R M S A N I TAT I O N F O R B E T T E R H E A LT H , E N V I R O N M E N T S , E C O N O M I E S A N D S O C I E T I E S 69
BOX 11
BOX 12
Indonesia made significant improvements in sanitation, reducing open defecation from over 19 per cent in 2011 to less than 8 per cent in 2019 and achieving gains in extending basic sanitation services. This was achieved through a concerted effort by the Government of Indonesia to support the sanitation sector at all levels, with a focus on sub-national peer-to-peer learning. An alliance of former mayors and district heads provided leadership, mobilizing their peers across the country to share lessons on WASH. With support from a range of development partners, this initiative has been successful at inspiring local leaders and mobilizing communities.
Many lessons were learned on the most effective ways to address sanitation issues, including the need for:• Continuous and more systematic advocacy
and capacity building for local governments;• Stronger coordination between institutions in
the sanitation sector;
• A consolidated district sanitation strategy to enable multiple programmes to work toward a common objective and leverage earmarked national funds for sanitation;
• Innovative funding mechanisms, such as the use of Islamic alms funding (zakat, infak, shadaqah and wakaf, referred to as ZISWAF), micro-credit to reach the poorest households, output-based grants to support communal level investments, and provincial and national-level funds to support larger scale systemic investments in infrastructure; and
• Leveraging of non-traditional partners – such as faith-based organizations and the private sector –to mainstream behaviours and practises and ensure long-term sustainability.
The government has integrated these lessons into the new Medium-term National Development Policy for 2020 to 2024 to support targets on open defecation and safely managed sanitation.
In the 1960s and 1970s, during their formative stages as nation states, Malaysia, the Republic of Korea, Singapore and Thailand produced rapid and remarkable results in delivering total sanitation coverage.45 Under strong government leadership, publicly subsidized sanitation infrastructure was developed in parallel to changes to public health and hygiene policies. In each country, improvements in sanitation came as part of wider public health, housing and hygiene programmes, rather than being pursued as a stand-alone goal.
Robust leadership played a vital role in delivering dramatic progress in sanitation. First, leaders built a clear and compelling case for sanitation and changed hygiene behaviours by drawing on nationally or culturally significant symbols and motivations. In Singapore, sanitation and hygienic practices were tied to notions of modernity and integration with global markets. In Thailand, where a focus on sanitation was established at the highest level of government through the King of Thailand, and was reflected at all levels, from the central government to village or district officials, sanitation subsequently benefited from 40 years of sustained public intervention. In the Republic of Korea, sanitation was central to the government’s public health planning and promotion of the idea of communities and country ‘living well’.
Second, leaders at all levels encouraged local innovation and adaptation so that trial and error, or ‘adaptive management’ practices, led to solutions to address local problems and contexts.
Lastly, leaders built coordination bodies at all levels that were tasked with ‘breaking bottlenecks’. These bodies met regularly to identify barriers to progress and to propose local solutions. If the obstacles required higher-level action, they were passed up the decision-making chain for leaders to resolve, based on recommendations and lessons learned from the ground. At the outset of their national sanitation sector planning stages in the 1960s, the per capita income levels in the East Asian states studied were equivalent to that of many sub-Saharan African countries. This is significant because it suggests that the overall strategy and vision came first, and the sector investments from a variety of sources were sought subsequently.
The lesson from these East Asian ‘tigers’ is that success is possible if leaders make it clear to the public and to bureaucrats that sanitation is central to national development efforts, and are actively engaged with learning, problem resolution, ‘progress-chasing’ and building a culture of regular course correction.
Support to all levels of government in Indonesia
Transformative leadership for sanitation successes in East Asia
Sour
ce: G
over
nmen
t of I
ndon
esia
SU
SEN
AS
Sour
ce: W
ater
Aid
Good governance begins with leadership, effective coordination and regulation
6.1
Good governance begins with leadership that prioritizes and champions sanitation. Experience shows this can be from a head of state, minister or another senior political figure ready to assume the challenge of driving progress. Local leadership is equally important. States, districts or villages
must also have a clear vision, roadmap and targets endorsed, promoted and followed up on by a prominent champion. Such a champion can be critical in catalysing public participation towards collectively delivering a shared vision of improving sanitation.
Sanitation needs to be defined as an essential service for which government is responsible and can be held accountable. Governments must establish institutions to coordinate and regulate the activities of government, service providers and service users, and generate public benefits. Sanitation service provision, including through the private sector and informal provision, should be supported through a legislative framework and policies, accompanied by standards for service quality throughout
the sanitation chain (sewered and non-sewered) and a simple, transparent, effective regulatory and enforcement environment allowing innovation, cost recovery and provision for serving the poor and vulnerable. The inclusion of sanitation in national policies, strategies and plans can serve as a concrete indicator of the political will and priority given to sanitation. The higher the profile of sanitation in national development plans, the more likely the issue is to be prioritized by decision makers and politicians.

70 S TAT E O F T H E WO R L D ' S S A N I TAT I O N A C A L L T O T R A N S F O R M S A N I TAT I O N F O R B E T T E R H E A LT H , E N V I R O N M E N T S , E C O N O M I E S A N D S O C I E T I E S 71
BOX 13The African Ministers’ Council on Water (AMCOW) was formed in 2002 to promote cooperation on water and sanitation. AMCOW has since become a specialized committee for water and sanitation within the African Union. In response to demand from African governments, AMCOW is coordinating the development of the African Sanitation Policy Guidelines. These guidelines will enable governments to develop policies specifically related to sanitation, with the objective of accelerating progress on sanitation
coverage and improving service quality. The guidelines encourage the development of stand-alone sanitation policy, and provide background information, advice on the process, recommended contents of a policy, and guidance for developing an implementation strategy. The guidelines are designed for use at national level, but are also applicable to local governments. The overarching theme is government leadership, responsibility and initiative.
Supporting policy development through the African Sanitation Policy Guidelines
Sanitation policies can only be successful when complemented by implementation plans that have been costed and backed by sufficient human and financial resources. Lead institutions need to develop multi-sectoral sanitation policies that use inter-sectoral coordination mechanisms and planning processes. Plans should be based on a review of existing policies to identify impediments to improving sanitation along the whole service chain and in all settings, including linkages with related sectors, such as
agriculture and urban planning. Effective plans must have time-bound targets and goals, adequate budget allocation and monitoring frameworks, including both outcomes and outputs (e.g. focus on open defecation free communities rather than just toilet coverage). Development partners must align their programmes to national strategies and priorities. Regular, coordinated, national or multi-sectoral reviews of sanitation policies, plans and progress have been effective in strengthening planning and governance.46
BOX 14Since the 1950s, Nepal has produced five-year national development plans that establish socio-economic objectives. The Fifteenth Periodic Plan (2019/2020–2024/2025) outlines key strategies to achieve middle-income country status for Nepal. The plan includes WASH objectives, focussing on improving public health by ensuring accessibility of reliable, affordable and safe drinking-water and sanitation facilities for all in urban, peri-urban and rural areas. It also includes maintaining a clean environment by proper management
of wastewater. The target is for 100 per cent of the population to have access to improved sanitation facilities, achieve and maintain the open defecation free status of the country, and to work progressively towards total sanitation, with at least 20 per cent of wastewater treated and properly discharged. Total sanitation in Nepal includes the basic requirement of having access to a toilet, as well as additional considerations, such as handwashing, safe drinking-water, safe food and an overall clean environment in the community.
Strengthened sanitation policy and planning for rapid progress in Nepal
Sour
ce: W
HO
(201
9). N
epal
San
itatio
n Po
licy
and
Plan
ning
Fra
mew
ork
Cas
e St
udy
for D
iscu
ssio
n.
Government decision makers should recognize that safe sanitation systems need to be delivered through a mix of technologies, implemented through service models tailored to the local context and based on sound risk assessments. Strategies and plans should explicitly recognize the utility of both sewered and non-sewered sanitation (including decentralized systems) and appreciate the importance of building and supporting the entire sanitation chains of both. The role of informal sanitation service providers should be acknowledged, recognizing that their experience is a valuable resource that should be utilized within the formal system.
Service quality must be regulated at all steps in the sanitation service chain, based on public health risk assessment and management. Government policy must enable and encourage more private sector producers, suppliers and services to increase competition, lower costs, increase innovation and allow the availability of a diverse range of products in the marketplace.
Clearly defined leads and institutional arrangements for sanitation across the sanitation service chain have enabled success in many countries. National
and local governments need to establish clear roles, responsibilities and mandates for all steps in the sanitation service chain to address both overlaps and gaps in organizational mandates. For instance, some countries, including Bangladesh and Nepal, have developed institutional and regulatory frameworks specifically for faecal sludge management to better define roles and responsibilities.47 Governments must also improve cross-sector collaboration, and increase involvement of all stakeholders, including the private sector, users and civil society.
Sanitation must be recognized as a multi-sectoral issue that has impacts across health, social development, education and the economy. While lead institutions are important, governments must establish clear mandates, backed with capacity for sanitation delivery, in all sectors, including local government, education, housing, healthcare, labour and agriculture. It is particularly important to ensure the lead sector in sanitation has dedicated staffing and resourcing, and is involved in all aspects of planning, delivery, promotion and monitoring.
The sanitation workplace requires increased regulation and formalization. Many more sanitation workers are needed, yet sanitation workers, who are often poorly paid and
© U
NIC
EF/U
N03
4891
1/M
odol
a

72 S TAT E O F T H E WO R L D ' S S A N I TAT I O N A C A L L T O T R A N S F O R M S A N I TAT I O N F O R B E T T E R H E A LT H , E N V I R O N M E N T S , E C O N O M I E S A N D S O C I E T I E S 73
stigmatized, are repeatedly exposed to health risks. Their work may expose them to hazards such as pathogens in faecal sludge and wastewater, injury from collapsing pits, asphyxiation from gases in sewers and drug and alcohol abuse to cope with the dehumanizing conditions of the worst types of informal sanitation work. Working conditions need to be progressively formalized to safeguard health and safety, and to ensure decent working conditions, as called for by SDG 8.48 Workers’ rights must be protected, and they need freedom and support to organize as a labour force.
Through partnerships and platforms, governments can learn from one another and support each other towards greater political prioritization of sanitation and strengthening of governance systems. The Sanitation and Water for All multi-stakeholder partnership of governments, civil society, the private sector, UN agencies, and research institutions encourages partners to increase political prioritization of WASH; ensure adequate financing; and build better governance structures and institutions to achieve SDG 6.
Smart public finance unlocks effective household and private investment
6.2
In most countries, the investment needed to meet sanitation targets is considerable. It is households, not governments, that currently provide the largest proportion of funding for sanitation through connection tariffs, emptying service fees
and investment in toilets and on-site containment and treatment technologies. However, a reliance on household funding can exacerbate inequalities. Household funding also does not address the need for larger investments in the broader
© U
NIC
EF/C
hina
sanitation chain, including infrastructure for conveyance, treatment and disposal. These require coordinated government-led investment, including costed plans and dedicated budget lines. Clarifying which funding sources and financing instruments can be mobilized, as well as the role of each entity in funding sanitation investments, is critical if countries are to meet their aspirations in the most cost-effective and efficient manner.
Sanitation is a public good that delivers benefits for health as well as social and economic development, and warrants strategic, well-targeted public funding. The process by which developed countries achieved near-universal access to water and sanitation clearly demonstrates that domestic public finance, including targeted subsidies, has been and remains critically important, even in strongly market-led economies.49 Policies need to make explicit what is to be funded, when and how government funds will be used, and how funding is to be coordinated.
Investments in sanitation bring significant financial returns to households and society. A 2012 WHO study estimated that the economic benefits of sanitation are more than five times greater than the costs. A follow-up global study in 2018 showed an overall return on basic sanitation of just over five times in rural areas and a return of six times costs from eliminating open defecation. In urban areas, ratios were lower, at almost three times costs, as a result of the higher unit costs of sanitation interventions in urban areas.50
Studies showing the long-term benefits of sanitation can help galvanize political will and investment. Studies such as that undertaken by the World Bank in India in 2011, which showed that inadequate sanitation was costing the country billions of dollars,51 along with similar studies in Bangladesh52 and Pakistan53, have had a significant impact on government investment in the sector.54
In addition to sanitation systems and services, governments must also budget for the costs associated with a conducive enabling environment, sustained over the long term, particularly related to building and maintaining institutional and regulatory capacity.
There are multiple sources of funds for sanitation, including the ‘3Ts’: taxes disbursed via government budgets, transfers from external donors, and tariffs and user fees. Where large investments are required to develop sanitation services, and revenues from taxes and tariffs are insufficient to meet the initial investment costs, additional funds can be mobilized by governments and service providers via a range of financing instruments. These are used to borrow from donors or commercial banks, and the amounts borrowed are repaid in the future, usually with taxes or tariffs. Repayable finance can be coupled with specialist expertise through PPPs, in which a private company and a government entity work together to provide a public service. A common form of PPP in the sanitation sector is a concession contract for the operation and management of a faecal sludge treatment plant. Repayable finance can also be accessed, at small scale, by households or service providers through microfinance. Governments seeking to support private sector investment in sanitation must develop a robust regulatory environment, enabling the private sector to generate reliable and sufficient revenue streams to cover their investments and operations. Governments must also build capacity in commercial and financial management, and contract oversight.
Choosing the funding arrangements that work best requires understanding the costs of sanitation and the different funding sources and instruments available. If the full costs of sanitation cannot be funded, then governments will face a situation in which services cannot be extended to all, or cannot be sustained over time, or both.

74 S TAT E O F T H E WO R L D ' S S A N I TAT I O N A C A L L T O T R A N S F O R M S A N I TAT I O N F O R B E T T E R H E A LT H , E N V I R O N M E N T S , E C O N O M I E S A N D S O C I E T I E S 75
Good practice is to set tariffs that cover at least operating costs. However, subsidies may be needed to achieve universal coverage for vulnerable groups and to ensure that no one is left behind. Public funds can be used to cover the affordability gap between minimum sanitation service standards and users’ ability and willingness to pay. Subsidies can be effective if they are well-designed, transparent and targeted so that scarce public resources reach those most in need. Poorly designed subsidies, by contrast, can serve the rich rather than the poor, with the latter often paying more for services.
Governments must make evidence-based decisions on the allocation of funds and hold service providers accountable. Government financial tracking systems can be used to support decision-making by monitoring sanitation financial flows and expenditures.55 Establishing separate budget lines for sanitation is key, as is making clear budget allocations to fund sanitation programmes. Better coordination in budgeting between agencies with primary responsibility for different SDG targets (e.g. housing, urban development, health, education) can result in synergies and cost savings.
BOX 15During the 1990s, Durban was facing a sewage treatment capacity constraint. Existing infrastructure could not cope with the growing population and the economic development of the city, and significant investment was required. The municipality initiated a PPP agreement to recycle wastewater for industrial use. The goal of the project was to treat around 48 million litres per day (approximately 10 per cent of the city’s wastewater) and achieve an acceptable quality for safe use by two large industrial plants, a paper plant and an oil refinery, which were interested in using treated wastewater at half the cost of potable water.
Durban Water Recycling, a consortium led by Vivendi Water Systems (Veolia), was chosen through international bidding to finance, design, construct and operate the tertiary wastewater treatment plant at the city’s Southern Wastewater Treatment Works under a 20-year concession
contract (2001-2021). The total cost of the project (construction for the new tertiary plant, purchase and upgrade of the municipal utility assets used for the project and the required piping system) was financed by the private partner. The municipal utility remained in charge of the preliminary and primary wastewater treatment plant, but the consortium undertook the risk of meeting the water quality needs of the two industrial users. The high prevailing cost of water and the guaranteed demand for treated wastewater from the two industrial users made the project economically attractive and allowed the consortium to undertake the investment risk.
The project was the first of its type in South Africa and is an example of a win-win PPP that considers wastewater as an asset rather than a liability, reduces environmental impact and contributes to the circular economy.
Harnessing public private partnerships for sanitation: Safe wastewater use in Durban, South Africa
Sour
ce: W
orld
Ban
k, W
aste
wat
er: F
rom
Was
te to
Res
ourc
e, T
he C
ase
of D
urba
n, S
outh
Af
rica,
Wor
ld B
ank,
Was
hing
ton,
DC
, 201
8.
Capacity at all levels drives progress and sustains services
6.3
The low emphasis historically placed on sanitation has resulted in significant capacity shortfalls across all dimensions of the system. Investments made in institutions and infrastructure without addressing capacity needs will result in failing services and a waste of scarce funds. Capacity development and institutional strengthening are essential at all levels of government, communities and the private sector, and across sectors (WASH, health, education, finance) to plan, design, finance, build and sustain improved sanitation.
Capacity development is essential to build strong foundations for the effective
governance, financing, innovation and data management needed to reach and sustain sanitation targets. Capacity development is far more than just training. It encompasses:• Human resources development:
Ensuring that the institutions employ the right types and numbers of adequately qualified, trained and motivated personnel.
• Organizational development: Ensuring that the institutions are adequately empowered and use effective systems and procedures.
• Resourcing: Ensuring that the institutions have access to sufficient financial, material and technical resources.
© U
NIC
EF/U
NI6
2693
/Noo
rani
© U
NIC
EF/U
NI8
2512
/Maj
ola

76 S TAT E O F T H E WO R L D ' S S A N I TAT I O N A C A L L T O T R A N S F O R M S A N I TAT I O N F O R B E T T E R H E A LT H , E N V I R O N M E N T S , E C O N O M I E S A N D S O C I E T I E S 77
• Research and innovation: Undertaking applied research to develop better technical and managerial solutions for sanitation.
Sufficient numbers of adequately skilled and motivated government staff, at the highest levels, are essential. National governments need the capacity to develop and administer the fundamentals of effective and sustainable sanitation systems, including regulations for all steps of the sanitation chain, policies, time-bound strategies and costed plans, along with coordination mechanisms to ensure cross-sectoral integration and private sector involvement. A well-balanced gender, ethnic and cultural mix among sanitation personnel is important to enable a fully responsive relationship with users and provide equal opportunities for employment to all.
Local government must have adequate capacity to oversee and deliver service-oriented sanitation. The adoption of new approaches to sanitation, and an increasingly decentralized approach to delivery, requires adjusting the skills mix and level of resources for staff to effectively implement their mandate. A more service-oriented approach to sanitation – with a much higher degree of interaction with users, greatly increased activity with respect to non-sewered sanitation, and openness to market-based solutions – means that the organizational culture and mix of educational backgrounds in local government sanitation departments and utilities may need to change.
Appropriate skills need to be built among artisans and entrepreneurs working in the sanitation chain. With the increased need for private sector involvement in parts of the sanitation chain, there is an opportunity to grow the ‘sanitation economy’, which is a marketplace of products and services, renewable resource flows, data and information. The sanitation economy includes construction of individual and
shared toilets, maintenance, repair and cleaning, as well as the products derived from sanitation, such as water, fuel, proteins and organic fertilizers. The sanitation economy is estimated to represent a US$62 billion market opportunity in India alone by 2021.56
Growth of the private sector and the circular economy will require building skills in these areas, as well as for improved environmental management and climate change considerations, and the business opportunities that sanitation presents. The sanitation economy can only thrive with development of a supportive regulatory environment that encourages initiative.
Research and innovation must be scaled up to meet the challenges and opportunities of universal sanitation. There are a number of areas where the knowledge, skills and techniques needed to address challenges are lacking. Globally, conditions in large urban areas are changing quickly, small towns are growing rapidly, roads and telecommunications are opening up even the most remote areas, and the changing climate is creating new barriers to the provision and sustainability of sanitation systems. These new challenges and opportunities require research and capacity development in areas such as:• Management of non-sewered
sanitation;• Pit emptying and faecal sludge
processing technology (including a focus on safe valorization and use);
• Providing formal services to previously unserved communities;
• Developing appropriate climate-resilient sanitation technologies; and
• Developing effective behaviour change methodologies.
Effective integration and coordination of sectors addressing sanitation will require increased capacity. In many countries, there is a lack of coordination between sanitation and other sectors such as health, education, environment and water. For instance, sanitation is a major
determinant of health outcomes but there is often little involvement of various levels of the health sector in planning and financing sanitation promotion and implementation. Capacity must be strengthened through a number of strategic interventions, including:• Creating senior posts with dedicated
responsibility for sanitation and ensuring they are well resourced, trained and have adequate autonomy to make change.
• Building capacity of environmental health staff to fulfil health sector functions in the sanitation sector, such as incorporating sanitation into health programme delivery, promoting sanitation behaviour change, and ensuring adequate sanitation in healthcare facilities.
• Establishing sanitation oversight, monitoring and enforcement mechanisms, including routine monitoring of sanitation in schools and healthcare facilities.
Capacity development is a permanent activity. Sanitation requires a large number of personnel. With such a large workforce, there is a continuous need for capacity building at many levels. New staff posts are needed to work in traditionally neglected areas, such as non-sewered sanitation and hygiene promotion.
The principal focus of capacity development must be at the local level. This is the level at which services must be provided and problems solved in a continuous, adaptive process.
Capacity building for sanitation must be integrated into curricula. Because of the scale of the effort, it is imperative to include sanitation in the curricula of universities, vocational training schools and other specialized institutions, such as local government training schools.
Peer-to-peer learning and mentoring are very effective in sanitation. This must be explicitly recognized so that resources can be made available. For instance, government exchanges can be facilitated within or between countries to disseminate good practices and promote peer competition around the achievement of programme targets.
The private sector must be included in the capacity development effort. While the private sector has some ability to develop its own capacity (which it will eventually charge for indirectly), public sector investment in this area will yield faster and better results.
© U
NIC
EF/U
NI7
9278
/Pie
trasi
k

78 S TAT E O F T H E WO R L D ' S S A N I TAT I O N A C A L L T O T R A N S F O R M S A N I TAT I O N F O R B E T T E R H E A LT H , E N V I R O N M E N T S , E C O N O M I E S A N D S O C I E T I E S 79
BOX 16In Bolivia, on-site sanitation solutions are meeting the need in response to low access, rapid population growth and high investment costs for conventional sewers and wastewater treatment plants. Consequently, small- and medium-sized private vacuum truck companies have emerged to meet the demand to empty pits and septic tanks. In cities such as Santa Cruz, emptying companies have been operating for more than 30 years without any official control or regulation.
Despite the lack of regulation, there has been progress in protecting sanitation workers.
Solutions that are being implemented in Santa Cruz include:• The use of a toilet technology that limits
workers’ exposure to faecal matter; • The application of national occupational
health and safety standards for sanitation workers;
• The standardization of procedures for collection, transport, and discharge of household faecal sludge, focussed on industrial safety and environmental protection; and
• Training modules developed in partnership with universities.
Protecting sanitation worker health and safety in BoliviaSo
urce
: Wor
ld B
ank,
ILO
, Wat
erAi
d an
d W
HO
, Hea
lth,
Safe
ty a
nd D
igni
ty o
f San
itatio
n W
orke
rs: A
n In
itial
As
sess
men
t, W
orld
Ban
k, W
ashi
ngto
n, D
C, 2
019.
Reliable data support better decision-making and stronger accountability
6.4
High quality data allow governments to target investment, monitor progress and make timely course corrections. Governments need to fully harness the potential of data and evidence, and support the institutionalization of data collection and monitoring within national systems and at all levels(community, utilities, sub-national and national). Robust sanitation monitoring mechanisms at the lowest administrative level, using existing structures, need to be established and linked with existing reporting and accountability structures. Consistent methodology, including standardized terms and questions in data collection and monitoring, need to be used. Sanitation must be included within health surveillance systems to help target of high-burden settings, and to support outbreak prevention efforts. It is vital to build trust through data generation, validation, standardization and information exchange for decision-making and accountability.
Data can be paramount in developing political will and commitment. However, many countries lack the financial, institutional and human resources to acquire and analyse the data required for effective decision-making and governance.57 The establishment of simple, robust data collection systems, linked to accountability mechanisms, is important to inform political commitments and well-targeted investments.
Accurate and appropriate data allows for informed decision-making. Health sector surveillance and data
management, for example, is vital to inform and tailor sanitation investment based on health and sanitation coverage. Likewise, accurate and regular data collection will be essential to efforts to effectively target climate resilience responses.
Reliable, consistent and disaggregated data are essential to stimulate political commitment, inform policy-making and decision-making, and enable well-targeted investments that maximize health, environment and economic gains. Quality data can be used to inform more effective policies, targets, budget allocations and pro-poor strategies. Quality data is also important in measuring progress towards SDG targets and other goals, critical in all aspects of sector governance, and essential to ongoing efforts to improve accountability, transparency and participation.
The value of survey and census data can be increased by using harmonized questions that allow comparison with other surveys and enable tracking of national, regional and global indicators. Since 2006, the JMP has worked with statistical offices, international survey programmes and WASH experts to develop sets of harmonized core questions for monitoring WASH in households, schools and healthcare facilities. The quality and comparability of datasets has improved steadily.58, 59, 60
Official public data sources, including national accounts, censuses, surveys ©
UN
ICEF
/Jor
dan/
Sam
an

80 S TAT E O F T H E WO R L D ' S S A N I TAT I O N A C A L L T O T R A N S F O R M S A N I TAT I O N F O R B E T T E R H E A LT H , E N V I R O N M E N T S , E C O N O M I E S A N D S O C I E T I E S 81
of households and businesses, administrative records and regulatory data, are increasingly being complemented by new types of data from private sources, including mobile phones, electronic transactions and satellites. Developing country governments need to make use of both types of data. They should continue to invest in public sources, which provide reliable data covering the entire population that can be disaggregated for populations of interest, and also seek to harness data from other sources if these offer greater frequency, timeliness or granularity. In fact, new sources of data are essential, as information on safely managed sanitation cannot be collected from household surveys alone, and must be collected from service providers, such as utilities and private sanitation businesses, that maintain and empty septic tanks.
Surveys at country level reveal a consistent data gap in WASH financial data. In the 2018/2019 GLAAS survey cycle, less than half of countries were
able to provide data on government WASH expenditure. Many countries have expressed interest in obtaining better quality and more detailed information on WASH financial flows. The Trackfin initiative was developed to address this through a methodology for producing WASH accounts.
While many countries have data on the treatment of wastewater from sewers, relatively few have data on the collection, treatment and disposal of faecal sludge from on-site sanitation facilities such as septic tanks and latrines. There is also a lack of independent regulatory data – aggregated to national level – for all steps of the sanitation chain, especially for non-sewered services. Further work is required to integrate new questions on management of on-site sanitation into household surveys, to increase coverage of public health surveillance systems, including sanitary inspections, and to strengthen regulatory data systems on the collection, transport and treatment of waste from on-site facilities.
BOX 17Levels of basic sanitation services are generally high in Ecuador, but national data on the quality of these services have been scarce. The National Statistical Office collaborated with the World Bank Global Water Practice and the JMP to pilot a new module in a national household survey in 2016. Households were asked questions about sanitation that focussed on the management of on-site sanitation
facilities (septic tanks and latrines), asking where effluent from septic tanks is discharged and whether latrines and septic tanks have been emptied. The results allowed Ecuador to report on the current status of safely managed sanitation services nationally by combining information from the survey with data from municipalities on wastewater treatment and to drive action at the local level.61
Monitoring safely managed sanitation in Ecuador
BOX 18In Botswana, a policy gap analysis carried out through GLAAS highlighted that access to sanitation has lagged behind water supply. The response from the Ministry of Land Management, Water and Sanitation Services, with support from the United States Agency for International Development’s Resilient Waters Program, has been to develop a sanitation roadmap. In Namibia, gaps in sanitation
highlighted through GLAAS 2018/2019 data have resulted in a stronger and more inclusive process for developing Namibia’s new sanitation strategy, which will now reference the WHO Guidelines on Sanitation and Health, and include sanitation safety planning, financing mechanisms, faecal sludge management and the entire sanitation service chain, all of which were previously omitted.
Monitoring of policy identifies gaps in Botswana and Namibia
© U
NIC
EF/U
NI13
7336
/LeM
oyne
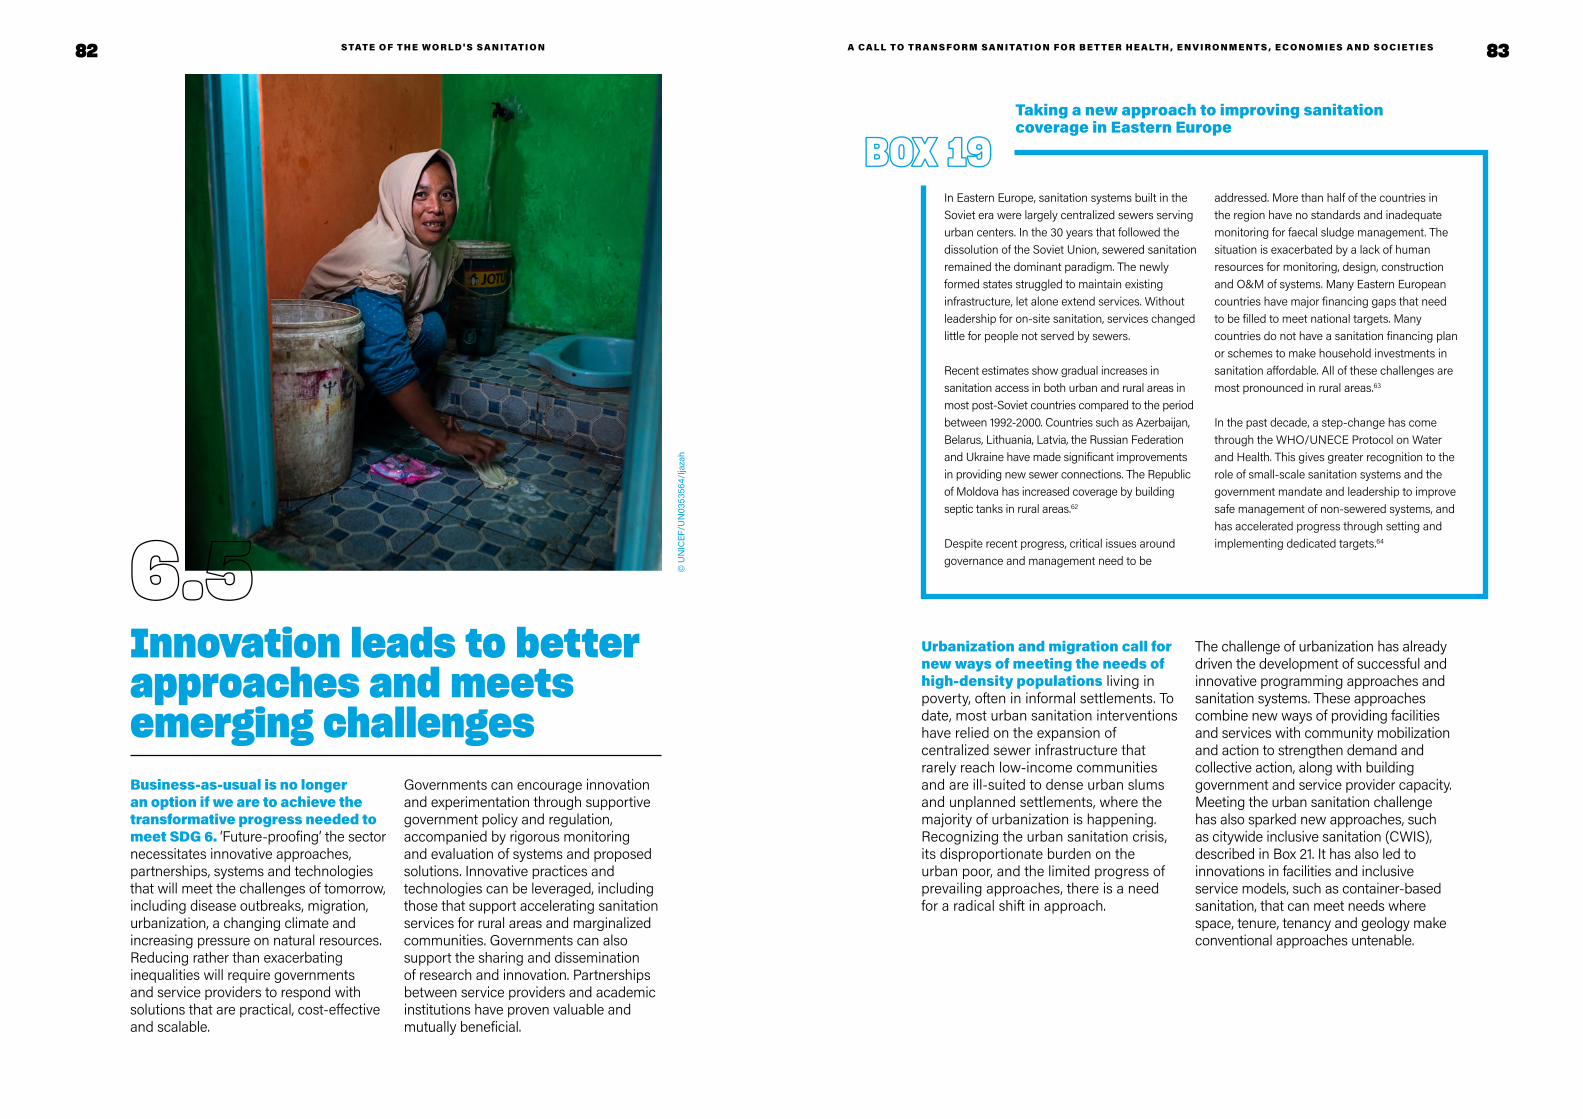
82 S TAT E O F T H E WO R L D ' S S A N I TAT I O N A C A L L T O T R A N S F O R M S A N I TAT I O N F O R B E T T E R H E A LT H , E N V I R O N M E N T S , E C O N O M I E S A N D S O C I E T I E S 83
Innovation leads to better approaches and meets emerging challenges
6.5
Business-as-usual is no longer an option if we are to achieve the transformative progress needed to meet SDG 6. ‘Future-proofing’ the sector necessitates innovative approaches, partnerships, systems and technologies that will meet the challenges of tomorrow, including disease outbreaks, migration, urbanization, a changing climate and increasing pressure on natural resources. Reducing rather than exacerbating inequalities will require governments and service providers to respond with solutions that are practical, cost-effective and scalable.
Governments can encourage innovation and experimentation through supportive government policy and regulation, accompanied by rigorous monitoring and evaluation of systems and proposed solutions. Innovative practices and technologies can be leveraged, including those that support accelerating sanitation services for rural areas and marginalized communities. Governments can also support the sharing and dissemination of research and innovation. Partnerships between service providers and academic institutions have proven valuable and mutually beneficial.
© U
NIC
EF/U
N03
5356
4/Ija
zah
BOX 19In Eastern Europe, sanitation systems built in the Soviet era were largely centralized sewers serving urban centers. In the 30 years that followed the dissolution of the Soviet Union, sewered sanitation remained the dominant paradigm. The newly formed states struggled to maintain existing infrastructure, let alone extend services. Without leadership for on-site sanitation, services changed little for people not served by sewers.
Recent estimates show gradual increases in sanitation access in both urban and rural areas in most post-Soviet countries compared to the period between 1992-2000. Countries such as Azerbaijan, Belarus, Lithuania, Latvia, the Russian Federation and Ukraine have made significant improvements in providing new sewer connections. The Republic of Moldova has increased coverage by building septic tanks in rural areas.62
Despite recent progress, critical issues around governance and management need to be
addressed. More than half of the countries in the region have no standards and inadequate monitoring for faecal sludge management. The situation is exacerbated by a lack of human resources for monitoring, design, construction and O&M of systems. Many Eastern European countries have major financing gaps that need to be filled to meet national targets. Many countries do not have a sanitation financing plan or schemes to make household investments in sanitation affordable. All of these challenges are most pronounced in rural areas.63
In the past decade, a step-change has come through the WHO/UNECE Protocol on Water and Health. This gives greater recognition to the role of small-scale sanitation systems and the government mandate and leadership to improve safe management of non-sewered systems, and has accelerated progress through setting and implementing dedicated targets.64
Taking a new approach to improving sanitation coverage in Eastern Europe
Urbanization and migration call for new ways of meeting the needs of high-density populations living in poverty, often in informal settlements. To date, most urban sanitation interventions have relied on the expansion of centralized sewer infrastructure that rarely reach low-income communities and are ill-suited to dense urban slums and unplanned settlements, where the majority of urbanization is happening. Recognizing the urban sanitation crisis, its disproportionate burden on the urban poor, and the limited progress of prevailing approaches, there is a need for a radical shift in approach.
The challenge of urbanization has already driven the development of successful and innovative programming approaches and sanitation systems. These approaches combine new ways of providing facilities and services with community mobilization and action to strengthen demand and collective action, along with building government and service provider capacity. Meeting the urban sanitation challenge has also sparked new approaches, such as citywide inclusive sanitation (CWIS), described in Box 21. It has also led to innovations in facilities and inclusive service models, such as container-based sanitation, that can meet needs where space, tenure, tenancy and geology make conventional approaches untenable.
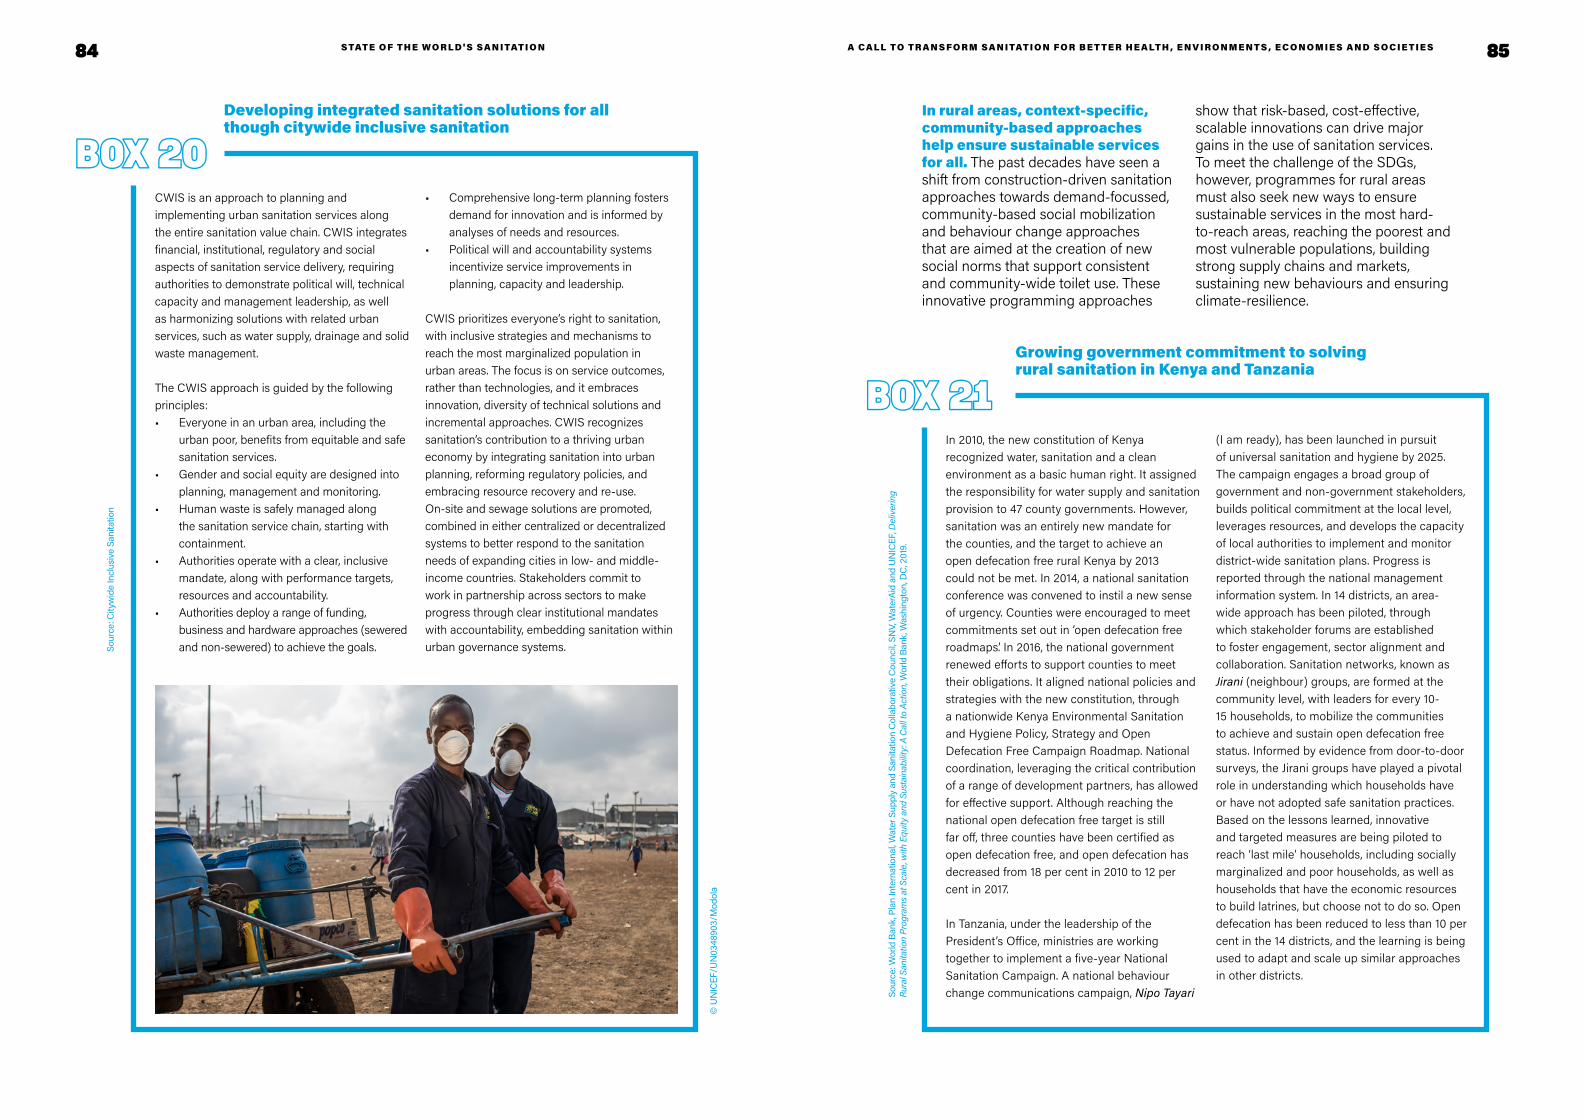
84 S TAT E O F T H E WO R L D ' S S A N I TAT I O N A C A L L T O T R A N S F O R M S A N I TAT I O N F O R B E T T E R H E A LT H , E N V I R O N M E N T S , E C O N O M I E S A N D S O C I E T I E S 85
BOX 20CWIS is an approach to planning and implementing urban sanitation services along the entire sanitation value chain. CWIS integrates financial, institutional, regulatory and social aspects of sanitation service delivery, requiring authorities to demonstrate political will, technical capacity and management leadership, as well as harmonizing solutions with related urban services, such as water supply, drainage and solid waste management.
The CWIS approach is guided by the following principles:• Everyone in an urban area, including the
urban poor, benefits from equitable and safe sanitation services.
• Gender and social equity are designed into planning, management and monitoring.
• Human waste is safely managed along the sanitation service chain, starting with containment.
• Authorities operate with a clear, inclusive mandate, along with performance targets, resources and accountability.
• Authorities deploy a range of funding, business and hardware approaches (sewered and non-sewered) to achieve the goals.
• Comprehensive long-term planning fosters demand for innovation and is informed by analyses of needs and resources.
• Political will and accountability systems incentivize service improvements in planning, capacity and leadership.
CWIS prioritizes everyone’s right to sanitation, with inclusive strategies and mechanisms to reach the most marginalized population in urban areas. The focus is on service outcomes, rather than technologies, and it embraces innovation, diversity of technical solutions and incremental approaches. CWIS recognizes sanitation’s contribution to a thriving urban economy by integrating sanitation into urban planning, reforming regulatory policies, and embracing resource recovery and re-use. On-site and sewage solutions are promoted, combined in either centralized or decentralized systems to better respond to the sanitation needs of expanding cities in low- and middle-income countries. Stakeholders commit to work in partnership across sectors to make progress through clear institutional mandates with accountability, embedding sanitation within urban governance systems.
Developing integrated sanitation solutions for all though citywide inclusive sanitation
Sour
ce: C
ityw
ide
Incl
usiv
e Sa
nita
tion
BOX 21In 2010, the new constitution of Kenya recognized water, sanitation and a clean environment as a basic human right. It assigned the responsibility for water supply and sanitation provision to 47 county governments. However, sanitation was an entirely new mandate for the counties, and the target to achieve an open defecation free rural Kenya by 2013 could not be met. In 2014, a national sanitation conference was convened to instil a new sense of urgency. Counties were encouraged to meet commitments set out in ‘open defecation free roadmaps’. In 2016, the national government renewed efforts to support counties to meet their obligations. It aligned national policies and strategies with the new constitution, through a nationwide Kenya Environmental Sanitation and Hygiene Policy, Strategy and Open Defecation Free Campaign Roadmap. National coordination, leveraging the critical contribution of a range of development partners, has allowed for effective support. Although reaching the national open defecation free target is still far off, three counties have been certified as open defecation free, and open defecation has decreased from 18 per cent in 2010 to 12 per cent in 2017.
In Tanzania, under the leadership of the President’s Office, ministries are working together to implement a five-year National Sanitation Campaign. A national behaviour change communications campaign, Nipo Tayari
(I am ready), has been launched in pursuit of universal sanitation and hygiene by 2025. The campaign engages a broad group of government and non-government stakeholders, builds political commitment at the local level, leverages resources, and develops the capacity of local authorities to implement and monitor district-wide sanitation plans. Progress is reported through the national management information system. In 14 districts, an area-wide approach has been piloted, through which stakeholder forums are established to foster engagement, sector alignment and collaboration. Sanitation networks, known as Jirani (neighbour) groups, are formed at the community level, with leaders for every 10-15 households, to mobilize the communities to achieve and sustain open defecation free status. Informed by evidence from door-to-door surveys, the Jirani groups have played a pivotal role in understanding which households have or have not adopted safe sanitation practices. Based on the lessons learned, innovative and targeted measures are being piloted to reach ‘last mile’ households, including socially marginalized and poor households, as well as households that have the economic resources to build latrines, but choose not to do so. Open defecation has been reduced to less than 10 per cent in the 14 districts, and the learning is being used to adapt and scale up similar approaches in other districts.
Growing government commitment to solving rural sanitation in Kenya and Tanzania
In rural areas, context-specific, community-based approaches help ensure sustainable services for all. The past decades have seen a shift from construction-driven sanitation approaches towards demand-focussed, community-based social mobilization and behaviour change approaches that are aimed at the creation of new social norms that support consistent and community-wide toilet use. These innovative programming approaches
show that risk-based, cost-effective, scalable innovations can drive major gains in the use of sanitation services. To meet the challenge of the SDGs, however, programmes for rural areas must also seek new ways to ensure sustainable services in the most hard-to-reach areas, reaching the poorest and most vulnerable populations, building strong supply chains and markets, sustaining new behaviours and ensuring climate-resilience.
Sour
ce: W
orld
Ban
k, P
lan
Inte
rnat
iona
l, Wat
er S
uppl
y an
d Sa
nita
tion
Col
labo
rativ
e C
ounc
il, SN
V, W
ater
Aid
and
UN
ICEF
, Del
iver
ing
Rura
l San
itatio
n Pr
ogra
ms
at S
cale
, with
Equ
ity a
nd S
usta
inab
ility:
A C
all t
o Ac
tion,
Wor
ld B
ank,
Was
hing
ton,
DC
, 201
9.
© U
NIC
EF/U
N03
4890
3/M
odol
a

86 S TAT E O F T H E WO R L D ' S S A N I TAT I O N A C A L L T O T R A N S F O R M S A N I TAT I O N F O R B E T T E R H E A LT H , E N V I R O N M E N T S , E C O N O M I E S A N D S O C I E T I E S 87
The challenges of climate change and mounting resource pressure call for innovative ways of delivering services that will be resilient and enable resource-recovery. Climate variability and change will increase the strain on sanitation systems, and therefore must be considered to ensure sanitation technologies and services are designed, operated and managed in a way that minimizes risks to human and environmental health. Well-designed sanitation services in turn increase community resilience to climate change through continuity of services that contain waste after extreme events. While human excreta is a globally significant source of greenhouse gas emissions, there is considerable potential to capture emissions and recover water, nutrients and energy from sludge and wastewater. Their safe use in energy generation, and as inputs to agricultural processes, help mitigate the effects of drought, reduce reliance on chemical fertilizers and strengthen food systems.
Governments must think beyond conventional sewage systems, which are costly and time-consuming to install, and consider other options, such as decentralized, non-sewered sanitation systems. Innovations in sanitation technologies and systems can mitigate and adapt to the risks posed by climate change, urbanization and resource scarcity. The selection of sanitation technologies and systems is context-specific and depends on local technical, economic and social factors.
Governments should consider using a mix of sanitation services based on an assessment of local housing and sanitary conditions, prioritizing institutionally and financially feasible interventions that address the greatest identified public health risks in the shortest time. A combination of technologies for containment, conveyance, treatment and safe disposal or end use, that are linked and properly managed, can form a safe sanitation chain. Such systems can be safer, more resilient, more cost-effective, environmentally-friendly and provide beneficial inputs for other sectors, such as energy and agriculture.65 Other innovations, like container-based systems, can be deployed very quickly, and may be well suited to people in fragile or emergency contexts. Wastewater treatment systems can be decentralized, and the costs of construction and operation can be lowered by using less complex technologies. Governments can enable innovation through sound regulation, and by setting sanitation technology performance criteria and standards that reduce risk but are not overly prescriptive. This includes O&M criteria and incremental standards, if appropriate for specific settings. By setting standards for and regulating safe use of wastewater and sludge, governments can reduce waste and recover resources for agriculture. For example, decentralized wastewater treatment systems offer an opportunity for local water reuse, such as for crop irrigation or fish production.
BOX 22Due to water scarcity, Jordan is a pioneer in practicing planned use of wastewater and sludge in agriculture. Since 1977, the Jordanian government has officially promoted agricultural use of wastewater and coordinated policy, implementation and monitoring between stakeholders in the sanitation and agricultural sectors to ensure safety.
Approximately 93 per cent of treated wastewater is used for irrigation in the country, of which 24 per cent is used directly.66 Direct use is regulated by contracts between farmers and the Ministry of Water and Irrigation. The contracts limit
farmers to cultivating fodder crops and trees, although regulations also allow irrigation of vegetables eaten cooked, cereals and industrial crops. The additional restriction exists primarily due to perceptions of health risks and limited monitoring capacities.
In 2014, the Jordanian authorities issued national guidelines and an implementation framework, adopting flexible health-based targets and applying risk assessment and management tools based on WHO guidelines to operational, legislative and institutional aspects along the sanitation chain.67
Making every drop count through safe use of wastewater in Jordan
Innovation extends to the protection of the sanitation workforce. Innovative technology and approaches can help to limit workers’ occupational exposure and provide a healthier workplace. Measures such as phasing out manual emptying, and replacing it with motorized systems, can improve worker health. Appropriate personal protective equipment, standard operating procedures and regular health checks can also improve worker health and
safety, at the same time as supporting continuity of services.
Effective sanitation programmes adapt and combine approaches and establish frequent feedback loops to course correct, using learning reviews and monitoring systems. Learning, adaptation and innovation require deliberate planning of time, capacity and resources, as well as the associated financing and reporting structures.
© U
NIC
EF/U
N03
4892
6/M
odol
a
© U
NIC
EF/U
N04
0195

88 89
Looking ahead: A pathway to 2030
The journey to 2030 offers key moments to strengthen government leadership, increase political prioritization, deepen partnerships and encourage strategic public investment for sanitation. These
moments present opportunities to share successes and learn from the experiences and innovations of others to collectively make universal access to safe sanitation a reality.
International High-Level Conference on International Decade for Action (2018-2028) in Dushanbe
United Nations Climate Change Conference
15-year anniversary of the recognition of the human rights to water and sanitation in 2025
UN Conference on the Midterm Review of the Water Action Decade on 22-24 March 2023
WHO World Health Assembly (annual)
In-depth review of SDG 6 during the High-level Political Forum
Sanitation and Water for All Finance Ministers’ Meetings (biennial)
Annual Moments convened to mark SDG 6 Global Acceleration Framework progress
High-level meeting convened by the President of the General Assembly to promote the implementation of the water-related goals and targets of the 2030 Agenda
2030
2020
S TAT E O F T H E WO R L D ' S S A N I TAT I O N A C A L L T O T R A N S F O R M S A N I TAT I O N F O R B E T T E R H E A LT H , E N V I R O N M E N T S , E C O N O M I E S A N D S O C I E T I E S
Africa Water Week
AMCOW Ministerial Meetings
Arab Water Week
Asia-Pacific Water Summit
Korea International Water Week
Singapore International Water Week
SIWI World Water Week
World Water Forum
International Water Association Congress
Regional sanitation conferences (LatinoSan, AfricaSan, SacoSan)

9190 S TAT E O F S A N I TAT I O N R E P O R T
EENDNOTES
S TAT E O F T H E WO R L D ' S S A N I TAT I O N
1 WHO, Global costs and benefits of drinking-water supply and sanitation interventions to reach MDG target and universal coverage, WHO, Geneva, 2012.
2 WHO and UN-Water, National Systems to Support Drinking-water, Sanitation and Hygiene: Global Status Report 2019 (GLAAS 2019 Report), WHO, Geneva, 2019.
3 WHO and UN-Water, National Systems to Support Drinking-water, Sanitation and Hygiene: Global Status Report 2019 (GLAAS 2019 Report), WHO, Geneva, 2019.
4 OECD, ‘Creditor Reporting System’, OECD, Paris, 2020, <https://stats.oecd.org/Index.aspx?DataSetCode=crs1>, accessed 28 August 2020.
5 Parikh, Priti, et al., ‘Synergies and Trade-offs between Sanitation and the Sustainable Development Goals’, 2020, ResearchGate: 10.14324/111.444/000054.v1.
6 WHO, Guidelines on Sanitation and Health, WHO, Geneva, 2018.
7 WHO, FAO and OIE, Technical Brief on Water, Sanitation, Hygiene and Wastewater Management to Prevent Infections and Reduce the Spread of Antimicrobial Resistance, WHO, Geneva, 2020.
8 Esteves Mills, Joanna and Oliver Cumming, ‘The Impact of Water, Sanitation and Hygiene on Key Health and Social Outcomes: Review of Evidence’, 2017, ResearchGate: 10.13140/RG.2.2.36572.49280.
9 Adapted from WHO, Safer Water, Better Health, WHO, Geneva, 2019.
10 WHO, Preventing diarrhoea through better water, sanitation and hygiene: exposures and impacts in low- and middle-income countries. WHO, Geneva, 2014.
11 WHO, Global costs and benefits of drinking-water supply and sanitation interventions to reach MDG target and universal coverage, WHO, Geneva, 2012.
12 Hutton, Guy, and Claire Chase, ‘The Knowledge Base for Achieving the Sustainable Development Goal Targets on Water Supply, Sanitation and Hygiene’, Int J Environ Res Public Health, 13(6), 2016.
13 Hutton, Guy, et al., ‘Comparison of the costs and benefits of the Clean India Mission’, World Development, 134: 105052, 2020.
14 UNICEF, National Economic and Financial Impact of the Swachh Bharat Mission, UNICEF, New York, 2020.
15 UNICEF, WaterAid and WSUP, Female-friendly public and community toilets: A guide for planners and decision makers, WaterAid, London, 2018.
16 UN-Water, Delivering the promise of safe water and sanitation for all by 2030: The SDG 6 Global Acceleration Framework. Geneva, 2020.
17 Andres, Luis A., et al., Doing More with Less: Smarter Subsidies for Water Supply and Sanitation, World Bank, Washington, DC, 2019.
18 Studies tend to report that between 25 per cent and 45 per cent of women in the study population have a type of urinary incontinence, while other studies have found that 1 per cent and 39 per cent of men (increasing with age) have urinary incontinence. Source: Rosato-Scott, C, Giles-Hansen, C, House, S et al., Guidance on supporting people with incontinence in humanitarian and low- and middle-income contexts (LMICs). Report. LMIC-Incontinence-email-group , University of Leeds, 2019.
19 White, S., et al., ‘A Qualitative Study of Barriers to Accessing Water, Sanitation and Hygiene for Disabled People in Malawi’, PLoS One, May 2016, 11(5):e0155043.
20 WaterAid, SHARE Consortium, Leonard Cheshire Disability and Inclusive Development Centre, Including disabled people in sanitation and hygiene services, WaterAid, London, 2011.
21 Wilbur, J., and H. Jones, ‘Disability: Making CLTS Fully Inclusive’, Frontiers of CLTS: Innovations and Insights, Issue 3, Brighton, 2014.
22 UNICEF and WHO, Progress on household drinking-water, sanitation and hygiene 2000-2017: Special focus on inequalities, UNICEF, New York, 2019.
23 Harris, M., et al., ‘Community-Level Sanitation Coverage More Strongly Associated with Child Growth and Household Drinking Water Quality than Access to a Private Toilet in Rural Mali’,

92 S TAT E O F T H E WO R L D ' S S A N I TAT I O N A C A L L T O T R A N S F O R M S A N I TAT I O N F O R B E T T E R H E A LT H , E N V I R O N M E N T S , E C O N O M I E S A N D S O C I E T I E S 93
Environmental Science & Technology, 51(12), 2017, pp. 7219–7227.
24 UNICEF, The Environmental Impact of the Swachh Bharat Mission on Water, Soil and Food, UNICEF, 2018.
25 UNICEF and WHO, Progress on household drinking-water, sanitation and hygiene 2000-2017: Special focus on inequalities, UNICEF, New York, 2019.
26 UNICEF and WHO, Progress on drinking water, sanitation and hygiene in schools: Special focus on COVID-19, UNICEF, New York, 2020.
27 WHO and UNICEF, WASH in health care facilities: Global Baseline Report 2019, WHO, Geneva, 2019.
28 The updated data are available on the JMP website <washdata.org/data/healthcare> and will be published as part of a broader report on WASH in health care facilities later in 2020.
29 UNHCR, Global Trends: Forced Displacement in 2019, UNHCR, Geneva, 2020.
30 UNHCR, WASH monitoring website, <wash.unhcr.org>, 2 September 2020.
31 Canet Rossello, J., ‘Analysis of global refugee settlement density vs UNHCR standard., PhD Dissertation for Polytechnical University of Madrid, 2020.
32 UNHCR internal analyses, September 2020.
33 UNHCR, Global Trends: Forced Displacement in 2018, UNHCR, Geneva, 2020.
34 OCHA, Whole of Afghanistan: Multi-Sector Needs Assessments, OCHA, 2018.
35 UNICEF and WHO, Progress on household drinking water, sanitation and hygiene 2000-2017, UNICEF, New York, 2019.
36 WHO and UN-Water, National Systems to Support Drinking-water, Sanitation and Hygiene:Global Status Report 2019 (GLAAS 2019 Report), WHO, Geneva, 2019.
37 Countries participating in the GLAAS 2018/2019 cycle with open defecation rates above 2 per cent.
38 Hutton, G., and M. Varughese, ‘The Costs of Meeting the 2030 Sustainable Development Goal Targets on Drinking Water, Sanitation, and Hygiene’, World Bank Water and Sanitation Program Technical Paper 10371, 2016.
39 Hutton, G., and M. Varughese, Global and Regional Costs of Achieving Universal Access to Sanitation to Meet SDG Target 6.2, UNICEF, New York, 2020.
40 The 18 countries able to report data were: Albania, Bangladesh, Bhutan, Brazil, Burkina Faso, Colombia, Costa Rica, Hungary, Iran, Kenya, Madagascar, Nepal, Netherlands, Senegal, Serbia, Solomon Islands, South Africa and Tunisia.
41 WHO and UN-Water GLAAS 2018/2019 country survey.
42 WHO and UN-Water GLAAS 2016/2017 and 2018/2019 country surveys.
43 WHO, Thirteenth General Programme of Work 2019−2023, WHO, Geneva, 2018.
44 UN-Water, Delivering the promise of safe water and sanitation for all by 2030: The SDG 6 Global Acceleration Framework. Geneva, 2020.
45 Northover, Henry, Kue Ryu, Shin, and Timothy Brewer, Achieving total sanitation and hygiene coverage within a generation: Lessons from East Asia, WaterAid, 2016.
46 The Policy Monitoring and Assessment Tool (PMAT) developed by WHO through the GLAAS initiative is a tool that governments and development partners can use to monitor and assess the content of policies, plans and strategies governing sanitation.
47 Examples of this are the “Institutional and Regulatory Framework for FSM in Urban Areas of Nepal“ and Bangladesh’s “Institutional and Regulatory Framework for Faecal Sludge Management”.
48 World Bank, ILO, WaterAid and WHO, Health, Safety and Dignity of Sanitation Workers: An Initial Assessment, World Bank, Washington, DC, 2019.
49 Fonseca, C., and L. Pories, ‘Financing WASH: How to Increase Funds for the Sector while Reducing Inequalities’, Position paper for the
Sanitation and Water for All Finance Ministers Meeting, Briefing Note, The Hague, Netherlands, IRC, 2017.
50 Hutton G., Benefits and costs of the water, sanitation and hygiene targets for the post-2015 development agenda. Chapter 23 in “Prioritizing Development”, Edited by Bjorn Lomborg. Cambridge University Press, 2018.
51 World Bank, The Economic Impacts of Inadequate Sanitation in India, World Bank, Washington, DC, 2011.
52 DeFrancis, Marc P. Economic Impacts of Inadequate Sanitation in Bangladesh. Water and Sanitation Program;. World Bank, Washington, DC., 2012.
53 World Bank, Economic Impacts of Inadequate Sanitation in Pakistan. Water and sanitation program working paper; WSP. Economics of Sanitation Initiative. Washington, DC., 2013.
54 Brocklehurst, Clarissa, Mead, Simon, and Joep Verhagen, Documentation of WSP’s Engagement in the Rural Sanitation Sector in South Asia – Regional Synthesis Report, World Bank, Washington, DC, 2016.
55 TrackFin is a methodology to identify and track financing to the WASH sector at the national or sub-national level in a consistent and comparable manner. TrackFin produces WASH accounts that can be used for national benchmarking, cross-country comparisons and to provide an evidence base to better plan and finance WASH services and systems. To learn more about TrackFin or express interest in producing WASH accounts, please contact [email protected].
56 Toilet Board Coalition, The Sanitation Economy in India: Market Insights and Estimates, 2017.
57 WHO and UN-Water, National Systems to Support Drinking-water, Sanitation and Hygiene: Global Status Report 2019 (GLAAS 2019 Report), WHO, Geneva, 2019.
58 WHO and UNICEF, Core questions and indicators for monitoring WASH in health care facilities in the Sustainable Development Goals, WHO, Geneva, 2018.
59 UNICEF and WHO, Core questions and indicators for monitoring WASH in schools in the Sustainable Development Goals, UNICEF and WHO, New York, 2016.
60 WHO and UNICEF, Core questions and indicators for monitoring WASH in health care facilities in the Sustainable Development Goals, WHO, Geneva, 2018.
61 United Nations, Sustainable Development Goal 6 Synthesis Report 2018 on Water and Sanitation, United Nations, New York, 2018.
62 UNICEF and WHO, Progress on household drinking-water, sanitation and hygiene 2000-2017: Special focus on inequalities, UNICEF, New York, 2019.
63 WHO and UN-Water, National Systems to Support Drinking-water, Sanitation and Hygiene: Global Status Report 2019 (GLAAS 2019 Report), WHO, Geneva, 2019.64 United Nations, Protocol on Water and Health to the 1992 Convention on the Protection and Use of Transboundary Watercourses and International Lakes, United Nations, 1999
65 WHO, Sanitation Safety Planning: Manual for safe use and disposal of wastewater, greywater and excreta, WHO Geneva, 2015
66 Ministry of Water and Irrigation, Jordan.
67 WHO, Guideline on Safe Use of Wastewater, Excreta and Greywater in Agriculture and Aquaculture, Volumes 3 & 4, WHO, Geneva, 2006.

94 S TAT E O F S A N I TAT I O N R E P O R T
ISBN: 978-92-806-5187-4
Programme Division/WASH 3 United Nations Plaza New York, NY 10017 USA www.unicef.org/wash