State of the UK Barn Owl Population – 2017 · State of the UK Barn Owl population – 2017 3...
22
State of the UK Barn Owl population – 2017 ‘Generally a good year, except on some isles and peninsulas’ Results from 38 independent groups collated by the Barn Owl Trust Conserving the Barn Owl and its Environment Photo: Craig Jones
Transcript of State of the UK Barn Owl Population – 2017 · State of the UK Barn Owl population – 2017 3...

1State of the UK Barn Owl population – 2017
State of the UK Barn Owl population – 2017‘Generally a good year, except on some isles and peninsulas’Results from 38 independent groups collated by the Barn Owl Trust
Conserving the Barn Owl and its EnvironmentPhoto: Craig Jones

2State of the UK Barn Owl population – 2017
State of the UK Barn Owl population - 2017
Barn Owl TrustBisham Barn Owl GroupBrandon Ringing GroupBroxton Barn Owl GroupBucks Owl Raptor GroupCam Valley Wildlife GroupEast Cheshire Barn Owl GroupEast Riding Barn Owl Conservation GroupEssex Wildlife TrustGarry SteeleGil GaylorGlamorgan Barn Owl GroupGloucestershire Barn Owl Monitoring ProgrammeJersey Barn Owl Conservation Lewis Raptor & Owl GroupManchester Raptor GroupMerseyside Ringing GroupMid Cheshire Barn Owl Conservation GroupNorth Cheshire Barn Owl Group
North-east Cheshire Barn Owl GroupNorth West Norfolk Ringing GroupPhilip Hanmer - Nat. Hist. Soc. of Northumbria Hancock Mus. R.G.Powys Species Habitat Protection GroupScottish Raptor Study GroupShropshire Barn Owl GroupSouth Cheshire Barn Owl GroupSouth Warwickshire Barn Owl SurveyStaffordshire Barn Owl Action GroupStour Valley Wildlife Action GroupSuffolk Community Barn Owl ProjectSussex Ornithological Society - Barrie WatsonSussex Ornithological Society - Graham RobertsThornham Owl ProjectUlster WildlifeWest Berkshire Countryside Society Barn Owl GroupWest Cornwall Ringing GroupWirral Barn Owl TrustWolds Barn Owl Group
Contributing Groups
3State of the UK Barn Owl population – 2017
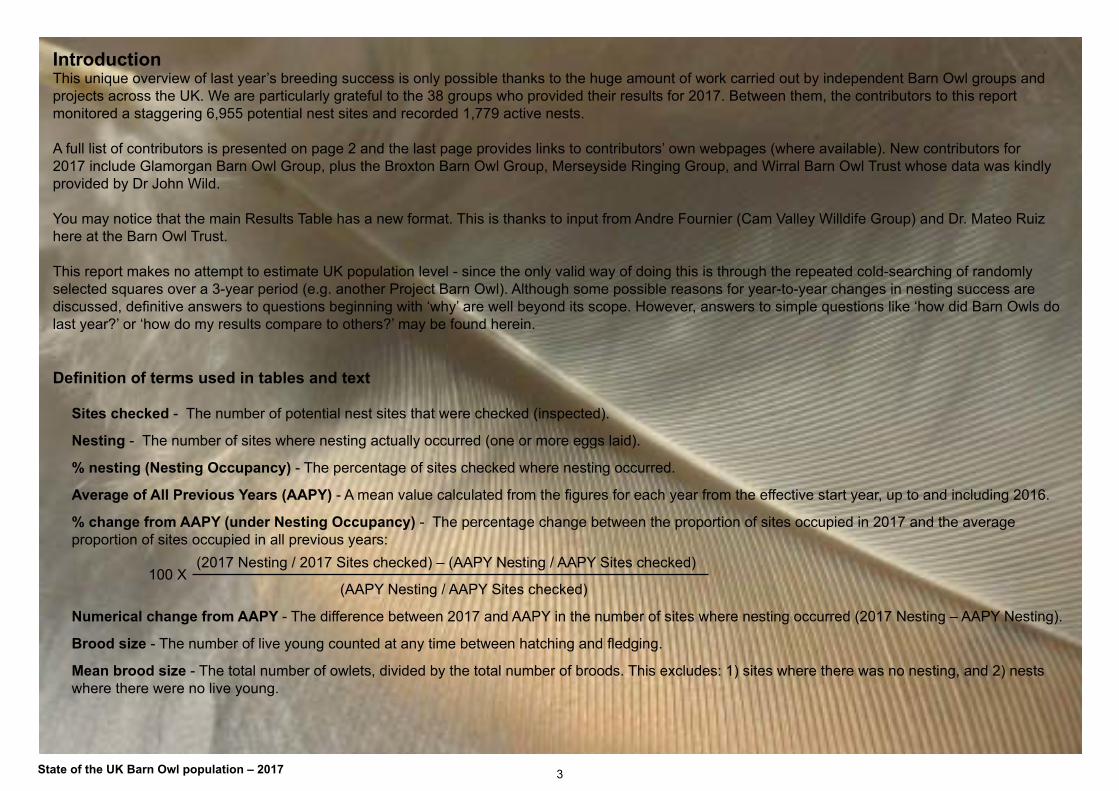
IntroductionThis unique overview of last year’s breeding success is only possible thanks to the huge amount of work carried out by independent Barn Owl groups and projects across the UK. We are particularly grateful to the 38 groups who provided their results for 2017. Between them, the contributors to this report monitored a staggering 6,955 potential nest sites and recorded 1,779 active nests.
A full list of contributors is presented on page 2 and the last page provides links to contributors’ own webpages (where available). New contributors for 2017 include Glamorgan Barn Owl Group, plus the Broxton Barn Owl Group, Merseyside Ringing Group, and Wirral Barn Owl Trust whose data was kindly provided by Dr John Wild.
You may notice that the main Results Table has a new format. This is thanks to input from Andre Fournier (Cam Valley Willdife Group) and Dr. Mateo Ruiz here at the Barn Owl Trust.
This report makes no attempt to estimate UK population level - since the only valid way of doing this is through the repeated cold-searching of randomly selected squares over a 3-year period (e.g. another Project Barn Owl). Although some possible reasons for year-to-year changes in nesting success are discussed, definitive answers to questions beginning with ‘why’ are well beyond its scope. However, answers to simple questions like ‘how did Barn Owls do last year?’ or ‘how do my results compare to others?’ may be found herein.
Definition of terms used in tables and text
Sites checked - The number of potential nest sites that were checked (inspected).
Nesting - The number of sites where nesting actually occurred (one or more eggs laid).
% nesting (Nesting Occupancy) - The percentage of sites checked where nesting occurred.
Average of All Previous Years (AAPY) - A mean value calculated from the figures for each year from the effective start year, up to and including 2016.
% change from AAPY (under Nesting Occupancy) - The percentage change between the proportion of sites occupied in 2017 and the average proportion of sites occupied in all previous years: (2017 Nesting / 2017 Sites checked) – (AAPY Nesting / AAPY Sites checked) 100 X (AAPY Nesting / AAPY Sites checked)
Numerical change from AAPY - The difference between 2017 and AAPY in the number of sites where nesting occurred (2017 Nesting – AAPY Nesting).
Brood size - The number of live young counted at any time between hatching and fledging.
Mean brood size - The total number of owlets, divided by the total number of broods. This excludes: 1) sites where there was no nesting, and 2) nests where there were no live young.

4State of the UK Barn Owl population – 2017
Definition of terms used - continued
% change from AAPY (under Mean Brood Size) - The percentage change in mean brood size between 2017 and the AAPY: 2017 mean brood size – AAPY mean brood size 100 X AAPY mean brood size
E - An estimate provided by a contributing group.
Please note that apparent discrepancies in calculations of change from AAPY are due to rounding table values to whole numbers.
*Unusual ExclusionsFor three contributors, all the figures used in the calculation of Nesting Occupancy % change from AAPY are excluded from the Summary row for the following reasons:
a) Wiltshire – Lewis Raptor & Owl Group. In 2017, 314 sites were checked as opposed to their usual c.620, and effort was concentrated on sites where there was a greater probability of finding breeding pairs. This rendered invalid any comparison between the nesting occupancy in 2017 and the average of all previous years.
b) Somerset NE - Cam Valley Wildlife Group. This project is carried out entirely within three 10 x 10 km squares. A large number of additional nest boxes were erected between the 2016 and 2017 monitoring seasons effectively saturating the 300 km2 with boxes. Such saturation reduced the probability of a corresponding increase in nesting occupancy. Therefore, the numerical change in occupancy (+6) is a more representative figure.
c) Yorkshire – In 2017 the Wolds Barn Owl Group checked only 21 sites, compared to the usual c.70. To some extent, effort was concentrated on the sites where there was a greater probability of finding breeding pairs. For this reason, we applied the same rationale as with Lewis Raptor & Owl Group (see above).
Perhaps the snow of winter 2017/18 will affect nesting occupancy in 2018
Photo: Ed MacKerrow

5State of the UK Barn Owl population – 2017
Caveats1. The figures provided in the table are accurate (unless marked ‘E’). However, these figures can only provide an indications of what happened to the population in that specific area.
2. For some individual groups, anomalies can arise with regard to year-to-year changes in numbers of ‘Sites checked’ as well as in the ‘Average of All Previous Years’. This is because the authors have not imposed criteria for the inclusion/exclusion of individual sites.
3. The proportion of nest sites that were monitored varies between counties and may sometimes vary between years.
4. The probability of individual sites being occupied varies tremendously. Some datasets include sites that may never have been occupied whilst others only include sites where pairs have nested previously.
5. The vast majority of sites were checked by inspection to confirm/discount breeding, and determine brood size. However, some groups accepted reports from trusted/knowledgeable site owners, particularly where nest cavities were inaccessible.
6. At most sites, only one nest inspection was carried out. Chicks may have died before this nest inspection or may die between inspection and fledging. Some sites were visited more than once and figures given for brood size may have been derived from either one of these visits.
7. The number of years over which the ‘Average of All Previous Years’ was calculated varies between groups
8. One or two individual years may be omitted from data sets due to restrictions on farm visits such as in 1996 due to BSE and 2001 due to Foot and Mouth Disease.
Photo: Paul Smith

6State of the UK Barn Owl population – 2017
NESTING OCCUPANCY MEAN BROOD SIZE
Seenotes
2017 Average of All Previous Years(AAPY)
% Change
from AAPY
Numericalchange
from AAPY
2017 AAPY
% Change
from AAPYCounty / Group Sites
checked Nesting % Nesting
Sites checked Nesting %
Nesting
Berkshire - West Berkshire CountrysideSociety Barn Owl Group 188 40 21 126 22 17 22 18 2.9 3.0 -6 1
Berkshire (N) & Buckinghamshire (S) -
Bisham Barn Owl Group123 28 23 115 20 17 34 9 2.8 2.8 -1 2
Buckinghamshire - Bucks Owl Raptor Group 270 47 17 202 23 11 53 24 2.8 2.7 6 3
Cheshire Barn Owl Groups 1764 196 11 1270 121 10 16 75 2.5 2.8 -11 4
Cornwall – West Cornwall Ringing Group 64 36 56 39 28 72 -22 8 3.0 3.1 -2
Devon & Cornwall (E) - Barn Owl Trust 71 34 48 79 35 44 9 -1 3.2 2.9 13
Essex Barn Owl Conservation Project 183 40 22 119 21 18 24 19 2.7 2.6 3 5
Galloway (W) - Scottish Raptor Study Group 62 42 68 74 65 87 -22 -23 3.1 3.3 -7 6
Glamorgan Barn Owl Group 37 13 35 52 26 50 -30 -13 3.3 3.2 3 7
Gloucestershire Barn Owl Monitoring Programme 125 30 24 51 9 18 32 21 2.8 2.4 18 8
Table 1. RELATIVE CHANGE IN NESTING OCCUPANCY AND BROOD SIZE
7State of the UK Barn Owl population – 2017
NESTING OCCUPANCY MEAN BROOD SIZE
See notes
2017 Average of All Previous Years(AAPY) %
Change from AAPY
Numerical change
from AAPY
2017 AAPY% change
from AAPY
County / Group Sites checked Nesting %
NestingSites
checked Nesting % Nesting
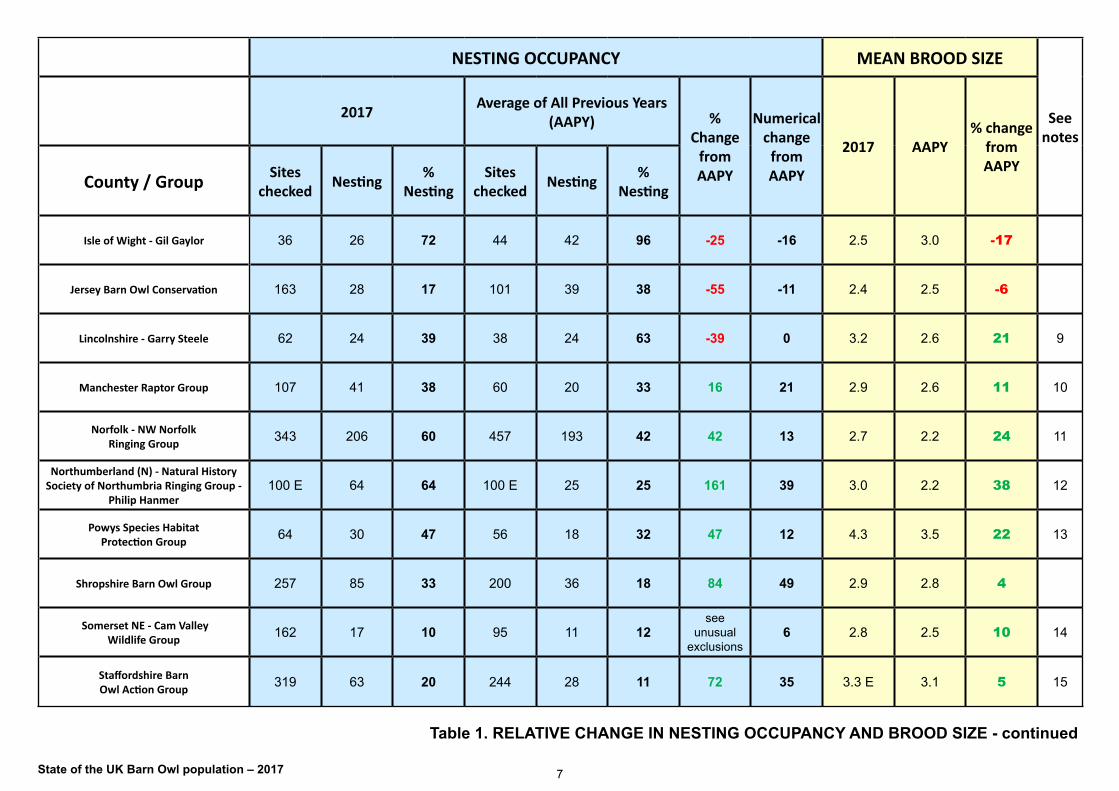
Isle of Wight - Gil Gaylor 36 26 72 44 42 96 -25 -16 2.5 3.0 -17
Jersey Barn Owl Conservation 163 28 17 101 39 38 -55 -11 2.4 2.5 -6
Lincolnshire - Garry Steele 62 24 39 38 24 63 -39 0 3.2 2.6 21 9
Manchester Raptor Group 107 41 38 60 20 33 16 21 2.9 2.6 11 10
Norfolk - NW Norfolk Ringing Group 343 206 60 457 193 42 42 13 2.7 2.2 24 11
Northumberland (N) - Natural History Society of Northumbria Ringing Group -
Philip Hanmer100 E 64 64 100 E 25 25 161 39 3.0 2.2 38 12
Powys Species Habitat Protection Group 64 30 47 56 18 32 47 12 4.3 3.5 22 13
Shropshire Barn Owl Group 257 85 33 200 36 18 84 49 2.9 2.8 4
Somerset NE - Cam Valley Wildlife Group 162 17 10 95 11 12
see unusual
exclusions6 2.8 2.5 10 14
Staffordshire Barn Owl Action Group 319 63 20 244 28 11 72 35 3.3 E 3.1 5 15
Table 1. RELATIVE CHANGE IN NESTING OCCUPANCY AND BROOD SIZE - continued

8State of the UK Barn Owl population – 2017
NESTING OCCUPANCY MEAN BROOD SIZE
See notes2017 Average of All Previous Years
(AAPY)%
Change from AAPY
Numerical change
from AAPY
2017 AAPY% change
from AAPYCounty / Group Sites
checked Nesting % Nesting
Sites checked Nesting %
NestingSuffolk Community Barn Owl Project
Thornham Owl Project, Suffolk Owl Sanctuary & others
1402 366 26 1223 212 17 51 154 2.8 2.0 37 23
Sussex - Barrie Watson 108 62 57 125 57 45 27 5 3.1 3.1 3 16
Sussex (W) - Graham Roberts 28 12 43 32 E 12 38 14 0 2.8 2.9 -3 17
Ulster Wildlife 109 3 3 84 3 4 -23 0 2.3 1.3 73 18
Warwickshire - Stour Valley Wildlife Action Group/
S War. Barn Owl Survey/ Brandon Ringing Group
420 129 31 242 42 17 77 87 2.6 3.1 -14 19
Wiltshire - Lewis Raptor & Owl Group 314 E 149 47 620 126 20
see unusual
exclusions23 2.5 2.1 19 20
Yorkshire - East Riding Barn Owl Conservation Group 550 E 134 24 580 E 134 23 5 0 2.7 3.0 -10 21
Yorkshire – Wolds Barn Owl Group 21 E 8 38 70 E 22 31
see unusual
exclusions-14 2.6 2.7 -4 22
Summary
Grand total
Grand total
% Nesting
Grand total
Grand total
% Nesting
% Change
Numerical change Mean Mean %
Change
6955 E 1779 26 5713 E 1253 22 17 526 2.9 E 2.7 6.6
Table 1. RELATIVE CHANGE IN NESTING OCCUPANCY AND BROOD SIZE - continued

9State of the UK Barn Owl population – 2017
Year Nesting Occupancy Mean Brood Size2013 Down by 70% Down by 12%2014 Up by 16% Up by 36%2015 Down by 26% Down by 16%2016 Down by 6% Down by 7%2017 Up by 17% Up by 7%
Table 2. State of the UK Barn Owl Population results 2013-17Variation in nesting occupancy and mean brood size, relative to the average of all previous years.
.
General Summary The data received from 38 monitoring schemes shows that the number of nesting pairs in the UK in 2017 was 17% above the average of all previous years (2013 - 2016) and the average number of young in the nest was 6.6% above. With a few exceptions, 2017 was a good year for Barn Owls although not a ‘bumper year’ (like 2014).
Across most of England and into mid Wales Barn Owls had a generally good to very good year. However, Barn Owls had a relatively poor year in West Galloway, West Cornwall, and the Isle of Wight. Those on Jersey experienced a very poor year and in Northern Ireland Barn Owls are still very scarce.
Barn Owls are very scarce in Northern Ireland Photo: Courtesy of Ulster Wildlife & @AntrimLens

10State of the UK Barn Owl population – 2017
Regional round up
The North – very mixed resultsIn Northern Ireland, Barn Owls are very rare indeed and one has to admire the sheer amount of effort that goes into their monitoring for so little return – Conor McKinney (Ulster Wildlife) was delighted to report three nests amongst the 109 sites checked by volunteers - a nesting occupancy rate of just 2.7%.
Just across the water in West Galloway, an impressive 68% of sites checked by Geoff Sheppard et al. (Scottish Raptor Study Group) had nesting although even this high occupancy rate was 22% lower than their average of all previous years (AAPY), mean brood size (3.1) was also below AAPY (-7%) yet still higher than the ‘UK’ (all contributors) average of 2.9. A little further east in Dumfries & Galloway mean brood size was much better at 3.74 (see Note 6).
Further east again, Barn Owls in Northumberland had an amazing year with nesting occupancy up by a staggering 161% and mean brood size 38% up – the highest values out of all the data contributors. Philip Hanmer reported “the most successful year since at least 2006”, first broods included a brood of seven, and eight second broods were ringed.
Sightings reported to Ulster Wildlife in 2017 Sites checked by Ulster Wildlife in 2017
11State of the UK Barn Owl population – 2017
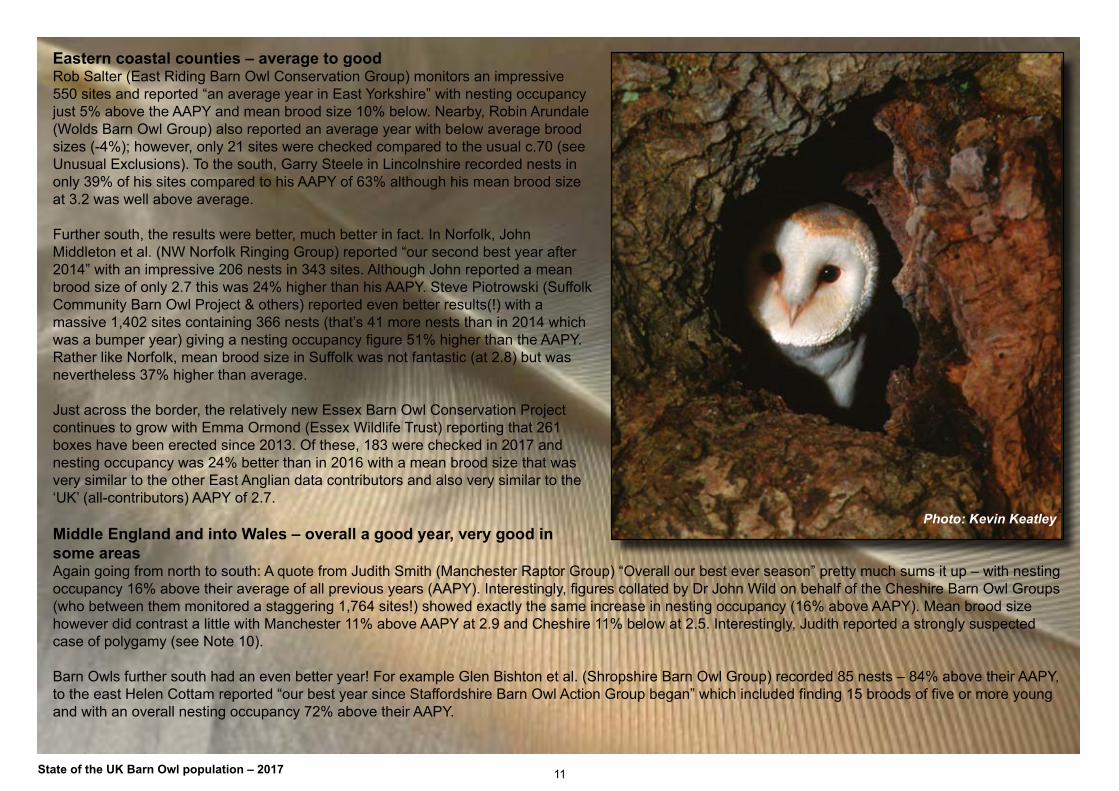
Eastern coastal counties – average to goodRob Salter (East Riding Barn Owl Conservation Group) monitors an impressive 550 sites and reported “an average year in East Yorkshire” with nesting occupancy just 5% above the AAPY and mean brood size 10% below. Nearby, Robin Arundale (Wolds Barn Owl Group) also reported an average year with below average brood sizes (-4%); however, only 21 sites were checked compared to the usual c.70 (see Unusual Exclusions). To the south, Garry Steele in Lincolnshire recorded nests in only 39% of his sites compared to his AAPY of 63% although his mean brood size at 3.2 was well above average.
Further south, the results were better, much better in fact. In Norfolk, John Middleton et al. (NW Norfolk Ringing Group) reported “our second best year after 2014” with an impressive 206 nests in 343 sites. Although John reported a mean brood size of only 2.7 this was 24% higher than his AAPY. Steve Piotrowski (Suffolk Community Barn Owl Project & others) reported even better results(!) with a massive 1,402 sites containing 366 nests (that’s 41 more nests than in 2014 which was a bumper year) giving a nesting occupancy figure 51% higher than the AAPY. Rather like Norfolk, mean brood size in Suffolk was not fantastic (at 2.8) but was nevertheless 37% higher than average.
Just across the border, the relatively new Essex Barn Owl Conservation Project continues to grow with Emma Ormond (Essex Wildlife Trust) reporting that 261 boxes have been erected since 2013. Of these, 183 were checked in 2017 and nesting occupancy was 24% better than in 2016 with a mean brood size that was very similar to the other East Anglian data contributors and also very similar to the ‘UK’ (all-contributors) AAPY of 2.7.
Middle England and into Wales – overall a good year, very good in some areasAgain going from north to south: A quote from Judith Smith (Manchester Raptor Group) “Overall our best ever season” pretty much sums it up – with nesting occupancy 16% above their average of all previous years (AAPY). Interestingly, figures collated by Dr John Wild on behalf of the Cheshire Barn Owl Groups (who between them monitored a staggering 1,764 sites!) showed exactly the same increase in nesting occupancy (16% above AAPY). Mean brood size however did contrast a little with Manchester 11% above AAPY at 2.9 and Cheshire 11% below at 2.5. Interestingly, Judith reported a strongly suspected case of polygamy (see Note 10).
Barn Owls further south had an even better year! For example Glen Bishton et al. (Shropshire Barn Owl Group) recorded 85 nests – 84% above their AAPY, to the east Helen Cottam reported “our best year since Staffordshire Barn Owl Action Group began” which included finding 15 broods of five or more young and with an overall nesting occupancy 72% above their AAPY.
Photo: Kevin Keatley
12State of the UK Barn Owl population – 2017
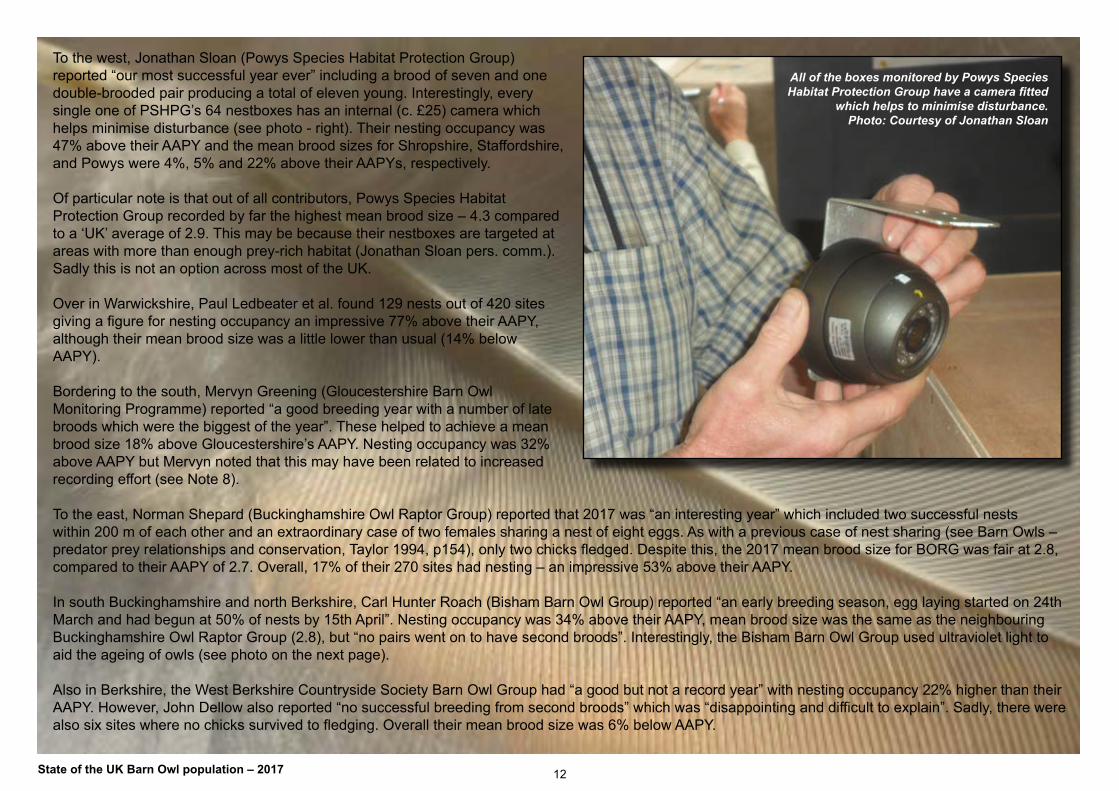
To the west, Jonathan Sloan (Powys Species Habitat Protection Group) reported “our most successful year ever” including a brood of seven and one double-brooded pair producing a total of eleven young. Interestingly, every single one of PSHPG’s 64 nestboxes has an internal (c. £25) camera which helps minimise disturbance (see photo - right). Their nesting occupancy was 47% above their AAPY and the mean brood sizes for Shropshire, Staffordshire, and Powys were 4%, 5% and 22% above their AAPYs, respectively.
Of particular note is that out of all contributors, Powys Species Habitat Protection Group recorded by far the highest mean brood size – 4.3 compared to a ‘UK’ average of 2.9. This may be because their nestboxes are targeted at areas with more than enough prey-rich habitat (Jonathan Sloan pers. comm.). Sadly this is not an option across most of the UK.
Over in Warwickshire, Paul Ledbeater et al. found 129 nests out of 420 sites giving a figure for nesting occupancy an impressive 77% above their AAPY, although their mean brood size was a little lower than usual (14% below AAPY).
Bordering to the south, Mervyn Greening (Gloucestershire Barn Owl Monitoring Programme) reported “a good breeding year with a number of late broods which were the biggest of the year”. These helped to achieve a mean brood size 18% above Gloucestershire’s AAPY. Nesting occupancy was 32% above AAPY but Mervyn noted that this may have been related to increased recording effort (see Note 8).
To the east, Norman Shepard (Buckinghamshire Owl Raptor Group) reported that 2017 was “an interesting year” which included two successful nests within 200 m of each other and an extraordinary case of two females sharing a nest of eight eggs. As with a previous case of nest sharing (see Barn Owls – predator prey relationships and conservation, Taylor 1994, p154), only two chicks fledged. Despite this, the 2017 mean brood size for BORG was fair at 2.8, compared to their AAPY of 2.7. Overall, 17% of their 270 sites had nesting – an impressive 53% above their AAPY.
In south Buckinghamshire and north Berkshire, Carl Hunter Roach (Bisham Barn Owl Group) reported “an early breeding season, egg laying started on 24th March and had begun at 50% of nests by 15th April”. Nesting occupancy was 34% above their AAPY, mean brood size was the same as the neighbouring Buckinghamshire Owl Raptor Group (2.8), but “no pairs went on to have second broods”. Interestingly, the Bisham Barn Owl Group used ultraviolet light to aid the ageing of owls (see photo on the next page).
Also in Berkshire, the West Berkshire Countryside Society Barn Owl Group had “a good but not a record year” with nesting occupancy 22% higher than their AAPY. However, John Dellow also reported “no successful breeding from second broods” which was “disappointing and difficult to explain”. Sadly, there were also six sites where no chicks survived to fledging. Overall their mean brood size was 6% below AAPY.
All of the boxes monitored by Powys Species Habitat Protection Group have a camera fitted
which helps to minimise disturbance. Photo: Courtesy of Jonathan Sloan

13State of the UK Barn Owl population – 2017
South Wales, Southern & SW England, IOW and Jersey – mixed results, some areas very poorIn Sussex, results provided by Graham Roberts and separately by Barrie Watson (both on behalf of Sussex Ornithological Society) showed nesting occupancy 14% up and 22% up respectively and mean brood sizes close to their respective AAPYs. These included “a brood of six ringed and three broods of five” reported by Barrie, and a nest on 10th of October that still contained “downy young” found by Graham.
For the second year in a row, the Wiltshire Lewis Raptor and Owl Group only checked about half of the sites they used to check up to 2015 (314 compared to c. 620) and once again tended to concentrate on more productive sites (see Unusual Exclusions). However, Major Nigel Lewis commented “in 2017 we had three times last year’s number of nests” and reported a mean brood size 19% above their AAPY. In neighbouring Somerset, Andre Fournier (Cam Valley Wildlife Group) commented that 2017 was the “3rd best year since our project began 20 years ago.” Please note that for this project, the numerical change in nesting occupancy (an increase of 6) is a more representative figure than the percentage change from AAPY (see Unusual Exclusions). Mean brood size was 10% above the Cam Valley AAPY.
In Glamorgan, new contributors to this report Guy Evans and Steve Thomas visited 37 sites, of which 13 were occupied (a nesting occupancy rate 30% below their AAPY) and commented that the Barn Owl population in their area is restricted by “intensive farming practices (too many sheep!) and a wet climate”. However, their 2017 average brood size at 3.3 is the joint second highest out of all of this year’s contributors, as well as being 7% above their AAPY.
Barn Owls in Devon and East Cornwall had a slightly above average year with nesting occupancy and mean brood size 9% and 13% up respectively. In contrast, figures from Mark Grantham (West Cornwall Ringing Group) revealed a relatively poor year with nesting occupancy 22% below AAPY and mean brood size just 2% below. Similarly, Barn Owls on the Isle of Wight monitored by Gil Gaylor had an unusually poor year with a 25% drop in nesting occupancy and smaller broods (17% below AAPY).
The worst results of the year, however, came from Jersey where Marc Peters et al. (Jersey Barn Owl Conservation) checked 163 sites and only found 28 nests - 55% below their AAPY and the most drastic negative change found this year. Mean brood size was also a little disappointing at 6% below AAPY.
Bisham Barn Owl Group - Ageing an owl using ultra violet light. The more recently grown feathers are a darker pink due to a greater quantity of porphyrin pigments Photo: Courtesy of Carl Hunter Roach

14State of the UK Barn Owl population – 2017
2017 Contributor’s notes/comments
1. Berkshire - West Berkshire Countryside Society Barn Owl Group – John DellowFor us 2017 was a good year but not a record year. All breeding was from first broods with no successful breeding from second broods. This was disappointing and difficult to explain. The number of active nest sites figure includes 6 sites which had at least one egg but did not have any chick surviving to fledge. We had 114 fledged chicks. For your “Brood size” statistic the number of chicks counted is number of birds believed to have fledged. Unhatched eggs and chick losses before fledging have not been counted. This is consistent with previous years. The brood size calculation is therefore 114/40 = 2.85.
2. Berkshire (N) and Buckinghamshire (S) - Bisham Barn Owl Group - Carl Hunter Roach2017 was an early breeding season in our area. Egg laying started on 24th March and had begun at 50% of nests by 15th April. No pairs went on to have second broods though. In 2017 we used ultraviolet (UV) light to aid the ageing of the owls. Newly grown feathers have a higher quantity of porphyrin pigments than older feathers because daylight degrades the pigment. UV causes the porphyrin pigments in recently grown feathers to fluoresce purple. In the photograph, the feathers which are the darkest pink are the youngest and were grown in 2017.
3. Buckinghamshire Owl Raptor Group – Norman Shepherd2017 was an interesting year with very similar results to 2016. However, we had 15 more nests that showed signs of occupation but no breeding occurred. We had 3 sites with 2 successful breeding pairs in the same field (within 200 metres) but the most amazing discovery was a box with 2 female barn owls sharing a nest of 8 eggs. They sat side by side, both with brood patches, but only reared 2 chicks.
4. Cheshire Barn Owl Groups - Dr John WildPlease note this data is from all Cheshire Barn Owl groups not just the ones previously reported by John Mycock.
5. Essex Barn Owl Conservation Project - Essex Wildlife Trust - Emma OrmondIn five years the Essex Barn Owl Conservation Project has grown from strength to strength; we now have 164 landowners who have provided their land as sites for nest boxes, businesses who have generously donated materials and support and 52 dedicated volunteers who help with all elements of the project. 261 nest boxes have been installed since 2013. Although the project is in its infancy in statistical terms, we are beginning to observe trends. One of particular interest is that occupancy by Barn Owls has so far remained constant at 21-22% as the project continues to expand yet overall occupancy (covering all species including Kestrel, Little Owl and Tawny Owl) fluctuates between 56% and 65%.
As well as 164 landowners and managers supporting the project by providing sites for nestboxes, we are fortunate to have the support of fifty-two volunteers who build and monitor them. Basildon Timber, Flight Timber Structures, Kent Blaxill and Travis Perkins continue to donate materials whilst Maestro Tree Services and Eastern Counties Pest Control kindly donate significant time to supporting the installation of nest boxes.
[Eds. Being a relatively new project, AAPY values are not yet available for Essex. Therefore the 2017 figures are compared to 2016 alone]

15State of the UK Barn Owl population – 2017
6. Galloway (W) - Scottish Raptor Study Group - Geoff & Jean SheppardVole numbers had increased in West Galloway by the spring, with breeding commencing early producing some large clutches. The earliest brood sizes were also generally good but as the season progressed, this decreased with later broods of 1 or 2 often being present at ringing. Unusually, ringing of pulli was almost completed by the end of June with a single late pullus being ringed in early November (the female had bred successfully in a different site earlier).
In other areas of Dumfries & Galloway, a further 222 sites were checked. Eggs were laid at 88 sites giving a nesting occupancy of almost 40%. 85 of the sites produced a total of 344 young (inc. 7 second broods) giving a mean brood size of 3.74 (344 young divided by 92 broods).
7. Glamorgan Barn Owl Group - Guy Evans & Steve ThomasA slight improvement in brood size but intensive farming practices (too many sheep!) and a wet climate in our area continue to restrict population growth.
8. Gloucestershire Barn Owl Monitoring Programme - Mervyn GreeningA good breeding year in Gloucestershire with a number of late broods which were the biggest broods of the year. Recording effort has increased and more nesting birds are being found, so this does not necessarily mean that it was either above or below average. We have yet to establish what an “average” year looks like.
9. Lincolnshire – Gary SteeleAt one site the land owner chooses to supplementary feed. This undoubtedly had a bearing in the resident pair of Barn Owls successfully raising 2 broods of four (first brood), and seven (second brood) owlets. Brood 1 were all ringed on 16 May 2017 - with the oldest chick estimated to be 44 days in age after hatching on this date, meaning the first egg would have been laid at the beginning of March 2018. The following brood of 7 owlets was only the second ever time this number of young have been ringed at one of my monitoring sites - although at the original one no supplementary feeding was being carried out. The same box which had the second brood of 7 owlets was the only one of my sites in 2017 where a second breeding attempt took place from the selection of sites (all with relatively early first breeding dates) that were re-checked.[Eds. The above site was subsequently excluded from calculation of Mean Brood Size]
In the early autumn period of 2017, four fledged young from various of my sites were subsequently found dead by members of the public. This may have been partly the result of the often inclement weather conditions which occurred in Lincolnshire during late summer 2017 - with juveniles potentially experiencing tricky conditions for hunting at a time when they were still fine-tuning their foraging skills.
Geoff and Jean Sheppard and helpers hard at work in West Galloway
Photo: Courtesy of Geoff Sheppard
16State of the UK Barn Owl population – 2017
10. Manchester Raptor Group - Judith SmithBrood size in several cases is unknown but known to have bred; Eg. a quarry where adults taking in food (no access), a site checked too late where one fledged youngster present, probably were more, sites found too late or inaccessible where definitely at least 1 young. All these have been counted as 1 young. So underestimate.[Eds. The probable underestimation of brood size at a small proportion of the 41 nests recorded is not considered significant, but thank you for the comment]
Polygyny strongly suspected at 2 sites only 200m apart, with male favouring 1 of the broods. Possible at another about 300m apart. There were 4 sites where breeding has resumed after several years’ absence. At one site the eggs were abandoned and as we know there was a road casualty nearby we think the female was killed.Largest brood was 6, 11 broods had 3 and 11 broods had 4. I have not counted young which died or disappeared prior to ringing. Overall our best ever season (but we are expanding all the time with the number of nestboxes).Compared with Cheshire, where only about 10% of boxes are occupied compared with our 40%, I think it is because the great majority of our boxes are inside barns. We don’t go in for tree boxes (which I understand Cheshire do) as they get squirrelled, or taken by other species. Pole boxes are out in this urban area.
11. Norfolk - North West Norfolk Ringing Group – John MiddletonOur second best year after 2014.
12. Northumberland (N) - Natural History Society of Northumbria (Hancock Museum) Ringing Group - Phil HanmerOur study (of around 100 sites) indicates that this was the most successful year since at least 2006 for Barn Owls and that the climate (or in simple terms the weather) was the predominate determining factor in this outcome.
Consequent on the good weather many birds started nesting early and we were ringing owlets in May (not normal until June or July). The number of breeding owls was high with 64 breeding attempts, 58 successful nests, and 196 owlets being ringed. Some of the early nesting owls were able to raise a second brood and 8 (all but one in the southern half of the coastal strip) had young that were ringed in September and October. Six broods failed but two of these were replaced successfully; with new eggs laid in July & August. Average brood size was 3.0, the average number of owlets fledged was only 2.8 (not substantially higher than in other years), but there were eight notably larger broods which may indicate a particular high ‘local’ density of small mammal prey. The largest individual brood encountered (of 7 owlets) was especially noteworthy as it included a bird which showed the beautiful genetic traits of a dark or buff coloured owl from the eastern side of Europe. Seventeen new adult Barn Owls were ringed and 34 were re-trapped; including one female which is 8 yrs old; and another 3 adults which are 6yrs old.
13. Powys Species Habitat Protection Group - Jon Sloan2017 has proved to be our most successful year ever with the highest total of active sites since we started recording, with 1 pair producing 7 chicks (a first for our group), and 1 brood of 5 fledging at the end of May with a 2nd brood of 6 fledging in September (11 in total, another 1st for the group). All this contributing to our highest mean brood size on record & also out of 64 sites checked, 30 of them producing chicks = 46.8% success rate. All our sites now have cameras fitted in the nest boxes making it easier to monitor with the least disturbance.[Eds. In the calculation of AAPY nesting occupancy values, the sampling period used is 2014-16 (rather than 2006-16) as these years are more representative.]

17State of the UK Barn Owl population – 2017
14. Cam Valley Wildlife Group - Andre FournierThe 3rd best year since our project began 20 years ago. Over the 20 years there has been a four-fold increase in number of breeding pairs found. A single nest inspection is used to count chicks which we try to time when they are likely to be about 6 weeks old.
15. Staffordshire Barn Owl Action Group - Helen CottamWe have had a really good year for barn owls here in Staffordshire, 2017 has been our best year for breeding pairs since Staffordshire BOAG began monitoring. We have put this down to several factors. Firstly, numbers of pairs have remained at a constant and increasing for the last 3 years partly due to the relatively mild winters during this time. Furthermore, the increase of breeding pairs during 2016 and 2017 is likely due to vole numbers reaching a peak in their 4-year cycle providing an abundance of prey. This year we recorded 5 + young at 15 nest sites.
16. Sussex Ornithological Society - Barrie WatsonWe found one clutch of 6 eggs and at another site a brood of 6 young were ringed. Also 3 broods of five. We were unable to visit some areas in West Sussex which are usually checked, and in other parts of Sussex there were a few new sites visited.
17. Sussex (W) - Sussex Ornithological Society - Graham Roberts26 young were ringed from 9 broods. This comprised two broods of 4 young, four broods of 3 & three broods of 2 young (average 2.8 young). All were in nestboxes. A late nest (with downy young with developing wing feathers) was found on 10/10/17 in a natural hole in a tree.
18. Ulster Wildlife - Conor McKinneyIn many ways 2017 was a fruitful year with Barn Owl work with Ulster Wildlife, but working with this rare and elusive bird in Northern Ireland remains extremely challenging. We are delighted to report that the three previously known active nests sites all remained active in 2017. Nest box site in the Ards Peninsula fledged two birds, which were ringed for the third year in the row. Tree cavity nest site in South Down fledged three birds (compared to just one in 2016). Worryingly however, the male bird was found injured on a road nearby and was deemed unable to be released back to the wild, making the future of this nest site unknown. The final nest site in a building in Crumlin fledged two birds. The latter two were unfortunately inaccessible for ringing.
The geographical spread of sightings (with 111 recorded) seems to have followed the pattern of previous years (see map on page 10), County Down and the Lough Neagh remaining the hotspots for reports. Again, Barn Owls were very rarely recorded above 150m (see map on page 10).Thanks to our brilliant volunteers (of which c. 50 have been active this year), over 100 sites were surveyed for Barn Owl activity, with the increase of c.30 per cent (if top sightings (15) checked are included) in survey effort from 2016.Barn Owls on the Lough Neagh shore have provided us with interesting perspective on the Barn Owl diet in Northern Ireland. A Barn Owl was photographed hunting beetles in September by one of our volunteers and pellet dissection has revealed not only mice, but also rats and birds having been consumed.With the help of our amazing volunteers we’ll soon be delivering more conservation action for Barn Owls in Northern Ireland. Indeed, with a further 20 nest boxes erected around the 3 current nest sites, we are looking forward to monitoring in 2018 and continuing our work with this wonderful species.
19. Warwickshire - Stour Valley Wildlife Action Group/ South Warks BO survey / Brandon Ringing Group - Paul LeadbeaterThe increase in the number of breeding pairs (from 102 to 129) was mainly due to pairs breeding in new boxes erected since April 2016 and pairs breeding in old existing boxes erected by others but monitored by us for the first time.

18State of the UK Barn Owl population – 2017
20. Wiltshire - Lewis Raptor & Owl Group - Major Nigel LewisLast year (in 2016), breeding owls on the MoD Training Estate had their second worst year of the last 10 years, but in 2017 we have had three times last year’s number - the second highest in the last 10 years! It all depends on the ground mammal situation which fluctuates enormously. Barn Owls do not travel great distances, to go from one extreme to the other is not an increase in the population but, because the vole population is good, more of the resident owls are able to breed.
21. Yorkshire (E) East Riding Barn Owl Conservation Group - Robert SalterIt was an average year in East Yorkshire. I found it patchy when it came to breeding success. One huge area along the River Hull corridor only produced a brood of one. Usually it’s the most productive area. Elsewhere they faired ok. Just one second brood that I came across.
22. Yorkshire (E) Wolds Barn Owl Group - Robin Arundale5 Adults caught and ringed including one re-trap.
23. Suffolk. Thornham Owl Project – Roger BuxtonNest box checking commenced as normal in June but it was clearly evident early on by amount of debris in some boxes that in some cases pulli had already fledged. In hindsight this was due to the very warm spell in late March and some Barn Owls possibly took exception to the unusual conditions and commenced with early breeding, Others took a more conservative approach and started late when weather conditions deteriorated, pulli were consequently being ringed late September and well into October. Of the 188 Barn Owl project nest boxes, 54 were used by Barn Owls and a further 18 were used as roosts or young had already fledged. Other species using boxes were Kestrel (4), Stock Dove (50), Jackdaw (34), Hornets (2) and Squirrel (10). Another success story for 2017 was Kestrel, 88 pulli being ringed with an average brood size of 4.4.[Eds. Barn Owl data gathered by the Thornham Owl Project is within the data supplied by Suffolk Community Barn Owl Project]
Links to ten new films to help Barn Owl’sHow to create and manage Barn Owl foraging habitat (UK)How to choose the best Barn Owl nestbox designHow to build a Barn Owl nestbox for inside a buildingHow to erect a Barn Owl nestbox in a buildingHow to build a Barn Owl nestbox for a treeHow to choose the best tree for a Barn Owl nestboxHow to erect a Barn Owl nestbox in a treeHow to prevent owls from drowningHow to pick up and examine an injured owlHow to rehydrate and feed a starving owl From the Barn Owl Trust

19State of the UK Barn Owl population – 2017
Previous years: 1995 to 2016
1995-2009The only reliable estimate of Barn Owl numbers in the UK was c. 4,000 pairs in the period 1995-97 (Project Barn Owl Report, 2000) and there is some evidence that numbers increased in the period 1997-2009, particularly in eastern England. Additionally, the BTO Bird Atlas 2007-11 showed a northerly range expansion since the previous 1993 atlas. These increases were probably the result of general climate warming in the period 1989-2009 and the erection of numerous nestboxes in, for example, parts of The Fens and East Anglia. It is quite probable that in 2009 the UK Barn Owl population level was substantially greater than 4,000 pairs.
2009-2012There can be little doubt that the unusually severe winters of 2009/10 and 2010/11 reduced total population size although ‘before and after’ population levels will never be known. In spite of these setbacks, additional data submitted to the authors suggest that 2012, with the hottest March since 1997, was quite a reasonable year. For example, the Suffolk Community Barn Owl Project which monitored a staggering 1,191 boxes in 2012 recorded 319 nests which, at the time, was the highest number since monitoring started in 2007. However, in some parts such as SW Scotland (Geoff Sheppard pers. com.) and Cumbria (Ian Armstrong pers. com.) 2012 was a very poor year and in Devon widespread nestling mortality resulted in the average brood size dropping from 3.68 to 2.75 during the wettest June since 1766.
2013Given that 2012 was a relatively good year (overall) and winter 2012/13 was much less severe than the preceding three, Barn Owl numbers at the start of 2013 were probably quite reasonable (probably lower than in 2009 but possibly still higher than 1995-97). March 2013 was the coldest since 1962 and during the month the number of dead Barn Owls reported to the BTO was 280% above normal.
Without exception, every monitoring scheme that contributed data reported a high proportion of nest sites with no signs of occupation and Major Nigel Lewis’s comment summed it up very well: “the worst year in the 30 years I have been owling in Wiltshire”. The State of the UK Barn Owl Population 2013 showed that nesting occupancy in 2013 was an estimated 72% below the all-years average and mean brood size (2.63) was down by 12% (based on information provided by 26 data contributors who between them checked an estimated 6,344 potential nest sites).
The widespread absence of adults from annual nest sites and exceptionally high mortality recorded by the BTO suggested that the missing birds were dead. Conversely, the exceptionally high nesting occupancy the following year suggested that the missing birds had been simply roosting away from their nest sites. Fortunately, the UK’s largest county-wide survey, which included the rechecking of all known roost sites as well as nest sites was carried out that same year. If the birds were alive and roosting elsewhere, the big drop in nesting occupancy should have been mirrored by a similar or bigger increase in roost
The key to success: a litter-layer not less than 7cm deep Photo: Kevin Keatley
20State of the UK Barn Owl population – 2017
occupancy (bigger because of birds roosting singly). In the event this was not the case. The Devon Report, based on the checking of 1,070 sites, showed a 65% drop in nesting occupancy and an increase in roost occupancy of only 16.9%. These figures support the view that a high proportion of the missing birds were not simply roosting elsewhere but were in fact dead.
This begs the question “where did all the Barn Owls come from that nested in 2014?” They must have been a combination of those that survived 2013 and young birds produced very late in 2013 who were all probably helped by the fact that winter-spring 2013-14 was so mild that Field Voles were even breeding in mid-winter (see State of the UK Barn Owl Population 2013).
2014 With a mild winter followed by an early spring and a long and pleasant summer, 2014 turned out to be the warmest year ever recorded - according to the National Climatic Data Centre. Great weather happened to coincide with a peak year for small mammals and Barn Owls had a very productive year in many areas. Berkshire, Lincolnshire, Shropshire and Warwickshire did particularly well with nesting occupancy 71 to 193% above normal (UK average +16%). Brood sizes were phenomenal in many areas with records broken in Suffolk and Wiltshire. Broods in Somerset were, on average, 84% bigger than normal (UK average +35%).
Sadly, 2014 was not an amazing year everywhere. Brood sizes in parts of SW Scotland, east Wales and the Isle of Wight bucked the trend by being no higher than normal and the mean brood size of the biggest UK Barn Owl monitoring scheme in Lincolnshire (the Bowden and Ball Ringing Group) was only 13% above their all-years average (see State of the UK Barn Owl Population 2014).
2015Overall, 2015 was a poor year for Barn Owls in the UK but with some quite extreme geographical variation between regions, within regions and even within counties. Barn Owls in Lincolnshire experienced an even worse year than in 2013 with nesting occupancy 95% below the all-years average and mean brood size 41% down. In Mid Sussex nesting occupancy was 47% down but, in complete contrast, in West Sussex it was 16% up despite the fact that these areas are immediately adjacent and even overlap a little. Further north, where the Bisham BOG straddles the Berks/Bucks border, nesting occupancy was only 7% below average but the Bucks ORG reported it to be a disappointing 66% below.
Given that winter 2014/15, and 2015 itself, were generally mild it is most unlikely that the poor results were due to the weather but due to a general lack of prey. It is well known that annual variations in small mammal abundance are not synchronised across the whole country and that certainly seems to have been the case in 2015.
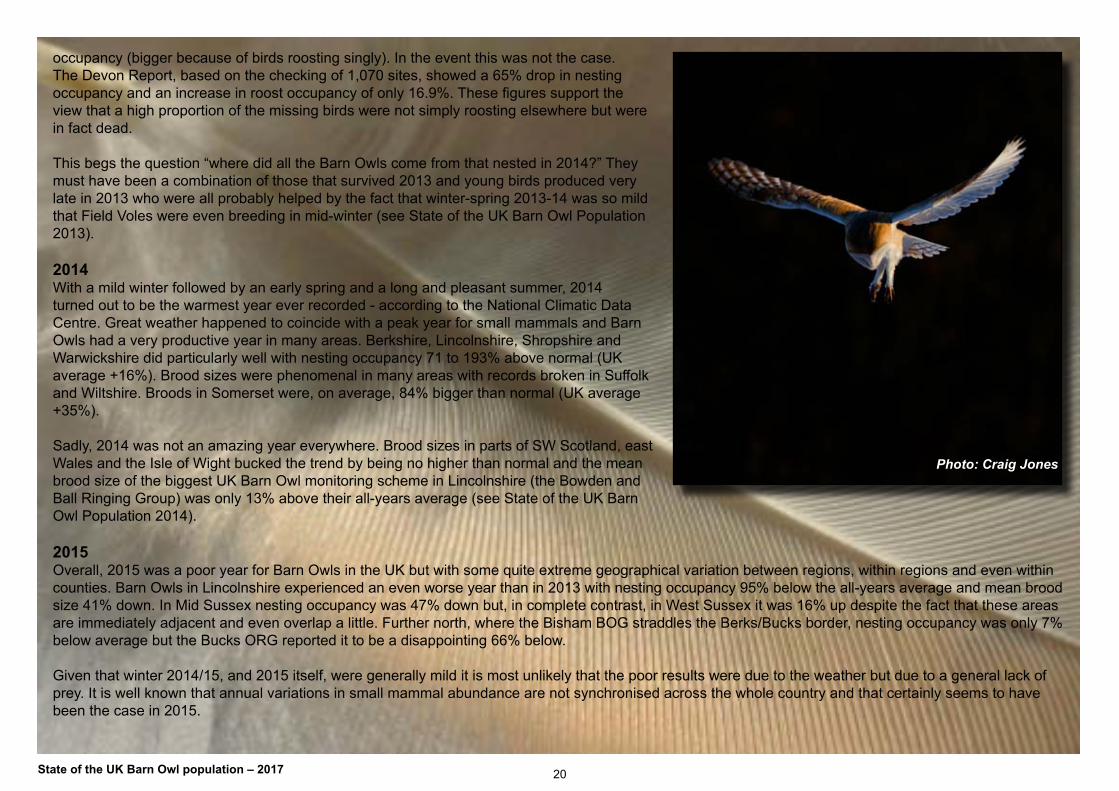
Photo: Craig Jones
21State of the UK Barn Owl population – 2017
2016Sadly, 2016 was another poor year. Data received from 32 monitoring schemes shows that the number of nesting pairs in the UK was 6% below the all-years average and the average number of young in the nest was 7% below. Barn Owls had a poor to very poor year in SW and S England, Jersey, N Norfolk, parts of Lincs. and E Yorkshire, parts of Powys in Wales and West Galloway in Scotland. Conversely, Barn Owls in the west of England (from Cheshire down to Buckinghamshire), and in North Northumberland, Suffolk, and the Isle of Wight had a quite good to good year.
Globally, 2016 was once again the warmest year ever recorded. Here in the UK, winter 15/16 was the third warmest and second wettest recorded since 1910. With few exceptions, such as November flooding thanks to Storm Angus, long-duration extreme weather events were not a major feature of 2016. Therefore the observed temporal changes in nesting occupancy and brood sizes were probably more influenced by variations in small mammal abundance than by the weather.
Further information
BTO Bird Atlas 2007-11: the breeding and wintering of birds in Britain and Ireland. Balmer, D.E., Gillings, S., Caffrey, B.J., Swann, R.L., Downie, I.S., & Fuller, R.J. (2013) BTO Books. British Trust for Ornithology, Thetford.
Barn Owl Conservation Handbook, a comprehensive guide for ecologists, surveyors, land managers and ornithologists. Barn Owl Trust (2012) Pelagic Publishing, Exeter.
State of the UK Barn Owl Population 2013. Barn Owl Trust (2014) Ashburton
State of the UK Barn Owl Population 2014. Barn Owl Trust (2015) Ashburton
State of the UK Barn Owl Population 2015. Barn Owl Trust (2016) Ashburton
State of the UK Barn Owl Population 2016. Barn Owl Trust (2017) Ashburton
Population Trends in British barn owls (Tyto alba) and tawny owls (Strix aluco) in relation to environmental change. Percival, S.M. (1990) BTO Research Report, 57. British Trust for Ornithology, Thetford.
Barn Owls and Major Roads: results and recommendations from a 15 year research project. Ramsden, D.J., (2003) Barn Owl Trust, Ashburton.
Project Barn Owl Final Report. Toms, M.P., Crick, H.P.Q. & Shawyer, C.R. (2000) BTO Research Report, 157. HOT Research Report 98/1. British Trust for Ornithology, Thetford.
Barn Owls: Predator-prey Relationships and Conservation, Taylor, I. (1994) Cambridge University Press
22State of the UK Barn Owl population – 2017
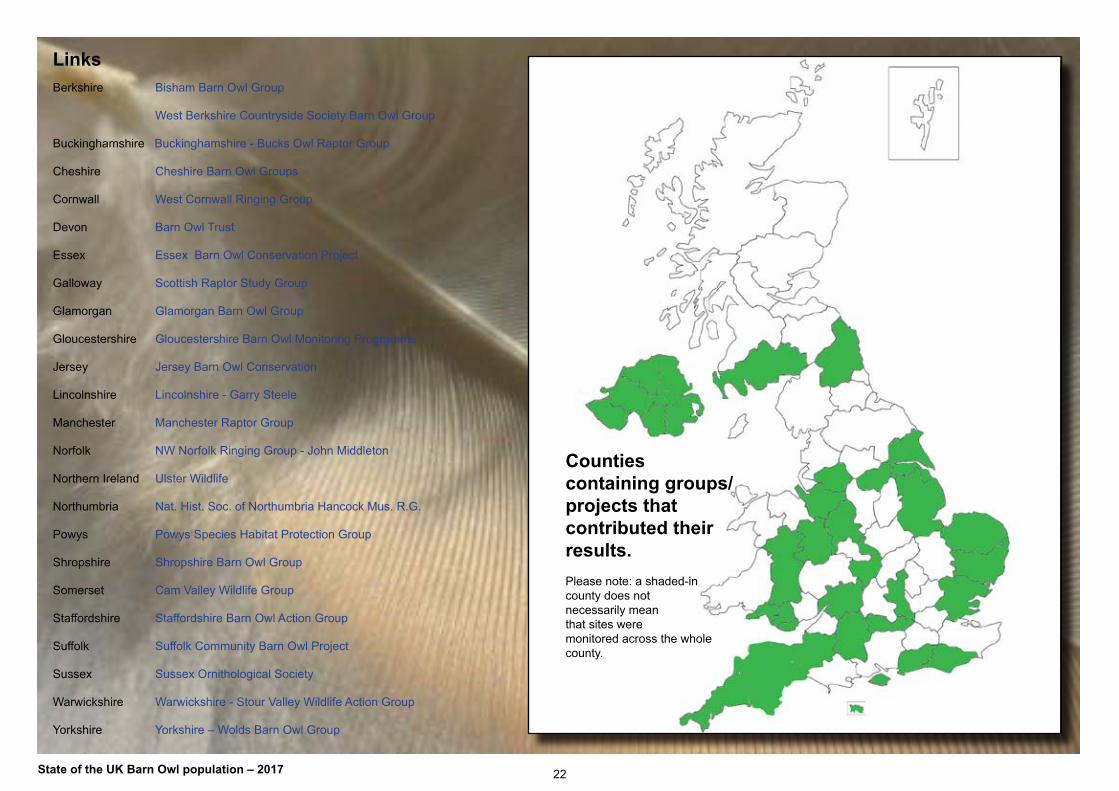
LinksBerkshire Bisham Barn Owl Group
West Berkshire Countryside Society Barn Owl Group
Buckinghamshire Buckinghamshire - Bucks Owl Raptor Group
Cheshire Cheshire Barn Owl Groups
Cornwall West Cornwall Ringing Group
Devon Barn Owl Trust
Essex Essex Barn Owl Conservation Project
Galloway Scottish Raptor Study Group
Glamorgan Glamorgan Barn Owl Group Gloucestershire Gloucestershire Barn Owl Monitoring Programme
Jersey Jersey Barn Owl Conservation
Lincolnshire Lincolnshire - Garry Steele
Manchester Manchester Raptor Group
Norfolk NW Norfolk Ringing Group - John Middleton
Northern Ireland Ulster Wildlife
Northumbria Nat. Hist. Soc. of Northumbria Hancock Mus. R.G.
Powys Powys Species Habitat Protection Group
Shropshire Shropshire Barn Owl Group
Somerset Cam Valley Wildlife Group
Staffordshire Staffordshire Barn Owl Action Group
Suffolk Suffolk Community Barn Owl Project
Sussex Sussex Ornithological Society
Warwickshire Warwickshire - Stour Valley Wildlife Action Group
Yorkshire Yorkshire – Wolds Barn Owl Group
Counties containing groups/projects that contributed their results.Please note: a shaded-in county does not necessarily meanthat sites were monitored across the whole county.