
State of the Social Casino Industry – Q2 2017
18
State of Social Casino Industry Q2 2017 Adam Krejcik Principal Eilers & Krejcik Gaming, LLC
-
Upload
jessica-tams -
Category
Technology
-
view
862 -
download
1
Transcript of State of the Social Casino Industry – Q2 2017

State of Social Casino Industry Q2 2017
Adam Krejcik
Principal
Eilers & Krejcik Gaming, LLC

Eilers & Krejcik Gaming, LLC is a boutique research & advisory firm focused on servicing the gamingequipment, technology, and interactive gaming sectors within the global gaming industry. Productsand services include market research, company research, and advisory services designedspecifically for traditional land based & online casino companies, gaming technology providers,digital & interactive gaming companies, and institutional investors.
• Market Research - proprietary market research offering includes multiple surveys and internallydeveloped reports that are designed specifically to track key industry and product demand drivers,operating metrics, market share trends, and technology adoption rates.
• Company Research - company research offering includes the active coverage of all major gamingequipment and technology providers, as well as social gaming companies.
• Consulting & Advisory Services - consulting & advisory services division provides a wide range ofcustomized research products and advisory services for both gaming companies and investorsincluding, but not limited to, M&A advisory, customized surveys, new market analysis, assetvaluation, and competitive landscape analysis.

Market Overview
Social Casino Gaming = free-to-play online Poker, Slots, Table Games and Bingo, on desktop and mobile devices.
Social Casino Gaming
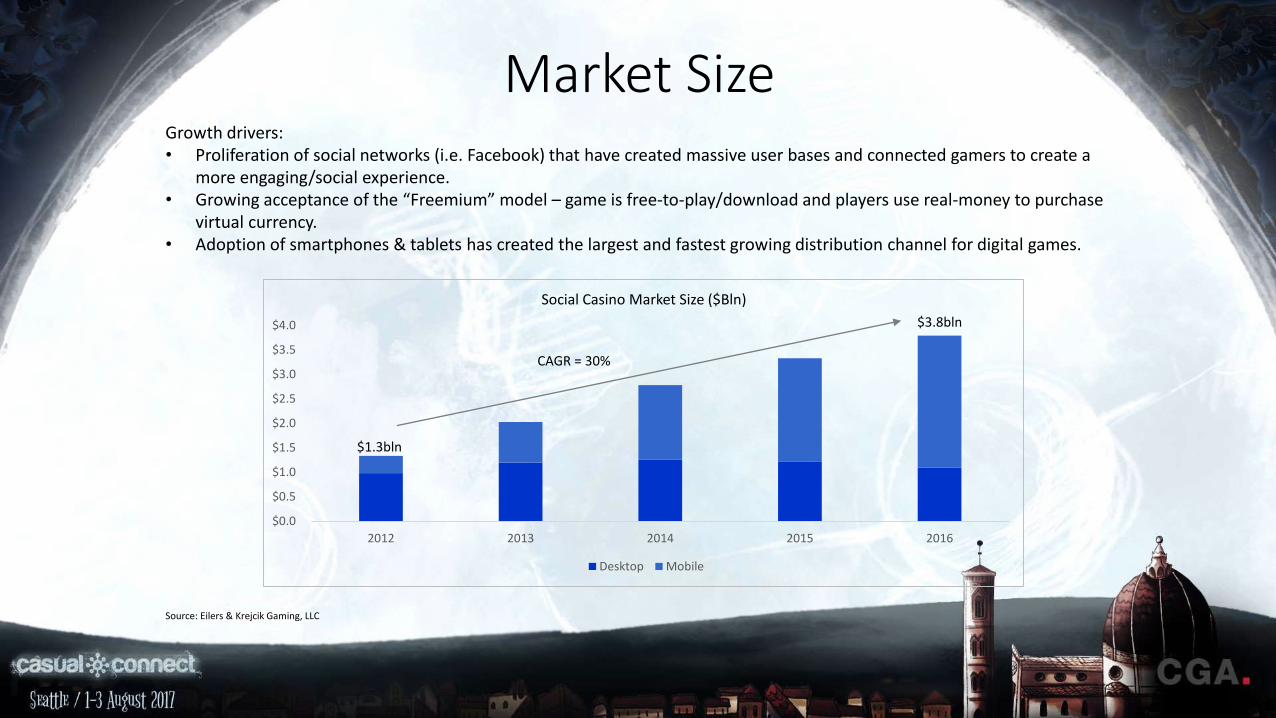
Market SizeGrowth drivers: • Proliferation of social networks (i.e. Facebook) that have created massive user bases and connected gamers to create a
more engaging/social experience.• Growing acceptance of the “Freemium” model – game is free-to-play/download and players use real-money to purchase
virtual currency.• Adoption of smartphones & tablets has created the largest and fastest growing distribution channel for digital games.
$0.0
$0.5
$1.0
$1.5
$2.0
$2.5
$3.0
$3.5
$4.0
2012 2013 2014 2015 2016
Social Casino Market Size ($Bln)
Desktop Mobile
$1.3bln
$3.8bln
CAGR = 30%
Source: Eilers & Krejcik Gaming, LLC

Key VerticalsThe social casino market consists of 4 distinct game types, with slots accounting for 79% of revenue in CY16. Slots have and will likely remain the dominant type of social casino game in the USA and Australia (two biggest markets) due to a large user base educated in slots.
Game Category Leading Title Leading Company
Slots Slotomania Playtika
Poker Zynga Poker Zynga
Bingo Bingo Blitz Playtika
Table & Other NA NA
Slots79%
Table Games1%
Poker13%
Bingo7%
Vertical % of Revenues - 2Q17
Source: Eilers & Krejcik Gaming, LLC

Key GeographiesThe social casino market is predominantly North America (74%), followed by Asia-Pacific (17%), and Western Europe (7%). The leading players are U.S. focused, with 13 of the 15 top players generating the majority of their revenue from the U.S.
North America74%
As ia Pacific17%
Western Europe
7%
Latin America1%
Eastern Europe
1%Middle East &
Africa0.4%
Social Casino Revenues by Geography Country Top Social Casino Publishers
USA Playtika, SciGames, Double Down
Canada Playtika, SciGames, Double Down
Australia Playtika, Product Madness, Murka
China Tencent, PokerCity, Boyaa
UK Playtika, Zynga, GSN
Germany Playtika, Funstage, Huuuge
Brazil Pipa Studios, Playtika
Russia Playtika, Funstage, KamaGames
Source: Eilers & Krejcik Gaming, LLC

Top 10 Social Casino Titles
(2Q17 - $ in millions)
Rank Title Category Publisher Revenue
1 Slotomania Slots Playtika $122
2 DoubleDown Casino Casino DoubleU Games $66
3 Heart of Vegas Slots Product Madness $55
4 House of Fun Slots Playtika $54
5 Jackpot Party Casino Slots SciGames $49
6 Big Fish Casino Casino Big Fish $44
7 Caesars Casino Slots Playtika $41
8 Bingo Blitz Bingo Playtika $38
9 Texas Hold'Em Poker Poker Zynga $36
10 Huuuge Casino Casino Huuuge Games $33
Source: Eilers & Krejcik Gaming, LLC

Competitive Landscape
Playtika26.1%
DoubleU Games*10.1%
Scientific Games9.2%
Zynga9.1%
Aristocrat7.7%
Churchill Downs4.5%
Sony/GSN4.1%
Playstudios3.3%
Huuuge Games3.0%
Murka2.9%
Other20.0%
Social Casino Market Share - 2Q17 (Mobile & Web)Source: Eilers & Krejcik Gaming, LLC Notes for Q2 2017:
• Playtika is the largest social casino publisherwith 26.1% market share
• DoubleU Games (now owns Double Down)is #2 with 9.2% market share, and SciGamesInteractive #3 with 9.1% share.
• Combined, the top-3 three companiesaccounted for 44.4% of the total socialcasino game market
• top-15 companies accounted for roughly86% of the total market.

Categorizing Key Players
Early movers:
Gaming Equipment Suppliers:
Social gaming companies:
Asia focused:
New incumbents:

Categorizing Key PlayersEarly moversKey theme: being early on a sector call and successfully executing can pay huge dividends over the long-run.
Gaming Equipment SuppliersKey theme: Land-based content serves a key competitive advantage due to superior monetization (better Math), retention (familiarity with certain slot titles)
Social gaming companiesKey theme: acquiring studios with developers / professionals with former real-money gaming experience helps ensure better math / designs / content leading to increased probability of success.
Asia focusedKey theme: large opportunity for local players who can partner with platform providers (Tencent, Qihoo), penetrate secondary Android game market, and localized Chinese poker.
New incumbentsKey theme: can still be disruptive if you can find niche i.e. rewards, innovation, social, etc.

Gaming Supplier Strategies
M&A Strategic Partnerships Licensing

Casino Operator Strategies
M&A / Investments B2B / White label Internally developed

User Acquisition Trends
The trend is clearly upwards (CPI has roughly tripled since CY13) reflecting increased competitionin the social casino category, flattish DAUs for the casino category, and general price inflationobserved across the entire mobile app ecosystem.
$-
$2.00
$4.00
$6.00
$8.00
$10.00
$12.00
Mobile CPI - Social Casino
iOS
Android
Source: Bidalgo, Eilers & Krejcik Gaming, LLC

User Acquisition TrendsWe est. social casino game companies will spend over $1blnn marketing (mostly UA) in CY17.Most of that money will flow to the big-2 (Facebook & Google), but still a number of smalleragencies capitalizing on fast growing market.
Est. 80% market share for social casino UA spend Est. 20% market share in UA spend (social casino)
Clear competitive advantage / data & scale Many lack performance sustainability at scale

Social Casino M&A Flurry (CY11-17)
2011
2012
2013
2014
2015
2016
2017

Social Casino M&A Details
• Approx. $8bn worth of M&A transactions over the past 5-years in social casino gaming, incl. mega-$4.4bn sale of Playtika to Chinese consortium and $825M DoubleU/DoubleDown deal.
• There has been considerable amount of consolidation over the past 5-years resulting in a “top-heavy” industry and now very few private companies with meaningful scale.
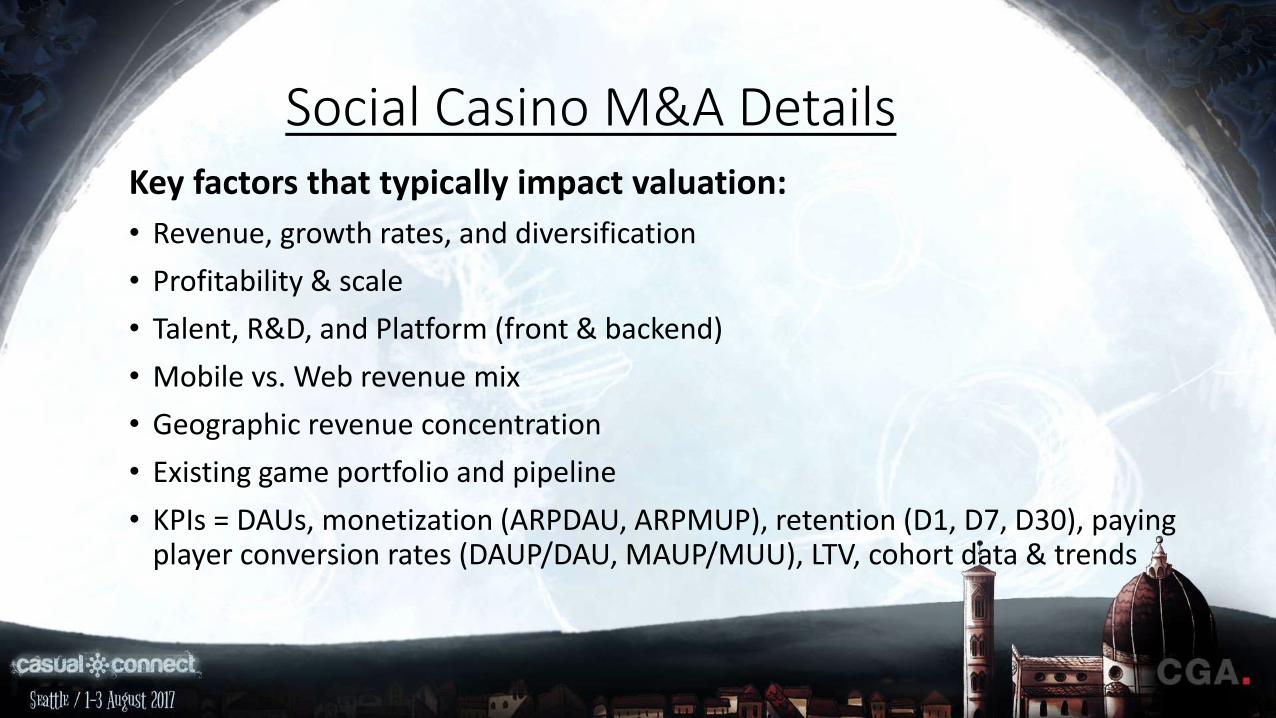
Social Casino M&A DetailsKey factors that typically impact valuation:
• Revenue, growth rates, and diversification
• Profitability & scale
• Talent, R&D, and Platform (front & backend)
• Mobile vs. Web revenue mix
• Geographic revenue concentration
• Existing game portfolio and pipeline
• KPIs = DAUs, monetization (ARPDAU, ARPMUP), retention (D1, D7, D30), paying player conversion rates (DAUP/DAU, MAUP/MUU), LTV, cohort data & trends