STATE OF THE SNOW SPORTS MARKET May, 2012. The 2011/2012 Market Economy remains in recovery but...
10
STATE OF THE SNOW SPORTS MARKET May, 2012
-
Upload
clifton-lane -
Category
Documents
-
view
213 -
download
0
Transcript of STATE OF THE SNOW SPORTS MARKET May, 2012. The 2011/2012 Market Economy remains in recovery but...
STATE OF THE SNOW SPORTS MARKET
May, 2012

The 2011/2012 Market• Economy remains in recovery but relatively
stableo Employment issues remaino European and Asian economic
slowdowns likely
• Lack of snow explains sales and participation declines
• Pre-season orders projected declines of 10%-50% in equipment and accessories categories
• Retail margins down Feb – Nov to clear carryover

State of the Marketplace
Consumer’s Perspective • Recovery from the recession very slow for
younger workers• Wage growth flat • Continued lack of vacation time and
discretionary income• Fuel, food, and apparel prices are rising• Snow conditions terrible this season
Retailer’s Perspective• Snow not falling, consumers not buying• Inventories required deep discounting in
February• Margins down in all categories• Cash flow is a trickle• Look to warm weather product to bring in
customers and cash
Supplier’s Perspective• Pre-season equipment orders for equipment
for 2012/2013 down 10% to 50% in equipment
• Marketing strategies meet with mixed success in new social media driven society
• Manufacturing costs overseas increasing due to labor initiatives, tariffs, materials costs increases, and currency policy
Resort’s Perspective• Skier visits down 5% to 40% at resorts• Short season• Participants age 25 to 35 have less time
and discretionary income• Baby boomers leaving the slopes at
150,000 per year with smaller Gen X behind them
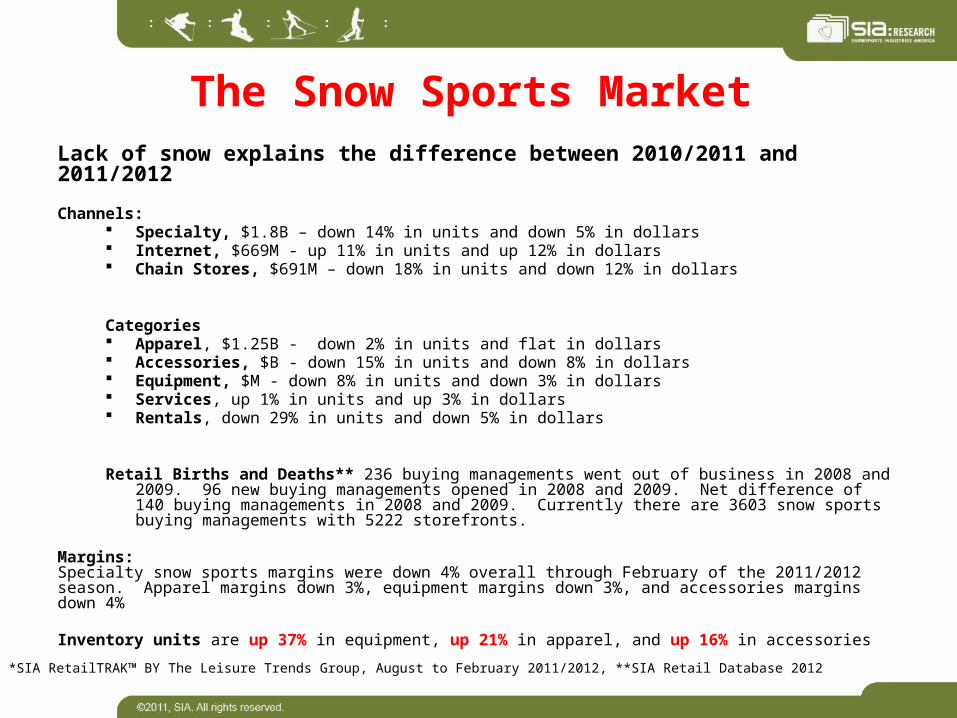
The Snow Sports MarketLack of snow explains the difference between 2010/2011 and 2011/2012 Channels:
Specialty, $1.8B – down 14% in units and down 5% in dollars Internet, $669M - up 11% in units and up 12% in dollars Chain Stores, $691M – down 18% in units and down 12% in dollars
Categories Apparel, $1.25B - down 2% in units and flat in dollars Accessories, $B - down 15% in units and down 8% in dollars Equipment, $M - down 8% in units and down 3% in dollars Services, up 1% in units and up 3% in dollars Rentals, down 29% in units and down 5% in dollars
Retail Births and Deaths** 236 buying managements went out of business in 2008 and 2009. 96 new buying managements opened in 2008 and 2009. Net difference of 140 buying managements in 2008 and 2009. Currently there are 3603 snow sports buying managements with 5222 storefronts.
Margins:Specialty snow sports margins were down 4% overall through February of the 2011/2012 season. Apparel margins down 3%, equipment margins down 3%, and accessories margins down 4%
Inventory units are up 37% in equipment, up 21% in apparel, and up 16% in accessories
Source: *SIA RetailTRAK™ BY The Leisure Trends Group, August to February 2011/2012, **SIA Retail Database 2012

5
Source: SIA Single Sports Reports, The Physical Activity Council 2011
Snow Sports Participation by Sport
Alpine skiing participation declined 11% in the 2010/2011 season and snowboarding participation declined 8% despite heavier participation among core snow sports participants. Total participation in snow sports is 21M with another 11M who
consider themselves skiers or riders but did not ski or ride in the past two seasons.
2006/2007 2007/2008 2008/2009 2009/2010 2010/2011
Skiing (Cross-Country) 3530 3848 4157 4530 4318
Skiing (Alpine/Downhill) 10362 10346 10919 11504 10201
Skiing (Freestyle) 2817 2711 2950 3647 3641
Snowboarding 6841 7159 7421 8196 7579
Snowshoeing 2400 2922 3431 3823 4111
Telemarking (Downhill) 1173 1435 1482 1821 2099
1,000
3,000
5,000
7,000
9,000
11,000
13,000
Parti
cipan
ts ('
000s
)
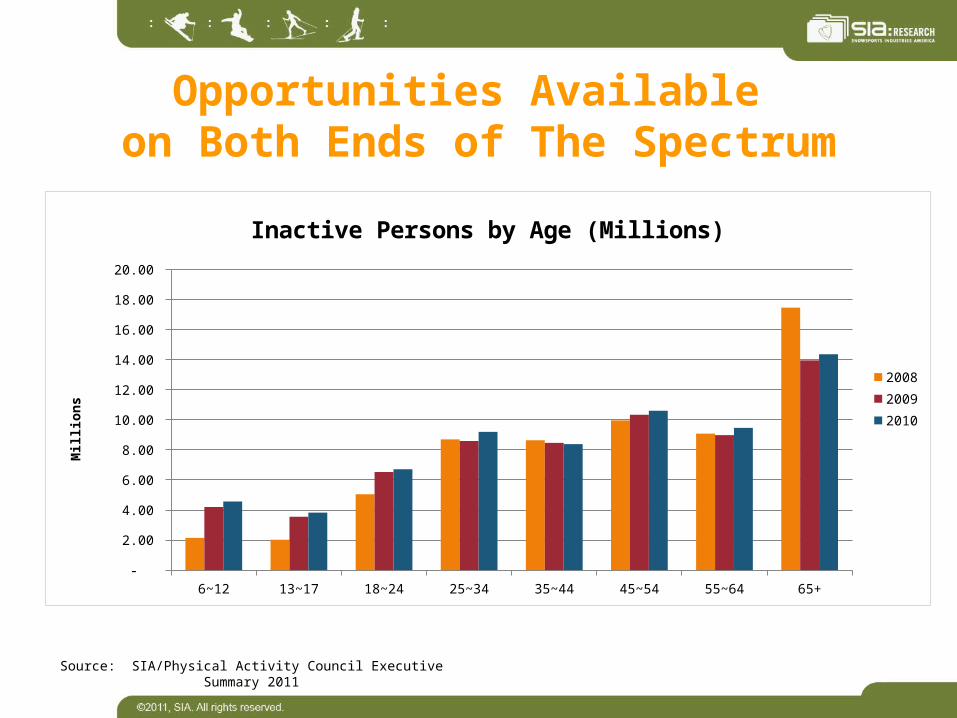
Opportunities Available on Both Ends of The Spectrum
Source: SIA/Physical Activity Council Executive Summary 2011
6~12 13~17 18~24 25~34 35~44 45~54 55~64 65+ -
2.00
4.00
6.00
8.00
10.00
12.00
14.00
16.00
18.00
20.00
Inactive Persons by Age (Millions)
200820092010
Mil
lio
ns
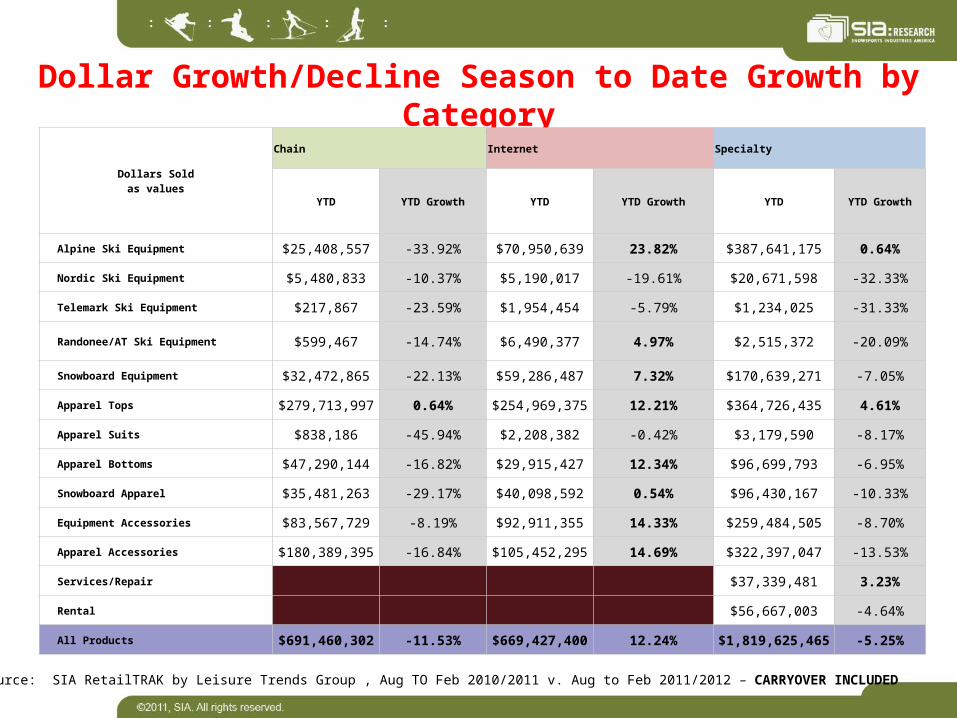
Dollar Growth/Decline Season to Date Growth by Category
Source: SIA RetailTRAK by Leisure Trends Group , Aug TO Feb 2010/2011 v. Aug to Feb 2011/2012 – CARRYOVER INCLUDED
Dollars Soldas values
Chain Internet Specialty
YTD YTD Growth YTD YTD Growth YTD YTD Growth
Alpine Ski Equipment $25,408,557 -33.92% $70,950,639 23.82% $387,641,175 0.64%
Nordic Ski Equipment $5,480,833 -10.37% $5,190,017 -19.61% $20,671,598 -32.33%
Telemark Ski Equipment $217,867 -23.59% $1,954,454 -5.79% $1,234,025 -31.33%
Randonee/AT Ski Equipment $599,467 -14.74% $6,490,377 4.97% $2,515,372 -20.09%
Snowboard Equipment $32,472,865 -22.13% $59,286,487 7.32% $170,639,271 -7.05%
Apparel Tops $279,713,997 0.64% $254,969,375 12.21% $364,726,435 4.61%
Apparel Suits $838,186 -45.94% $2,208,382 -0.42% $3,179,590 -8.17%
Apparel Bottoms $47,290,144 -16.82% $29,915,427 12.34% $96,699,793 -6.95%
Snowboard Apparel $35,481,263 -29.17% $40,098,592 0.54% $96,430,167 -10.33%
Equipment Accessories $83,567,729 -8.19% $92,911,355 14.33% $259,484,505 -8.70%
Apparel Accessories $180,389,395 -16.84% $105,452,295 14.69% $322,397,047 -13.53%
Services/Repair $37,339,481 3.23%
Rental $56,667,003 -4.64%
All Products $691,460,302 -11.53% $669,427,400 12.24% $1,819,625,465 -5.25%
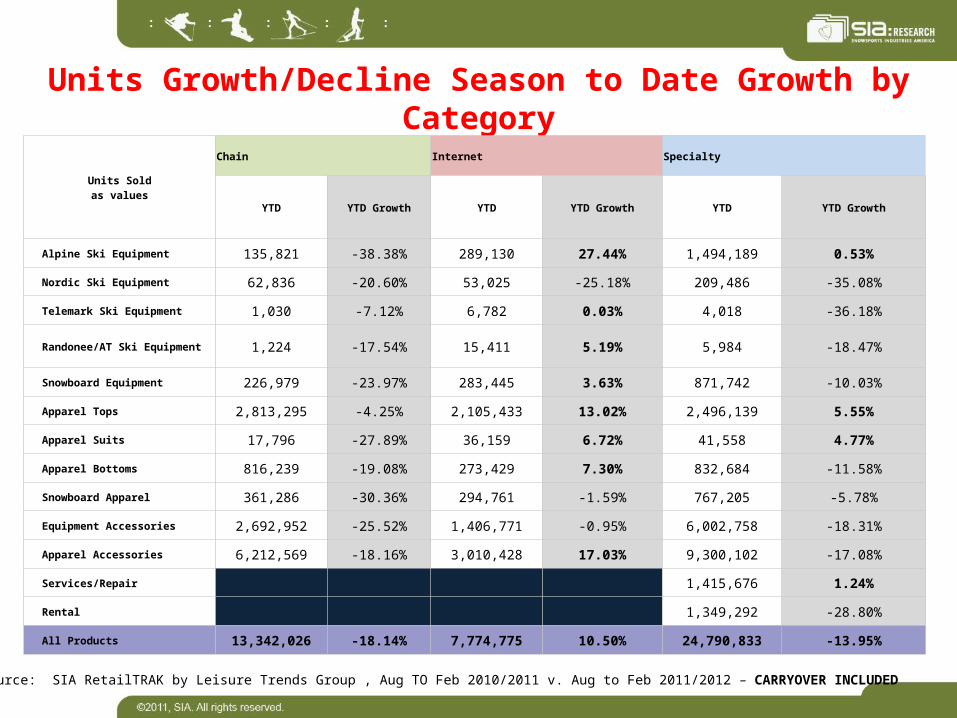
Units Growth/Decline Season to Date Growth by Category
Units Soldas values
Chain Internet Specialty
YTD YTD Growth YTD YTD Growth YTD YTD Growth
Alpine Ski Equipment 135,821 -38.38% 289,130 27.44% 1,494,189 0.53%
Nordic Ski Equipment 62,836 -20.60% 53,025 -25.18% 209,486 -35.08%
Telemark Ski Equipment 1,030 -7.12% 6,782 0.03% 4,018 -36.18%
Randonee/AT Ski Equipment 1,224 -17.54% 15,411 5.19% 5,984 -18.47%
Snowboard Equipment 226,979 -23.97% 283,445 3.63% 871,742 -10.03%
Apparel Tops 2,813,295 -4.25% 2,105,433 13.02% 2,496,139 5.55%
Apparel Suits 17,796 -27.89% 36,159 6.72% 41,558 4.77%
Apparel Bottoms 816,239 -19.08% 273,429 7.30% 832,684 -11.58%
Snowboard Apparel 361,286 -30.36% 294,761 -1.59% 767,205 -5.78%
Equipment Accessories 2,692,952 -25.52% 1,406,771 -0.95% 6,002,758 -18.31%
Apparel Accessories 6,212,569 -18.16% 3,010,428 17.03% 9,300,102 -17.08%
Services/Repair 1,415,676 1.24%
Rental 1,349,292 -28.80%
All Products 13,342,026 -18.14% 7,774,775 10.50% 24,790,833 -13.95%
Source: SIA RetailTRAK by Leisure Trends Group , Aug TO Feb 2010/2011 v. Aug to Feb 2011/2012 – CARRYOVER INCLUDED

Regional Sales
Source: SIA RetailTRAK by Leisure Trends Group , Topline Regional Category
West Specialty Sales $660M, up 1%
Northeast Specialty Sales $496M, down 10%
Midwest Specialty Sales $290M, down 6%
South Specialty Sales $282M, down 9%
Looking Ahead:Threats and Opportunities
• Fallout from a terrible season:o Smaller orderso Conservative product mixo Bankruptcy – retail and supplyo Consolidation
• Opportunity to leverage a better snow season in 2012/2013?
• How will slow downs in the European and Asian economies impact our economy?
• Will retailers sell through inflated inventories?
• How can we work together to keep snow sports healthy?

![[2012] Ofcom - International Communications Market Report 2012](https://static.fdocuments.in/doc/165x107/554dd076b4c905c70e8b4755/2012-ofcom-international-communications-market-report-2012.jpg)


![[STP] 'Market O'](https://static.fdocuments.in/doc/165x107/558189a8d8b42a132d8b513b/stp-market-o.jpg)