BY TUGANAI BORINA TOASTMASTERS INTERNATIONAL ASTANA ALUMNI ASSOCIATION ASTANA.
Upload
bernice-merrittCategory
view
216download
1
State of the Mining Market
Vasily AlekseenkoAstana, June 13, 2014

IMPORTANT COPYRIGHT NOTICE
The information in this document is subject to SNL Metals & Mining’s full copyright and entitlements as defined and protected by international law. All other rights are exclusively reserved to SNL Metals & Mining.
All information in this file is owned by SNL Metals & Mining, and the copying or distribution of this information is strictly prohibited without the prior written permission and consent of SNL Metals & Mining. Unauthorized reproduction or distribution may result in severe civil or criminal sanctions pursuant to Canada, United States and other law.
If you wish to distribute this information, contact Christina Twomey at [email protected].© Copyright by SNL Metals & Mining 2014. All rights reserved. _______________________________________________________________________
SNL Metals & Mining represents the information obtained in this document has been collected and compiled in good faith from a variety of sources but makes no warranty as to the accuracy of the information from these sources.


Overview
Mining Sector Summary Commodity PricesExploration (Drilling and Spending)Development ProjectsFinancingMergers and Acquisitions

ANNUAL GLOBAL OUTPUT 2013
ORE (Mt)
WASTE (Mt)
TOTAL (Mt)
Metals Mines 7,000 13,000 20,000Aggregates 15,000 0 15,000Coal Mines 8,000 7,000 15,000Industrial Minerals 1,000 1,000 2,000Total 31,000 21,000 52,000
The Mining Sector

MINED('000t)
PRICE(US$/t)
VALUE PA(US$ bn)
Coal 7,800,000 85 663Iron Ore 1,900,000 130 247Copper 17,000 7,100 121Gold 2.65 42,300,000 112Nickel 1,700 14,000 24Zinc 13,000 1,800 23PGMs 0.48 30,300,000 15Diamonds 0.025 580,000,000 14Bauxite 240,000 45 11Lead 3,600 2,000 7Top Ten Total 9,975,000 -124 1,237
Commodity Tonnages and Prices
Data for 2013; annual tonnages, median prices
$1,300/oz
$950/oz$115/ct
85 Moz
90 Mct
Now much lower

VALUE OF MINED PRODUCTION (2013)
Extracted total worth some US$1.9 trillion pa:US$700 billion metals and gemsUS$660 billion coal / ligniteUS$340 billion cement and aggregatesUS$200 billion industrial minerals
Value of the Mining Sector
1/3rd1/3rd1/3rd

TARGET OPERATIONS
Mined coal and metals production
According to SNL database, around 90% of the value of the world’s annual production is produced by only 2,000 mines.
The Mining Sector

Mining Market (end March)
57%
21%
6%
16%
Commodity Prices (to end-March)
Recession bites
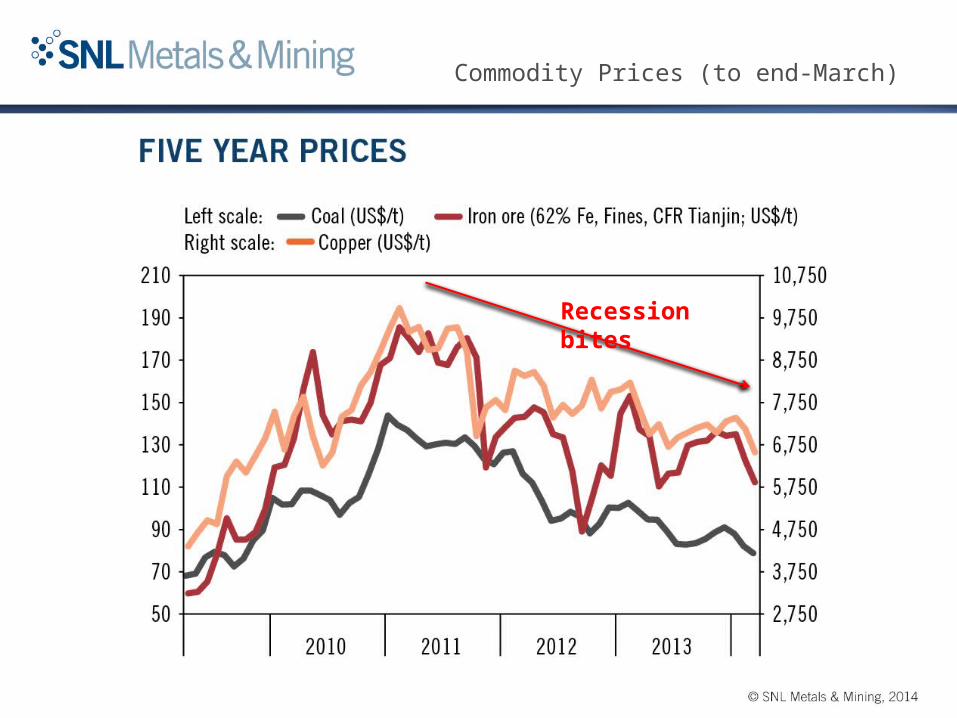
Commodity Prices
Worst over?

Long-term Metals Prices
REAL GOLD PRICE (since 1270)

Two-year Decline in Drilling
56%
62%

Where Still Drilling? (2012 to Feb 2014)

Worldwide Exploration v Metals Prices

Drilling Follows Metals Prices

Drilling Reports (Individual Prospects)

Regional Exploration (Share Total)

Falling Junior Share of Exploration Expenditure
Majors
Juniors
Gov’t / Other
Intermediate

Grassroots Work Has Fallen
Grassroots
Late Stage
Minesite

Major Producers’ Exploration (Share of Revenue)

New Gold Resources

New Gold Reserves
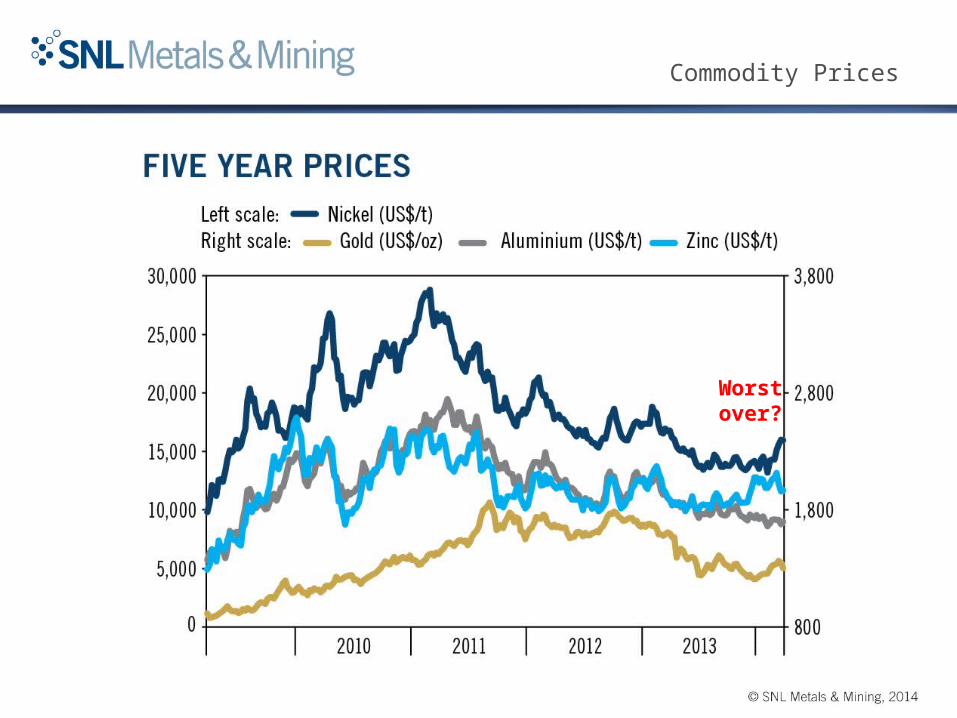
Development Projects
Numbers continue to fall but capex rising
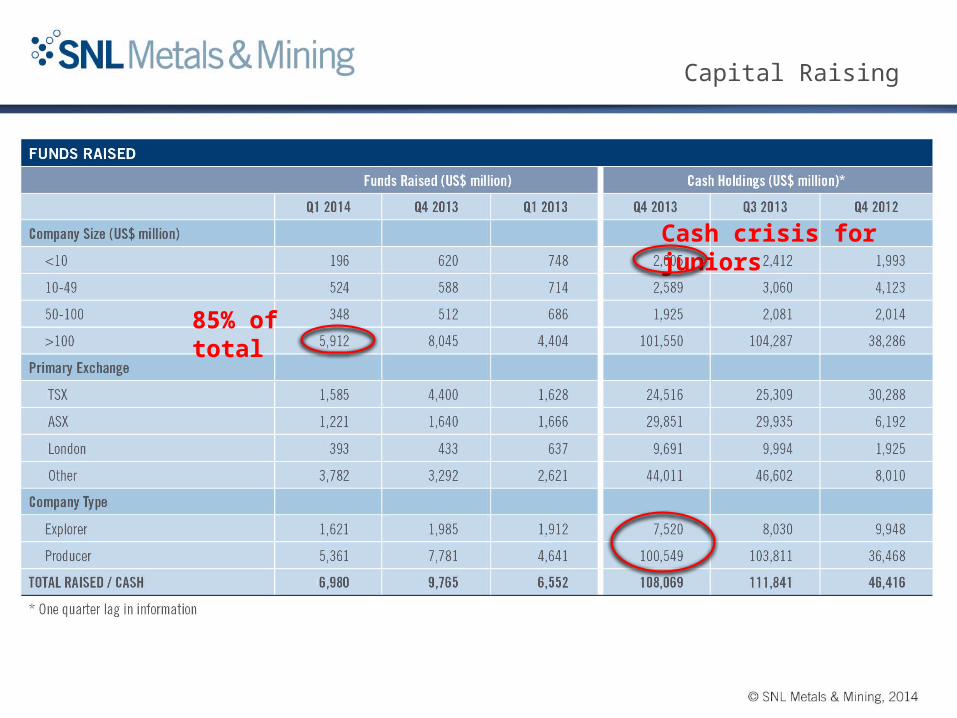
Capital Raising
85% of total
Cash crisis for juniors

Mergers and Acquisitions (March Quarter)
83% of total
71% of total

M&A: Still Low but Improving
Deal value is improving