
State of the Grid: 2018 - iso-ne.com · PDF fileISO-NE PUBLIC 6 State of the Grid 2018: Key...
53
ISO-NE PUBLIC FEBRUARY 27, 2018 Gordon van Welie PRESIDENT & CEO, ISO NEW ENGLAND INC. ISO on Background State of the Grid: 2018
Transcript of State of the Grid: 2018 - iso-ne.com · PDF fileISO-NE PUBLIC 6 State of the Grid 2018: Key...

ISO-NE PUBLIC
F E B R U A R Y 2 7 , 2 0 1 8
Gordon van Welie
P R E S I D E N T & C E O , I S O N E W E N G L A N D I N C .
ISO on Background
State of the Grid: 2018

ISO-NE PUBLIC
About the ISO on Background Series
• Informal opportunity for media to learn more about trends affecting New England’s electricity industry
• Hosted by ISO New England senior management
• Content is on the record
• Please hold questions until the Q&A session at the end of the presentation
• Presentation and remarks will be posted at www.iso-ne.com>About Us>News and Media>Press Releases
2

ISO-NE PUBLIC
Agenda
• 10:30 to 10:35 a.m. Welcome Ellen Foley, director, Corporate, Media, and Web Communications
• 10:35 to 11:05 a.m. State of the Grid: 2018 Gordon van Welie, president and CEO
• 11:05 to 11:30 a.m. Question-and-Answer Session
3

ISO-NE PUBLIC
Overview of State of the Grid: 2018
• New England’s Power System Today
• The Changing Grid
• Fuel Security – 2017/2018 Arctic Cold Spell – Operational Fuel-Security Analysis
• Setting the Stage for the Future
• Conclusions
• Q & A
• Appendix: Additional Data
4

ISO-NE PUBLIC ISO-NE PUBLIC
STATE OF THE GRID: KEY TAKEAWAYS
5

ISO-NE PUBLIC 6
State of the Grid 2018: Key Takeaways
• New England’s power grid is operating reliably and competitive markets are working, but challenges are looming
• Competitive wholesale markets: – Benefits
• Reliability: Market revenues are sufficient to retain and attract the resources needed
• Competitively priced, clean energy: Competition incentivizes efficiency
– Fewer emissions – Lower operating costs
• Investment risk: Private developers bear the impacts of poor decisions, not ratepayers
– Challenges • Fuel security: Constraints aren’t priced • Price formation: Resources with state
contracts have above-market revenue

ISO-NE PUBLIC
• Fuel security is the greatest challenge to continued power system reliability – 2017/2018 cold snap and the Operational
Fuel-Security Analysis – Taking action will be costly; inaction will
also come at a cost
• Transmission investments bring benefits
• ISO New England and stakeholders will build on the region’s history of strong collaboration
7
State of the Grid 2018: Key Takeaways (continued)

ISO-NE PUBLIC ISO-NE PUBLIC
STATE OF THE GRID: NEW ENGLAND’S POWER SYSTEM TODAY
8

ISO-NE PUBLIC
2017: Second-Lowest Energy Prices Since 2003 Competitive markets produce low prices when low-priced fuel can be delivered, and a robust transmission system provides access to the lowest-cost resources
12.1
5.9 7.3
6.7
5.2
8.0 9.1
5.9
4.1 4.5
1.5
1.8 1.6
1.3
1.2
1.0 1.1
1.1
1.2 2.2
$0
$2
$4
$6
$8
$10
$12
$14
$16
2008 2009 2010 2011 2012 2013 2014 2015 2016 2017*
Energy Market
Ancillary Markets
Forward Capacity Market
Annual Value of Wholesale Electricity Markets (in billions)
Source: 2016 Report of the Consumer Liaison Group; *2017 data is preliminary and subject to resettlement Note: Forward Capacity Market values shown are based on auctions held roughly three years prior to each calendar year.
9

ISO-NE PUBLIC 10
The Forward Capacity Market Is Attracting New Resources Amid Retirements

ISO-NE PUBLIC 11
Transmission Investments Improve Reliability $10 billion invested, reliability enhanced, congestion & reliability costs a fraction of former levels
ISO-NE PUBLIC
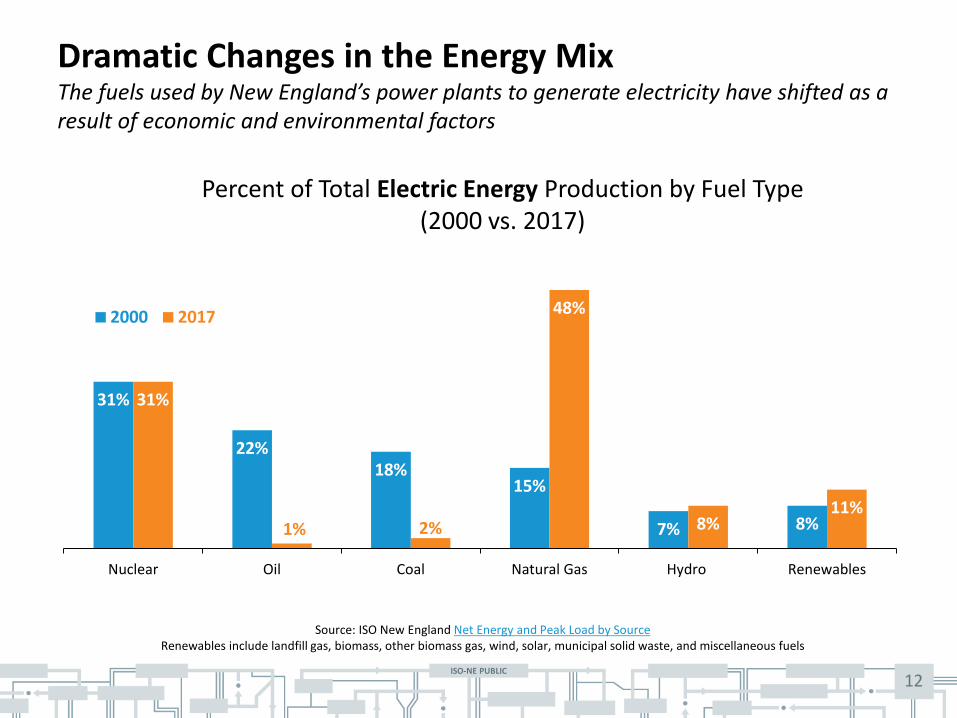
Dramatic Changes in the Energy Mix The fuels used by New England’s power plants to generate electricity have shifted as a result of economic and environmental factors
31%
22% 18%
15%
7% 8%
31%
1% 2%
48%
8% 11%
Nuclear Oil Coal Natural Gas Hydro Renewables
2000 2017
Percent of Total Electric Energy Production by Fuel Type (2000 vs. 2017)
Source: ISO New England Net Energy and Peak Load by Source Renewables include landfill gas, biomass, other biomass gas, wind, solar, municipal solid waste, and miscellaneous fuels
12

ISO-NE PUBLIC ISO-NE PUBLIC
STATE OF THE GRID: THE CHANGING GRID
13

ISO-NE PUBLIC 14
The Changing Grid: Natural Gas • Increased reliance on natural-gas-
fired generation – Growing use of natural gas for heating,
generation, and other purposes
• Primary fuel for 45% of capacity; alternate fuel for 11% more
• 48% of 2017 fuel mix
• Sets the real-time price more than 75% of the time
• 31% of proposed new generating capacity
Cumulative New Regional Generating Capacity
Note: New generating capacity for years 2016–2019 includes resources clearing in recent Forward Capacity Auctions.

ISO-NE PUBLIC 15
The Changing Grid: Retirements of Coal, Oil, and Nuclear Resources • 4,600 MW of coal, oil, & nuclear
resources have or will retire 2013-2021 – 16% of total generating capacity
• Oil- & coal-fired plants produced just 3% of NE’s generation in 2017, but still make up 26% of generating capacity
– Still needed when demand peaks or natural gas is in short supply or more costly
• Nuclear plants make up 14% of capacity, but produced 31% of NE’s generation
– Pilgrim (680 MW) will retire by 2019
• More than 5,000 MW of remaining coal- & oil-fired generation is at risk

ISO-NE PUBLIC 16
The Changing Grid: Wind, Solar, Energy Efficiency, & Energy Storage
Notes: Numbers are rounded. Not all proposed new projects are built;. 1 Nameplate capacity. 2 Nameplate capacity for proposed projects; summer seasonal claimed capability for existing units based on primary fuel type. Does not include oil units that can switch to natural gas. Sources: ISO New England, ISO-NE Generator Interconnection Queue (January 29, 2018), CELT Report (2010, 2016, 2017), Final 2017 ISO-NE Solar PV Forecast, and Final Energy-Efficiency Forecast Report for 2021 to 2026, and Seasonal Claimed Capability Monthly Report (January 2018)

ISO-NE PUBLIC 17
The Changing Grid: Wind More than half of the proposed new projects in the region are wind
• Onshore wind has grown from 375 MW in 2011 to more than 1,300 MW today
• 8,600 MW is proposed (half onshore, half offshore)
Wind Project Proposals in New England

ISO-NE PUBLIC
40
2,400
5,750
0
1,000
2,000
3,000
4,000
5,000
6,000
7,000
Jan. 2010 Thru 2017 2027*
Meg
awat
ts (M
W)
Cumulative Growth in Solar PV through 2027 (MWac)
18
The Changing Grid: Solar PV
Note: The bar chart reflects the ISO’s projections for nameplate capacity from PV resources participating in the region’s wholesale electricity markets, as well as those connected “behind the meter.” *Source: Draft 2018 PV Forecast (February 2018); MW values are AC nameplate.
State Installed Capacity (MWac)
No. of Installations
Connecticut 365.6 29,512
Massachusetts 1,602.3 78,047
Maine 33.5 3,598
New Hampshire 69.7 7,330
Rhode Island 62.2 4,148
Vermont 257.2 9,773
New England 2,390.5 132,408
December 2017 Solar PV Installed Capacity (MWac)

ISO-NE PUBLIC
• Battery storage projects totaling more than 400 MW of capacity have requested interconnection to the regional power system – Currently 20 MW of battery
storage on the system
• New England has benefited from grid-scale electrical energy storage capabilities for more than 40 years • Two pumped-storage facilities built
in the 1970s can supply 1,800 MW within 10 minutes, for up to seven hours
19
The Changing Grid: Energy Storage

ISO-NE PUBLIC
The Changing Grid: Energy Efficiency, PV, Annual Usage and Peak Demand
Note: Summer peak demand is based on the “90/10” forecast, which accounts for the possibility of extreme summer weather (temperatures of about 94⁰ F). Source: Final 2017 Solar PV Forecast (April 2017) and Final ISO New England Energy-Efficiency Forecast 2021-2026 (May 2017)
115,000
120,000
125,000
130,000
135,000
140,000
145,000
150,000
155,000
Gross load
Minus PV, EE
Minus PV
Annual Energy Use (GWh) With and Without EE and PV Savings
28,000
29,000
30,000
31,000
32,000
33,000
34,000
35,000
Gross peak
Minus PV, EE
Minus PV
Summer Peak Demand (MW) With and Without EE and PV Savings
The gross peak and load forecast The gross peak and load forecast minus forecasted “behind-the-meter” (BTM) solar PV resources
The gross peak and load forecast minus forecasted BTM solar PV, minus energy-efficiency (EE) resources in the Forward Capacity Market 2017-2020 and forecasted EE 2021-2026
20
ISO-NE PUBLIC 21
The Changing Grid: Decarbonization
• New England states have decarbonization goals
• Decarbonization of transportation and heating could impact the grid
• Increased adoption of electric vehicles (EVs) across the region and greater use of electric heating could increase demand for power
• The ISO plans to start working this year with regional stakeholders to quantify the impact of the states’ decarbonization policies on long-term demand

ISO-NE PUBLIC ISO-NE PUBLIC
STATE OF THE GRID: FUEL SECURITY – 2017/2018 ARCTIC COLD SPELL
22

ISO-NE PUBLIC 23
Shifting Fuel Mix Before and During the Two-Week Outbreak of Arctic Cold
NG/LNG 46%
Wind 3%
Coal 2%
Nuclear 35%
Renewables 7%
Hydro 7%
Oil 0.29%
BEFORE 12/1 thru 12/25/2017
NG/LNG
Wind
Coal
Nuclear
Renewable
Hydro
Oil
NG/LNG 24%
Wind 4%
Coal 6% Nuclear
27% Renewables
6%
Hydro 6%
Oil 27%
DURING 12/26/17 thru 1/8/2018

ISO-NE PUBLIC
Fuel Oil Inventories Declined Rapidly in Two Weeks December 1, 2017, to January 9, 2018
24
This chart is the ISO’s best approximation of usable oil ,discounting unit outages, reductions, or emissions
68%
51%
43% 41% 37%
34%
19% 19%
12/1/2017 1/1/2018 1/4/2018 1/5/2018 1/6/2018 1/7/2018 1/8/2018 1/9/20180%
10%
20%
30%
40%
50%
60%
70%
80%
90%
100%
0
1,000,000
2,000,000
3,000,000
4,000,000
5,000,000
6,000,000
Perc
enta
ge o
f Max
imum
Ava
ilabl
e
Usa
ble
Fuel
Oil
- Bar
rels
Survey Date
Maximum Capacity Available Usable Fuel Oil % of Maximum Available

ISO-NE PUBLIC
Generator Oil Burn: Two Weeks vs Twelve Months NE generators burned 2 million barrels of oil in 2 weeks—more than twice the amount of oil used in all of 2016
25
0
500,000
1,000,000
1,500,000
2,000,000
2,500,000
2016 1/1/17 to 12/25/17 12/26/17 to 1/9/18
Barr
els o
f Oil

ISO-NE PUBLIC
Natural Gas Prices Outside New England, In New England, and Wholesale Power Prices
26
$78.35
$3.61
$287.85
$0
$40
$80
$120
$160
$200
$240
$280
$320
$360
$400
$0
$10
$20
$30
$40
$50
$60
$70
$80
$90
$100
LMP
$/M
Wh
Nat
ural
Gas
$/M
MBt
u
Mass. Natural Gas, Marcellus Shale Gas, and Electricity Prices (December 1, 2017 – January 8, 2018)
Avg MA Natural Gas Marcellus RT Power
Underlying natural gas data furnished by:

ISO-NE PUBLIC 27
Two-Week Cold Spell: Nearly $1 Billion in Total Market Cost
$348 M
$798 M
$292 M
$201 M $243 M
$992 M
$0
$200,000,000
$400,000,000
$600,000,000
$800,000,000
$1,000,000,000
$1,200,000,000
Energy Market Value, December 26 - January 8 (2012/2013 – 2017/2018)

ISO-NE PUBLIC ISO-NE PUBLIC
STATE OF THE GRID: FUEL SECURITY – OPERATIONAL FUEL-SECURITY ANALYSIS
28

ISO-NE PUBLIC 29
Fuel Security
• Based on the ISO’s experiences during winter as the grid operator, as well as long-standing trends, the ISO conducted a fuel-security analysis
• Ensuring adequate fuel for the region’s generators is New England’s most pressing challenge
• December 2017-January 2018 cold outbreak reinforced fuel security concerns

ISO-NE PUBLIC 30
Operational Fuel-Security Analysis • Conducted to improve the ISO’s and the
region’s understanding of risks to reliable operations
• Analyzed 23 possible resource combinations and outage scenarios in winter 2024/2025
• Measured number and duration of energy shortfalls that would require emergency procedures, including rolling blackouts
• Accounted for growth in EE and PV; assumed no additional natural gas pipeline capacity to serve generators would be added

ISO-NE PUBLIC
Operational Fuel-Security Analysis: Load Shedding Required in 19 of 23 Scenarios
31

ISO-NE PUBLIC 32
Operational Fuel-Security Analysis: Findings Suggest Six Major Conclusions for Winter 2024/25
• Outages: The region is vulnerable to the season-long outage of any of several major energy facilities.
• Stored fuels: Power system reliability is heavily dependent on LNG and electricity imports; more dual-fuel capability is also a key reliability factor, but permitting for construction and emissions is difficult.
• Logistics: Timely availability of fuel is critical, highlighting the importance of fuel-delivery logistics.
• Risk trends: All but four scenarios result in fuel shortages requiring load shedding, indicating current trends may intensify fuel-security risk.
• Renewables: More renewable resources can help lessen fuel-security risk but are likely to drive coal- and oil-fired generator retirements, requiring higher LNG imports to counteract the loss of stored fuels.
• Positive outcomes: Higher levels of LNG, imports, and renewables can minimize system stress and maintain reliability; delivery assurances as well as transmission expansion will be needed.

ISO-NE PUBLIC ISO-NE PUBLIC
STATE OF THE GRID: SETTING THE STAGE FOR THE FUTURE
33

ISO-NE PUBLIC 34
Goal is to Maintain Markets that are Competitive States have clean-energy goals and requirements
• Above-market contracts for renewables offset their costs, so these resources can sell at artificially low prices in the capacity market
• Existing and new, non-state-sponsored resources needed for reliability are put at a disadvantage – Any resource without an above-market contract
• Competitive capacity pricing is essential to retain existing non-sponsored resources and attract investment in new non-subsidized new resources when needed

ISO-NE PUBLIC
• CASPR coordinates retirements of existing resources & entry of new, sponsored resources through the capacity market – Retiring resources get paid – Sponsored resources get capacity payments
• CASPR will: – Maintain competitive prices in the capacity market – Maintain resource adequacy while helping states
achieve their clean-energy goals – Enable state-sponsored (clean energy) resources to
receive capacity payments – Maintain certainty for the market and attract
investment when resources are needed
35
ISO Proposal: Competitive Auctions for Sponsored Policy Resources (CASPR)

ISO-NE PUBLIC 36
Other Major Market Initiatives in 2018
• FCM “pay-for-performance” incentives go into effect beginning June 1, 2018 – Rewards resources that make investments to improve performance during
periods of system stress; resources that don’t perform will forfeit a portion of capacity payments
• Demand-response resource integration begins June 1, 2018 – ISO New England will become the first US grid operator to incorporate
demand resources into the daily energy dispatch and reserves process, comparable to generators’ participation
• Demand-response resources have been able to participate in the capacity market from the beginning
• The ability of new technologies to participate in the markets expands further – Advanced storage technologies already participate in the regulation
market; later this year, emerging energy-storage technologies can also participate as dispatchable resources in the energy market

ISO-NE PUBLIC ISO-NE PUBLIC
STATE OF THE GRID: KEY TAKEAWAYS
37

ISO-NE PUBLIC 38
Today’s Key Takeaways
Markets must evolve to accommodate states’ clean-energy goals and address fuel-security risks
ISO New England & industry stakeholders have a history of working together to solve complex challenges.
Competitive markets work.
Fuel security poses risks for reliability.
Transmission investment pays dividends.
ISO-NE PUBLIC
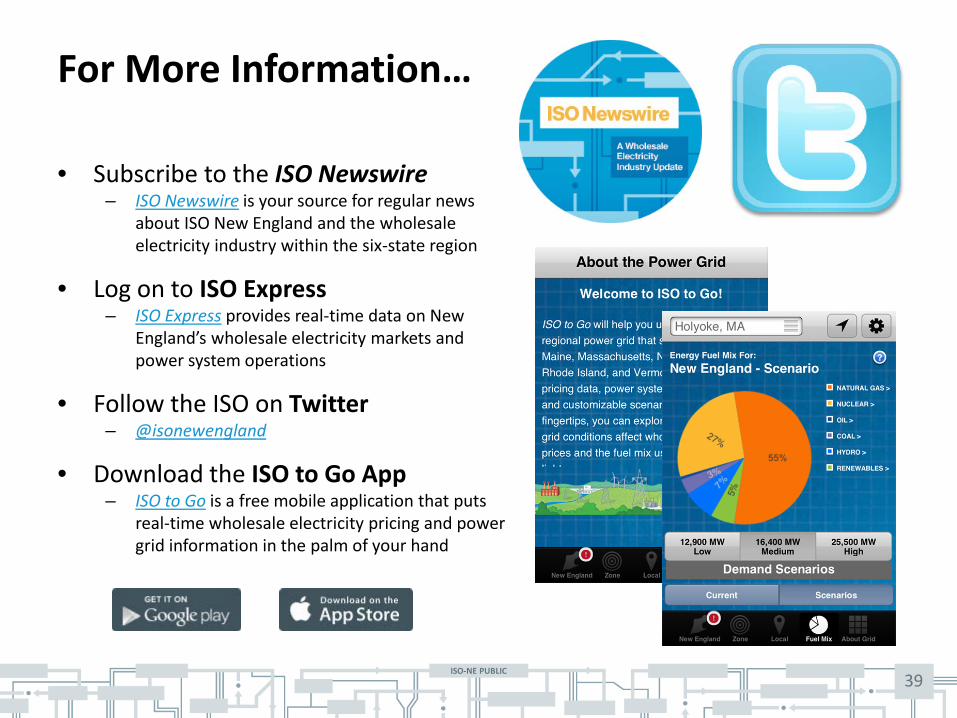
• Subscribe to the ISO Newswire – ISO Newswire is your source for regular news
about ISO New England and the wholesale electricity industry within the six-state region
• Log on to ISO Express – ISO Express provides real-time data on New
England’s wholesale electricity markets and power system operations
• Follow the ISO on Twitter – @isonewengland
• Download the ISO to Go App – ISO to Go is a free mobile application that puts
real-time wholesale electricity pricing and power grid information in the palm of your hand
For More Information…
39

ISO-NE PUBLIC ISO-NE PUBLIC
APPENDIX: ADDITIONAL DATA
40

ISO-NE PUBLIC
Peak Demand and Overall Electricity Use Energy efficiency and behind-the-meter solar are having an impact
• 7.2 million retail electricity customers drive the demand for electricity in New England (14.8 million people)
• Region’s all-time summer peak demand set on August 2, 2006 at 28,130 MW
• Region’s all-time winter peak demand set on January 15, 2004 at 22,818 MW
• The annual growth rates for summer peak demand and overall electricity use are 0.1% and -0.6%, respectively, when energy efficiency and behind-the-meter solar are factored into the forecast
41
Note: Without energy efficiency and solar, the region’s peak demand is forecasted to grow 1% annually and the region’s overall electricity demand is forecasted to grow 0.9% annually. Summer peak demand is based on the “90/10” forecast for extreme summer weather.

ISO-NE PUBLIC
A Range of Generation and Demand Resources Are Used to Meet New England’s Energy Needs
• 350 generators in the region
• 29,200 MW of generating capacity
• 14,800 MW of proposed generation in the ISO Queue
– Mostly wind and natural gas
• 4,600 MW of generation has retired or will retire in the next few years
• 400 MW of active demand response and 2,300 MW of energy efficiency with Capacity Supply Obligations in the Forward Capacity Market (FCM)*
29,200
2,700
14,800
0
5,000
10,000
15,000
20,000
25,000
30,000
35,000
ExistingGeneration
Existing DemandResources
ProposedGeneration
Existing and Proposed Resources (MW)
42
* In the FCM, demand-reduction resources are treated as capacity resources.

ISO-NE PUBLIC
New England’s Transmission Grid Is the Interstate Highway System for Electricity
• 9,000 miles of high-voltage transmission lines (115 kV and above)
• 13 transmission interconnections to power systems in New York and Eastern Canada
• 17% of region’s energy needs met by imports in 2017
• $10 billion invested to strengthen transmission system reliability since 2002; $2.3 billion planned
• Developers have proposed multiple transmission projects to access non-carbon-emitting resources inside and outside the region
New Brunswick
Hydro Québec
New York
43

ISO-NE PUBLIC
Elec
tric
Ene
rgy
$/M
Wh
Fuel $/MM
Btu
Monthly Average Natural Gas and Wholesale Electricity Prices in New England
44
Natural Gas and Wholesale Electricity Prices Are Linked Competitive markets use the lowest-priced resources to meet demand
$0
$5
$10
$15
$20
$25
$30
$0
$20
$40
$60
$80
$100
$120
$140
$160
$180
Wholesale electricity Natural gas
Hurricanes hit the Gulf
Before the Recession and
Marcellus Shale gas boom
Winter 2012/2013
Winter 2013/2014
Winter 2014/2015
Underlying natural gas data furnished by:

ISO-NE PUBLIC
Forward Capacity Market: Changes in Supply and Performance Rules Drive Prices
1,772
4,755 5,031
5,374
3,718
2,853 3,252
-143 506
1,416 1,760
1,103
$4.50
$3.60 $2.95 $2.95 $3.21 $3.42 $3.15*
$7.025*
$9.55*
$7.03
$5.30 $4.63
$0
$2
$4
$6
$8
$10
-1,000
0
1,000
2,000
3,000
4,000
5,000
6,000
1 2 3 4 5 6 7 8 9 10 11 12*
Capacity Surplus or Deficit (MW) Against Auction Clearing Prices ($/kWh-month)
Negotiated Ceiling and Floor Prices (per settlement)
Prices cleared at the floor price in the first seven auctions due to excess capacity; resources were paid a slightly lower prorated price. FCA 7 clearing price in NEMA/Boston was $14.999/kW-month (new capacity received $14.999/kW-month & existing capacity received an administrative price of $6.66/kW-month). FCA 8 clearing price was $15.00/kW-month (new capacity in all zones & existing capacity in NEMA/Boston received $15.00/kW-month & existing capacity in all other zones received an administrative price of $7.025/kW-month). FCA 9 clearing price was $9.55/kW-month, except in SEMA/RI where administrative pricing rules were triggered due to inadequate supply (new capacity in the zone will receive the auction starting price of $17.73/kW-month & existing capacity in the zone will receive an administratively set price of $11.08/kW-month). *FCA 12 data are preliminary
MW
of E
xces
s Cap
acity
Per
Auc
tion
Auc
tion
Clea
ring
Pric
e in
$/k
W-m
onth
Floor Price Removed
Demand Curve and Pay-For-Performance
3,135 MW of capacity
submitted Non-Price
Retirement requests for FCA 8
Auction
45

ISO-NE PUBLIC
Dramatic Changes in the Region’s Power Plant Fleet The resources making up the region’s installed generating capacity are trending away from nuclear, oil, and coal to natural gas and renewables
18%
34%
12%
18% 14%
5%
14%
23%
3%
45%
11% 5%
Nuclear Oil Coal Natural Gas Hydro Renewables
2000 2017
Percent of Total System Capacity by Fuel Type (2000 vs. 2017)
Source: 2017 CELT Report, Summer Seasonal Claimed Capability (SCC) Capacity Renewables include landfill gas, biomass, other biomass gas, wind, solar, municipal solid waste, and miscellaneous fuels
46

ISO-NE PUBLIC
Power Plant Emissions Have Declined with Changes in the Fuel Mix
Year NOx SO2 CO2
2001 59.73 200.01 52,991
2016 16.27 4.47 37,467
% Reduction, 2001–2016 73% 98% 29%
Year NOx SO2 CO2
1999 1.36 4.52 1,009
2016 0.31 0.08 710
% Reduction, 1999–2016 77% 98% 30%
Source: 2016 ISO New England Electric Generator Air Emissions Report, December 2017
Reduction in Aggregate Emissions (kilotons per year)
Reduction in Average Emission Rates (pounds per megawatt-hour)
47

ISO-NE PUBLIC 48
States Are Sponsoring Clean Energy Development to Meet Their Legislative and Regulatory Goals
• Most renewable power resources are still relatively expensive to build
• States provide above-market revenues through mechanisms such as long-term contracts
State(s) Recent State Resource
Procurement Initiatives Expected Resources
Target MW (nameplate*)
MA, CT, RI
2016 Multi-State Clean Energy RFP Solar, wind 460
MA 2016 Energy Diversity Act
Clean energy, incl. hydro import Approx. 1200
MA 2016 Energy Diversity Act Off-Shore Wind Up to 1600
*Note: Nameplate MW may be higher than qualified FCM capacity MW

ISO-NE PUBLIC 49
Tuesday, January 7, 2014
High PV penetrations will increase the need
for ramping capability
throughout sunlight hours
PV does not reduce winter peak
Deep Load Reductions During Winter Daylight Hours Result in Steep Ramp Into the Evening Peak

ISO-NE PUBLIC
• Forecasting Long-Term Solar Growth – The ISO tracks historical growth and predicts levels of solar
development 10 years into the future – The solar forecast is used in transmission planning and market
needs assessments
• Forecasting Short-Term Solar Performance – The ISO creates daily forecasts of solar
generation production to improve daily load forecasts and situational awareness for grid operators
• Improving Interconnection Rules – The ISO is engaged with industry stakeholders
to strengthen interconnection standards and reduce reliability concerns
50
The ISO Is Leading Efforts to Account for Solar Resources Connected to the Distribution System

ISO-NE PUBLIC
• Flexibility to Offer Negative Prices
– Allows generators, like wind, the opportunity to operate during low-load conditions when they otherwise might be curtailed
• Updated Elective Transmission Upgrade (ETU) Rules
– Improve the interconnection study process for ETUs and ensure these resources are able to deliver capacity and energy into the wholesale electricity markets
• Flexibility to Operate Up to a Certain Level
– Allows the ISO to better manage transmission congestion in a way that will maximize the use of low-cost renewable resources and alleviate the need for curtailments
• Known as “Do-not-Exceed Dispatch Order”
51
ISO New England Has Enhanced the Ability of Intermittent Resources to Participate in the Markets

ISO-NE PUBLIC 52
• Developers are proposing 20+ elective transmission upgrades (ETUs) to help deliver 16,500+ MW of clean energy
– Projects seek to address public policy goals, not reliability needs
• Massachusetts plans to contract for 1,600 MW of offshore wind by 2027 and 1,200 MW of clean energy by 2022
– Clean energy contracts would be mostly Canadian hydro and/or onshore wind from northern New England
• Canadian hydro and wind can offset the need for natural gas; but demand in Canada peaks in winter, so contracts will have to ensure Canadian hydro energy will be available for New England in winter
Map is representative of the types of projects announced for the region in recent years
Source: ISO Interconnection Queue (January 2018)
The Changing Grid: Elective Transmission

ISO-NE PUBLIC 1
Operational Fuel-Security Analysis: 5 Key Fuel Variables 23 resource combinations modeled in winter 2024-2025
Retirements of coal- and oil-fired generators
Imports of electricity over transmission lines from New York and Canada
Oil tank inventories (how often on-site oil tanks at dual-fuel power plants are filled during winter)
Level of liquefied natural gas (LNG) injections into the region’s natural gas delivery and storage infrastructure
Level of renewable resources on the system
![ISO 9001 - 2008 Checklist - Quality Web Based · PDF fileISO 9001- 2008 Checklist? )? ] equipment -6 to ()? ) www](https://static.fdocuments.in/doc/165x107/5a7ab1817f8b9a66798b745d/iso-9001-2008-checklist-quality-web-based-9001-2008-checklist-equipment.jpg)