Research Article Vibration Signal Forecasting on Rotating ...
Journal of Electrical Engineering 5 (2017) 84-99 doi: 10.17265/2328-2223/2017.02.004
State of the Art Vibration Analysis of Electrical Rotating
Machines
Israr Ullah1, Naeem Arbab1 and Waheed Gul2
1. Department of Electrical Engineering, University of Engineering and Technology, Peshawar 25000, Pakistan
2. Department of Mechanical Technology, University of Technology, Nowshera 24110, Pakistan
Abstract: Electrical machines are precarious mechanisms in manufacturing practices. A motor failure may yield an unexpected interruption at the industrial plant, with consequences in costs, product quality, and security. To govern the conditions of each part of motor, various testing and monitoring methods have been developed. In this paper, a review on effective fault indicators and vibration based condition monitoring approaches of rotating electrical machines has been accomplished. The determination of the review is to progress the understanding of vibration based analysis, and its use in the Machine Health Monitoring. A variety of analysis was identified to highlight the concept of predictive maintenance in industries. The techniques of vibration analysis were investigated to detect both healthy and fault related signals of rotating machineries. Key words: Machine health monitoring, vibration analysis, time domain, frequency domain.
1. Introduction
Vibration monitoring of electrical machines is one
of the stimulating tasks for researchers essentially in
manufacturing units. There are numerous condition
monitoring approaches, containing Vibration
monitoring, thermal monitoring, chemical monitoring
and acoustic emission monitoring [1]. Vibration
monitoring is accompanied to support in the
assessment of the well-being of the machine
throughout nonstop operation. It has been revealed
several times over that the vibration signature of a
working machine should be responsible for additional
statistics about the inner mechanisms of the machine
than any other sort of non-destructive test. A bearing
that has a minor emerging defect will cause a
betraying change in the machine vibration, as well an
imbalance condition, a misalignment, or any of an
innumerable of additional faults. Vibration analysis
accurately applied to Predictive Maintenance, permits
the technician to identify trivial emerging mechanical
flaws extended before they become a risk to the
Corresponding author: Israr Ullah, research scholar,
research field: machine health monitoring.
reliability of the machine, and thus delivers the
essential lead-time to calendar maintenance to
ensemble the requirements of the plant supervision. In
this way, plant supervision has governed over the
machines, relatively than the other way everywhere.
Vibration measurement and analysis is the foundation
of Predictive Maintenance, which stances in shrill
disparity to the ancient “run-to-failure” type of
maintenance practice. Copious studies, such as those
accompanied by the EPRI (Electric Power Research
Institute), have presented that on usual, the cost to
industry for maintenance will be condensed by more
than 50% if a predictive maintenance package is used
as a replacement for of run-to-failure [2].
The practice of vibration analysis as one of the
major tackles for condition monitoring has been
industrialized comprehensively over a period of just
about 35 years. With the corresponding expansions in
electronic equipment, transducers, computers and
software currently machine management is nearly
entirely mechanized. From 1960 to the mid-1970s
simple concrete approaches were used, along with
cautious guard on the machine’s performance, often
D DAVID PUBLISHING
State of the Art Vibration Analysis of Electrical Rotating Machines
85
armored by recurrent maintenance. Fundamental tools
were occasionally used to quota and record the values
on which letdown detection and clinched maintenance
verdicts were based. Though nearly digital tools were
accessible during the early 1970s, momentous
expansions took place for the duration of the late
1970s and the early 1980s due to the accessibility of
new microprocessors [3]. Circuits could be shrunken,
plummeting the proportions and weight of apparatuses
and permissible data to be fingered at high speeds.
Onboard microprocessors gave instruments the
capability to seizure data, examine it via suitable
algorithms, then stock and display the information. A
very substantial feature of frequency analysis was
effective computation of the FFT
(Fast-Fourier-Transformation) of multi-channel
measurements within seconds correspondingly
minutes and the capability to store data for further
conclusions. Long-term data storage became a
putative practice. From the mid-1980s forward the
expansions have been related with the desktop
computer, its interfaced apparatus and software, which
permit the entire process and the real machine
condition to be examined automatically, giving a
comprehensive provision for measurement, analysis
and problem diagnosis trailed by action or
maintenance approaches. The 1990s are considered by
lessening the instrumentation and the data acquisitions
and data process units. Sensors systems are joined
with electronic data pre-processing and multi-sensor
agreement allow not only accentuating on single
machine mechanisms, the entire plant with the
connections and enslavements of all procedures
become translucent, though vibration analysis was
used previous essentially to govern faults and perilous
operation circumstances. At the present time the
anxieties for condition monitoring and vibration
analysis are no more inadequate annoying to curtail
the penalties of machine failures, but to exploit current
resources more efficiently.
To stare at an electrical signal, we use an
oscilloscope to realize how the signal varies with time.
This is very significant information; yet, it does not
provide us the full image. To, fully recognize the
performance of a scheme or device, we also want to
investigate the signal in the frequency domain. This is
a graphical illustration of the signal’s amplitude as a
function of frequency. The spectrum analyzer is to the
frequency domain as the oscilloscope is to the time
domain. The amplitude of the frequency at the
machines running rpm and its different harmonics is
patterned. Any amplitude beyond a threshold value
clues toward a particular fault. The diagnosis of fault
before a major break takes place is the aim of
preventive maintenance. In addition to frequency
domain analysis, the spectrum analyzer has the
capability to accomplish time domain analysis by the
statistical time values and their tendency of settings
and, spectrum analysis to enumerate periodical
information of spectral data [4].
2. Vibration Monitoring
All electrical machines produce noise and vibration,
and the analysis of the generated noise and vibration
can be used to give statistics on the condition of
machine. Even very minor amplitude of vibration of
machine frame can generate high noise. The vibration
of electrical machines is consummated through the use
of broad-band, narrow-band or signature analysis of
the calculated vibration energy of the machine.
Monitoring of vibration based judgement is the best
technique for fault diagnoses.
Use of fiber optics based sensors approach in Refs.
[4, 5] for different types of vibration signals
monitoring is found relatively cost effective. Also it
provides an easy way of measuring vibration signals
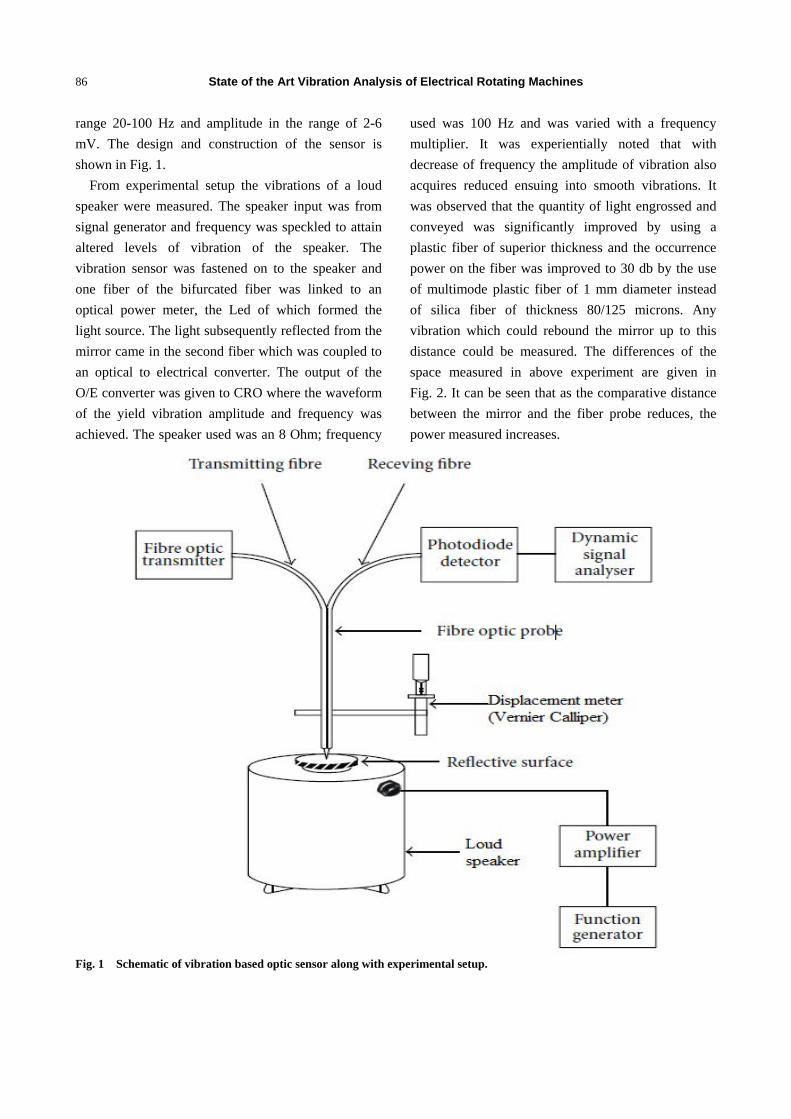
up to some extent. Neha and Sakshi [4] carried out an
innovative fiber optic vibration sensor for health
monitoring of electrical machines, which operates
with comparatively unpretentious technologies and
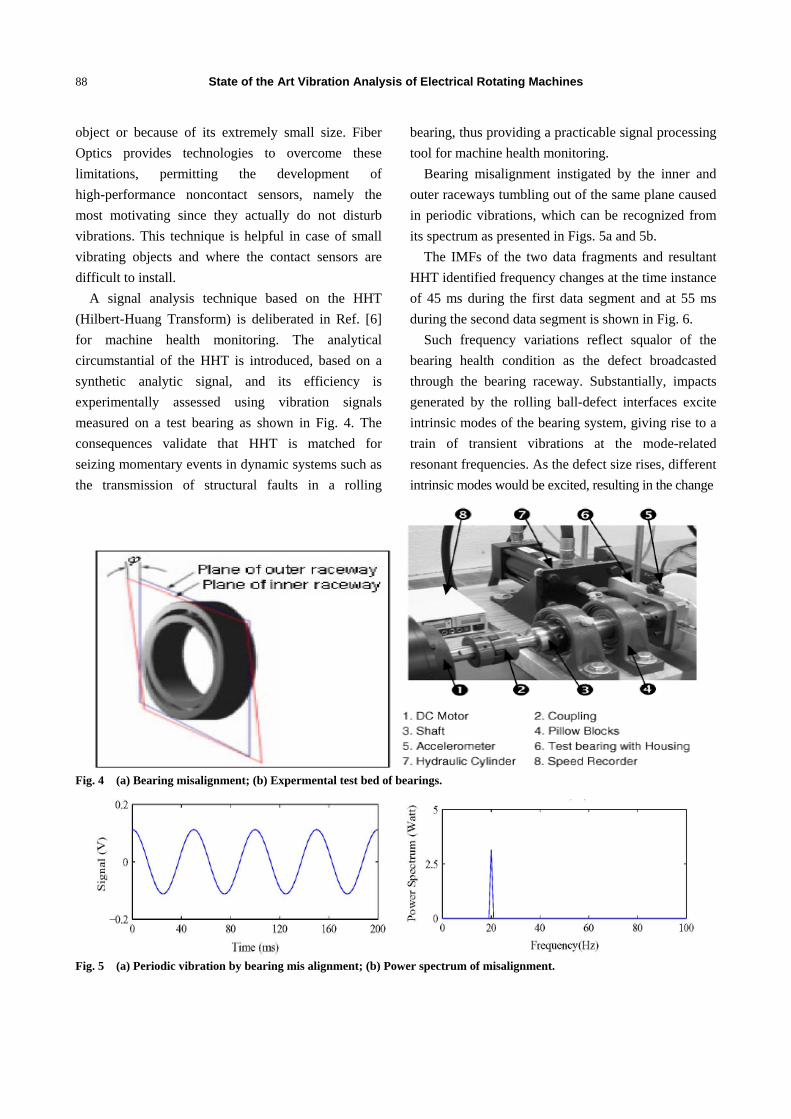
offers reasonable costs. The sensor is enhanced for
revealing of mechanical vibrations in the frequency
State of the Art Vibration Analysis of Electrical Rotating Machines
86
range 20-100 Hz and amplitude in the range of 2-6
mV. The design and construction of the sensor is
shown in Fig. 1.
From experimental setup the vibrations of a loud
speaker were measured. The speaker input was from
signal generator and frequency was speckled to attain
altered levels of vibration of the speaker. The
vibration sensor was fastened on to the speaker and
one fiber of the bifurcated fiber was linked to an
optical power meter, the Led of which formed the
light source. The light subsequently reflected from the
mirror came in the second fiber which was coupled to
an optical to electrical converter. The output of the
O/E converter was given to CRO where the waveform
of the yield vibration amplitude and frequency was
achieved. The speaker used was an 8 Ohm; frequency
used was 100 Hz and was varied with a frequency
multiplier. It was experientially noted that with
decrease of frequency the amplitude of vibration also
acquires reduced ensuing into smooth vibrations. It
was observed that the quantity of light engrossed and
conveyed was significantly improved by using a
plastic fiber of superior thickness and the occurrence
power on the fiber was improved to 30 db by the use
of multimode plastic fiber of 1 mm diameter instead
of silica fiber of thickness 80/125 microns. Any
vibration which could rebound the mirror up to this
distance could be measured. The differences of the
space measured in above experiment are given in
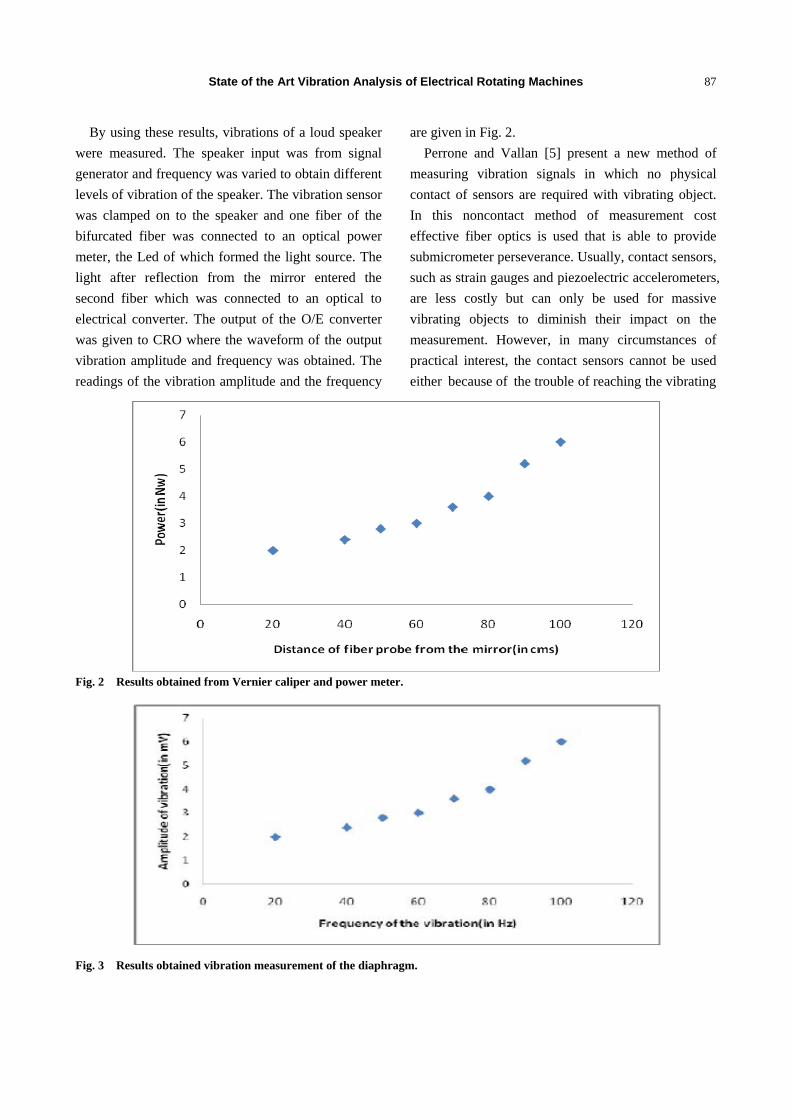
Fig. 2. It can be seen that as the comparative distance
between the mirror and the fiber probe reduces, the
power measured increases.
Fig. 1 Schematic of vibration based optic sensor along with experimental setup.
State of the Art Vibration Analysis of Electrical Rotating Machines
87
By using these results, vibrations of a loud speaker
were measured. The speaker input was from signal
generator and frequency was varied to obtain different
levels of vibration of the speaker. The vibration sensor
was clamped on to the speaker and one fiber of the
bifurcated fiber was connected to an optical power
meter, the Led of which formed the light source. The
light after reflection from the mirror entered the
second fiber which was connected to an optical to
electrical converter. The output of the O/E converter
was given to CRO where the waveform of the output
vibration amplitude and frequency was obtained. The
readings of the vibration amplitude and the frequency
are given in Fig. 2.
Perrone and Vallan [5] present a new method of
measuring vibration signals in which no physical
contact of sensors are required with vibrating object.
In this noncontact method of measurement cost
effective fiber optics is used that is able to provide
submicrometer perseverance. Usually, contact sensors,
such as strain gauges and piezoelectric accelerometers,
are less costly but can only be used for massive
vibrating objects to diminish their impact on the
measurement. However, in many circumstances of
practical interest, the contact sensors cannot be used
either because of the trouble of reaching the vibrating
Fig. 2 Results obtained from Vernier caliper and power meter.
Fig. 3 Results obtained vibration measurement of the diaphragm.
State of the Art Vibration Analysis of Electrical Rotating Machines
88
object or because of its extremely small size. Fiber
Optics provides technologies to overcome these
limitations, permitting the development of
high-performance noncontact sensors, namely the
most motivating since they actually do not disturb
vibrations. This technique is helpful in case of small
vibrating objects and where the contact sensors are
difficult to install.
A signal analysis technique based on the HHT
(Hilbert-Huang Transform) is deliberated in Ref. [6]
for machine health monitoring. The analytical
circumstantial of the HHT is introduced, based on a
synthetic analytic signal, and its efficiency is
experimentally assessed using vibration signals
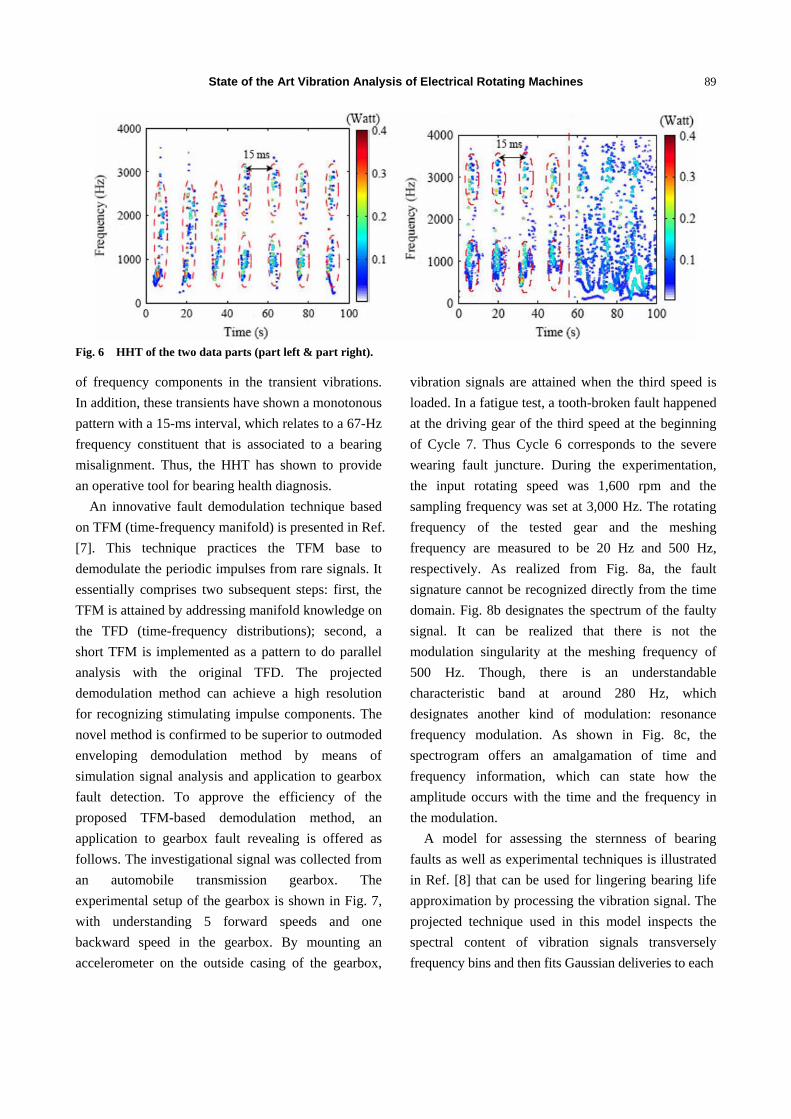
measured on a test bearing as shown in Fig. 4. The
consequences validate that HHT is matched for
seizing momentary events in dynamic systems such as
the transmission of structural faults in a rolling
bearing, thus providing a practicable signal processing
tool for machine health monitoring.
Bearing misalignment instigated by the inner and
outer raceways tumbling out of the same plane caused
in periodic vibrations, which can be recognized from
its spectrum as presented in Figs. 5a and 5b.
The IMFs of the two data fragments and resultant
HHT identified frequency changes at the time instance
of 45 ms during the first data segment and at 55 ms
during the second data segment is shown in Fig. 6.
Such frequency variations reflect squalor of the
bearing health condition as the defect broadcasted
through the bearing raceway. Substantially, impacts
generated by the rolling ball-defect interfaces excite
intrinsic modes of the bearing system, giving rise to a
train of transient vibrations at the mode-related
resonant frequencies. As the defect size rises, different
intrinsic modes would be excited, resulting in the change
Fig. 4 (a) Bearing misalignment; (b) Expermental test bed of bearings.
Fig. 5 (a) Periodic vibration by bearing mis alignment; (b) Power spectrum of misalignment.
State of the Art Vibration Analysis of Electrical Rotating Machines
89
Fig. 6 HHT of the two data parts (part left & part right).
of frequency components in the transient vibrations.
In addition, these transients have shown a monotonous
pattern with a 15-ms interval, which relates to a 67-Hz
frequency constituent that is associated to a bearing
misalignment. Thus, the HHT has shown to provide
an operative tool for bearing health diagnosis.
An innovative fault demodulation technique based
on TFM (time-frequency manifold) is presented in Ref.
[7]. This technique practices the TFM base to
demodulate the periodic impulses from rare signals. It
essentially comprises two subsequent steps: first, the
TFM is attained by addressing manifold knowledge on
the TFD (time-frequency distributions); second, a
short TFM is implemented as a pattern to do parallel
analysis with the original TFD. The projected
demodulation method can achieve a high resolution
for recognizing stimulating impulse components. The
novel method is confirmed to be superior to outmoded
enveloping demodulation method by means of
simulation signal analysis and application to gearbox
fault detection. To approve the efficiency of the
proposed TFM-based demodulation method, an
application to gearbox fault revealing is offered as
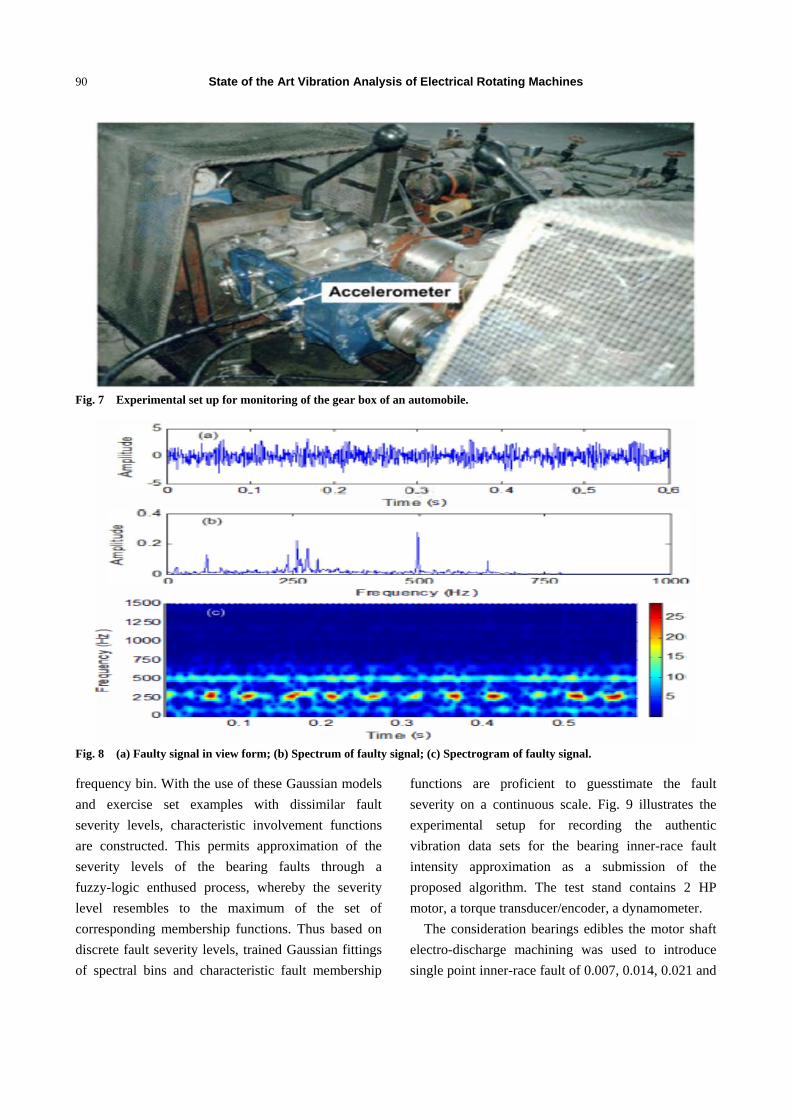
follows. The investigational signal was collected from
an automobile transmission gearbox. The
experimental setup of the gearbox is shown in Fig. 7,
with understanding 5 forward speeds and one
backward speed in the gearbox. By mounting an
accelerometer on the outside casing of the gearbox,
vibration signals are attained when the third speed is
loaded. In a fatigue test, a tooth-broken fault happened
at the driving gear of the third speed at the beginning
of Cycle 7. Thus Cycle 6 corresponds to the severe
wearing fault juncture. During the experimentation,
the input rotating speed was 1,600 rpm and the
sampling frequency was set at 3,000 Hz. The rotating
frequency of the tested gear and the meshing
frequency are measured to be 20 Hz and 500 Hz,
respectively. As realized from Fig. 8a, the fault
signature cannot be recognized directly from the time
domain. Fig. 8b designates the spectrum of the faulty
signal. It can be realized that there is not the
modulation singularity at the meshing frequency of
500 Hz. Though, there is an understandable
characteristic band at around 280 Hz, which
designates another kind of modulation: resonance
frequency modulation. As shown in Fig. 8c, the
spectrogram offers an amalgamation of time and
frequency information, which can state how the
amplitude occurs with the time and the frequency in
the modulation.
A model for assessing the sternness of bearing
faults as well as experimental techniques is illustrated
in Ref. [8] that can be used for lingering bearing life
approximation by processing the vibration signal. The
projected technique used in this model inspects the
spectral content of vibration signals transversely
frequency bins and then fits Gaussian deliveries to each
State of the Art Vibration Analysis of Electrical Rotating Machines
90
Fig. 7 Experimental set up for monitoring of the gear box of an automobile.
Fig. 8 (a) Faulty signal in view form; (b) Spectrum of faulty signal; (c) Spectrogram of faulty signal.
frequency bin. With the use of these Gaussian models
and exercise set examples with dissimilar fault
severity levels, characteristic involvement functions
are constructed. This permits approximation of the
severity levels of the bearing faults through a
fuzzy-logic enthused process, whereby the severity
level resembles to the maximum of the set of
corresponding membership functions. Thus based on
discrete fault severity levels, trained Gaussian fittings
of spectral bins and characteristic fault membership
functions are proficient to guesstimate the fault
severity on a continuous scale. Fig. 9 illustrates the
experimental setup for recording the authentic
vibration data sets for the bearing inner-race fault
intensity approximation as a submission of the
proposed algorithm. The test stand contains 2 HP
motor, a torque transducer/encoder, a dynamometer.
The consideration bearings edibles the motor shaft
electro-discharge machining was used to introduce
single point inner-race fault of 0.007, 0.014, 0.021 and
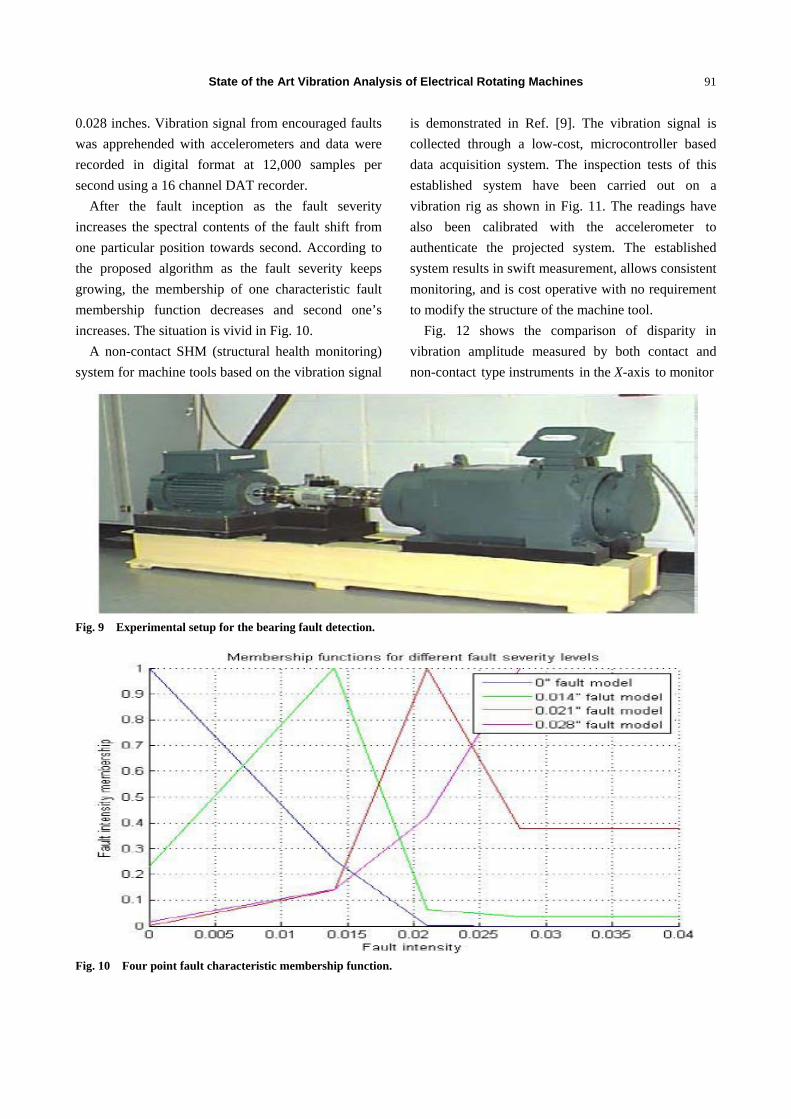
State of the Art Vibration Analysis of Electrical Rotating Machines
91
0.028 inches. Vibration signal from encouraged faults
was apprehended with accelerometers and data were
recorded in digital format at 12,000 samples per
second using a 16 channel DAT recorder.
After the fault inception as the fault severity
increases the spectral contents of the fault shift from
one particular position towards second. According to
the proposed algorithm as the fault severity keeps
growing, the membership of one characteristic fault
membership function decreases and second one’s
increases. The situation is vivid in Fig. 10.
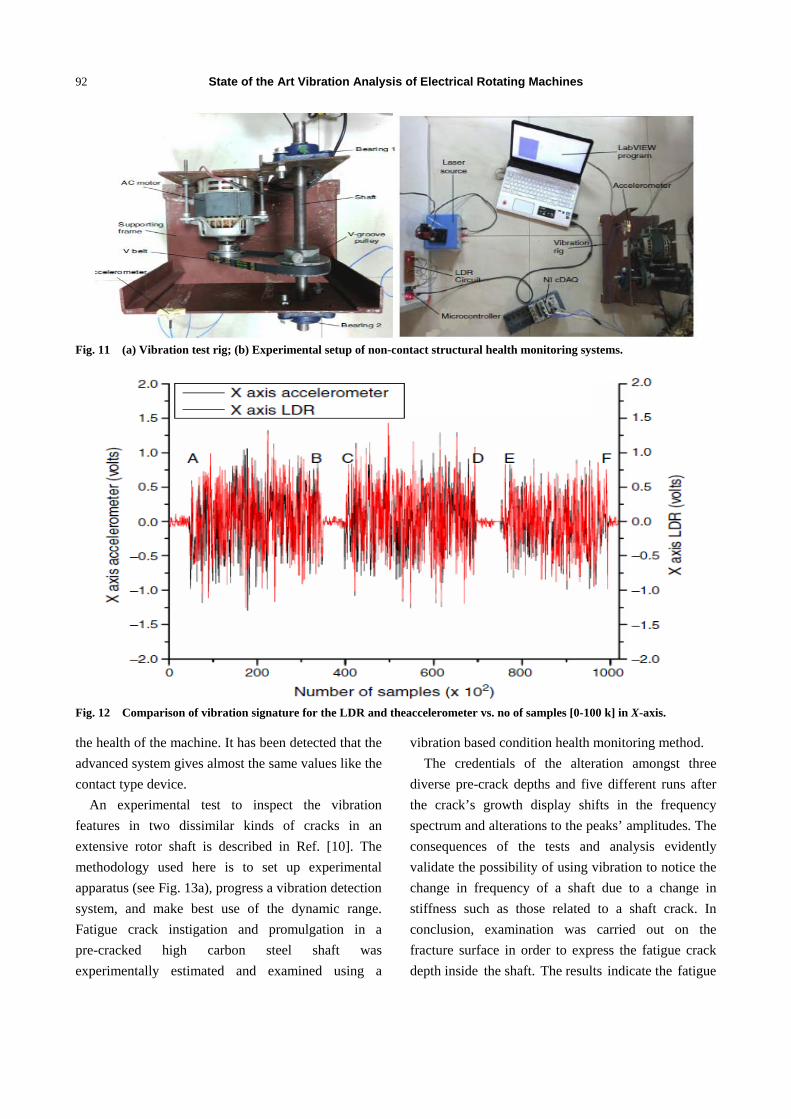
A non-contact SHM (structural health monitoring)
system for machine tools based on the vibration signal
is demonstrated in Ref. [9]. The vibration signal is
collected through a low-cost, microcontroller based
data acquisition system. The inspection tests of this
established system have been carried out on a
vibration rig as shown in Fig. 11. The readings have
also been calibrated with the accelerometer to
authenticate the projected system. The established
system results in swift measurement, allows consistent
monitoring, and is cost operative with no requirement
to modify the structure of the machine tool.
Fig. 12 shows the comparison of disparity in
vibration amplitude measured by both contact and
non-contact type instruments in the X-axis to monitor
Fig. 9 Experimental setup for the bearing fault detection.
Fig. 10 Four point fault characteristic membership function.
State of the Art Vibration Analysis of Electrical Rotating Machines
92
Fig. 11 (a) Vibration test rig; (b) Experimental setup of non-contact structural health monitoring systems.
Fig. 12 Comparison of vibration signature for the LDR and theaccelerometer vs. no of samples [0-100 k] in X-axis.
the health of the machine. It has been detected that the
advanced system gives almost the same values like the
contact type device.
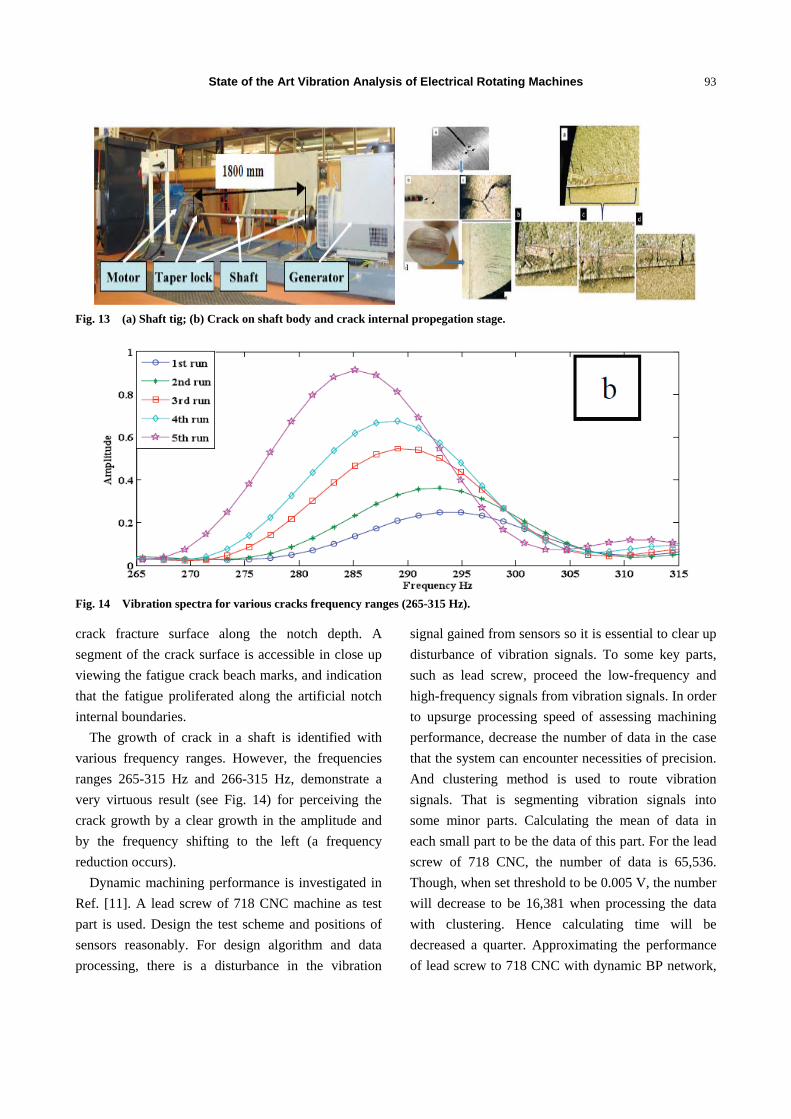
An experimental test to inspect the vibration
features in two dissimilar kinds of cracks in an
extensive rotor shaft is described in Ref. [10]. The
methodology used here is to set up experimental
apparatus (see Fig. 13a), progress a vibration detection
system, and make best use of the dynamic range.
Fatigue crack instigation and promulgation in a
pre-cracked high carbon steel shaft was
experimentally estimated and examined using a
vibration based condition health monitoring method.
The credentials of the alteration amongst three
diverse pre-crack depths and five different runs after
the crack’s growth display shifts in the frequency
spectrum and alterations to the peaks’ amplitudes. The
consequences of the tests and analysis evidently
validate the possibility of using vibration to notice the
change in frequency of a shaft due to a change in
stiffness such as those related to a shaft crack. In
conclusion, examination was carried out on the
fracture surface in order to express the fatigue crack
depth inside the shaft. The results indicate the fatigue
State of the Art Vibration Analysis of Electrical Rotating Machines
93
Fig. 13 (a) Shaft tig; (b) Crack on shaft body and crack internal propegation stage.
Fig. 14 Vibration spectra for various cracks frequency ranges (265-315 Hz).
crack fracture surface along the notch depth. A
segment of the crack surface is accessible in close up
viewing the fatigue crack beach marks, and indication
that the fatigue proliferated along the artificial notch
internal boundaries.
The growth of crack in a shaft is identified with
various frequency ranges. However, the frequencies
ranges 265-315 Hz and 266-315 Hz, demonstrate a
very virtuous result (see Fig. 14) for perceiving the
crack growth by a clear growth in the amplitude and
by the frequency shifting to the left (a frequency
reduction occurs).
Dynamic machining performance is investigated in
Ref. [11]. A lead screw of 718 CNC machine as test
part is used. Design the test scheme and positions of
sensors reasonably. For design algorithm and data
processing, there is a disturbance in the vibration
signal gained from sensors so it is essential to clear up
disturbance of vibration signals. To some key parts,
such as lead screw, proceed the low-frequency and
high-frequency signals from vibration signals. In order
to upsurge processing speed of assessing machining
performance, decrease the number of data in the case
that the system can encounter necessities of precision.
And clustering method is used to route vibration
signals. That is segmenting vibration signals into
some minor parts. Calculating the mean of data in
each small part to be the data of this part. For the lead
screw of 718 CNC, the number of data is 65,536.
Though, when set threshold to be 0.005 V, the number
will decrease to be 16,381 when processing the data
with clustering. Hence calculating time will be
decreased a quarter. Approximating the performance
of lead screw to 718 CNC with dynamic BP network,
State of the Art Vibration Analysis of Electrical Rotating Machines
94
as well as classifying the results into two parts
(normal state and faulty state) was carried out. The
dynamic machining performance is accurate in the
circumstance of normal state and the dynamic
machining performance cannot encounter the
machining accuracy obligation. The results of
simulation show that the method can correctly classify
normal state and faulty state.
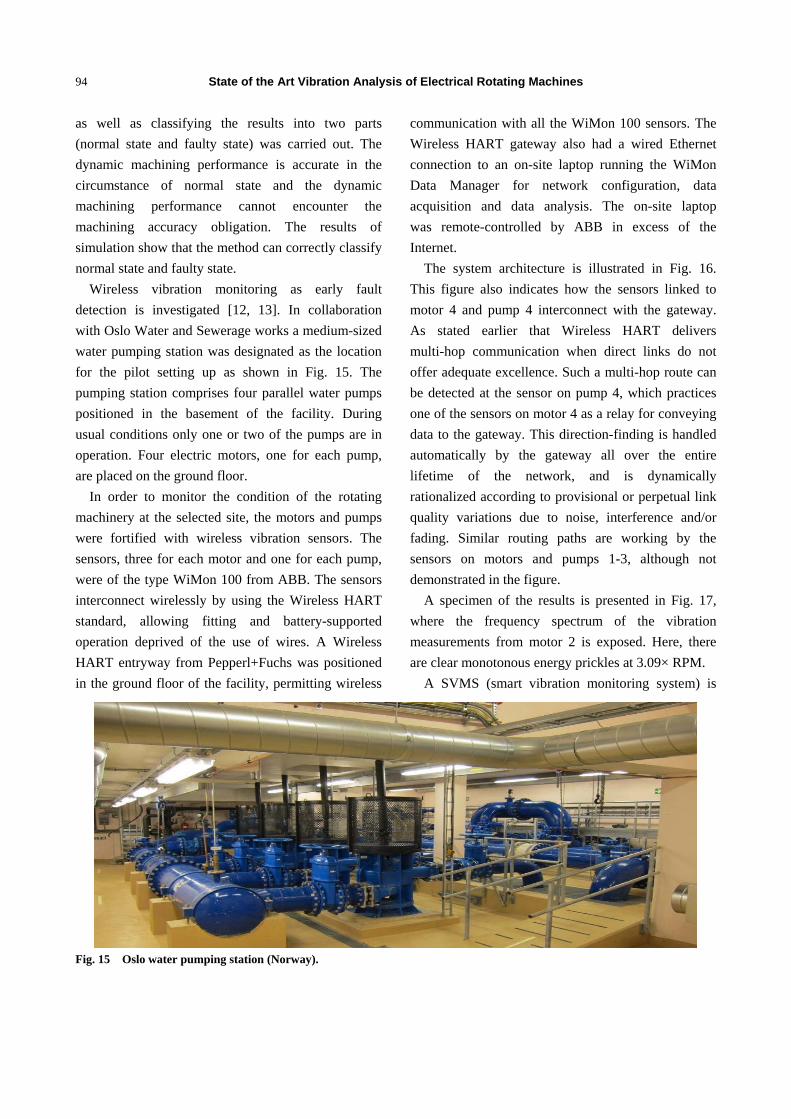
Wireless vibration monitoring as early fault
detection is investigated [12, 13]. In collaboration
with Oslo Water and Sewerage works a medium-sized
water pumping station was designated as the location
for the pilot setting up as shown in Fig. 15. The
pumping station comprises four parallel water pumps
positioned in the basement of the facility. During
usual conditions only one or two of the pumps are in
operation. Four electric motors, one for each pump,
are placed on the ground floor.
In order to monitor the condition of the rotating
machinery at the selected site, the motors and pumps
were fortified with wireless vibration sensors. The
sensors, three for each motor and one for each pump,
were of the type WiMon 100 from ABB. The sensors
interconnect wirelessly by using the Wireless HART
standard, allowing fitting and battery-supported
operation deprived of the use of wires. A Wireless
HART entryway from Pepperl+Fuchs was positioned
in the ground floor of the facility, permitting wireless
communication with all the WiMon 100 sensors. The
Wireless HART gateway also had a wired Ethernet
connection to an on-site laptop running the WiMon
Data Manager for network configuration, data
acquisition and data analysis. The on-site laptop
was remote-controlled by ABB in excess of the
Internet.
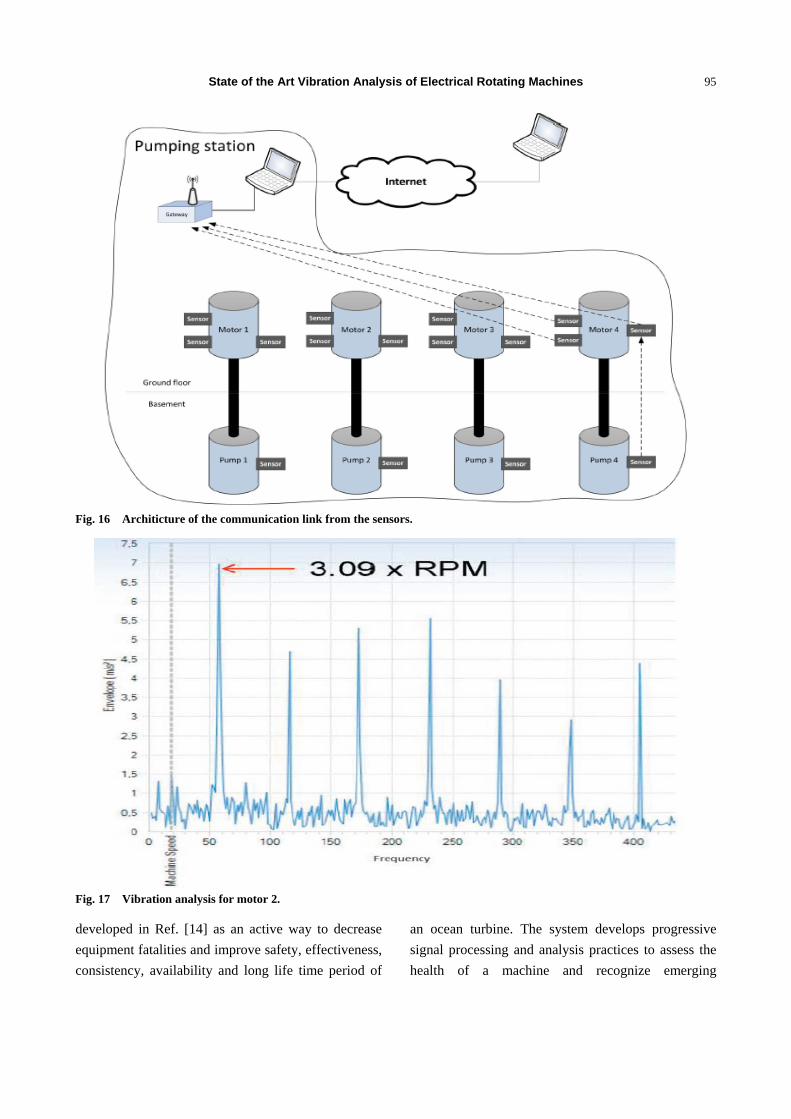
The system architecture is illustrated in Fig. 16.
This figure also indicates how the sensors linked to
motor 4 and pump 4 interconnect with the gateway.
As stated earlier that Wireless HART delivers
multi-hop communication when direct links do not
offer adequate excellence. Such a multi-hop route can
be detected at the sensor on pump 4, which practices
one of the sensors on motor 4 as a relay for conveying
data to the gateway. This direction-finding is handled
automatically by the gateway all over the entire
lifetime of the network, and is dynamically
rationalized according to provisional or perpetual link
quality variations due to noise, interference and/or
fading. Similar routing paths are working by the
sensors on motors and pumps 1-3, although not
demonstrated in the figure.
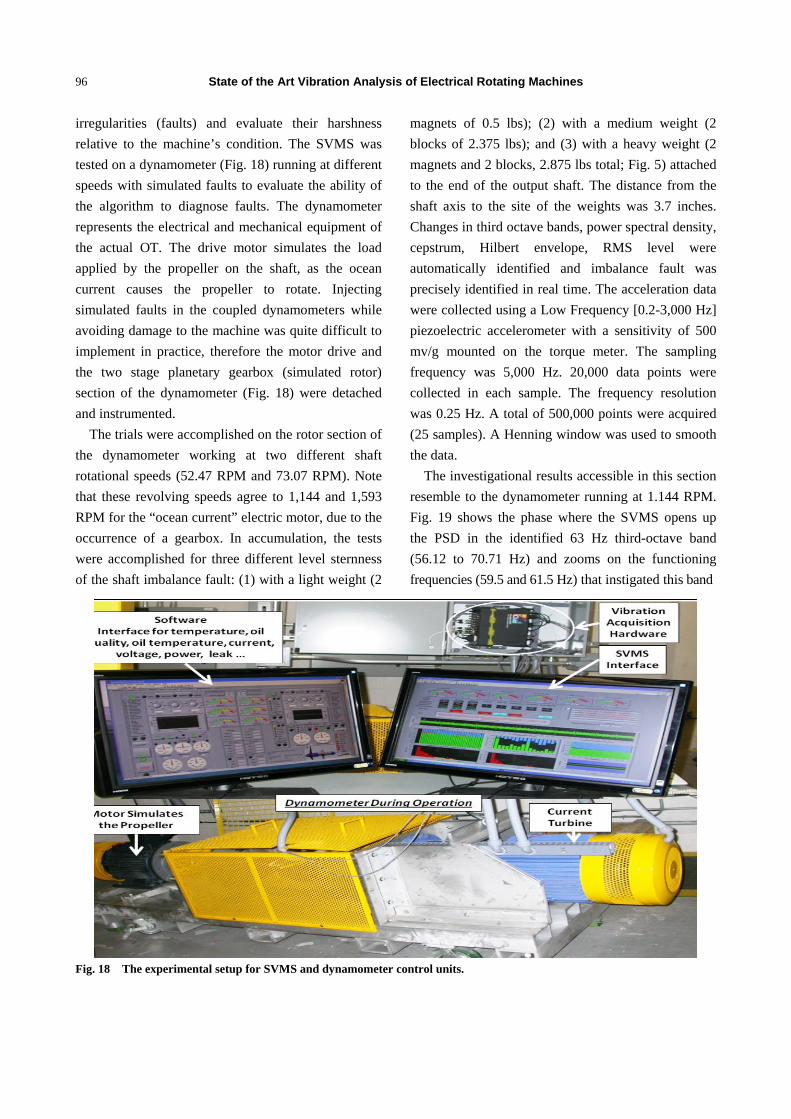
A specimen of the results is presented in Fig. 17,
where the frequency spectrum of the vibration
measurements from motor 2 is exposed. Here, there
are clear monotonous energy prickles at 3.09× RPM.
A SVMS (smart vibration monitoring system) is
Fig. 15 Oslo water pumping station (Norway).
State of the Art Vibration Analysis of Electrical Rotating Machines
95
Fig. 16 Architicture of the communication link from the sensors.
Fig. 17 Vibration analysis for motor 2.
developed in Ref. [14] as an active way to decrease
equipment fatalities and improve safety, effectiveness,
consistency, availability and long life time period of
an ocean turbine. The system develops progressive
signal processing and analysis practices to assess the
health of a machine and recognize emerging
State of the Art Vibration Analysis of Electrical Rotating Machines
96
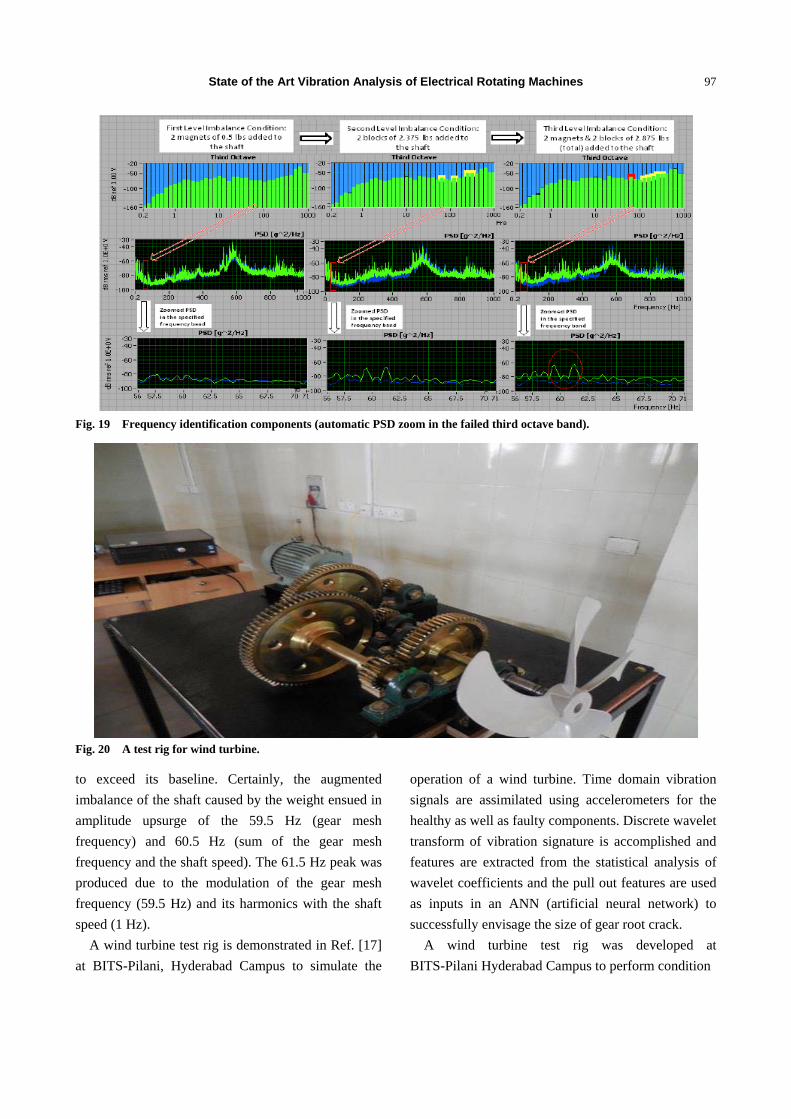
irregularities (faults) and evaluate their harshness
relative to the machine’s condition. The SVMS was
tested on a dynamometer (Fig. 18) running at different
speeds with simulated faults to evaluate the ability of
the algorithm to diagnose faults. The dynamometer
represents the electrical and mechanical equipment of
the actual OT. The drive motor simulates the load
applied by the propeller on the shaft, as the ocean
current causes the propeller to rotate. Injecting
simulated faults in the coupled dynamometers while
avoiding damage to the machine was quite difficult to
implement in practice, therefore the motor drive and
the two stage planetary gearbox (simulated rotor)
section of the dynamometer (Fig. 18) were detached
and instrumented.
The trials were accomplished on the rotor section of
the dynamometer working at two different shaft
rotational speeds (52.47 RPM and 73.07 RPM). Note
that these revolving speeds agree to 1,144 and 1,593
RPM for the “ocean current” electric motor, due to the
occurrence of a gearbox. In accumulation, the tests
were accomplished for three different level sternness
of the shaft imbalance fault: (1) with a light weight (2
magnets of 0.5 lbs); (2) with a medium weight (2
blocks of 2.375 lbs); and (3) with a heavy weight (2
magnets and 2 blocks, 2.875 lbs total; Fig. 5) attached
to the end of the output shaft. The distance from the
shaft axis to the site of the weights was 3.7 inches.
Changes in third octave bands, power spectral density,
cepstrum, Hilbert envelope, RMS level were
automatically identified and imbalance fault was
precisely identified in real time. The acceleration data
were collected using a Low Frequency [0.2-3,000 Hz]
piezoelectric accelerometer with a sensitivity of 500
mv/g mounted on the torque meter. The sampling
frequency was 5,000 Hz. 20,000 data points were
collected in each sample. The frequency resolution
was 0.25 Hz. A total of 500,000 points were acquired
(25 samples). A Henning window was used to smooth
the data.
The investigational results accessible in this section
resemble to the dynamometer running at 1.144 RPM.
Fig. 19 shows the phase where the SVMS opens up
the PSD in the identified 63 Hz third-octave band
(56.12 to 70.71 Hz) and zooms on the functioning
frequencies (59.5 and 61.5 Hz) that instigated this band
Fig. 18 The experimental setup for SVMS and dynamometer control units.
State of the Art Vibration Analysis of Electrical Rotating Machines
97
Fig. 19 Frequency identification components (automatic PSD zoom in the failed third octave band).
Fig. 20 A test rig for wind turbine.
to exceed its baseline. Certainly, the augmented
imbalance of the shaft caused by the weight ensued in
amplitude upsurge of the 59.5 Hz (gear mesh
frequency) and 60.5 Hz (sum of the gear mesh
frequency and the shaft speed). The 61.5 Hz peak was
produced due to the modulation of the gear mesh
frequency (59.5 Hz) and its harmonics with the shaft
speed (1 Hz).
A wind turbine test rig is demonstrated in Ref. [17]
at BITS-Pilani, Hyderabad Campus to simulate the
operation of a wind turbine. Time domain vibration
signals are assimilated using accelerometers for the
healthy as well as faulty components. Discrete wavelet
transform of vibration signature is accomplished and
features are extracted from the statistical analysis of
wavelet coefficients and the pull out features are used
as inputs in an ANN (artificial neural network) to
successfully envisage the size of gear root crack.
A wind turbine test rig was developed at
BITS-Pilani Hyderabad Campus to perform condition
State of the Art Vibration Analysis of Electrical Rotating Machines
98
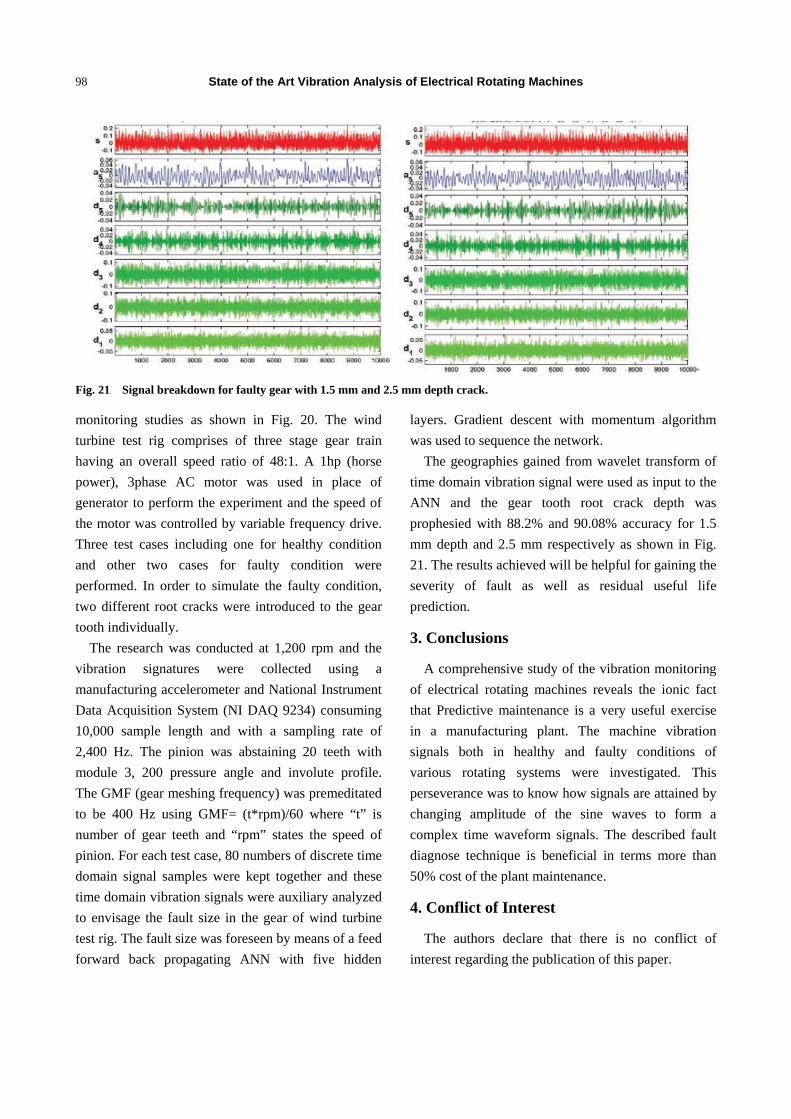
Fig. 21 Signal breakdown for faulty gear with 1.5 mm and 2.5 mm depth crack.
monitoring studies as shown in Fig. 20. The wind
turbine test rig comprises of three stage gear train
having an overall speed ratio of 48:1. A 1hp (horse
power), 3phase AC motor was used in place of
generator to perform the experiment and the speed of
the motor was controlled by variable frequency drive.
Three test cases including one for healthy condition
and other two cases for faulty condition were
performed. In order to simulate the faulty condition,
two different root cracks were introduced to the gear
tooth individually.
The research was conducted at 1,200 rpm and the
vibration signatures were collected using a
manufacturing accelerometer and National Instrument
Data Acquisition System (NI DAQ 9234) consuming
10,000 sample length and with a sampling rate of
2,400 Hz. The pinion was abstaining 20 teeth with
module 3, 200 pressure angle and involute profile.
The GMF (gear meshing frequency) was premeditated
to be 400 Hz using GMF= (t*rpm)/60 where “t” is
number of gear teeth and “rpm” states the speed of
pinion. For each test case, 80 numbers of discrete time
domain signal samples were kept together and these
time domain vibration signals were auxiliary analyzed
to envisage the fault size in the gear of wind turbine
test rig. The fault size was foreseen by means of a feed
forward back propagating ANN with five hidden
layers. Gradient descent with momentum algorithm
was used to sequence the network.
The geographies gained from wavelet transform of
time domain vibration signal were used as input to the
ANN and the gear tooth root crack depth was
prophesied with 88.2% and 90.08% accuracy for 1.5
mm depth and 2.5 mm respectively as shown in Fig.
21. The results achieved will be helpful for gaining the
severity of fault as well as residual useful life
prediction.
3. Conclusions
A comprehensive study of the vibration monitoring
of electrical rotating machines reveals the ionic fact
that Predictive maintenance is a very useful exercise
in a manufacturing plant. The machine vibration
signals both in healthy and faulty conditions of
various rotating systems were investigated. This
perseverance was to know how signals are attained by
changing amplitude of the sine waves to form a
complex time waveform signals. The described fault
diagnose technique is beneficial in terms more than
50% cost of the plant maintenance.
4. Conflict of Interest
The authors declare that there is no conflict of
interest regarding the publication of this paper.
State of the Art Vibration Analysis of Electrical Rotating Machines
99
References
[1] Vas, P. 1993. Parameter Estimation, Condition Monitoring, and Diagnosis of Electrical Machines. Oxford: Clarendon Press.
[2] Khan, S. 2011. Simulation and Vibration Analysis of Electrical Machine. Karachi: KANAUP, Pakistan.
[3] Hartog, J. P. D. 1985. Mechanical Vibrations. Dover Publications.
[4] Neha, G., and Pahuja, S. 2012. “Vibration Sensor for Health Monitoring of Electrical Machines in Power Station.” International Journal of Engineering Science and Technology 4 (04 April).
[5] Perrone, G., and Vallan, A. 2009. “A Low-Cost Optical Sensor for Noncontact Vibration Measurements.” IEEE Transactions on Instrumentation and Measurement 58 (5): 1650-6.
[6] Yan, R., and Gao, R. X. 2006. “Hilbert & Huang Transform-Based Vibration Signal Analysis for Machine Health Monitoring.” IEEE Transactions on Instrumentation and Measurement 55 (6): 2320-9.
[7] He, Q., and Wang, X. X. 2012. “Time-Frequency Manifold for Demodulation with Application to Gearbox Fault Detection.” In Proceedings of the IEEE 2012 Prognostics and System Health Management Conference (PHM-2012 Beijing).
[8] Amar, M., Gondal, I., and Wilson, C. 2013. “Fuzzy Logic Inspired Bearing Fault-Model Membership Estimation.” In 2013 IEEE Eighth International Conference on Intelligent Sensors, Sensor Networks and Information Processing.
[9] Goyal, D., and Pabla, B. S. 2016. “Development of Non-contact Structural Health Monitoring System for Machine Tools.” Journal of Applied Research and Technology 14 (4): 245-58.
[10] Mohamed, A. A. et al. 2011. “Monitoring of Fatigue Crack Stages in a High Carbon Steel Rotating Shaft Using Vibration.” Procedia Engineering 10: 130-5.
[11] Huang, H. et al. 2011. “Study on Dynamic Machining Performance of Machine Tool Based on BP Network.” Procedia Engineering 15: 5148-52.
[12] Myhre, B., Petersen, S., and Ugarelli, R. 2014. “Using Wireless Vibration Monitoring to Enable
Condition-Based Maintenance of Rotating Machinery in the Water and Wastewater Industries.” Procedia Engineering 89: 1397-403.
[13] Petersen, S., Myhre, B., and Røstum, J. 2014. “Wireless
Instrumentation for the Water and Wastewater
Industry.” Procedia Engineering 70: 1314-23.
[14] Mjit, M., Beaujean, P. P. J., and Vendittis, D. J. 2011.
“Smart Vibration Monitoring System for an Ocean
Turbine.” In 2011 IEEE 13th International Symposium
on High-Assurance Systems Engineering.
[15] Dipti Agrawal, M. N. Y., and Suresh, S. 2015.
“Condition Monitoring of Slip-ring Induction Motor.”
International Journal of Innovative Research in
Advanced Engineering (IJIRAE) 2 (3).
[16] Siddiqui, K. M., Kuldeep, S., and Giri, V. K. 2014. “A
Survey of Health Monitoring and Fault Diagnosis in
Induction Motor.” International Journal of Advanced
Research in Electrical, Electronics and Instrumentation
Engineering 3 (1, January 2014).
[17] Biswal, S., George, J. D., and Sabareesh, G. R. 2016.
“Fault Size Estimation Using Vibration Signatures in a
Wind Turbine Test-Rig.” Procedia Engineering 144:
305-11.
[18] Krishnakumari, A. et al. “Application of
Zhao-Atlas-Marks Transforms in Non-stationary
Bearing Fault Diagnosis.” Procedia Engineering 144:
297-304.
[19] Ribeiro, L. C. et al. 2014. “Equipment for Predictive
Maintenance in Hydrogenerators.” AASRI Procedia 7:
75-80.
[20] Desavale, R. G., and Mali, A. R. 2016. “Detection of
Damage of Rotor-Bearing Systems Using Experimental
Data Analysis.” Procedia Engineering 144: 195-201.
[21] Helwig, N., Klein, S., and Schütze, A. 2015.
“Identification and Quantification of Hydraulic System
Faults Based on Multivariate Statistics Using Spectral
Vibration Features.” Procedia Engineering 120:
1225-8.
[22] Ebersbach, S., and Peng, Z. 2008. “Expert System
Development for Vibration Analysis in Machine
Condition Monitoring.” Expert Systems with
Applications 34 (1): 291-9.