State of the airline industry - IATA · Airline Industry Economics Advisory Workshop 2016 1 State...
31
Airline Industry Economics Advisory Workshop 2016 1 State of the airline industry April 2017 Brian Pearce, Chief Economist, IATA www.iata.org/economics
Transcript of State of the airline industry - IATA · Airline Industry Economics Advisory Workshop 2016 1 State...

Airline Industry Economics Advisory Workshop 2016 1
State of the airline
industry
April 2017
Brian Pearce,
Chief Economist,
IATA
www.iata.org/economics

Airline Industry Economics Advisory Workshop 2016 2
Industry profitability peaked a year ago
Source: IATA Economic Performance of the Airline Industry – end year 2016 report IATA Economics www.iata.org/economics
-2%
0%
2%
4%
6%
8%
10%
12%
14%
16%
2011 2012 2013 2014 2015 2016 2017
EBIT
as
% r
even
ues
Quarterly profile for airline industry operating profits (EBIT)
Operating margin 8.3% => 6.6%Net profits$39.6bn => $29.8bn
Airline Industry Economics Advisory Workshop 2016 3
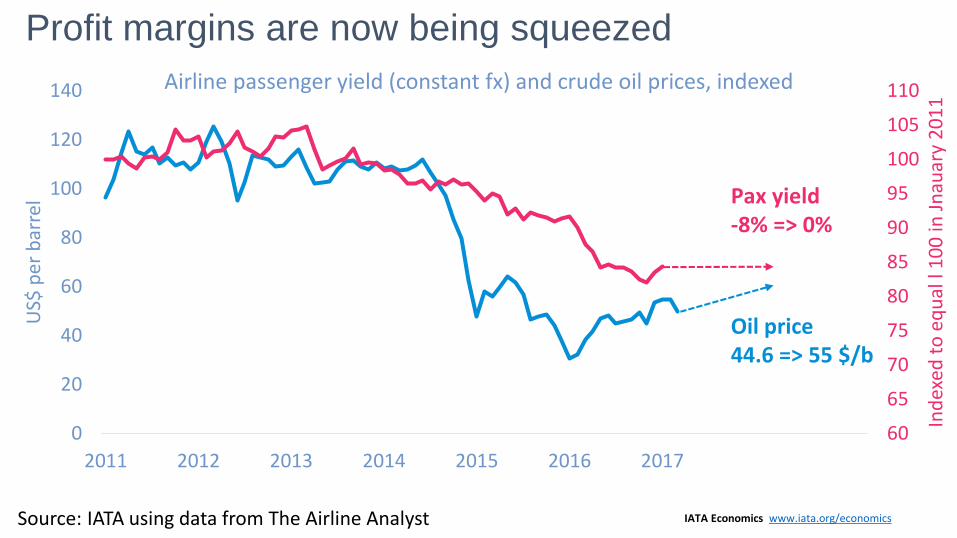
Profit margins are now being squeezed
Source: IATA using data from The Airline Analyst IATA Economics www.iata.org/economics
60
65
70
75
80
85
90
95
100
105
110
0
20
40
60
80
100
120
140
2011 2012 2013 2014 2015 2016 2017
Ind
exed
to
eq
ual
l 1
00
in J
nau
ary
20
11
US$
per
bar
rel
Airline passenger yield (constant fx) and crude oil prices, indexed
Oil price 44.6 => 55 $/b
Pax yield-8% => 0%

Return on capital is likely to be lower this year
Source: IATA Economic Performance of the Airline Industry, End-Year 2016 report
0.0
1.0
2.0
3.0
4.0
5.0
6.0
7.0
8.0
9.0
10.0
1994 1996 1998 2000 2002 2004 2006 2008 2010 2012 2014 2016
% o
f in
vest
ed c
apit
al
Return on capital invested in airlines
Cost of capital (WACC)
Return on capital (ROIC)
IATA Economics www.iata.org/economics
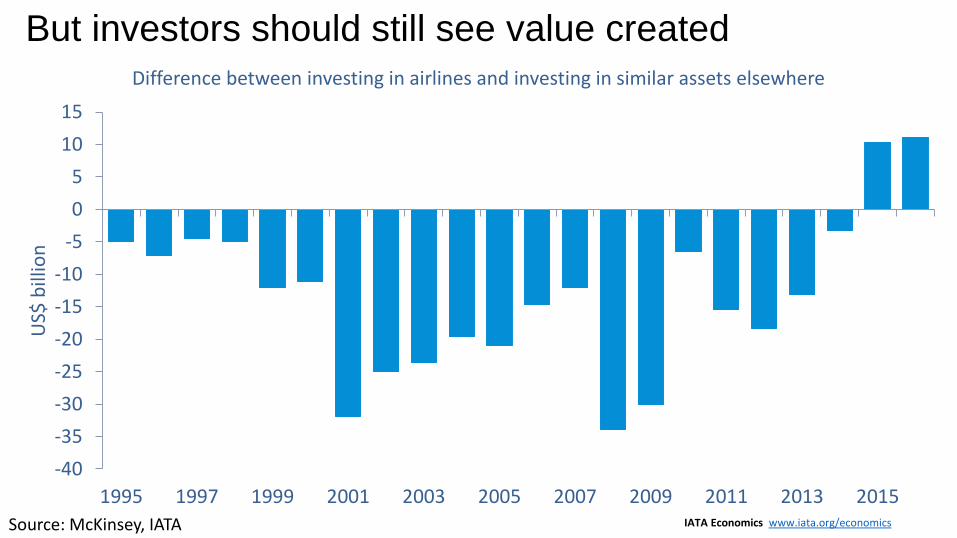
But investors should still see value created
Source: McKinsey, IATA
-40
-35
-30
-25
-20
-15
-10
-5
0
5
10
15
1995 1997 1999 2001 2003 2005 2007 2009 2011 2013 2015
US$
bill
ion
Difference between investing in airlines and investing in similar assets elsewhere
IATA Economics www.iata.org/economics
Airline Industry Economics Advisory Workshop 2016 6
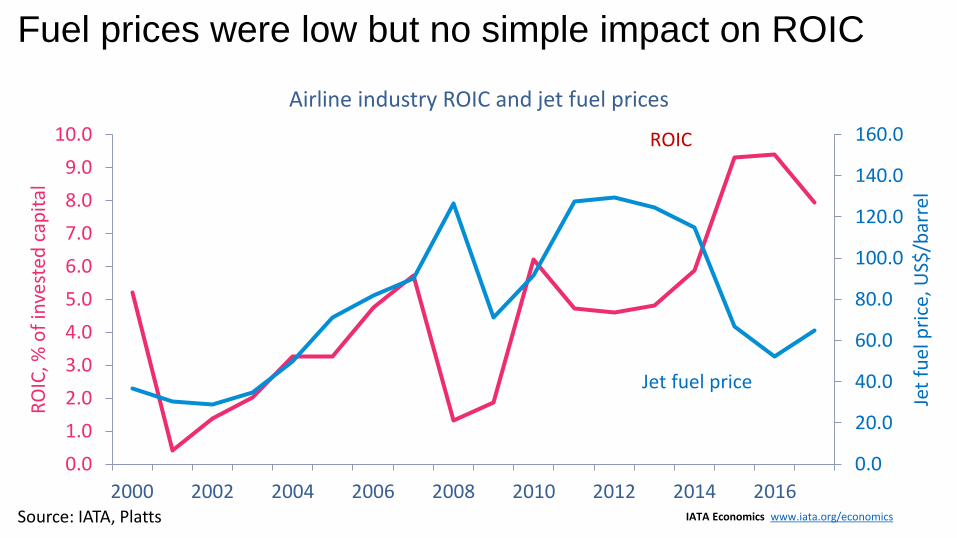
Fuel prices were low but no simple impact on ROIC
Source: IATA, Platts IATA Economics www.iata.org/economics
0.0
20.0
40.0
60.0
80.0
100.0
120.0
140.0
160.0
0.0
1.0
2.0
3.0
4.0
5.0
6.0
7.0
8.0
9.0
10.0
2000 2002 2004 2006 2008 2010 2012 2014 2016
Jet
fuel
pri
ce, U
S$/b
arre
l
RO
IC, %
of
inve
sted
cap
ital
Airline industry ROIC and jet fuel prices
ROIC
Jet fuel price
Airline Industry Economics Advisory Workshop 2016 7
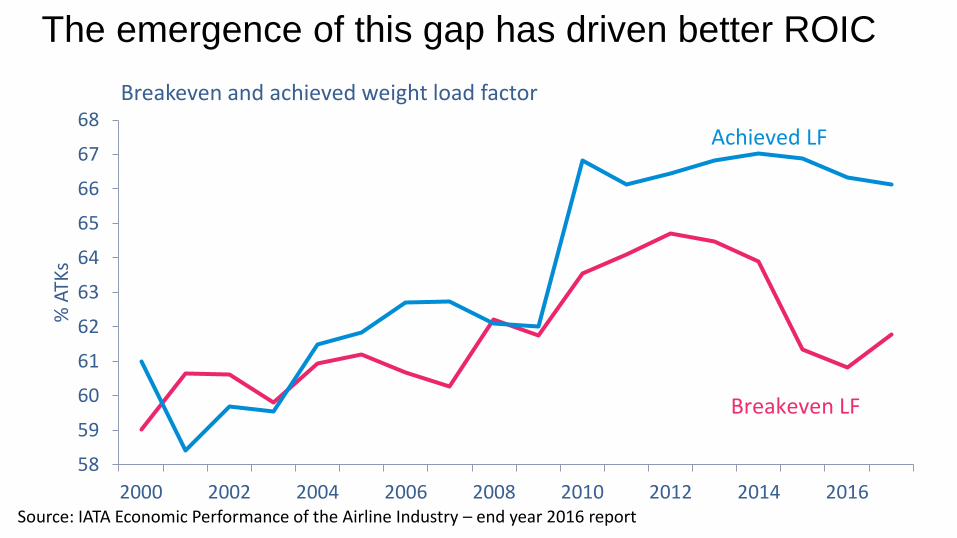
The emergence of this gap has driven better ROIC
58
59
60
61
62
63
64
65
66
67
68
2000 2002 2004 2006 2008 2010 2012 2014 2016
% A
TKs
Breakeven and achieved weight load factor
Achieved LF
Breakeven LF
Source: IATA Economic Performance of the Airline Industry – end year 2016 report
Airline Industry Economics Advisory Workshop 2016 8
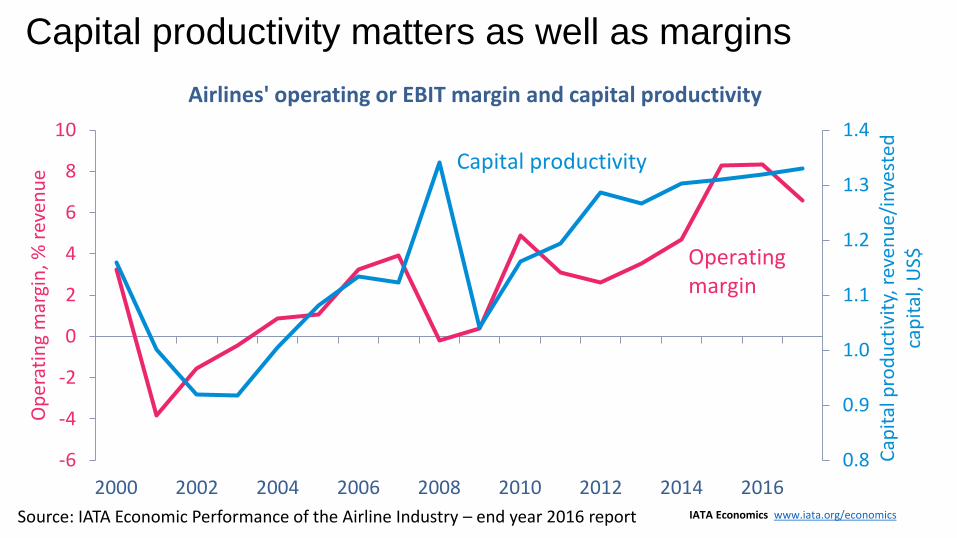
Capital productivity matters as well as margins
0.8
0.9
1.0
1.1
1.2
1.3
1.4
-6
-4
-2
0
2
4
6
8
10
2000 2002 2004 2006 2008 2010 2012 2014 2016
Cap
ital
pro
du
ctiv
ity,
rev
enu
e/in
vest
ed
cap
ital
, US$
Op
erat
ing
mar
gin
, % r
even
ue
Airlines' operating or EBIT margin and capital productivity
Capital productivity
Operating margin
Source: IATA Economic Performance of the Airline Industry – end year 2016 report IATA Economics www.iata.org/economics
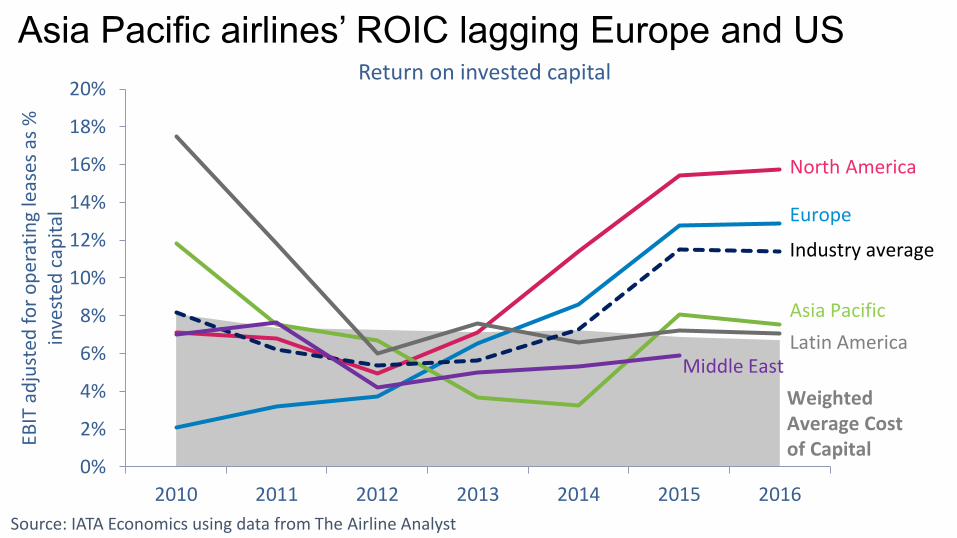
Asia Pacific airlines’ ROIC lagging Europe and US
Source: IATA Economics using data from The Airline Analyst
0%
2%
4%
6%
8%
10%
12%
14%
16%
18%
20%
2010 2011 2012 2013 2014 2015 2016
EBIT
ad
just
ed f
or
op
erat
ing
leas
es a
s %
in
vest
ed c
apit
alReturn on invested capital
Industry average
North America
Europe
Asia Pacific
Latin AmericaMiddle East
Weighted Average Cost of Capital

Free Cash Flow yield just positive in Asia Pacific
Source: IATA Economics using data from The Airline Analyst
-10%
-8%
-6%
-4%
-2%
0%
2%
4%
6%
8%
2010 2011 2012 2013 2014 2015 2016
FCF
as %
inve
sted
cap
ital
Free cash flow yield
North America
Industry average
Asia Pacific
Latin America
Europe
Middle East
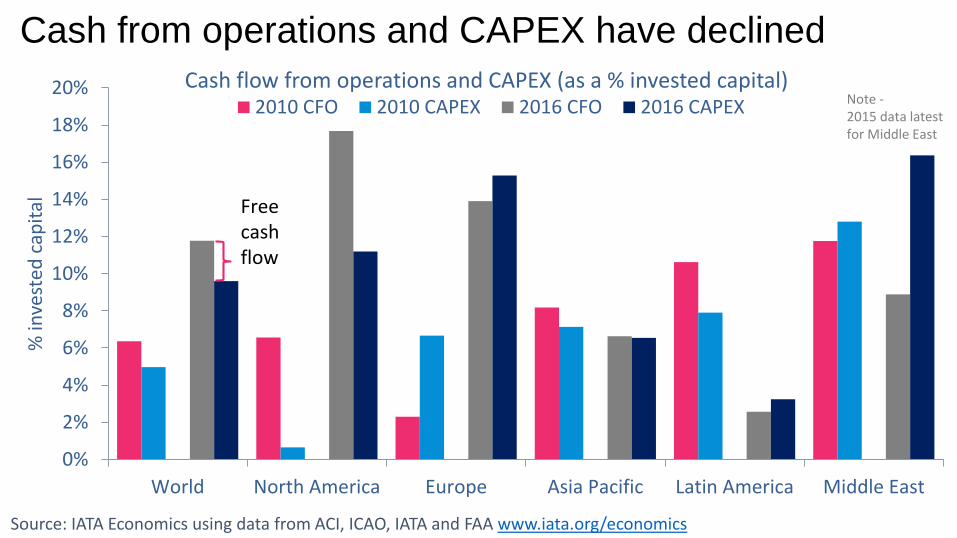
Cash from operations and CAPEX have declined
Source: IATA Economics using data from ACI, ICAO, IATA and FAA www.iata.org/economics
0%
2%
4%
6%
8%
10%
12%
14%
16%
18%
20%
World North America Europe Asia Pacific Latin America Middle East
% in
vest
ed c
apit
al
Cash flow from operations and CAPEX (as a % invested capital)2010 CFO 2010 CAPEX 2016 CFO 2016 CAPEX
Free cash flow
Note -2015 data latest for Middle East

Balance sheets still highly leveraged in Asia Pacific
Source: IATA Economics using data from The Airline Analyst
0
1
2
3
4
5
6
7
8
2010 2011 2012 2013 2014 2015 2016
Deb
t ad
just
ed f
or
op
erat
ing
leas
es/E
BIT
DA
R
Adjusted net debt/EBITDAR
Latin America
Asia Pacific
Industry average
EuropeNorth America
Middle East
Investment grade credits
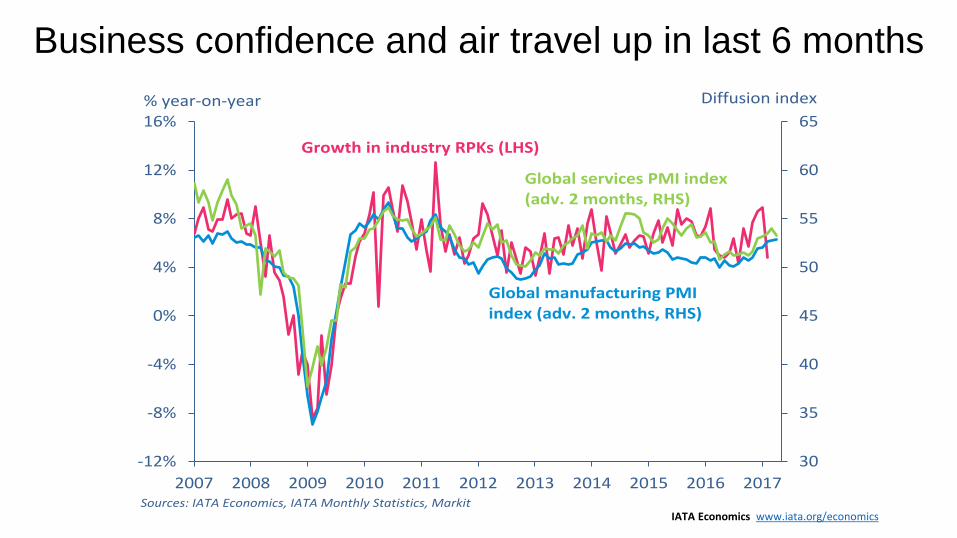
Business confidence and air travel up in last 6 months
30
35
40
45
50
55
60
65
-12%
-8%
-4%
0%
4%
8%
12%
16%
2007 2008 2009 2010 2011 2012 2013 2014 2015 2016 2017
% year-on-year Diffusion index
Growth in industry RPKs (LHS)
Global manufacturing PMI index (adv. 2 months, RHS)
Sources: IATA Economics, IATA Monthly Statistics, Markit
Global services PMI index (adv. 2 months, RHS)
IATA Economics www.iata.org/economics

Though still much variation by air travel market
Africa - Europe
Europe- C. AmericaEurope - Asia
Europe - Middle East
Europe - North America
Asia - North AmericaAsia - SW Pacific
Middle East - Asia
Middle East - North America
North - South America
Within Europe
Within Asia
Domestic Australia
Domestic Brazil
Domestic China
Domestic India
Domestic Japan
Domestic Russia
Domestic US
-5%
0%
5%
10%
15%
20%
0% 2% 4% 6% 8% 10% 12% 14% 16%Share of total global RPKs (Year ended Jan 2017)
Sources: IATA Economics, IATA Monthly Statistics by Route
RPK growth by int'l route and dom. market (latest month, % year-on-year*)
*Note: int'l routes data are for January;domestic market data are for February
IATA Economics www.iata.org/economics

Growth has returned to air cargo
IATA Economics www.iata.org/economics Source: Markit, IATA Statistics
-50%
-40%
-30%
-20%
-10%
0%
10%
20%
30%
40%
-30%
-20%
-10%
0%
10%
20%
30%
2000
2001
2002
2003
2004
2005
2006
2007
2008
2009
2010
2011
2012
2013
2014
2015
2016
2017
% year-on-year % year-on-year
Growth in industry FTKs Global PMI new export orders component (adv. 2 months)
Sources: IATA Economics, IATA Monthly Statistics, Markit
Implied PMI series if the index remains flat at its
February 2017 level over the coming months
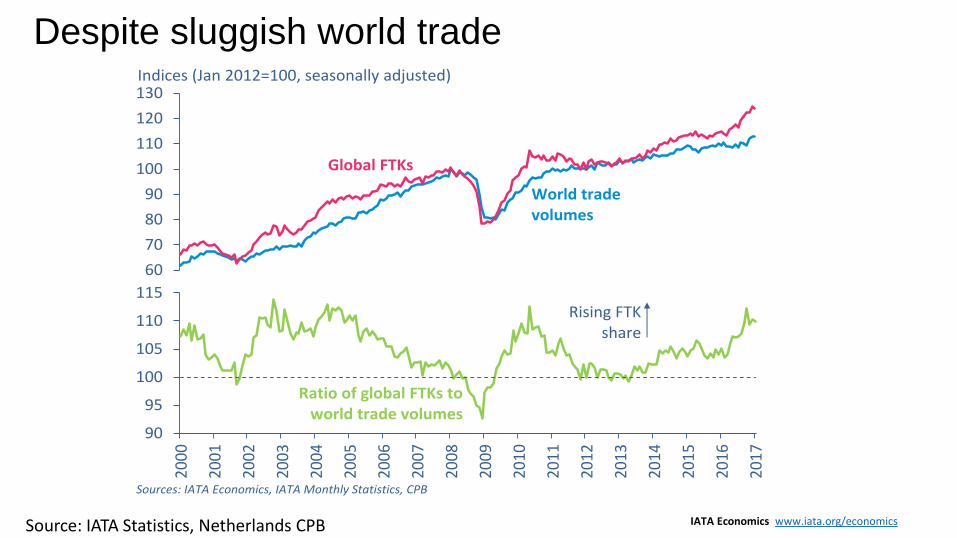
Despite sluggish world trade
IATA Economics www.iata.org/economics Source: IATA Statistics, Netherlands CPB
60
70
80
90
100
110
120
130Indices (Jan 2012=100, seasonally adjusted)
Global FTKs
World trade volumes
90
95
100
105
110
115
2000
2001
2002
2003
2004
2005
2006
2007
2008
2009
2010
2011
2012
2013
2014
2015
2016
2017
Sources: IATA Economics, IATA Monthly Statistics, CPB
Rising FTK share
Ratio of global FTKs to world trade volumes

Headwind – continuing debt overhang
Source: Bank for International Settlement database
100
110
120
130
140
150
160
170
180
190
200
210
220
230
240
250
260
270
280
1999 2001 2003 2005 2007 2009 2011 2013 2015
% o
f G
DP
% o
f G
DP
Outstanding debt of non-financial sector, % of GDP
Developed economies
Developing economies

Headwind – the retreat from globalization
Source: IMF World Economic Outlook and the World Trade Organization
-15
-10
-5
0
5
10
15
2000 2002 2004 2006 2008 2010 2012 2014 2016
% c
han
ge o
ver
pre
vio
us
year
World GDP and cross-border trade growth
World trade growth
World GDP growth

Headwind - poor demographics in some economies
Source: Oxford Economics
-1.0
0.0
1.0
2.0
3.0
4.0
1985 1990 1995 2000 2005 2010 2015 2020 2025 2030
% c
han
ge o
ver
pre
vio
us
year
Labour force growth
US
ChinaJapanGermany
Note: Only+0.1% pa without net immigration

Headwind - the exhaustion of monetary policies
Source: Haver
0
500
1000
1500
2000
2500
3000
3500
4000
4500
5000
0
1
2
3
4
5
6
7
8
9
10
1985 1990 1995 2000 2005 2010 2015
Bill
ion
US$
% in
tere
st r
ate
US federal funds target rate and balance sheet assets
US fed funds
US Federal Reserve Bank assets
Airline Industry Economics Advisory Workshop 2016 21
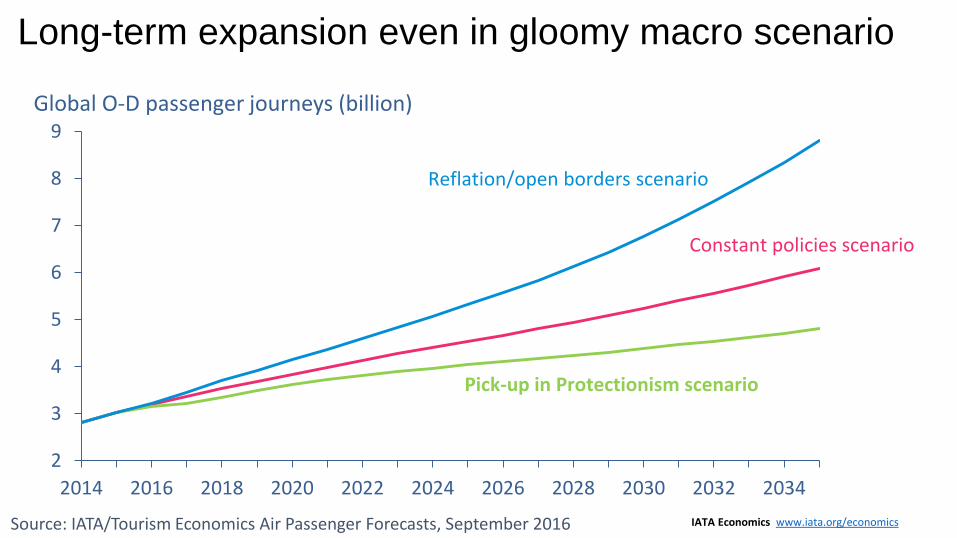
Long-term expansion even in gloomy macro scenario
2
3
4
5
6
7
8
9
2014 2016 2018 2020 2022 2024 2026 2028 2030 2032 2034
Global O-D passenger journeys (billion)
Constant policies scenario
Reflation/open borders scenario
Pick-up in Protectionism scenario
Source: IATA/Tourism Economics Air Passenger Forecasts, September 2016 IATA Economics www.iata.org/economics

Airline Industry Economics Advisory Workshop 2016 22
Trip frequency still low in many important markets
0 0.5 1 1.5 2 2.5 3 3.5 4
NigeriaIndia
EgyptChina
South AfricaIndonesia
BrazilMexico
Russian FederationColombia
ChileTurkey
ThailandJapan
Korea, Republic OfSaudi Arabia
GermanyFrance
ItalyUnited States
CanadaUnited Kingdom
SpainAustralia
Propensity to fly (total passengers/population)Source: IATA/Tourism Economics Air Passenger Forecasts, September 2016 IATA Economics www.iata.org/economics
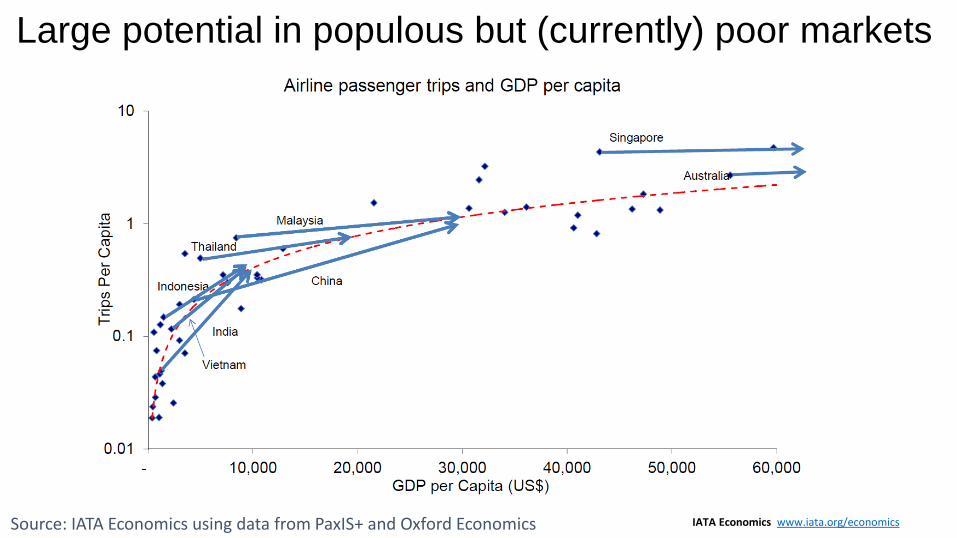
Large potential in populous but (currently) poor markets
Source: IATA Economics using data from PaxIS+ and Oxford Economics IATA Economics www.iata.org/economics
Airline Industry Economics Advisory Workshop 2016 24
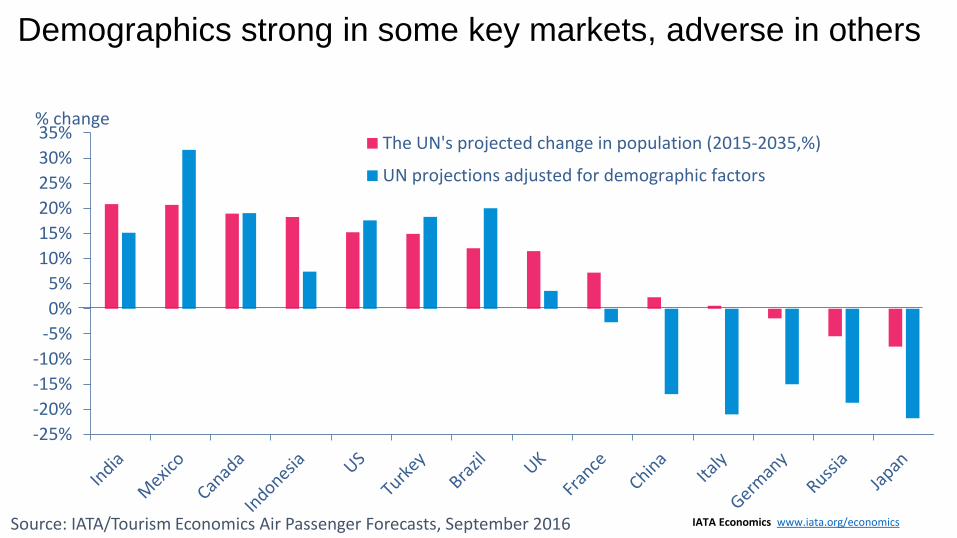
Demographics strong in some key markets, adverse in others
-25%
-20%
-15%
-10%
-5%
0%
5%
10%
15%
20%
25%
30%
35%% change
The UN's projected change in population (2015-2035,%)
UN projections adjusted for demographic factors
Source: IATA/Tourism Economics Air Passenger Forecasts, September 2016 IATA Economics www.iata.org/economics

Airline Industry Economics Advisory Workshop 2016 25
Significant change in top-10 markets over next 20 years
2015 2017 2019 2021 2023 2025 2027 2029 2031 2033 2035
US
China
UK
Japan
Spain
Germany
India
Italy
France
Indonesia
China
US
India
UK
Indonesia
Japan
Spain
Germany
Brazil
Turkey
Source: IATA/Tourism Economics Air Passenger Forecasts, September 2016 IATA Economics www.iata.org/economics
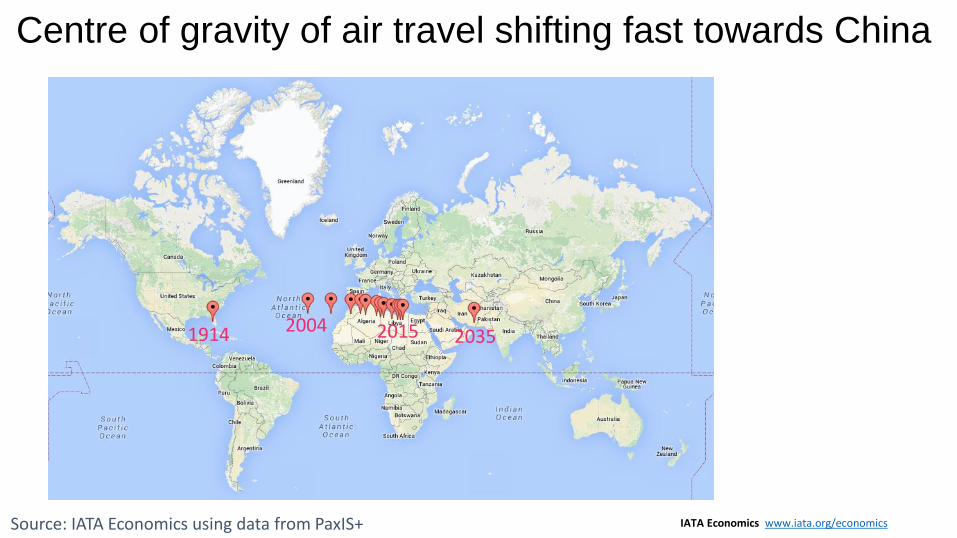
Centre of gravity of air travel shifting fast towards China
Source: IATA Economics using data from PaxIS+
1914 2004 2015 2035
IATA Economics www.iata.org/economics
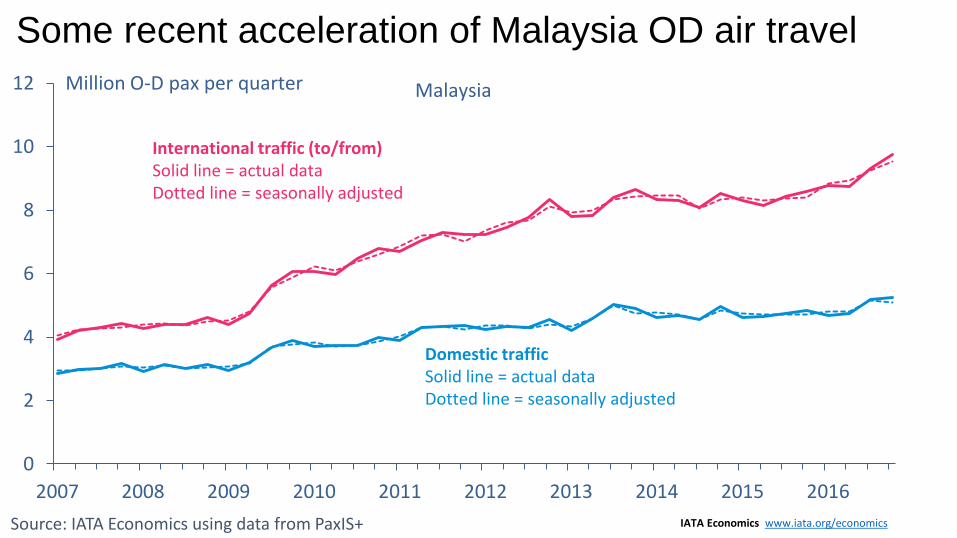
Some recent acceleration of Malaysia OD air travel
Source: IATA Economics using data from PaxIS+ IATA Economics www.iata.org/economics
0
2
4
6
8
10
12
2007 2008 2009 2010 2011 2012 2013 2014 2015 2016
Million O-D pax per quarter
International traffic (to/from) Solid line = actual data Dotted line = seasonally adjusted
Domestic traffic Solid line = actual data Dotted line = seasonally adjusted
Malaysia

Growth rates back to double figures
Source: IATA Economics using data from PaxIS+ IATA Economics www.iata.org/economics
-10%
-5%
0%
5%
10%
15%
20%
25%
30%
35%
40%
2007 2008 2009 2010 2011 2012 2013 2014 2015 2016
Total Dom Int
%yoy growth Malaysia

Middle East hubs dominating some connecting markets
Source: IATA Economics using data from PaxIS+ IATA Economics www.iata.org/economics
4.1%
10.6% 11.4%
30.3%
36.8%
8.9%
17.1% 15.1%
54.7%
41.3%
0%
10%
20%
30%
40%
50%
60%
Asia - North America Asia - Europe Asia - Middle East Europe - Australasia Asia - Africa
2010 2016
Passenger journeys connecting through the Middle East (AUH, DOH, DXB) % of total

-0.4% -2.7%
-0.7%
-0.4% -8.4% -1.3% -1.4%
6.7%
5.3%
-0.8% -0.1% -5.5% -0.6%
0.3%
-1
0
1
2
3
4
5
6
Singapore Kuala Lumpur
Passengers (millions) Change in number of connecting passengers (2010-2016)
Note: the data labels show the change in the proportion of total connecting passengers on each route passing through SIN and KUL between 2010 and 2016.
But KL has seen success in regional connecting market
Source: IATA Economics using data from PaxIS+ IATA Economics www.iata.org/economics

Airline Industry Economics Advisory Workshop 2016 31