State of the Agent Network, India 2017 MicroSave MicroSave is a leading international consulting...
51
In partnership with #ANAIndia #AgentNetworksIndia Contributing authors: Aakash Mehrotra, Akhand Tiwari, M. P. Karthick, Mimansa Khanna, and Vivek Khanna Special contributions from: Bhavana Srivastava, Manoj Sharma, and Sidra Butt–Mughal State of the Agent Network, India 2017 Agent Network Accelerator Research India Country Report February, 2018
Transcript of State of the Agent Network, India 2017 MicroSave MicroSave is a leading international consulting...
In partnership with
#ANAIndia#AgentNetworksIndia
Contributing authors:
Aakash Mehrotra, Akhand Tiwari, M. P. Karthick, Mimansa Khanna, and Vivek Khanna
Special contributions from:
Bhavana Srivastava, Manoj Sharma, and Sidra Butt–Mughal
State of the Agent Network, India 2017Agent Network Accelerator Research
India Country ReportFebruary, 2018
About MicroSave MicroSave is a leading international consulting firm that offers practical, market-led solutions in the areas of Digital Financial Services, Inclusive Finance and Banking, Micro, Small and Medium Enterprises, and Private Sector Development. We focus on enhancing access to financial services to the low- and middle-income segments.
Our vision is to live in a world where everyone has access to high-quality, affordable, market-led financial services and support. For 20 years, we have worked with our clients as a locally based, international consulting firm. We have guided policy and facilitated partnerships to develop enabling ecosystems.
About Helix Institute of Digital FinanceThe Helix Institute is the training arm of MicroSave. Helix is a global leader in providing practical, market-focussed training sessions and insights on financial services.
The mission of Helix Institute is to support financial service practitioners with the strategies and tools they need to achieve sustainable impact and success in their business or programme objectives.
At Helix, we design our training modules to help organisations build effective strategies, enhance operations, and extend financial services to their clients in a profitable manner.
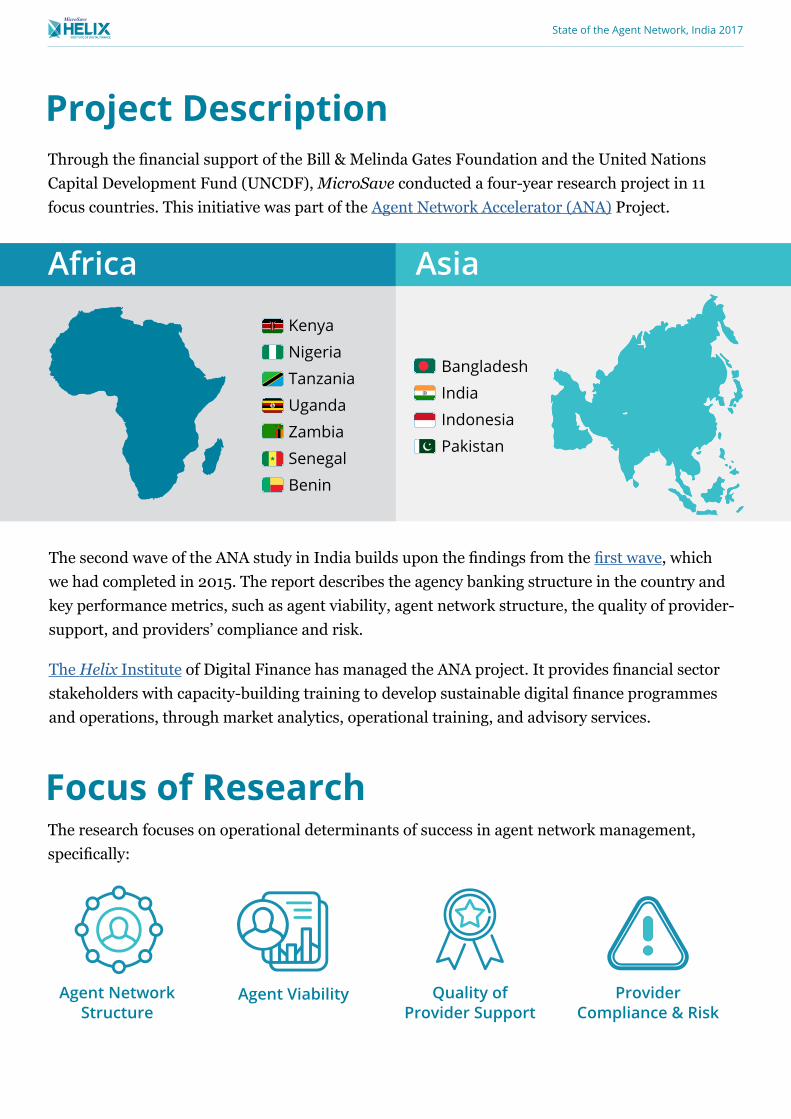
Project DescriptionThrough the financial support of the Bill & Melinda Gates Foundation and the United Nations Capital Development Fund (UNCDF), MicroSave conducted a four-year research project in 11 focus countries. This initiative was part of the Agent Network Accelerator (ANA) Project.
Africa Asia
Kenya
Nigeria
Tanzania
Uganda
Zambia
Senegal
Benin
Bangladesh
India
Indonesia
Pakistan
Focus of ResearchThe research focuses on operational determinants of success in agent network management, specifically:
The second wave of the ANA study in India builds upon the findings from the first wave, which we had completed in 2015. The report describes the agency banking structure in the country and key performance metrics, such as agent viability, agent network structure, the quality of provider-support, and providers’ compliance and risk.
The Helix Institute of Digital Finance has managed the ANA project. It provides financial sector stakeholders with capacity-building training to develop sustainable digital finance programmes and operations, through market analytics, operational training, and advisory services.
Quality of Provider Support
Provider Compliance & Risk
Agent Network Structure
Agent Viability
State of the Agent Network, India 2017
Outline of the Report
A Short History of Digital Financial Services (DFS) in India 5
Evolution of the Agent Network in India 6
Agent Network Landscape 7
Agent Network Structure 10
Agent Viability 15
Quality of Provider Support 25
Provider Compliance and Risk 31
Gender Dimensions in Agent Banking 36
Emerging Models – Payments Banks 38
Salient Points – Corporate BC vs Direct BC Models 40
Appendix 44
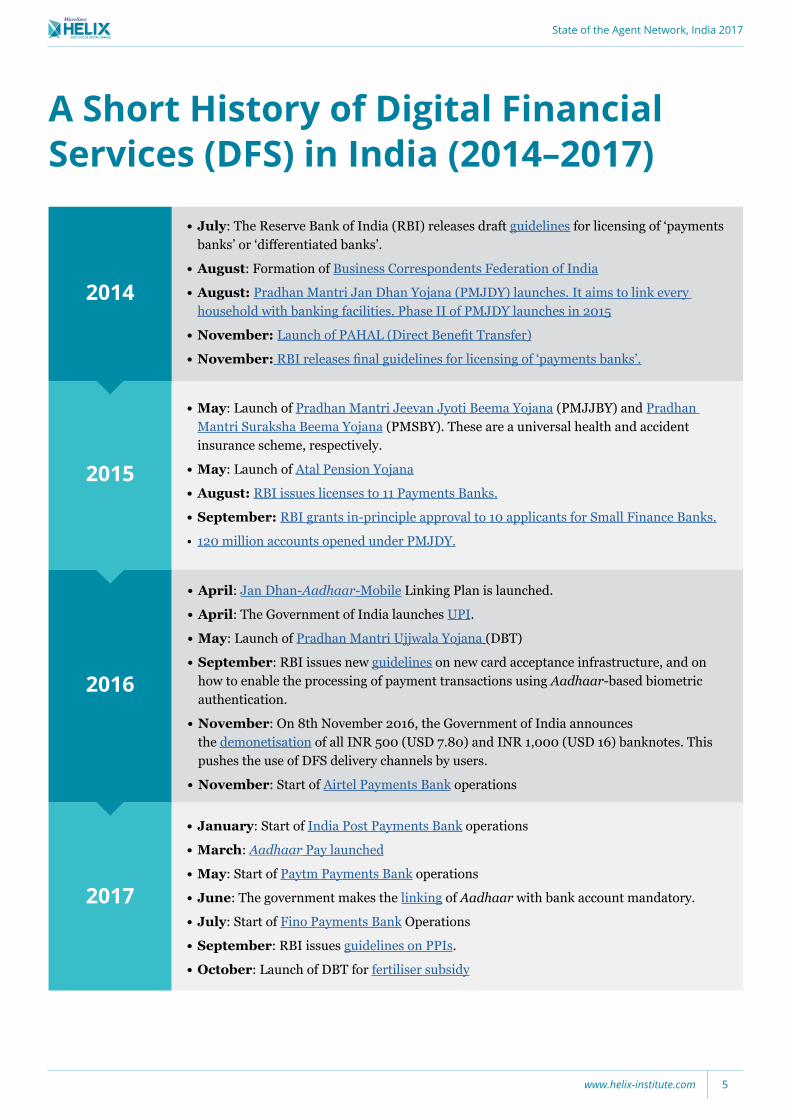
A Short History of Digital Financial Services (DFS) in India (2014–2017)
•July: The Reserve Bank of India (RBI) releases draft guidelines for licensing of ‘payments banks’ or ‘differentiated banks’.
•August: Formation of Business Correspondents Federation of India
•August:Pradhan Mantri Jan Dhan Yojana (PMJDY) launches. It aims to link every household with banking facilities. Phase II of PMJDY launches in 2015
•November:Launch of PAHAL (Direct Benefit Transfer)
•November: RBI releases final guidelines for licensing of ‘payments banks’.
•May: Launch of Pradhan Mantri Jeevan Jyoti Beema Yojana (PMJJBY) and Pradhan Mantri Suraksha Beema Yojana (PMSBY). These are a universal health and accident insurance scheme, respectively.
•May: Launch of Atal Pension Yojana
•August:RBI issues licenses to 11 Payments Banks.
•September:RBI grants in-principle approval to 10 applicants for Small Finance Banks.
• 120 million accounts opened under PMJDY.
•April: Jan Dhan-Aadhaar-Mobile Linking Plan is launched.
•April: The Government of India launches UPI.
•May: Launch of Pradhan Mantri Ujjwala Yojana (DBT)
•September: RBI issues new guidelines on new card acceptance infrastructure, and on how to enable the processing of payment transactions using Aadhaar-based biometric authentication.
•November: On 8th November 2016, the Government of India announces the demonetisation of all INR 500 (USD 7.80) and INR 1,000 (USD 16) banknotes. This pushes the use of DFS delivery channels by users.
•November: Start of Airtel Payments Bank operations
•January: Start of India Post Payments Bank operations
•March: Aadhaar Pay launched
•May: Start of Paytm Payments Bank operations
•June: The government makes the linking of Aadhaar with bank account mandatory.
•July: Start of Fino Payments Bank Operations
•September: RBI issues guidelines on PPIs.
•October: Launch of DBT for fertiliser subsidy
2015
2016
2017
2014
State of the Agent Network, India 2017
www.helix-institute.com 5
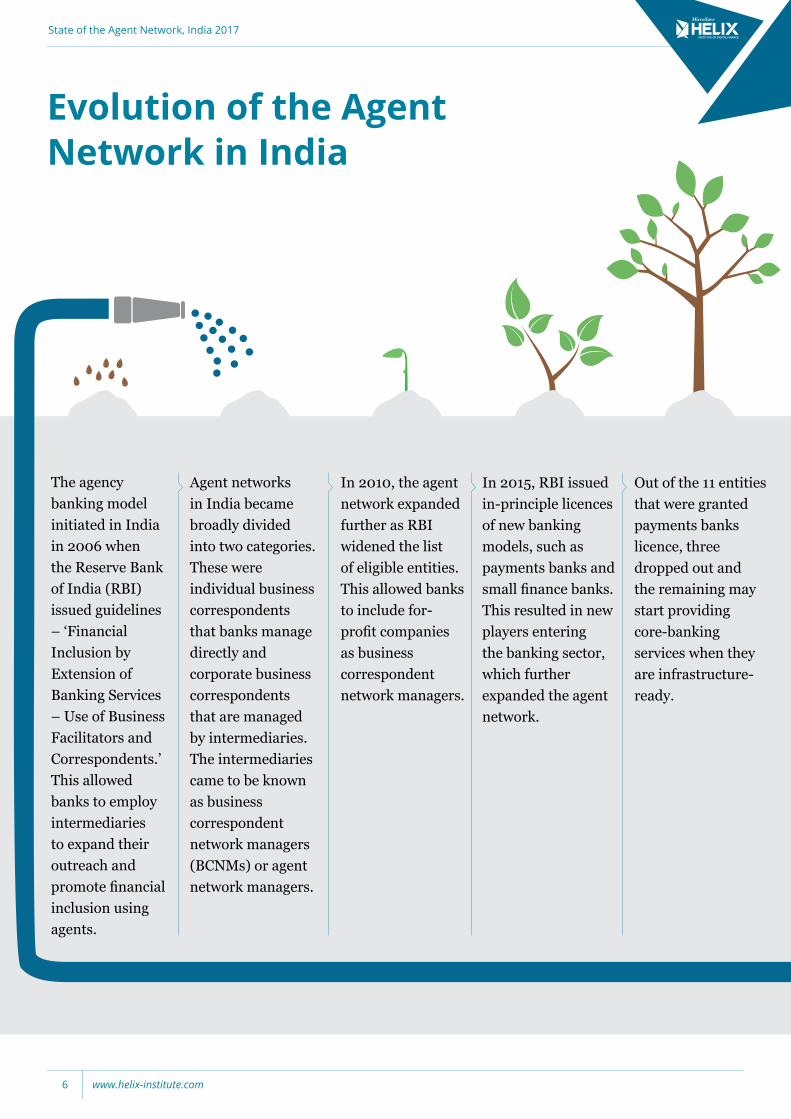
Evolution of the Agent Network in India
The agency banking model initiated in India in 2006 when the Reserve Bank of India (RBI) issued guidelines – ‘Financial Inclusion by Extension of Banking Services – Use of Business Facilitators and Correspondents.’ This allowed banks to employ intermediaries to expand their outreach and promote financial inclusion using agents.
Agent networks in India became broadly divided into two categories. These were individual business correspondents that banks manage directly and corporate business correspondents that are managed by intermediaries. The intermediaries came to be known as business correspondent network managers (BCNMs) or agent network managers.
In 2010, the agent network expanded further as RBI widened the list of eligible entities. This allowed banks to include for-profit companies as business correspondent network managers.
In 2015, RBI issued in-principle licences of new banking models, such as payments banks and small finance banks. This resulted in new players entering the banking sector, which further expanded the agent network.
Out of the 11 entities that were granted payments banks licence, three dropped out and the remaining may start providing core-banking services when they are infrastructure-ready.
State of the Agent Network, India 2017
www.helix-institute.com6
Agent Network Landscape
State of the Agent Network, India 2017
www.helix-institute.com 7
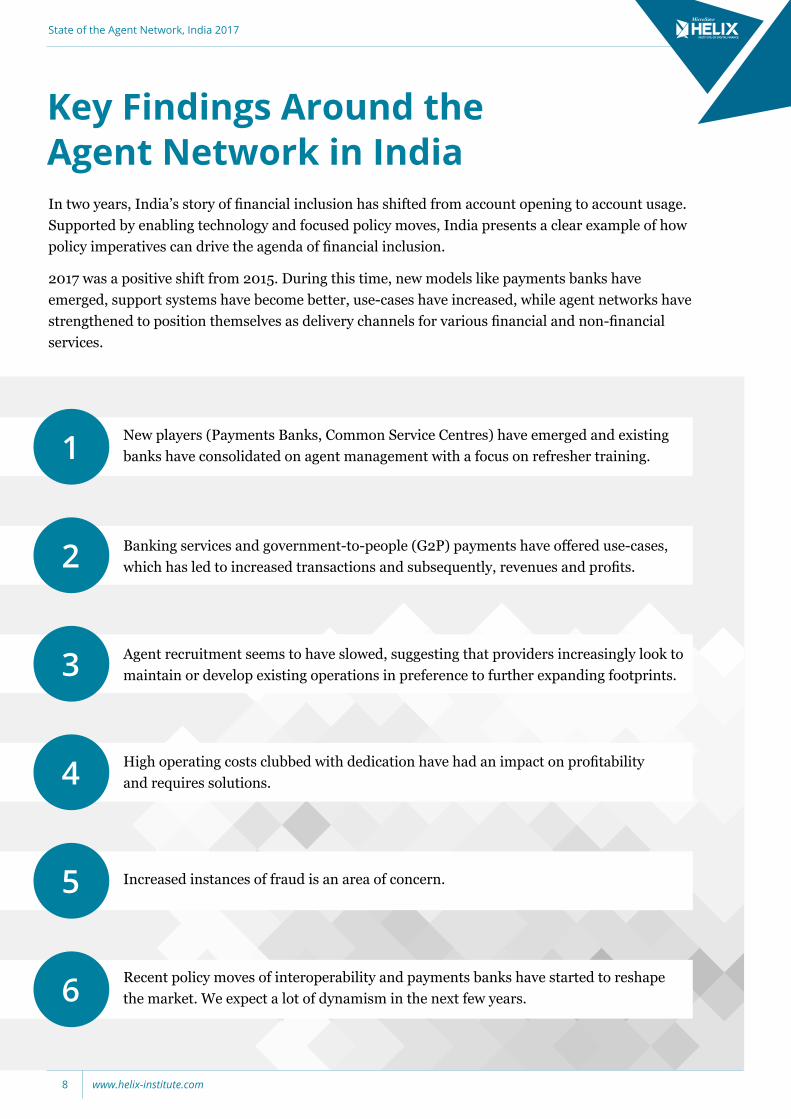
In two years, India’s story of financial inclusion has shifted from account opening to account usage. Supported by enabling technology and focused policy moves, India presents a clear example of how policy imperatives can drive the agenda of financial inclusion.
2017 was a positive shift from 2015. During this time, new models like payments banks have emerged, support systems have become better, use-cases have increased, while agent networks have strengthened to position themselves as delivery channels for various financial and non-financial services.
Key Findings Around the Agent Network in India
1 New players (Payments Banks, Common Service Centres) have emerged and existing banks have consolidated on agent management with a focus on refresher training.
2 Banking services and government-to-people (G2P) payments have offered use-cases, which has led to increased transactions and subsequently, revenues and profits.
3 Agent recruitment seems to have slowed, suggesting that providers increasingly look to maintain or develop existing operations in preference to further expanding footprints.
4 High operating costs clubbed with dedication have had an impact on profitability and requires solutions.
5 Increased instances of fraud is an area of concern.
6 Recent policy moves of interoperability and payments banks have started to reshape the market. We expect a lot of dynamism in the next few years.
State of the Agent Network, India 2017
www.helix-institute.com8
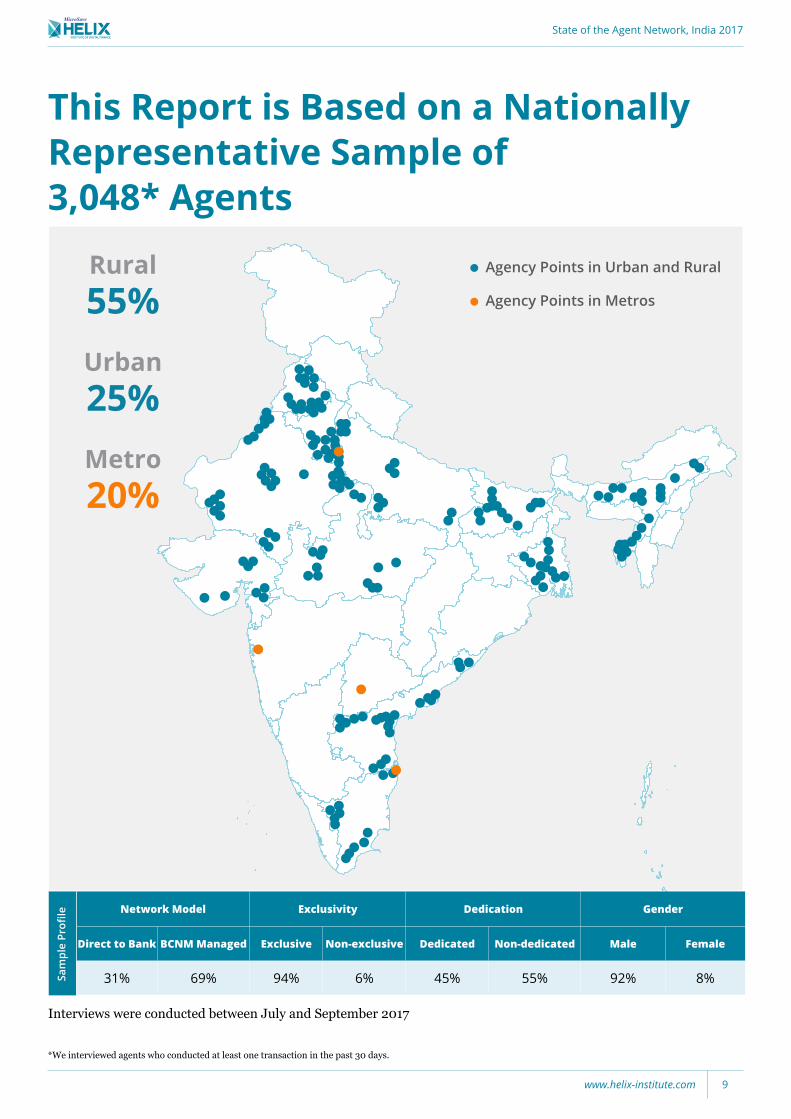
This Report is Based on a Nationally Representative Sample of 3,048* Agents
Agency Points in Urban and Rural
Agency Points in Metros
Network Model Exclusivity Dedication Gender
Direct to Bank BCNM Managed Exclusive Non-exclusive Dedicated Non-dedicated Male Female
31% 69% 94% 6% 45% 55% 92% 8%Sam
ple
Profi
le
Metro20%
Rural55%Urban25%
*We interviewed agents who conducted at least one transaction in the past 30 days.
Interviews were conducted between July and September 2017
State of the Agent Network, India 2017
www.helix-institute.com 9
Agent Network Structure
State of the Agent Network, India 2017
www.helix-institute.com10
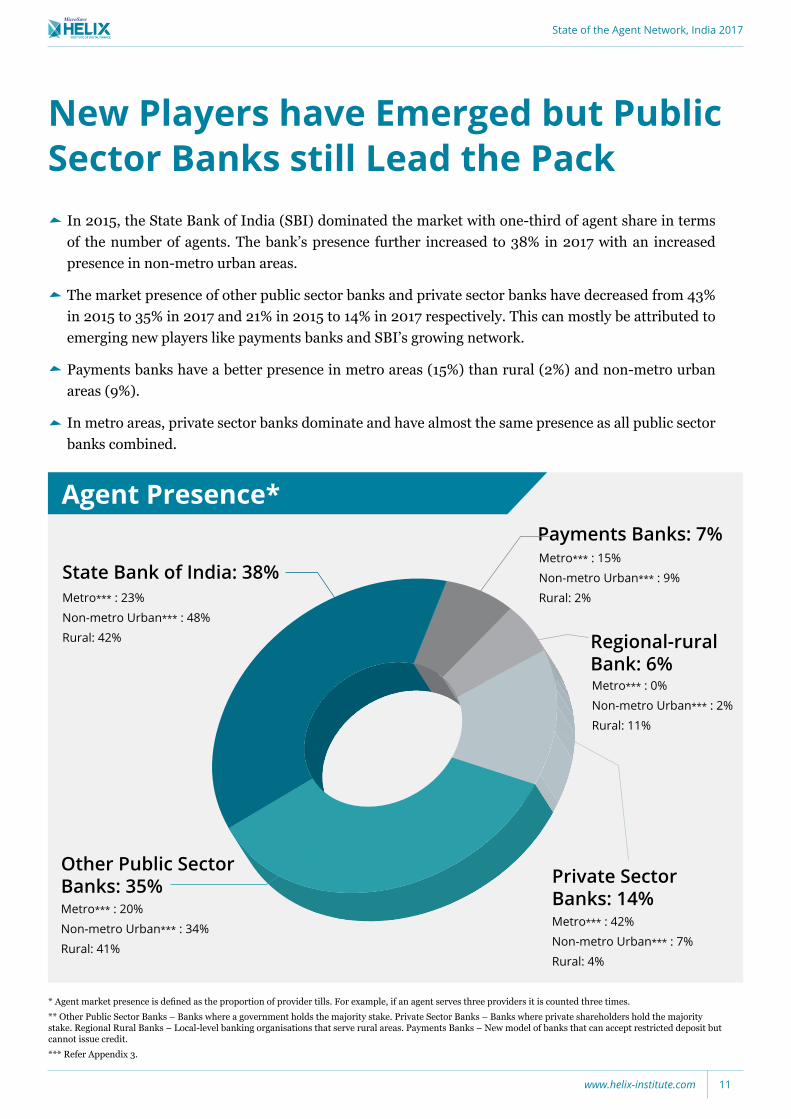
New Players have Emerged but Public Sector Banks still Lead the Pack
In 2015, the State Bank of India (SBI) dominated the market with one-third of agent share in terms of the number of agents. The bank’s presence further increased to 38% in 2017 with an increased presence in non-metro urban areas.
The market presence of other public sector banks and private sector banks have decreased from 43% in 2015 to 35% in 2017 and 21% in 2015 to 14% in 2017 respectively. This can mostly be attributed to emerging new players like payments banks and SBI’s growing network.
Payments banks have a better presence in metro areas (15%) than rural (2%) and non-metro urban areas (9%).
In metro areas, private sector banks dominate and have almost the same presence as all public sector banks combined.
* Agent market presence is defined as the proportion of provider tills. For example, if an agent serves three providers it is counted three times.** Other Public Sector Banks – Banks where a government holds the majority stake. Private Sector Banks – Banks where private shareholders hold the majority stake. Regional Rural Banks – Local-level banking organisations that serve rural areas. Payments Banks – New model of banks that can accept restricted deposit but cannot issue credit. *** Refer Appendix 3.
Agent Presence*
State Bank of India: 38%Metro*** : 23%
Non-metro Urban*** : 48%
Rural: 42%
Metro*** : 20%
Non-metro Urban*** : 34%
Rural: 41%
Metro*** : 42%
Non-metro Urban*** : 7%
Rural: 4%
Metro*** : 15%
Non-metro Urban*** : 9%
Rural: 2%
Metro*** : 0%
Non-metro Urban*** : 2%
Rural: 11%
Other Public Sector Banks: 35% Private Sector
Banks: 14%
Payments Banks: 7%
Regional-rural Bank: 6%
State of the Agent Network, India 2017
www.helix-institute.com 11
Non-exclusivity: ANA Research Countries*
Pakistan 2014
Tanzania 2013
Senegal 2015
Uganda 2013
Bangladesh 2014
Kenya 2013
India 2015
Zambia 2015
Indonesia 2017
Kenya 2014
Tanzania 2015
Uganda 2015
Bangladesh 2016
Pakistan 2017
India 2017
78%
4%
6%11%
72%
13%
70%
16%64%
57%56%
66%
9%
66%
4%
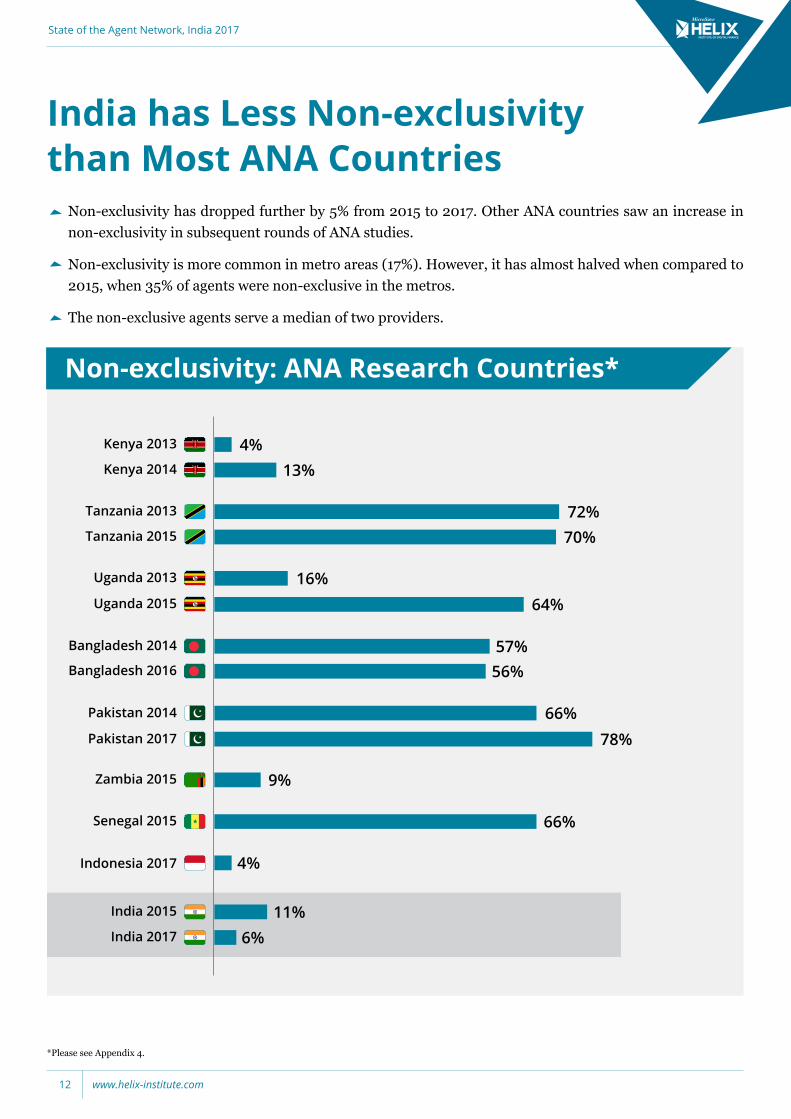
Non-exclusivity has dropped further by 5% from 2015 to 2017. Other ANA countries saw an increase in non-exclusivity in subsequent rounds of ANA studies.
Non-exclusivity is more common in metro areas (17%). However, it has almost halved when compared to 2015, when 35% of agents were non-exclusive in the metros.
The non-exclusive agents serve a median of two providers.
India has Less Non-exclusivity than Most ANA Countries
*Please see Appendix 4.
State of the Agent Network, India 2017
www.helix-institute.com12
Non-dedication: ANA Research Countries*
Pakistan 2014
Tanzania 2013
Senegal 2015
Uganda 2013
Bangladesh 2014
Kenya 2013
India 2015
Zambia 2015
Indonesia 2017
Kenya 2014
Tanzania 2015
Uganda 2015
Bangladesh 2016
Pakistan 2017
India 2017
*Please see Appendix 4.
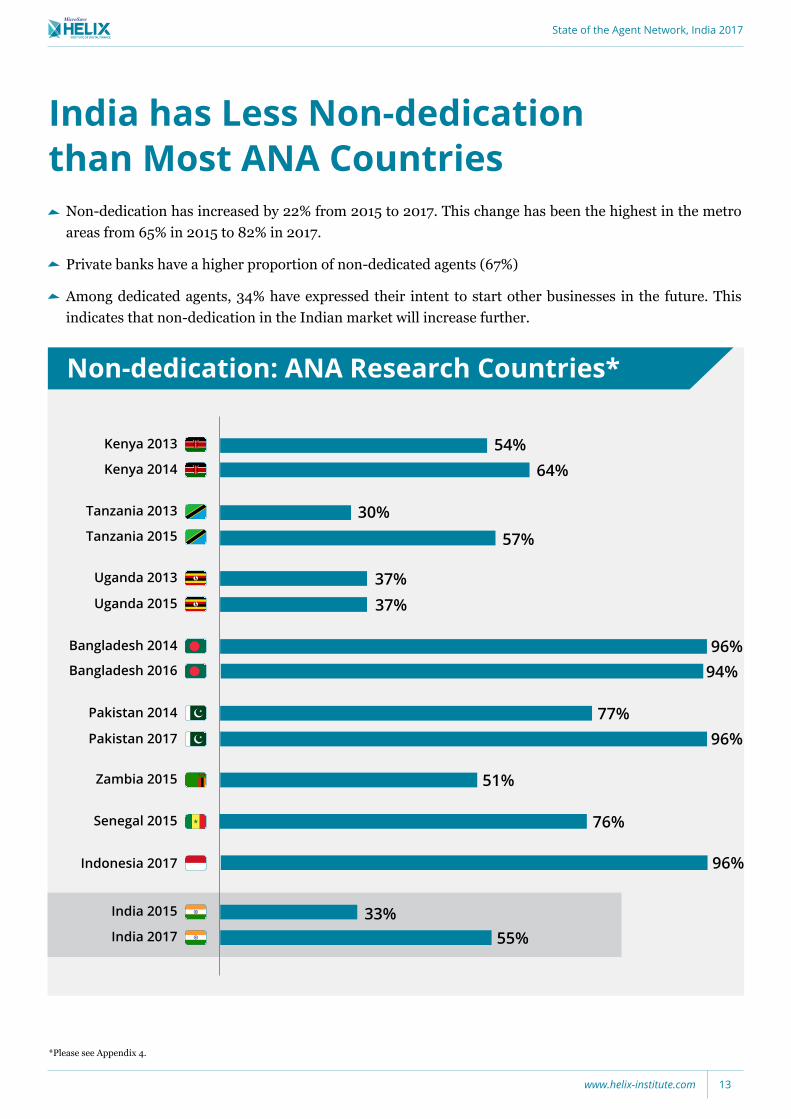
India has Less Non-dedication than Most ANA Countries
Non-dedication has increased by 22% from 2015 to 2017. This change has been the highest in the metro areas from 65% in 2015 to 82% in 2017.
Private banks have a higher proportion of non-dedicated agents (67%)
Among dedicated agents, 34% have expressed their intent to start other businesses in the future. This indicates that non-dedication in the Indian market will increase further.
64%
57%
54%
30%
37%37%
96%94%
77%96%
51%
76%
96%
33%55%
State of the Agent Network, India 2017
www.helix-institute.com 13
Age of Agency*
The mean age of the agents is
33 years
63% of agents are either graduates
or above or have a diploma
30% of agents conduct
transactions outside of their shop as well.
84% of agents are owners of
the shop
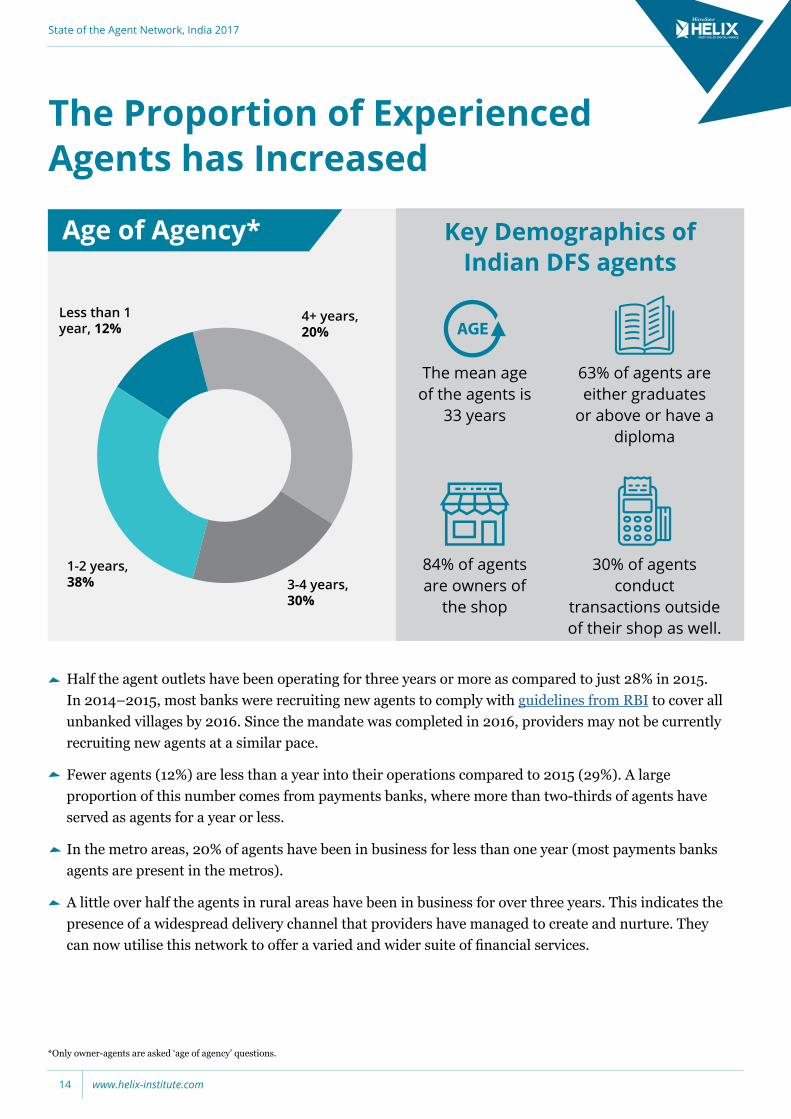
Key Demographics of Indian DFS agents
4+ years, 20%
3-4 years, 30%
Less than 1 year, 12%
1-2 years, 38%
Half the agent outlets have been operating for three years or more as compared to just 28% in 2015. In 2014–2015, most banks were recruiting new agents to comply with guidelines from RBI to cover all unbanked villages by 2016. Since the mandate was completed in 2016, providers may not be currently recruiting new agents at a similar pace.
Fewer agents (12%) are less than a year into their operations compared to 2015 (29%). A large proportion of this number comes from payments banks, where more than two-thirds of agents have served as agents for a year or less.
In the metro areas, 20% of agents have been in business for less than one year (most payments banks agents are present in the metros).
A little over half the agents in rural areas have been in business for over three years. This indicates the presence of a widespread delivery channel that providers have managed to create and nurture. They can now utilise this network to offer a varied and wider suite of financial services.
The Proportion of Experienced Agents has Increased
*Only owner-agents are asked ‘age of agency’ questions.
State of the Agent Network, India 2017
www.helix-institute.com14
Agent Viability
State of the Agent Network, India 2017
www.helix-institute.com 15
2015
2017
Cash-in into account
Cash-out from account
Domestic Remittances
Linking Aadhaar to Bank Accounts
Insurance Registration (Government)
Pension Registration
Account Opening (PMJDY)
Account Opening (General)
Balance Enquiry
Utility Bill Payments
Insurance Registration (Bank)
*Please refer Appendix 5 for definitions of different products and services.
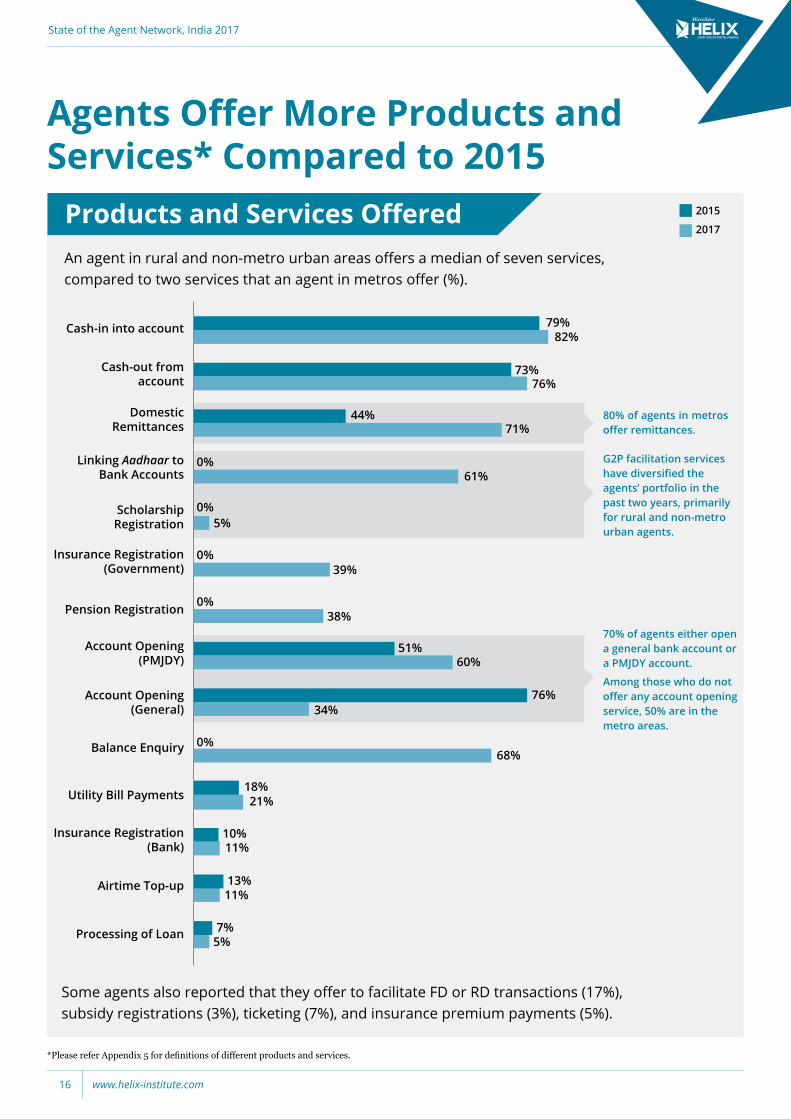
Some agents also reported that they offer to facilitate FD or RD transactions (17%), subsidy registrations (3%), ticketing (7%), and insurance premium payments (5%).
Airtime Top-up
Processing of Loan
An agent in rural and non-metro urban areas offers a median of seven services, compared to two services that an agent in metros offer (%).
79%82%
44%71%
73%76%
61%0%
0%
39%
38%
Scholarship Registration 5%
51%60%
76%34%
68%
18%21%
10%11%
11%13%
5%7%
80% of agents in metros offer remittances.
G2P facilitation services have diversified the agents’ portfolio in the past two years, primarily for rural and non-metro urban agents.
70% of agents either open a general bank account or a PMJDY account.
Among those who do not offer any account opening service, 50% are in the metro areas.
Agents Offer More Products and Services* Compared to 2015
Products and Services Offered
0%
0%
0%
State of the Agent Network, India 2017
www.helix-institute.com16
Median Daily Transactions:ANA Research Countries
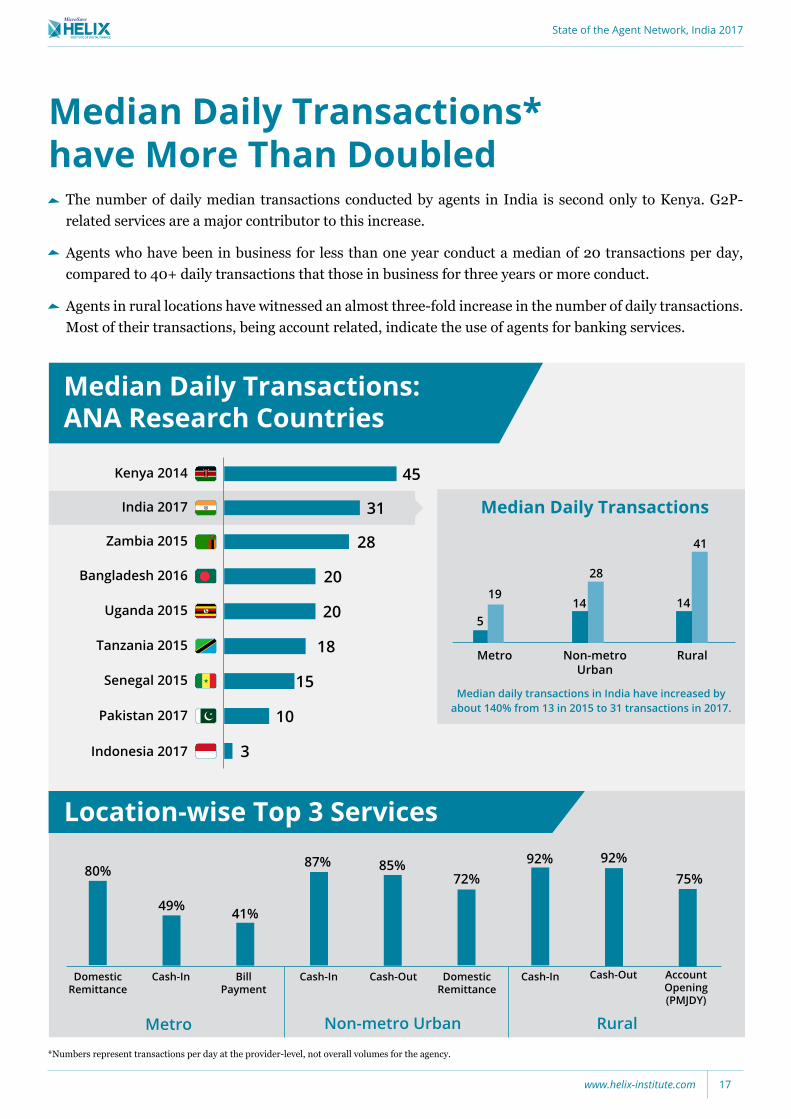
Median Daily Transactions* have More Than Doubled
*Numbers represent transactions per day at the provider-level, not overall volumes for the agency.
The number of daily median transactions conducted by agents in India is second only to Kenya. G2P-related services are a major contributor to this increase.
Agents who have been in business for less than one year conduct a median of 20 transactions per day, compared to 40+ daily transactions that those in business for three years or more conduct.
Agents in rural locations have witnessed an almost three-fold increase in the number of daily transactions. Most of their transactions, being account related, indicate the use of agents for banking services.
India 2017 31
Kenya 2014 45
Zambia 2015 28
Bangladesh 2016 20
Tanzania 2015 18
Senegal 2015 15
Uganda 2015 20
Pakistan 2017 10
Indonesia 2017 3
Rural
41
Metro Non-metro Urban
14
28
1419
5
Median daily transactions in India have increased by about 140% from 13 in 2015 to 31 transactions in 2017.
Median Daily Transactions
Domestic Remittance
80%
49% 41%
87% 85%72%
92% 92%75%
Cash-Out Domestic Remittance
Cash-In Cash-Out Account Opening (PMJDY)
Cash-InBill Payment
Cash-In
Metro Non-metro Urban Rural
Location-wise Top 3 Services
State of the Agent Network, India 2017
www.helix-institute.com 17
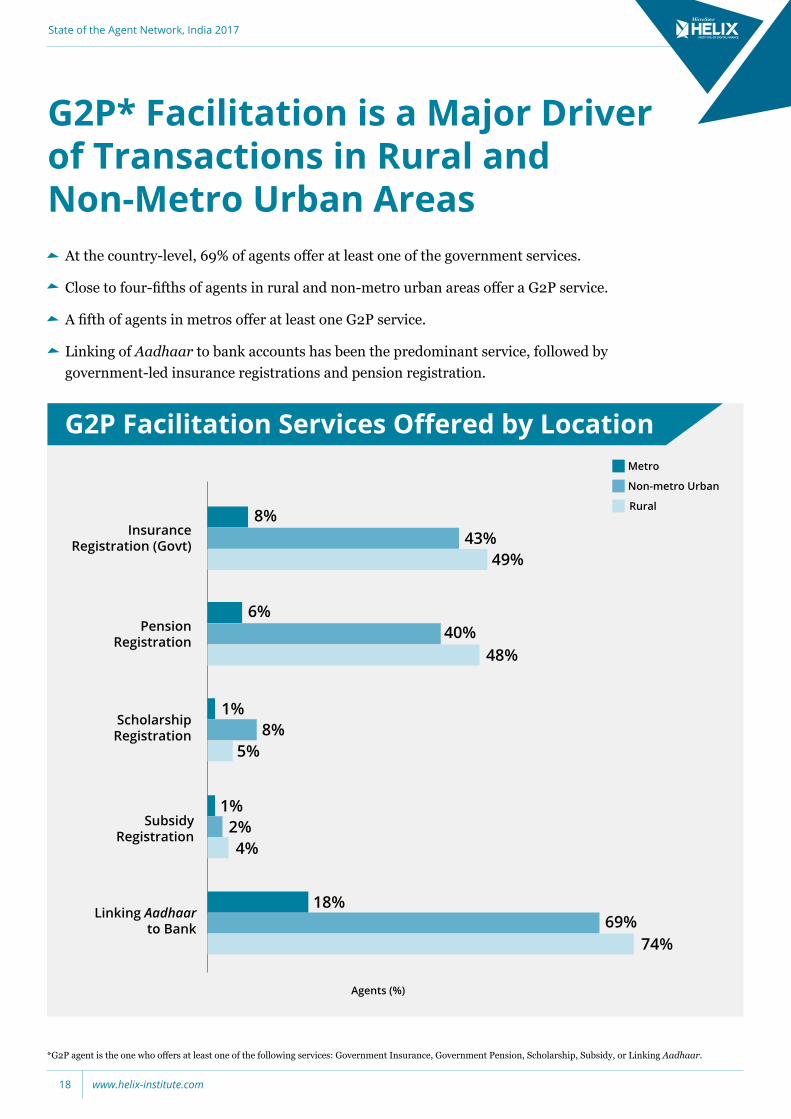
At the country-level, 69% of agents offer at least one of the government services.
Close to four-fifths of agents in rural and non-metro urban areas offer a G2P service.
A fifth of agents in metros offer at least one G2P service.
Linking of Aadhaar to bank accounts has been the predominant service, followed by government-led insurance registrations and pension registration.
Insurance Registration (Govt)
Metro
Non-metro Urban
Rural
5%
4%
18%69%
74%
8%
2%
1%
1%
48%40%
6%
8%
49%43%
Pension Registration
Scholarship Registration
Subsidy Registration
Linking Aadhaar to Bank
G2P* Facilitation is a Major Driver of Transactions in Rural and Non-Metro Urban Areas
G2P Facilitation Services Offered by Location
*G2P agent is the one who offers at least one of the following services: Government Insurance, Government Pension, Scholarship, Subsidy, or Linking Aadhaar.
Agents (%)
State of the Agent Network, India 2017
www.helix-institute.com18
Insurance Registration (Govt)
Metro
Non-metro Urban
Rural
Pension Registration
Scholarship Registration
Subsidy Registration
Linking Aadhaar to Bank
G2P Facilitation Services Offered by Location
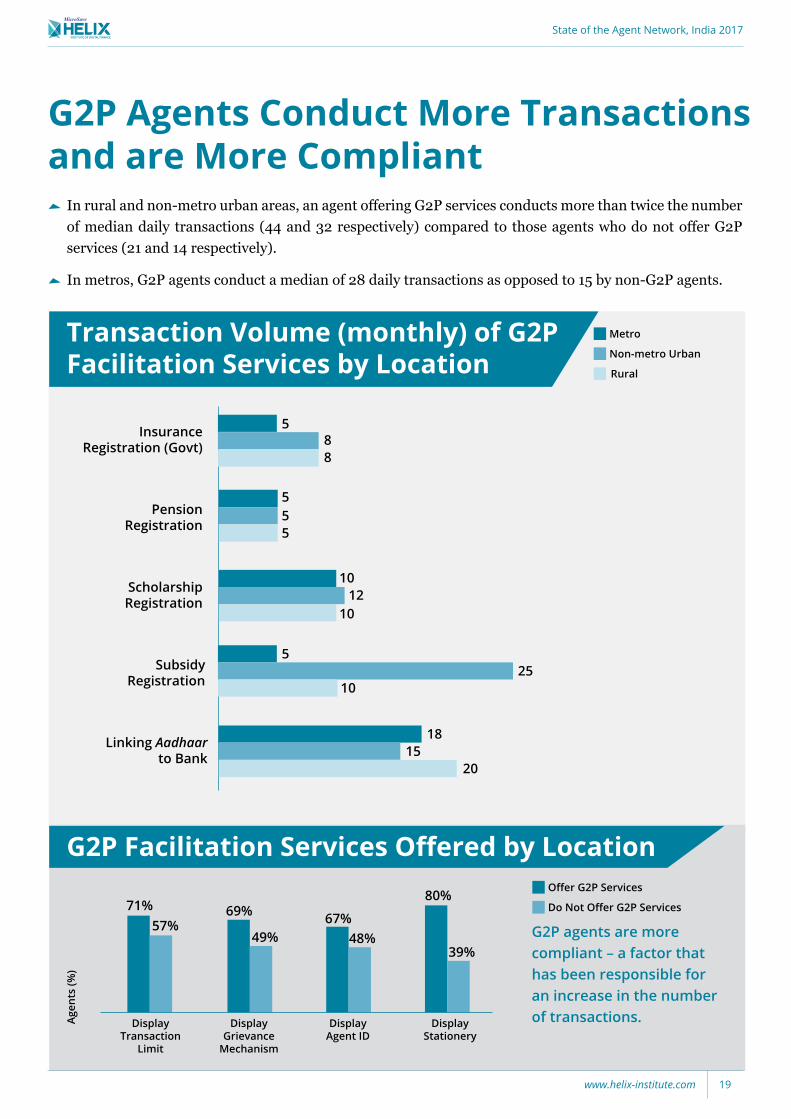
Transaction Volume (monthly) of G2P Facilitation Services by Location
G2P Agents Conduct More Transactions and are More Compliant
In rural and non-metro urban areas, an agent offering G2P services conducts more than twice the number of median daily transactions (44 and 32 respectively) compared to those agents who do not offer G2P services (21 and 14 respectively).
In metros, G2P agents conduct a median of 28 daily transactions as opposed to 15 by non-G2P agents.
5
555
525
10
10
10
1815
20
12
88
Offer G2P Services
Do Not Offer G2P Services71% 69%
49%67%
48%
80%
39%
57%
Display Grievance
Mechanism
Display Agent ID
Display Stationery
Display Transaction
Limit
Agen
ts (%
)
G2P agents are more compliant – a factor that has been responsible for an increase in the number of transactions.
State of the Agent Network, India 2017
www.helix-institute.com 19
Median # of Transactions per Month
Transaction Value (median in USD)
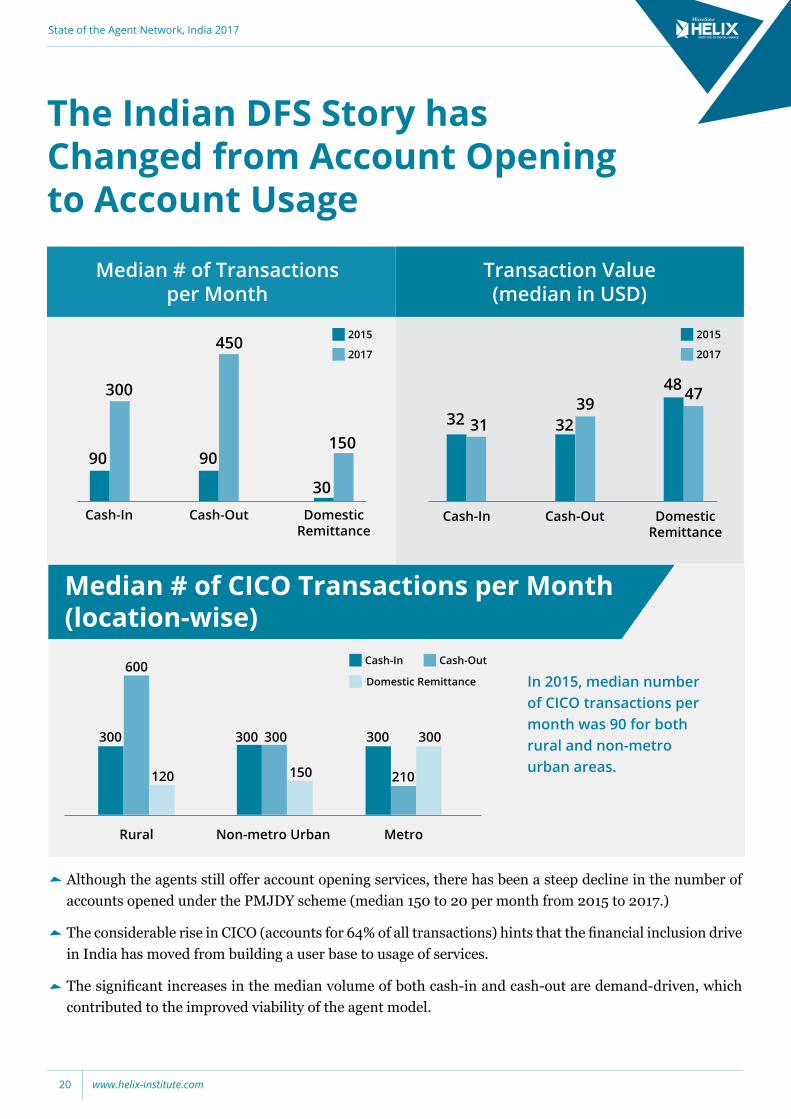
Although the agents still offer account opening services, there has been a steep decline in the number of accounts opened under the PMJDY scheme (median 150 to 20 per month from 2015 to 2017.)
The considerable rise in CICO (accounts for 64% of all transactions) hints that the financial inclusion drive in India has moved from building a user base to usage of services.
The significant increases in the median volume of both cash-in and cash-out are demand-driven, which contributed to the improved viability of the agent model.
Cash-In
90
Cash-Out Domestic Remittance
150
30
450
90
300
2015 2015
2017 2017
Cash-In Cash-Out Domestic Remittance
474839
323132
Rural
300 300 300 300 300
210
Non-metro Urban Metro
150
600
120
Cash-In Cash-Out
Domestic Remittance
The Indian DFS Story has Changed from Account Opening to Account Usage
Median # of CICO Transactions per Month(location-wise)
In 2015, median number of CICO transactions per month was 90 for both rural and non-metro urban areas.
State of the Agent Network, India 2017
www.helix-institute.com20
Median Revenues have More Than Doubled
Median Total Monthly Revenue (USD)*
Senegal 2015 320160
Kenya 2014220
110
India 2017310
93
Bangladesh 2016257
77
Pakistan 2017 26476
Current Prices
PPP Adjusted**
Median Monthly Revenue-India (USD) 2015
2017
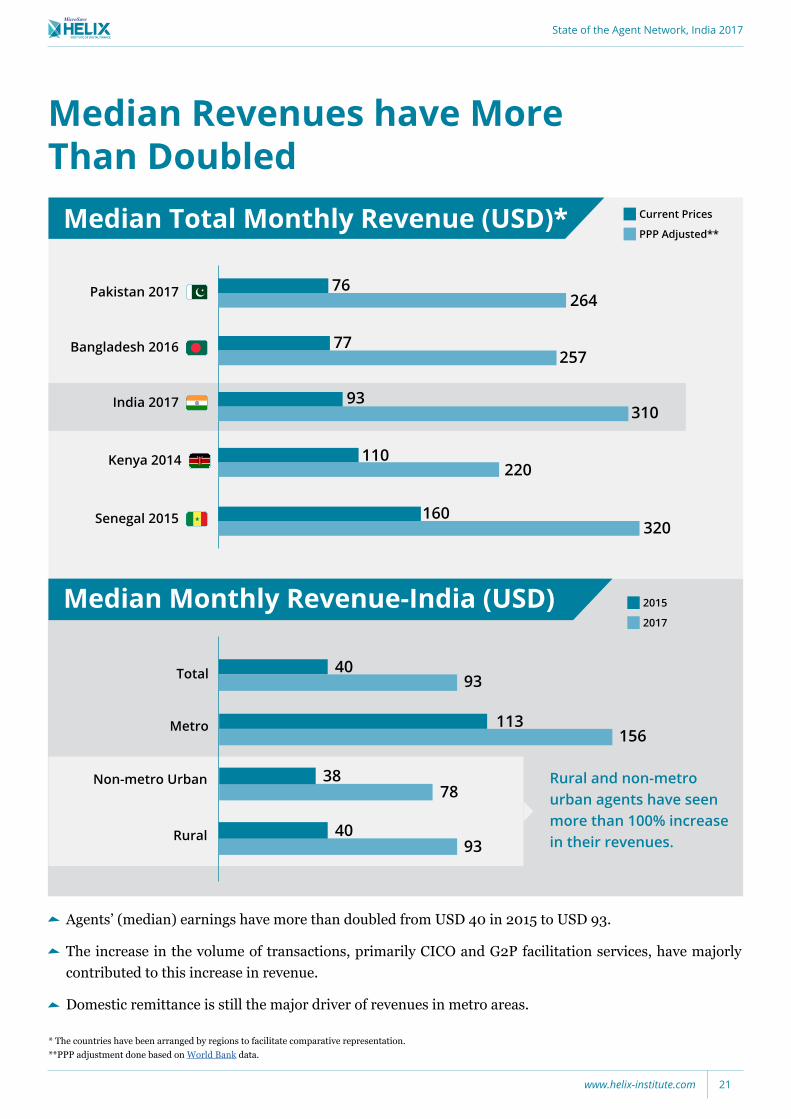
Rural and non-metro urban agents have seen more than 100% increase in their revenues.Rural
Non-metro Urban
Metro
4093
113
38
4093
78
156
Total
Agents’ (median) earnings have more than doubled from USD 40 in 2015 to USD 93.
The increase in the volume of transactions, primarily CICO and G2P facilitation services, have majorly contributed to this increase in revenue.
Domestic remittance is still the major driver of revenues in metro areas.
* The countries have been arranged by regions to facilitate comparative representation. **PPP adjustment done based on World Bank data.
State of the Agent Network, India 2017
www.helix-institute.com 21
Median Monthly Profitability Comparison* (in USD)
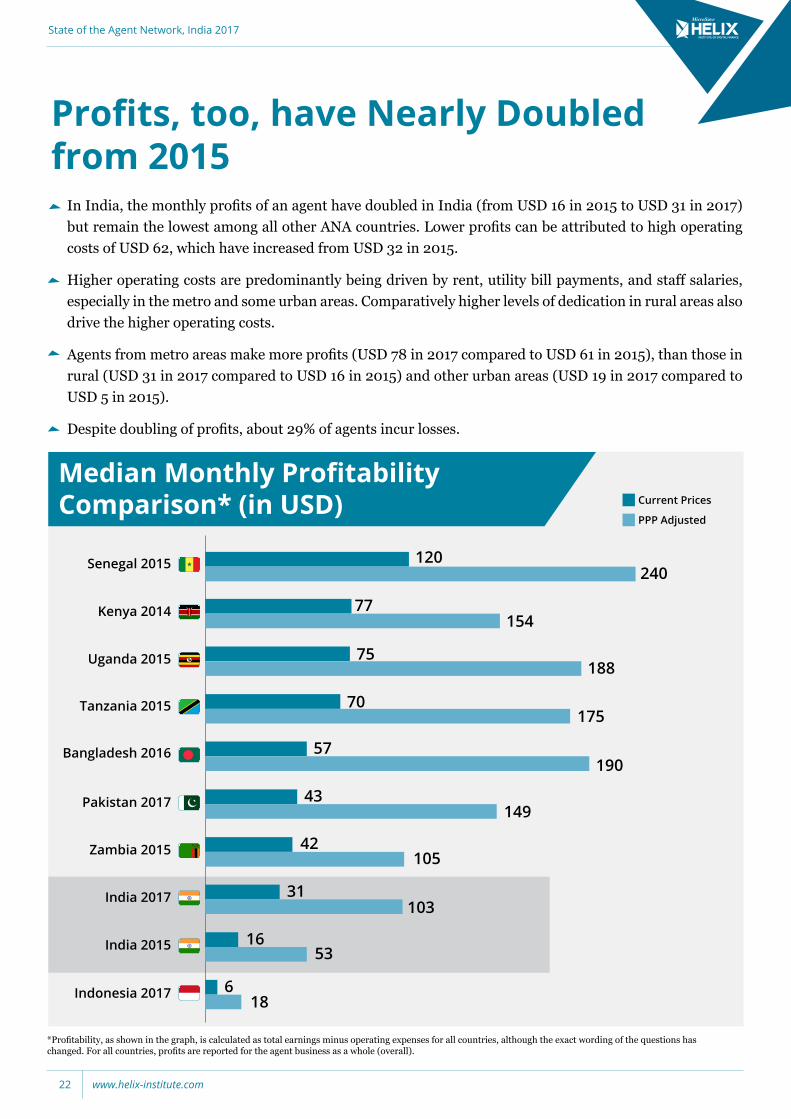
*Profitability, as shown in the graph, is calculated as total earnings minus operating expenses for all countries, although the exact wording of the questions has changed. For all countries, profits are reported for the agent business as a whole (overall).
In India, the monthly profits of an agent have doubled in India (from USD 16 in 2015 to USD 31 in 2017) but remain the lowest among all other ANA countries. Lower profits can be attributed to high operating costs of USD 62, which have increased from USD 32 in 2015.
Higher operating costs are predominantly being driven by rent, utility bill payments, and staff salaries, especially in the metro and some urban areas. Comparatively higher levels of dedication in rural areas also drive the higher operating costs.
Agents from metro areas make more profits (USD 78 in 2017 compared to USD 61 in 2015), than those in rural (USD 31 in 2017 compared to USD 16 in 2015) and other urban areas (USD 19 in 2017 compared to USD 5 in 2015).
Despite doubling of profits, about 29% of agents incur losses.
70175
43149Pakistan 2017
Tanzania 2015
120240
Senegal 2015
75188Uganda 2015
57190
Bangladesh 2016
1653India 2015
42105Zambia 2015
Indonesia 2017 618
31103
India 2017
154Kenya 2014 77
Current Prices
PPP Adjusted
Profits, too, have Nearly Doubled from 2015
State of the Agent Network, India 2017
www.helix-institute.com22
High Operating Expense is a Cause for Concern
Operating Costs (USD) per Month In ANA Countries*
Senegal 2015 3216
4313Bangladesh 2016
Kenya 2014 7035
9328Pakistan 2017
India 2017 20762
Opex
PPP Adjusted
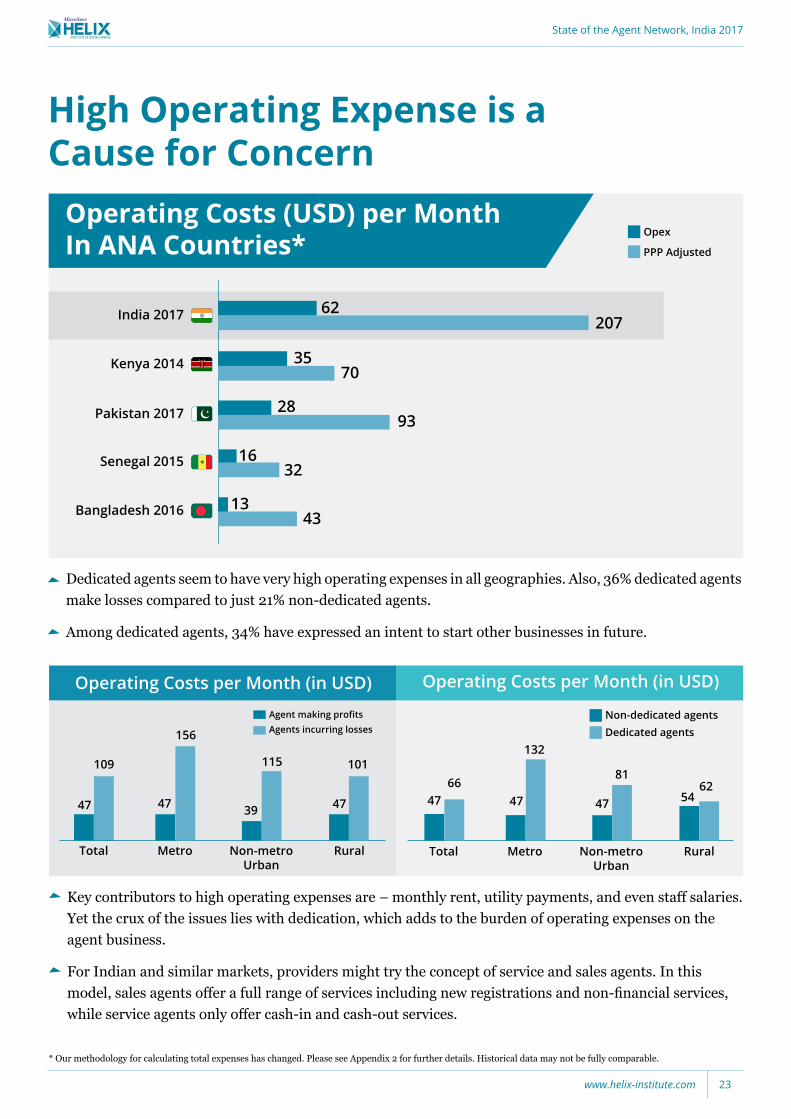
Dedicated agents seem to have very high operating expenses in all geographies. Also, 36% dedicated agents make losses compared to just 21% non-dedicated agents.
Among dedicated agents, 34% have expressed an intent to start other businesses in future.
* Our methodology for calculating total expenses has changed. Please see Appendix 2 for further details. Historical data may not be fully comparable.
Key contributors to high operating expenses are – monthly rent, utility payments, and even staff salaries. Yet the crux of the issues lies with dedication, which adds to the burden of operating expenses on the agent business.
For Indian and similar markets, providers might try the concept of service and sales agents. In this model, sales agents offer a full range of services including new registrations and non-financial services, while service agents only offer cash-in and cash-out services.
Operating Costs per Month (in USD) Operating Costs per Month (in USD)
Total
47
Metro Non-metro Urban
115
39
156
47
109
Agent making profitsAgents incurring losses
101
47
Rural Total
47
Metro Non-metro Urban
81
47
132
4766
Non-dedicated agentsDedicated agents
6254
Rural
State of the Agent Network, India 2017
www.helix-institute.com 23
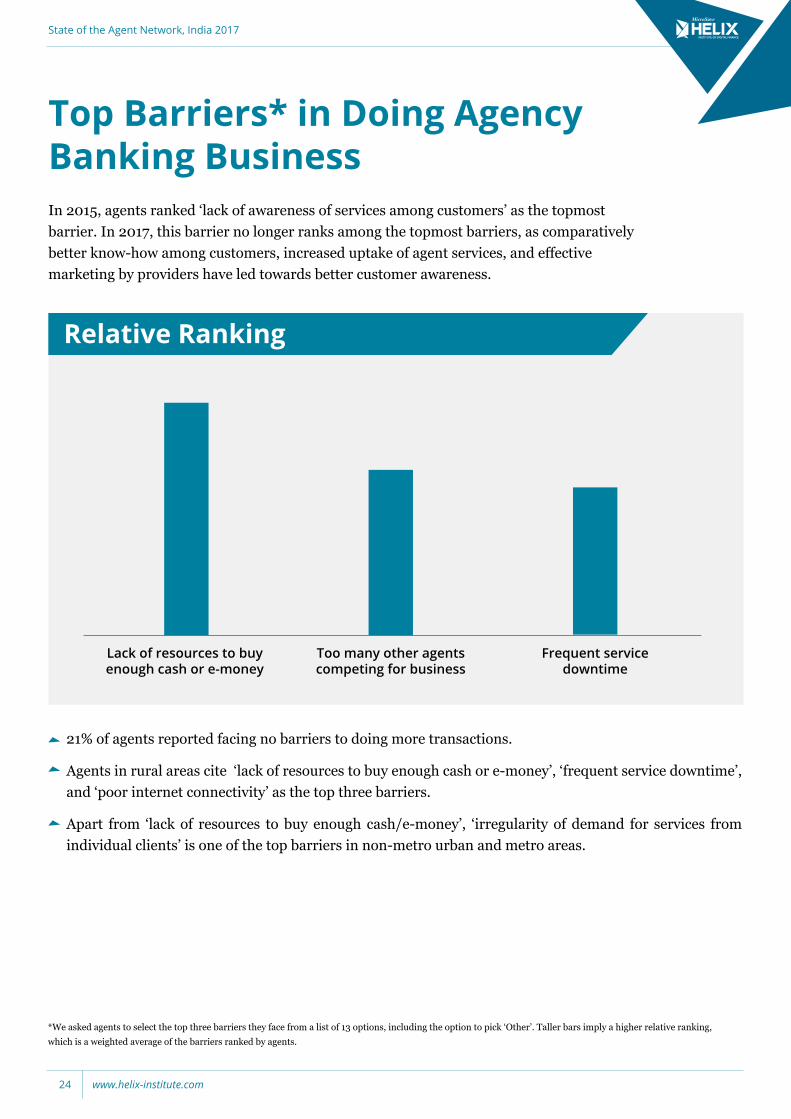
*We asked agents to select the top three barriers they face from a list of 13 options, including the option to pick ‘Other’. Taller bars imply a higher relative ranking, which is a weighted average of the barriers ranked by agents.
In 2015, agents ranked ‘lack of awareness of services among customers’ as the topmost barrier. In 2017, this barrier no longer ranks among the topmost barriers, as comparatively better know-how among customers, increased uptake of agent services, and effective marketing by providers have led towards better customer awareness.
21% of agents reported facing no barriers to doing more transactions.
Agents in rural areas cite ‘lack of resources to buy enough cash or e-money’, ‘frequent service downtime’, and ‘poor internet connectivity’ as the top three barriers.
Apart from ‘lack of resources to buy enough cash/e-money’, ‘irregularity of demand for services from individual clients’ is one of the top barriers in non-metro urban and metro areas.
Relative Ranking
Lack of resources to buy enough cash or e-money
Too many other agents competing for business
Frequent service downtime
Top Barriers* in Doing Agency Banking Business
State of the Agent Network, India 2017
www.helix-institute.com24
Quality of Provider Support
State of the Agent Network, India 2017
www.helix-institute.com 25
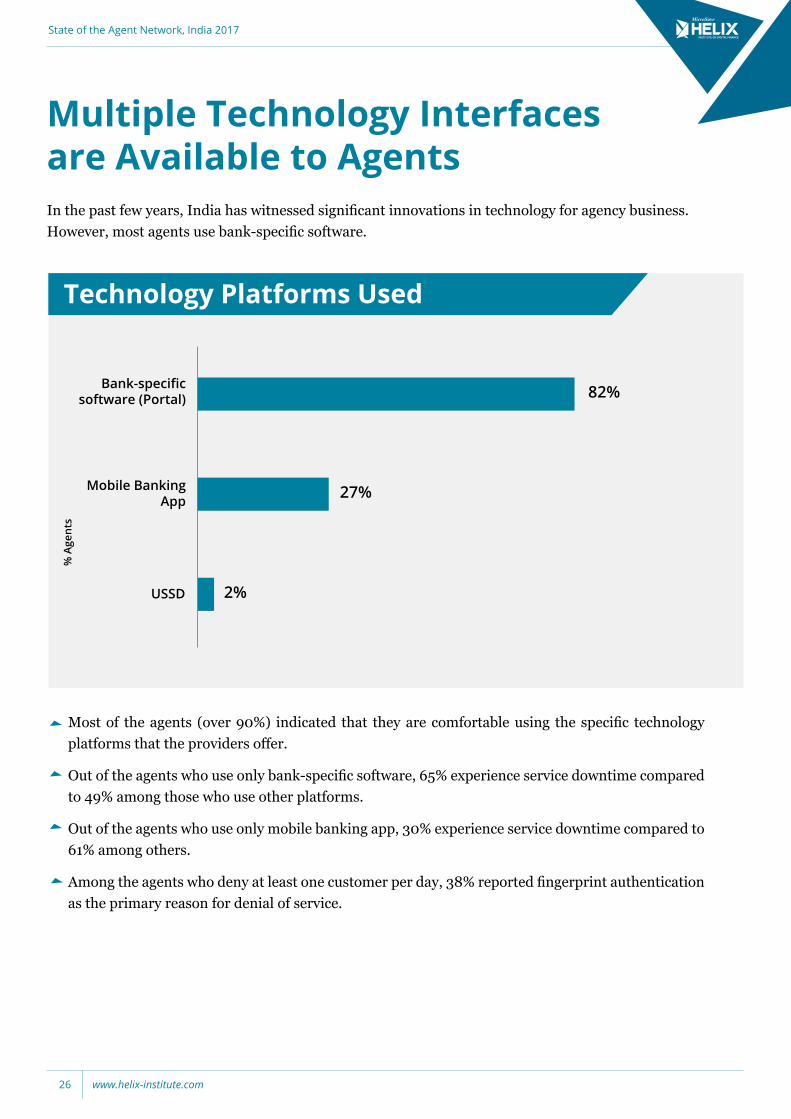
In the past few years, India has witnessed significant innovations in technology for agency business. However, most agents use bank-specific software.
Most of the agents (over 90%) indicated that they are comfortable using the specific technology platforms that the providers offer.
Out of the agents who use only bank-specific software, 65% experience service downtime compared to 49% among those who use other platforms.
Out of the agents who use only mobile banking app, 30% experience service downtime compared to 61% among others.
Among the agents who deny at least one customer per day, 38% reported fingerprint authentication as the primary reason for denial of service.
Bank-specific software (Portal) 82%
USSD 2%
Mobile Banking App 27%
Multiple Technology Interfaces are Available to Agents
Technology Platforms Used
% A
gent
s
State of the Agent Network, India 2017
www.helix-institute.com26
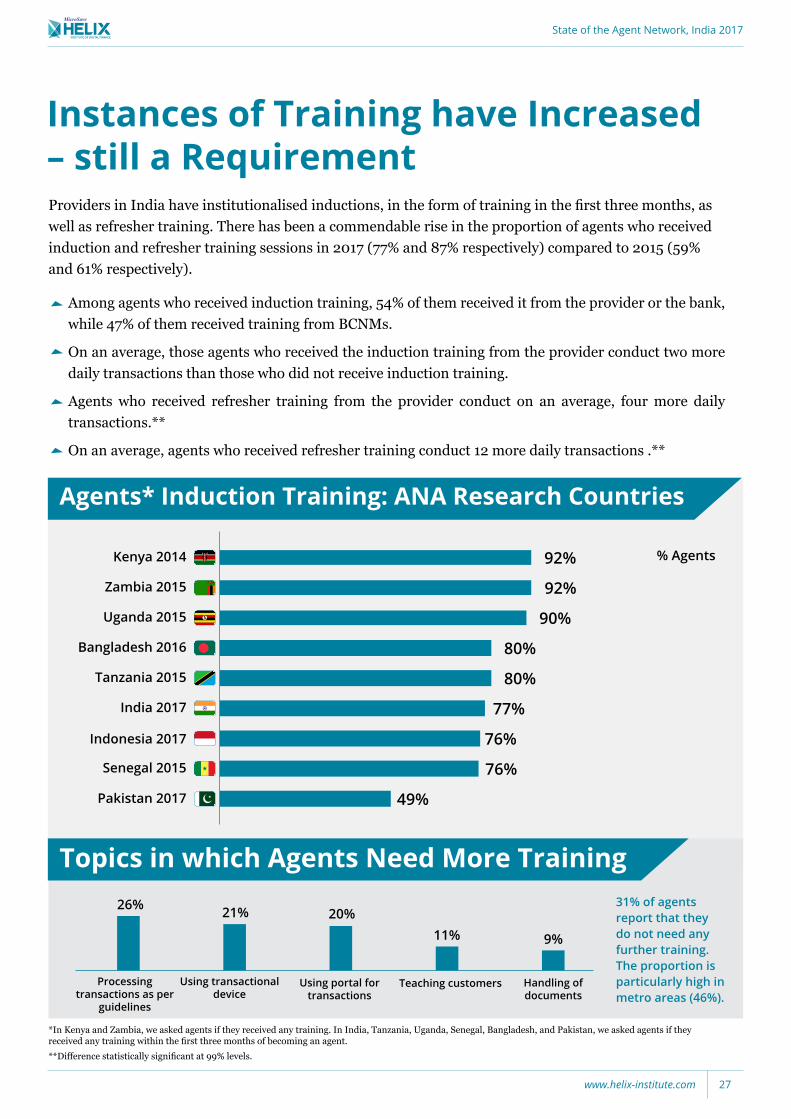
Instances of Training have Increased – still a Requirement Providers in India have institutionalised inductions, in the form of training in the first three months, as well as refresher training. There has been a commendable rise in the proportion of agents who received induction and refresher training sessions in 2017 (77% and 87% respectively) compared to 2015 (59% and 61% respectively).
Among agents who received induction training, 54% of them received it from the provider or the bank, while 47% of them received training from BCNMs.
On an average, those agents who received the induction training from the provider conduct two more daily transactions than those who did not receive induction training.
Agents who received refresher training from the provider conduct on an average, four more daily transactions.**
On an average, agents who received refresher training conduct 12 more daily transactions .**
Agents* Induction Training: ANA Research Countries
Kenya 2014 92%
92%Zambia 2015
Bangladesh 2016 80%
India 2017 77%
90%Uganda 2015
Tanzania 2015 80%
Senegal 2015 76%
76%Indonesia 2017
Pakistan 2017 49%
% Agents
*In Kenya and Zambia, we asked agents if they received any training. In India, Tanzania, Uganda, Senegal, Bangladesh, and Pakistan, we asked agents if they received any training within the first three months of becoming an agent. **Difference statistically significant at 99% levels.
Topics in which Agents Need More Training
Teaching customers Handling of documents
Using transactional device
Using portal for transactions
Processing transactions as per
guidelines
26% 21% 20%11% 9%
31% of agents report that they do not need any further training. The proportion is particularly high in metro areas (46%).
State of the Agent Network, India 2017
www.helix-institute.com 27
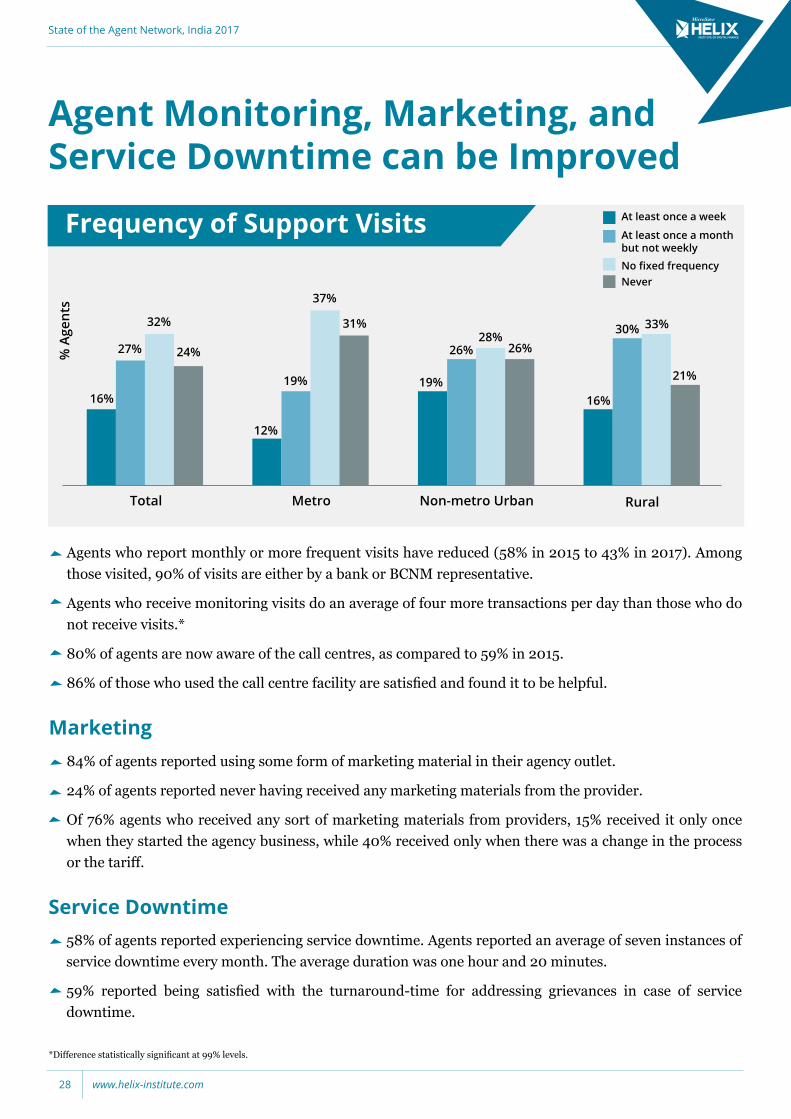
16
27%
16%
32%
24%
Total Metro Non-metro Urban
*Difference statistically significant at 99% levels.
Frequency of Support Visits At least once a week
At least once a month but not weekly
No fixed frequencyNever
Rural
% A
gent
s
12%
19%
37%
31%
19%
26%28%
26%
16%
30% 33%
21%
Agents who report monthly or more frequent visits have reduced (58% in 2015 to 43% in 2017). Among those visited, 90% of visits are either by a bank or BCNM representative.
Agents who receive monitoring visits do an average of four more transactions per day than those who do not receive visits.*
80% of agents are now aware of the call centres, as compared to 59% in 2015.
86% of those who used the call centre facility are satisfied and found it to be helpful.
84% of agents reported using some form of marketing material in their agency outlet.
24% of agents reported never having received any marketing materials from the provider.
Of 76% agents who received any sort of marketing materials from providers, 15% received it only once when they started the agency business, while 40% received only when there was a change in the process or the tariff.
Marketing
58% of agents reported experiencing service downtime. Agents reported an average of seven instances of service downtime every month. The average duration was one hour and 20 minutes.
59% reported being satisfied with the turnaround-time for addressing grievances in case of service downtime.
Service Downtime
Agent Monitoring, Marketing, and Service Downtime can be Improved
State of the Agent Network, India 2017
www.helix-institute.com28
*Difference statistically significant at 99% levels.
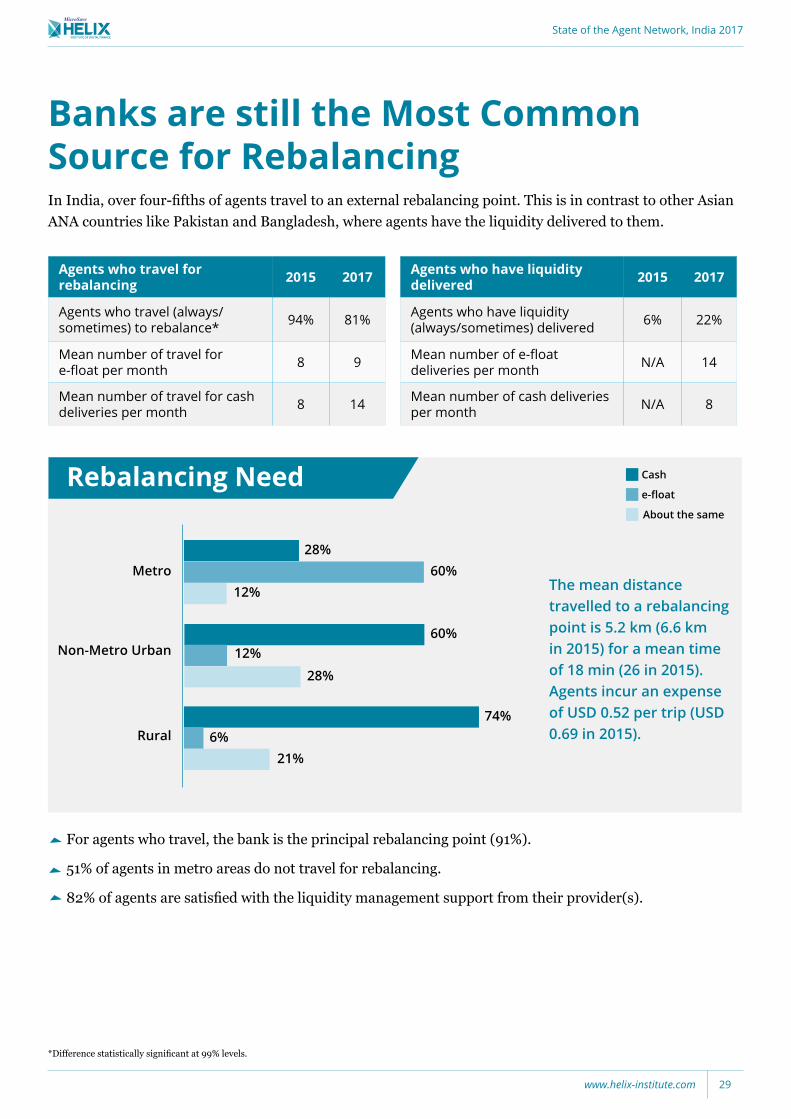
Banks are still the Most Common Source for RebalancingIn India, over four-fifths of agents travel to an external rebalancing point. This is in contrast to other Asian ANA countries like Pakistan and Bangladesh, where agents have the liquidity delivered to them.
For agents who travel, the bank is the principal rebalancing point (91%).
51% of agents in metro areas do not travel for rebalancing.
82% of agents are satisfied with the liquidity management support from their provider(s).
Rebalancing Need
The mean distance travelled to a rebalancing point is 5.2 km (6.6 km in 2015) for a mean time of 18 min (26 in 2015). Agents incur an expense of USD 0.52 per trip (USD 0.69 in 2015).
Metro
Non-Metro Urban
Rural
Cash
e-float
About the same
Agents who travel for rebalancing 2015 2017
Agents who travel (always/sometimes) to rebalance* 94% 81%
Mean number of travel for e-float per month 8 9
Mean number of travel for cash deliveries per month 8 14
Agents who have liquidity delivered 2015 2017
Agents who have liquidity (always/sometimes) delivered 6% 22%
Mean number of e-float deliveries per month N/A 14
Mean number of cash deliveries per month N/A 8
28%
28%
60%12%
12%60%
74%6%
21%
State of the Agent Network, India 2017
www.helix-institute.com 29
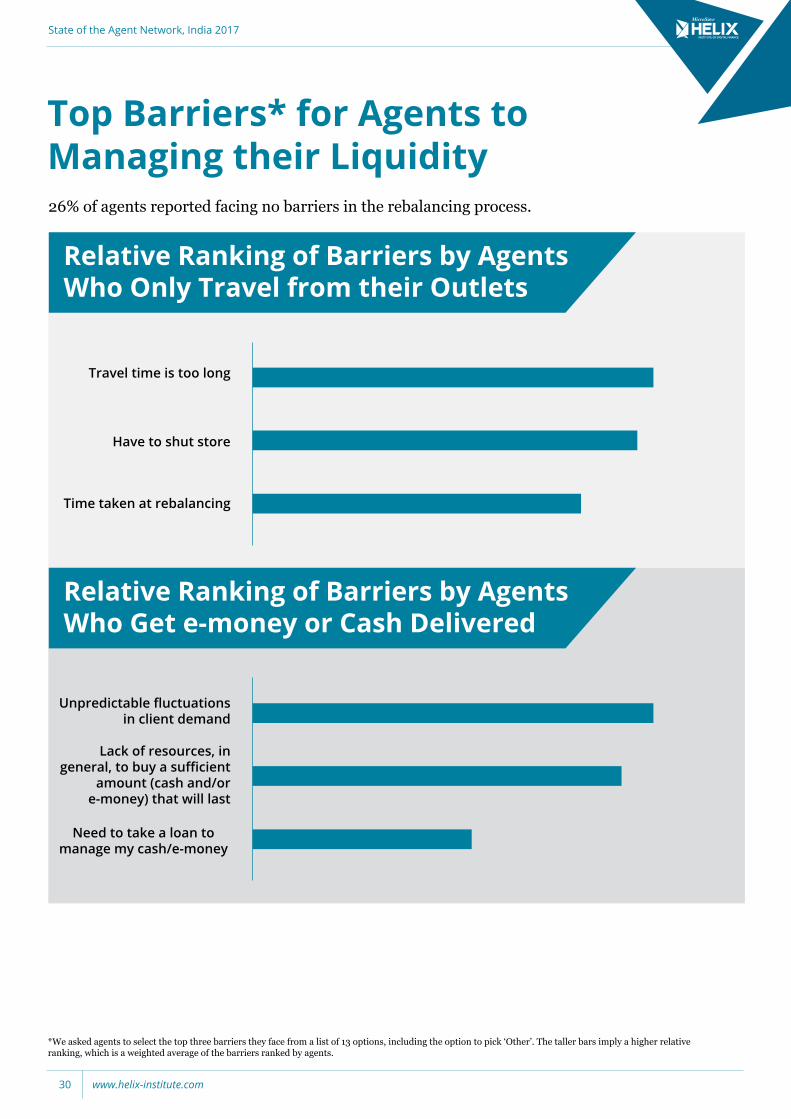
Top Barriers* for Agents to Managing their Liquidity
*We asked agents to select the top three barriers they face from a list of 13 options, including the option to pick ‘Other’. The taller bars imply a higher relative ranking, which is a weighted average of the barriers ranked by agents.
26% of agents reported facing no barriers in the rebalancing process.
Relative Ranking of Barriers by Agents Who Only Travel from their Outlets
Relative Ranking of Barriers by Agents Who Get e-money or Cash Delivered
Travel time is too long
Have to shut store
Time taken at rebalancing
Unpredictable fluctuations in client demand
Lack of resources, in general, to buy a sufficient
amount (cash and/or e-money) that will last
Need to take a loan to manage my cash/e-money
State of the Agent Network, India 2017
www.helix-institute.com30
Provider Compliance and Risk
State of the Agent Network, India 2017
www.helix-institute.com 31
Robbery/Theft* and Fraud: ANA Research Countries*
*In Kenya, agents reported whether they or one of their employees had ever experienced robbery or fraud. In all the other countries, we asked agents whether they or their employees had experienced such incidents within the past one year. Thus, the data is not fully comparable.
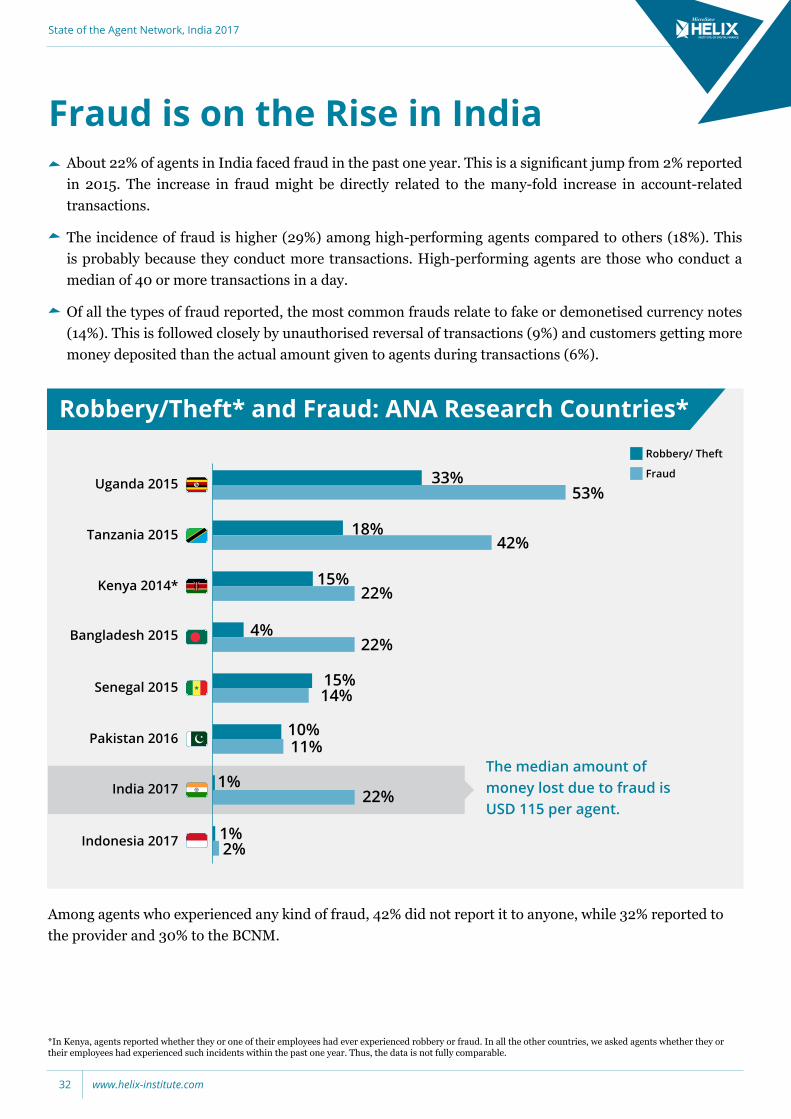
About 22% of agents in India faced fraud in the past one year. This is a significant jump from 2% reported in 2015. The increase in fraud might be directly related to the many-fold increase in account-related transactions.
The incidence of fraud is higher (29%) among high-performing agents compared to others (18%). This is probably because they conduct more transactions. High-performing agents are those who conduct a median of 40 or more transactions in a day.
Of all the types of fraud reported, the most common frauds relate to fake or demonetised currency notes (14%). This is followed closely by unauthorised reversal of transactions (9%) and customers getting more money deposited than the actual amount given to agents during transactions (6%).
33%53%
15%22%
4%22%
15%
10%11%
1%22%
1%2%
14%
42%
Pakistan 2016
Tanzania 2015
Senegal 2015
Uganda 2015
Bangladesh 2015
Kenya 2014*
Indonesia 2017
India 2017
18%
Robbery/ Theft
Fraud
Among agents who experienced any kind of fraud, 42% did not report it to anyone, while 32% reported to the provider and 30% to the BCNM.
The median amount of money lost due to fraud is USD 115 per agent.
Fraud is on the Rise in India
State of the Agent Network, India 2017
www.helix-institute.com32
Compliance has Improved, but New Concerns have Emerged (1/2)
Compliance: ANA Research Countries
45%59%
Pakistan 2016
99%94%
Tanzania 2015
30%68%
Senegal 2015
45%77%Uganda 2015
47%85%Bangladesh 2016
13%76%
Zambia 2015
45%11%
Indonesia 2017
61%65%
India 2017
96%Kenya 201492%
Agent ID on display
Tariff sheet on display
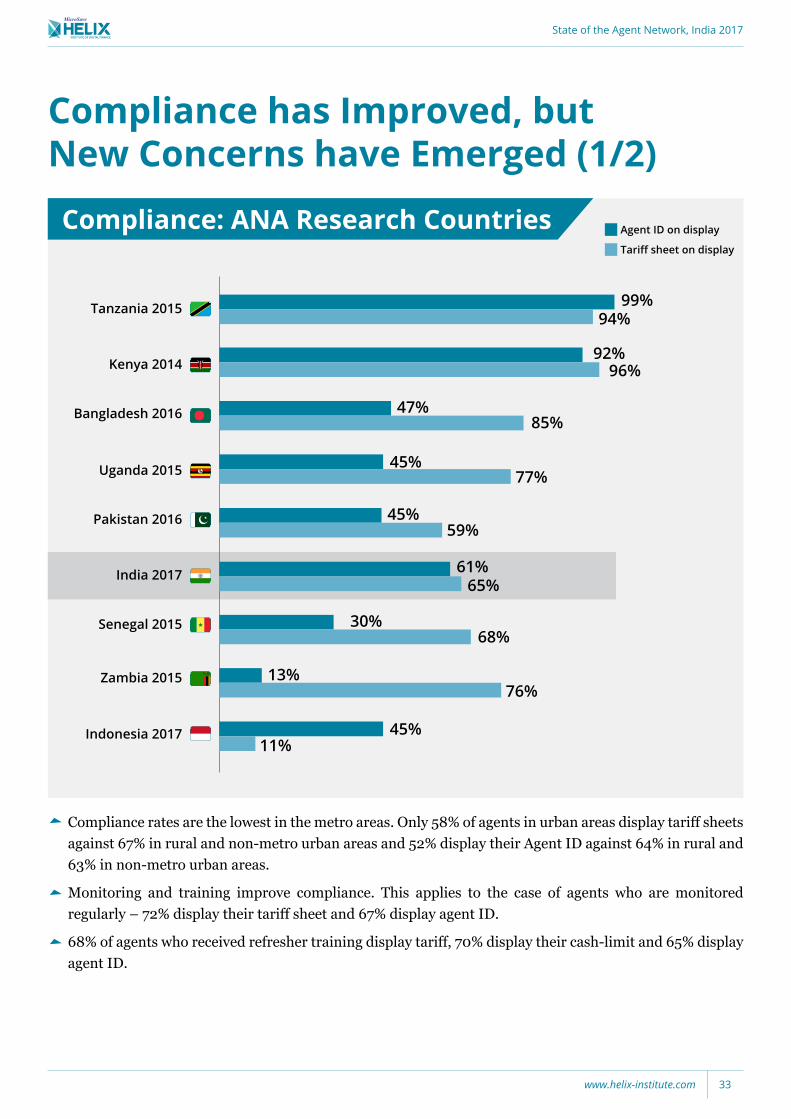
Compliance rates are the lowest in the metro areas. Only 58% of agents in urban areas display tariff sheets against 67% in rural and non-metro urban areas and 52% display their Agent ID against 64% in rural and 63% in non-metro urban areas.
Monitoring and training improve compliance. This applies to the case of agents who are monitored regularly – 72% display their tariff sheet and 67% display agent ID.
68% of agents who received refresher training display tariff, 70% display their cash-limit and 65% display agent ID.
State of the Agent Network, India 2017
www.helix-institute.com 33
Compliance: 2015 vs 2017
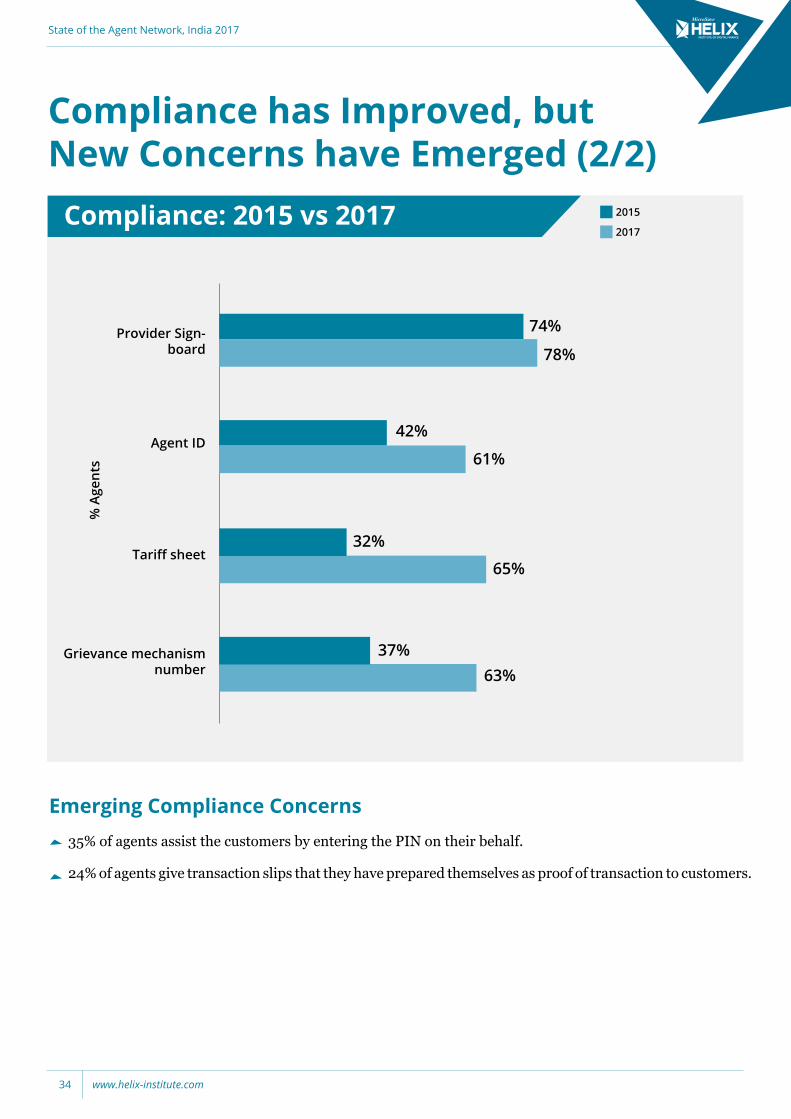
35% of agents assist the customers by entering the PIN on their behalf.
24% of agents give transaction slips that they have prepared themselves as proof of transaction to customers.
2015
2017
Grievance mechanism number 63%
37%
Tariff sheet65%
32%
Agent ID61%
42%
Provider Sign-board 78%
74%
Emerging Compliance Concerns
Compliance has Improved, but New Concerns have Emerged (2/2)
% A
gent
s
State of the Agent Network, India 2017
www.helix-institute.com34
Compliance with Interoperability can Prove to be a Boon for the Business
Agents Who Offer Interoperability
Services Offered by Interoperable Agents
All Banks Some Banks None Cash-in Cash-out Money Transfer
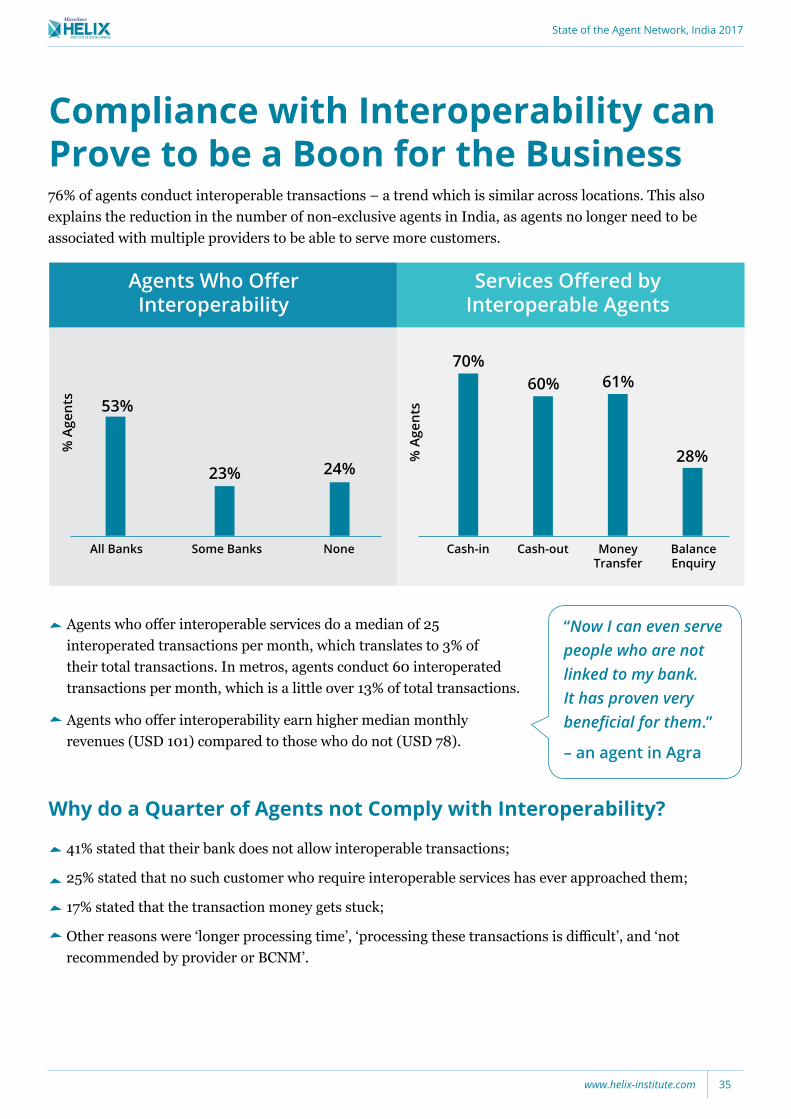
76% of agents conduct interoperable transactions – a trend which is similar across locations. This also explains the reduction in the number of non-exclusive agents in India, as agents no longer need to be associated with multiple providers to be able to serve more customers.
% A
gent
s
Balance Enquiry
53%
23% 24%
70%60% 61%
28%% A
gent
s
Agents who offer interoperable services do a median of 25 interoperated transactions per month, which translates to 3% of their total transactions. In metros, agents conduct 60 interoperated transactions per month, which is a little over 13% of total transactions.
Agents who offer interoperability earn higher median monthly revenues (USD 101) compared to those who do not (USD 78).
41% stated that their bank does not allow interoperable transactions;
25% stated that no such customer who require interoperable services has ever approached them;
17% stated that the transaction money gets stuck;
Other reasons were ‘longer processing time’, ‘processing these transactions is difficult’, and ‘not recommended by provider or BCNM’.
Why do a Quarter of Agents not Comply with Interoperability?
“Now I can even serve people who are not linked to my bank. It has proven very beneficial for them.”
– an agent in Agra
State of the Agent Network, India 2017
www.helix-institute.com 35
Gender Dimensions in Agent Banking
State of the Agent Network, India 2017
www.helix-institute.com36
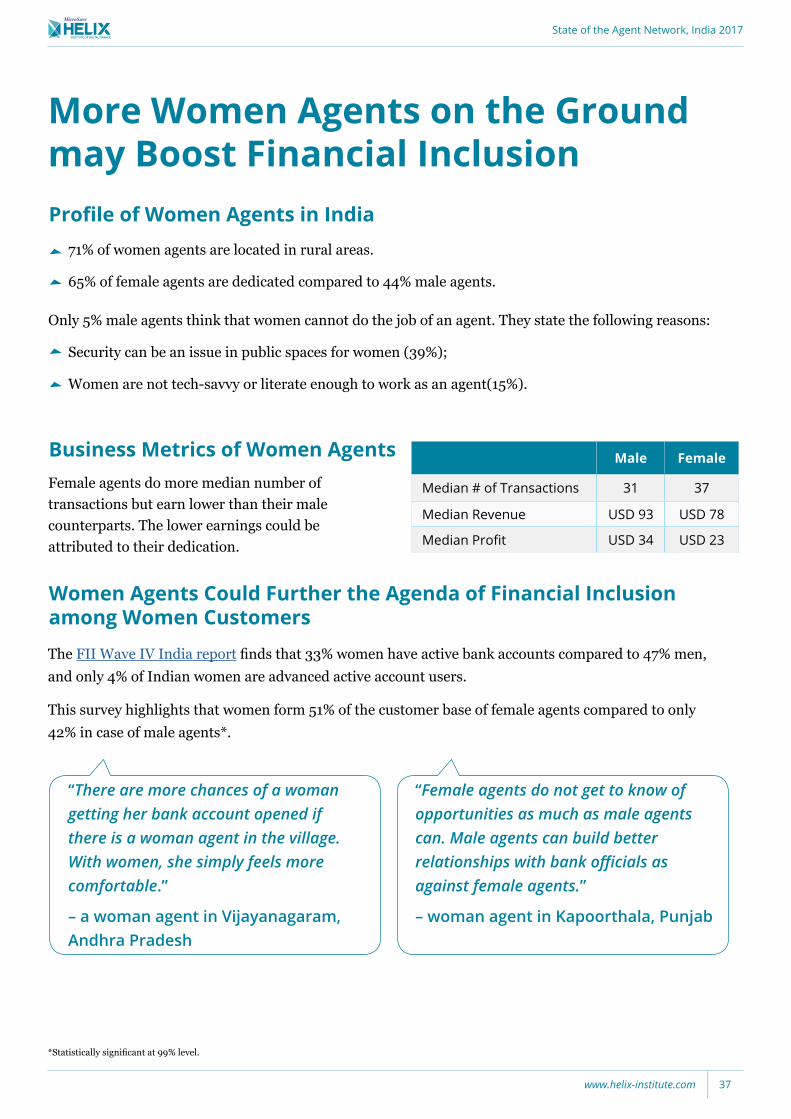
Female agents do more median number of transactions but earn lower than their male counterparts. The lower earnings could be attributed to their dedication.
71% of women agents are located in rural areas.
65% of female agents are dedicated compared to 44% male agents.
Only 5% male agents think that women cannot do the job of an agent. They state the following reasons:
Security can be an issue in public spaces for women (39%);
Women are not tech-savvy or literate enough to work as an agent(15%).
Business Metrics of Women Agents
Women Agents Could Further the Agenda of Financial Inclusion among Women Customers
Male Female
Median # of Transactions 31 37
Median Revenue USD 93 USD 78
Median Profit USD 34 USD 23
More Women Agents on the Ground may Boost Financial InclusionProfile of Women Agents in India
The FII Wave IV India report finds that 33% women have active bank accounts compared to 47% men, and only 4% of Indian women are advanced active account users.
This survey highlights that women form 51% of the customer base of female agents compared to only 42% in case of male agents*.
*Statistically significant at 99% level.
“There are more chances of a woman getting her bank account opened if there is a woman agent in the village. With women, she simply feels more comfortable.”
– a woman agent in Vijayanagaram, Andhra Pradesh
“Female agents do not get to know of opportunities as much as male agents can. Male agents can build better relationships with bank officials as against female agents.”
– woman agent in Kapoorthala, Punjab
State of the Agent Network, India 2017
www.helix-institute.com 37
*statistically significant at 1% level.
Emerging Models – Payments Banks
State of the Agent Network, India 2017
www.helix-institute.com38
Payments Banks* – Gearing Up for Challenges Ahead
*Please see Appendix 6.
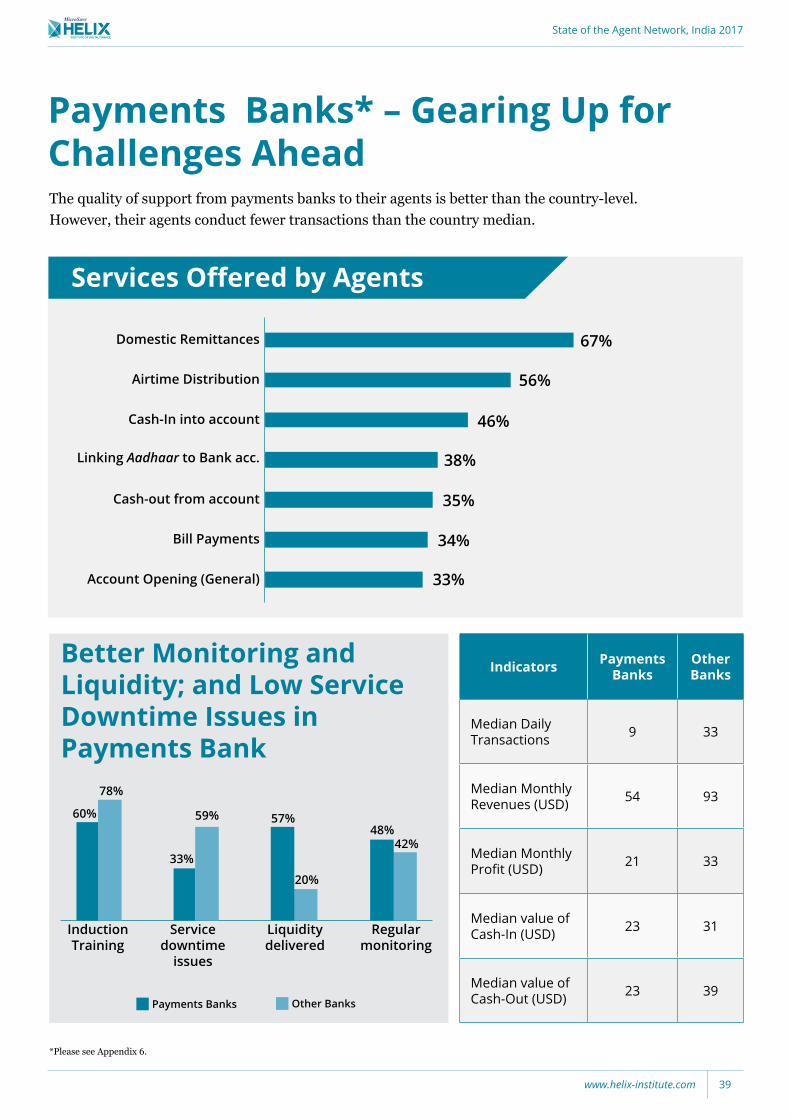
The quality of support from payments banks to their agents is better than the country-level. However, their agents conduct fewer transactions than the country median.
Services Offered by Agents
Airtime Distribution 56%
Domestic Remittances 67%
Cash-In into account 46%
Linking Aadhaar to Bank acc. 38%
Bill Payments 34%
Account Opening (General) 33%
Cash-out from account 35%
Better Monitoring and Liquidity; and Low Service Downtime Issues in Payments Bank
Payments Banks Other Banks
Regular monitoring
42%48%
Liquidity delivered
20%
57%
Service downtime
issues
59%
33%
Induction Training
78%
60%
Indicators Payments Banks
Other Banks
Median Daily Transactions 9 33
Median Monthly Revenues (USD) 54 93
Median Monthly Profit (USD) 21 33
Median value of Cash-In (USD) 23 31
Median value of Cash-Out (USD) 23 39
State of the Agent Network, India 2017
www.helix-institute.com 39
Salient Points – Corporate BC vs Direct BC Models
State of the Agent Network, India 2017
www.helix-institute.com40
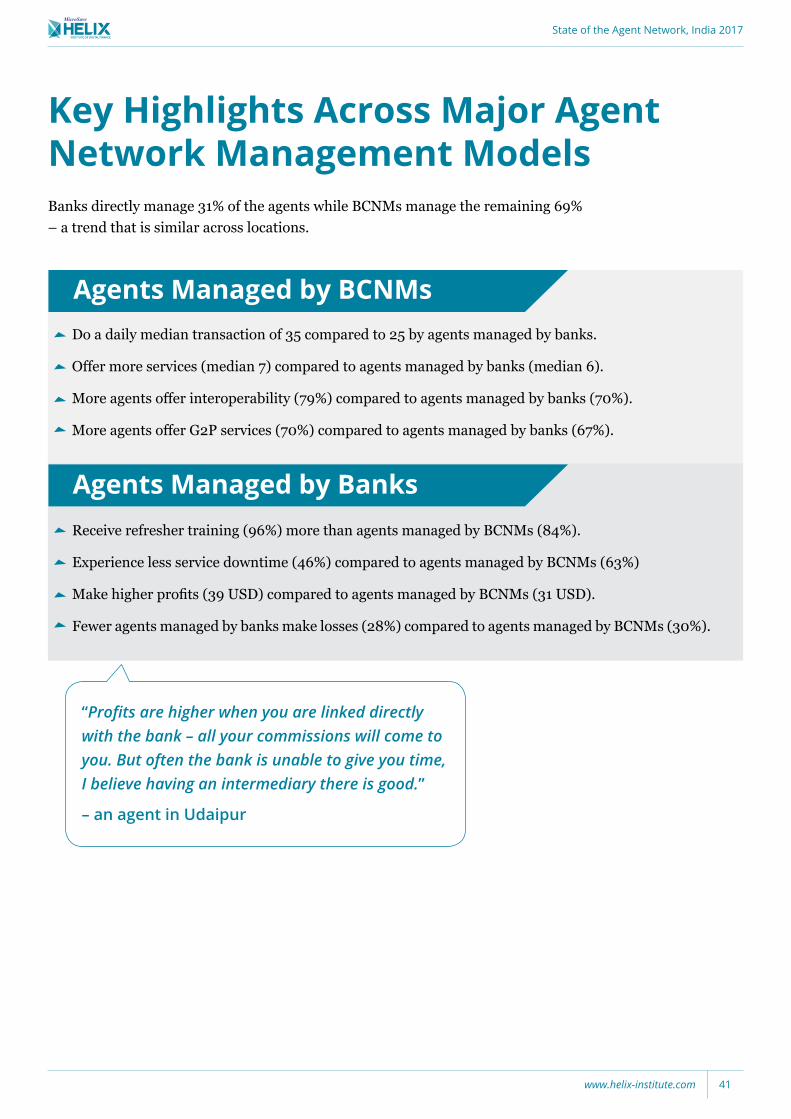
Key Highlights Across Major Agent Network Management ModelsBanks directly manage 31% of the agents while BCNMs manage the remaining 69% – a trend that is similar across locations.
Do a daily median transaction of 35 compared to 25 by agents managed by banks.
Offer more services (median 7) compared to agents managed by banks (median 6).
More agents offer interoperability (79%) compared to agents managed by banks (70%).
More agents offer G2P services (70%) compared to agents managed by banks (67%).
Receive refresher training (96%) more than agents managed by BCNMs (84%).
Experience less service downtime (46%) compared to agents managed by BCNMs (63%)
Make higher profits (39 USD) compared to agents managed by BCNMs (31 USD).
Fewer agents managed by banks make losses (28%) compared to agents managed by BCNMs (30%).
Agents Managed by BCNMs
Agents Managed by Banks
“Profits are higher when you are linked directly with the bank – all your commissions will come to you. But often the bank is unable to give you time, I believe having an intermediary there is good.”
– an agent in Udaipur
State of the Agent Network, India 2017
www.helix-institute.com 41
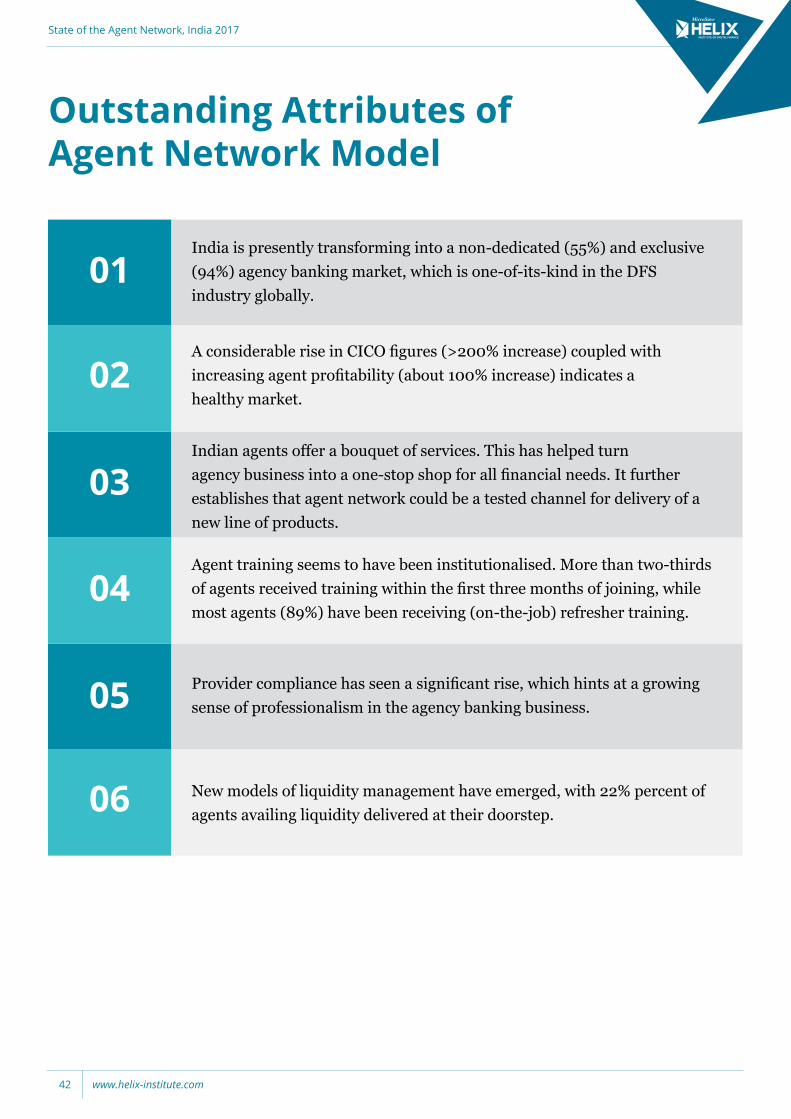
India is presently transforming into a non-dedicated (55%) and exclusive (94%) agency banking market, which is one-of-its-kind in the DFS industry globally.
A considerable rise in CICO figures (>200% increase) coupled with increasing agent profitability (about 100% increase) indicates a healthy market.
Indian agents offer a bouquet of services. This has helped turn agency business into a one-stop shop for all financial needs. It further establishes that agent network could be a tested channel for delivery of a new line of products.
Agent training seems to have been institutionalised. More than two-thirds of agents received training within the first three months of joining, while most agents (89%) have been receiving (on-the-job) refresher training.
Provider compliance has seen a significant rise, which hints at a growing sense of professionalism in the agency banking business.
New models of liquidity management have emerged, with 22% percent of agents availing liquidity delivered at their doorstep.
Outstanding Attributes of Agent Network Model
01
02
03
04
05
06
State of the Agent Network, India 2017
www.helix-institute.com42
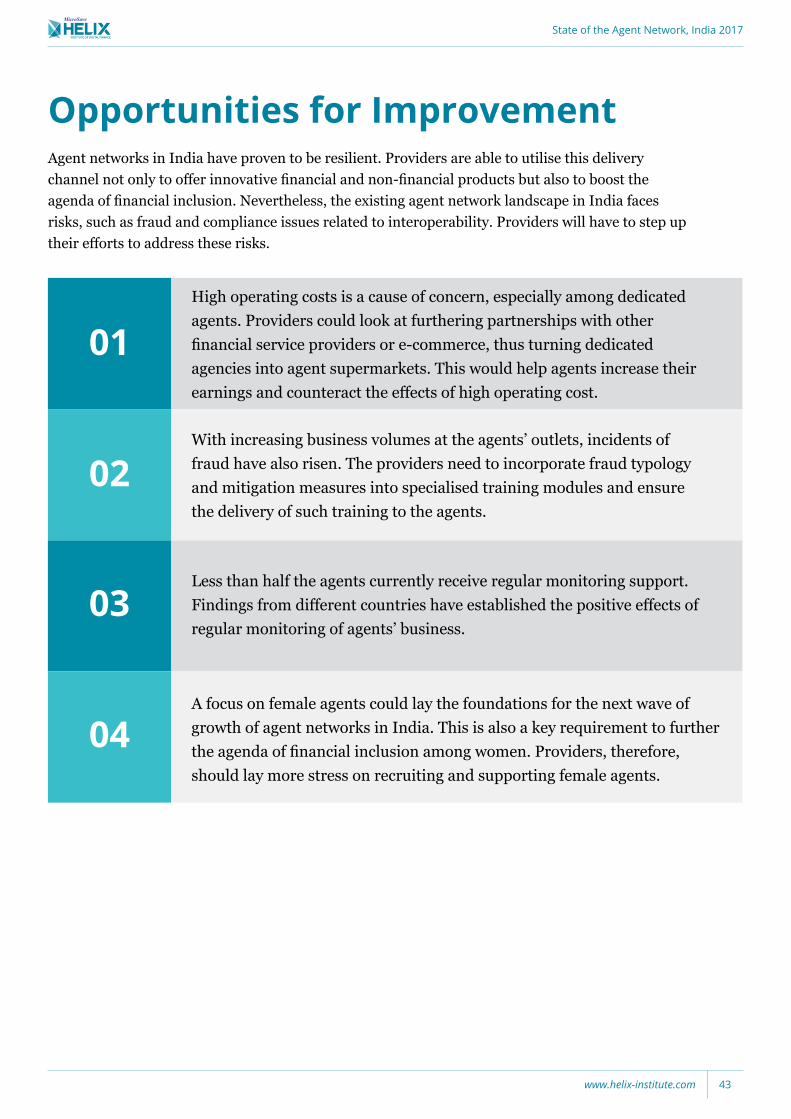
High operating costs is a cause of concern, especially among dedicated agents. Providers could look at furthering partnerships with other financial service providers or e-commerce, thus turning dedicated agencies into agent supermarkets. This would help agents increase their earnings and counteract the effects of high operating cost.
With increasing business volumes at the agents’ outlets, incidents of fraud have also risen. The providers need to incorporate fraud typology and mitigation measures into specialised training modules and ensure the delivery of such training to the agents.
Less than half the agents currently receive regular monitoring support. Findings from different countries have established the positive effects of regular monitoring of agents’ business.
A focus on female agents could lay the foundations for the next wave of growth of agent networks in India. This is also a key requirement to further the agenda of financial inclusion among women. Providers, therefore, should lay more stress on recruiting and supporting female agents.
Opportunities for Improvement
01
02
03
04
Agent networks in India have proven to be resilient. Providers are able to utilise this delivery channel not only to offer innovative financial and non-financial products but also to boost the agenda of financial inclusion. Nevertheless, the existing agent network landscape in India faces risks, such as fraud and compliance issues related to interoperability. Providers will have to step up their efforts to address these risks.
State of the Agent Network, India 2017
www.helix-institute.com 43
Appendix
State of the Agent Network, India 2017
www.helix-institute.com44
Appendix 1: MethodologyThe study is based on a nationally representative sample of 3,048 agents across India.
The sample is designed to be representative at the country level, for metro, non-metro urban, and rural agents
The sampling frame has been stratified into two broad categories – metros and others.
Sampling for Metros:We developed a discrete sampling frame of all metros, defined on the basis of population. Four metros were selected using simple random sampling.
In each metro, we arranged wards by ward numbers. We selected 15 wards using systematic random sampling.
From each ward, we selected 10 samples using systematic random sampling.
Sampling for Others (Non-metro Urban and Rural):Based on the Socio-economic Caste Census of 2011, we selected two states from the six zones, using simple random sampling.
Each state was divided into five geographical regions to ensure spatial spread. We selected one district from each region using the Probability Proportional to Size (PPS) sampling method.
We stratified the allocated number of 40 samples in each district as urban or rural based on the Census of India, 2011.
We used an Android-based hand-held CAPI module to perform the data collection and entry, employing rigorously tested and controlled processes.
The survey data collection module allowed for an additional level of randomisation among the providers that a sampled agent was serving, to ensure representativeness at the provider-level. The module randomly selected one provider that an agent was then interviewed for out of a list of all mentioned providers. This allocation occured only from a pool of providers for which the agent had been active – that is, had conducted at least one transaction within the past 30 days.
State of the Agent Network, India 2017
www.helix-institute.com 45
Appendix 2: Application of WeightsOur methodology applies weight to each interviewed agent using inverse probability weighting method to generate country-level representative findings. The weights were estimated using multipliers calculated from the probability of selection of the sample at all the stages of sampling.
Weighting for Metros:Metro-level– The number of selected metros in a zone was divided by the total number of metros in a zone and the inverse was taken as weights.
Ward-level– Total selected wards in the metro were divided by the total wards in the metro and the inverse was taken as weights.
Agent-level– Total number of sampled agents for a particular ward were divided by the total number of agents available in particular ward and the inverse were taken as weights.
We achieved the final weights by multiplying the weights of the three levels described above.
Weighting for Others (Non-metro Urban and Rural):State-level– The number of selected states in a zone was divided by the total number of states in the zone and the inverse was taken as weights.
District-level– The total Sub-service Areas (SSAs) in the selected district were divided by the total SSA in the region and the inverse was taken as weights.
Agent-level– The total number of sampled agents for a particular strata were divided by the total number of active agents available in particular strata and the inverse was taken as weights.
We arrived at the final weights by multiplying the weights of the three levels described above.
State of the Agent Network, India 2017
www.helix-institute.com46
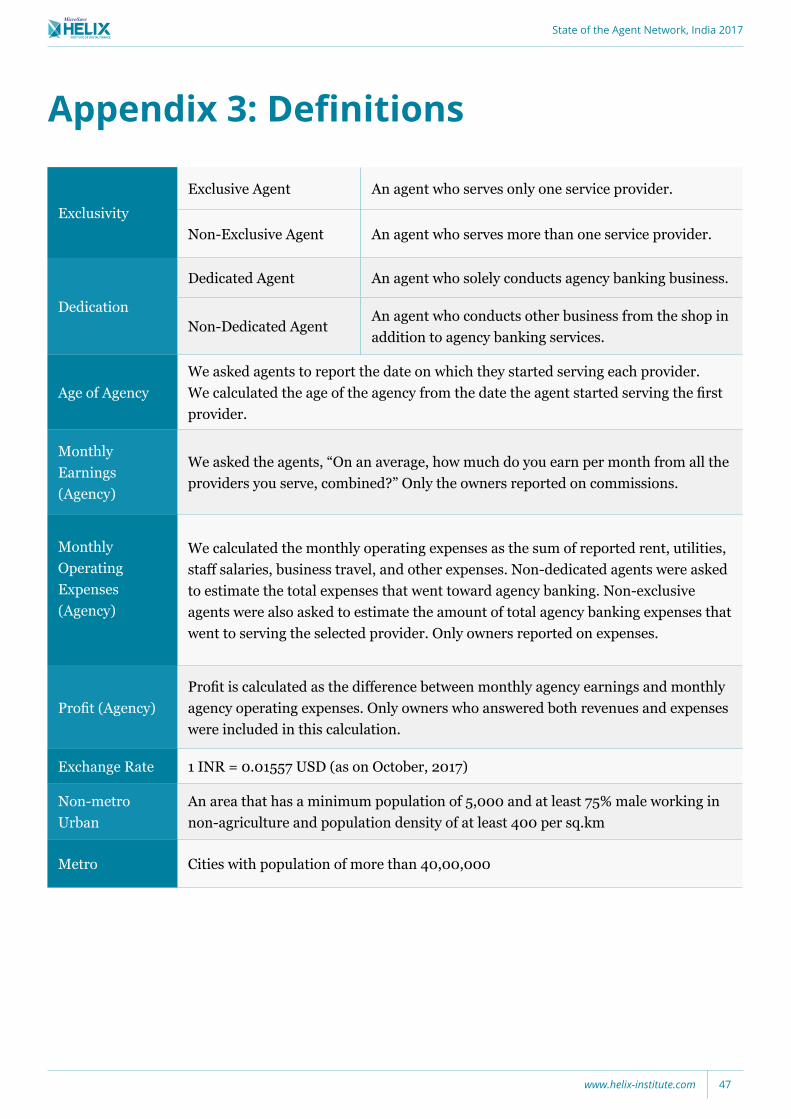
Appendix 3: Definitions
ExclusivityExclusive Agent An agent who serves only one service provider.
Non-Exclusive Agent An agent who serves more than one service provider.
Dedication
Dedicated Agent An agent who solely conducts agency banking business.
Non-Dedicated AgentAn agent who conducts other business from the shop in addition to agency banking services.
Age of AgencyWe asked agents to report the date on which they started serving each provider. We calculated the age of the agency from the date the agent started serving the first provider.
Monthly Earnings (Agency)
We asked the agents, “On an average, how much do you earn per month from all the providers you serve, combined?” Only the owners reported on commissions.
Monthly Operating Expenses (Agency)
We calculated the monthly operating expenses as the sum of reported rent, utilities, staff salaries, business travel, and other expenses. Non-dedicated agents were asked to estimate the total expenses that went toward agency banking. Non-exclusive agents were also asked to estimate the amount of total agency banking expenses that went to serving the selected provider. Only owners reported on expenses.
Profit (Agency)Profit is calculated as the difference between monthly agency earnings and monthly agency operating expenses. Only owners who answered both revenues and expenses were included in this calculation.
Exchange Rate 1 INR = 0.01557 USD (as on October, 2017)
Non-metro Urban
An area that has a minimum population of 5,000 and at least 75% male working in non-agriculture and population density of at least 400 per sq.km
Metro Cities with population of more than 40,00,000
State of the Agent Network, India 2017
www.helix-institute.com 47
Comparison with other ANA countries has been provided on multiple slides. We conducted ANA surveys in the following countries, year-wise:
2013: Uganda, Kenya, Tanzania
2014: Bangladesh, Kenya, Pakistan
2015: Zambia, Tanzania, Uganda, Senegal, India
2016: Bangladesh
2017: Pakistan, Indonesia, Nigeria
Appendix 4: Footnotes
State of the Agent Network, India 2017
www.helix-institute.com48
Appendix 5: Products and Services
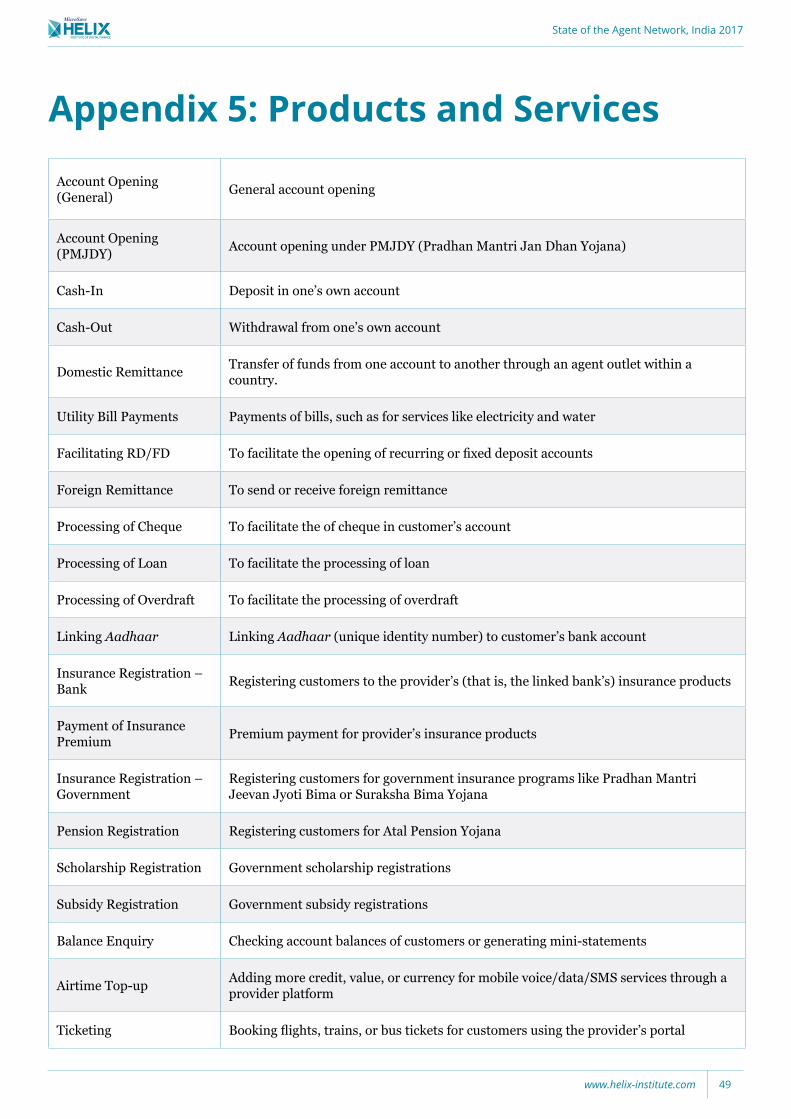
Account Opening (General) General account opening
Account Opening (PMJDY) Account opening under PMJDY (Pradhan Mantri Jan Dhan Yojana)
Cash-In Deposit in one’s own account
Cash-Out Withdrawal from one’s own account
Domestic Remittance Transfer of funds from one account to another through an agent outlet within a country.
Utility Bill Payments Payments of bills, such as for services like electricity and water
Facilitating RD/FD To facilitate the opening of recurring or fixed deposit accounts
Foreign Remittance To send or receive foreign remittance
Processing of Cheque To facilitate the of cheque in customer’s account
Processing of Loan To facilitate the processing of loan
Processing of Overdraft To facilitate the processing of overdraft
Linking Aadhaar Linking Aadhaar (unique identity number) to customer’s bank account
Insurance Registration – Bank Registering customers to the provider’s (that is, the linked bank’s) insurance products
Payment of Insurance Premium Premium payment for provider’s insurance products
Insurance Registration – Government
Registering customers for government insurance programs like Pradhan Mantri Jeevan Jyoti Bima or Suraksha Bima Yojana
Pension Registration Registering customers for Atal Pension Yojana
Scholarship Registration Government scholarship registrations
Subsidy Registration Government subsidy registrations
Balance Enquiry Checking account balances of customers or generating mini-statements
Airtime Top-up Adding more credit, value, or currency for mobile voice/data/SMS services through a provider platform
Ticketing Booking flights, trains, or bus tickets for customers using the provider’s portal
State of the Agent Network, India 2017
www.helix-institute.com 49
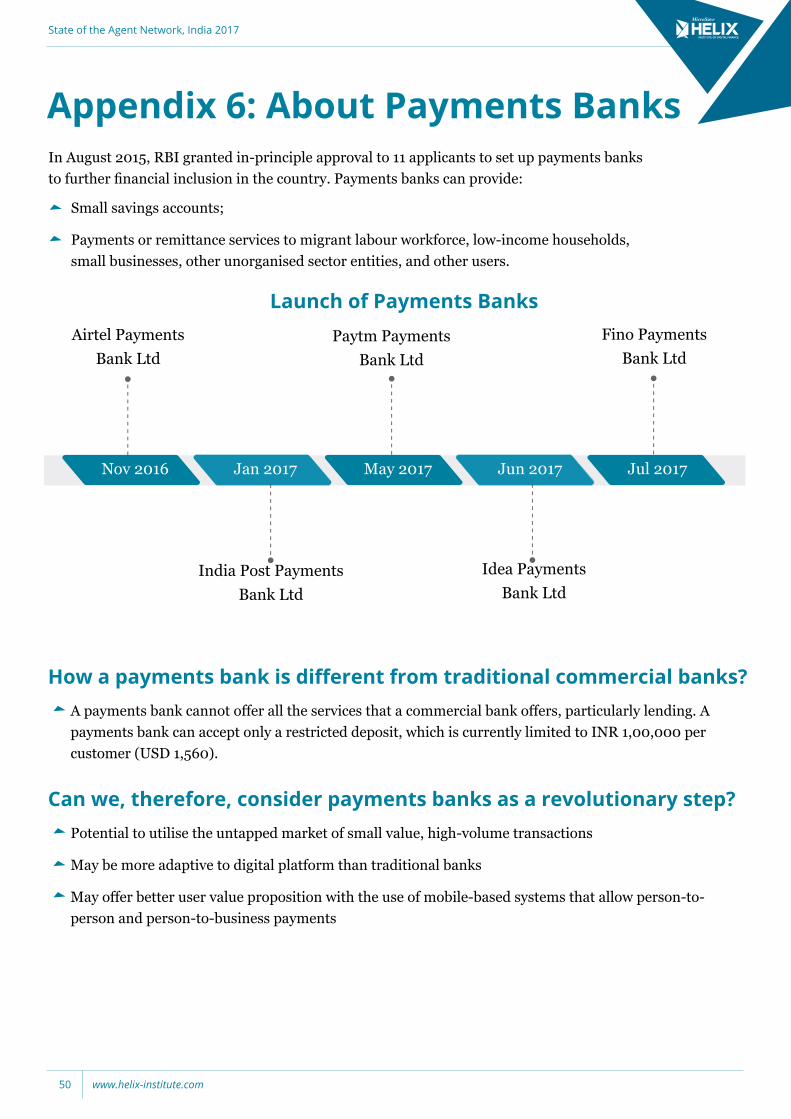
In August 2015, RBI granted in-principle approval to 11 applicants to set up payments banks to further financial inclusion in the country. Payments banks can provide:
Small savings accounts;
Payments or remittance services to migrant labour workforce, low-income households, small businesses, other unorganised sector entities, and other users.
Nov 2016 Jan 2017 May 2017 Jun 2017 Jul 2017
Airtel Payments Bank Ltd
Paytm Payments Bank Ltd
Fino Payments Bank Ltd
Idea Payments Bank Ltd
India Post Payments Bank Ltd
Appendix 6: About Payments Banks
Launch of Payments Banks
How a payments bank is different from traditional commercial banks?A payments bank cannot offer all the services that a commercial bank offers, particularly lending. A payments bank can accept only a restricted deposit, which is currently limited to INR 1,00,000 per customer (USD 1,560).
Can we, therefore, consider payments banks as a revolutionary step?Potential to utilise the untapped market of small value, high-volume transactions
May be more adaptive to digital platform than traditional banks
May offer better user value proposition with the use of mobile-based systems that allow person-to-person and person-to-business payments
State of the Agent Network, India 2017
www.helix-institute.com50
www.helix-institute.com
Helix Institute of Digital Finance
@HelixInstitute
For more information about this report, please email [email protected]
#ANAIndia#AgentNetworksIndia