state of state 2017 - RI Department of Labor and Training Trade 51,753 47,071 48,190 Manufacturing...
48
Sta Sta Sta Sta State of te of te of te of te of the Sta the Sta the Sta the Sta the State te te te te A Sta A Sta A Sta A Sta A Sta tistical Pr tistical Pr tistical Pr tistical Pr tistical Pr of of of of of ile of ile of ile of ile of ile of Rhode Island’ Rhode Island’ Rhode Island’ Rhode Island’ Rhode Island’ s Cities and s Cities and s Cities and s Cities and s Cities and T T T o o o wns wns wns wns wns A publication of the Labor Market Information Unit
Transcript of state of state 2017 - RI Department of Labor and Training Trade 51,753 47,071 48,190 Manufacturing...

StaStaStaStaState ofte ofte ofte ofte of the Sta the Sta the Sta the Sta the StateteteteteA StaA StaA StaA StaA Statistical Prtistical Prtistical Prtistical Prtistical Profofofofofile ofile ofile ofile ofile of
Rhode Island’Rhode Island’Rhode Island’Rhode Island’Rhode Island’s Cities and s Cities and s Cities and s Cities and s Cities and TTTTTooooownswnswnswnswns
A publication of the
Labor Market Information Unit

Misquamicut Beach, Westerly, RI

State of the State – A Statistical Profile of Rhode Island’s Cities and Towns
From Burrillville to Block Island, from Woonsocket to Westerly, recent demographic and
employment trends have impacted the lives of all Rhode Islanders. Incorporating information
collected by the United States Department of Commerce and the Rhode Island Department of
Labor and Training, State of the State depicts demographic changes and recent employment
trends that have impacted our local economies over the last twenty years.
Population diversity based on age, sex, race, and ethnicity, as well as educational attainment,
labor force statistics, and English language proficiency of local residents,
is encapsulated in statistical profiles for each of Rhode Island’s thirty-nine communities.
An overview of local private sector employment by industry sector is also provided
on a city and town basis.
Introduction

OverviewRhode Island reached peak private employment levels in 2006 with an average of 417,700 private sector jobs within the
state. The annual average unemployment rate for the year was 4.9 percent and the state’s population stood at 1,063,096.
Rhode Island’s economic momentum began to change the following year, and the state entered into a recessionary period
months earlier than the official National Recession. By 2009, the height of the recession in Rhode Island, the number of
private jobs averaged 387,800, the annual average unemployment rate was 11.0 percent, and the state’s population had
shrank to 1,053,646 residents.
Since the end of the recession, Rhode Island has been gradually recovering. As of 2017, private job levels averaged
418,000, an increase of 30,200 (+7.8%) from the 2009 average and the unemployment rate is down 6.5 percentage points
to 4.5 percent. The state’s population has yet to regain residents lost during the recession, as the count stood at 1,059,639
in 2017, down 3,457 (-0.3%) from 2006. On a positive note, the population in 2017 increased over 2016 by 2,073 (+0.2%)
residents, the sixth consecutive over-the-year
increase in population.
Other Findings
w Thirty of the state’s thirty-nine cities andtowns reported total employment growthbetween 2016-2017, with Hopkintonhaving the largest over-the-year increase(+5.9%). Woonsocket (-3.4%) posted thelargest total employment decrease.
w Providence establishments employed thelargest percentage (23.4%) of RhodeIsland private sector workers, followed byWarwick (10.6%), Cranston (7.4%),Pawtucket (5.0%) and East Providence(4.9%).
w Rhode Island total annual averageemployment in 2017 (477,305) was thehighest employment level since 2007(480,232).
w The state experienced a 0.2 percentpopulation increase between the 2016 and2017 population estimate. Twenty-sevencities and towns gained residents, withProvidence (+439), Burrillville (+331) andCumberland (+202) adding the mostpeople. Of the twelve cities and townsthat lost residents, only Newport (-136)
and Central Falls (-116) lost more than100 residents.
w Rhode Island (4.5%) had the 22nd highestannual average unemployment rate in the
country in 2017. Alaska (7.2%), NewMexico (6.2%) and District of Columbia(6.1%) had the highest rates in thecountry. The annual averageunemployment rate for the United Statesas a whole in 2017 was 4.4 percent.
Rhode Island 0.8% Rhode Island 0.2% Rhode Island 4.5%
Hopkinton 5.9% Burrillville 2.0% Jamestown 2.9%
Little Compton 5.4% West Greenwich 2.0% Barrington 3.0%
Portsmouth 4.2% Charlestown 0.8% Narragansett 3.0%
Cumberland 4.1% Glocester 0.8% Richmond 3.1%
Newport 3.3% Jamestown 0.7% Little Compton 3.3%
Middletown 3.3% Richmond 0.7% North Kingstown 3.5%
Barrington 3.3% North Smithfield 0.7% Glocester 3.6%
Lincoln 3.2% Cumberland 0.6% North Smithfield 3.6%
East Greenwich 3.2% Foster 0.5% Cumberland 3.7%
North Kingstown 2.5% Johnston 0.4% Exeter 3.8%
New Shoreham 2.4% Lincoln 0.4% Newport 3.8%
North Providence 2.4% Scituate 0.3% West Greenwich 3.8%
Jamestown 2.3% Woonsocket 0.3% Lincoln 3.9%
West Greenwich 2.1% North Kingstown 0.3% Middletown 3.9%
Warren 1.8% Bristol 0.3% South Kingstown 3.9%
East Providence 1.7% Providence 0.2% Warwick 3.9%
Westerly 1.6% South Kingstown 0.2% East Greenwich 4.0%
Burrillville 1.6% Portsmouth 0.2% Portsmouth 4.0%
Johnston 1.4% North Providence 0.2% Smithfield 4.0%
Exeter 1.4% East Providence 0.2% Bristol 4.2%
West Warwick 1.1% Pawtucket 0.2% Coventry 4.2%
Glocester 1.1% Coventry 0.2% Cranston 4.3%
Cranston 0.9% Cranston 0.2% Foster 4.3%
Warwick 0.9% East Greenwich 0.2% Hopkinton 4.3%
Pawtucket 0.9% Tiverton 0.2% Scituate 4.3%
Narragansett 0.9% Hopkinton 0.1% Warren 4.3%
Scituate 0.8% Little Compton 0.1% Burrillville 4.4%
Providence 0.4% Middletown 0.0% North Providence 4.4%
South Kingstown 0.3% Barrington -0.1% Johnston 4.6%
Tiverton 0.1% Smithfield -0.1% Tiverton 4.6%
Smithfield -0.2% Warwick -0.1% Charlestown 4.7%
Charlestown -0.3% West Warwick -0.2% West Warwick 4.7%
Coventry -0.8% Westerly -0.2% East Providence 4.9%
North Smithfield -1.0% Warren -0.2% Pawtucket 5.1%
Central Falls -1.4% Exeter -0.2% Westerly 5.1%
Richmond -2.4% Narragansett -0.3% Providence 5.4%
Bristol -3.1% New Shoreham -0.5% Central Falls 5.6%
Foster -3.2% Newport -0.5% Woonsocket 6.0%
Woonsocket -3.4% Central Falls -0.6% New Shoreham 10.7%
Employment Growth Population Growth Unemployment Rate
2016-2017 2016-2017 2017 Annual Average
Rhode Island City & Town Rankings

State of Rhode Island
Providence31.3%
Elsewhere
0.8%
Other RI Town53.9%
Massachusetts
11.9%
Connecticut
2.1%
Establishment Employment 2006 2009 2017
Total Private & Government 480,589 448,475 477,305
Total Private Only 417,706 387,824 417,962
Health Care & Social Assistance 74,436 76,912 78,668
Government 62,883 60,652 59,343
Retail Trade 51,753 47,071 48,106
Accommodation & Food Services 42,561 41,329 47,604
Manufacturing 52,726 41,747 40,335
Administrative Support & Waste Management 25,388 22,207 28,646
Finance & Insurance 26,492 23,628 26,515
Professional & Technical Services 21,449 21,127 24,854
Educational Services 18,221 19,083 21,113
Construction 22,803 17,180 18,373
Other Services 18,117 17,780 17,915
Wholesale Trade 16,969 16,097 17,605
Management of Companies & Enterprises 9,311 9,208 12,865
Arts, Entertainment, & Recreation 7,692 7,637 10,939
Transportation & Warehousing 9,397 8,683 10,443
Information 10,997 10,112 6,674
Real Estate & Rental & Leasing 6,877 5,975 6,289
Utilities 1,144 1,119 1,093
Agriculture, Forestry, Fishing & Hunting 862 729 832
Mining 259 194 193
Where Rhode Island Residents Work, 2013
w Rhode Island’s total population increased by 4.5
percent during the 1990’s, with the gain of
44,855 people, while between 2000 and 2016,
Rhode Island gained 6,172 (+0.6%) residents.
w Forty-one percent (41.0%) of Rhode Island
residents 25 years and older had a college
degree (Associate or higher) in 2016. The share
of state residents without a high school diploma
or GED decreased between 2000 and 2016,
falling from 22.0 percent to 13.1 percent.
w Between 2009 and 2017, employment in Rhode
Island increased by 28,830 (+6.4%) jobs. Private
sector employers reported a gain of 30,137
(+7.8%) jobs, while public sector employment
fell by 1,309 (-2.2%) jobs.
w Rhode Island’s unemployment rate averaged 4.5
percent in 2017, a decrease of 6.5 percentage
points from the 2009 average of 11.0 percent.
w In 2016, 95.1 percent of Rhode Island residents
age 18-64 spoke only English or spoke another
language and English either well or very well.
w Nearly a third (31.3%) of Rhode Island
residents work in Providence, while 14.8 percent
work outside of Rhode Island.
Language
Population Age 18-64
Population 1990 2000 2016
Total Population 1,003,464 1,048,319 1,054,491
Male 481,496 503,635 511,297
Female 521,968 544,684 543,194
16 years + 801,625 827,797 868,361
21 years + 722,844 748,445 787,809
65 years + 150,547 152,402 166,517
White 917,375 891,191 854,026
Black/African American 38,861 46,908 68,886
American Indian & Alaskan Native 4,071 5,121 5,130
Asian & Pacific Islander 18,325 24,232 35,173
Some other race 24,832 52,616 61,218
Two or more races - 28,251 30,058
Hispanic or Latino (of any race) 45,752 90,820 148,375
Educational Attainment 1990 2000 2016
Population (Age 25+) 658,956 694,573 724,708
Less than 9th grade 11.1% 8.1% 5.8%
9th-12th, no dip loma 16.9% 13.9% 7.3%
High School Graduate / GED 29.5% 27.8% 27.7%
Some College, no degree 15.0% 17.6% 18.3%
Associate Degree 6.3% 7.0% 8.5%
Bachelor Degree 13.5% 15.9% 19.4%
Graduate/Professional Degree 7.8% 9.7% 13.1%
1990 2000 2016
Median Household Income $32,181 $42,090 $58,387
Annual Average Labor Force Estimates 2006 2009 2017
Labor Force 572,601 567,280 554,658
Employment 544,357 504,951 529,867
Unemployment 28,244 62,329 24,791
Unemployment Rate 4.9% 11.0% 4.5%
2016
Percent of Population that Speak Only English or
Another Language & English either 'well' or 'very well' 95.1%
Percent of Population that Speak English 'not well'
or 'not at all' 4.9%
Language Spoken:
Speak Spanish 3.7%
Speak Other Indo-European 0.6%
Speak Asian/Pacific Islander 0.5%
Speak Other Languages 0.1%

Health Care & Social Assistance 19.1%
Arts, Entertainment, & Recreat ion2.2%
Accommodation & Food Services11.7%
Other Services 4.3%
Agriculture/Mining/ Utilities/Unclassified
0.5%
Construction4.4%
Manufacturing9.6%
Wholesale Trade3.9%
Retail Trade11.6%
Transportation & Warehousing2.4%
Information1.5%
Finance & Insurance 6.4%
Real Estate & Rental & Leasing1.5%
Professional & Technical Services6.0%
Management of Companies & Enterprises 3.2%
Administrative Support & Waste Mngmnt. 6 .9%
Educational Services4.7%
State of Rhode Island
18 to 64 years old 675,568
Speak only English 523,610
% of age group 77.5%
Speak Spanish 84,216
% of age group 12.5%
Speak English "very well" 44,408 52.7%
Speak English "well" 15,029 17.8%
Speak English "not well" 15,810 18.8%
Speak English "not at all" 8,969 10.6%
Speak Other Indo-European 44,547
% of age group 6.6%
Speak English "very well" 32,178 72.2%
Speak English "well" 8,023 18.0%
Speak English "not well" 3,188 7.2%
Speak English "not at all" 1,158 2.6%
Speak Asian/Pacific Island 17,072
% of age group 2.5%
Speak English "very well" 9,124 53.4%
Speak English "well" 4,670 27.4%
Speak English "not well" 2,493 14.6%
Speak English "not at all" 785 4.6%
Speak other languages 6,123
% of age group 0.9%
Speak English "very well" 4,283 69.9%
Speak English "well" 1,263 20.6%
Speak English "not well" 476 7.8%
Speak English "not at all" 101 1.6%
Language Spoken at Home by
Ability to Speak English, 2016
w The percentage of Rhode Islanders who spoke only English or spoke
another language and English either well or very well increased from
94.7 percent in 2010 to 95.1 percent in 2016.
w The percentage of total residents aged 18 to 64 that spoke Spanish
while speaking English either not well or not at all remained
unchanged at 3.7 in 2016, representing 29.4 percent of all Spanish-
speaking Rhode Islanders.
ACS ACS
2010 2016
Percent of Population that Speak Only English or
Another Language & English either ‘well’ or 94.7% 95.1%
‘very well’
Percent of Population that Speak English ‘not well’
or ‘not at all’ 5.3% 4.9%
Language Spoken:
Speak Spanish 3.7% 3.7%
Speak Other Indo-European 0.9% 0.6%
Speak Asian/Pacific Islander 0.6% 0.5%
Speak Other Languages 0.1% 0.1%
w The Health Care & Social Assistance (19.1%) industry sector
employs the largest percentage of private Rhode Island workers,
followed by Accommodation & Food Services (11.7%) and Retail
Trade (11.6%).
w Providence (97,659) had the largest number of private sector
workers in the state, followed by Warwick (44,131) and Cranston
(30,825). Foster (380) and Little Compton (645) had the fewest
number of workers.
Total Private Sector Employment in Rhode Island by Industry, 2017

Rhode Island Private Covered Employment
by City and Town2017
Private Employment
Rhode Island - 417,962
>50,000
20,000-49,999
10,000-19,999
5,000-9,999
1,000-4,999
<1,000
Providence97,659
Warwick44,131
Cranston30,825
Pawtucket 20,810
EastProvidence20,625
Woonsocket12,409
Newport12,644
Lincoln14,168
NorthKingstown15,684
Smithfield14,283
Johnston12,449
Middletown10,651
Westerly8,729
SouthKingstown
9,987
WestWarwick6,755
N.Prov.6,018
Cumberland10,432
EastGreenwich
7,556
Coventry6,564 Bristol
5,700
Portsmouth5,193
Warren3,645
West Greenwich2,815
NorthSmithfield 4,615
Narragansett3,851
CentralFalls2,231
Burrillville2,688
Barrington2,424
Tiverton2,232
Charlestown1,349
Richmond1,379Hopkinton
1,150
Scituate1,108
Glocester1,073
Exeter 1,403
Jamestown905
NewShoreham
882
LittleCompton
645
Foster380

Hometown22.3%Elsewhere
0.4%
Other RI Town61.8%
Massachusetts15.0%
Connecticut
0.5%
Barrington
Establishment Employment 2006 2009 2017
Total Private & Government 3,133 2,993 3,094
Total Private Only 2,410 2,270 2,424
Government 723 723 670
Health Care & Social Assistance 453 506 501
Accommodation & Food Services 288 265 303
Retail Trade 391 343 278
Other Services 280 259 271
Arts, Entertainment, & Recreation 155 166 179
Construction 218 153 169
Educational Services 124 141 155
Professional & Technical Services 108 103 149
Finance & Insurance 87 85 139
Administrative Support & Waste Management 58 60 114
Wholesale Trade 84 52 47
Real Estate & Rental & Leasing 36 27 34
Manufacturing 79 51 27
Information 23 24 18
Transportation & Warehousing 3 2 *
Management of Companies & Enterprises * * *
Agriculture, Forestry, Fishing & Hunting * * 0
Mining 0 0 0
Utilities 0 0 0
Where Barrington Residents Work, 2013
Language
Population Age 18-64
Population 1990 2000 2016
Total Population 15,849 16,819 16,304
Male 7,705 8,197 7,973
Female 8,144 8,622 8,331
16 years + 12,303 12,561 12,525
21 years + 11,362 11,608 11,619
65 years + 2,173 2,471 2,867
White 15,611 16,209 15,274
Black/African American 52 115 95
American Indian & Alaskan Native 6 19 0
Asian & Pacific Islander 152 297 536
Some other race 28 43 13
Two or more races - 136 386
Hispanic or Latino (of any race) 125 177 365
Educational Attainment 1990 2000 2016
Population (Age 25+) 10,773 11,195 11,251
Less than 9th grade 2.9% 2.0% 1.0%
9th-12th, no diploma 8.2% 5.7% 3.3%
High School Graduate / GED 18.3% 16.4% 10.8%
Some College, no degree 16.3% 16.0% 11.0%
Associate Degree 7.9% 6.8% 6.7%
Bachelor Degree 25.9% 29.5% 30.3%
Graduate/Professional Degree 20.5% 23.7% 36.9%
1990 2000 2016
Median Household Income $53,058 $74,591 $116,935
Annual Average Labor Force Estimates 2006 2009 2017
Labor Force 8,582 8,374 8,430
Employment 8,282 7,675 8,175
Unemployment 300 699 255
Unemployment Rate 3.5% 8.3% 3.0%
w Barrington’s total population grew by 6.1
percent during the 1990’s, with the addition of
970 people, however, between 2000 and 2016,
Barrington lost 515 (-3.1%) residents.
w Nearly 74 percent of Barrington residents 25
years and older had a college degree (Associate
or higher) in 2016. The share of local residents
without a high school diploma or GED
decreased between 2000 and 2016, falling from
7.7 percent to 4.3 percent.
w Between 2009 and 2017, total employment in
Barrington grew by 101 (+3.4%) jobs. Private
sector employers reported a gain of 154
(+3.4%) jobs, while public sector employment
decreased by 53 (-7.3%) jobs. In comparison,
statewide total employment grew by 28,830
(+6.4%) jobs.
w Barrington’s unemployment rate averaged 3.0
percent in 2017, tied for the second lowest in the
state and well below the state average of 4.5
percent.
w In 2016, 99.5 percent of Barrington residents
age 18-64 spoke only English or spoke another
language and English either well or very well,
compared to 95.1 percent of RI residents.
w Over one-fifth (22.3%) of Barrington residents
work in Barrington, while 15.9 percent work
outside of RI.
2016
Percent of Population that Speak Only English or
Another Language & English either 'well' or 'very well' 99.5%
Percent of Population that Speak English 'not well'
or 'not at all' 0.5%
Language Spoken:
Speak Spanish 0.0%
Speak Other Indo-European 0.1%
Speak Asian/Pacific Islander 0.4%
Speak Other Languages 0.0%

Hometown32.8%
Elsewhere1.0%
Other RI Town
56.7%Massachusetts
8.8%
Connecticut
0.7%
Bristol
Establishment Employment 2006 2009 2017
Total Private & Government 7,666 7,462 6,796
Total Private Only 6,473 6,273 5,700
Educational Services 1,290 * 1,304
Government 1,193 1,188 1,096
Health Care & Social Assistance 901 894 798
Manufacturing 1,222 1,088 796
Accommodation & Food Services 752 737 696
Retail Trade 791 666 546
Construction 483 377 329
Other Services 234 227 275
Arts, Entertainment, & Recreation 101 131 193
Administrative Suport & Waste Management 157 192 191
Wholesale Trade 132 115 170
Finance & Insurance 135 129 159
Professional & Technical Services 96 105 91
Real Estate & Rental & Leasing 42 28 68
Information 80 * 51
Transportation & Warehousing 42 26 4
Management of Companies & Enterprises * 19 *
Utilities 0 * *
Agriculture, Forestry, Fishing & Hunting * * 0
Mining 0 0 0
Where Bristol Residents Work, 2013
w Bristol’s total population grew by 3.9 percent
during the 1990’s, with the addition of 844
people. However, between 2000 and 2016,
Bristol lost 93 (-0.4%) residents.
w Over 47 percent (47.5%) of Bristol residents 25
years and older had a college degree (Associate
or higher) in 2016. The share of local residents
without a high school diploma or GED
decreased between 2000 and 2016, falling from
25.9 percent to 13.2 percent.
w Between 2009 and 2017, employment in Bristol
declined by 666 (-8.9%) jobs. Private sector
employers reported a loss of 573 (-9.1%) jobs,
while public sector employment dropped by 92
(-7.7%) jobs. In comparison, statewide total
employment grew by 28,830 (+6.4%) jobs.
w Bristol’s unemployment rate averaged 4.2
percent in 2017, tied for 19th highest in the state
and below the state average of 4.5 percent.
w In 2016, 98.4 percent of Bristol residents age
18-64 spoke only English or spoke another
language and English either well or very well,
compared to 95.1 percent of RI residents.
w Nearly a third (32.8%) of Bristol residents work
in Bristol, while 10.5 percent work outside of RI.
Language
Population Age 18-64
Population 1990 2000 2016
Total Population 21,625 22,469 22,376
Male 10,620 10,834 10,782
Female 11,005 11,635 11,594
16 years + 17,808 18,540 19,535
21 years + 15,439 16,175 16,545
65 years + 3,520 3,969 4,282
White 21,362 21,826 21,165
Black/African American 99 140 564
American Indian & Alaskan Native 22 37 29
Asian & Pacific Islander 100 161 341
Some other race 42 74 112
Two or more races - 231 165
Hispanic or Latino (of any race) 410 289 624
Educational Attainment 1990 2000 2016
Population (Age 25+) 13,972 14,994 14,985
Less than 9th grade 18.9% 13.3% 6.2%
9th-12th, no dip loma 16.0% 12.6% 7.0%
High School Graduate / GED 28.0% 25.6% 24.0%
Some College, no degree 13.2% 16.1% 15.4%
Associate Degree 4.2% 6.1% 8.6%
Bachelor Degree 12.5% 16.0% 23.2%
Graduate/Professional Degree 7.1% 10.2% 15.7%
1990 2000 2016
Median Household Income $34,165 $43,689 $62,909
Annual Average Labor Force Estimates 2006 2009 2017
Labor Force 13,632 12,467 12,077
Employment 13,032 11,148 11,575
Unemployment 600 1,319 502
Unemployment Rate 4.4% 10.6% 4.2%
2016
Percent of Population that Speak Only English or
Another Language & English either 'well' or 'very well' 98.4%
Percent of Population that Speak English 'not well'
or 'not at all' 1.6%
Language Spoken:
Speak Spanish 0.3%
Speak Other Indo-European 0.6%
Speak Asian/Pacific Islander 0.6%
Speak Other Languages 0.1%

Hometown
19.4%Elsewhere
0.5%
Other RI Town
57.8%
Massachusetts
19.0%
Connecticut
3.3%
Burrillville
Establishment Employment 2006 2009 2017
Total Private & Government 2,840 2,829 3,277
Total Private Only 2,209 2,215 2,688
Manufacturing 375 434 707
Government 631 614 589
Health Care & Social Assistance 492 488 560
Accommodation & Food Services 418 435 474
Construction 208 210 307
Retail Trade 158 151 132
Other Services 170 92 83
Administrative Support & Waste Management 84 74 77
Wholesale Trade 43 47 65
Professional & Technical Services 53 49 59
Utilities 38 * 55
Arts, Entertainment, & Recreation 54 51 48
Transportation & Warehousing 13 12 44
Information 22 33 29
Educational Services 30 40 18
Finance & Insurance 21 24 11
Real Estate & Rental & Leasing 16 7 7
Agriculture, Forestry, Fishing & Hunting * * *
Management of Companies & Enterprises * * 0
Mining 0 0 0
Where Burrillville Residents Work, 2013
w Burrillville’s total population decreased by 2.7
percent during the 1990’s, with the loss of 434
people, however, between 2000 and 2016,
Burrillville gained 418 (+2.6%) residents.
w Over 35 percent of Burrillville residents 25 years
and older had a college degree (Associate or
higher) in 2016. The share of local residents
without a high school diploma or GED
decreased between 2000 and 2016, falling from
19.6 percent to 12.1 percent.
w Between 2009 and 2017, employment in
Burrillville increased by 448 (+15.8%) jobs.
Private sector employers reported a gain of 473
(+21.4%) jobs, while public sector employment
declined by 25 (-4.1%) jobs. In comparison,
statewide total employment grew by 28,830
(+6.4%) jobs.
w Burrillville’s unemployment rate averaged 4.4
percent in 2017, tied for the 12th highest in RI
and below the state average of 4.5 percent.
w In 2016, 99.7 percent of Burrillville residents age
18-64 spoke only English or spoke another
language and English either well or very well,
compared to 95.1 percent of RI residents.
w Nearly one-fifth (19.4%) of Burrillville residents
work in Burrillville, while 22.8 percent work
outside of RI.
Language
Population Age 18-64
Population 1990 2000 2016
Total Population 16,230 15,796 16,214
Male 7,987 7,749 7,789
Female 8,243 8,047 8,425
16 years + 12,207 12,301 13,122
21 years + 11,121 11,150 12,291
65 years + 2,033 1,800 2,473
White 16,152 15,569 15,617
Black/African American 17 34 138
American Indian & Alaskan Native 21 31 0
Asian & Pacific Islander 21 38 111
Some other race 19 40 100
Two or more races - 84 248
Hispanic or Latino (of any race) 71 132 233
Educational Attainment 1990 2000 2016
Population (Age 25+) 10,364 10,520 11,847
Less than 9th grade 13.6% 5.3% 3.0%
9th-12th, no diploma 15.8% 14.3% 9.1%
High School Graduate / GED 31.9% 35.0% 31.6%
Some College, no degree 14.8% 19.3% 21.1%
Associate Degree 8.0% 9.9% 9.9%
Bachelor Degree 10.3% 11.2% 17.6%
Graduate/Professional Degree 5.6% 5.0% 7.7%
1990 2000 2016
Median Household Income $37,156 $52,587 $67,693
Annual Average Labor Force Estimates 2006 2009 2017
Labor Force 9,917 10,012 8,989
Employment 9,456 8,901 8,590
Unemployment 461 1,111 399
Unemployment Rate 4.6% 11.1% 4.4%
2016
Percent of Population that Speak Only English or
Another Language & English either 'well' or 'very well' 99.7%
Percent of Population that Speak English 'not well'
or 'not at all' 0.3%
Language Spoken:
Speak Spanish 0.1%
Speak Other Indo-European 0.1%
Speak Asian/Pacific Islander 0.0%
Speak Other Languages 0.0%

Hometown
11.5%Elsewhere
1.4%
Other RI Town
58.5%Massachusetts
28.3%
Connecticut
0.3%
Central Falls
Establishment Employment 2006 2009 2017
Total Private & Government 3,106 2,742 2,855
Total Private Only 2,264 1,946 2,231
Government 842 796 624
Manufacturing 709 602 545
Health Care & Social Assistance 251 239 389
Accommodation & Food Services 171 158 263
Retail Trade 177 195 249
Administrative Support & Waste Management 298 291 210
Educational Services * * 207
Construction 150 93 146
Other Services 123 112 90
Finance & Insurance 90 79 29
Real Estate & Rental & Leasing 48 42 27
Transportation & Warehousing 78 18 26
Wholesale Trade 121 37 22
Professional & Technical Services 19 23 19
Information 0 * *
Agriculture, Forestry, Fishing & Hunting 0 0 *
Arts, Entertainment, & Recreation * * 0
Mining 0 0 0
Utilities 0 0 0
Management of Companies & Enterprises 0 0 0
Where Central Falls Residents Work, 2013
w Central Falls’ total population grew by 7.3
percent during the 1990’s, with the addition of
1,291 people. Between 2000 and 2016, Central
Falls added another 438 (+2.3%) residents.
w Nearly thirteen percent of Central Falls
residents 25 years and older had a college
degree (Associate or higher) in 2016. The share
of local residents without a high school diploma
or GED decreased between 2000 and 2016.
While falling from 50.9 percent to 43.8 percent,
Central Falls continued to have the highest
percentage of residents without a high school
diploma.
w Between 2009 and 2017, employment in Central
Falls grew by 113 (+4.1%) jobs. Private sector
employers reported a gain of 285 (+14.6%) jobs,
while public sector employment decreased by
172 (-21.6%) jobs. In comparison, statewide
total employment grew by 28,830 (+6.4%) jobs.
w Central Falls’ unemployment rate averaged 5.6
percent in 2017, the third highest in the state and
well above the state average of 4.5 percent.
w In 2016, 67.9 percent of Central Falls residents
age 18-64 spoke only English or spoke another
language and English either well or very well,
compared to 95.1 percent of RI residents.
w Nearly an eighth of Central Falls residents work in
the city, while 30 percent work outside of RI.
Language
Population Age 18-64
Population 1990 2000 2016
Total Population 17,637 18,928 19,366
Male 8,332 9,404 9,924
Female 9,305 9,524 9,442
16 years + 13,152 13,995 14,049
21 years + 12,058 12,485 12,561
65 years + 2,632 2,177 1,486
White 13,656 10,820 9,951
Black/African American 744 1,101 4,222
American Indian & Alaskan Native 47 108 171
Asian & Pacific Islander 136 136 88
Some other race 3,054 5,367 4,240
Two or more races - 1,396 694
Hispanic or Latino (of any race) 5,119 9,041 12,365
Educational Attainment 1990 2000 2016
Population (Age 25+) 10,860 11,282 11,043
Less than 9th grade 24.7% 24.3% 25.4%
9th-12th, no dip loma 28.4% 26.6% 18.4%
High School Graduate / GED 28.7% 28.0% 31.1%
Some College, no degree 8.9% 11.9% 12.3%
Associate Degree 3.7% 3.5% 4.1%
Bachelor Degree 4.6% 3.8% 5.9%
Graduate/Professional Degree 1.1% 1.9% 2.8%
1990 2000 2016
Median Household Income $18,617 $22,628 $28,901
Annual Average Labor Force Estimates 2006 2009 2017
Labor Force 8,220 8,262 8,526
Employment 7,658 7,089 8,046
Unemployment 562 1,173 480
Unemployment Rate 6.8% 14.2% 5.6%
2016
Percent of Population that Speak Only English or
Another Language & English either 'well' or 'very well' 67.9%
Percent of Population that Speak English 'not well'
or 'not at all' 32.1%
Language Spoken:
Speak Spanish 29.4%
Speak Other Indo-European 2.5%
Speak Asian/Pacific Islander 0.2%
Speak Other Languages 0.0%

Hometown
20.3%Elsewhere
1.2%
Other RI Town
68.7%Massachusetts
2.4%
Connecticut
7.4%
Charlestown
Establishment Employment 2006 2009 2017
Total Private & Government 1,632 1,460 1,565
Total Private Only 1,459 1,258 1,349
Accommodation & Food Services 207 187 290
Government 173 202 215
Construction 185 145 166
Health Care & Social Assistance 186 177 153
Retail Trade 174 143 145
Administrative Support & Waste Management 78 61 52
Real Estate & Rental & Leasing 20 19 48
Finance & Insurance 28 35 46
Other Services 32 38 41
Professional & Technical Services 59 45 40
Arts, Entertainment, & Recreation 7 20 27
Wholesale Trade 36 21 25
Information 17 20 21
Educational Services 0 * 3
Transportation & Warehousing 117 12 *
Agriculture, Forestry, Fishing & Hunting * * *
Mining * * *
Manufacturing 308 * *
Management of Companies & Enterprises 0 0 *
Utilities 0 0 0
Where Charlestown Residents Work, 2013
w Charlestown’s total population grew by 21.3
percent during the 1990’s, with the addition of
1,381 people, however, between 2000 and 2016,
Charlestown lost 83 (-1.1%) residents.
w Over half of Charlestown residents 25 years and
older had a college degree (Associate or higher)
in 2016. The share of local residents without a
high school diploma or GED decreased between
2000 and 2016, falling from 10.0 percent to 6.1
percent.
w Between 2009 and 2017, employment in
Charlestown increased by 105 (+7.2%) jobs.
Private sector employers reported a gain of 91
(+7.2%) jobs, while public sector employment
increased by 13 (+6.4%). In comparison,
statewide total employment grew by 28,830
(+6.4%) jobs.
w Charlestown’s unemployment rate averaged 4.7
percent in 2017, tied for the 8th highest in RI
and above the state average of 4.5 percent.
w In 2016, 100.0 percent of Charlestown residents
age 18-64 spoke only English or spoke another
language and English either well or very well,
compared to 95.1 percent of RI residents.
w Over one-fifth (20.3%) of Charlestown
residents work in Charlestown, while 11 percent
work outside of RI.
Language
Population Age 18-64
Population 1990 2000 2016
Total Population 6,478 7,859 7,776
Male 3,215 3,893 4,140
Female 3,263 3,966 3,636
16 years + 5,033 6,331 6,553
21 years + 4,695 5,907 6,176
65 years + 876 1,143 1,653
White 6,284 7,565 7,278
Black/African American 43 30 10
American Indian & Alaskan Native 103 99 145
Asian & Pacific Islander 42 50 85
Some other race 6 42 48
Two or more races - 73 210
Hispanic or Latino (of any race) 37 87 147
Educational Attainment 1990 2000 2016
Population (Age 25+) 4,370 5,637 5,815
Less than 9th grade 3.2% 2.0% 2.2%
9th-12th, no diploma 10.8% 8.0% 3.9%
High School Graduate / GED 33.9% 32.0% 25.3%
Some College, no degree 18.6% 20.7% 18.5%
Associate Degree 10.0% 7.8% 10.6%
Bachelor Degree 15.4% 17.9% 24.3%
Graduate/Professional Degree 8.1% 11.6% 15.2%
1990 2000 2016
Median Household Income $36,040 $51,491 $73,203
Annual Average Labor Force Estimates 2006 2009 2017
Labor Force 4,816 4,765 4,084
Employment 4,590 4,246 3,891
Unemployment 226 519 193
Unemployment Rate 4.7% 10.9% 4.7%
2016
Percent of Population that Speak Only English or
Another Language & English either 'well' or 'very well' 100.0%
Percent of Population that Speak English 'not well'
or 'not at all' 0.0%
Language Spoken:
Speak Spanish 0.0%
Speak Other Indo-European 0.0%
Speak Asian/Pacific Islander 0.0%
Speak Other Languages 0.0%

Hometown
18.0%Elsewhere
0.1%
Other RI Town
74.7%
Massachusetts4.1%
Connecticut3.1%
Coventry
Establishment Employment 2006 2009 2017
Total Private & Government 8,044 7,627 7,814
Total Private Only 6,630 6,351 6,564
Retail Trade 1,464 1,694 1,671
Health Care & Social Assistance 916 936 1,290
Government 1,414 1,276 1,250
Accommodation & Food Services 1,004 959 892
Manufacturing 814 666 545
Construction 723 439 408
Administrative Support & Waste Management 214 237 367
Professional & Technical Services 176 179 332
Other Services 283 289 308
Wholesale Trade 236 270 257
Transportation & Warehousing 308 241 135
Educational Services 104 101 92
Finance & Insurance 128 127 86
Management of Companies & Enterprises 56 55 62
Real Estate & Rental & Leasing 106 59 54
Information 24 28 33
Arts, Entertainment, & Recreation 60 56 *
Agriculture, Forestry, Fishing & Hunting 14 * *
Mining 0 * 0
Utilities 0 0 0
Where Coventry Residents Work, 2013
w Coventry’s total population grew by 8.3 percent
during the 1990’s, with the addition of 2,585
people. Between 2000 and 2016, Coventry
gained another 1,285 (+3.8%) residents.
w Over 39 percent of Coventry residents 25 years
and older had a college degree (Associate or
higher) in 2016. The share of local residents
without a high school diploma or GED
decreased between 2000 and 2016, falling from
16.7 percent to 7.9 percent.
w Between 2009 and 2017, employment in
Coventry increased by 187 (+2.5%) jobs.
Private sector employers reported a gain of 213
(+3.4%) jobs, while public sector employment
lost 26 (-2.0%) jobs. In comparison, statewide
total employment grew by 28,830 (+6.4%) jobs.
w Coventry’s unemployment rate averaged 4.2
percent in 2017, tied for the 19th highest in the
state and below the state average of 4.5
percent.
w In 2016, 99.9 percent of Coventry residents age
18-64 spoke only English or spoke another
language and English either well or very well,
compared to 95.1 percent of RI residents.
w Nearly one-fifth (18.0%) of Coventry residents
work in Coventry, while 7.3 percent work
outside of RI.
Language
Population Age 18-64
Population 1990 2000 2016
Total Population 31,083 33,668 34,953
Male 15,064 16,301 17,053
Female 16,019 17,367 17,900
16 years + 24,360 26,257 29,095
21 years + 22,203 24,230 26,736
65 years + 4,036 4,384 5,640
White 30,771 32,859 33,718
Black/African American 82 131 384
American Indian & Alaskan Native 32 50 0
Asian & Pacific Islander 115 196 204
Some other race 83 106 112
Two or more races - 326 535
Hispanic or Latino (of any race) 260 385 616
Educational Attainment 1990 2000 2016
Population (Age 25+) 20,814 23,172 25,166
Less than 9th grade 9.2% 5.1% 2.1%
9th-12th, no dip loma 16.4% 11.6% 5.8%
High School Graduate / GED 34.9% 34.5% 33.1%
Some College, no degree 17.8% 20.7% 19.6%
Associate Degree 7.6% 8.5% 13.0%
Bachelor Degree 10.4% 14.8% 17.0%
Graduate/Professional Degree 3.7% 4.9% 9.3%
1990 2000 2016
Median Household Income $37,230 $51,987 $65,507
Annual Average Labor Force Estimates 2006 2009 2017
Labor Force 20,540 20,744 18,810
Employment 19,607 18,561 18,013
Unemployment 933 2,183 797
Unemployment Rate 4.5% 10.5% 4.2%
2016
Percent of Population that Speak Only English or
Another Language & English either 'well' or 'very well' 99.9%
Percent of Population that Speak English 'not well'
or 'not at all' 0.1%
Language Spoken:
Speak Spanish 0.1%
Speak Other Indo-European 0.0%
Speak Asian/Pacific Islander 0.0%
Speak Other Languages 0.0%

Hometown
25.3%
Elsewhere
0.4%
Other RI Town
66.0% Massachusetts7.3%
Connecticut
1.0%
Cranston
Establishment Employment 2006 2009 2017
Total Private & Government 36,695 32,773 37,158
Total Private Only 29,804 26,706 30,825
Government 6,890 6,067 6,333
Retail Trade 4,477 4,101 5,126
Health Care & Social Assistance 3,621 3,936 3,963
Manufacturing 4,719 3,947 3,474
Accommodation & Food Services 2,711 2,707 3,413
Finance & Insurance 1,331 755 2,786
Administrative Support & Waste Management 2,587 1,716 2,747
Professional & Technical Services 1,468 1,632 2,292
Wholesale Trade 1,718 1,517 1,703
Other Services 1,551 1,515 1,613
Construction 1,635 1,224 1,178
Transportation & Warehousing 684 590 607
Management of Companies & Enterprises 308 246 580
Arts, Entertainment, & Recreation 290 270 368
Real Estate & Rental & Leasing 611 397 336
Information 1,574 1,802 301
Educational Services 431 304 292
Agriculture, Forestry, Fishing & Hunting 24 16 20
Mining * * *
Utilities * 0 0
Where Cranston Residents Work, 2013
w Cranston’s total population grew by 4.2 percent
during the 1990’s, with the addition of 3,209
people. Between 2000 and 2016, Cranston
added another 1,613 (+2.0%) residents.
w Nearly 40 percent of Cranston residents 25
years and older had a college degree (Associate
or higher) in 2016. The share of local residents
without a high school diploma or GED
decreased between 2000 and 2016, falling from
21.3 percent to 10.8 percent.
w Between 2009 and 2017, employment in
Cranston increased by 4,385 (+13.4%) jobs.
Private sector employers reported a gain of
4,119 (+15.4%) jobs, while public sector
employment grew by 266 (+4.4%) jobs. In
comparison, statewide total employment grew
by 28,830 (+6.4%) jobs.
w Cranston’s unemployment rate averaged 4.3
percent in 2017, tied for the 14th highest in the
state and below the state average of 4.5
percent.
w In 2016, 96.5 percent of Cranston residents age
18-64 spoke only English or spoke another
language and English either well or very well,
compared to 95.1 percent of RI residents.
w Over one-quarter (25.3%) of Cranston residents
work in Cranston, while 8.7 percent work
outside of RI.
Language
Population Age 18-64
Population 1990 2000 2016
Total Population 76,060 79,269 80,882
Male 36,594 38,800 39,609
Female 39,466 40,469 41,273
16 years + 62,903 64,096 67,353
21 years + 58,502 59,415 61,991
65 years + 14,124 13,711 13,124
White 72,318 70,703 66,169
Black/African American 1,837 2,926 4,223
American Indian & Alaskan Native 139 236 235
Asian & Pacific Islander 1,348 2,632 4,637
Some other race 418 1,528 3,053
Two or more races - 1,244 2,565
Hispanic or Latino (of any race) 1,532 3,613 10,743
Educational Attainment 1990 2000 2016
Population (Age 25+) 54,062 55,886 57,307
Less than 9th grade 8.5% 6.6% 4.9%
9th-12th, no diploma 17.5% 14.7% 5.9%
High School Graduate / GED 30.2% 28.7% 31.2%
Some College, no degree 16.2% 17.8% 18.1%
Associate Degree 6.5% 7.6% 9.2%
Bachelor Degree 13.7% 15.6% 18.6%
Graduate/Professional Degree 7.4% 9.0% 12.0%
1990 2000 2016
Median Household Income $34,528 $44,108 $61,646
Annual Average Labor Force Estimates 2006 2009 2017
Labor Force 42,743 42,232 41,328
Employment 40,644 37,551 39,551
Unemployment 2,099 4,681 1,777
Unemployment Rate 4.9% 11.1% 4.3%
2016
Percent of Population that Speak Only English or
Another Language & English either 'well' or 'very well' 96.5%
Percent of Population that Speak English 'not well'
or 'not at all' 3.5%
Language Spoken:
Speak Spanish 1.7%
Speak Other Indo-European 0.6%
Speak Asian/Pacific Islander 1.1%
Speak Other Languages 0.3%

Hometown
19.1%Elsewhere
1.0%
Other RI Town
52.9%
Massachusetts
26.2%
Connecticut
0.8%
Cumberland
Establishment Employment 2006 2009 2017
Total Private & Government 10,143 8,856 11,469
Total Private Only 8,724 7,590 10,432
Manufacturing 1,698 1,254 1,694
Management of Companies & Enterprises 5 * 1,220
Administrative Support & Waste Management 174 160 1,081
Government 1,419 1,266 1,037
Retail Trade 974 955 964
Health Care & Social Assistance 1,109 1,032 885
Accommodation & Food Services 610 614 815
Construction 1,129 798 716
Transportation & Warehousing 451 470 674
Other Services 513 534 585
Wholesale Trade 875 727 540
Professional & Technical Services 370 337 309
Educational Services 111 112 306
Finance & Insurance 246 151 170
Information 65 139 133
Real Estate & Rental & Leasing 110 106 108
Arts, Entertainment, & Recreation 90 69 70
Agriculture, Forestry, Fishing & Hunting * * *
Mining * * *
Utilities * * *
Where Cumberland Residents Work, 2013
w Cumberland’s total population grew by 9.6
percent during the 1990’s, with the addition of
2,802 people. Between 2000 and 2016,
Cumberland gained another 2,445 (+7.7%)
residents.
w Nearly 47 percent of Cumberland residents 25
years and older had a college degree (Associate or
higher) in 2016. The share of local residents
without a high school diploma or GED decreased
between 2000 and 2016, falling from 18.6 percent
to 10.3 percent.
w Between 2009 and 2017, employment in
Cumberland increased by 2,613 (+29.5%) jobs.
Private sector employers reported a gain of 2,842
(+37.4%) jobs, while public sector employment
fell by 229 (-18.1%) jobs. In comparison, RI total
employment grew by 28,830 (+6.4%) jobs.
w Cumberland’s unemployment rate averaged 3.7
percent in 2017, the 9th lowest in RI and below
the state average of 4.5 percent.
w In 2016, 98.6 percent of Cumberland residents
age 18-64 spoke only English or spoke another
language and English either well or very well,
compared to 95.1 percent of RI residents.
w Nearly one-fifth (19.1%) of Cumberland residents
work in Cumberland, while 28.0 percent work
outside of RI.
Language
Population Age 18-64
Population 1990 2000 2016
Total Population 29,038 31,840 34,285
Male 13,877 15,177 16,400
Female 15,161 16,663 17,885
16 years + 23,363 24,973 28,108
21 years + 21,515 23,245 26,287
65 years + 4,229 5,098 6,210
White 28,730 30,803 32,484
Black/African American 71 180 449
American Indian & Alaskan Native 11 25 36
Asian & Pacific Islander 116 272 574
Some other race 110 267 381
Two or more races - 293 361
Hispanic or Latino (of any race) 440 667 1,830
Educational Attainment 1990 2000 2016
Population (Age 25+) 20,006 22,377 24,822
Less than 9th grade 10.7% 7.7% 4.4%
9th-12th, no dip loma 14.6% 10.9% 5.9%
High School Graduate / GED 29.8% 27.1% 25.0%
Some College, no degree 13.6% 16.6% 18.0%
Associate Degree 8.7% 8.3% 9.8%
Bachelor Degree 15.5% 19.5% 22.4%
Graduate/Professional Degree 7.0% 10.0% 14.5%
1990 2000 2016
Median Household Income $40,683 $54,656 $78,150
Annual Average Labor Force Estimates 2006 2009 2017
Labor Force 19,860 19,864 19,631
Employment 19,003 17,867 18,896
Unemployment 857 1,997 735
Unemployment Rate 4.3% 10.1% 3.7%
2016
Percent of Population that Speak Only English or
Another Language & English either 'well' or 'very well' 98.6%
Percent of Population that Speak English 'not well'
or 'not at all' 1.4%
Language Spoken:
Speak Spanish 0.9%
Speak Other Indo-European 0.4%
Speak Asian/Pacific Islander 0.0%
Speak Other Languages 0.0%

Hometown
18.7%Elsewhere
1.4%
Other RI Town
73.8% Massachusetts
4.8%
Connecticut
1.3%
East Greenwich
Establishment Employment 2006 2009 2017
Total Private & Government 7,354 6,769 8,242
Total Private Only 6,604 6,010 7,556
Health Care & Social Assistance 1,007 1,217 1,703
Accommodation & Food Services 1,106 1,000 1,450
Retail Trade 796 689 888
Professional & Technical Services 404 523 781
Educational Services 208 215 717
Government 750 759 686
Finance & Insurance 518 295 325
Other Services 279 296 321
Manufacturing 982 622 286
Administrative Support & Waste Management 149 260 228
Management of Companies & Enterprises 43 * 206
Construction 289 206 192
Wholesale Trade 405 297 176
Arts, Entertainment, & Recreation 117 134 82
Transportation & Warehousing 96 * 76
Information 30 27 57
Real Estate & Rental & Leasing 161 103 51
Agriculture, Forestry, Fishing & Hunting 12 11 *
Utilities 0 0 *
Mining 0 0 0
Where East Greenwich Residents Work, 2013
w East Greenwich’s total population grew by 9.1
percent during the 1990’s, with the addition of
1,083 people. Between 2000 and 2016, East
Greenwich added another 156 (+1.2%)
residents.
w Nearly 68 percent of East Greenwich residents
25 years and older had a college degree
(Associate or higher) in 2016. The share of local
residents without a high school diploma or GED
decreased between 2000 and 2016, falling from
7.4 percent to 4.4 percent.
w Between 2009 and 2017, employment in East
Greenwich increased by 1,473 (+21.8%) jobs.
Private sector employers reported a gain of
1,546 (+25.7%) jobs, while public sector
employment dropped by 73 (-9.6%) jobs. In
comparison, statewide total employment grew
by 28,830 (+6.4%) jobs.
w East Greenwich’s unemployment rate averaged
4.0 percent in 2017, tied for the 17th lowest in
RI and below the state average of 4.5 percent.
w In 2016, 99.3 percent of East Greenwich
residents age 18-64 spoke only English or spoke
another language and English either well or very
well, compared to 95.1 percent of RI residents.
w Nearly one-fifth (18.7%) of East Greenwich
residents work in East Greenwich, while 7.5
percent work outside of RI.
Language
Population Age 18-64
Population 1990 2000 2016
Total Population 11,865 12,948 13,104
Male 5,734 6,267 6,313
Female 6,131 6,681 6,791
16 years + 9,307 9,818 10,215
21 years + 8,519 9,087 9,464
65 years + 1,448 1,756 2,215
White 11,628 12,383 12,120
Black/African American 49 89 77
American Indian & Alaskan Native 22 8 43
Asian & Pacific Islander 159 325 404
Some other race 7 37 46
Two or more races - 106 414
Hispanic or Latino (of any race) 77 117 417
Educational Attainment 1990 2000 2016
Population (Age 25+) 8,024 8,733 8,976
Less than 9th grade 2.8% 1.4% 1.6%
9th-12th, no diploma 7.4% 6.0% 2.8%
High School Graduate / GED 21.7% 15.2% 15.4%
Some College, no degree 16.4% 14.0% 12.4%
Associate Degree 7.6% 6.9% 6.1%
Bachelor Degree 26.9% 31.7% 32.9%
Graduate/Professional Degree 17.3% 24.8% 28.8%
1990 2000 2016
Median Household Income $50,896 $70,063 $105,903
Annual Average Labor Force Estimates 2006 2009 2017
Labor Force 7,065 6,985 6,859
Employment 6,757 6,289 6,586
Unemployment 308 696 273
Unemployment Rate 4.4% 10.0% 4.0%
2016
Percent of Population that Speak Only English or
Another Language & English either 'well' or 'very well' 99.3%
Percent of Population that Speak English 'not well'
or 'not at all' 0.7%
Language Spoken:
Speak Spanish 0.0%
Speak Other Indo-European 0.1%
Speak Asian/Pacific Islander 0.4%
Speak Other Languages 0.1%

Hometown
22.5%Elsewhere0.4%
Other RI Town
59.2%
Massachusetts
17.4%
Connecticut
0.5%
East Providence
Establishment Employment 2006 2009 2017
Total Private & Government 22,773 21,527 22,087
Total Private Only 20,906 19,674 20,625
Health Care & Social Assistance 3,498 3,869 4,671
Finance & Insurance 3,317 3,401 2,954
Manufacturing 3,125 2,073 2,356
Retail Trade 1,880 1,706 1,842
Accommodation & Food Services 1,412 1,408 1,624
Government 1,866 1,853 1,462
Wholesale Trade 1,398 1,313 1,215
Administrative Support & Waste Management 1,009 1,093 1,162
Professional & Technical Services 1,248 1,251 1,119
Construction 1,272 972 829
Other Services 731 697 705
Arts, Entertainment, & Recreation 474 654 586
Educational Services 649 432 404
Information 437 353 337
Transportation & Warehousing 128 137 323
Real Estate & Rental & Leasing 256 209 240
Management of Companies & Enterprises 73 106 *
Agriculture, Forestry, Fishing & Hunting 0 0 0
Mining 0 0 0
Utilities 0 0 0
Where East Providence Residents Work, 2013
w East Providence’s total population shrank by 3.4
percent during the 1990’s, with the loss of 1,692people. Between 2000 and 2016, EastProvidence lost another 1,428 (-2.9%) residents.
w One-third (33.9%) of East Providence residents
25 years and older had a college degree(Associate or higher) in 2016. The share of localresidents without a high school diploma or GEDdecreased between 2000 and 2016, falling from28.9 percent to 17.6 percent.
w Between 2009 and 2017, employment in EastProvidence increased by 560 (+2.6%) jobs.Private sector employers reported a gain of 951(+4.8%) jobs, while public sector employmentfell by 391 (-21.1%) jobs. In comparison, RItotal employment grew by 28,830 (+6.4%) jobs.
w East Providence’s unemployment rate averaged4.9 percent in 2017, the 7th highest in RI andabove the state average of 4.5 percent.
w In 2016, 96.8 percent of East Providenceresidents age 18-64 spoke only English or spokeanother language and English either well orvery well, compared to 95.1 percent of RIresidents.
w Over one-fifth (22.5%) of East Providenceresidents work in East Providence, while 18.3percent work outside of RI.
Language
Population Age 18-64
Population 1990 2000 2016
Total Population 50,380 48,688 47,260
Male 23,443 22,629 22,046
Female 26,937 26,059 25,214
16 years + 41,030 39,290 38,992
21 years + 37,860 36,628 36,817
65 years + 9,504 9,203 8,708
White 46,407 42,111 38,915
Black/African American 2,193 2,445 3,122
American Indian & Alaskan Native 241 225 75
Asian & Pacific Islander 294 582 1,279
Some other race 1,245 1,361 1,324
Two or more races - 1,964 2,545
Hispanic or Latino (of any race) 845 922 2,494
Educational Attainment 1990 2000 2016
Population (Age 25+) 35,267 34,489 34,372
Less than 9th grade 14.3% 11.8% 8.1%
9th-12th, no dip loma 18.7% 17.1% 9.5%
High School Graduate / GED 31.4% 29.4% 29.3%
Some College, no degree 14.4% 17.8% 19.2%
Associate Degree 5.1% 5.8% 8.0%
Bachelor Degree 10.6% 12.4% 16.4%
Graduate/Professional Degree 5.4% 5.7% 9.5%
1990 2000 2016
Median Household Income $31,007 $39,108 $52,550
Annual Average Labor Force Estimates 2006 2009 2017
Labor Force 26,170 26,111 24,295
Employment 24,827 23,062 23,113
Unemployment 1,343 3,049 1,182
Unemployment Rate 5.1% 11.7% 4.9%
2016
Percent of Population that Speak Only English or
Another Language & English either 'well' or 'very well' 96.8%
Percent of Population that Speak English 'not well'
or 'not at all' 3.2%
Language Spoken:
Speak Spanish 0.9%
Speak Other Indo-European 1.9%
Speak Asian/Pacific Islander 0.1%
Speak Other Languages 0.2%

Hometown
18.8%
Elsewhere
0.7%
Other RI Town
75.1%
Massachusetts
2.6%
Connecticut
2.8%
Exeter
Establishment Employment 2006 2009 2017
Total Private & Government 1,182 1,289 1,492
Total Private Only 1,083 1,206 1,403
Accommodation & Food Services 131 152 184
Health Care & Social Assistance 193 197 150
Construction 94 75 122
Administrative Support & Waste Management 57 145 121
Arts, Entertainment, & Recreation 69 75 107
Retail Trade 84 64 98
Transportation & Warehousing 68 15 94
Government 99 83 89
Agriculture, Forestry, Fishing & Hunting 147 110 59
Other Services 37 36 42
Wholesale Trade 62 * 41
Manufacturing 69 39 40
Real Estate & Rental & Leasing 7 14 11
Information * 10 9
Finance & Insurance 0 * 5
Professional & Technical Services 49 193 *
Educational Services 14 17 *
Management of Companies & Enterprises 0 * *
Mining 0 0 0
Utilities 0 0 0
Where Exeter Residents Work, 2013
w Exeter’s total population grew by 10.7 percent
during the 1990’s, with the addition of 584
people. Between 2000 and 2016, Exeter gained
another 672 (+11.1%) residents.
w Forty-seven percent of Exeter residents 25
years and older had a college degree (Associate
or higher) in 2016. The share of local residents
without a high school diploma or GED
decreased between 2000 and 2016, falling from
14.0 percent to 10.4 percent.
w Between 2009 and 2017, employment in Exeter
grew by 203 (+15.7%) jobs. Private sector
employers reported a gain of 197 (+16.3%) jobs,
while public sector employment grew by 6
(+7.2%) jobs. In comparison, statewide total
employment grew by 28,830 (+6.4%) jobs.
w Exeter’s unemployment rate averaged 3.8
percent in 2017, tied for the 10th lowest in the
state and below the state average of 4.5
percent.
w In 2016, 100.0 percent of Exeter residents age
18-64 spoke only English or spoke another
language and English either well or very well,
compared to 95.1 percent of RI residents.
w Nearly one-fifth (18.8%) of Exeter residents
work in Exeter, while 6.1 percent work outside
of RI.
Language
Population Age 18-64
Population 1990 2000 2016
Total Population 5,461 6,045 6,717
Male 2,775 2,972 3,483
Female 2,686 3,073 3,234
16 years + 4,105 4,654 5,712
21 years + 3,751 4,255 5,174
65 years + 446 589 920
White 5,362 5,825 6,191
Black/African American 41 40 85
American Indian & Alaskan Native 36 36 3
Asian & Pacific Islander 17 46 189
Some other race 5 20 155
Two or more races - 78 94
Hispanic or Latino (of any race) 30 77 101
Educational Attainment 1990 2000 2016
Population (Age 25+) 3,538 4,094 4,704
Less than 9th grade 11.9% 5.2% 1.0%
9th-12th, no diploma 11.9% 8.8% 9.4%
High School Graduate / GED 29.4% 25.7% 25.4%
Some College, no degree 17.8% 20.7% 17.2%
Associate Degree 5.3% 9.5% 8.2%
Bachelor Degree 15.5% 20.1% 22.9%
Graduate/Professional Degree 8.2% 10.2% 16.0%
1990 2000 2016
Median Household Income $38,179 $64,452 $78,545
Annual Average Labor Force Estimates 2006 2009 2017
Labor Force 3,783 3,814 3,896
Employment 3,618 3,456 3,749
Unemployment 165 358 147
Unemployment Rate 4.4% 9.4% 3.8%
2016
Percent of Population that Speak Only English or
Another Language & English either 'well' or 'very well' 100.0%
Percent of Population that Speak English 'not well'
or 'not at all' 0.0%
Language Spoken:
Speak Spanish 0.0%
Speak Other Indo-European 0.0%
Speak Asian/Pacific Islander 0.0%
Speak Other Languages 0.0%

Hometown
11.9%
Elsewhere
0.0%
Other RI Town71.5%
Massachusetts
8.5%
Connecticut
8.1%
Foster
Establishment Employment 2006 2009 2017
Total Private & Government 446 448 478
Total Private Only 356 344 380
Finance & Insurance * * *
Information 15 * *
Management of Companies & Enterprises 0 * *
Manufacturing 13 5 *
Government 90 104 98
Health Care & Social Assistance 51 47 73
Administrative Support & Waste Management 18 16 43
Construction 75 58 42
Retail Trade 8 21 37
Arts, Entertainment, & Recreation * * 36
Accommodation & Food Services 39 35 35
Transportation & Warehousing 30 42 34
Professional & Technical Services 16 12 20
Agriculture, Forestry, Fishing & Hunting 21 22 19
Other Services 8 9 11
Wholesale Trade 13 6 7
Real Estate & Rental & Leasing * * 0
Educational Services * * 0
Mining 0 0 0
Utilities 0 0 0
Where Foster Residents Work, 2013
w Foster’s total population declined by 1.0 percent
during the 1990’s, with the loss of 42 people,
however, between 2000 and 2016, Foster gained
403 (+9.4%) residents.
w Over 41 percent of Foster residents 25 years
and older had a college degree (Associate or
higher) in 2016. The share of local residents
without a high school diploma or GED
decreased between 2000 and 2016, falling from
12.4 percent to 7.6 percent.
w Between 2009 and 2017, employment in Foster
increased by 30 (+6.7%) jobs. Private sector
employers reported a gain of 36 (+10.5%) jobs,
while public sector employment fell by 6
(-5.8%) jobs. In comparison, statewide total
employment grew by 28,830 (+6.4%) jobs.
w Foster’s unemployment rate averaged 4.3
percent in 2017, tied for the 14th highest in the
state and below the state average of 4.5
percent.
w In 2016, 99.4 percent of Foster residents age 18-
64 spoke only English or spoke another
language and English either well or very well,
compared to 95.1 percent of RI residents.
w Over one-tenth (11.9%) of Foster residents
work in Foster, while 16.6 percent work outside
of RI.
Language
Population Age 18-64
Population 1990 2000 2016
Total Population 4,316 4,274 4,677
Male 2,119 2,133 2,313
Female 2,197 2,141 2,364
16 years + 3,240 3,311 4,053
21 years + 2,958 3,040 3,714
65 years + 401 447 852
White 4,267 4,157 4,455
Black/African American 19 9 29
American Indian & Alaskan Native 12 10 0
Asian & Pacific Islander 13 29 8
Some other race 5 11 0
Two or more races - 58 185
Hispanic or Latino (of any race) 16 34 0
Educational Attainment 1990 2000 2016
Population (Age 25+) 2,816 2,895 3,491
Less than 9th grade 5.2% 2.9% 2.8%
9th-12th, no dip loma 12.9% 9.5% 4.8%
High School Graduate / GED 31.9% 29.5% 28.5%
Some College, no degree 19.8% 20.5% 22.6%
Associate Degree 5.9% 10.0% 8.4%
Bachelor Degree 14.0% 14.5% 20.5%
Graduate/Professional Degree 10.3% 13.3% 12.3%
1990 2000 2016
Median Household Income $40,795 $59,673 $80,750
Annual Average Labor Force Estimates 2006 2009 2017
Labor Force 2,722 2,746 2,857
Employment 2,577 2,437 2,733
Unemployment 145 309 124
Unemployment Rate 5.3% 11.3% 4.3%
2016
Percent of Population that Speak Only English or
Another Language & English either 'well' or 'very well' 99.4%
Percent of Population that Speak English 'not well'
or 'not at all' 0.6%
Language Spoken:
Speak Spanish 0.3%
Speak Other Indo-European 0.3%
Speak Asian/Pacific Islander 0.0%
Speak Other Languages 0.0%

Hometown
13.9%
Elsewhere
0.0%
Other RI Town
69.9%
Massachusetts
12.7%
Connecticut
3.5%
Glocester
Establishment Employment 2006 2009 2017
Total Private & Government 1,666 1,629 1,522
Total Private Only 1,156 1,136 1,073
Government 509 493 449
Health Care & Social Assistance 288 378 244
Retail Trade 200 182 182
Accommodation & Food Services 134 138 174
Construction 148 131 130
Professional & Technical Services 71 77 75
Transportation & Warehousing 73 64 67
Administrative Support & Waste Management 84 24 53
Other Services 49 43 39
Finance & Insurance 29 22 24
Arts, Entertainment, & Recreation 19 24 20
Information 18 20 19
Real Estate & Rental & Leasing * 4 8
Wholesale Trade 10 6 4
Manufacturing 29 * *
Agriculture, Forestry, Fishing & Hunting * * *
Educational Services * * *
Mining * * 0
Management of Companies & Enterprises * * 0
Utilities 0 0 0
Where Glocester Residents Work, 2013
w Glocester’s total population grew by 7.8 percent
during the 1990’s, with the addition of 721
people, however, between 2000 and 2016,
Glocester lost 14 (-0.1%) residents.
w Nearly 42 percent of Glocester residents 25
years and older had a college degree (Associate
or higher) in 2016. The share of local residents
without a high school diploma or GED
decreased between 2000 and 2016, falling from
13.1 percent to 6.1 percent.
w Between 2009 and 2017, employment in
Glocester declined by 107 (-6.6%) jobs. Private
sector employers reported a loss of 63 (-5.5%)
jobs, while public sector employment fell by 44
(-8.9%) jobs. In comparison, statewide total
employment grew by 28,830 (+6.4%) jobs.
w Glocester’s unemployment rate averaged 3.6
percent in 2017, tied for the 7th lowest in the
state and well below the state average of 4.5
percent.
w In 2016, 100.0 percent of Glocester residents
age 18-64 spoke only English or spoke another
language and English either well or very well,
compared to 95.1 percent of RI residents.
w Over one in eight (13.9%) Glocester residents
work in Glocester, while 16.2 percent work
outside of RI.
Language
Population Age 18-64
Population 1990 2000 2016
Total Population 9,227 9,948 9,934
Male 4,556 4,974 5,119
Female 4,671 4,974 4,815
16 years + 6,939 7,584 8,208
21 years + 6,283 6,950 7,800
65 years + 797 915 1,527
White 9,162 9,797 9,626
Black/African American 33 34 37
American Indian & Alaskan Native 13 15 0
Asian & Pacific Islander 16 24 55
Some other race 3 10 77
Two or more races - 68 139
Hispanic or Latino (of any race) 46 65 266
Educational Attainment 1990 2000 2016
Population (Age 25+) 5,854 6,607 7,208
Less than 9th grade 5.1% 3.6% 2.2%
9th-12th, no diploma 12.1% 9.5% 3.9%
High School Graduate / GED 32.7% 29.7% 29.9%
Some College, no degree 17.8% 21.6% 22.3%
Associate Degree 8.9% 8.4% 10.6%
Bachelor Degree 14.8% 16.8% 20.7%
Graduate/Professional Degree 8.6% 10.4% 10.5%
1990 2000 2016
Median Household Income $40,000 $57,537 $87,758
Annual Average Labor Force Estimates 2006 2009 2017
Labor Force 6,584 6,505 6,026
Employment 6,329 5,922 5,807
Unemployment 255 583 219
Unemployment Rate 3.9% 9.0% 3.6%
2016
Percent of Population that Speak Only English or
Another Language & English either 'well' or 'very well' 100.0%
Percent of Population that Speak English 'not well'
or 'not at all' 0.0%
Language Spoken:
Speak Spanish 0.0%
Speak Other Indo-European 0.0%
Speak Asian/Pacific Islander 0.0%
Speak Other Languages 0.0%

Hometown13.3%
Elsewhere
0.8%
Other RI Town
63.3%
Massachusetts2.1%
Connecticut
20.5%
Hopkinton
Establishment Employment 2006 2009 2017
Total Private & Government 1,223 1,171 1,270
Total Private Only 1,121 1,050 1,150
Manufacturing 357 330 406
Construction 172 139 185
Health Care & Social Assistance 177 175 177
Retail Trade 106 84 120
Government 102 120 119
Accommodation & Food Services 52 34 70
Arts, Entertainment, & Recreation 82 79 44
Administrative Support & Waste Management 27 30 29
Professional & Technical Services 24 52 28
Other Services 33 40 28
Wholesale Trade 17 21 19
Information 16 13 16
Finance & Insurance 8 5 6
Agriculture, Forestry, Fishing & Hunting 12 17 5
Real Estate & Rental & Leasing 10 4 *
Mining * * *
Educational Services * * *
Management of Companies & Enterprises 0 * *
Transportation & Warehousing 24 * 0
Utilities 0 0 0
Where Hopkinton Residents Work, 2013
w Hopkinton’s total population grew by 14.0
percent during the 1990’s, with the addition of
963 people. Between 2000 and 2016, Hopkinton
gained another 277 (+3.5%) residents.
w Nearly 40 percent of Hopkinton residents 25
years and older had a college degree (Associate
or higher) in 2016. The share of local residents
without a high school diploma or GED
decreased between 2000 and 2016, falling from
13.4 percent to 6.5 percent.
w Between 2009 and 2017, employment in
Hopkinton increased by 99 (+8.5%) jobs.
Private sector employers reported a gain of 100
(+9.5%) jobs, while public sector employment
lost 1 (-0.8%) job. In comparison, statewide total
employment grew by 28,830 (+6.4%) jobs.
w Hopkinton’s unemployment rate averaged 4.3
percent in 2017, tied for the 14th highest in the
state and below the state average of 4.5
percent.
w In 2016, 100.0 percent of Hopkinton residents
age 18-64 spoke only English or spoke another
language and English either well or very well,
compared to 95.1 percent of RI residents.
w Over one in eight (13.3%) Hopkinton residents
work in Hopkinton, while 23.4 percent work
outside of RI.
Language
Population Age 18-64
Population 1990 2000 2016
Total Population 6,873 7,836 8,113
Male 3,410 3,912 4,016
Female 3,463 3,924 4,097
16 years + 5,216 6,068 6,782
21 years + 4,750 5,581 6,338
65 years + 763 866 1,260
White 6,775 7,587 7,810
Black/African American 19 48 155
American Indian & Alaskan Native 61 70 0
Asian & Pacific Islander 17 34 41
Some other race 1 21 59
Two or more races - 76 48
Hispanic or Latino (of any race) 45 83 178
Educational Attainment 1990 2000 2016
Population (Age 25+) 4,399 5,321 5,896
Less than 9th grade 6.1% 3.8% 2.2%
9th-12th, no dip loma 14.4% 9.6% 4.3%
High School Graduate / GED 38.7% 36.8% 32.3%
Some College, no degree 17.2% 20.8% 21.4%
Associate Degree 5.4% 7.5% 10.5%
Bachelor Degree 13.4% 14.9% 17.7%
Graduate/Professional Degree 4.9% 6.7% 11.6%
1990 2000 2016
Median Household Income $36,737 $52,181 $74,436
Annual Average Labor Force Estimates 2006 2009 2017
Labor Force 4,849 4,836 4,735
Employment 4,631 4,331 4,530
Unemployment 218 505 205
Unemployment Rate 4.5% 10.4% 4.3%
2016
Percent of Population that Speak Only English or
Another Language & English either 'well' or 'very well' 100.0%
Percent of Population that Speak English 'not well'
or 'not at all' 0.0%
Language Spoken:
Speak Spanish 0.0%
Speak Other Indo-European 0.0%
Speak Asian/Pacific Islander 0.0%
Speak Other Languages 0.0%

Hometown
27.8%
Elsewhere
2.1%
Other RI Town
65.1%
Massachusetts4.0%
Connecticut
1.0%
Jamestown
Establishment Employment 2006 2009 2017
Total Private & Government 1,248 1,223 1,231
Total Private Only 985 930 905
Government 263 293 326
Accommodation & Food Services 156 149 174
Arts, Entertainment, & Recreation 126 102 119
Professional & Technical Services 100 96 107
Health Care & Social Assistance 127 128 98
Retail Trade 88 97 98
Other Services 76 77 71
Administrative Support & Waste Management 57 54 67
Construction 112 83 53
Wholesale Trade 37 36 41
Real Estate & Rental & Leasing 52 33 24
Agriculture, Forestry, Fishing & Hunting 7 * 15
Information * 12 10
Manufacturing 6 9 10
Finance & Insurance 19 24 9
Transportation & Warehousing 2 * 6
Management of Companies & Enterprises * * *
Educational Services * * *
Mining 0 0 0
Utilities 0 0 0
Where Jamestown Residents Work, 2013
w Jamestown’s total population grew by 12.5
percent during the 1990’s, with the addition of
623 people, however, between 2000 and 2016,
Jamestown lost 160 (-2.8%) residents.
w Seventy-one percent of Jamestown residents 25
years and older had a college degree (Associate
or higher) in 2016. The share of local residents
without a high school diploma or GED
decreased between 2000 and 2016, falling from
6.8 percent to 2.9 percent.
w Between 2009 and 2017, employment in
Jamestown increased by 8 (+0.7%) jobs. Private
sector employers reported a loss of 25 (-2.7%)
jobs, while public sector employment grew by 33
(+11.3%). In comparison, statewide total
employment grew by 28,830 (+6.4%) jobs.
w Jamestown’s unemployment rate averaged 2.9
percent in 2017, the lowest rate in the state and
well below the state average of 4.5 percent.
w In 2016, 99.0 percent of Jamestown residents
age 18-64 spoke only English or spoke another
language and English either well or very well,
compared to 95.1 percent of RI residents.
w Over one-quarter (27.8%) of Jamestown
residents work in Jamestown, while 7.1 percent
work outside of RI.
Language
Population Age 18-64
Population 1990 2000 2016
Total Population 4,999 5,622 5,462
Male 2,460 2,733 2,691
Female 2,539 2,889 2,771
16 years + 3,962 4,551 4,571
21 years + 3,717 4,268 4,272
65 years + 650 828 1,189
White 4,938 5,484 4,980
Black/African American 32 44 10
American Indian & Alaskan Native 12 12 14
Asian & Pacific Islander 10 22 397
Some other race 7 13 0
Two or more races - 47 61
Hispanic or Latino (of any race) 45 50 33
Educational Attainment 1990 2000 2016
Population (Age 25+) 3,610 4,160 4,088
Less than 9th grade 2.8% 2.7% 0.5%
9th-12th, no diploma 8.2% 4.1% 2.4%
High School Graduate / GED 23.9% 19.6% 13.7%
Some College, no degree 18.1% 21.4% 12.3%
Associate Degree 5.3% 6.5% 4.6%
Bachelor Degree 23.1% 26.4% 32.7%
Graduate/Professional Degree 18.6% 19.3% 33.7%
1990 2000 2016
Median Household Income $41,518 $63,073 $101,448
Annual Average Labor Force Estimates 2006 2009 2017
Labor Force 3,192 3,084 3,206
Employment 3,079 2,860 3,112
Unemployment 113 224 94
Unemployment Rate 3.5% 7.3% 2.9%
2016
Percent of Population that Speak Only English or
Another Language & English either 'well' or 'very well' 99.0%
Percent of Population that Speak English 'not well'
or 'not at all' 1.0%
Language Spoken:
Speak Spanish 0.0%
Speak Other Indo-European 0.0%
Speak Asian/Pacific Islander 1.0%
Speak Other Languages 0.0%

Hometown
19.0%Elsewhere
0.5%
Other RI Town
71.5%
Massachusetts
7.6%
Connecticut
1.4%
Johnston
Establishment Employment 2006 2009 2017
Total Private & Government 12,343 10,719 13,651
Total Private Only 11,185 9,476 12,449
Health Care & Social Assistance 1,427 1,475 2,110
Administrative Support & Waste Management 1,557 1,195 1,760
Retail Trade 1,665 1,436 1,651
Finance & Insurance 1,199 1,235 1,468
Accommodation & Food Services 948 856 1,237
Government 1,158 1,243 1,202
Manufacturing 1,380 1,032 877
Construction 1,026 673 822
Other Services 468 500 511
Transportation & Warehousing 205 215 467
Information 343 81 403
Real Estate & Rental & Leasing 295 258 326
Wholesale Trade 329 258 263
Professional & Technical Services 228 138 210
Management of Companies & Enterprises * 0 92
Arts, Entertainment, & Recreation 42 43 82
Educational Services 20 21 62
Agriculture, Forestry, Fishing & Hunting 23 30 48
Mining * * *
Utilities * * *
Where Johnston Residents Work, 2013
w Johnston’s total population grew by 6.2 percent
during the 1990’s, with the addition of 1,653
people. Between 2000 and 2016, Johnston
gained another 931 (+3.3%) residents.
w Over 31 percent of Johnston residents 25 years
and older had a college degree (Associate or
higher) in 2016. The share of local residents
without a high school diploma or GED
decreased between 2000 and 2016, falling from
21.9 percent to 11.9 percent.
w Between 2009 and 2017, employment in
Johnston grew by 2,932 (+27.4%) jobs. Private
sector employers reported a gain of 2,973
(+31.4%) jobs, while public sector employment
fell by 41 (-3.3%) jobs. In comparison, statewide
total employment grew by 28,830 (+6.4%) jobs.
w Johnston’s unemployment rate averaged 4.6
percent in 2017, tied for the 10th highest in the
state and above the state average of 4.5
percent.
w In 2016, 99.0 percent of Johnston residents age
18-64 spoke only English or spoke another
language and English either well or very well,
compared to 95.1 percent of RI residents.
w Nearly one-fifth (19.0%) of Johnston residents
work in Johnston, while 9.5 percent work
outside of RI.
Language
Population Age 18-64
Population 1990 2000 2016
Total Population 26,542 28,195 29,126
Male 12,648 13,214 13,601
Female 13,894 14,981 15,525
16 years + 21,786 22,876 24,526
21 years + 20,233 21,466 23,145
65 years + 4,567 5,315 5,976
White 26,193 27,254 26,597
Black/African American 151 184 301
American Indian & Alaskan Native 23 37 117
Asian & Pacific Islander 150 318 1,002
Some other race 25 155 525
Two or more races - 247 584
Hispanic or Latino (of any race) 175 533 2,109
Educational Attainment 1990 2000 2016
Population (Age 25+) 18,727 20,579 21,877
Less than 9th grade 10.7% 6.1% 4.1%
9th-12th, no dip loma 22.5% 15.8% 7.8%
High School Graduate / GED 32.3% 34.2% 36.4%
Some College, no degree 15.3% 17.1% 20.5%
Associate Degree 5.7% 8.8% 9.0%
Bachelor Degree 9.3% 12.3% 15.3%
Graduate/Professional Degree 4.1% 5.7% 7.0%
1990 2000 2016
Median Household Income $32,596 $43,514 $58,295
Annual Average Labor Force Estimates 2006 2009 2017
Labor Force 15,804 15,759 15,687
Employment 14,947 13,925 14,962
Unemployment 857 1,834 725
Unemployment Rate 5.4% 11.6% 4.6%
2016
Percent of Population that Speak Only English or
Another Language & English either 'well' or 'very well' 99.0%
Percent of Population that Speak English 'not well'
or 'not at all' 1.0%
Language Spoken:
Speak Spanish 0.3%
Speak Other Indo-European 0.4%
Speak Asian/Pacific Islander 0.4%
Speak Other Languages 0.0%

Hometown
20.4%Elsewhere
0.3%
Other RI Town
59.8%
Massachusetts
19.5%
Connecticut
0.0%
Lincoln
Establishment Employment 2006 2009 2017
Total Private & Government 14,659 13,687 15,205
Total Private Only 13,378 12,425 14,168
Finance & Insurance 2,774 2,425 2,636
Arts, Entertainment, & Recreation 1,113 1,055 2,153
Manufacturing 2,701 2,184 1,943
Health Care & Social Assistance 1,113 938 1,233
Government 1,281 1,262 1,037
Retail Trade 992 887 885
Construction 872 776 831
Administrative Support & Waste Management 542 486 831
Accommodation & Food Services 614 722 827
Professional & Technical Services 738 594 650
Wholesale Trade 704 807 522
Management of Companies & Enterprises 62 271 454
Transportation & Warehousing 381 488 393
Other Services 209 219 344
Information 291 287 192
Educational Services 86 109 174
Utilities * * 63
Real Estate & Rental & Leasing 62 62 35
Agriculture, Forestry, Fishing & Hunting * * *
Mining 0 0 0
Where Lincoln Residents Work, 2013
w Lincoln’s total population grew by 15.8 percent
during the 1990’s, with the addition of 2,853
people. Between 2000 and 2016, Lincoln gained
another 588 (+2.8%) residents.
w Over 46 percent of Lincoln residents 25 years
and older had a college degree (Associate or
higher) in 2016. The share of local residents
without a high school diploma or GED
decreased between 2000 and 2016, falling from
18.2 percent to 8.8 percent.
w Between 2009 and 2017, employment in Lincoln
increased by 1,518 (+11.1%) jobs. Private sector
employers reported a gain of 1,743 (+14.0%)
jobs, while public sector employment fell by 225
(-17.8%) jobs. In comparison, statewide total
employment grew by 28,830 (+6.4%) jobs.
w Lincoln’s unemployment rate averaged 3.9
percent in 2017, tied for the 13th lowest in the
state and below the state average of 4.5
percent.
w In 2016, 99.0 percent of Lincoln residents age
18-64 spoke only English or spoke another
language and English either well or very well,
compared to 95.1 percent of RI residents.
w Over one-fifth (20.4%) of Lincoln residents
work in Lincoln, while 19.8 percent work outside
of RI.
Language
Population Age 18-64
Population 1990 2000 2016
Total Population 18,045 20,898 21,486
Male 8,553 9,946 10,232
Female 9,492 10,952 11,254
16 years + 14,637 16,311 17,237
21 years + 13,502 15,178 15,895
65 years + 3,240 3,444 3,689
White 17,735 19,967 19,447
Black/African American 41 176 503
American Indian & Alaskan Native 14 16 11
Asian & Pacific Islander 189 368 664
Some other race 66 134 225
Two or more races - 237 636
Hispanic or Latino (of any race) 183 343 1,000
Educational Attainment 1990 2000 2016
Population (Age 25+) 12,647 14,462 14,906
Less than 9th grade 8.5% 7.2% 3.4%
9th-12th, no diploma 15.4% 11.0% 5.4%
High School Graduate / GED 29.5% 25.9% 27.1%
Some College, no degree 16.1% 18.3% 17.8%
Associate Degree 7.9% 7.6% 9.3%
Bachelor Degree 13.9% 16.8% 24.0%
Graduate/Professional Degree 8.7% 13.1% 13.0%
1990 2000 2016
Median Household Income $37,082 $47,815 $65,634
Annual Average Labor Force Estimates 2006 2009 2017
Labor Force 12,432 12,461 12,395
Employment 11,919 11,192 11,915
Unemployment 513 1,269 480
Unemployment Rate 4.1% 10.2% 3.9%
2016
Percent of Population that Speak Only English or
Another Language & English either 'well' or 'very well' 99.0%
Percent of Population that Speak English 'not well'
or 'not at all' 1.0%
Language Spoken:
Speak Spanish 0.6%
Speak Other Indo-European 0.4%
Speak Asian/Pacific Islander 0.0%
Speak Other Languages 0.0%

Hometown
35.3%
Elsewhere
4.7%
Other RI Town35.8%
Massachusetts
23.6%
Connecticut
0.6%
Little Compton
Establishment Employment 2006 2009 2017
Total Private & Government 702 647 775
Total Private Only 566 526 645
Government 136 121 130
Construction 144 103 119
Accommodation & Food Services 113 54 95
Other Services 49 41 77
Arts, Entertainment, & Recreation 56 80 65
Agriculture, Forestry, Fishing & Hunting 29 39 51
Administrative Support & Waste Management 32 75 47
Finance & Insurance * * 41
Retail Trade 31 31 37
Professional & Technical Services 16 15 27
Health Care & Social Assistance 18 * 21
Wholesale Trade 6 6 10
Real Estate & Rental & Leasing 9 7 *
Manufacturing * * *
Transportation & Warehousing * * *
Management of Companies & Enterprises * * *
Educational Services * * *
Mining * * 0
Utilities 0 0 0
Information 0 0 0
Where Little Compton Residents Work, 2013
w Little Compton’s total population grew by 7.6percent during the 1990’s, with the addition of254 people, however, between 2000 and 2016,Little Compton lost 99 (-2.8%) residents.
w Over 64 percent of Little Compton residents 25years and older had a college degree (Associateor higher) in 2016. The share of local residentswithout a high school diploma or GED
decreased between 2000 and 2016, falling from9.0 percent to 2.5 percent.
w Between 2009 and 2017, employment in LittleCompton increased by 128 (+19.7%) jobs.
Private sector employers reported a gain of 119(+22.6%) jobs, while public sector employmentincreased by 9 (+7.4%) jobs. In comparison,statewide total employment grew by 28,830(+6.4%) jobs.
w Little Compton’s unemployment rate averaged3.3 percent in 2017, the 5th lowest in the stateand well below the state average of 4.5 percent.
w In 2016, 99.5 percent of Little Comptonresidents age 18-64 spoke only English or spokeanother language and English either well or verywell, compared to 95.1 percent of RI residents.
w Over one-third (35.3%) of Little Compton
residents work in Little Compton, while 28.9percent work outside of RI.
Language
Population Age 18-64
Population 1990 2000 2016
Total Population 3,339 3,593 3,494
Male 1,667 1,772 1,681
Female 1,672 1,821 1,813
16 years + 2,689 2,869 3,059
21 years + 2,472 2,719 2,811
65 years + 515 637 912
White 3,311 3,548 3,389
Black/African American 1 2 39
American Indian & Alaskan Native 6 7 0
Asian & Pacific Islander 18 11 14
Some other race 3 2 11
Two or more races - 23 41
Hispanic or Latino (of any race) 11 31 62
Educational Attainment 1990 2000 2016
Population (Age 25+) 2,355 2,604 2,698
Less than 9th grade 5.1% 3.8% 1.1%
9th-12th, no dip loma 8.9% 5.2% 1.4%
High School Graduate / GED 26.8% 22.1% 17.2%
Some College, no degree 19.8% 15.3% 16.1%
Associate Degree 5.8% 8.6% 14.6%
Bachelor Degree 23.7% 25.8% 28.0%
Graduate/Professional Degree 10.0% 19.2% 21.5%
1990 2000 2016
Median Household Income $41,187 $55,368 $73,125
Annual Average Labor Force Estimates 2006 2009 2017
Labor Force 1,992 1,973 1,872
Employment 1,909 1,785 1,810
Unemployment 83 188 62
Unemployment Rate 4.2% 9.5% 3.3%
2016
Percent of Population that Speak Only English or
Another Language & English either 'well' or 'very well' 99.5%
Percent of Population that Speak English 'not well'
or 'not at all' 0.5%
Language Spoken:
Speak Spanish 0.0%
Speak Other Indo-European 0.5%
Speak Asian/Pacific Islander 0.0%
Speak Other Languages 0.0%
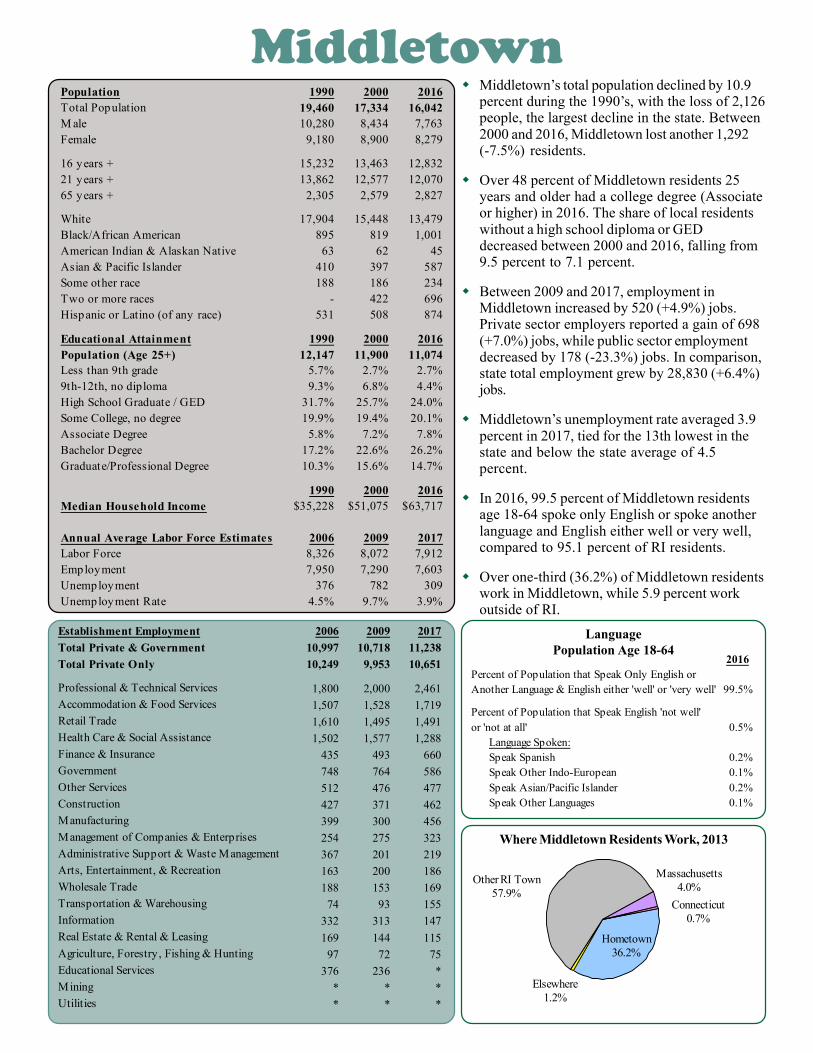
Hometown
36.2%
Elsewhere
1.2%
Other RI Town
57.9%
Massachusetts
4.0%
Connecticut
0.7%
Middletown
Where Middletown Residents Work, 2013
w Middletown’s total population declined by 10.9percent during the 1990’s, with the loss of 2,126people, the largest decline in the state. Between2000 and 2016, Middletown lost another 1,292(-7.5%) residents.
w Over 48 percent of Middletown residents 25years and older had a college degree (Associateor higher) in 2016. The share of local residentswithout a high school diploma or GEDdecreased between 2000 and 2016, falling from9.5 percent to 7.1 percent.
w Between 2009 and 2017, employment inMiddletown increased by 520 (+4.9%) jobs.Private sector employers reported a gain of 698(+7.0%) jobs, while public sector employmentdecreased by 178 (-23.3%) jobs. In comparison,state total employment grew by 28,830 (+6.4%)jobs.
w Middletown’s unemployment rate averaged 3.9percent in 2017, tied for the 13th lowest in thestate and below the state average of 4.5percent.
w In 2016, 99.5 percent of Middletown residentsage 18-64 spoke only English or spoke anotherlanguage and English either well or very well,compared to 95.1 percent of RI residents.
w Over one-third (36.2%) of Middletown residentswork in Middletown, while 5.9 percent workoutside of RI.
Language
Population Age 18-64
Population 1990 2000 2016
Total Population 19,460 17,334 16,042
Male 10,280 8,434 7,763
Female 9,180 8,900 8,279
16 years + 15,232 13,463 12,832
21 years + 13,862 12,577 12,070
65 years + 2,305 2,579 2,827
White 17,904 15,448 13,479
Black/African American 895 819 1,001
American Indian & Alaskan Native 63 62 45
Asian & Pacific Islander 410 397 587
Some other race 188 186 234
Two or more races - 422 696
Hispanic or Latino (of any race) 531 508 874
Educational Attainment 1990 2000 2016
Population (Age 25+) 12,147 11,900 11,074
Less than 9th grade 5.7% 2.7% 2.7%
9th-12th, no diploma 9.3% 6.8% 4.4%
High School Graduate / GED 31.7% 25.7% 24.0%
Some College, no degree 19.9% 19.4% 20.1%
Associate Degree 5.8% 7.2% 7.8%
Bachelor Degree 17.2% 22.6% 26.2%
Graduate/Professional Degree 10.3% 15.6% 14.7%
1990 2000 2016
Median Household Income $35,228 $51,075 $63,717
Annual Average Labor Force Estimates 2006 2009 2017
Labor Force 8,326 8,072 7,912
Employment 7,950 7,290 7,603
Unemployment 376 782 309
Unemployment Rate 4.5% 9.7% 3.9%
2016
Percent of Population that Speak Only English or
Another Language & English either 'well' or 'very well' 99.5%
Percent of Population that Speak English 'not well'
or 'not at all' 0.5%
Language Spoken:
Speak Spanish 0.2%
Speak Other Indo-European 0.1%
Speak Asian/Pacific Islander 0.2%
Speak Other Languages 0.1%
Establishment Employment 2006 2009 2017
Total Private & Government 10,997 10,718 11,238
Total Private Only 10,249 9,953 10,651
Professional & Technical Services 1,800 2,000 2,461
Accommodation & Food Services 1,507 1,528 1,719
Retail Trade 1,610 1,495 1,491
Health Care & Social Assistance 1,502 1,577 1,288
Finance & Insurance 435 493 660
Government 748 764 586
Other Services 512 476 477
Construction 427 371 462
Manufacturing 399 300 456
Management of Companies & Enterprises 254 275 323
Administrative Support & Waste Management 367 201 219
Arts, Entertainment, & Recreation 163 200 186
Wholesale Trade 188 153 169
Transportation & Warehousing 74 93 155
Information 332 313 147
Real Estate & Rental & Leasing 169 144 115
Agriculture, Forestry, Fishing & Hunting 97 72 75
Educational Services 376 236 *
Mining * * *
Utilities * * *

Hometown
26.6%
Elsewhere
0.9%
Other RI Town
67.7%Massachusetts
3.5%
Connecticut
1.3%
Narragansett
Establishment Employment 2006 2009 2017
Total Private & Government 4,128 4,294 4,764
Total Private Only 3,089 3,272 3,851
Accommodation & Food Services 932 1,104 1,265
Government 1,039 1,022 913
Retail Trade 635 665 662
Health Care & Social Assistance 360 461 406
Manufacturing 120 89 277
Other Services 227 186 215
Arts, Entertainment, & Recreation 155 159 169
Construction 117 96 159
Professional & Technical Services 109 86 140
Real Estate & Rental & Leasing 95 97 131
Transportation & Warehousing 95 97 120
Administrative Support & Waste Management 84 81 100
Wholesale Trade 77 67 87
Finance & Insurance 53 48 61
Agriculture, Forestry, Fishing & Hunting 21 21 26
Management of Companies & Enterprises * * 16
Information 3 * 12
Educational Services 5 9 5
Utilities 0 0 *
Mining 0 0 0
Where Narragansett Residents Work, 2013
w Narragansett’s total population grew by 9.2
percent during the 1990’s, with the addition of
1,376 people, however, between 2000 and 2016,
Narragansett lost 689 (-4.2%) residents.
w Over 68 percent of Narragansett residents 25
years and older had a college degree (Associate or
higher) in 2016. The share of local residents
without a high school diploma or GED decreased
between 2000 and 2016, falling from 8.7 percent
to 3.0 percent.
w Between 2009 and 2017, employment in
Narragansett increased by 470 (+10.9%) jobs.
Private sector employers reported a gain of 579
(+17.7%) jobs, while public sector employment
declined by 109 (-10.7%) job. In comparison,
statewide total employment grew by 28,830
(+6.4%) jobs.
w Narragansett’s unemployment rate averaged 3.0
percent in 2017, tied for the 2nd lowest in the
state and well below the state average of 4.5
percent.
w In 2016, 99.8 percent of Narragansett residents
age 18-64 spoke only English or spoke another
language and English either well or very well,
compared to 95.1 percent of RI residents.
w Over one-quarter (26.6%) of Narragansett
residents work in Narragansett, while 5.7 percent
work outside of RI.
Language
Population Age 18-64
Population 1990 2000 2016
Total Population 14,985 16,361 15,672
Male 7,367 7,951 7,640
Female 7,618 8,410 8,032
16 years + 12,436 13,908 13,921
21 years + 11,228 12,464 12,635
65 years + 1,621 2,216 3,223
White 14,558 15,680 15,199
Black/African American 123 122 92
American Indian & Alaskan Native 141 148 13
Asian & Pacific Islander 132 127 143
Some other race 31 55 100
Two or more races - 229 125
Hispanic or Latino (of any race) 155 204 404
Educational Attainment 1990 2000 2016
Population (Age 25+) 9,106 10,356 10,035
Less than 9th grade 3.5% 2.1% 0.7%
9th-12th, no dip loma 9.3% 6.6% 2.3%
High School Graduate / GED 24.2% 22.5% 14.6%
Some College, no degree 18.0% 18.0% 13.7%
Associate Degree 7.9% 9.0% 8.1%
Bachelor Degree 22.6% 24.2% 31.9%
Graduate/Professional Degree 14.5% 17.6% 28.6%
1990 2000 2016
Median Household Income $35,545 $50,363 $71,725
Annual Average Labor Force Estimates 2006 2009 2017
Labor Force 10,098 9,740 9,044
Employment 9,768 9,059 8,771
Unemployment 330 681 273
Unemployment Rate 3.3% 7.0% 3.0%
2016
Percent of Population that Speak Only English or
Another Language & English either 'well' or 'very well' 99.8%
Percent of Population that Speak English 'not well'
or 'not at all' 0.2%
Language Spoken:
Speak Spanish 0.2%
Speak Other Indo-European 0.0%
Speak Asian/Pacific Islander 0.0%
Speak Other Languages 0.0%

Hometown
85.9%
Elsewhere
4.0%
Other RI Town
8.1%
Massachusetts
0.0%
Connecticut
2.0%
New Shoreham
Establishment Employment 2006 2009 2017
Total Private & Government 867 859 1,011
Total Private Only 744 732 882
Accommodation & Food Services 356 352 511
Government 123 127 129
Retail Trade 102 103 100
Construction 92 75 56
Real Estate & Rental & Leasing 36 44 53
Arts, Entertainment, & Recreation 31 31 34
Administrative Support & Waste Management 30 29 33
Other Services 21 18 19
Health Care & Social Assistance * * 15
Transportation & Warehousing 11 11 15
Manufacturing 12 12 12
Professional & Technical Services 9 15 9
Agriculture, Forestry, Fishing & Hunting * * 3
Information 9 * *
Utilities * * *
Wholesale Trade * * *
Finance & Insurance * * *
Management of Companies & Enterprises * * *
Educational Services * * *
Mining 0 0 0
Where New Shoreham Residents Work, 2013
w New Shoreham’s total population grew by 20.8
percent during the 1990’s, with the addition of
174 people. However, between 2000 and 2016,
New Shoreham lost 125 (-12.4%) residents.
w Over 57 percent of New Shoreham residents 25
years and older had a college degree (Associate
or higher) in 2016. The share of local residents
without a high school diploma or GED
decreased between 2000 and 2016, falling from
5.3 percent to 3.5 percent.
w Between 2009 and 2017, employment in New
Shoreham increased by 152 (+17.7%) jobs.
Private sector employers reported a gain of 150
(+20.5%) jobs, while public sector employment
added 2 (+1.6%) jobs. In comparison, statewide
total employment grew by 28,830 (+6.4%) jobs.
w New Shoreham’s unemployment rate averaged
10.7 percent in 2017, the highest rate in RI and
well above the state average of 4.5 percent.
w In 2016, 100.0 percent of New Shoreham
residents age 18-64 spoke only English or spoke
another language and English either well or
very well, compared to 95.1 percent of RI
residents.
w Nearly 86 percent of New Shoreham residents
work in New Shoreham, while 6.0 percent work
outside of RI.
Language
Population Age 18-64
Population 1990 2000 2016
Total Population 836 1,010 885
Male 414 492 414
Female 422 518 471
16 years + 663 837 825
21 years + 652 807 766
65 years + 157 175 192
White 820 988 835
Black/African American 7 6 8
American Indian & Alaskan Native 1 0 0
Asian & Pacific Islander 7 8 14
Some other race 1 3 16
Two or more races - 5 12
Hispanic or Latino (of any race) 8 12 23
Educational Attainment 1990 2000 2016
Population (Age 25+) 600 774 756
Less than 9th grade 1.0% 0.8% 1.1%
9th-12th, no diploma 5.0% 4.5% 2.4%
High School Graduate / GED 26.2% 19.4% 19.7%
Some College, no degree 21.8% 18.5% 19.7%
Associate Degree 8.5% 8.8% 10.2%
Bachelor Degree 26.5% 32.6% 27.0%
Graduate/Professional Degree 11.0% 15.5% 20.0%
1990 2000 2016
Median Household Income $31,471 $44,779 $73,952
Annual Average Labor Force Estimates 2006 2009 2017
Labor Force 1,089 1,103 795
Employment 1,025 992 710
Unemployment 64 111 85
Unemployment Rate 5.9% 10.1% 10.7%
2016
Percent of Population that Speak Only English or
Another Language & English either 'well' or 'very well' 100.0%
Percent of Population that Speak English 'not well'
or 'not at all' 0.0%
Language Spoken:
Speak Spanish 0.0%
Speak Other Indo-European 0.0%
Speak Asian/Pacific Islander 0.0%
Speak Other Languages 0.0%

Hometown
63.5%Elsewhere
2.0%
Other RI Town
29.7%
Massachusetts
4.0%
Connecticut
0.8%
Newport
Establishment Employment 2006 2009 2017
Total Private & Government 17,660 17,516 18,395
Total Private Only 12,754 12,321 12,644
Government 4,906 5,195 5,751
Accommodation & Food Services 3,485 3,493 4,263
Health Care & Social Assistance 1,965 1,730 1,556
Retail Trade 1,510 1,395 1,505
Arts, Entertainment, & Recreation 1,036 949 975
Other Services 607 762 945
Educational Services 603 658 682
Professional & Technical Services 858 755 570
Administrative Support & Waste Management 451 450 382
Real Estate & Rental & Leasing 375 327 365
Construction 629 458 321
Transportation & Warehousing 248 300 213
Information 268 249 213
Finance & Insurance 205 202 185
Manufacturing 232 134 184
Wholesale Trade 211 215 133
Management of Companies & Enterprises 38 214 *
Agriculture, Forestry, Fishing & Hunting 36 31 *
Mining 0 0 0
Utilities 0 0 0
Where Newport Residents Work, 2013
w Newport’s total population declined by 6.2
percent during the 1990’s, with the loss of 1,752
people. Between 2000 and 2016, Newport lost
another 1,905 (-7.2%) residents.
w Nearly 56 percent of Newport residents 25
years and older had a college degree (Associate
or higher) in 2016. The share of local residents
without a high school diploma or GED
decreased between 2000 and 2016, falling from
12.9 percent to 7.1 percent.
w Between 2009 and 2017, employment in
Newport increased by 879 (+5.0%) jobs. Private
sector employers reported a gain of 323
(+2.6%) jobs, while public sector employment
increased by 556 (+10.7%) jobs. In comparison,
statewide total employment grew by 28,830
(+6.4%) jobs.
w Newport’s unemployment rate averaged 3.8
percent in 2017, tied for the 10th lowest in the
state and below the state average of 4.5
percent.
w In 2016, 96.7 percent of Newport residents age
18-64 spoke only English or spoke another
language and English either well or very well,
compared to 95.1 percent of RI residents.
w Nearly two-thirds (63.5%) of Newport residents
work in Newport, while 6.8 percent work
outside of RI.Language
Population Age 18-64
Population 1990 2000 2016
Total Population 28,227 26,475 24,570
Male 13,644 12,751 11,877
Female 14,583 13,724 12,693
16 years + 23,189 21,770 21,412
21 years + 20,369 19,429 19,173
65 years + 3,736 3,408 3,743
White 25,023 22,272 20,489
Black/African American 2,281 2,053 1,331
American Indian & Alaskan Native 210 225 116
Asian & Pacific Islander 399 376 248
Some other race 314 638 951
Two or more races - 911 1,435
Hispanic or Latino (of any race) 789 1,467 2,634
Educational Attainment 1990 2000 2016
Population (Age 25+) 17,810 17,428 16,891
Less than 9th grade 5.9% 4.5% 3.7%
9th-12th, no dip loma 9.9% 8.4% 3.4%
High School Graduate / GED 28.2% 21.4% 19.8%
Some College, no degree 17.8% 18.7% 17.2%
Associate Degree 5.9% 5.5% 5.0%
Bachelor Degree 20.2% 26.3% 31.0%
Graduate/Professional Degree 12.0% 15.1% 19.9%
1990 2000 2016
Median Household Income $30,534 $40,669 $59,794
Annual Average Labor Force Estimates 2006 2009 2017
Labor Force 13,046 12,482 13,816
Employment 12,412 11,211 13,290
Unemployment 634 1,271 526
Unemployment Rate 4.9% 10.2% 3.8%
2016
Percent of Population that Speak Only English or
Another Language & English either 'well' or 'very well' 96.7%
Percent of Population that Speak English 'not well'
or 'not at all' 3.3%
Language Spoken:
Speak Spanish 3.2%
Speak Other Indo-European 0.1%
Speak Asian/Pacific Islander 0.0%
Speak Other Languages 0.0%

Hometown
27.6%
Elsewhere
0.8%
Other RI Town
65.3%Massachusetts
4.6%
Connecticut
1.7%
North Kingstown
Establishment Employment 2006 2009 2017
Total Private & Government 14,447 14,418 17,028
Total Private Only 12,788 12,847 15,684
Manufacturing 4,318 4,385 6,588
Retail Trade 1,910 1,988 1,905
Health Care & Social Assistance 1,316 1,483 1,707
Government 1,659 1,571 1,344
Accommodation & Food Services 1,034 908 912
Management of Companies & Enterprises 579 587 697
Wholesale Trade 475 424 535
Administrative Support & Waste Management 348 348 524
Transportation & Warehousing 456 450 472
Construction 492 443 422
Other Services 362 405 419
Professional & Technical Services 395 420 402
Finance & Insurance 349 180 363
Arts, Entertainment, & Recreation 217 237 285
Information 136 252 128
Educational Services 95 119 108
Real Estate & Rental & Leasing 129 67 82
Agriculture, Forestry, Fishing & Hunting 53 34 71
Utilities * * *
Mining 0 0 0
Where North Kingstown Residents Work, 2013
w North Kingstown’s total population grew by 10.7percent during the 1990’s, with the addition of2,540 people, however, between 2000 and 2016,North Kingstown lost 94 (-0.4%) residents.
w Fifty-nine percent of North Kingstown residents25 years and older had a college degree(Associate or higher) in 2016. The share of localresidents without a high school diploma or GEDdecreased between 2000 and 2016, falling from8.5 percent to 4.6 percent.
w Between 2009 and 2017, employment in NorthKingstown increased by 2,610 (+18.1%) jobs.Private sector employers reported a gain of2,837 (+22.1%) jobs, while public sectoremployment declined by 227 (-14.4%) jobs. Incomparison, statewide total employment grewby 28,830 (+6.4%) jobs.
w North Kingstown’s unemployment rate averaged3.5 percent in 2017, the 6th lowest in the stateand below the state average of 4.5 percent.
w In 2016, 99.6 percent of North Kingstownresidents age 18-64 spoke only English or spokeanother language and English either well orvery well, compared to 95.1 percent of RIresidents.
w Over one-quarter (27.6%) of North Kingstownresidents work in North Kingstown, while 7.1percent work outside of RI.
Language
Population Age 18-64
Population 1990 2000 2016
Total Population 23,786 26,326 26,232
Male 11,604 12,750 12,812
Female 12,182 13,576 13,420
16 years + 18,283 20,200 21,336
21 years + 16,793 18,765 19,718
65 years + 2,831 3,105 4,375
White 23,045 25,196 24,115
Black/African American 310 256 371
American Indian & Alaskan Native 106 145 209
Asian & Pacific Islander 236 260 736
Some other race 89 139 311
Two or more races - 330 490
Hispanic or Latino (of any race) 253 465 655
Educational Attainment 1990 2000 2016
Population (Age 25+) 15,811 17,833 18,294
Less than 9th grade 4.1% 2.0% 1.2%
9th-12th, no diploma 9.7% 6.5% 3.4%
High School Graduate / GED 28.5% 23.3% 19.4%
Some College, no degree 19.1% 19.5% 16.9%
Associate Degree 7.8% 8.4% 8.9%
Bachelor Degree 19.2% 26.4% 28.6%
Graduate/Professional Degree 11.6% 14.0% 21.5%
1990 2000 2016
Median Household Income $40,419 $60,027 $84,726
Annual Average Labor Force Estimates 2006 2009 2017
Labor Force 15,641 15,439 14,561
Employment 15,023 14,072 14,045
Unemployment 618 1,367 516
Unemployment Rate 4.0% 8.9% 3.5%
2016
Percent of Population that Speak Only English or
Another Language & English either 'well' or 'very well' 99.6%
Percent of Population that Speak English 'not well'
or 'not at all' 0.4%
Language Spoken:
Speak Spanish 0.0%
Speak Other Indo-European 0.1%
Speak Asian/Pacific Islander 0.2%
Speak Other Languages 0.0%

Hometown
13.7%
Elsewhere
0.1%
Other RI Town
74.3%
Massachusetts11.8%
Connecticut
0.1%
North Providence
Establishment Employment 2006 2009 2017
Total Private & Government 8,492 7,353 6,889
Total Private Only 7,588 6,476 6,018
Health Care & Social Assistance 2,851 2,591 2,132
Retail Trade 1,184 966 954
Government 904 878 871
Accommodation & Food Services 812 693 755
Administrative Support & Waste Management 484 448 641
Other Services 337 322 334
Manufacturing 510 366 218
Construction 299 257 207
Professional & Technical Services 209 165 183
Transportation & Warehousing 96 93 145
Real Estate & Rental & Leasing 122 111 125
Finance & Insurance 394 168 123
Wholesale Trade 132 191 94
Arts, Entertainment, & Recreation 98 51 54
Management of Companies & Enterprises * * 27
Educational Services 12 4 13
Information 31 31 12
Mining 0 0 *
Utilities * 0 0
Agriculture, Forestry, Fishing & Hunting 0 0 0
Where North Providence Residents Work, 2013
w North Providence’s total population grew by 1.0percent during the 1990’s, adding 321 residents,however, between 2000 and 2016, NorthProvidence lost 78 (-0.2%) residents.
w Over 38 percent of North Providence residents25 years and older had a college degree(Associate or higher) in 2016. The share of localresidents without a high school diploma or GEDdecreased between 2000 and 2016, falling from22.7 percent to 10.6 percent.
w Between 2009 and 2017, employment in NorthProvidence declined by 464 (-6.3%) jobs.Private sector employers reported a loss of 458(-7.1%) jobs, while public sector employmentdeclined by 7 (-0.8%) jobs. In comparison,statewide total employment grew by 28,830(+6.4%) jobs.
w North Providence’s unemployment rateaveraged 4.4 percent in 2017, tied for the 12thhighest in the state and below the state averageof 4.5 percent.
w In 2016, 97.6 percent of North Providenceresidents age 18-64 spoke only English or spokeanother language and English either well or verywell, compared to 95.1 percent of RI residents.
w Nearly one in seven (13.7%) North Providenceresidents work in North Providence, while 12.0percent work outside of RI.
Language
Population Age 18-64
Population 1990 2000 2016
Total Population 32,090 32,411 32,333
Male 14,946 15,117 15,001
Female 17,144 17,294 17,332
16 years + 27,166 27,192 27,473
21 years + 25,244 25,557 26,126
65 years + 6,015 6,395 6,326
White 31,152 29,812 27,321
Black/African American 334 859 2,144
American Indian & Alaskan Native 33 55 116
Asian & Pacific Islander 378 605 1,241
Some other race 193 511 760
Two or more races - 569 751
Hispanic or Latino (of any race) 571 1,247 3,199
Educational Attainment 1990 2000 2016
Population (Age 25+) 23,079 24,057 24,745
Less than 9th grade 10.2% 5.6% 4.0%
9th-12th, no dip loma 19.0% 17.1% 6.6%
High School Graduate / GED 29.8% 30.5% 31.4%
Some College, no degree 13.8% 19.2% 19.7%
Associate Degree 6.8% 6.4% 9.1%
Bachelor Degree 13.1% 13.5% 18.9%
Graduate/Professional Degree 7.3% 7.7% 10.2%
1990 2000 2016
Median Household Income $32,321 $39,721 $52,547
Annual Average Labor Force Estimates 2006 2009 2017
Labor Force 18,804 18,654 18,038
Employment 17,893 16,683 17,245
Unemployment 911 1,971 793
Unemployment Rate 4.8% 10.6% 4.4%
2016
Percent of Population that Speak Only English or
Another Language & English either 'well' or 'very well' 97.6%
Percent of Population that Speak English 'not well'
or 'not at all' 2.4%
Language Spoken:
Speak Spanish 1.7%
Speak Other Indo-European 0.3%
Speak Asian/Pacific Islander 0.2%
Speak Other Languages 0.2%

Hometown
15.8%
Elsewhere
0.0%
Other RI Town
63.7%
Massachusetts
19.8%
Connecticut
0.7%
North Smithfield
Establishment Employment 2006 2009 2017
Total Private & Government 4,098 3,664 4,963
Total Private Only 3,675 3,285 4,615
Retail Trade 622 677 1,144
Health Care & Social Assistance 814 781 742
Accommodation & Food Services 446 400 584
Manufacturing 631 436 530
Transportation & Warehousing 135 70 359
Government 422 379 348
Professional & Technical Services 248 248 259
Construction 273 183 215
Other Services 116 145 195
Administrative Support & Waste Management 46 57 194
Wholesale Trade 165 132 169
Arts, Entertainment, & Recreation 15 36 81
Finance & Insurance 68 38 53
Real Estate & Rental & Leasing 22 24 22
Information 20 10 11
Educational Services 7 6 3
Agriculture, Forestry, Fishing & Hunting * * *
Mining * * *
Management of Companies & Enterprises 0 * *
Utilities 0 0 0
Where North Smithfield Residents Work, 2013
w North Smithfield’s total population grew by 1.2
percent during the 1990’s, adding 121 people.
Between 2000 and 2016, North Smithfield
gained another 1,609 (+15.2%) residents.
w Over 40 percent of North Smithfield residents
25 years and older had a college degree
(Associate or higher) in 2016. The share of local
residents without a high school diploma or GED
decreased between 2000 and 2016, falling from
17.8 percent to 8.2 percent.
w Between 2009 and 2017, employment in North
Smithfield grew by 1,299 (+35.5%) jobs. Private
sector employers reported a gain of 1,330
(+40.5%) jobs, while public sector employment
declined by 31 (-8.2%) jobs. In comparison,
statewide total employment grew by 28,830
(+6.4%) jobs.
w North Smithfield’s unemployment rate averaged
3.6 percent in 2017, the tied for the 7th lowest in
RI and below the state average of 4.5 percent.
w In 2016, 99.9 percent of North Smithfield
residents age 18-64 spoke only English or spoke
another language and English either well or
very well, compared to 95.1 percent of RI
residents.
w Over one of every six (15.8%) North Smithfield
residents work in North Smithfield, while 20.5
percent work outside of RI.
Language
Population Age 18-64
Population 1990 2000 2016
Total Population 10,497 10,618 12,227
Male 5,033 5,042 5,693
Female 5,464 5,576 6,534
16 years + 8,489 8,528 10,259
21 years + 7,773 7,944 9,728
65 years + 1,851 1,912 2,604
White 10,397 10,440 11,812
Black/African American 17 45 236
American Indian & Alaskan Native 5 22 5
Asian & Pacific Islander 69 55 73
Some other race 9 8 11
Two or more races - 48 90
Hispanic or Latino (of any race) 56 50 467
Educational Attainment 1990 2000 2016
Population (Age 25+) 7,314 7,676 9,154
Less than 9th grade 12.7% 6.4% 3.5%
9th-12th, no diploma 15.8% 11.4% 4.7%
High School Graduate / GED 28.2% 27.0% 31.5%
Some College, no degree 14.2% 19.4% 19.5%
Associate Degree 8.3% 9.8% 10.8%
Bachelor Degree 13.2% 16.8% 19.4%
Graduate/Professional Degree 7.6% 9.1% 10.6%
1990 2000 2016
Median Household Income $41,449 $58,602 $81,227
Annual Average Labor Force Estimates 2006 2009 2017
Labor Force 6,443 6,598 6,857
Employment 6,165 5,925 6,609
Unemployment 278 673 248
Unemployment Rate 4.3% 10.2% 3.6%
2016
Percent of Population that Speak Only English or
Another Language & English either 'well' or 'very well' 99.9%
Percent of Population that Speak English 'not well'
or 'not at all' 0.1%
Language Spoken:
Speak Spanish 0.0%
Speak Other Indo-European 0.1%
Speak Asian/Pacific Islander 0.0%
Speak Other Languages 0.0%

Hometown
23.0%Elsewhere
0.7%
Other RI Town
48.8%
Massachusetts
27.2%
Connecticut
0.3%
Pawtucket
Establishment Employment 2006 2009 2017
Total Private & Government 26,679 24,100 22,857
Total Private Only 24,310 21,932 20,810
Health Care & Social Assistance 5,553 5,671 4,326
Manufacturing 5,517 4,157 3,642
Administrative Support & Waste Management 1,924 1,720 2,294
Government 2,369 2,167 2,047
Accommodation & Food Services 1,643 1,518 1,721
Retail Trade 1,994 1,664 1,492
Other Services 1,387 1,337 1,208
Construction 1,232 810 1,125
Professional & Technical Services 596 641 757
Wholesale Trade 530 420 593
Finance & Insurance 829 916 585
Transportation & Warehousing 390 473 564
Arts, Entertainment, & Recreation 362 311 430
Educational Services 354 376 386
Real Estate & Rental & Leasing 283 233 183
Utilities 10 36 76
Information 379 160 65
Management of Companies & Enterprises 1,327 * *
Agriculture, Forestry, Fishing & Hunting 0 0 0
Mining 0 0 0
Where Pawtucket Residents Work, 2013
w Pawtucket’s total population grew by 0.4
percent during the 1990’s, with the addition of
314 people, however, between 2000 and 2016,
Pawtucket lost 1,569 (-2.2%) residents.
w Over 27 percent of Pawtucket residents 25
years and older had a college degree (Associate
or higher) in 2016. The share of local residents
without a high school diploma or GED
decreased between 2000 and 2016, falling from
33.8 percent to 20.2 percent.
w Between 2009 and 2017, employment in
Pawtucket declined by 1,243 (-5.2%) jobs.
Private sector employers reported a loss of
1,122 (-5.1%) jobs, while public sector
employment declined by 120 (-5.6%) jobs. In
comparison, statewide total employment grew
by 28,830 (+6.4%) jobs.
w Pawtucket’s unemployment rate averaged 5.1
percent in 2017, tied for the 5th highest in RI
and above the state average of 4.5 percent.
w In 2016, 91.1 percent of Pawtucket residents
age 18-64 spoke only English or spoke another
language and English either well or very well,
compared to 95.1 percent of RI residents.
w Over one-fifth (23.0%) of Pawtucket residents
work in Pawtucket, while 28.2 percent work
outside of RI.
Language
Population Age 18-64
Population 1990 2000 2016
Total Population 72,644 72,958 71,389
Male 34,167 34,600 35,778
Female 38,477 38,358 35,611
16 years + 57,701 56,657 56,903
21 years + 52,989 52,088 52,609
65 years + 11,854 10,828 8,608
White 64,836 55,004 45,163
Black/African American 2,608 5,334 13,509
American Indian & Alaskan Native 203 217 350
Asian & Pacific Islander 472 663 1,249
Some other race 4,525 7,841 7,652
Two or more races - 3,899 3,466
Hispanic or Latino (of any race) 5,211 10,141 16,183
Educational Attainment 1990 2000 2016
Population (Age 25+) 48,604 48,132 48,393
Less than 9th grade 16.6% 13.0% 10.2%
9th-12th, no dip loma 21.8% 20.8% 10.0%
High School Graduate / GED 30.2% 30.0% 32.8%
Some College, no degree 13.0% 15.3% 19.9%
Associate Degree 5.3% 6.7% 8.1%
Bachelor Degree 9.0% 8.8% 12.2%
Graduate/Professional Degree 4.1% 5.5% 6.8%
1990 2000 2016
Median Household Income $26,541 $31,775 $44,120
Annual Average Labor Force Estimates 2006 2009 2017
Labor Force 37,556 37,663 36,299
Employment 35,350 32,737 34,431
Unemployment 2,206 4,926 1,868
Unemployment Rate 5.9% 13.1% 5.1%
2016
Percent of Population that Speak Only English or
Another Language & English either 'well' or 'very well' 91.1%
Percent of Population that Speak English 'not well'
or 'not at all' 8.9%
Language Spoken:
Speak Spanish 5.3%
Speak Other Indo-European 3.2%
Speak Asian/Pacific Islander 0.3%
Speak Other Languages 0.2%

Hometown
23.0%Elsewhere
0.8%
Other RI Town
65.3%Massachusetts
10.5%
Connecticut
0.4%
Portsmouth
Establishment Employment 2006 2009 2017
Total Private & Government 6,120 5,928 5,887
Total Private Only 5,526 5,194 5,193
Manufacturing 2,371 1,971 1,365
Health Care & Social Assistance 422 476 878
Government 594 732 694
Retail Trade 527 515 545
Accommodation & Food Services 471 449 471
Construction 381 311 358
Educational Services 235 269 291
Administrative Support & Waste Management 122 230 281
Other Services 217 183 199
Finance & Insurance 89 89 155
Professional & Technical Services 142 148 145
Real Estate & Rental & Leasing 110 118 121
Arts, Entertainment, & Recreation 119 103 97
Wholesale Trade 116 111 92
Transportation & Warehousing 63 74 87
Information 88 65 51
Agriculture, Forestry, Fishing & Hunting 46 48 46
Management of Companies & Enterprises 4 * *
Utilities * * *
Mining 0 0 0
Where Portsmouth Residents Work, 2013
w Portsmouth’s population grew by 1.7 percentduring the 1990’s, with the addition of 292people. Between 2000 and 2016, Portsmouth
added another 202 (+1.2%) residents.
w Nearly 56 percent of Portsmouth residents 25years and older had a college degree (Associateor higher) in 2016. The share of local residents
without a high school diploma or GEDdecreased between 2000 and 2016, falling from9.1 percent to 6.5 percent.
w Between 2009 and 2017, employment in
Portsmouth declined by 41 (-0.7%) jobs. Privatesector employers reported a loss of 1 (0.0%)job, while public sector employment fell by 38(-5.2%) jobs. In comparison, statewide totalemployment grew by 28,830 (+6.4%) jobs.
w Portsmouth’s unemployment rate averaged 4.0percent in 2017, tied for the 17th lowest in thestate and below the state average of 4.5percent.
w In 2016, 99.8 percent of Portsmouth residentsage 18-64 spoke only English or spoke anotherlanguage and English either well or very well,compared to 95.1 percent of RI residents.
w Over one-fifth (23.0%) of Portsmouth residentswork in Portsmouth, while 11.7 percent workoutside of RI.
Language
Population Age 18-64
Population 1990 2000 2016
Total Population 16,857 17,149 17,351
Male 8,384 8,421 8,673
Female 8,473 8,728 8,678
16 years + 13,179 13,327 14,355
21 years + 12,141 12,423 13,168
65 years + 2,012 2,307 3,635
White 16,456 16,432 16,507
Black/African American 151 201 183
American Indian & Alaskan Native 41 33 0
Asian & Pacific Islander 178 240 321
Some other race 31 63 4
Two or more races - 180 336
Hispanic or Latino (of any race) 175 249 587
Educational Attainment 1990 2000 2016
Population (Age 25+) 11,389 12,040 12,541
Less than 9th grade 5.9% 3.4% 2.1%
9th-12th, no diploma 7.8% 5.7% 4.4%
High School Graduate / GED 28.1% 23.6% 21.3%
Some College, no degree 17.0% 17.7% 16.5%
Associate Degree 6.5% 6.7% 7.5%
Bachelor Degree 21.4% 25.9% 28.7%
Graduate/Professional Degree 13.2% 17.0% 19.6%
1990 2000 2016
Median Household Income $42,474 $58,835 $86,051
Annual Average Labor Force Estimates 2006 2009 2017
Labor Force 9,403 9,244 8,815
Employment 9,027 8,423 8,464
Unemployment 376 821 351
Unemployment Rate 4.0% 8.9% 4.0%
2016
Percent of Population that Speak Only English or
Another Language & English either 'well' or 'very well' 99.8%
Percent of Population that Speak English 'not well'
or 'not at all' 0.2%
Language Spoken:
Speak Spanish 0.2%
Speak Other Indo-European 0.0%
Speak Asian/Pacific Islander 0.0%
Speak Other Languages 0.0%

Hometown
52.5% Elsewhere
1.0%
Other RI Town
35.3%Massachusetts
10.5%
Connecticut
0.7%
Providence
Establishment Employment 2006 2009 2017
Total Private & Government 113,104 106,799 112,550
Total Private Only 97,598 91,894 97,659
Health Care & Social Assistance 24,026 24,940 27,212
Government 15,506 14,906 14,891
Educational Services 10,931 11,588 11,532
Accommodation & Food Services 8,421 8,009 9,869
Administrative Support & Waste Management 8,339 6,863 7,513
Retail Trade 7,175 6,446 6,918
Professional & Technical Services 6,310 6,299 6,786
Finance & Insurance 5,643 5,190 5,822
Other Services 4,471 4,455 4,135
Manufacturing 6,625 4,716 3,667
Management of Companies & Enterprises 1,975 1,776 3,163
Wholesale Trade 2,413 2,315 2,864
Construction 3,177 2,229 2,361
Information 4,118 3,546 1,810
Real Estate & Rental & Leasing 1,561 1,429 1,657
Arts, Entertainment, & Recreation 1,094 918 1,025
Transportation & Warehousing 792 632 773
Utilities 521 533 535
Agriculture, Forestry, Fishing & Hunting * * *
Mining * 0 0
Where Providence Residents Work, 2013
w Providence’s population grew by 8.0 percent
during the 1990’s, with the addition of 12,890
people. Between 2000 and 2016, Providence
added another 5,233 (+3.0%) residents.
w Nearly 35 percent of Providence residents 25
years and older had a college degree (Associate or
higher) in 2016. The share of local residents
without a high school diploma or GED decreased
between 2000 and 2016, falling from 34.2 percent
to 23.8 percent.
w Between 2009 and 2017, employment in
Providence increased by 5,751 (+5.4%) jobs.
Private sector employers reported a gain of 5,765
(+6.3%) jobs, while public sector employment
declined by 15 (-0.1%) jobs. In comparison,
statewide total employment grew by 28,830
(+6.4%) jobs.
w Providence’s unemployment rate averaged 5.4
percent in 2017, the 4th highest rate in RI and
well above the state average of 4.5 percent.
w In 2016, 85.9 percent of Providence residents age
18-64 spoke only English or spoke another
language and English either well or very well,
compared to 95.1 percent of RI residents.
w Over one-half (52.5%) of Providence residents
work in Providence, while 12.2 percent work
outside of RI.
Language
Population Age 18-64
Population 1990 2000 2016
Total Population 160,728 173,618 178,851
Male 76,439 83,035 86,510
Female 84,289 90,583 92,341
16 years + 126,088 133,072 143,253
21 years + 108,054 111,493 121,457
65 years + 21,802 18,155 16,293
White 112,404 94,666 91,473
Black/African American 23,828 25,243 28,417
American Indian & Alaskan Native 1,495 1,975 2,338
Asian & Pacific Islander 9,547 10,702 11,845
Some other race 13,454 30,477 37,376
Two or more races - 10,555 7,402
Hispanic or Latino (of any race) 24,982 52,146 74,612
Educational Attainment 1990 2000 2016
Population (Age 25+) 93,957 96,154 105,264
Less than 9th grade 16.4% 15.2% 13.0%
9th-12th, no dip loma 20.8% 19.0% 10.8%
High School Graduate / GED 25.0% 23.1% 25.3%
Some College, no degree 11.8% 13.7% 16.2%
Associate Degree 4.3% 4.7% 5.3%
Bachelor Degree 12.0% 13.1% 15.5%
Graduate/Professional Degree 9.6% 11.3% 13.9%
1990 2000 2016
Median Household Income $22,147 $26,867 $37,366
Annual Average Labor Force Estimates 2006 2009 2017
Labor Force 79,668 79,216 86,438
Employment 74,751 68,887 81,785
Unemployment 4,917 10,329 4,653
Unemployment Rate 6.2% 13.0% 5.4%
2016
Percent of Population that Speak Only English or
Another Language & English either 'well' or 'very well' 85.9%
Percent of Population that Speak English 'not well'
or 'not at all' 14.1%
Language Spoken:
Speak Spanish 12.2%
Speak Other Indo-European 0.6%
Speak Asian/Pacific Islander 1.2%
Speak Other Languages 0.1%

Hometown
23.2%
Elsewhere
0.7%
Other RI Town
66.4%
Massachusetts
3.1%
Connecticut6.6%
Richmond
Establishment Employment 2006 2009 2017
Total Private & Government 1,890 1,810 2,040
Total Private Only 1,236 1,129 1,379
Government 654 681 661
Retail Trade 346 309 302
Accommodation & Food Services 239 197 247
Arts, Entertainment, & Recreation 55 121 114
Construction 82 83 105
Professional & Technical Services 28 43 89
Administrative Support & Waste Management 55 53 63
Health Care & Social Assistance 81 76 62
Agriculture, Forestry, Fishing & Hunting 43 22 51
Finance & Insurance 47 43 39
Other Services 51 48 28
Wholesale Trade 50 32 *
Educational Services * 5 *
Manufacturing 110 * *
Information 5 * *
Mining * * *
Transportation & Warehousing * * *
Real Estate & Rental & Leasing * * 0
Utilities 0 0 0
Management of Companies & Enterprises 0 0 0
Where Richmond Residents Work, 2013
w Richmond’s total population grew by 35.0
percent during the 1990’s, with the addition of
1,871 people. Between 2000 and 2016,
Richmond gained another 396 (+5.5%)
residents.
w Over 49 percent of Richmond residents 25 years
and older had a college degree (Associate or
higher) in 2016. The share of local residents
without a high school diploma or GED
decreased between 2000 and 2016, falling from
12.7 percent to 7.0 percent.
w Between 2009 and 2017, employment in
Richmond increased by 230 (+12.7%) jobs.
Private sector employers reported a gain of 250
(+22.1%) jobs, while public sector employment
decreased by 20 (-2.9%) jobs. In comparison,
statewide total employment grew by 28,830
(+6.4%) jobs.
w Richmond’s unemployment rate averaged 3.1
percent in 2017, the 4th lowest in the state and
well below the state average of 4.5 percent.
w In 2016, 100.0 percent of Richmond residents
age 18-64 spoke only English or spoke another
language and English either well or very well,
compared to 95.1 percent of RI residents.
w Nearly one-quarter (23.2%) Richmond residents
work in Richmond, while 10.4 percent work
outside of RI.
Language
Population Age 18-64
Population 1990 2000 2016
Total Population 5,351 7,222 7,618
Male 2,719 3,623 3,714
Female 2,632 3,599 3,904
16 years + 3,950 5,396 6,176
21 years + 3,585 5,001 5,576
65 years + 397 509 965
White 5,223 7,003 7,250
Black/African American 23 29 172
American Indian & Alaskan Native 46 66 0
Asian & Pacific Islander 34 32 121
Some other race 25 14 15
Two or more races - 78 60
Hispanic or Latino (of any race) 48 89 108
Educational Attainment 1990 2000 2016
Population (Age 25+) 3,371 4,751 5,275
Less than 9th grade 5.1% 3.6% 2.1%
9th-12th, no diploma 14.0% 9.1% 4.9%
High School Graduate / GED 30.3% 29.7% 26.8%
Some College, no degree 19.5% 22.9% 16.9%
Associate Degree 7.1% 7.8% 11.4%
Bachelor Degree 17.2% 16.1% 25.5%
Graduate/Professional Degree 6.9% 10.7% 12.5%
1990 2000 2016
Median Household Income $40,975 $59,840 $95,026
Annual Average Labor Force Estimates 2006 2009 2017
Labor Force 4,458 4,336 4,236
Employment 4,309 3,999 4,103
Unemployment 149 337 133
Unemployment Rate 3.3% 7.8% 3.1%
2016
Percent of Population that Speak Only English or
Another Language & English either 'well' or 'very well' 100.0%
Percent of Population that Speak English 'not well'
or 'not at all' 0.0%
Language Spoken:
Speak Spanish 0.0%
Speak Other Indo-European 0.0%
Speak Asian/Pacific Islander 0.0%
Speak Other Languages 0.0%

Hometown
12.4%
Elsewhere
0.0%
Other RI Town
80.8%
Massachusetts4.2%
Connecticut
2.6%
Scituate
Establishment Employment 2006 2009 2017
Total Private & Government 1,612 1,500 1,699
Total Private Only 997 849 1,108
Government 614 651 591
Construction 174 117 211
Retail Trade 217 182 202
Accommodation & Food Services 98 109 174
Health Care & Social Assistance 94 78 107
Professional & Technical Services 70 73 87
Other Services 77 70 67
Agriculture, Forestry, Fishing & Hunting 48 45 64
Transportation & Warehousing 47 41 48
Administrative Support & Waste Management 45 34 44
Information 28 23 27
Wholesale Trade 27 15 22
Manufacturing 27 27 20
Real Estate & Rental & Leasing 14 11 14
Finance & Insurance 16 13 11
Arts, Entertainment, & Recreation 14 12 *
Educational Services * * *
Management of Companies & Enterprises * 0 0
Mining 0 0 0
Utilities 0 0 0
Where Scituate Residents Work, 2013
w Scituate’s total population grew by 5.4 percent
during the 1990’s, with the addition of 528
people. Between 2000 and 2016, Scituate gained
another 157 (+1.5%) residents.
w Over 48 percent of Scituate residents 25 years
and older had a college degree (Associate or
higher) in 2016. The share of local residents
without a high school diploma or GED decreased
between 2000 and 2016, falling from 12.8 percent
to 5.9 percent.
w Between 2009 and 2017, employment in Scituate
increased by 199 (+13.2%) jobs. Private sector
employers reported a gain of 259 (+30.4%) jobs,
while public sector employment decreased by 60
(-9.3%) jobs. In comparison, statewide total
employment grew by 28,830 (+6.4%) jobs.
w Scituate’s unemployment rate averaged 4.3
percent in 2017, tied for the 14th highest in the
state and below the state average of 4.5 percent.
w In 2016, 100.0 percent of Scituate residents age
18-64 spoke only English or spoke another
language and English either well or very well,
compared to 95.1 percent of RI residents.
w Over one in eight (12.4%) Scituate residents work
in Scituate, while 6.8 percent work outside of RI.
Language
Population Age 18-64
Population 1990 2000 2016
Total Population 9,796 10,324 10,481
Male 4,857 5,066 5,410
Female 4,939 5,258 5,071
16 years + 7,716 8,018 8,771
21 years + 6,987 7,380 8,307
65 years + 1,131 1,241 1,953
White 9,719 10,131 10,250
Black/African American 15 30 12
American Indian & Alaskan Native 2 7 43
Asian & Pacific Islander 47 63 31
Some other race 13 33 0
Two or more races - 60 145
Hispanic or Latino (of any race) 53 77 54
Educational Attainment 1990 2000 2016
Population (Age 25+) 6,521 7,075 7,793
Less than 9th grade 3.8% 3.5% 1.6%
9th-12th, no dip loma 12.4% 9.3% 4.3%
High School Graduate / GED 31.6% 27.7% 29.8%
Some College, no degree 17.9% 19.2% 16.1%
Associate Degree 7.0% 9.5% 11.5%
Bachelor Degree 18.1% 19.7% 22.1%
Graduate/Professional Degree 9.2% 11.2% 14.7%
1990 2000 2016
Median Household Income $45,170 $60,788 $81,975
Annual Average Labor Force Estimates 2006 2009 2017
Labor Force 6,528 6,521 6,175
Employment 6,216 5,806 5,908
Unemployment 312 715 267
Unemployment Rate 4.8% 11.0% 4.3%
2016
Percent of Population that Speak Only English or
Another Language & English either 'well' or 'very well' 100.0%
Percent of Population that Speak English 'not well'
or 'not at all' 0.0%
Language Spoken:
Speak Spanish 0.0%
Speak Other Indo-European 0.0%
Speak Asian/Pacific Islander 0.0%
Speak Other Languages 0.0%

Hometown
23.3%Elsewhere
0.6%
Other RI Town
63.2%
Massachusetts
12.2%
Connecticut
0.7%
Smithfield
Establishment Employment 2006 2009 2017
Total Private & Government 12,871 13,084 14,885
Total Private Only 12,253 12,480 14,283
Finance & Insurance 2,193 2,313 3,248
Retail Trade 2,263 2,224 1,957
Health Care & Social Assistance 1,280 1,537 1,610
Accommodation & Food Services 1,181 1,203 1,428
Manufacturing 1,271 1,265 1,327
Construction 1,106 910 997
Wholesale Trade 808 754 677
Other Services 369 333 624
Government 618 603 602
Administrative Support & Waste Management 331 347 580
Professional & Technical Services 198 279 383
Information 185 242 169
Transportation & Warehousing 95 76 122
Real Estate & Rental & Leasing 78 64 110
Management of Companies & Enterprises 101 76 76
Arts, Entertainment, & Recreation 47 46 73
Agriculture, Forestry, Fishing & Hunting 6 8 9
Educational Services 733 * *
Mining * * *
Utilities 0 0 0
Where Smithfield Residents Work, 2013
w Smithfield’s total population grew by 7.6 percent
during the 1990’s, with the addition of 1,450
people. Between 2000 and 2016, Smithfield
gained another 948 (+4.6%) residents.
w Over 44 percent (44.3%) of Smithfield residents
25 years and older had a college degree
(Associate or higher) in 2016. The share of local
residents without a high school diploma or GED
decreased between 2000 and 2016, falling from
14.6 percent to 7.5 percent.
w Between 2009 and 2017, employment in
Smithfield increased by 1,801 (+13.8%) jobs.
Private sector employers reported a gain of
1,803 (+14.4%) jobs, while public sector
employment declined by 1 (-0.2%) job. In
comparison, statewide total employment grew
by 28,830 (+6.4%) jobs.
w Smithfield’s unemployment rate averaged 4.0
percent in 2017, tied for 17th lowest in RI and
below the state average of 4.5 percent.
w In 2016, 99.3 percent of Smithfield residents age
18-64 spoke only English or spoke another
language and English either well or very well,
compared to 95.1 percent of RI residents.
w Nearly one-quarter (23.3%) of Smithfield
residents work in Smithfield, while 13.5 percent
work outside of RI.
Language
Population Age 18-64
Population 1990 2000 2016
Total Population 19,163 20,613 21,561
Male 9,280 10,043 10,146
Female 9,883 10,570 11,415
16 years + 15,673 17,084 18,646
21 years + 13,208 14,501 15,587
65 years + 2,498 3,429 4,113
White 18,886 20,066 20,217
Black/African American 105 165 329
American Indian & Alaskan Native 24 25 53
Asian & Pacific Islander 128 186 595
Some other race 20 26 63
Two or more races - 145 304
Hispanic or Latino (of any race) 113 191 444
Educational Attainment 1990 2000 2016
Population (Age 25+) 11,600 13,479 14,281
Less than 9th grade 6.9% 4.4% 2.5%
9th-12th, no diploma 12.3% 10.2% 5.0%
High School Graduate / GED 31.4% 27.6% 26.6%
Some College, no degree 17.2% 19.5% 21.6%
Associate Degree 7.0% 9.5% 9.3%
Bachelor Degree 16.7% 17.2% 20.7%
Graduate/Professional Degree 8.6% 11.6% 14.3%
1990 2000 2016
Median Household Income $42,523 $55,621 $76,014
Annual Average Labor Force Estimates 2006 2009 2017
Labor Force 12,171 11,914 11,417
Employment 11,635 10,683 10,960
Unemployment 536 1,231 457
Unemployment Rate 4.4% 10.3% 4.0%
2016
Percent of Population that Speak Only English or
Another Language & English either 'well' or 'very well' 99.3%
Percent of Population that Speak English 'not well'
or 'not at all' 0.7%
Language Spoken:
Speak Spanish 0.2%
Speak Other Indo-European 0.1%
Speak Asian/Pacific Islander 0.4%
Speak Other Languages 0.0%

Hometown41.6%
Elsewhere
1.7%
Other RI Town
50.9%
Massachusetts
3.2%
Connecticut
2.6%
South Kingstown
Establishment Employment 2006 2009 2017
Total Private & Government 13,765 13,330 13,932
Total Private Only 9,977 9,633 9,987
Government 3,788 3,696 3,945
Health Care & Social Assistance 2,351 2,524 2,892
Accommodation & Food Services 1,249 1,279 1,567
Retail Trade 1,484 1,330 1,237
Other Services 758 718 595
Manufacturing 956 739 530
Wholesale Trade 778 785 475
Professional & Technical Services 373 308 426
Construction 434 283 392
Administrative Support & Waste Management 248 246 365
Educational Services 251 270 329
Finance & Insurance 289 244 314
Real Estate & Rental & Leasing 102 289 221
Arts, Entertainment, & Recreation 212 224 213
Transportation & Warehousing 198 130 131
Information 145 149 129
Agriculture, Forestry, Fishing & Hunting 108 73 107
Management of Companies & Enterprises 13 24 38
Mining * * *
Utilities * * *
Where South Kingstown Residents Work, 2013
w South Kingstown’s total population grew by 13.4percent during the 1990’s, with the addition of3,290 people. Between 2000 and 2016, SouthKingstown added another 2,730 (+9.8%)residents.
w Nearly 57 percent of South Kingstown residents25 years and older had a college degree(Associate or higher) in 2016. The share of localresidents without a high school diploma or GEDdecreased between 2000 and 2016, falling from8.7 percent to 5.6 percent.
w Between 2009 and 2017, employment in SouthKingstown increased by 602 (+4.5%) jobs.Private sector employers reported a gain of 354(+3.7%) jobs, while public sector employmentgrew by 249 (+6.7%) jobs. In comparison,statewide total employment grew by 28,830(+6.4%) jobs.
w South Kingstown’s unemployment rate averaged3.9 percent in 2017, tied for the 13th lowest inthe state and below the state average of 4.5percent.
w In 2016, 99.8 percent of South Kingstownresidents age 18-64 spoke only English or spokeanother language and English either well orvery well, compared to 95.1 percent of RIresidents.
w Over 41 percent (41.6%) South Kingstownresidents work in South Kingstown, while 7.5percent work outside of RI.
Language
Population Age 18-64
Population 1990 2000 2016
Total Population 24,631 27,921 30,651
Male 11,790 13,268 14,618
Female 12,841 14,653 16,033
16 years + 20,383 22,335 26,491
21 years + 15,019 17,528 19,895
65 years + 2,800 3,248 5,402
White 23,000 25,440 27,801
Black/African American 362 437 779
American Indian & Alaskan Native 451 449 426
Asian & Pacific Islander 735 874 538
Some other race 83 203 388
Two or more races - 518 719
Hispanic or Latino (of any race) 306 493 1,545
Educational Attainment 1990 2000 2016
Population (Age 25+) 13,110 16,149 17,953
Less than 9th grade 4.6% 2.3% 1.2%
9th-12th, no dip loma 9.9% 6.4% 4.4%
High School Graduate / GED 23.8% 20.8% 20.8%
Some College, no degree 16.5% 17.6% 16.7%
Associate Degree 6.2% 6.0% 5.4%
Bachelor Degree 19.6% 26.9% 27.0%
Graduate/Professional Degree 19.4% 19.9% 24.5%
1990 2000 2016
Median Household Income $36,481 $56,325 $73,801
Annual Average Labor Force Estimates 2006 2009 2017
Labor Force 16,041 15,750 16,470
Employment 15,372 14,314 15,824
Unemployment 669 1,436 646
Unemployment Rate 4.2% 9.1% 3.9%
2016
Percent of Population that Speak Only English or
Another Language & English either 'well' or 'very well' 99.8%
Percent of Population that Speak English 'not well'
or 'not at all' 0.2%
Language Spoken:
Speak Spanish 0.1%
Speak Other Indo-European 0.1%
Speak Asian/Pacific Islander 0.0%
Speak Other Languages 0.0%

Hometown
18.0%
Elsewhere0.7%
Other RI Town
50.0%Massachusetts
31.0%
Connecticut
0.3%
Tiverton
Establishment Employment 2006 2009 2017
Total Private & Government 2,703 2,566 2,696
Total Private Only 2,221 2,018 2,232
Retail Trade 575 458 580
Government 482 547 464
Accommodation & Food Services 310 289 446
Health Care & Social Assistance 301 324 371
Construction 312 217 197
Other Services 125 121 122
Wholesale Trade 107 100 94
Manufacturing 69 57 77
Professional & Technical Services 134 138 66
Administrative Support & Waste Management 52 72 62
Transportation & Warehousing 53 * 58
Finance & Insurance 52 57 54
Utilities * * 26
Arts, Entertainment, & Recreation 27 30 26
Agriculture, Forestry, Fishing & Hunting 38 32 23
Educational Services * 5 22
Real Estate & Rental & Leasing 14 6 6
Information 3 23 *
Management of Companies & Enterprises * * *
Mining 33 * 0
Where Tiverton Residents Work, 2013
w Tiverton’s total population grew by 6.6 percent
during the 1990’s, with the addition of 948
people. Between 2000 and 2016, Tiverton gained
another 535 (+3.5%) residents.
w Forty-one percent of Tiverton residents 25 years
and older had a college degree (Associate or
higher) in 2016. The share of local residents
without a high school diploma or GED
decreased between 2000 and 2016, falling from
20.4 percent to 9.3 percent.
w Between 2009 and 2017, employment in
Tiverton increased by 130 (+5.1%) jobs. Private
sector employers reported a gain of 214
(+10.6%) jobs, while public sector employment
declined by 83 (-15.2%) jobs. In comparison,
statewide total employment grew by 28,830
(+6.4%) jobs.
w Tiverton’s unemployment rate averaged 4.6
percent in 2017, tied for the 10th highest in the
state and above the state average of 4.5
percent.
w In 2016, 99.6 percent of Tiverton residents age
18-64 spoke only English or spoke another
language and English either well or very well,
compared to 95.1 percent of RI residents.
w Over one in five (18.0%) Tiverton residents
work in Tiverton, while 32.0 percent work
outside of RI.
Language
Population Age 18-64
Population 1990 2000 2016
Total Population 14,312 15,260 15,795
Male 6,996 7,429 7,931
Female 7,316 7,831 7,864
16 years + 11,509 12,319 13,312
21 years + 10,560 11,454 12,680
65 years + 2,055 2,522 3,568
White 14,206 14,952 15,296
Black/African American 36 65 162
American Indian & Alaskan Native 20 26 0
Asian & Pacific Islander 46 64 71
Some other race 4 33 78
Two or more races - 120 188
Hispanic or Latino (of any race) 161 104 218
Educational Attainment 1990 2000 2016
Population (Age 25+) 9,825 10,952 12,126
Less than 9th grade 13.5% 8.5% 4.0%
9th-12th, no diploma 16.1% 11.9% 5.3%
High School Graduate / GED 30.5% 29.6% 32.0%
Some College, no degree 14.1% 18.7% 17.7%
Associate Degree 6.8% 7.2% 9.7%
Bachelor Degree 13.1% 14.7% 19.0%
Graduate/Professional Degree 6.0% 9.3% 12.3%
1990 2000 2016
Median Household Income $36,170 $49,977 $72,365
Annual Average Labor Force Estimates 2006 2009 2017
Labor Force 8,726 8,581 8,698
Employment 8,288 7,627 8,301
Unemployment 438 954 397
Unemployment Rate 5.0% 11.1% 4.6%
2016
Percent of Population that Speak Only English or
Another Language & English either 'well' or 'very well' 99.6%
Percent of Population that Speak English 'not well'
or 'not at all' 0.4%
Language Spoken:
Speak Spanish 0.0%
Speak Other Indo-European 0.4%
Speak Asian/Pacific Islander 0.0%
Speak Other Languages 0.0%

Hometown
19.8%Elsewhere
1.3%
Other RI Town58.6%
Massachusetts
20.3%
Connecticut
0.0%
Warren
Establishment Employment 2006 2009 2017
Total Private & Government 4,141 3,546 3,810
Total Private Only 3,967 3,379 3,645
Manufacturing 1,062 769 794
Accommodation & Food Services 613 474 639
Health Care & Social Assistance 624 572 520
Retail Trade 276 249 306
Professional & Technical Services 73 97 236
Other Services 130 143 198
Finance & Insurance 162 196 186
Government 174 167 165
Transportation & Warehousing 360 286 153
Administrative Support & Waste Management 137 158 151
Construction 219 131 140
Wholesale Trade 141 138 120
Educational Services 65 70 83
Arts, Entertainment, & Recreation 39 33 55
Real Estate & Rental & Leasing 17 18 29
Information 43 39 28
Agriculture, Forestry, Fishing & Hunting 2 * *
Management of Companies & Enterprises * * *
Mining 0 0 0
Utilities 0 0 0
Where Warren Residents Work, 2013
w Warren’s total population decreased by 0.2
percent during the 1990’s, with the loss of 25
people. Between 2000 and 2016, Warren lost
another 812 (-7.1%) residents.
w Over 41 percent of Warren residents 25 years
and older had a college degree (Associate or
higher) in 2016. The share of local residents
without a high school diploma or GED
decreased between 2000 and 2016, falling from
23.1 percent to 10.5 percent.
w Between 2009 and 2017, employment in Warren
increased by 264 (+7.4%) jobs. Private sector
employers reported a gain of 266 (+7.9%) jobs,
while public sector employment fell by 2 (-1.2%)
jobs. In comparison, statewide total employment
grew by 28,830 (+6.4%) jobs.
w Warren’s unemployment rate averaged 4.3
percent in 2017, tied for the 14th highest in the
state and below the state average of 4.5
percent.
w In 2016, 99.6 percent of Warren residents age
18-64 spoke only English or spoke another
language and English either well or very well,
compared to 95.1 percent of RI residents.
w Nearly one-fifth (19.8%) of Warren residents
work in Warren, while 21.6 percent work
outside of RI.
Language
Population Age 18-64
Population 1990 2000 2016
Total Population 11,385 11,360 10,548
Male 5,398 5,394 4,991
Female 5,987 5,966 5,557
16 years + 9,196 9,199 8,936
21 years + 8,534 8,551 8,450
65 years + 2,005 2,034 2,125
White 11,277 10,999 10,339
Black/African American 35 94 32
American Indian & Alaskan Native 11 26 0
Asian & Pacific Islander 45 61 49
Some other race 17 33 22
Two or more races - 147 106
Hispanic or Latino (of any race) 137 106 263
Educational Attainment 1990 2000 2016
Population (Age 25+) 7,933 8,029 7,913
Less than 9th grade 14.1% 10.0% 4.1%
9th-12th, no dip loma 16.6% 13.1% 6.4%
High School Graduate / GED 31.7% 29.3% 29.3%
Some College, no degree 16.4% 18.3% 19.0%
Associate Degree 6.0% 6.3% 10.0%
Bachelor Degree 11.1% 15.1% 18.9%
Graduate/Professional Degree 4.2% 7.7% 12.2%
1990 2000 2016
Median Household Income $31,637 $41,285 $51,909
Annual Average Labor Force Estimates 2006 2009 2017
Labor Force 6,371 6,238 5,672
Employment 6,046 5,530 5,426
Unemployment 325 708 246
Unemployment Rate 5.1% 11.3% 4.3%
2016
Percent of Population that Speak Only English or
Another Language & English either 'well' or 'very well' 99.6%
Percent of Population that Speak English 'not well'
or 'not at all' 0.4%
Language Spoken:
Speak Spanish 0.0%
Speak Other Indo-European 0.0%
Speak Asian/Pacific Islander 0.4%
Speak Other Languages 0.0%

Hometown
35.0%Elsewhere
0.5%
Other RI Town
57.2%Massachusetts
6.0%
Connecticut1.3%
Warwick
Establishment Employment 2006 2009 2017
Total Private & Government 53,070 47,810 48,006
Total Private Only 48,798 43,742 44,131
Health Care & Social Assistance 8,460 8,517 8,461
Retail Trade 8,835 7,808 7,540
Accommodation & Food Services 5,204 5,147 5,514
Government 4,272 4,070 3,875
Manufacturing 3,860 3,370 2,798
Finance & Insurance 3,866 2,989 2,709
Administrative Support & Waste Management 2,493 1,950 2,653
Transportation & Warehousing 2,264 2,020 2,297
Construction 2,475 1,964 2,178
Professional & Technical Services 1,985 1,885 2,080
Wholesale Trade 1,908 1,717 1,816
Other Services 1,722 1,661 1,718
Management of Companies & Enterprises 2,186 1,340 1,562
Real Estate & Rental & Leasing 1,499 1,246 1,159
Educational Services 867 1,018 614
Arts, Entertainment, & Recreation 578 502 598
Information 575 591 416
Agriculture, Forestry, Fishing & Hunting 10 17 *
Utilities * * 0
Mining * 0 0
Where Warwick Residents Work, 2013
w Warwick’s total population grew by 0.4 percent
during the 1990’s, with the addition of 381
people, however, between 2000 and 2016,
Warwick lost 3,927 (-4.6%) residents.
w Over 43 percent (43.6%) of Warwick residents
25 years and older had a college degree
(Associate or higher) in 2016. The share of local
residents without a high school diploma or GED
decreased between 2000 and 2016, falling from
15.0 percent to 8.6 percent.
w Between 2009 and 2017, employment in
Warwick increased by 196 (+0.4%) jobs.
Private sector employers reported a gain of 389
(+0.9%) jobs, while public sector employment
decreased by 195 (-4.8%) jobs. In comparison,
statewide total employment grew by 28,830
(+6.4%) jobs.
w Warwick’s unemployment rate averaged 3.9
percent in 2017, tied for the 13th lowest in RI
and below the state average of 4.5 percent.
w In 2016, 98.8 percent of Warwick residents age
18-64 spoke only English or spoke another
language and English either well or very well,
compared to 95.1 percent of RI residents.
w Over one-third (35.0%) of Warwick residents
work in Warwick, while 7.8 percent work
outside of RI.
Language
Population Age 18-64
Population 1990 2000 2016
Total Population 85,427 85,808 81,881
Male 40,562 40,835 39,228
Female 44,865 44,973 42,653
16 years + 69,079 69,281 68,984
21 years + 63,831 64,478 64,986
65 years + 14,343 14,558 15,703
White 83,695 81,695 74,990
Black/African American 673 996 1,163
American Indian & Alaskan Native 183 213 144
Asian & Pacific Islander 713 1,296 2,268
Some other race 163 506 1,592
Two or more races - 1,102 1,724
Hispanic or Latino (of any race) 845 1,372 4,073
Educational Attainment 1990 2000 2016
Population (Age 25+) 59,561 61,276 61,572
Less than 9th grade 6.0% 3.5% 2.6%
9th-12th, no diploma 16.1% 11.5% 6.0%
High School Graduate / GED 32.3% 32.1% 27.3%
Some College, no degree 16.9% 20.0% 20.5%
Associate Degree 7.3% 8.4% 11.1%
Bachelor Degree 14.2% 16.6% 20.8%
Graduate/Professional Degree 7.1% 7.9% 11.7%
1990 2000 2016
Median Household Income $35,786 $46,483 $66,602
Annual Average Labor Force Estimates 2006 2009 2017
Labor Force 49,222 48,426 46,040
Employment 46,961 43,522 44,263
Unemployment 2,261 4,904 1,777
Unemployment Rate 4.6% 10.1% 3.9%
2016
Percent of Population that Speak Only English or
Another Language & English either 'well' or 'very well' 98.8%
Percent of Population that Speak English 'not well'
or 'not at all' 1.2%
Language Spoken:
Speak Spanish 0.4%
Speak Other Indo-European 0.4%
Speak Asian/Pacific Islander 0.3%
Speak Other Languages 0.0%

Hometown
13.6%
Elsewhere
1.5%
Other RI Town
82.5% Massachusetts
1.5%Connecticut
0.9%
West Greenwich
Establishment Employment 2006 2009 2017
Total Private & Government 4,726 3,201 3,190
Total Private Only 4,283 2,805 2,815
Manufacturing 1,830 * 851
Professional & Technical Services 1,097 * 471
Government 443 396 374
Accommodation & Food Services 229 216 277
Wholesale Trade 258 248 266
Administrative Support & Waste Management 194 104 184
Health Care & Social Assistance 99 159 128
Retail Trade 58 56 110
Construction 205 123 108
Real Estate & Rental & Leasing 3 12 72
Arts, Entertainment, & Recreation 12 * 43
Other Services 25 24 24
Finance & Insurance 44 43 22
Information 11 14 14
Agriculture, Forestry, Fishing & Hunting * 4 *
Transportation & Warehousing 170 * *
Mining 0 * *
Management of Companies & Enterprises * * *
Educational Services * * *
Utilities 0 0 0
Where West Greenwich Residents Work, 2013
w West Greenwich’s total population grew by 45.6percent during the 1990’s, with the addition of1,593 people. Between 2000 and 2016, WestGreenwich gained another 1,027 (+20.2%)residents.
w Nearly half (49.9%) of West Greenwichresidents 25 years and older had a collegedegree (Associate or higher) in 2016. The shareof local residents without a high school diplomaor GED decreased between 2000 and 2016,falling from 8.4 percent to 3.2 percent.
w Between 2009 and 2017, employment in WestGreenwich declined by 11 (-0.3%) jobs. Privatesector employers reported a gain of 10 (+0.4%)jobs, while public sector employment declined by22 (-5.6%). In comparison, statewide totalemployment grew by 28,830 (+6.4%) jobs.
w West Greenwich’s unemployment rate averaged3.8 percent in 2017, tied for the 10th lowest inthe state and below the state average of 4.5percent.
w In 2016, 100.0 percent of West Greenwichresidents age 18-64 spoke only English or spokeanother language and English either well or verywell, compared to 95.1 percent of RI residents.
w Over one in seven (13.6%) West Greenwichresidents work in West Greenwich, while 3.9percent work outside of RI.
Language
Population Age 18-64
Population 1990 2000 2016
Total Population 3,492 5,085 6,112
Male 1,773 2,548 3,000
Female 1,719 2,537 3,112
16 years + 2,686 3,816 4,702
21 years + 2,425 3,479 4,358
65 years + 308 359 625
White 3,449 4,968 5,611
Black/African American 11 14 26
American Indian & Alaskan Native 6 12 13
Asian & Pacific Islander 21 29 314
Some other race 5 12 97
Two or more races - 50 51
Hispanic or Latino (of any race) 13 35 137
Educational Attainment 1990 2000 2016
Population (Age 25+) 2,277 3,341 4,128
Less than 9th grade 5.8% 2.4% 0.9%
9th-12th, no dip loma 13.5% 6.0% 2.3%
High School Graduate / GED 32.5% 27.4% 30.4%
Some College, no degree 18.9% 24.7% 16.6%
Associate Degree 8.0% 9.5% 10.1%
Bachelor Degree 15.5% 19.8% 20.8%
Graduate/Professional Degree 5.8% 10.1% 19.0%
1990 2000 2016
Median Household Income $41,250 $65,725 $86,650
Annual Average Labor Force Estimates 2006 2009 2017
Labor Force 3,906 3,886 3,200
Employment 3,761 3,512 3,080
Unemployment 145 374 120
Unemployment Rate 3.7% 9.6% 3.8%
2016
Percent of Population that Speak Only English or
Another Language & English either 'well' or 'very well' 100.0%
Percent of Population that Speak English 'not well'
or 'not at all' 0.0%
Language Spoken:
Speak Spanish 0.0%
Speak Other Indo-European 0.0%
Speak Asian/Pacific Islander 0.0%
Speak Other Languages 0.0%

Hometown
17.3%Elsewhere
0.6%
Other RI Town
75.8%Massachusetts
4.2%
Connecticut
2.1%
West Warwick
Establishment Employment 2006 2009 2017
Total Private & Government 9,436 8,040 7,742
Total Private Only 8,350 6,996 6,755
Manufacturing 1,795 1,356 1,251
Government 1,086 1,044 987
Retail Trade 1,170 944 942
Health Care & Social Assistance 774 756 900
Accommodation & Food Services 823 713 683
Information 878 * 666
Transportation & Warehousing 273 266 419
Construction 388 303 361
Wholesale Trade 366 279 312
Other Services 347 338 307
Professional & Technical Services 82 114 251
Administrative Support & Waste Management 167 118 235
Management of Companies & Enterprises * * 148
Finance & Insurance 1,009 779 118
Educational Services 41 35 78
Real Estate & Rental & Leasing 78 55 62
Arts, Entertainment, & Recreation 55 52 *
Agriculture, Forestry, Fishing & Hunting 0 0 *
Mining * * 0
Utilities 0 0 0
Where West Warwick Residents Work, 2013
w West Warwick’s total population grew by 1.1
percent during the 1990’s, with the addition of
313 people, however, between 2000 and 2016,
West Warwick lost 745 (-2.5%) residents.
w Over 32 percent of West Warwick residents 25
years and older had a college degree (Associate
or higher) in 2016. The share of local residents
without a high school diploma or GED
decreased between 2000 and 2016, falling from
23.9 percent to 12.3 percent.
w Between 2009 and 2017, employment in West
Warwick declined by 298 (-3.7%) jobs. Private
sector employers reported a loss of 241 (-3.4%)
jobs, while public sector employment decreased
by 57 (-5.5%) jobs. In comparison, statewide
total employment grew by 28,830 (+6.4%) jobs.
w West Warwick’s unemployment rate averaged
4.7 percent in 2017, tied for the 8th highest in RI
and above the state average of 4.5 percent.
w In 2016, 99.0 percent of West Warwick
residents age 18-64 spoke only English or spoke
another language and English either well or very
well, compared to 95.1 percent of RI residents.
w Nearly one in six (17.3%) West Warwick
residents work in West Warwick, while 6.9
percent work outside of RI.
Language
Population Age 18-64
Population 1990 2000 2016
Total Population 29,268 29,581 28,836
Male 14,059 14,230 13,967
Female 15,209 15,351 14,869
16 years + 23,416 23,704 23,904
21 years + 21,450 21,835 22,525
65 years + 4,101 4,165 4,638
White 28,579 27,740 26,196
Black/African American 235 328 704
American Indian & Alaskan Native 53 105 17
Asian & Pacific Islander 281 427 806
Some other race 120 425 294
Two or more races - 556 819
Hispanic or Latino (of any race) 542 918 1,499
Educational Attainment 1990 2000 2016
Population (Age 25+) 19,498 20,106 20,746
Less than 9th grade 11.2% 8.3% 4.3%
9th-12th, no diploma 18.5% 15.6% 8.0%
High School Graduate / GED 33.2% 31.7% 31.4%
Some College, no degree 15.1% 20.2% 24.0%
Associate Degree 7.2% 7.7% 10.1%
Bachelor Degree 10.9% 11.7% 15.2%
Graduate/Professional Degree 3.9% 5.0% 6.9%
1990 2000 2016
Median Household Income $31,625 $39,505 $50,952
Annual Average Labor Force Estimates 2006 2009 2017
Labor Force 16,791 16,775 16,119
Employment 15,896 14,815 15,364
Unemployment 895 1,960 755
Unemployment Rate 5.3% 11.7% 4.7%
2016
Percent of Population that Speak Only English or
Another Language & English either 'well' or 'very well' 99.0%
Percent of Population that Speak English 'not well'
or 'not at all' 1.0%
Language Spoken:
Speak Spanish 0.2%
Speak Other Indo-European 0.6%
Speak Asian/Pacific Islander 0.2%
Speak Other Languages 0.0%

Hometown
43.0%
Elsewhere
0.8%
Other RI Town19.9%
Massachusetts
1.5%Connecticut
34.8%
Westerly
Establishment Employment 2006 2009 2017
Total Private & Government 10,277 9,416 9,762
Total Private Only 9,272 8,365 8,729
Retail Trade 2,243 1,961 2,081
Health Care & Social Assistance 2,002 2,015 1,759
Accommodation & Food Services 1,270 1,260 1,739
Government 1,006 1,052 1,033
Manufacturing 965 597 552
Arts, Entertainment, & Recreation 365 431 527
Management of Companies & Enterprises 281 * 356
Construction 350 272 312
Other Services 422 301 301
Professional & Technical Services 226 233 274
Administrative Support & Waste Management 158 134 206
Finance & Insurance 322 322 205
Information 323 235 105
Wholesale Trade 63 70 74
Educational Services 40 67 71
Real Estate & Rental & Leasing 90 103 66
Transportation & Warehousing 48 41 55
Agriculture, Forestry, Fishing & Hunting 9 * *
Mining * * *
Utilities * * *
Where Westerly Residents Work, 2013
w Westerly’s total population grew by 6.3 percent
during the 1990’s, with the addition of 1,361
people, however, between 2000 and 2016,
Westerly lost 311 (-1.4%) residents.
w Nearly 43 percent of Westerly residents 25
years and older had a college degree (Associate
or higher) in 2016. The share of local residents
without a high school diploma or GED
decreased between 2000 and 2016, falling from
18.3 percent to 10.5 percent.
w Between 2009 and 2017, employment in
Westerly increased by 346 (+3.7%) jobs. Private
sector employers reported a gain of 364
(+4.4%) jobs, while public sector employment
decreased by 19 (-1.8%) jobs. In comparison,
statewide total employment grew by 28,830
(+6.4%) jobs.
w Westerly’s unemployment rate averaged 5.1
percent in 2017, tied for the 5th highest in the
state and above the state average of 4.5
percent.
w In 2016, 98.8 percent of Westerly residents age
18-64 spoke only English or spoke another
language and English either well or very well,
compared to 95.1 percent of RI residents.
w Forty-three percent of Westerly residents work
in Westerly, while 37.1 percent work outside of
RI.
Language
Population Age 18-64
Population 1990 2000 2016
Total Population 21,605 22,966 22,655
Male 10,378 11,077 10,236
Female 11,227 11,889 12,419
16 years + 17,127 18,124 18,920
21 years + 15,834 16,872 17,575
65 years + 3,617 3,915 4,723
White 21,145 21,857 21,250
Black/African American 130 164 270
American Indian & Alaskan Native 79 130 260
Asian & Pacific Islander 225 457 580
Some other race 26 77 65
Two or more races - 281 230
Hispanic or Latino (of any race) 180 270 491
Educational Attainment 1990 2000 2016
Population (Age 25+) 14,559 15,949 16,500
Less than 9th grade 8.6% 5.8% 2.7%
9th-12th, no dip loma 15.7% 12.5% 7.8%
High School Graduate / GED 31.9% 30.0% 28.3%
Some College, no degree 15.6% 20.3% 18.6%
Associate Degree 7.7% 6.8% 10.7%
Bachelor Degree 12.6% 15.0% 19.8%
Graduate/Professional Degree 7.9% 9.6% 12.2%
1990 2000 2016
Median Household Income $34,844 $44,613 $60,800
Annual Average Labor Force Estimates 2006 2009 2017
Labor Force 13,322 13,387 11,324
Employment 12,741 12,186 10,746
Unemployment 581 1,201 578
Unemployment Rate 4.4% 9.0% 5.1%
2016
Percent of Population that Speak Only English or
Another Language & English either 'well' or 'very well' 98.8%
Percent of Population that Speak English 'not well'
or 'not at all' 1.2%
Language Spoken:
Speak Spanish 0.3%
Speak Other Indo-European 0.2%
Speak Asian/Pacific Islander 0.5%
Speak Other Languages 0.1%

Hometown
27.4%Elsewhere
0.6%
Other RI Town
39.2%
Massachusetts
32.2%
Connecticut
0.6%
Woonsocket
Establishment Employment 2006 2009 2017
Total Private & Government 15,201 15,105 13,959
Total Private Only 13,561 13,575 12,409
Health Care & Social Assistance 3,506 3,793 3,525
Management of Companies & Enterprises 1,697 * 2,453
Government 1,640 1,530 1,549
Retail Trade 2,016 1,688 1,382
Manufacturing 1,338 1,053 965
Accommodation & Food Services 1,132 1,126 935
Transportation & Warehousing 775 773 559
Professional & Technical Services 404 399 457
Administrative Support & Waste Management 589 615 420
Wholesale Trade 375 362 345
Educational Services 382 339 325
Construction 312 283 321
Other Services 531 494 284
Finance & Insurance 253 192 161
Real Estate & Rental & Leasing 139 129 121
Arts, Entertainment, & Recreation 68 97 107
Information 45 107 *
Utilities 0 * *
Agriculture, Forestry, Fishing & Hunting 0 0 0
Mining 0 0 0
Where Woonsocket Residents Work, 2013
w Woonsocket’s total population decreased by 1.5
percent during the 1990’s, with the loss of 653
people. Between 2000 and 2016, Woonsocket
lost another 1,952 (-4.5%) residents.
w Over 23 percent of Woonsocket residents 25years and older had a college degree (Associate
or higher) in 2016. The share of local residents
without a high school diploma or GED
decreased between 2000 and 2016, falling from
36.0 percent to 20.4 percent.
w Between 2009 and 2017, employment in
Woonsocket decreased by 1,146 (-7.6%) jobs.
Private sector employers reported a loss of1,166 (-8.6%) jobs, while public sector
employment increased by 19 (+1.2%) jobs. In
comparison, statewide total employment grew
by 28,830 (+6.4%) jobs.
w Woonsocket’s unemployment rate averaged 6.0
percent in 2017, the 2nd highest in the state and
well above the state average of 4.5 percent.
w In 2016, 94.2 percent of Woonsocket residents
age 18-64 spoke only English or spoke another
language and English either well or very well,
compared to 95.1 percent of RI residents.
w Over one-quarter (27.4%) of Woonsocket
residents work in Woonsocket, while 33.4
percent work outside of RI.
Language
Population Age 18-64
Population 1990 2000 2016
Total Population 43,877 43,224 41,272
Male 20,647 20,622 20,730
Female 23,230 22,602 20,542
16 years + 34,424 33,181 33,255
21 years + 31,366 30,432 30,784
65 years + 7,124 6,589 5,893
White 40,939 35,935 33,247
Black/African American 1,158 1,920 3,502
American Indian & Alaskan Native 77 139 103
Asian & Pacific Islander 1,309 1,769 2,714
Some other race 394 2,102 708
Two or more races - 1,359 998
Hispanic or Latino (of any race) 1,156 4,030 6,322
Educational Attainment 1990 2000 2016
Population (Age 25+) 28,426 28,109 28,822
Less than 9th grade 20.0% 13.7% 7.5%
9th-12th, no diploma 23.9% 22.3% 12.9%
High School Graduate / GED 30.1% 32.0% 35.8%
Some College, no degree 11.4% 16.7% 20.2%
Associate Degree 5.5% 5.1% 7.9%
Bachelor Degree 6.2% 7.1% 10.4%
Graduate/Professional Degree 2.9% 3.1% 5.4%
1990 2000 2016
Median Household Income $25,363 $30,819 $37,235
Annual Average Labor Force Estimates 2006 2009 2017
Labor Force 22,088 22,266 19,032
Employment 20,900 19,382 17,886
Unemployment 1,188 2,884 1,146
Unemployment Rate 5.4% 13.0% 6.0%
2016
Percent of Population that Speak Only English or
Another Language & English either 'well' or 'very well' 94.2%
Percent of Population that Speak English 'not well'
or 'not at all' 5.8%
Language Spoken:
Speak Spanish 4.1%
Speak Other Indo-European 0.3%
Speak Asian/Pacific Islander 1.3%
Speak Other Languages 0.1%

Data Sources
Population:
1990 & 2000: US Census Bureau, 1990 Census and Census 2000, www.census.gov
Educational Attainment, Median Household Income and 2016 Population:
1990 and 2000: US Census Bureau, 1990 Census and Census 2000, www.census.gov
2016: US Census Bureau, 2012-2016 American Community Survey 5-Year Estimates
Annual Average Labor Force Estimates and Establishment Employment:
Rhode Island Department of Labor and Training, Labor Market Information unit, Local Area Unemployment Statistics
(www.dlt.ri.gov/lmi/laus.htm) and Quarterly Census of Employment and Wages (www.dlt.ri.gov/lmi/es202.htm)
Rhode Island and City and Town Language Spoken at Home by Ability to Speak English for Population Aged
18-64, 2016: US Census Bureau, 2012-2016 American Community Survey 5-Year Estimates, Table B16004
Where Residents Work, 2013: US Census Bureau, 2009-2013 American Community Survey 5-Year Estimates, Journey
to Work and Place of Work files
This workforce product was funded by a grant awarded by the U.S. Department of Labor's Employment and Training
Administration. The product was created by the recipient, the Labor Market Information Division of the RI Department of
Labor and Training, and does not necessarily reflect the official position of the U.S. Department of Labor. The US Depart-
ment of Labor makes no guarantees, warranties, or assurances of any kind, express or implied, with respect to such
information, including any information on linked sites and including, but not limited to, accuracy of the information or its
completeness, timeliness, usefulness, adequacy, continued availability, or ownership as this is the responsibility of RI Labor
Market Information Division. This product is copyrighted by the institution that created it. Internal use by an organization
and/or personal use by an individual for non-commercial purposes is permissible. All other uses require the prior authoriza-
tion of the copyright owner.
* Confidential or non-publishable data
**Labor force statistics prior to 1976 were determined under a different methodology and are not comparable to today’s
estimates.

Rhode Island Department of Labor & Training
Labor Market Information Unit
1511 Pontiac Ave.
Cranston, RI 02920
(401) 462-8740
www.dlt.ri.gov/lmi
DLT is an Equal Opportunity Employer/Program.
Auxiliary aids and services are available upon request to individuals with disabilities.
TTY via RI Relay 711
Published June 2018