State of Reliability 2015 - NERC Analysis DL/2015 State of... · Chapter 1 – Key Findings ... the...
156
NERC | State of Reliability Report 2015 | May 2015 I State of Reliability 2015 May 2015
Transcript of State of Reliability 2015 - NERC Analysis DL/2015 State of... · Chapter 1 – Key Findings ... the...

NERC | State of Reliability Report 2015 | May 2015 I
State of Reliability 2015
May 2015

NERC | State of Reliability Report 2015 | May 2015 ii
Table of Contents
Preface ....................................................................................................................................................................... iii
Executive Summary ....................................................................................................................................................5
Chapter 1 – Key Findings ............................................................................................................................................6
Chapter 2 – 2014 Year in Review ............................................................................................................................. 13
Chapter 3 – Severity Risk Assessment and Availability Data Systems Summary .................................................... 17
Chapter 4 – Reliability Indicator Trends .................................................................................................................. 26
Chapter 5 – Development of Compliance Metrics .................................................................................................. 56
Chapter 6 – Event Analysis ...................................................................................................................................... 60
Chapter 7 – Actions to Address Key Findings in Prior State of Reliability Reports .................................................. 66
Chapter 8 – Spare Equipment Initiatives ................................................................................................................. 75
Chapter 9 – BES Security Metrics ............................................................................................................................ 78
Appendix A – Statistical Analysis for Risk Issue Identification and Transmission Outage Severity Analysis ........... 84
Appendix B – Analysis of Generation Data ............................................................................................................ 107
Appendix C – Analysis of Demand Response Data ................................................................................................ 113
Appendix D – Statistical Analysis of Metrics.......................................................................................................... 120
Appendix E – Event Analysis Discussion ................................................................................................................ 142
Appendix F – Statistical Summary of SRI Assessment ........................................................................................... 149
Appendix G – Abbreviations Used in This Report .................................................................................................. 153
Appendix H – Contributions .................................................................................................................................. 154

NERC | State of Reliability Report 2015 | May 2015 iii
Preface
The North American Electric Reliability Corporation (NERC) is a not-for-profit international regulatory authority whose mission is to assure the reliability of the bulk power system (BPS) in North America. NERC develops and enforces Reliability Standards; annually assesses seasonal and long‐term reliability; monitors the BPS through system awareness; and educates, trains, and certifies industry personnel. NERC’s area of responsibility spans the continental United States, Canada, and the northern portion of Baja California, Mexico. NERC is the electric reliability organization (ERO) for North America, subject to oversight by the Federal Energy Regulatory Commission (FERC) and governmental authorities in Canada. NERC’s jurisdiction includes users, owners, and operators of the BPS, which serves more than 334 million people. The North American BPS is divided into several assessment areas within the eight Regional Entity (RE) boundaries, as shown in the map and corresponding table below.
FRCC Florida Reliability Coordinating Council
MRO Midwest Reliability Organization
NPCC Northeast Power Coordinating Council
RF ReliabilityFirst
SERC SERC Reliability Corporation
SPP-RE Southwest Power Pool Regional Entity
TRE Texas Reliability Entity
WECC Western Electricity Coordinating Council

Preface
NERC | State of Reliability Report 2015 | May 2015 iv
Notice This report presents metrics and trends derived from the data available at the time of publication and may be modified pending further review and analysis.
NERC | State of Reliability Report 2015 | May 2015 5
Executive Summary
The State of Reliability 2015 report presents NERC’s independent view of ongoing bulk power system (BPS) trends via data compiled through December 2014 to objectively provide an integrated view of reliability performance. The key findings and recommendations serve as technical input to NERC’s risk assessment, Reliability Standards project prioritization, compliance process improvement, event analysis, reliability assessment, and critical infrastructure protection efforts. The analysis of BPS performance developed as part of this report provides a reference of historical reliability, offers analytical insights regarding industry action, and enables the identification and prioritization of specific steps that can be taken to manage risks that have an effect on reliability. The analysis of available data provided in the report demonstrates that, excluding weather effects, BPS reliability remained within defined performance objectives to provide an Adequate Level of Reliability (ALR). 1 Weather continues to be a significant stress factor on BPS reliability, specifically impacting generator performance. Several of the most important reliability performance findings were (1) there was no loss of load due to cyber or physical security events in 2014; (2) average transmission outage severity declined; (3) protection system misoperations continue to escalate risk in Qualified Events, and (3) there was a significant decrease in unplanned transmission outages that resulted in a loss of load. Excluding the impact of extreme weather, BPS performance for events that can be controlled by industry action demonstrated that the reliability risk of non-weather events is manageable. In its mission to ensure the reliability of the BPS, NERC carries out multiple initiatives and assessments. One such initiative is the development and maintenance of performance metrics. This report introduces new performance metrics in two key areas: compliance and security. When performance metrics were first introduced in 2010, the Key Compliance Monitoring Index (KCMI) was developed to track the impact of “Standard-driven” risks of compliance violations. Due to the number of Reliability Standards modifications, it became difficult to update the changing set of requirements while maintaining meaningful tracking of the compliance violation data that could provide informative trends. Two metrics are proposed to replace the retired KCMI. One metric relies on ERO Enforcement staff’s determination of the risk of a potential violation, and the other metric is a quarterly count of the number of reported Reliability Standards noncompliances with observed reliability impact. NERC also developed a set of security performance metrics. The metrics include the total number of Reportable Cyber Security Incidents1 and physical security reportable events2 that occur over time and identify how many of these incidents have resulted in a loss of load. They also include Electricity Sector Information Sharing and Analysis Center (ES-ISAC) membership and Incident Bulletins published by the ES-ISAC based on information voluntarily submitted by ES-ISAC member organizations. These metrics provide lagging and leading indicators for security performance applicable to reliable BES operation. The goal of the State of Reliability 2015 report is to quantify risk and performance, highlight areas for improvement, and reinforce and measure success in controlling risks to reliability. The ongoing work in NERC’s Performance Analysis staff, working with the Performance Analysis Subcommittee, provides a foundation for these risk assessments, which is documented in this report.
1 Definition of “Adequate Level of Reliability,”
http://www.nerc.com/comm/Other/Adequate Level of Reliability Task Force ALRTF DL/Final Documents Posted for Stakeholders and Board of Trustee Review/10_04_12_ALR_Definition_clean.pdf (The assessment objectives relate to planning assessments, which are not covered in the report).
1 Ref. NERC Glossary of Terms: “A Cyber Security Incident that has compromised or disrupted one or more reliability tasks of a functional
entity.” 2 Reportable events are defined in Reliability Standard EOP-004-2 Event Reporting, Attachment 1.

NERC | State of Reliability Report 2015 | May 2015 6
Chapter 1 – Key Findings
2014 Reliability Performance The 2014 reliability performance continued to remain high, sustaining the positive trends documented in the review of 2013 performance in the State of Reliability 2014 report. In late 2012, NERC adopted a revised definition of Adequate Level of Reliability, which forms the basis for the reliability indicators that are used as metrics to evaluate the performance of the BES. The five performance objectives, two assessment objectives, and associated expected performance outcomes were developed to encompass NERC’s responsibility to ensure reliability of the BES.2 The severity risk index (SRI)3 and metrics measuring the ALR characteristics indicate that the BPS is within defined performance objectives. Based on the data and analysis presented within this report, the following key findings were identified:
Weather continues to stress BPS reliability
No load loss due to cyber or physical security events4
Decline of average transmission outage severity
Significant decrease in unplanned transmission outages resulting in loss of load
Stable frequency response trend
Protection system misoperations trending lower, but continue to escalate risk in Qualified Events5
Continued decline of the use of Energy Emergency Alert Level 3 (declared by Balancing Authorities (BAs) or Load-Serving Entities (LSEs) when they are deficit in resources)
Key Finding 1: Weather Continues to Stress BPS Reliability The analysis of SRI in Chapter 3 and the metrics in Chapter 4 demonstrate that BPS reliability remained within the ALR performance objectives. Weather continues to be a significant stress factor on BPS reliability, leading primarily to generator outages and deratings. Load-loss events were not the primary driver of high SRI days during 2014. All of the top-10 most severe events in 2014 were initiated or exacerbated by weather. There were three high-stress days (i.e., days with an SRI greater than 5.0) in 2014. Two of the days were associated with the polar vortex;6 the remaining high-stress day was associated with an extreme weather event in California. The calculated SRI for all but two of the 10 highest SRI days for the year was driven by generation performance and, to a lesser extent, transmission outage performance, and did not involve a significant degree of load loss. While the BPS is expected to perform at a high level during weather events, system performance must continue to be examined in light of extreme weather. To the extent that weather is determined as a large impact to day-to-day and extreme-day performance, other metrics that report on BPS reliability (specifically load-loss events) that retain weather impacts should be developed. Excluding the impact of these extreme days, BPS performance for events that can be controlled by industry action was consistently above the ALR performance objectives, demonstrating that the reliability risk of non-weather events is manageable. Chapter 3 contains further discussion on this topic.
2 Definition of “Adequate Level of Reliability,”
http://www.nerc.com/comm/Other/Adequate Level of Reliability Task Force ALRTF DL/Final Documents Posted for Stakeholders and Board of Trustee Review/10_04_12_ALR_Definition_clean.pdf (The assessment objectives relate to planning assessments, which are not covered in the report).
3 SRI is a “stress” index, measuring risk impact from events resulting in transmission loss, generation loss, and load loss. 4 A Reportable Cyber Security Incident is defined as “A Cyber Security Incident that has compromised or disrupted one or more reliability
tasks of a functional entity.” A reportable physical event is defined in Reliability Standard EOP-004-2 Event Reporting, Attachment 1. 5 A Qualified Event is an event that meets a category description in the Electric Reliability Organization Event Analysis Process, found at
http://www.nerc.com/pa/rrm/ea/EA Program Document Library/Final_ERO_EA_Process_V2.1.pdf. 6 http://www.nerc.com/pa/rrm/January 2014 Polar Vortex Review/Polar_Vortex_Review_29_Sept_2014_Final.pdf.

Chapter 1 – Key Findings
NERC | State of Reliability Report 2015 | May 2015 7
Key Finding 2: No Load Loss Due to Cyber or Physical Security Events Analysis of the newly developed security performance metric data showed that no Reportable Cyber Security Incidents or physical security reportable events resulted in loss of load on the BPS in 2014. As recommended in the State of Reliability 2014 report, the NERC Performance Analysis Subcommittee (PAS) collaborated with the BES Security Metrics Working Group (BESSMWG) to develop security performance metrics. The BESSMWG developed an initial set of five metrics, presented in Chapter 9.
NERC Actions to Support BES Security NERC is committed to analyzing and advising industry on cybersecurity compromises that could lead to impacts on reliability. On November 22, 2013, FERC approved Version 5 of the critical infrastructure protection cybersecurity standards (CIP Version 5), representing significant progress in mitigating cyber risks to the BPS. NERC initiated a program to support industry transition directly from the currently enforceable CIP Version 3 standards to CIP Version 5. The goal of the transition program is to improve industry’s understanding of the technical security requirements for CIP Version 5, as well as the expectations for compliance and enforcement. The Electricity Sector Information Sharing and Analysis Center (ES-ISAC) establishes situational awareness, incident management, coordination, and communication capabilities within the electricity sector through timely, reliable, and secure information exchange. The ES-ISAC, in collaboration with the Department of Energy and the Electricity Sector Coordinating Council (ESCC), serves as the primary security communications channel for the electricity sector and enhances the sector’s ability to prepare for and respond to cyber and physical threats, vulnerabilities, and incidents. ES-ISAC member organizations include NERC registered entities and others in the electricity sector. A strategic review of the ES-ISAC is ongoing, and expected to conclude in the summer of 2015. As part of its ongoing training and education efforts, NERC conducted its second industry-wide grid security ex-ercise, GridEx II, in November 2013. The exercise, a coordinated cyber and physical attack on the BPS, promoted coordination and highlighted urgent issues facing the industry. A report7 summarizing the exercise highlights recommendations and lessons learned for industry to use when preparing for and responding to cyber and physical threats, vulnerabilities, and incidents. The results are also incorporated into strategic action by NERC’s Critical Infrastructure Protection Committee (CIPC) and the ESCC. Planning for GridEx III, which is scheduled for late 2015, has begun. The scenario will include robust cyber and physical threats to the BPS to exercise crisis response and recovery, improve crisis communications, gather lessons learned, and engage senior industry and government leaders. On March 7, 2014, FERC issued an order directing NERC to address physical security risks and vulnerabilities of critical facilities on the BPS. In response to the order, Reliability Standard CIP-014-1 was adopted by the Board and subsequently filed with and approved by FERC, to become effective on October 1, 2015. FERC directed NERC to remove the term “widespread” from the standard or, alternatively, propose modifications to the Reliability Standard that address FERC’s concerns. While NERC is proceeding through the Standards Development Process to incorporate these refinements, implementation of the standard is underway.
7 http://www.nerc.com/pa/CI/CIPOutreach/GridEX/GridEx II After Action Report.pdf.
Recommendation NERC and industry should develop metrics that provide insight into weather impacts on BPS performance, especially during load-loss events.

Chapter 1 – Key Findings
NERC | State of Reliability Report 2015 | May 2015 8
Key Finding 3: Decline of Average Transmission Outage Severity The average transmission outage severity continued to decrease in 2014. After realizing a significant decrease from 2012 to 2013, it reduced again from 2013 to 2014, based on analysis of year-over-year changes in calculated transmission outage severity of TADS events by Initiating Cause Code (ICC). This analysis, presented in Appendix A, shows continuing positive performance in the average transmission outage severity for each ICC and for the 2012–2014 dataset. Events initiated by the ICCs of Misoperations and Failed AC Substation Equipment remained high in total transmission outage severity and were the greatest contributors to transmission outage severity relative risk.
NERC Actions to Support Reducing Misoperations NERC actions to address misoperations are addressed in Key Finding 6.
NERC Actions to Support Reducing the Risk of Failed AC Substation Equipment In 2014, NERC produced a report investigating reliability issues related to ac substation equipment failures,8 with recommendations on bus configuration evaluations, breaker lubrication practices, service advisory tracking, and proactive equipment replacement.
8 http://www.nerc.com/comm/PC/AC Substation Equipment Task Force ACSETF/Final_ACSETF_Report.pdf.
Recommendations
NERC, with support from CIPC, should deploy the security metrics presented in Chapter 9.
Working with industry and forums such as the North American Transmission Forum (NATF), NERC should analyze information from these security metrics and consider development of additional metrics that could provide valuable information on cybersecurity.
NERC, working jointly with the ESCC, should conclude expeditiously the strategic review of the ES-ISAC.
Recommendations
NERC, working with the NATF, should evaluate the failure rate of circuit breakers and determine the impact of bus configuration on ac transmission circuit outages.
Entities should evaluate the impact of breaker failures on system performance when choosing bus configurations for new installations or modifying existing substations.
NERC, working with IEEE and other applicable industry forums, should develop a consistent method for the collection and distribution of ac substation equipment failure data.

Chapter 1 – Key Findings
NERC | State of Reliability Report 2015 | May 2015 9
Key Finding 4: Significant Decrease in Unplanned Transmission Outages Resulting in Loss of Load Analysis of unplanned transmission outage data shows that the number of BPS transmission-related events resulting in loss of firm load from 2002 to 2011 was relatively constant (average of 10 events per year), then dropped significantly over the last three years to an average of less than four per year. Metric M-2 measures BPS transmission-related events resulting in the loss of load, excluding weather-related outages. The analysis of data for this metric is presented in Chapter 4.
NERC Actions to Support Continued Reduction of Unplanned Transmission Outages Resulting in Loss of Load NERC’s focus on this metric in past state of reliability reports resulted in a range of actions. NERC Reliability Standard TOP-003-1 – Planned Outage Coordination was developed and required that scheduled generator and transmission outages potentially affecting the reliability of interconnected operations must be planned and coordinated among Balancing Authorities, Transmission Operators, and Reliability Coordinators. Also, Reliability Standard FAC-014-2 – Establish and Communicate System Operating Limits requires that System Operating Limits (SOLs) and Interconnection Reliability Operating Limits (IROLs) are established and consistent with documented methodology. These standards help ensure that the impact on the BPS from unplanned transmission outages is mitigated. Finally, transmission outage events that meet the definition of a Qualified Event in NERC’s Event Analysis Process are evaluated for root causes to derive potential lessons learned that are shared with industry.
Key Finding 5: Stable Frequency Response Trend From 2012 to 2014, the Eastern, Western, ERCOT, and Québec Interconnections have shown steady frequency response performance, trending above the recommended Interconnection Frequency Response Obligation (IFRO) at all times during the time period studied. NERC annually applies statistical tests to interconnection frequency response datasets,9 including additional analyses on time of year, load levels, and other attributes. The Eastern Interconnection frequency response has shown a statistically significant positive increase from 2012 to 2014. The Western Interconnection and the ERCOT Interconnection are statistically stable. The Québec Interconnection frequency response experienced a statistically significant decline from 2012 to 2014, but remains well above the calculated IFRO for the Interconnection. It is important to monitor these trends to determine whether any events approach or drop below the IFRO for any Interconnection and to identify any underlying causes and corrective courses of action. The study methods and statistical results are summarized in Chapter 4 and detailed in Appendix D.
NERC Actions to Support Sustained Frequency Response NERC Reliability Standard BAL-003-1 was approved by the Federal Energy Regulatory Commission (FERC) on January 16, 2014, and has phased-in effective dates of April 1, 2015, and April 1, 2016. The standard requires an annual collection of data for calculating Frequency Bias and for determining compliance with the Frequency Response Obligation (FRO).
9 Datasets described in the Frequency Response Initiative Report, October 2012
http://www.nerc.com/docs/pc/FRI_Report_10-30-12_Master_w-appendices.pdf

Chapter 1 – Key Findings
NERC | State of Reliability Report 2015 | May 2015 10
There were no reported Event Analysis Process10 Qualified Events in 2014 where frequency response performance was cited as a causal factor for initiating or sustaining an event. NERC will examine incidents in 2014 where frequency response was below the IFRO to determine any root causes and actions necessary to improve the frequency response performance. On February 5, 2015, NERC issued an Industry Advisory on generator governor frequency response.11 NERC determined that a significant portion of the Eastern Interconnection generator dead bands or governor control settings could inhibit or prevent frequency response. With the exception of nuclear generators, entities with generators greater than 75 MVA were advised to review generator governor and Distributed Control System (DCS) settings to conform to specifications mentioned in the Advisory.
Key Finding 6: Protection System Misoperations Trending Lower, but Continue to Escalate Risk in Qualified Events The analysis of data showed that the protection system misoperation rate began to decline in 2014. The majority of protection system misoperations do not lead to Qualified Events;12 approximately three percent cause or exacerbate the severity of reportable system disturbances. However, those protection system misoperations that do occur can severely increase risk to reliability. For example, more than 68 percent of transmission-related Qualified Events have protection system misoperations associated with them that either initiated the event or caused it to be more severe. The analysis of these data and events are presented in Chapter 4.
NERC Actions to Support Improved Protection System Performance NERC is completing revisions to a number of Reliability Standards that involve protection systems13 to improve their performance. These standards are designed to implement a corrective action program in which specific mitigation of misoperation root causes is required. To increase awareness, NERC conducts industry webinars14 on protection systems and publishes Lessons Learned on how Generator Owners (GOs) and Transmission Owners (TOs) are achieving high levels of protection system performance. In addition, NERC staff analyzed and reported on the top-three protection system misoperation cause codes reported by entities.15 This analysis sets the stage for NERC and industry action toward protection system misoperation reduction.
10 http://www.nerc.com/pa/rrm/ea/Pages/EA-Program.aspx 11 http://www.nerc.com/pa/rrm/bpsa/Alerts DL/2015 Alerts/NERC Alert A-2015-02-05-01 Generator Governor Frequency Response.pdf 12 A Qualified Event is an event that meets a category description in the Electric Reliability Organization Event Analysis Process, found at
http://www.nerc.com/pa/rrm/ea/EA Program Document Library/Final_ERO_EA_Process_V2.1.pdf. 13 http://www.nerc.com/pa/Stand/Pages/Standards-Under-Development.aspx. 14 http://www.nerc.com/files/misoperations_webinar_master_deck_final.pdf. 15 http://www.nerc.com/pa/RAPA/PA/Performance Analysis DL/NERC Staff Analysis of Reported Misoperations - Final.pdf.
Recommendations
NERC should monitor the effectiveness of the Industry Advisory on generator governor frequency response on the Eastern Interconnection.
NERC should assess the impact of BAL-003-1 on frequency response for all Interconnections subsequent to the Reliability Standard’s effective dates.
NERC, with support from the Resources Subcommittee, should identify root causes and any necessary actions for incidents in 2014 where frequency response was less than the IFRO.
NERC should determine whether additional actions, beyond those currently being pursued in NERC Reliability Standards, are required to maintain and improve frequency response performance.

Chapter 1 – Key Findings
NERC | State of Reliability Report 2015 | May 2015 11
For example, based on reviews of the Qualified Events for protection system misoperations, there are two main causes of incorrectly set ground instantaneous overcurrent elements. The first is an increase in the maximum value of ground fault short circuit current available over time, rendering the ground settings too sensitive. The second is setting the ground instantaneous overcurrent element without enough margin to accommodate short circuit modeling tolerances and other component anomalies. In its February 10, 2015 Lessons Learned,16 NERC advised entities to consider reviewing the maximum value of ground fault short circuit current that was used to develop the protection system settings and ensure that the short circuit current available is appropriate. In addition, entities should review their philosophies for setting ground instantaneous overcurrent elements and determine the appropriate percentage of line length to protect with the instantaneous setting.
Key Finding 7: Use of Energy Emergency Alert Level 3 Continues to Decline In 2014 there were four Energy Emergency Alert Level 3 (EEA3) events declared, which is fewer than any other year for which data was reported. Of the four EEA3 events, only one resulted in load shed. This event was due to conditions during the polar vortex17 that resulted in record-low temperatures and high demand. The other three reported EEA3 alerts did not result in loss of load and were generally caused by transmission limitations resulting in a localized area’s inability to make use of the reserves that existed within the region.
NERC Actions to Support Evaluation of EEA3 Events NERC continues to evaluate each reported EEA3 event to determine the potential impact to reliability. As historical data is gathered by NERC on EEAs, trends provide a relative indication of performance measured at a Regional Entity or interconnection level. The issuance of an EEA3 indicates an issue with the real-time adequacy of the electric supply system. It may be due to a lack of fuel or dependence on transmission for imports into a constrained area, not simply a lack of available generation resources. Events that meet the definition of a Qualified Event in
16 http://www.nerc.com/pa/rrm/ea/Lessons Learned Document.
Library/LL20150202_Effects_of_Mutual_Coupling_when_Setting_Ground_Instantaneous_Overcurrent_Elements.pdf. 17 http://www.nerc.com/pa/rrm/January 2014 Polar Vortex Review/Polar_Vortex_Review_29_Sept_2014_Final.pdf.
Recommendations
Entities should review the maximum value of ground fault short circuit current that was used to develop the protection system settings and ensure that the short circuit current available is appropriate. In addition, entities should review their philosophies for setting ground instantaneous overcurrent elements and determine the appropriate percentage of line length to protect with the instantaneous setting.
NERC and the Regions should develop training modules on the importance of standard design templates to address design, logic settings, and peer review.
NERC should work with the Protection System Misoperations Task Force to develop a guideline on quality control to improve protective relay settings.
NERC and the Regions, in partnership with protection system equipment manufacturers, should develop an industry outreach program that targets specific organizations that have the greatest impact on protection system misoperation reduction.
NERC should work with microprocessor relay manufacturers to determine whether any technical bulletins or industry alerts should be developed to address protection system equipment failures.
The NATF, in coordination with NERC, should engage its membership on key topical areas of improvement and develop targeted improvement plans for its members.

Chapter 1 – Key Findings
NERC | State of Reliability Report 2015 | May 2015 12
NERC’s Event Analysis Process are evaluated for root causes to derive potential lessons learned that are shared with industry.

NERC | State of Reliability Report 2015 | May 2015 13
Chapter 2 – 2014 Year in Review
The State of Reliability 2015 report gathers data and metrics needed to evaluate the reliability of the BPS. This chapter describes the conditions in which the electric industry operated during 2014 and other environmental, regulatory, and policy-related issues that took place during 2014 to provide context to the observations and data presented in this report.
Reliability Assurance Initiative The Reliability Assurance Initiative (RAI) was a collaborative, multiyear effort among NERC, the Regional Entities, and industry to enhance the effectiveness of the Compliance Monitoring and Enforcement Program (CMEP). The initiative focused on the development and implementation of a risk-based approach to compliance monitoring and enforcement. This approach focused NERC, the Regional Entities, and industry resources on higher-risk reliability issues. These methods successfully address high-risk issues while also accounting for lesser-risk reliability issues, which continue to be identified, corrected, and tracked. Further, the approach focuses on how the ERO performs oversight and obtains assurance on compliance with NERC Reliability Standards, and it does so without creating new or additional requirements (beyond those established in Reliability Standards) for registered entities operating the grid. This approach enables the ERO to leverage registered entity management practices in use at registered entities and inform industry of lessons learned by their peers. The emphasis of this initiative shifted at the end of 2014 toward implementation through the Risk-Based Compliance Monitoring and Enforcement Program.
Transition to Critical Infrastructure Protection Version 5 In 2013, FERC approved Version 5 of the Critical Infrastructure Protection Reliability Standards (CIP Version 5), which represent a significant improvement—and change—over the currently effective CIP Version 3 standards. They include new cybersecurity controls and extend the scope of systems to which the CIP Reliability Standards apply. NERC initiated the CIP Version 5 Transition Program to collaborate with Regional Entities and applicable entities to implement the CIP Version 5 standards in a manner that is timely, effective, and efficient. The goals of the program are to improve industry’s understanding of the technical security requirements for CIP Version 5 and clarify the expectations for compliance and enforcement. In 2014, NERC concluded a nine-month CIP Version 5 implementation study with a representative sample of six responsible entities focused on the technical solutions and processes needed to implement the CIP Version 5 standards. In so doing, NERC, Regional Entities, and responsible entities developed a deeper understanding of compliance and enforcement matters applicable to CIP Version 5. As anticipated, NERC, the Regional Entities, and the implementation study participants identified a number of issues during the implementation study that called for additional guidance and clarity. To further ensure confidence in the transition to CIP V5, NERC continued working with the Regional Entities and implementation study participants to develop lessons learned and frequently asked question (FAQ) documents on specific issues. As documents are finalized, they will be shared with industry. Working in collaboration with the Regional Entities, implementation study participants, and other stakeholders, NERC also developed a transition guidance document and compatibility tables that compare requirements in CIP Version 5 with requirements in CIP Version 3. In addition, NERC addressed stakeholder concerns with a document that clarifies how the risk-based compliance monitoring and enforcement processes developed under RAI will apply to CIP Version 5.

Chapter 2 – 2014 Year in Review
NERC | State of Reliability Report 2015 | May 2015 14
Risk-Based Registration Initiative NERC’s Risk-Based Registration initiative seeks to ensure that the right entities are subject to the right set of applicable NERC Reliability Standards using a consistent approach to risk assessment and registration across the ERO. In 2014, NERC established the Risk-Based Registration Advisory Group (RBRAG) and the RBRAG technical task force to provide input and advice on the design framework and implementation plan. The framework includes refined thresholds based on sound technical analysis, risk considerations, and support; reduced NERC Reliability Standard applicability based on sound technical analysis, risk considerations, and support; and clearly defined terms, criteria, and procedures that are risk-based and ensure the reliability of the BPS as outlined in the new BES definition. The proposed enhancements reduce unnecessary burdens while preserving BPS reliability and enable entities to avoid causing or exacerbating instability, uncontrolled separation, or cascading failures.
Polar Vortex Review As part of NERC’s ongoing efforts to identify risks to BPS reliability and to inform stakeholders of the impacts of those risks, NERC reviewed the extreme weather event (polar vortex) that occurred January 6–8, 2014. The Polar Vortex Review18 details how the BPS exhibited its resiliency during the polar vortex, as BPS reliability was maintained despite sustained record-low temperatures occurring over a large geographic area in North America. Many areas experienced daytime-high and overnight-low temperatures that were between 20 and 30 degrees below average, with 49 cities setting new record lows. North America GOs and TOs responded well to prevent major impacts to the BPS through industry preparations and operational effectiveness. NERC examines the impact of these events to ensure lessons learned and related information are shared to prevent reoccurrences where possible and, most importantly, sustain successful operation and maintenance practices. As expected, key factors during the event included fuel deliverability issues, natural gas pipeline outages, gas service interruptions, frozen electricity and gas equipment, and other extreme cold weather operating challenges. During the event, grid operators employed techniques such as voltage reduction and demand-side management to ensure that BES reliability was maintained. Only one BA shed firm load during the polar vortex event, which is an indication of a strong overall performance by industry under extremely challenging circumstances.
2014 Long-Term Reliability Assessment The 2014 Long-Term Reliability Assessment19 provided a forward-looking, independent perspective of the resources needed to maintain reliability of the North American BPS over the next 10 years. NERC examined key indicators including load forecasts, expected resources, and transmission additions. The assessment identified three key reliability findings facing industry in the coming years: downward trends in reserve margins, uncertain impacts of environmental rules, and an ongoing resource mix transformation. In several assessment areas, reserve margins trended downward because of ongoing generation retirements, despite low load growth. Uncertainty remains for a large amount of existing conventional generation that may be vulnerable to retirement resulting from pending regulations, particularly the EPA’s proposed Clean Power Plan.
Potential Reliability Impacts from the Proposed Clean Power Plan
18 http://www.nerc.com/pa/rrm/January 2014 Polar Vortex Review/Polar_Vortex_Review_29_Sept_2014_Final.pdf 19 http://www.nerc.com/pa/RAPA/ra/Reliability Assessments DL/2014LTRA_ERATTA.pdf

Chapter 2 – 2014 Year in Review
NERC | State of Reliability Report 2015 | May 2015 15
A preliminary reliability review of the EPA assumptions and potential reliability impacts of the Environmental Protection Agency’s proposed Clean Power Plan under Section 111(d) of the Clean Air Act was completed in November. This assessment, Potential Reliability Impacts of EPA’s Proposed Clean Power Plan,20 examined the potential reliability concerns that could result from the proposed plan’s implementation. As noted in the 2014 Long-Term Reliability Assessment, the BPS is undergoing a fundamental transformation toward increasing dependency on natural gas, wind, and solar resources. The Clean Power Plan substantially accelerates that shift and proposes a very different mix of power resources. NERC’s role is to identify emerging reliability issues that must be adequately addressed to ensure future reliability of the electricity supply. The Clean Power Plan assessment provided a foundation for future reliability analyses and evaluations required by the ERO, stakeholders, and federal and state policy makers to create a framework with timelines that accommodate the expected infrastructure deployments needed to support BPS reliability while achieving the environmental objectives of the proposed rule.
BES Definition and BESnet FERC approved the revised definition of “BES” on March 20, 2014, as outlined in Order Nos. 743, 773, and 773-A. The definition includes bright-line core criteria with enumerated inclusions and exclusions. The ERO developed enterprise-wide processes and tools to provide a uniform, clear way of determining assets contained within the BES. The tools offer a consistent way to identify assets and manage workflow, which will enhance the reliability of the BPS. The ERO Enterprise-wide software application, the BES Notification and Exceptions Tool, or BESnet, is used by entities to submit notifications of changes to BES assets that affect their responsibilities for compliance with the Reliability Standards. As a result of the new definition, all elements and facilities necessary for the reliable operation and planning of the BPS will be included as BES Elements. FERC also approved the process for review of elements on a case-by-case basis to enable exceptions from the definition, where appropriate, as well as a process for entities to self-notify Regions of their determinations of BES Elements.
Physical Security of the BES Physical security was noted as an emerging focus in the 2014 State of Reliability report. On March 7, 2014, FERC directed NERC to submit a Reliability Standard within 90 days that would require TOs to identify critical facilities, evaluate the potential threats and vulnerabilities of these facilities, and develop and implement security plans on critical facilities such as transmission stations or substations and their associated primary control centers that, if rendered inoperable or damaged, could have a critical impact on the operation of the interconnection through instability, uncontrolled separation, or cascading failures on the BPS. On May 23, 2014, NERC filed with FERC for approval of its proposed Reliability Standard CIP-014-1, and on November 20, 2014, FERC issued its final rule, largely approving this standard. NERC explained in the filing that the proposed Reliability Standard is just part of its “multi-pronged approach” to ensuring the physical security of the nation’s BPS, which includes posting security guidelines and best practices and holding periodic grid security exercises and an annual grid security conference. The new standard also would complement two existing standards:
1. EOP-004-2 requires registered entities to report to NERC and law enforcement any physical damage or threats to a facility, and
2. CIP-006-5 addresses the management of physical access to critical cyber systems.
20 http://www.nerc.com/pa/RAPA/ra/Reliability Assessments DL/Potential_Reliability_Impacts_of_EPA_Proposed_CPP_Final.pdf.
Chapter 2 – 2014 Year in Review
NERC | State of Reliability Report 2015 | May 2015 16
With FERC approval, the standard requires a TO Risk Assessment under Requirement R1 to be completed no later than September 30, 2015. Thus, as a first step, each TO is required to develop a Risk Assessment for all of the facilities that meet the specified applicability criteria in the standard. The Risk Assessment consists of transmission analyses designed to identify the critical facilities. Further, as required by the standard, an unaffiliated third party will verify the Risk Assessment no later than December 31, 2015. After the Risk Assessment identifying critical stations or substations is verified, the TO will identify potential threats to those facilities and their primary control centers. A physical security plan for the identified facilities will be created and reviewed by an unaffiliated third party with expertise in physical security.
Essential Reliability Services The changing generation mix, along with the retirement of conventional generation, increasing demand response, and the introduction of distributed resources, can lead to the loss essential reliability services at both the micro and macro levels. NERC, through the Planning and Operating Committees, commissioned the ERS Task Force (ERSTF) in 2014 to define the reliability services and identify the quantity needed and required location of the services to maintain BPS reliability. The mission of the ERSTF is to provide a roadmap that ensures BPS reliability for the transition to a generation mix with a high penetration of renewables and reduced conventional and synchronous generation. Conventional generation (steam, hydro, and steam turbine technologies) inherently provides essential reliability services needed to reliably operate the BPS. NERC has identified the building blocks of these essential reliability services, which include voltage support, ramping capability, and frequency support. Generators must be able to continuously balance load and demand throughout the BPS to support transmission voltage and frequency response. Wind, solar, and other variable energy resources that are an increasingly greater share of the BPS provide a significantly lower level of essential reliability services than conventional generation. The ERSTF developed a concept paper21 to inform regulators and industry of essential reliability services affected by the integration of renewable resources and retirements of baseload generating plants. The ERSTF then developed four subgroups to review and develop a framework for measures for the essential services:
• Load and Resources Balance • Frequency Support • Voltage Support • Policy and Advisory
The ERSTF developed a Measures Framework Report that lists various measures slated to be evaluated by these subgroups. Five measures were endorsed by the Planning and Operating Committees to pilot by gathering data:
• Synchronous Inertial Response at an Interconnection Level • Synchronous Inertial Response at the Balancing Authority Level • Initial Frequency Deviation following largest contingency • Ramping Variability Needs • System Reactive and Voltage Support
The task force is also evaluating four other measures in parallel with the pilot. All these measures will be part of the overall recommendations to industry and policy makers. The review and analyses of the above-mentioned measures will be concluded at the end of 2015.
21 http://www.nerc.com/comm/Other/essntlrlbltysrvcstskfrcDL/ERSTF Concept Paper.pdf

NERC | State of Reliability Report 2015 | May 2015 17
Chapter 3 – Severity Risk Assessment and Availability Data
Systems Summary
Overview of SRI Analysis The SRI has been useful for measuring the performance of the BPS. During 2013, the Performance Analysis Subcommittee (PAS) undertook significant efforts to enhance and modify the SRI; those efforts are included in this report. All SRIs from prior years have been recalculated using the modified method for year-over-year comparisons. Key conclusions were:
All of the highest stress days were the result of extreme weather, notably the polar vortex event in the Eastern Interconnection and the significant pacific coast storms in the Western Interconnection.
The performance on the highest SRI days22 in 2014 were poorer than those recorded in many of the previous years, but are directly attributable to weather.
Load-loss events were not the primary driver of a high SRI day during 2014. In fact, all but two of the top-10 days for the year were driven by generator performance and, to a lesser extent, transmission outage performance attributed to weather, and they did not involve load loss.
There were only three high-stress days (SRI greater than 5.0) in 2014.
For SRI values less than 5.0, the average was slightly elevated compared with the prior four years; however, the daily variation was less.23
NERC Assessment Figure 3.1 captures the daily SRI values from 2010 to 2014. The SRI is comprised of three key components, notably Generation Severity, Transmission Severity, and Load-Loss Severity. For context throughout this report, each of these severity measures is calculated based on certain assumed and average values as outlined in the SRI white paper24 and do not rely on individual analyses that measured the specific impact of any given element’s function. In particular, Generation Severity reflects the unscheduled generation unavailability of a given unit with a plant capacity as a percentage of all available plant capacity. Transmission Severity reflects the unscheduled unavailability of a particular TADS element event, the impact of which is calculated by a voltage-weighted value divided by the total inventory of TADS elements. Load-Loss Severity is calculated as an average customer usage at peak for the day during which the load-loss event occurred. As the year-to-year performance is evaluated in Figure 3.1, certain portions of the graph become relevant for specific analysis. First, the left side of the graph, where the system has been substantially stressed, should be considered in the context of the prior years’ high-stress days. Next, the slope of the central part of the graph reveals year-to-year changes in performance for the majority of the days of the year and demonstrates routine system resilience. Finally, the right portion of the curve may also provide useful information about how many days with lower SRI occurred during any year compared to other years.
22 High-stress days are those days in which the BPS performance, as measured by the SRI, has experienced noteworthy impacts to any or
all of its components, specifically generation, transmission or load components. Based on past analysis, the count of days that exceed 5 (on the scale of 0 to 1000) are often memorable and may provide lessons learned opportunities. If no days exceed 5, the highest 10 days for the year are generally reviewed for their initiating causes.
23 For details of the statistical analysis of SRI see Appendix F. 24 Severity Risk Index, http://www.nerc.com/comm/PC/Performance Analysis Subcommittee PAS 2013/SRI Enhancement Whitepaper.pdf.
Chapter 3 – Severity Risk Assessment and Availability Data Systems Summary
NERC | State of Reliability Report 2015 | May 2015 18
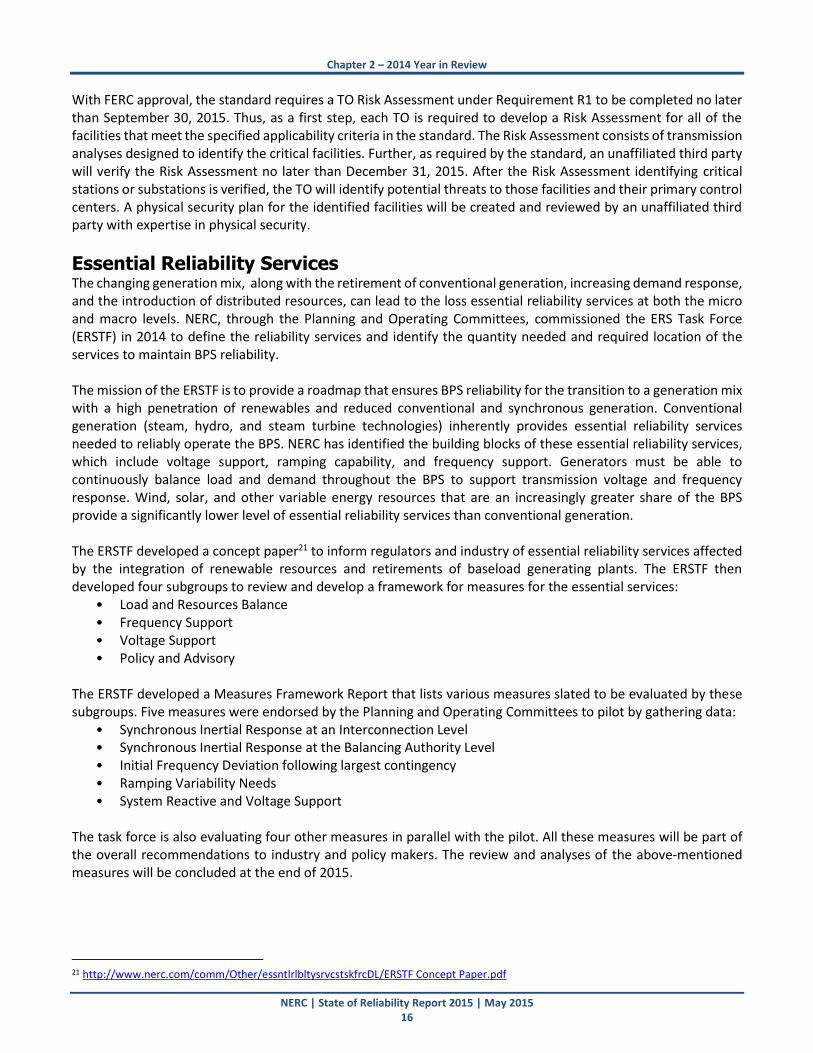
Figure 3.1: NERC Annual Daily Severity Risk Index (SRI) Sorted Descending
The inset shown in Figure 3.1 indicates that in 2014 there were three days for which SRI exceeded 5.0 (viewed as an indicator of a significant day). The first two, January 6 and 7, were associated with the highly discussed polar vortex (as were the eighth and tenth largest SRI days, January 3 and 8); the next one, on December 11, was associated with an extreme weather event in California. Table 3.1 lists the 10 event dates with the highest daily SRI values in 2014 and indicates the component contribution to the SRI. Separately, PAS reviewed OE-417 reports25 to evaluate the consistency between the load-loss calculation and the OE-417 notification results, and all but one were supported by OE-417 notifications.
25 https://www.oe.netl.doe.gov/oe417.aspx.

Chapter 3 – Severity Risk Assessment and Availability Data Systems Summary
NERC | State of Reliability Report 2015 | May 2015 19
Figure 3.2 shows each day’s SRI by day of year for 2010 through 2014. On a daily basis, a general normal range of performance exists. Days that were extreme can be detected by their significant deviation from that normal level. It is apparent that these extreme days happen throughout the year, although in 2014 they were heavily weighted within the winter season, as shown in Table 3.1. The top-10 SRI days for the study period are shown in Table 3.2. The Event Rank in Table 3.2 corresponds to the spike numbers in Figure 3.2.
Figure 3.2: NERC Daily SRI (2010–2014)

Chapter 3 – Severity Risk Assessment and Availability Data Systems Summary
NERC | State of Reliability Report 2015 | May 2015 20
Table 3.2: Top-10 SRI Days (2010–2014)
Event Rank as Indicated in chart above
Date Event Ranking
SRI Event Type
1 9/8/2011 1 14.0 Southwest Blackout
2 1/7/2014 2 11.1 Polar Vortex
3 2/2/2011 3 10.8 Cold Weather Event
4 6/29/2012 4 8.9 Thunderstorm Derecho
5 1/6/2014 5 8.0 Polar Vortex
6 10/30/2012 6 7.2 Hurricane Sandy
7 10/29/2012 7 7.0 Hurricane Sandy
8 4/27/2011 8 5.8 Tornadoes, Severe Storm
9 8/28/2011 9 5.6 Hurricane Irene
10 12/11/2014 10 5.0 Extreme Windstorm
Figure 3.3 shows the annual cumulative performance of the BPS. If a step change occurs on the graph, it represents a stress day as measured by the SRI. Thus, the more gentle and linear the slope of the cumulative curve, the better the performance of the system through the evaluation period. During 2014 it is apparent that the year began worse than any other year, but the balance of the year is somewhat similar to other years.
Figure 3.3: BPS Cumulative SRI (2010–2014)
Figure 3.4 breaks down the 2014 cumulative performance by BPS segment. The components are generation, transmission, and load loss, in that order. In Figure 3.4, the load-loss component shows day-to-day load-loss

Chapter 3 – Severity Risk Assessment and Availability Data Systems Summary
NERC | State of Reliability Report 2015 | May 2015 21
events but doesn’t demonstrate any significant step changes. As noted in previous state of reliability reports, unplanned generation unavailability is the largest contributor to daily SRI. Ongoing GADS analysis26 will help improve the understanding of how the generation fleet is performing. Additionally, further assessment of the SRI weighting factors should be considered to determine whether modifications to this measure are appropriate. Finally, with the significant role that weather played during 2014, additional studies should be completed to determine the extent of acceptable weather impacts to BPS performance. To the extent that weather is determined as a large impact to day-to-day and extreme-day performance, other metrics that report on load-loss events that retain weather impacts should be developed.
Figure 3.4: NERC Cumulative SRI by Component for 2014
26 http://www.nerc.com/pa/RAPA/gads/Pages/default.aspx.
Recommendations
NERC, through the PAS, should reevaluate SRI criteria to consider weather impacts.
NERC, through the PAS, should develop metrics that retain weather impacts on load-loss events.

Chapter 3 – Severity Risk Assessment and Availability Data Systems Summary
NERC | State of Reliability Report 2015 | May 2015 22
Overview of TADS Data Analysis A complete analysis of Transmission Availability Data System (TADS) data is presented in Appendix A. First, NERC performed an analysis of all TADS outage events (momentary and sustained). Then NERC limited the study to outage events that resulted in multiple transmission element outages (common or dependent-mode (CDM) events). Next, NERC performed a study on all outage events that lasted for more than a minute (defined as a sustained outage). Finally, NERC studied the transmission outage severity of TADS events by Regional Entity. This year was the first time that NERC performed these studies on sustained outages and Regional Entity variations. Figure 3.5 represents an analysis of the risk profile of the 2012–2014 TADS events combined study. The x-axis is the magnitude of the correlation of a given Initiating Cause Code (ICC) with transmission outage severity. The y-axis represents the expected transmission outage severity of an event when it occurs. The color of the marker indicates if there is a correlation of transmission outage severity with the given ICC (either positive— Red, negative—Green, or no significant correlation—Blue). The size of the marker indicates the probability of an event initiating in any hour with a given ICC. The Misoperation ICC (which represents TADS ICCs Failed Protection System Equipment and Human Error associated with Misoperations) and the Failed AC Substation Equipment ICC both show a statistically significant positive correlation with transmission outage severity and show a higher relative transmission risk. Power System Condition, while showing a positive correlation of transmission outage severity, has a lower relative transmission risk, based on the probability of this TADS outage event initiating in any hour and its expected transmission outage severity. On the other end of the risk spectrum, Lightning shows a high relative transmission risk but has no significant correlation with transmission outage severity.

Chapter 3 – Severity Risk Assessment and Availability Data Systems Summary
NERC | State of Reliability Report 2015 | May 2015 23
Figure 3.5: Risk Profile of the 2012–2014 TADS Events by ICC
The statistical analysis of the 2012–2014 TADS data on the transmission outage severity and initiating causes of TADS outage events yields the following observations:
Excluding weather-related and Unknown ICCs, Misoperations and Failed AC Substation Equipment remain the two largest contributors to transmission outage severity risk for all TADS events (momentary and sustained) and all sustained TADS events.
TADS outage events initiated by either of these ICCs have statistically significant higher expected outage severity than all other TADS outage events.
Among other ICCs, only Power System Condition has a statistically significant positive correlation with transmission outage severity, but events initiated by this reported cause are less frequent and together contribute only 2.9 percent to the total transmission outage severity of the 2012–2014 TADS events.
Statistical tests show that the average transmission outage severity of the events initiated by both Misoperations and Failed AC Substation Equipment significantly decreased in 2014 versus 2012.

Chapter 3 – Severity Risk Assessment and Availability Data Systems Summary
NERC | State of Reliability Report 2015 | May 2015 24
Sustained TADS outage events with Unknown ICCs require further review by the TADS Working Group (TADSWG) to determine:
o The sustained outage events that have an Unknown ICC, and
o The relative risk of events with both an ICC and sustained cause code of Unknown.
The ICCs of TADS outage events are very different by Region.
Overview of GADS Data Analysis A complete analysis of GADS data is presented in Appendix B. An analysis of the age of the existing fleet shows:
There is an age bubble around 39–47 years, and that population is driven by coal and some gas units.
There is a significant age bubble around 11–13 years comprised almost exclusively of gas units.
The data set shows a clear shift toward gas-fired unit additions, and the overall age of that fleet across North America is almost 10 years younger than the age of the coal-fired baseload plants that have been the backbone of power supply for many years. This is a trend that is projected to continue given current forecasts around price and availability of natural gas as a power generation fuel. To understand generator performance, NERC reviewed the top-10 causes of unit outages for the summer and winter seasons, as well as the annual causes, for the 2012–2014 period. The analysis focused on the top causes for non-weather-related outages, measured in terms of lost MWh, so it captures both the amount of capacity during the outage and the duration of the outages. Although only three years of data is available, some observations were made:
In calendar year 2014, lack of fuel was one of the top-10 causes of generator outages and the second-most frequent cause in winter months. This was the first time that this type of outage placed in the top 10.
Energy lost during summer has remained relatively consistent over the three-year period.
Generally, energy lost in the winter season is greater than other periods of the year.
The energy lost in the 2014 winter showed a significant increase driven in large part by outages related to the polar vortex.
The sharp increase in the annual value of lost energy reported in 2014 was driven by the winter seasonal outages.
Overview of DADS Data Analysis A complete analysis of Demand Response Availability Data System (DADS) data is presented in Appendix C. Mandatory collection of detailed demand response data began with the 2011 Summer Period. A review of the summer period data was provided in the 2012 State of Reliability report. Since 2012, the DADS Working Group (DADSWG) has been working to improve the data quality and process within DADS. Actions taken in the last year include:
Revising the DADS glossary of definitions,
Streamlining event type reporting,
Implementing changes to the webDADS portal, and
Updating the historically reported event type to align with revised terms.

Chapter 3 – Severity Risk Assessment and Availability Data Systems Summary
NERC | State of Reliability Report 2015 | May 2015 25
An analysis of the DADS data for 2014 provides the following observations:
The registered demand response capacity for all product service types was 44,285 MW for August 2013 and 44,583 MW for 2014, an increase of less than 1 percent.
Load as a Capacity Resource appears to be the most common use of demand response resources for reliability (66 percent in 2013 and 58 percent in 2014), followed by Direct Control Load Management.
The impact of the polar vortex is evident in the number of days that demand response was dispatched and the number of affected areas in January 2014.
Across North America, demand response is used an average of six times a month to respond to reliability events, dispatching an average of 500 MW each month.

NERC | State of Reliability Report 2015 | May 2015 26
Chapter 4 – Reliability Indicator Trends
Reliability Indicator Trends – Summary NERC Reliability Indicators are intended to tie the performance of the BPS to the set of specified objectives and outcomes for the NERC Reliability Performance Objectives to measure whether an adequate level of reliability (ALR) exists. Based on the events that occurred in 2014 and the metrics data analyzed, the system shows a continuing trend toward sustaining a high level of reliability performance. One of the stated purposes for the ALR indicators is for the NERC Performance Analysis Subcommittee (PAS) to assess BES reliability and identify gaps in performance and data collection. In 2014, the PAS focused on aligning the existing reliability indicators with the new BES definition.27 This included evaluating existing metrics to determine those that should continue (with possible modification) and those that should be retired. The PAS also evaluated whether new metrics should be developed. Table 4.1 shows the mapping of the 14 metrics monitored in 2014 to the seven Reliability Performance Objectives of the ALR definition approved in 2012.28 In 2013, the PAS introduced a new naming convention (M-x) for the existing 14 metrics shown below. This naming convention was first introduced in the State of Reliability 2013 report. Both metric naming conventions (M-x and ALRxx) are used in this chapter, but in future reports, the new metric names will be used.
Table 4.1 Adequate Level of Reliability Metrics Reliability
Performance Objectives
System Stability
System Frequency
System Voltage
Manage Contingencies
Coordinate Restoration
Transmission Adequacy
Resource Adequacy
New ID (ALR Metrics)
M-2 (ALR1-4) M-4 (ALR1-12) M-9 (ALR4-1)
M-4 (ALR1-12) M-6 (ALR2-4)
M-2 (ALR1-4) M-6 (ALR2-4) M-7 (ALR2-5) M-8 (ALR3-5)
M-11 (ALR6-2)
M-2 (ALR1-4) M-11(ALR6-2)
M-2 (ALR1-4) M-8 (ALR3-5)
M-10 (ALR6-1) M-12(ALR6-11) M-13(ALR6-12) M-14(ALR6-13) M-15(ALR6-14) M-16(ALR6-15)
M-1 (ALR1-3) M-11(ALR6-2)
These metrics exist within a reliability framework. The current 14 performance metrics align with the performance objectives for the design, planning, and operation of the BES. These metrics contribute to the Reliability Performance Objectives, which will lead to a more resilient and reliable BES. There is at least one existing performance metric associated with each of the performance objectives listed in the table, except system voltage. The existing metric for system voltage performance M-3 (ALR 1-5) was retired in 2014. Efforts are underway to develop one or more metrics to more effectively determine system voltage performance. The definition of ALR speaks to the state of the BES in which the Performance Objectives are met. It is therefore intuitive that one could not base such an assessment of reliability on one metric only. Rather, it is necessary to look at the entire set of metrics to evaluate that the ALR state has been attained. Any comparisons of individual metrics alone or between Regions, or to value one metric higher than another, should be evaluated with care.
27 http://www.nerc.com/pa/Stand/Pages/Project2010-17_BES.aspx. 28 Definition of “Adequate Level of Reliability,”
http://www.nerc.com/comm/Other/Adequate Level of Reliability Task Force ALRTF DL/Final Documents Posted for Stakeholders and Board of Trustee Review/10_04_12_ALR_Definition_clean.pdf (The last two performance objectives relate to planning assessments, which are not covered in the report).

Chapter 4 – Reliability Indicator Trends
NERC | State of Reliability Report 2015 | May 2015 27
Another metric reporting principle is to retain anonymity of individual reporting organizations. Thus, details are presented in this report at a NERC level, and a Regional Entity level, and do not compromise anonymity of individual reporting organizations.
Process Overview Building upon previous metric reviews, the results of the approved performance metrics continue to be assessed. Each metric is designed to provide a measure of one or more Reliability Performance Objectives. Due to varying data availability, each of the performance metrics does not address the same time period (some metrics have just been established or modified, while others represent data collected over many years). At this time, the number of metrics is expected to remain relatively stable; however, the PAS annually reviews the set of metrics and, working with industry subject matter experts, may recommend changes to metrics, or new metrics, as gaps are identified in reliability data needed to assess the state of reliability of the BES. In 2014, The PAS performed this review, which resulted in the retirement of metrics ALR1-5 and ALR2-3 and the modification of several others. Specific changes to metrics that were approved in 2014 and those that are ongoing will be described in greater detail in this section. Table 4.2 provides an overview of the ALR metric trends through 2014. Although a number of performance categories have been assessed, some do not yet have sufficient data to derive conclusions from the metric results. Assessment of these metrics should continue as additional data becomes available to determine if the metric is a good indicator of the performance objective it is meant to measure. As indicated below, most of the ALR metrics have been revised in the past two years.
Trend Rating Symbols
Significant Improvement
Slight Improvement
No Change
Inconclusive/Mixed *
Slight Deterioration
Significant Deterioration
New Data ***
Incomplete dataset/not enough to draw any conclusion **
Retired N/A

Chapter 4 – Reliability Indicator Trends
NERC | State of Reliability Report 2015 | May 2015 28
The following provides a discussion of each metric and activity on certain metrics where changes have been implemented and those that are associated with key findings. The full set of metrics and their descriptions, along with the results and trending, are on the NERC public website.29
M-2 (ALR1-4) BPS Transmission-Related Events Resulting in Loss of Load
Background This metric measures BPS transmission-related events resulting in the loss of load, excluding weather-related outages. Planners and operators can use this metric to validate their design and operating criteria by identifying the number of instances when loss of load occurs. For the purposes of this metric and consistent with the revised metric approved by the Operating and Planning Committees in March, 2014, an “event” is an unplanned disturbance that produces an abnormal system condition due to equipment failures/system operational actions (either intentional or unintentional) that result in the loss of firm system demands, utilizing the subset of data provided in accordance with EOP-004-2. The reporting criteria for such events beginning with data for events occurring in 2013 are outlined below:30
1. Loss of firm load for 15 minutes or more: a. 300 MW or more for entities with previous year’s demand of 3,000 MW or more. b. 200 MW or more for all other entities.
29 Assessments & Trends: Reliability Indicator, http://www.nerc.com/pa/RAPA/Pages/ReliabilityIndicators.aspx. 30 http://www.nerc.com/pa/rrm/ea/EA Program Document Library/Final_ERO_EA_Process_V2.1.pdf.
Table 4.2: Metric Trends
Metric Description Trend Rating
M-2 (ALR1-4) BPS Transmission-Related Events Resulting in Loss of Load (modified in early 2014)
M-3 (ALR1-5) System Voltage Performance (discontinued in 2014) N/A M-4 (ALR1-12) Interconnection Frequency Response * M-5 (ALR2-3) Activation of Underfrequency Load Shedding (discontinued in 2014) N/A M-6 (ALR2-4) Average Percent Non-Recovery Disturbance Control Standard Events * M-7 (ALR2-5) Disturbance Control Events Greater than Most Severe Single
Contingency
M-8 (ALR3-5) Interconnected Reliability Operating Limit/System Operating Limit (IROL/SOL) Exceedances (modified in 2013)
*
M-9 (ALR4-1) Correct Protection System Operations
M-10 (ALR6-1) Transmission Constraint Mitigation **
M-11(ALR6-2) Energy Emergency Alerts (modified in 2013) M-12 (ALR6-11) Automatic AC Transmission Outages Initiated by Failed Protection
System Equipment (modified in late 2014) **
M-13 (ALR6-12) Automatic AC Transmission Outages Initiated by Human Error (modified in late 2014)
**
M-14 (ALR6-13) Automatic AC Transmission Outages Initiated by Failed AC Substation Equipment (modified in late 2014)
**
M-15 (ALR6-14) Automatic AC Transmission Outages Initiated by Failed AC Circuit Equipment (modified in late 2014)
**
M-16 (ALR6-15) Element Availability Percentage (APC) and Unavailability Percentage (modified in 2013)
**

Chapter 4 – Reliability Indicator Trends
NERC | State of Reliability Report 2015 | May 2015 29
2. BES Emergency requiring manual firm load shedding of 100 MW or more. 3. BES Emergency resulting in automatic firm load shedding of 100 MW or more (via automatic under
voltage or under frequency load shedding schemes, or SPS/RAS). 4. Transmission loss event with an unexpected loss within an entity’s area, contrary to design, of three or
more BES Elements caused by a common disturbance (excluding successful automatic reclosing) resulting in a firm load loss of 50 MW or more.
This metric was reviewed by the PAS in 2013, and changes were made to make the criteria consistent with the approved changes to EOP-004-2 reporting criteria pertaining to transmission-related events that result in loss of load. The criteria presented above were approved for implementation in the first quarter of 2014. Changes in the annual measurement between 2012 and 2013 therefore reflect the addition of criterion 4, which has been applied to the 2013 and 2014 data. For the first part of the analysis below, historical data back to 2002 was used, and the new criterion 4 was not included, to enable trending of the other aspects of the metric over time. Figure 4.3 includes all of the criteria; therefore, it was only evaluated for 2013 and 2014, the time period for which data collection associated with the new criterion was available.
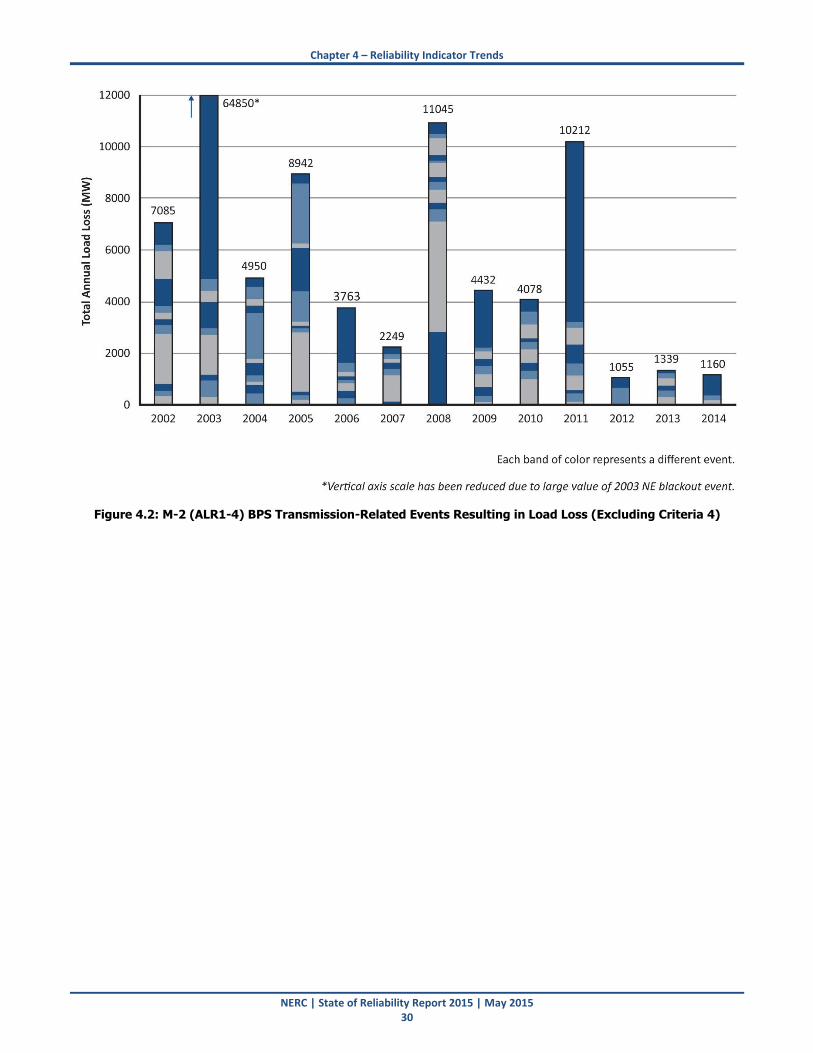
Assessment Figure 4.1 shows the number of BPS transmission-related events resulting in loss of firm load from 2002 to 2014. Figure 4.2 provides a breakdown of the events per year by load interrupted. In 2014, there were fewer events than any other year in the data set except for 2012. The year 2014 has the second-lowest average level of load lost in megawatts of all years for which data exists, with three events resulting in 1160 MW of load lost. With three years of data indicating that the number and megawatt load loss amount for the past three years is significantly less than previous years, M-2 has shown marked improvement over the assessment period.
Figure 4.1: M-2 (ALR1‐4) BPS Transmission-Related Events Resulting in Load Loss (2002–2014 – Excluding
Criteria 4)
Chapter 4 – Reliability Indicator Trends
NERC | State of Reliability Report 2015 | May 2015 30
Figure 4.2: M-2 (ALR1-4) BPS Transmission-Related Events Resulting in Load Loss (Excluding Criteria 4)

Chapter 4 – Reliability Indicator Trends
NERC | State of Reliability Report 2015 | May 2015 31
Table 4.3 shows total megawatt loss values and duration of events resulting in firm load loss of 50 MW or greater and includes all four criteria for this metric. This table shows that in 2014, in addition to the three events that were reported and shown in Figures 4.1 and 4.2 under criteria 1, 2, and 3, there were three additional events that were associated with the new criterion. While Figures 4.1 and 4.2 show 2014 transmission-related load-loss events based on the historical metric language, Table 4.3 shows what the number and load loss would be for transmission-related load loss events in 2013 and 2014. Further analysis and continued assessment of the trends over time will continue.
Table 4.3: 2013 and 2014 Events with Load Loss
≥ 50 MW (Including Criteria 4)
Duration (hours) 2013 2014
3.83 300
2.73 240
10.33 200
1.5 297
1.63 200
1.25 102
3.03 51
3.82 90
7.27 90
2.82 70
1.3 50
3 797
1.7 200
1.67 163
0.83 95
0.97 71
1.02 63
Special Considerations The collected data does not indicate whether load loss during an event occurred as designed. Data collection will be refined in the future for this metric to allow enable data grouping into categories, such as separating load loss as designed from unexpected firm load loss. Also, differentiating between load loss as a direct consequence of an outage compared to load loss as a result of an operator-controlled action to mitigate an IROL/SOL exceedance should be considered.
M-3 (ALR1-5) System Voltage Performance
Background This metric was removed from the monitored set in 2014 and will no longer be included in future reports. Data collection consisted of the total number of key buses/nodes being monitored at 345 kV and above, the total number of minutes by quarter that the voltage was either above the predetermined upper threshold or below the predetermined lower threshold. With more than two years of data collected and reviewed, the PAS determined that there was insufficient information about voltage performance in the collected data for the M-3 metric and data collection has been discontinued.
Chapter 4 – Reliability Indicator Trends
NERC | State of Reliability Report 2015 | May 2015 32
Future Development In 2014, NERC established the Essential Reliability Services Task Force (ERSTF), a team tasked with identifying those Essential Reliability Services that are the elemental reliability building blocks necessary to maintain BPS reliability and associated measures. The ERSTF has recommended a measure31 that was approved by the Operating Committee (OC) and Planning Committee (PC) for data collection and testing, which may support development of new voltage and reactive support metrics going forward.
M-4 (ALR1-12) Interconnection Frequency Response
Background The purpose of this metric is to monitor interconnection frequency response, which is a measure of an interconnection’s ability to stabilize frequency immediately following the sudden loss of generation or load. It is a critical component to the reliable operation of the BPS, particularly during disturbances. The metric measures the average frequency response for all events where frequency deviates more than the interconnection’s defined threshold. The following are frequency response calculations of the Eastern, Western, ERCOT, and Québec Interconnections. Figure 4.3 shows the criteria for calculating average values A and B used to report frequency response. The event starts at time t±0. Value A is the average from t-16 to t-2 seconds, and Value B is the average from t+20 to t+52 seconds. The difference of value A and B is the change in frequency32 used for calculating frequency response. The monthly frequency event candidate lists are posted on the NERC Resources Subcommittee33 website. These lists are vetted by the NERC Frequency Working Group and the final list is published on a quarterly basis. The data is used to support Reliability Standard BAL-003-1. The frequency event data collection process is described in the BAL-003-1 Frequency Response Standard Supporting Document.34
31 http://www.nerc.com/comm/Other/essntlrlbltysrvcstskfrcDL/ERSTF - Framework for Measures Report January 2015 - Final.pdf. 32 ALR1-12 Frequency Response Data Collections Process, Slide 18 of Presentation 1, 10/26-27/2011
http://www.nerc.com/docs/oc/rs/RS_Presentation_October_2011.pdf. 33 Resource Subcommittee (RS), http://www.nerc.com/comm/OC/Pages/Resources-Subcommittee-(RS)-2013.aspx. 34 BAL-003-1 Frequency Response & Frequency Bias Setting Standard, 07/18/2011,
http://www.nerc.com/FilingsOrders/us/FERCOrdersRules/NOPR_Proposal for BAL-003-1.pdf.

Chapter 4 – Reliability Indicator Trends
NERC | State of Reliability Report 2015 | May 2015 33
Figure 4.3: Criteria for Calculating Value A and Value B
The actual megawatt loss from a generation frequency event is determined jointly by NERC and Regional Entity situation awareness staff to develop the monthly frequency event candidate list. Both the change in frequency and the megawatt loss determine whether the event qualifies for further consideration for use in the M-4 metric or for the measurement of BA performance under Reliability Standard BAL-003-1 by the NERC Frequency Working Group. If the event qualifies, then the actual MW loss is converted to a beta value (MW/.1 Hz) for use in Figure 4.3 above. The final monthly datasets of approved frequency events35 are then used to analyze the interconnection frequency response performance. In examining the frequency event selection process, NERC staff found that process to be too restrictive in event selection. The Resources Subcommittee and NERC staff have made recommendations to improve the process for selecting frequency events.36
35 Starting in 2014, all frequency events selected for use in BAL-003 shall be also used for the ALR 1-12 frequency performance metric. 36 http://www.nerc.com/FilingsOrders/us/NERC Filings to FERC DL/Final_Info_Filing_Freq_Resp_Annual_Report_03202015.pdf

Chapter 4 – Reliability Indicator Trends
NERC | State of Reliability Report 2015 | May 2015 34
Table 4.4 shows a proposed set of revisions to the event detection and selection triggers for M-4.
Table 4.4: ALR 1-12 Frequency Event Candidate Triggers
Interconnection
Detection Selection
MW Load Loss37
MW Resource
Loss
MW Load Loss34
MW Resource
Loss
Eastern 800 750 800 800
Western 700 650 700 700
ERCOT 450 400 450 450
Québec 450 400 450 450
The recommended criteria for frequency events also include the following:
All BAL-003-1 frequency events should be a subset of the ALR 1-12 event set.
All event detection windows are to remain at 15-second rolling windows.
No change is recommended to the BAL-003-1 event selection process.
Actual net megawatt loss will be verified for each megawatt loss event. Megawatt changes for load loss or pumped storage load rejection events will rely on FNet38 estimates until better data sources become available.
Data for all candidate events will be collected from the FNet system (Values A and B, Point C, Point C’, and 300 seconds of high-speed frequency data surrounding the event). These data will be stored in a database for use in the annual analysis.
Events could be triggered from several sources: o The FNet system alarms o Reliability Coordination Information System (RCIS) messages o E-mail o Telephone calls
Screen only actual megawatt change against the megawatt criteria.
No criteria will be applied on frequency change parameters, allowing for purer statistical analysis of interconnection performance.
Weekly reviews will be conducted by NERC staff to screen candidate events for ALR 1-12 selection.
Investigate the potential for applying a T=+0 to Point C slope (arresting slope) criteria to eliminate shallow slopes that may not be reflective of primary frequency response.
Data errors were determined to have existed in the 2013 data set; however, this did not alter the findings of the report. It changed one slightly negative trend to a positive one and resulted in key information being
37 Or Pumped-Storage Load Rejection. 38 Operated by the Power Information Technology Laboratory at the University of Tennessee, FNet is a low-cost, quickly deployable GPS-
synchronized wide-area frequency measurement network. High dynamic accuracy Frequency Disturbance Recorders (FDRs) are used to measure the frequency, phase angle, and voltage of the power system at ordinary 120 V outlets. The measurement data are continuously transmitted via the Internet to the FNet servers hosted at the University of Tennessee and Virginia Tech.
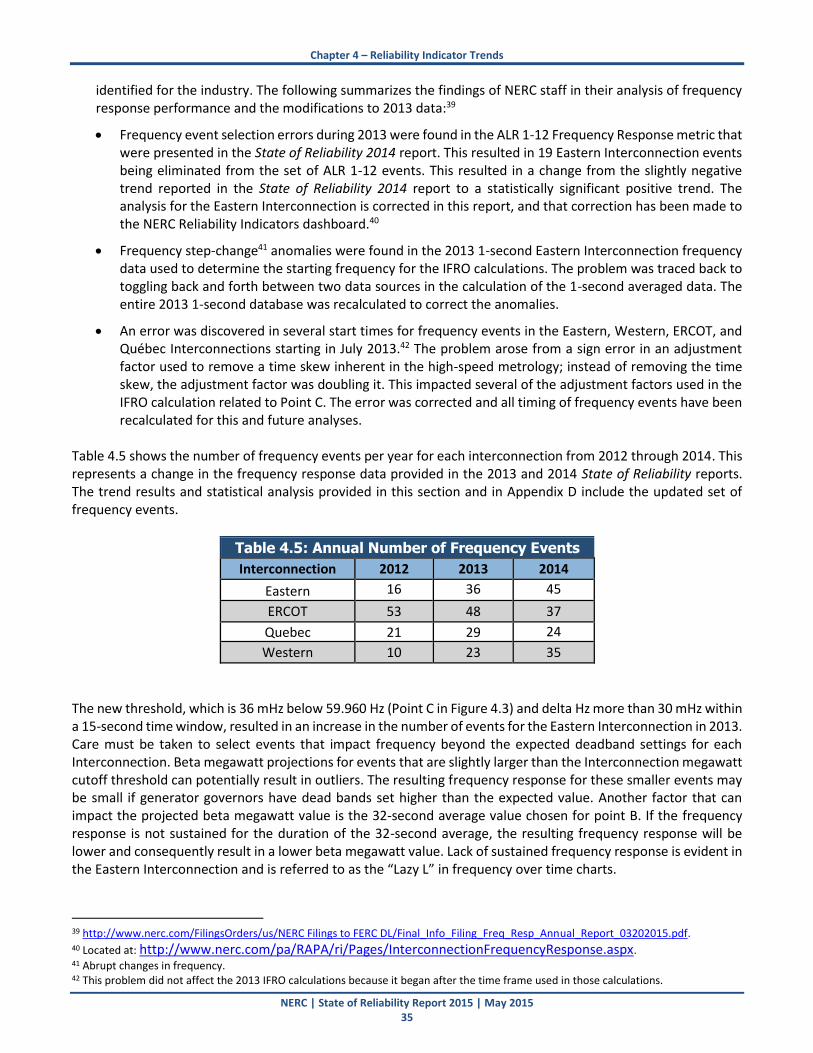
Chapter 4 – Reliability Indicator Trends
NERC | State of Reliability Report 2015 | May 2015 35
identified for the industry. The following summarizes the findings of NERC staff in their analysis of frequency response performance and the modifications to 2013 data:39
Frequency event selection errors during 2013 were found in the ALR 1-12 Frequency Response metric that were presented in the State of Reliability 2014 report. This resulted in 19 Eastern Interconnection events being eliminated from the set of ALR 1-12 events. This resulted in a change from the slightly negative trend reported in the State of Reliability 2014 report to a statistically significant positive trend. The analysis for the Eastern Interconnection is corrected in this report, and that correction has been made to the NERC Reliability Indicators dashboard.40
Frequency step-change41 anomalies were found in the 2013 1-second Eastern Interconnection frequency data used to determine the starting frequency for the IFRO calculations. The problem was traced back to toggling back and forth between two data sources in the calculation of the 1-second averaged data. The entire 2013 1-second database was recalculated to correct the anomalies.
An error was discovered in several start times for frequency events in the Eastern, Western, ERCOT, and Québec Interconnections starting in July 2013.42 The problem arose from a sign error in an adjustment factor used to remove a time skew inherent in the high-speed metrology; instead of removing the time skew, the adjustment factor was doubling it. This impacted several of the adjustment factors used in the IFRO calculation related to Point C. The error was corrected and all timing of frequency events have been recalculated for this and future analyses.
Table 4.5 shows the number of frequency events per year for each interconnection from 2012 through 2014. This represents a change in the frequency response data provided in the 2013 and 2014 State of Reliability reports. The trend results and statistical analysis provided in this section and in Appendix D include the updated set of frequency events.
Table 4.5: Annual Number of Frequency Events
Interconnection 2012 2013 2014
Eastern 16 36 45
ERCOT 53 48 37
Quebec 21 29 24
Western 10 23 35
The new threshold, which is 36 mHz below 59.960 Hz (Point C in Figure 4.3) and delta Hz more than 30 mHz within a 15-second time window, resulted in an increase in the number of events for the Eastern Interconnection in 2013. Care must be taken to select events that impact frequency beyond the expected deadband settings for each Interconnection. Beta megawatt projections for events that are slightly larger than the Interconnection megawatt cutoff threshold can potentially result in outliers. The resulting frequency response for these smaller events may be small if generator governors have dead bands set higher than the expected value. Another factor that can impact the projected beta megawatt value is the 32-second average value chosen for point B. If the frequency response is not sustained for the duration of the 32-second average, the resulting frequency response will be lower and consequently result in a lower beta megawatt value. Lack of sustained frequency response is evident in the Eastern Interconnection and is referred to as the “Lazy L” in frequency over time charts.
39 http://www.nerc.com/FilingsOrders/us/NERC Filings to FERC DL/Final_Info_Filing_Freq_Resp_Annual_Report_03202015.pdf. 40 Located at: http://www.nerc.com/pa/RAPA/ri/Pages/InterconnectionFrequencyResponse.aspx. 41 Abrupt changes in frequency. 42 This problem did not affect the 2013 IFRO calculations because it began after the time frame used in those calculations.
Chapter 4 – Reliability Indicator Trends
NERC | State of Reliability Report 2015 | May 2015 36
On February 5, 2015, NERC issued an Industry Advisory on generator governor frequency response.43 NERC determined that a significant portion of the Eastern Interconnection generator dead bands or governor control settings inhibit or prevent frequency response. With the exception of nuclear generators, entities with generators greater than 75 MVA were advised to review generator governor and Distributed Control System (DCS) settings to conform to specifications mentioned in the Advisory.
Assessment NERC annually applies statistical tests to interconnection frequency response datasets,44 and additional analyses on time of year, load levels, and other attributes have been conducted annually since 2013. Frequency response is the absolute value of the ratio of the megawatts lost when generation is tripped and the difference in frequency before and after the event. A large value of frequency response is considered better than a small value.
Frequency Response Trending From 2012 through 2014, the historical frequency response shows the following trends:
Frequency response performance in ERCOT and the Western Interconnection was stable, with a time trend being statistically flat.
Frequency response in the Eastern Interconnection has shown a statistically significant improvement with the average monthly rate of increase of 15.0 MW/0.1 Hz.
The Québec Interconnection experienced a statistically significant decline with the average monthly rate of decrease of 6.8 MW/0.1 Hz.
The differences in the evaluations of the frequency response performance compared with the State of Reliability 2014 report are due to the addition of the 2014 data, and also to a removal of the 2009–2011 data (based on new selection criteria) and a major revision of the 2012–2013 data as described above. Still, the current three-year datasets are relatively small, and a future addition of annual frequency response values might change the trends.
Statistical Significance Test Results Statistical significance tests were applied to Interconnection frequency response datasets, and additional analysis on time of year, load levels, and other attributes were also conducted. Following are the overall observations and test results:
The Eastern Interconnection frequency response has shown a statistically significant increase from 2012 to 2014, with an average monthly rate of increase of 15.0 MW/0.1 Hz.45
The ERCOT Interconnection frequency response was stable from 2012 to2014, with a statistically flat time trend.46
43 http://www.nerc.com/pa/rrm/bpsa/Alerts DL/2015 Alerts/NERC Alert A-2015-02-05-01 Generator Governor Frequency Response.pdf. 44 Datasets described in the Frequency Response Initiative Report, October 2012 http://www.nerc.com/docs/pc/FRI_Report_10-30-12_Master_w-appendices.pdf. 45 The correlation between time variable and frequency response is positive ,and this is equivalent to the fact that the slope is positive and
the trend line is increasing function with the average monthly growth of 15.0 MW/Hz*0.1; moreover, the correlation is statistically significant (p=0.03). This leads to the rejection of the null hypothesis of zero correlation. So, the observed increasing trend for frequency response unlikely occurred by chance.
46 The correlation between time variable and frequency response is positive and this is equivalent to the fact that the slope is e and the trend line is increasing function. However, the correlation is not statistically significant. This leads to the failure to reject the null hypothesis of zero correlation. So even though the increasing trend for frequency response in time was observed, there is a high probability that the positive correlation and the positive slope occurred by chance.
Chapter 4 – Reliability Indicator Trends
NERC | State of Reliability Report 2015 | May 2015 37
The Québec Interconnection frequency response experienced a statistically significant decline in 2012–2014, with an average monthly rate of decrease of 6.8 MW/0.1 Hz.47
The Western Interconnection frequency response was stable from 2012 to –2014, with a statistically flat time trend.48
The statistical analysis of the observed trends can be found in Appendix D.
47 The correlation between time variable and frequency response is negative, and this is equivalent to the fact that the slope is negative
and the trend line is a decreasing function with the average monthly decrease of 6.8 MW/Hz*0.1; moreover, the correlation is statistically significant (p=0.007). This leads to the rejection of the null hypothesis of zero correlation. So, the observed decreasing trend for frequency response unlikely occurred by chance.
48 The correlation between time variable and frequency response is negative and this is equivalent to the fact that the slope is negative and the trend line is decreasing function. However, the correlation is not statistically significant. This leads to the failure to reject the null hypothesis of zero correlation. So even though the decreasing trend for frequency response in time was observed, there is a high probability that the negative correlation and the negative slope occurred by chance.
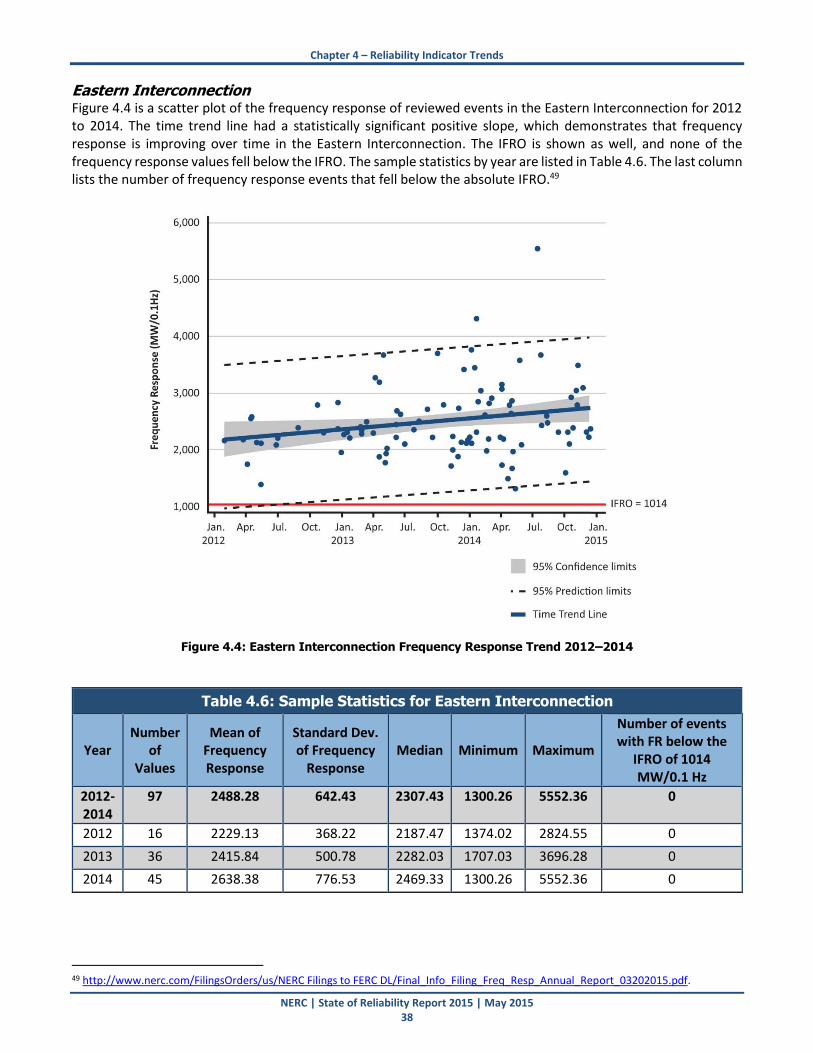
Chapter 4 – Reliability Indicator Trends
NERC | State of Reliability Report 2015 | May 2015 38
Eastern Interconnection Figure 4.4 is a scatter plot of the frequency response of reviewed events in the Eastern Interconnection for 2012 to 2014. The time trend line had a statistically significant positive slope, which demonstrates that frequency response is improving over time in the Eastern Interconnection. The IFRO is shown as well, and none of the frequency response values fell below the IFRO. The sample statistics by year are listed in Table 4.6. The last column lists the number of frequency response events that fell below the absolute IFRO.49
Figure 4.4: Eastern Interconnection Frequency Response Trend 2012–2014
Table 4.6: Sample Statistics for Eastern Interconnection
Year Number
of Values
Mean of Frequency Response
Standard Dev. of Frequency
Response Median Minimum Maximum
Number of events with FR below the
IFRO of 1014 MW/0.1 Hz
2012-2014
97 2488.28 642.43 2307.43 1300.26 5552.36 0
2012 16 2229.13 368.22 2187.47 1374.02 2824.55 0
2013 36 2415.84 500.78 2282.03 1707.03 3696.28 0
2014 45 2638.38 776.53 2469.33 1300.26 5552.36 0
49 http://www.nerc.com/FilingsOrders/us/NERC Filings to FERC DL/Final_Info_Filing_Freq_Resp_Annual_Report_03202015.pdf.

Chapter 4 – Reliability Indicator Trends
NERC | State of Reliability Report 2015 | May 2015 39
Western Interconnection Figure 4.5 is a scatter plot of the frequency response of reviewed events in the Western Interconnection from 2012 to 2014. The time trend line had a nonsignificant negative slope, which demonstrates that frequency response has been stable from 2012 through 2014 in the Western Interconnection. The sample statistics by year are listed in Table 4.7. The last column lists the number of frequency response events that fell below the absolute IFRO.50 In 2012–2014, there were four occurrences of frequency response events with values below the IFRO, which is 907 MW/0.1 Hz.
Figure 4.5: Western Interconnection Frequency Response Trend 2012–2014
Table 4.7: Sample Statistics for Western Interconnection
Year Number
of Values
Mean of Frequency Response
Standard Dev. of Frequency
Response Median Minimum Maximum
Number of events with FR below the
IFRO of 907 MW/0.1 Hz
2012-2014
68 1419.06 444.92 1336.80 798.34 3439.70 4
2012 10 1590.47 677.49 1396.43 1120.51 3439.70 0
2013 23 1489.99 421.93 1463.11 821.85 2850.99 1
2014 35 1323.47 363.24 1265.64 798.34 2695.58 3
50 http://www.nerc.com/FilingsOrders/us/NERC Filings to FERC DL/Final_Info_Filing_Freq_Resp_Annual_Report_03202015.pdf

Chapter 4 – Reliability Indicator Trends
NERC | State of Reliability Report 2015 | May 2015 40
ERCOT Interconnection Figure 4.6 is a scatter plot of the frequency response of reviewed events in the ERCOT Interconnection from 2012 to 2014. The time trend line had a nonsignificant positive slope, which demonstrates that frequency response has been stable from 2012 through 2014 in the ERCOT Interconnection. The sample statistics by year are listed in Table 4.8. The last column lists the number of frequency response events that fell below the absolute IFRO.51 In 2012–2014 there were 21 occurrences of frequency response events with values below the IFRO, which is 471 MW/0.1 Hz.
Figure 4.6: ERCOT Frequency Response Trend 2012–2014
Table 4.8: Sample Statistics for ERCOT Interconnection
Year Number of Values
Mean of Frequency Response
Standard Dev. of
Frequency Response
Median Minimum Maximum
Number of events with FR below the
IFRO of 471 MW/0.1 Hz
2012-2014
138 809.70 661.67 663.83 336.77 5530.50 21
2012 53 650.58 386.28 577.88 336.77 3082.64 12
2013 48 921.60 777.52 745.51 406.60 5530.50 5
2014 37 892.45 774.79 725.26 425.66 4879.72 4
51 http://www.nerc.com/FilingsOrders/us/NERC Filings to FERC DL/Final_Info_Filing_Freq_Resp_Annual_Report_03202015.pdf

Chapter 4 – Reliability Indicator Trends
NERC | State of Reliability Report 2015 | May 2015 41
Québec Interconnection Figure 4.7 is a scatter plot of the frequency response of reviewed events in the Québec Interconnection for 2012–2014. The time trend line had a statistically significant negative slope, which demonstrates that frequency response is decreasing over time in the Québec Interconnection. The sample statistics by year are listed in Table 4.9. The last column lists the number of frequency response events that fell below the absolute IFRO.52
Figure 4.7: Québec Interconnection Frequency Response Trend 2012–2014
Table 4.9: Sample Statistics for Quebec Interconnection
Year Number
of Values
Mean of Frequency Response
Standard Dev. of
Frequency Response
Median Minimum Maximum
Number of events with
FR below the IFRO of 183 MW/0.1 Hz
2012-2014 74 591.8 220.6 526.9 288.3 1673.6
0
2012 21 656.2 268.0 635.0 397.2 1673.6 0
2013 29 606.5 192.2 545.9 389.1 1227.8 0
2014 24 517.7 192.8 465.1 288.3 1212.4 0
52 http://www.nerc.com/FilingsOrders/us/NERC Filings to FERC DL/Final_Info_Filing_Freq_Resp_Annual_Report_03202015.pdf.

Chapter 4 – Reliability Indicator Trends
NERC | State of Reliability Report 2015 | May 2015 42
Relation to Interconnection Frequency Response Obligations The expected frequency response for each interconnection was compared to their respective IFROs from the 2014 Frequency Response Annual Analysis. In all cases, the statistically expected frequency response for each interconnection has been greater than the recommended absolute IFRO values.53 The historical frequency responses show the following:
There were no events during the assessment period for which the frequency response of the Eastern Interconnection or the Québec Interconnection was below the IFRO.
The Western Interconnection had four events with frequency response values below the absolute IFRO, which amounts to 6 percent of all Western Interconnection events for the three years. Three of the events occurred in 2014.
The ERCOT Interconnection had 21 events with frequency response values below the absolute IFRO, or 15 percent of all events for the three years. Four of these events occurred in 2014, showing an improvement in frequency performance over time.
Recommendations from NERC Staff and the Resource Subcommittee for M-4 (ALR 1-12) Frequency Event Detection and Selection Process Changes In the annual review of frequency response, NERC staff identified several concerns. The recommendations outlined in the 2014 Frequency Response Annual Analysis were incorporated into the data collection process for this report and include the following:
Monthly processing of 1-second data and weekly review of frequency event candidates for both M-4 (ALR 1-12) and BAL-003-1 are recommended to discover problems earlier and ensure consistency in event selection.
The Resources Subcommittee and NERC staff recommend that the process for selecting M-4 events be carefully reviewed and analyzed prior to the publication of the State of Reliability 2015 report.
The selection process discounted events that started above 60 Hz that did not fall below certain frequency deviation thresholds. This tends to corrupt any analysis of the statistical relationship between frequency response performance and starting frequency or ending frequency, and potentially eliminates events of high frequency response performance for large events or low frequency response for large megawatt changes in an Interconnection.
M-5 (ALR2-3) Under Frequency Load Shedding
Background This metric was removed from the monitored set in 2014 and will no longer be included in future reports. The purpose of Under Frequency Load Shedding (UFLS) is to balance generation and load when an event causes a significant drop in frequency of an interconnection or islanded area. Such occurrences are very few, and little value from trending is available. Additionally, the metric M-2 captures emergency automatic load shed including load shedding of 100 MW or greater associated with UFLS operation.
M-8 (ALR3-5) Interconnection Reliability Operating Limit Exceedances
Background The State of Reliability 2014 report reviewed the IROL/System Operating Limit (SOL) Exceedances metric. In the past, this metric has been used to determine the number of times an IROL was exceeded in the Eastern Interconnection and the number of times an SOL was exceeded in the Western and ERCOT Interconnections. Since the metric was first introduced, all Regional Entities now recognize IROLs and are anticipated to be able to report on IROL exceedances in 2014. Therefore, M-8 (ALR3-5) was modified to remove the SOL reporting language in late 2013.
53 Current recommended IFRO values are presented in the Frequency Response Annual Analysis, February 2015, Annual Analysis,
http://www.nerc.com/FilingsOrders/us/NERC Filings to FERC DL/Final_Info_Filing_Freq_Resp_Annual_Report_03202015.pdf.
Chapter 4 – Reliability Indicator Trends
NERC | State of Reliability Report 2015 | May 2015 43
This metric measures the number of times that a defined IROL was exceeded and the duration of the exceedances. Exceeding an IROL could lead to widespread outages if prompt operator control actions are not taken to return the system to within normal operating limits. In addition, exceeding the limits may not directly lead to an outage but may put the system at unacceptable risk if the operating limits are exceeded beyond Tv.54 The data is grouped into four time segments to monitor how quickly an IROL is returned to within normal limits, as shown in Table 4.10.
Table 4.10: Exceedance Duration Segment
Time Range IROL/SOL Duration
Time Range 1 10 seconds < Duration ≤ 10 minutes
Time Range 2 10 minutes < Duration ≤ 20 minutes
Time Range 3 20 minutes < Duration ≤ 30 minutes
Time Range 4 Duration > 30 minutes
Eastern Interconnection Figure 4.8 shows the number of IROL exceedances by quarter and time range of exceedance for the Eastern Interconnection for 2011 through 2014. The second quarter consistently shows the most exceedances for the Eastern Interconnection in all years due to planned transmission outages that result in congestion and higher flows on the remaining paths. In 2013 and 2014, the number of exceedances is similar in all four seasons, rather than heavily weighted toward the off-peak seasons when most planned outages occur. Also in 2013 and 2014, there were exceedances that had durations that put them into Time Range 3 and Time Range 4, meaning that the duration of these exceedances was greater than 20 minutes; some were greater than 30 minutes. Taken together, it appears that in the Eastern Interconnection, exceedances are occurring for longer periods of time, and there was a notable increase in total occurrences, particularly in Time Range 1. Also, the number of Time Range 1 exceedances increased significantly in 2014 compared to the other years for which data is provided. This may be explained by the fact that a new Energy Management System (EMS), which logs all defined IROL limit exceedance alarms, was installed in late 2013 at one of the RCs. All defined IROL exceedance limit alarms are also archived, allowing for sampling of the data for reporting purposes. The RC also implemented a new monitoring tool whereby the granularity of the monitoring has been decreased from 60 seconds to 10 seconds, which will inherently pick up more IROL exceedances. Therefore, the increase in the number of Time Range 1 events in 2014 is attributed to the new EMS system as well as the monitoring tool. It is anticipated that measurements for future years will also be impacted by the monitoring changes made for 2014. Based on this anticipated result, the parameters for reporting on Time Range 1 should be examined to ensure that the correct information is being captured.
54 Tv is the maximum time that an IROL can be violated before the risk to the Interconnection or other RC Area(s) becomes greater than
acceptable. Each IROL’s Tv shall be less than or equal to 30 minutes.

Chapter 4 – Reliability Indicator Trends
NERC | State of Reliability Report 2015 | May 2015 44
Figure 4.8: Eastern Interconnection IROL Exceedance
Western Interconnection The year 2014 was the first time the RC in the Western Interconnection was able to report on IROL exceedances because of changes to allow the calculation of IROL limits. As a result, M-8 was reviewed and updated to reflect IROL reporting from the Western Interconnection. For the year 2014, reported IROL data does not show any IROL exceedances for the Western Interconnection. The Western Interconnection RC’s definition of an IROL has additional criteria that may not exist in other RC areas.
ERCOT Interconnection Figure 4.9 shows that the number of IROL exceedances was greatly reduced from 2011 through 2014. The drop in IROL exceedances between the fourth quarter of 2012 and the first quarter of 2013 is attributed to the completion of a major transmission expansion project. The result is that the IROL that contributed to most of the exceedances (the West-to-North (W-N) IROL) was retired in 2013. In the past, the W-N IROL limit was the sole source of IROL exceedances.
Figure 4.9: ERCOT Interconnection IROL Exceedances

Chapter 4 – Reliability Indicator Trends
NERC | State of Reliability Report 2015 | May 2015 45
M-9 (ALR4-1) Correct Protection System Operations
Background In 2013, the metric was modified to focus on correct protection system operations, rather than focusing solely on misoperations. Therefore, in this report, the focus of this metric will include an analysis of correct operations and a discussion of misoperations. Protection system misoperations were identified as an area that requires further analysis in past state of reliability reports. The improvements to the data collection process that the Protection System Misoperations Task Force (PSMTF) and System Protection Control Subcommittee (SPCS) proposed in 2013 were implemented and have improved the accuracy of misoperation reporting. The PSMTF and SPCS recommendation that misoperation analysis be continued on an annual basis by the respective protection system subcommittees within each Regional Entity began in early 2014.
Assessment Figure 4.10 shows the correct operations rate for NERC during the reporting period. This information has not been included in prior state of reliability reports, but is included here for the time period that the data is available.
Figure 4.10: Correct Protection System Operations Rate

Chapter 4 – Reliability Indicator Trends
NERC | State of Reliability Report 2015 | May 2015 46
Figure 4.11 shows the misoperation rate by Region through the third quarter of 2014. The misoperation rate reflects the ratio of misoperations to total operations for the entire BES, 100 kV and above. This ratio provides a consistent way to trend the rate of misoperations as compared to a misoperation count alone, where weather and other factors can influence the count. Total protection system operations were first requested with the fourth quarter 2012 misoperation data.
Figure 4.11: Protection System Misoperations by Region (2Q 2012–3Q 2014)

Chapter 4 – Reliability Indicator Trends
NERC | State of Reliability Report 2015 | May 2015 47
Figure 4.12 illustrates the top-three cause codes being assigned to misoperations by the TOs: incorrect setting, logic, or design error; relay failures/malfunctions; and communication failure. These three cause codes have consistently accounted for approximately 65 percent of all misoperations since data collection started in 2011.
Figure 4.12: NERC Misoperations by Cause Code (2Q 2011–3Q 2014)55
Analysis of Data Linkage between Reported Misoperations and Transmission-Related Qualified Events An analysis of misoperation data and events in the Event Analysis Process provides two perspectives on misoperations. Out of approximately 2,000 total misoperations in 2014, approximately 2.5–3.0 percent were causal to or exacerbated the severity of reportable system disturbances. The other perspective is that more than 68 percent of transmission-related events have misoperations associated with them that either initiated the event or caused the event to be more severe. In 2014, there were 54 transmission-related system disturbances which resulted in a Qualified Event. Of those 54 events, 47 events, or about 87 percent, had associated misoperations. Of the 47 events, 37 of them (79 percent) experienced misoperations that were contributory to or exacerbated the severity of the event. In several cases, multiple misoperations occurred during a single disturbance. Ground Instantaneous Overcurrent Settings Additionally, 18 of the misoperations identified in Qualified Events were attributed to incorrect relay settings, with 11 of those 18 specifically attributed to incorrect ground overcurrent settings. The only Category 3 event in 2014 was directly related to an incorrect ground instantaneous overcurrent setting. Based on a review of misoperations in Qualified Events, there are two main causes of the incorrectly set ground instantaneous overcurrent elements. The first is an increase in the maximum value of ground fault short circuit current available over time, rendering the ground settings too sensitive. The second is setting the ground instantaneous overcurrent element without enough margin to accommodate short circuit modeling tolerances and other component anomalies. Entities were provided with information in 2014 to address these topics.
55 Cause coded Misoperation data for 2014 4Q is not available at this point

Chapter 4 – Reliability Indicator Trends
NERC | State of Reliability Report 2015 | May 2015 48
Actions to Address Misoperations NERC is in the process of revising a number of Reliability Standards that involve protection systems.56 To increase awareness and transparency, NERC will continue to conduct industry webinars57 on protection systems and document success stories on how GOs and TOs are achieving high levels of protection system performance. The quarterly protection system misoperation trending by NERC and the Regional Entities can be viewed on NERC’s website.58 In addition, NERC staff analyzed the top-three protection system misoperation cause codes reported on a quarterly basis by the Regions and NERC through compliance with Reliability Standard PRC-004-2.1a to identify Regional Entity trends and provide guidance to protection system owners that experience a high number of misoperations.59 Incorrect setting/logic/design errors in microprocessor relays were found to be the largest source of misoperations in almost every Region. This further supports the idea that focus should be placed on setting/logic/design controls for microprocessor relays. Specific NERC and industry actions are identified in the report, with the expectation that the rate of misoperations due to these causes can be reduced by 25 percent by yearend 2017.
M-11 (ALR6-2) Energy Emergency Alerts
Background This metric was enhanced in 2013 by expanding the data collection to include counts and duration of all EEA events of all levels, and unserved energy data for all EEA3 occurrences that result in load shedding. Going forward, this metric will account for the number and duration of all EEAs that are issued. All EEA1, EEA2, and EEA3 occurrences are now tracked to see whether there are any changes in frequency, duration, and load shed magnitudes associated with EEA occurrences over time. As historical data is gathered on EEAs, trends provide a relative indication of performance measured at a Regional Entity or interconnection level. By definition, when an EEA3 alert is issued, firm load interruptions are imminent or in progress. An EEA3 indicates an issue with the real-time adequacy of the electric supply system. It may be due to a lack of fuel or dependence on transmission for imports into a constrained area, not simply a lack of available generation resources. The contributing factors for EEA3 events need to be considered. The reporting of the duration and unserved energy of load shed events aids in determining the likelihood and duration of a load shed event following the issuance of an EEA3. EEA3 events are currently reported, collected, and maintained in NERC’s Reliability Coordinator Information System (RCIS), as defined in Reliability Standard EOP-002-3.60
Assessment Table 4.11 shows the number of EEA3 events from 2006 to 2014 at the Regional Entity level. Interactive quarterly trending is available on the Reliability Indicator’s page.61 In 2014, there were four EEA3 alerts issued with only one resulting in a loss of load event. The number of EEA3 events declared in 2014 is less than any other year for which data reporting exists.
56 http://www.nerc.com/pa/Stand/Pages/Standards-Under-Development.aspx 57 http://www.nerc.com/files/misoperations_webinar_master_deck_final.pdf 58 http://www.nerc.com/pa/RAPA/ri/Pages/ProtectionSystemMisoperations.aspx 59 http://www.nerc.com/pa/RAPA/PA/Performance Analysis DL/NERC Staff Analysis of Reported Misoperations - Final.pdf 60 The latest version of EOP-002 is available at: http://www.nerc.com/files/EOP-002-3_1.pdf. 61 The EEA3 interactive presentation is available on the NERC website at: http://www.nerc.com/pa/RAPA/ri/Pages/EEA2andEEA3.aspx.

Chapter 4 – Reliability Indicator Trends
NERC | State of Reliability Report 2015 | May 2015 49
Table 4.11: Energy Emergency Alert 3
Region Number of Events
2006 2007 2008 2009 2010 2011 2012 2013 2014
NERC 7 23 12 41 11 23 16 7 4
FRCC 0 0 0 0 0 0 0 1 2
MRO 0 0 0 0 0 0 0 0 0
NPCC 0 0 1 1 0 0 0 0 1
RF 0 3 1 0 2 0 1 0 0
SERC 4 14 2 3 4 2 7 0 1
SPP 1 5 3 35 4 15 6 2 0
TRE 0 0 0 0 0 1 1 0 0
WECC 2 1 5 2 1 5 1 4 0
One EEA3 event that resulted in load shed involved the interruption of 100 MW of load for 3.33 hours, and an additional 200 MW of load for 2.5 hours, or unserved energy of 833 MWh. This event was due to conditions during the polar vortex that resulted in record-low temperatures and high demand. The other three reported EEA3 alerts did not result in any loss of load events. These EEA3 events generally fell into the category of a local area with transmission limitations such that the local area could not make use of the reserves that existed within the Region. In these cases, all local generation resources were in use, and transmission limitations restricted the ability to get resources from the Region, which had reserves available.
Since 2013, EEA Level 1 and Level 2 events are also assessed as a part of this metric. Table 4.12 shows the number of EEA events at each of the levels by Regional Entity. More events occur at Level 1 and Level 2, as those represent situations in which capacity emergencies are developing. Figure 4.13 displays the cumulative amount of time at each EEA alert level. This data for all the alerts was only collected for 2013 and 2014. This graph shows that the duration of EEA3 events for which no load was lost was lower in 2014 than in 2013. Except for the one EEA3 event for which load was lost, both the amount of load lost and the duration of the event were greater than in 2013.
Table 4.12: 2014 EEA Level by Region
Region EEA1 EEA2 EEA3 Total
FRCC 0 2 2 4
MRO 10 12 0 22
NPCC 1 3 1 5
RF 3 6 0 9
SERC 2 7 1 10
SPP 1 2 0 3
WECC 1 3 0 4
TRE 1 1 0 2
Grand Total
19 36 4 59

Chapter 4 – Reliability Indicator Trends
NERC | State of Reliability Report 2015 | May 2015 50
Figure 4.13: Firm Load Shed and Duration Associated with EEA3 Events by Year

Chapter 4 – Reliability Indicator Trends
NERC | State of Reliability Report 2015 | May 2015 51
M-12 (ALR6-11) Automatic AC Transmission Outages Initiated by Failed Protection System Equipment
Background This metric was enhanced in 2014 to be consistent with the collection of BES data in TADS. Originally, this metric collected a “normalized count (on a per-circuit basis) of 200 kV and above ac Transmission Element outages (i.e., TADS momentary and sustained Automatic Outages) that were initiated by Failed Protection System Equipment.” Since the definition of BES was changed to include equipment down to 100 kV in some circumstances, this metric was revised to include any BES ac Transmission element outages that were initiated by the TADS ICC of Failed Protection System Equipment. The new BES definition became applicable July 1, 2014. However, the addition of TADS reporting for voltage classes less than 100 kV (BES only) and 100 to 199 kV begins for calendar year 2015. Therefore, 2014 data presented below is only for ac transmission element outages 200 kV and above. Figure 4.14 presents the number of automatic outages per circuit for the time period 2010 to 2014, and Figure 4.15 presents the number of automatic outages per transformer for the time period 2010 to 2014.
Figure 4.14: Automatic AC Circuit Outages Initiated by Failed Protection System Equipment
Figure 4.15: Automatic Transformer Outages Initiated by Failed Protection System Equipment

Chapter 4 – Reliability Indicator Trends
NERC | State of Reliability Report 2015 | May 2015 52
M-13 (ALR6-12) Automatic AC Transmission Outages Initiated by Human Error
Background This metric was enhanced in 2014 to be consistent with the collection of BES data in TADS. Originally, the metric collected a “normalized count (on a per-circuit basis) of 200 kV and above ac Transmission Element outages (i.e., TADS momentary and sustained Automatic Outages) that were initiated by Human Error.” Since the definition of BES was changed to include equipment down to 100 kV in some circumstances, this metric was revised to include any BES ac transmission element outages that were initiated by the TADS ICC of Human Error. Data for 2014, presented below, is only for ac transmission element outages 200 kV and above. Figure 4.16 presents the number of automatic outages per circuit for the time period 2010 to 2014, and Figure 4.17 presents the number of automatic outages per transformer for the time period 2010 to 2014.
Figure 4.16: Automatic AC Circuit Outages Initiated by Human Error
Figure 4.17: Automatic Transformer Outages Initiated by Human Error

Chapter 4 – Reliability Indicator Trends
NERC | State of Reliability Report 2015 | May 2015 53
M-14 (ALR6-13) Automatic AC Transmission Outages Initiated by Failed AC Substation Equipment
Background This metric was enhanced in 2014 to be consistent with the collection of BES data in TADS. Originally, the metric collected a “normalized count (on a per-circuit basis) of 200 kV and above ac Transmission Element outages (i.e., TADS momentary and sustained Automatic Outages) that were initiated by Failed AC Substation Equipment.” Since the definition of BES was changed to include equipment down to 100 kV in some circumstances, this metric was revised to include any BES ac transmission element outages that were initiated by the TADS ICC of Failed AC Substation Equipment. Data for 2014, presented below, is only for AC Transmission Element outages 200 kV and above. Figure 4.18 presents the number of automatic outages per circuit for the time period 2010 to 2014, and Figure 4.19 presents the number of automatic outages per transformer for the time period 2010 to 2014.
Figure 4.18: Automatic AC Circuit Outages Initiated by Failed AC Substation Equipment
Figure 4.19: Automatic Transformer Outages Initiated by Failed AC Substation Equipment

Chapter 4 – Reliability Indicator Trends
NERC | State of Reliability Report 2015 | May 2015 54
M-15 (ALR6-14) Automatic AC Transmission Outages Initiated by Failed AC Circuit Equipment
Background This metric was enhanced in 2014 to be consistent with the collection of BES data in TADS. Originally, the metric collected a “normalized count (on a per circuit basis) of 200 kV and above ac Transmission Element outages (i.e., TADS momentary and sustained Automatic Outages) that were initiated by Failed AC circuit equipment.” Since the definition of BES was changed to include equipment down to 100 kV in some circumstances, this metric was revised to include any BES ac transmission element outages that were initiated by the TADS ICC of Failed AC Circuit Equipment. Data for 2014, presented below, is only for ac transmission element outages 200 kV and above. Figure 4.20 presents the number of automatic outages per circuit per 100 miles for the time period 2010 to 2014.
Figure 4.20: Automatic AC Circuit Outages Initiated by Failed AC Circuit Equipment per 100 Miles

Chapter 4 – Reliability Indicator Trends
NERC | State of Reliability Report 2015 | May 2015 55
M-16 (ALR6-15) Element Availability Percentage (APC) & Unavailability Percentage
Background This metric was enhanced in 2013 to combine the Element Availability and Unavailability into one metric. Originally, there were two metrics: one to calculate availability and one to calculate unavailability. This metric continues to focus on availability of elements at 200 kV and above, because the components of the calculation include planned outages (which will no longer be collected in TADS beginning in 2015), unplanned outages (which are collected in TADS for all BES Elements), and operational outages (which are only collected in TADS for 200 kV and above). Therefore, the reporting voltage levels for this will not change. Figure 4.21 presents ac circuit availability as a percentage for the time period 2010 to 2014, and Figure 4.22 presents transformer availability as a percentage for the time period 2010 to 2014.
Figure 4.21: AC Circuit Availability
Figure 4.22: Transformer Availability

NERC | State of Reliability Report 2015 | May 2015 56
Chapter 5 – Development of Compliance Metrics
Background NERC has continuously enhanced the Compliance Monitoring and Enforcement Program since 2008, providing more certainty on actions, outcomes, and reliability consequences. In August of 2010, the Reliability Metrics Working Group released its Integrated Bulk Power System Risk Assessment Concepts62 paper introducing new concepts, such as the “universe of risk” of the BPS, which is illustrated in Figure 5.1. One of these concepts, the SRI, was developed as a way to assess the event-driven risk to the BPS. The ALR metrics were developed to assess the condition-driven risk. And the first attempt at a metric to track the impact of standard-driven risks of compliance violations was the Key Compliance Monitoring Index (KCMI).
Figure 5.1: Conceptual Diagram of Risk Indices
The five-year assessment of the KCMI indicated that the risk to BPS reliability based on the number of violations of NERC Reliability Standards trended lower from 2008 to 2012. However, over the years, the Reliability Standards and language in the requirements underwent several modifications. New Reliability Standards and requirements were added, and others retired, but these changes were not reflected in the KCMI calculation. It proved difficult to maintain meaningful tracking of the data. Therefore, in late 2013, the OC and the PC acted to retire KCMI as a compliance metric and tasked the PAS with developing a replacement metric to allow for the meaningful collection of data concerning industry performance pertaining to compliance violations. In June 2014, the RISC asked the CCC to identify ways compliance data can be used to create measures to reduce risk to the BPS. This request was based on a NERC Board request to the RISC in February 2013:
62 http://www.nerc.com/comm/PC/Performance Analysis Subcommittee PAS
DL/Archive/Integrated_Bulk_Power_System_Risk_Assessment_Concepts_Final.pdf.
Event Driven Index (EDI)
Indicates risk from major system events
Key Compliance Monitoring Index
(KCMI)
Indicates risks from violations of Severe-
Impact Standards
Condition-Driven Index (CDI)
Indicates risks from Key Reliability Indicators

Chapter 5 – Development of Compliance Metrics
NERC | State of Reliability Report 2015 | May 2015 57
FURTHER RESOLVED, the Board hereby directs NERC management to work with the RISC and, as appropriate, NERC committee leadership to consider how NERC should utilize a data-driven reliability strategy development process that integrates with budget development and overall ERO planning (e.g., Standing Committee planning, department and employee goal setting).
Separately tasked with determining methods and metrics to reflect the risk of noncompliance to the reliability of the BPS, the two groups formed a team to address the development of one or more compliance-based metrics that relate to the reliability of the BPS. The concepts presented in this chapter describe two metrics that the team has developed in response to the tasks presented by the RISC, the OC, and PC.
CP-1 Risk Metric A New Concept for Evaluating Risk to the BES, CP-1 The CCC and PAS proposed a new metric that relies on the ERO Enforcement staff’s determination of the risk of a potential violation. As a violation progresses through enforcement, it is assigned situation-specific risk based on the facts and circumstances of the case. The most egregious violations are deemed “Serious Risk.” Specifically, the team recommended tracking violations in the quarter they occurred. This focused the new metric more on newly discovered and reported possible violations (PVs).
CP-2 Impact Metric Description Compliance Metric 2 (CP-2) is a quarterly count of the number of newly reported noncompliances with observed reliability impact. While the CP-1 (Risk) metric is expected to provide value to the ERO Enterprise, it has two primary limitations:
While feedback loops will improve the quality of the risk assessments, there still is some subjectivity in the assignment of risk.
Serious-Risk violations are relatively rare events, so tracking them provides limited information. Error! Reference source not found.Figure 5.2 depicts the risk breakdown of violations processed in 2013 and 2014. Consistent with trends observed from 2008–2012, very few violations were deemed Serious Risk. Since BES impact is a manifestation of risk, the determination of the actual reliability impact of a PV is another aspect that could provide significant benefit in trending. The team’s proposed CP-2 provides a measure of the observable BES impact due to compliance violations.

Chapter 5 – Development of Compliance Metrics
NERC | State of Reliability Report 2015 | May 2015 58
Figure 5.2 Final Risk Assessments (2013 and 2014)
The starting point for the metric is identification of a PV. For each PV reported, an assessment would be made as to whether there was an observable reliability impact from that violation. Unlike the assessment of risk, this metric focuses on the actual impact, not the potential impact of the violation. To follow this approach to reduce the impact of standard violations on the BES, an assessment of the observable reliability impact needs to be made. Figure 5.3 maps the four data tiers that define the impacts used for CP-2. This metric only requires capturing a small amount of data along with each Compliance Exception or PV. The observed impacts in the figure were used to advance the development of this report. The list is expected to evolve slightly over time based on experience. It should be noted that Tier 2 and Tier 3 observations are relatively rare events. Of the approximately 1,200 violations processed in 2014, there were 25 Tier 3 violations and only a handful of Tier 2 cases. The value in the metric comes from verifying that the industry is looking for problems (Tier 0) and addressing the minor problems (Tier 1) before they can become large disturbances with more severe results. The CCC approved the concepts and provided these concepts to the RISC in April of 2015. The PAS plans to recommend to the OC and PC the testing of these two compliance metrics: CP-1 (Risk Focus), and CP-2 (Impact Focus). These metrics should offer significant value in achieving the objectives above.

Chapter 5 – Development of Compliance Metrics
NERC | State of Reliability Report 2015 | May 2015 59
Figure 5.3: Impact Observations Mapped to the Impact Pyramid Tiers

NERC | State of Reliability Report 2015 | May 2015 60
Chapter 6 – Event Analysis
Background The industry’s voluntary ERO Event Analysis Process provides information to the ERO and industry to address potential reliability risks or vulnerabilities of the BPS. Since its initial implementation in October of 2010, the process has resulted in the collection of 569 Qualified Events and yielded 96 Lessons Learned, 19 of which were published in 2014.63 The first step in the ERO Event Analysis Process is Bulk Power System Awareness (BPSA), which monitors the BPS for reliability incidents that rise above a certain threshold of impact or risk. NERC’s BPSA group and the eight Regional Entities monitor BPS conditions, significant occurrences, and emerging risks and threats across the 14 RC regions in North America. The 2014 information and products are provided in Figure 6.1, and a detailed description can be found in Appendix E.
Information Products Mandatory reports 252 daily reports
500 DOE OE-417 reports 33 special reports for significant occurrences
282 EOP-004-2 reports 4 security-related NERC Advisory (Level 1) Alerts for ES-ISAC
4 EOP-002-3 reports 1 reliability-related NERC Advisory (Level 1) Alert
Other information64 503 new Event Analysis database entries
1,741 Intelligent Alarms notifications 170 qualified Event Analysis Process events
2,356 FNet notifications and 602 FNet daily summaries
6,172 WECCnet messages
1,691 RCIS messages
186 Space Weather Predictive Center Alerts
1,789 assorted U.S. Government products
3,588 assorted confidential, proprietary, or non-public products
13,184 open source media reports
1,257 Reliability Coordinator and ISO/RTO notifications
Figure 6.1. Situational Awareness Inputs and Products in 2014
63 The link to the NERC Lessons Learned page: http://www.nerc.com/pa/rrm/ea/Pages/Lessons-Learned.aspx. 64 Information sources listed in no particular order or priority, and not limited to these resources.
Inputs Products

Chapter 6 – Event Analysis
NERC | State of Reliability Report 2015 | May 2015 61
Analysis and Reporting of Events Using the automated tools, mandatory reports, voluntary information sharing and third-party publicly available sources, disturbances on the grid are categorized by the severity of their impact on the BPS. Table 6.1 contains a consolidated chart of the reportable events since the program’s inception (October 2010) and for 2014. For a more thorough review of the process, see: http://www.nerc.com/pa/rrm/ea/EA Program Document Library/Final_ERO_EA_Process_V2.1.pdf.
Table 6.1: Event Analysis Summary
Event Category Count (Total) Count (2014) Comments
CAT 1 412 144 51 - Three or more BPS facilities lost (1a); 11 - Islanding (1b); 7 - BPS SPS/RAS Misoperation (1c); 1 - Voltage Reduction (1d) 10 - Control Room evacuations (1f); 2 - Generation lost (1g); 62 - Partial EMS (1h)
CAT 2 137 24 21 - EMS events (2b) 1 - Volt Excursion (2c) 1 - Unintended loss of load (2f) 1 - IROL (2g)
CAT 3 15 1 Loss of 2,103 MW generation (2 Nuclear units)
CAT 4 3 0
CAT 5 2 1 Polar Vortex (2014)
Total CAT 1-5 Events
569 170
Non-Qualified Occurrences Reported
2050 333

Chapter 6 – Event Analysis
NERC | State of Reliability Report 2015 | May 2015 62
Figure 6.2 is the control chart for the 569 Qualified Events through 2014. In October 2013, when Version 2 of the Event Analysis Process introduced the new category of events, collectively known as Category 1h (partial loss of EMS; see Appendix E for more information), occurrences that were not previously reported became reportable. The point in January 2014 where the number of reportable events exceeds the upper control limit65 has been analyzed; results show an increase in the Category 1h events reported—out of an abundance of caution—when the mandatory reporting of EOP-004-2 went into effect.
Figure 6.2. Control Chart – Number of Events (per Month) Over Time
A total of 342 contributing cause codes66 were assigned to 401 events. The root cause of every event cannot be determined, though many of the contributing causes or failed defenses can be.
65 The control limits are calculated using Statistical Process Control techniques as an Individuals-Moving Range (3-month moving average
for the moving range) control chart. 66 http://www.nerc.com/pa/rrm/ea/EA Program Document Library/CCAP_Manual_rev201503__Final_for_posting.pdf.
Chapter 6 – Event Analysis
NERC | State of Reliability Report 2015 | May 2015 63
Figure 6.3 shows the overall trends for the contributing cause codes of events.
Figure 6.3. Percentage of Contributing Causes by Category
Identifying these large areas of concern makes it easier to prioritize and search for actionable threats to reliability. For example, analysis of the aggregate data identified different types of failed or damaged equipment. This information was turned over to the ACSETF for further investigation.
There was a single Category 3 event in 2014. The dominant issue in this event was the latent error of an incorrect setting of the directional ground instantaneous overcurrent (IOC) element on a numerical relay. NERC published a Lesson Learned in February 2015 titled Consideration of the Effects of Mutual Coupling when Setting Ground Instantaneous Overcurrent Elements. Similar issues have been seen in several smaller events.
Major Initiatives in Event Analysis Human Performance In Appendix A, human error is listed as a contributor to transmission outages. Event Analysis has identified workforce capability and human performance challenges as possible threats to reliability. Workforce capability and human performance is a broad topic and can most simply be divided into management, team, and individual levels. NERC held its third annual HP conference, Improving Human Performance on the Grid, in Atlanta in March 2014. NERC continues to conduct cause analysis training with staff from the Regions and registered entities. As of December 2014, personnel from all eight Regions and approximately 1,000 people from 204 different registered entities have received cause analysis training (roughly 8,000 hours of training).
Polar Vortex Review In 2014, NERC and the Regions engaged in an analysis of a major event that occurred across a significant footprint of North America. In early January of 2014, the Midwest, South Central, and East Coast regions of North America experienced a polar vortex, where extreme cold weather conditions occurred in lower latitudes than normal, resulting in temperatures 20 to 30° F below average. Some areas faced days that were 35° F or more below their

Chapter 6 – Event Analysis
NERC | State of Reliability Report 2015 | May 2015 64
average temperatures. These temperatures resulted in record-high electrical demand for these areas on January 6 and again on January 7, 2014. Considerable resources were used to evaluate conditions, including information gathered during operations and data collected in GADS. NERC’s Polar Vortex Review67 shows that BPS reliability was maintained despite sustained record-low temperatures occurring over a large geographic area in North America. Many areas experienced daytime high and overnight-low temperatures that were between 20 degrees and 30 degrees below normal, with 49 cities setting new record lows. GOPs and TOPs in North America responded well to prevent major impacts to the BPS. As expected, key factors during the event included fuel deliverability issues, natural gas pipeline outages, gas service interruptions, frozen electricity and gas equipment, and other extreme cold weather operating challenges. During the event, grid operators employed techniques such as voltage reduction and demand-side management to ensure that BPS reliability was maintained.
Event Severity Risk Index (eSRI) Event Analysis calculates an Event Severity Risk Index (eSRI) for all Qualified Events (as defined in the ERO Event Analysis Process). The eSRI calculation follows the methodology provided in Appendix E and considers the loss of transmission, the loss of generation, and the loss of firm load along with the duration of the load loss. Every Qualified Event since October 2010 reported through the ERO Event Analysis Process has its eSRI calculated. For the purposes of trending, certain event groups are excluded. The total number of events was 568; of these, 29 were attributed to islanding events for an entity that plans and operates to island as a normal contingency, 14 were weather-driven, and five were Category 4-5 events (three of which are also weather driven). Only two Category 4-5 events were excluded as Category 4-5 events, while three of them were excluded as weather-driven events. For more details on the exclusions and the eSRI formula, see Appendix E. A total of 523 event eSRI calculations are used for trending, as shown in Figure 6.4 and Figure 6.5.
67 http://www.nerc.com/pa/rrm/January 2014 Polar Vortex Review/Polar_Vortex_Review_29_Sept_2014_Final.pdf.

Chapter 6 – Event Analysis
NERC | State of Reliability Report 2015 | May 2015 65
Figure 6.4: Trend Line of eSRI
Figure 6.5: Expanded View of eSRI Trend Line Y Axis 0 to .3
As seen in the expanded view (included to address the scale limit visibility), the eSRI is approximately zero within the statistical confidence interval. Also, as indicated in Figures 6.4 and 6.5, the trend line is relatively flat.

NERC | State of Reliability Report 2015 | May 2015 66
Chapter 7 – Actions to Address Key Findings in Prior State of
Reliability Reports
The state of reliability report contains key findings each year, many of which result in necessary actions for the PAS, NERC, and other subcommittees and working groups.68 To track the actions that have been completed and those that are ongoing, a comprehensive table of action items identified in state of reliability reports from 2011 to 2014 is provided. In Table 7.1, the list of completed key actions is detailed and represents several years of response from industry to the items noted in previous state of reliability reports, while Table 7.2 shows those items that are still ongoing. It is noteworthy that over these four years of reports, 22 items have been called out as actionable. During those same years, 18 of them have been completed. These have resulted in new processes, additional data and analysis, determination of risk, and modifications made to mitigate the risk. Four of them are still being addressed, but the expected resolution is on track for conclusion.
68 Prior state of reliability reports can be found at the following locations: http://www.nerc.com/comm/PC/Performance Analysis Subcommittee PAS DL/2011_RARPR_FINAL.pdf. http://www.nerc.com/pa/RAPA/PA/Performance Analysis DL/2012_SOR.pdf. http://www.nerc.com/pa/RAPA/PA/Performance Analysis DL/2013_SOR_May 15.pdf. http://www.nerc.com/pa/RAPA/PA/Performance Analysis DL/2014_SOR_Final.pdf.

Chapter 7 – Actions to Address Key Findings in Prior State of Reliability Reports
NERC | State of Reliability Report 2015 | May 2015 67
Table 7.1: Completed Key Finding Actions
Item Reference
Finding Report
Year Key Finding
Type Key Finding
Heading Key Finding Reference Key Finding Words
Key Finding Status Actions Taken to Date
1 2011 Transmission Performance
Transmission Availability Performance
Page 3 Paragraph 2
"Almost one‐third of all sustained, automatic outages are dependent or common mode events. A joint team should be formed to analyze these outages." Complete
Further clarification of key finding made, with subsequent formation of an IEEE working group, which continues to study this issue. Results of analysis on common and dependent mode outages was provided to the PC in 2012.
2 2011 Metric Assessment
Reliability Metric Performance
Page 2 Paragraph 3
"All metrics will be evaluated on a regular basis to determine each metric’s contribution to quantitative reliability measurement." Complete
Incorporated into routine metric review process and PAS scope. Reviewed, retired, and augmented metrics, in addition to annual review of BPS performance.
3 2011 Metric Assessment
Disturbance Events
Page 3 Paragraph 4
“This suggests more data and analysis into equipment failure many prove fruitful. However, with such a small dataset, no conclusions can be drawn.” Complete
Created Event Analysis Subcommittee and ERO Event Analysis Process with ongoing assessment of Qualified Events; subsequently, the ACSETF was formed, which further explored and investigated equipment failures.
4 2012 Metric Assessment
Bulk Power System Reliability Remains Adequate
Page 5 Paragraph 3
"Investigation into load-loss events is recommended, including post-event review. Further, load-loss reporting should be refined to distinguish differences between consequential and non-consequential load loss, and include identification of initiating events." Complete
Load-loss events are analyzed in several different ways, including modifications to ALR1-4 (in 2013), which captures load-loss events in excess of 50 MW, and the modified SRI calculation method, both of which were approved by OC and PC. Additionally, consequential and non-consequential are addressed by factors collected during the ERO Event Analysis Process, where an eSRI is also calculated.
5 2012 Transmission Performance
Equipment Failure Warrants Further Analysis
Page 10 Paragraph 2,3
"Additional data is needed to investigate equipment failure. Small subject matter expert technical group could be formed to further investigate and provide solutions." Complete
Targeted data collection conducted. Collaboration between NATF and NERC undertaken to facilitate identification of reliability risks due to particular types and models of equipment. ACSETF was formed to further investigate equipment failure; specific recommendations were made to the PC at its March 2015 meeting.

Chapter 7 – Actions To Address Key Findings in Prior State of Reliability Reports
NERC | State of Reliability Report 2015 | May 2015 68
Table 7.1: Completed Key Finding Actions
Item Reference
Finding Report
Year Key Finding
Type Key Finding
Heading Key Finding Reference Key Finding Words
Key Finding Status Actions Taken to Date
6 2012 Metric Assessment
Frequency Response is Stable with No Deterioration
Page 5 Paragraph 5
"More data is still needed to apply statistical significance tests and calculate a confidence interval to establish a trend. Also additional analysis on time of year, load levels, generation on-line, and response withdrawal should be considered when interpreting the trend.” Complete
Frequency response statistics and performance levels have been developed (with regard to assessing stability as a function of time, loading, etc.).
7 2012 Transmission Performance
Protection System Misoperations are a Significant Reliability Issue
Page 9 Paragraph 1
"Deeper investigation into the root causes of protection system misoperations is a high priority. As announced, a Protection System Misoperation Task Force has been formed to analyze misoperations." Complete
New reporting requirements were introduced, misoperation cause codes created; PSMTF assembled and evaluated performance. Augmented TADS analyses were subsequently performed and incorporated into the state of reliability reports.
8 2013 Metric Assessment
Bulk Power System Reliability Remains Adequate
Page 9 Paragraph 2
"The top 10 most severe events in 2012 were all initiated by weather. There were only three high-stress days (SRI greater than 5.0) in 2012 compared to six days in 2011." Complete
Refined SRI to incorporate improved load-loss calculation method; modified SRI calculation, which was approved by OC and PC.
9 2013 Metric Assessment
Reduced Standards Violations Risks
Page 12 Paragraph 1
"A five year assessment of the Key Compliance Monitoring Index indicated improvement…suggesting that this improved compliance trends indicates a reduced risk to BPS reliability." Complete
Subsequently, the KCMI was retired and a new metric was developed that evaluates the compliance risk to reliability.
10 2013 Transmission Performance
AC Substation Equipment Failures are a Second Significant Contributor to Disturbance Events and Automatic Outage Severity
Page 15 Paragraph 2
"NERC recommends that a small subject matter expert technical group be formed to further validate findings [re circuit breaker failure equipment involvement] to understand the contributing factors to circuit breaker failures and provide risk control solutions." Complete
ACSETF formed, developed analysis, recommended improvements in the report. The OC and PC approved the report and task force disbanded.

Chapter 7 – Actions To Address Key Findings in Prior State of Reliability Reports
NERC | State of Reliability Report 2015 | May 2015 69
Table 7.1: Completed Key Finding Actions
Item Reference
Finding Report
Year Key Finding
Type Key Finding
Heading Key Finding Reference Key Finding Words
Key Finding Status Actions Taken to Date
11 2014
Sustained High Performance for Bulk Power System Reliability
Page 11 Paragraph 1
"Based on the SRIbps and 16 metrics that measure the characteristics of an ALR, BPS reliability is adequate and within the defined acceptable ALR performance objectives." Complete No specific action is required for this finding.
12 2014 Frequency Response
Frequency Response remains Stable
Page 15 Paragraph 1
"From 2009 to 2013, the Eastern Interconnection, ERCOT Interconnection, Quebec Interconnection and Western Interconnection have shown steady frequency response performance, trending above the recommended IFRO at all times during the study period. The Eastern Interconnection showed a slightly downward trend in frequency response; however, this trend is not statistically significant. Recommendation: NERC will examine and develop root causes for incidents in 2013 where frequency response was less than the IFRO. NERC will determine additional actions, beyond those currently being worked on in NERC Standards that should be taken to maintain and improve frequency response performance." Complete
Frequency event data has been studied further as recommended in the Frequency Response Initiative Report. This analysis process is annually conducted and results in a report filed with FERC. It is expected that this periodic analysis will continue to support the state of reliability reports.
13 2012 Frequency Response
More Data and Research is Needed
Page 12 Paragraph 3
"Many datasets and performance analyses conducted in this report are still in an early stage. A number of metrics are limited to occurrence count values; no additional details, such as duration and/or intensity are available to provide a better observation of how each occurrence impacts bulk power system reliability." Complete
In subsequent state of reliability reports and in routine application of metrics, further dimensions to metrics have been created where appropriate. As metrics are reviewed and applied, they are further clarified and additional facets to their collection, calculation and application are addressed. This is evidenced by recent changes to metrics such as M2 (previously titled ALR1-4) as well as M11 (previously titled ALR 6-2).

Chapter 7 – Actions To Address Key Findings in Prior State of Reliability Reports
NERC | State of Reliability Report 2015 | May 2015 70
Table 7.1: Completed Key Finding Actions
Item Reference
Finding Report
Year Key Finding
Type Key Finding
Heading Key Finding Reference Key Finding Words
Key Finding Status Actions Taken to Date
14 2013 Frequency Response
Steady Frequency Response
Page 12 Paragraph 3
"The expected frequency response for each interconnection has been higher than the recommended interconnection frequency response obligation." Complete
Frequency response continues to be monitored and reported upon annually, with assessment against statistical limits. Conclusions are drawn from these analyses which are reported in a variety of reports, including the state of reliability reports.
15 2013 Transmission Performance
Protection System Misoperations are a Significant Contributor to Disturbance Events and Automatic Transmission Outage Severity
Page 13 Paragraph 1
"[P]rotection system misoperations are identified as the leading initiating cause to disturbance events." Complete
The PSMTF was established and collected data; additional outage cause codes were created to further distinguish types of clearing, to support better analysis, which will lead to improved operations and fewer misoperations. Misoperations reporting was enhanced.
16 2014 Transmission Performance
Protection System Misoperations Cause Transmission Events
Page 16 Paragraph 2
"Misoperations analysis has developed three different datasets to understand their impact. Based on these datasets, however, the relationship between the Misoperations Initiating Cause Code and transmission risk, and the positive correlation between misoperations and transmission severity, understanding and reducing misoperations should remain a focus of NERC and industry participants. Recommendation: NERC will complete development of Reliability Standard PRC-004-3 — Protection System Misoperation Identification and Correction. NERC will develop a plan and catalyze industry action to address the three most common causes of protection system misoperations (settings/logic/design Complete
PRC 04-3 was approved in 2013. NERC staff analyzed misoperation data in 2014 and presented findings to the Planning Committee, which contained recommendations.

Chapter 7 – Actions To Address Key Findings in Prior State of Reliability Reports
NERC | State of Reliability Report 2015 | May 2015 71
Table 7.1: Completed Key Finding Actions
Item Reference
Finding Report
Year Key Finding
Type Key Finding
Heading Key Finding Reference Key Finding Words
Key Finding Status Actions Taken to Date
errors, communication failures, and relay failures)."

Chapter 7 – Actions To Address Key Findings in Prior State of Reliability Reports
NERC | State of Reliability Report 2015 | May 2015 72
Table 7.1: Completed Key Finding Actions
Item Reference
Finding Report
Year Key Finding
Type Key Finding
Heading Key Finding Reference Key Finding Words
Key Finding Status Actions Taken to Date
17 2014 Transmission Performance
Substation Equipment Failures Impact Transmission Event Severity
Page 18 Paragraph 3
"The AC Substation Equipment Task Force (ACSETF) was created to address high-priority reliability issues related to ac substation equipment. The failure data is currently being analyzed, and observations include; 1) circuit breaker failures have the highest percentage of failures; 2) top four subcomponents are interruptions, mechanism, trip coil and bushing; 3) inherent in circuit breaker failure is an increased probability that additional BPS elements will also be out of service; 4) inherent in transformer failure is an increased probability of longer outage duration; and 5) further data collection and analysis is needed, including maintenance strategies, bus configurations, and failure event SRI calculation. Recommendation: NERC will assess the implementation and effectiveness of the Level 1 NERC Advisory issued to address 345 kV SF6 puffer-type breaker failures. NERC will develop a plan with milestones to address the causes of substation equipment failures identified by the ACSETF. NERC will develop and facilitate data collection necessary to perform future analysis of substation equipment failures, as recommended by the ACSETF." Complete
For circuit breaker failures, Event Analysis is assessing the effectiveness of the alert. For all other items noted, the ACSETF presented a prioritized list of recommendations at the March 2015 Planning Committee meeting and a plan to address those recommendations will be developed in 2015, including necessary data collection. Actions recommended were assigned by the PC to the appropriate work groups. The ACSETF was disbanded.

Chapter 7 – Actions To Address Key Findings in Prior State of Reliability Reports
NERC | State of Reliability Report 2015 | May 2015 73
Table 7.1: Completed Key Finding Actions
Item Reference
Finding Report
Year Key Finding
Type Key Finding
Heading Key Finding Reference Key Finding Words
Key Finding Status Actions Taken to Date
18 2014 Metric Assessment
Use of Energy Emergency Alert Level 3 Declines
Page 19 Paragraph 4
"In 2013 there were seven Energy Emergency Alert (EEA) Level 3 events declared, which is significantly lower than the number that occurred in prior years. Recommendation: NERC will analyze system events that resulted in firm load shedding to determine any common causes or trends that warrant action." Complete
This metric will continue to be monitored for the value in evaluating the reliability of the system. Modifications to the metric were made to ensure a comprehensive understanding of the use and occurrence of EEAs. Based upon continued analysis, there is an apparent improvement trend for this metric, as discussed in Chapters 2 and 4.

Chapter 7 – Actions To Address Key Findings in Prior State of Reliability Reports
NERC | State of Reliability Report 2015 | May 2015 74
Table 7.2: Ongoing Key Finding Actions
Item Reference
Finding Report
Year Key Finding
Type Key Finding
Heading Key Finding Reference Key Finding Words
Key Finding Status Actions Taken to Date
1 2012 Generation Performance
Resource Mix Changes Necessitate New Metrics
Page 11 Paragraph 1
"Resources such as wind generation and demand response are the non-traditional resources that perform differently than conventional generators. New metrics should be developed in order to determine what, if any, impact these differences have on reliability."
Ongoing The wind data reporting instruction (Section 1600 Data Request for Wind Characteristics) will collect elementary performance data intended to enable the development of metrics. Demand response metrics have been developed but are being modified and aligned across all Regions so that consistent measurements can be calculated.
2 2013 Transmission Performance
Automatic Transmission Events with Unknown Cause Necessitate Analysis
Page 17 Paragraph 1
"Initiating [unknown] cause codes comprise 19 percent of all events with automatic outages. This may be an area where more analysis is needed."
Ongoing Improvements have been made in unknown sustained cause codes by focused efforts by operators, Regional Entities and NERC. Work still remains for the TADSWG.
3 Metric Assessment
Severity Risk Index Assessment
Page 28 Paragraph 3
"Additionally, it appears that with the modified method of calculating SRIbps, generation severity plays a substantial role in the daily summary values as measured by SRIbps. Future state of reliability reports will contain information assembled and analyzed from GADS, which is likely to bring greater understanding to these facilities and their role assessing the reliability of the BPS. Further analysis of generation performance, particularly as it relates to daily bulk power system performance is appropriate; additional analysis will be incorporated into SOR reports in the future."
Ongoing Generation loss was noted as a significant contributor to daily SRI. It will be subsequently reported within the annual state of reliability reports.
4 2011 Generation Performance
Generating Availability Performance
Page 3 Paragraph 3
"In the last three years, the Equivalent Forced Outage Rate - Demand (EFORd) increased, indicating a higher risk that a unit may not be available...Detailed analysis is needed to identify the root causes of increasing forced outage rate."
Ongoing GADSWG analysis is underway and preliminary results are presented in this report. Work still remains for the GADSWG.

NERC | State of Reliability Report 2015 | May 2015 75
Chapter 8 – Spare Equipment Initiatives
Background In June 2010, NERC issued a report titled High-Impact, Low-Frequency Event Risk to the North American Bulk Power System.69 In a postulated high-impact low-frequency (HILF) event, such as a coordinated physical or cyber attack or a severe geomagnetic disturbance (GMD), long-lead-time70 electric transmission system equipment may be damaged. This could adversely impact system reliability. Following a HILF event, increased industry and government coordination will help maximize the use of available spare transmission equipment in restoring the grid, thereby increasing the resiliency of the system. Following the aforementioned HILF report, the Spare Equipment Database Task Force (SEDTF) was created to update NERC’s existing spare equipment database. The objective was provide an automated system with enhanced information security and usability for the industry to locate spare equipment in the event of an emergency or other non-routine failure. The SEDTF provided NERC staff with guidance on how the new system should operate and the NERC Spare Equipment Database (SED)71 was developed. Following the development of the SED, the SEDTF became the Spare Equipment Database Working Group (SEDWG), with the purpose of conducting outreach and maintenance on the database. In September 2014, the SEDWG’s scope was updated to reflect the broader landscape of spare equipment and was renamed the Spare Equipment Working Group (SEWG).72 The SEWG will continue to oversee the SED, but also assess the industry’s posture on long-lead-time electric transmission equipment and act as a conduit for information exchange between the industry and government on the issue of spare equipment.
Spare Equipment and NERC Reliability Standards Physical Security Standard CIP-014-173 On November 20, 2014, FERC issued its final rule, largely approving CIP-014-1. CIP-014-1 focuses on critical facilities such as transmission stations or substations and their associated primary control centers that, if rendered inoperable or damaged, could have a critical impact on the operation of the interconnection through instability, uncontrolled separation, or cascading failures on the BPS. Requirement 5.5.1 of CIP-014-1 specifies an attribute for an entity’s plan: The physical security plan(s) shall include resiliency or security measures to deter, detect, delay, assess, communicate and respond to potential threats. Having the ability to quickly locate available spare transformers is an important function of expanding BES resilience.
Transmission Planning Standard TPL-001-474 The importance of spare transformers has also been identified in Requirement 2.1.5 of TPL-001-4, since they are a type of long-lead-time equipment:
69 High Impact, Low Frequency Event Risk to the North American Bulk Power System, June 2010,
http://www.nerc.com/pa/ci/resources/documents/hilf_report.pdf. 70 “Long lead time” is defined as six months or more. 71http://www.nerc.com/comm/PC/Spare Equipment Database Task Force SEDTF DL/SEDTF_Special_Report_October_2011.pdf. 72 SEWG Scope, http://www.nerc.com/comm/PC/Spare Equipment Database Task Force SEDTF 2013/SEWG_scope_09_16_2014.pdf. 73 Physical Security Standard, http://www.nerc.com/pa/Stand/Reliability Standards/CIP-014-1.pdf. 74 TPL standard, http://www.nerc.com/files/TPL-001-4.pdf.

Chapter 8 – Spare Equipment Initiatives
NERC | State of Reliability Report 2015 | May 2015 76
When an entity’s spare equipment strategy could result in the unavailability of major Transmission equipment that has a lead time of one year or more (such as a transformer), the impact of this possible unavailability on System performance shall be studied. The studies shall be performed for the P0, P1, and P2 categories identified in Table 1 with the conditions that the System is expected to experience during the possible unavailability of the long lead time equipment.
Spare Equipment Working Group (SEWG) Purpose of SEWG The purpose of the Spare Equipment Working Group (SEWG) is to oversee the collection of information on long-lead-time electric transmission system equipment, assess the industry’s posture on this equipment, and act as a conduit for information exchange between the industry and government on the issue of spare equipment.
SEWG Activities In 2014, the primary focus of the SEWG was to increase participation. The SEWG worked with NERC and industry associations to host webinars and make presentations to explain the program to registered entities and to solicit new participants. In 2015, the SEWG will continue to increase SED awareness and participation, work on methods to gauge and assess the success and goals for the SED, and develop a white paper on the industry’s posture on long-lead-time electric transmission equipment.
Spare Equipment Initiatives NERC and industry are employing various initiatives with respect to spare equipment. Some of them are listed below.
Spare Equipment Database75 The NERC SED is able to support entities in search of spare power transformers available for purchase from other non-affiliated entities. If a HILF event such as a terrorist attack or natural disaster were to occur, the SED provides entities in need of multiple transformers the ability to connect with entities that have spare transformers available. Providing information to the database is voluntary and meant to complement existing transformer sharing and mutual assistance agreements. The database is populated and managed by participating organizations bound by a mutual confidentiality agreement.
SEWG reviewed various types of long-lead-time equipment. Following the review, it was determined that the initial focus should be large power transformers and generator step-up (GSU) transformers. In addition to long lead times, large power transformers also require substantial capital to secure. For these reasons, owners typically maintain an appropriate limited number of spares in the event of a failure. It may be beneficial in the future to expand the SED to include other types of long-lead-time equipment. Confidentiality has been and continues to be an important aspect of the SED. Participating organizations voluntarily identify and report spare equipment that meets predefined criteria in the database. The data collected provides essential information to enable automated queries of available equipment. In addition, equipment owner information is required to facilitate communication following a HILF event. SED utilizes a double-blind approach to preserve the anonymity of the registered SED participants, the requestor, and the owner of the equipment. To initiate the search, the requestor completes an online form and the program conducts a search. Upon completion, the requestor and the NERC SED administrator are notified of the success of the search. From there, the SED program initiates a double-blind search-response procedure. SED generates
75 For further information related to the SED program, please visit: http://www.nerc.com/pa/RAPA/sed/Pages/Spare-Equipment-
Database-(SED).aspx

Chapter 8 – Spare Equipment Initiatives
NERC | State of Reliability Report 2015 | May 2015 77
messages to each unnamed TO identified by the search (without disclosing what equipment is needed, how many pieces of equipment are requested, or the name of the requestor). Owners who wish to proceed with discussing a sale/lease/exchange can use the double-blind search process to respond to the unnamed requestor to open an active discussion. Any decision to provide additional information is the responsibility of the owners. The NERC SED administrator is informed of all communications conducted via the SED link. The requestor and owner may then work toward a settlement acceptable to both parties. A complete description of the SED search process and a special report on the SED can be found on NERC’s website.76
Spare Transformer Equipment Program77 The Spare Transformer Equipment Program (STEP) was developed by industry through EEI in response to an industry-wide desire to cost-effectively increase reliability, particularly in the event of deliberate destruction of electrical transformers in connection with a terrorist event. The STEP program was designed to benefit the BPS by making certain that sufficient spare transformer capacity is available to allow an affected participating utility to restore its system following a triggering event to an N-0 reliability level. It does not, however, directly address routine failures or events that may cause specific, localized outages in distribution service to any particular facility. Although a triggering event is limited to an act of terrorism, the STEP program provides a ready mechanism for participating utilities to voluntarily share assets in the event of other catastrophic loss. There are currently 55 member utilities in the program.
SpareConnect78 SpareConnect is a mechanism for BPS asset owners and operators to network with other SpareConnect participants concerning the possible sharing of transmission and GSU transformers and related equipment, including bushings, fans, and auxiliary components. SpareConnect establishes a confidential, united platform for the entire electric industry to communicate equipment needs in the event of an emergency or other non-routine failure. SpareConnect complements existing programs, such as STEP and voluntary mutual assistance programs, by establishing an additional trusted network of participants who are uniquely capable of providing assistance concerning equipment availability and technical resources. SpareConnect does not create or manage a central database of spare equipment. Instead, the program provides decentralized access to points of contact at electric industry companies so that, in the event of an emergency, SpareConnect participants are able to connect quickly with other participants in a selected voltage class. SpareConnect does not impose any obligation on participants to provide any information or to make any particular piece of equipment available. Once connected, those SpareConnect participants who are interested in providing additional information or sharing equipment work directly and privately with each other on the specific terms and conditions of any potential equipment sale or other transaction.
76 Special Report: Spare Equipment Database System, October 2011,
http://www.nerc.com/docs/pc/sedtf/SEDTF_Special_Report_October_2011.pdf 77 For more information about STEP, see http://www.eei.org/issuesandpolicy/transmission/Pages/sparetransformers.aspx. 78 For more information about SpareConnect, contact: [email protected].

NERC | State of Reliability Report 2015 | May 2015 78
Chapter 9 – BES Security Metrics
Background The State of Reliability 2014 report noted that the NERC PAS was collaborating with the BESSMWG to develop security performance metrics. During 2014, the BESSMWG developed an initial set of five metrics that have been approved by NERC’s Critical Infrastructure Protection Committee (CIPC), with an additional two undergoing further development. This chapter introduces these new cyber and physical security metrics, provides results based on preliminary data collected during 2014, and proposes next steps to further refine these metrics, validate the results, and develop additional metrics.
Purpose For some years now, NERC and the electricity industry have taken actions to address cyber and physical security risks to the BES as a result of potential and real threats, vulnerabilities, and events. CIPC established the BESSMWG to develop a comprehensive set of security performance metrics. These metrics would complement other NERC reliability performance metrics by defining lagging and leading indicators for security performance as they relate to reliable BES operation.
Methodology The BESSMWG, composed of subject matter experts from NERC’s Electricity Sector Information Sharing and Analysis Center (ES-ISAC) and experts from the electricity sector who have experience in physical security, cybersecurity, and power system operations, began their work by sharing how they measure and manage security performance within their own organizations. Members discussed the processes used to manage their security programs, as well as their own experiences with real security incidents and their potential impact on the BES. Through these discussions, members considered the available sources of data that might be helpful for improving security performance for the electricity sector as a whole. They also discussed the relative merits of lagging and leading indicators with the goal of developing metrics that address both attributes. The BESSMWG identified the following challenges related to developing security performance metrics:
Limited Historical Data: To date, there have been relatively few security incidents with the potential to affect the BES. Physical security incidents, such as vandalism and sabotage, have occurred infrequently for decades, typically with little or no impact on BES reliability. However, recent high-profile events have increased awareness regarding the potential for physical security incidents to significantly impact the BES. Risks associated with cybersecurity appear to be rapidly evolving as the nature of cyber intrusions becomes increasingly sophisticated.
Limited Ability to Normalize Available Data: Ideally, metrics provide a proportional indication by statistically sampling a known fraction of the whole, instead of measuring all events. Security threats and vulnerabilities are constantly changing. Therefore, security performance metrics are limited to absolute numbers rather than statistically valid percentages of the whole. While absolute numbers may indicate trends, work must continue to normalize available data to further refine this metric.
Changing Threat Landscape: The frequency of physical and cybersecurity threats, vulnerabilities, and incidents, while historically low, is changing rapidly. Adversaries are becoming increasingly sophisticated in using malware to pursue targets.
Lagging Indicators are results-oriented, measure historical events, and tend to be easier to measure. Leading Indicators contribute to or precede events and tend to be more difficult to measure.

Chapter 9: BES Security Metrics
NERC | State of Reliability Report 2015 | May 2015 79
Sensitive Information: Information that details security threats, vulnerabilities, and real incidents is highly sensitive. In the wrong hands, this information can expose existing vulnerabilities to new and sophisticated exploits, create additional vulnerabilities, and limit effective response.
NERC Reliability Principles NERC’s Reliability Principles were developed to help ensure NERC’s Reliability Standards are developed in a consistent manner to support the reliability of the BES. While the development of security performance metrics is not limited to the scope of NERC’s Reliability Standards, the eighth principle is relevant.
8. Bulk power systems shall be protected from malicious physical or cyber attacks.
Assessing the Value of the Metrics To assess the relative value of the security metrics being considered, the BESSMWG used the same SMART79 rating criteria used for developing the reliability performance metrics. As the SMART criteria were developed specific to BES reliability, the BESSMWG found the criteria helped ensure that the impact of security on the reliability of the BES was kept foremost in mind. From that perspective, security metrics that did not have an apparent link to BES reliability received a lower SMART rating score, while those that have an apparent link received a higher score. The BESSMWG considered several general categories related to security performance:
Actual Physical and Cyber Events: NERC’s Reliability Standards require entities to report cyber and physical security incidents or events according to certain criteria. The BESSMWG considered metrics that would summarize these historical events as lagging indicators of security performance. Of importance is not just the number and frequency of these events over time, but also the extent to which they may have resulted in a loss of load to customers.
Information Sharing: The ability of entities to quickly and effectively share information with each other is an important capability when responding to new or rapidly evolving emergency situations. NERC’s ES-ISAC provides a central clearing house to receive, analyze, and share information with member entities. The BESSMWG considered metrics that would provide leading indicators of the extent to which entities are actively engaged with the ES-ISAC on a macro level.
Global Cyber Vulnerabilities: Cybersecurity is not a concern limited to the electricity sector. The BESSMWG considered publicly available metrics that describe how cyber vulnerabilities at the global level affecting all information technologies are changing over time. While these metrics do not provide a direct measure of the impact on the BES, they may provide leading indicators relevant to the electricity sector.
The BESSMWG considered an initial set of more than 20 security performance metrics. Detailed definitions have been developed for the top five of these metrics based on available data. An additional two are being considered for further development during 2015. All security performance metrics are reported on an aggregated basis at the North American level, as there is no evidence to suggest that details at the interconnection or Regional Entity levels would be meaningful.
79 SMART: Specific/Simple, Measurable, Attainable, Relevant, and Tangible/Timely.

Chapter 9: BES Security Metrics
NERC | State of Reliability Report 2015 | May 2015 80
Security Performance Metrics and Preliminary Results This section provides the five security performance metrics approved by CIPC for implementation.
BES Security Metric 1: Reportable Cyber Security Incidents This metric reports the total number of Reportable Cyber Security Incidents80 that occur over time and identifies how many of these incidents have resulted in a loss of load. It is important to note that any loss of load will be counted, regardless of direct cause. For example, if load was shed as a result of a loss of situation awareness caused by a cyber incident affecting an entity’s energy management system, the incident would be counted even though the cyber incident did not directly cause the loss of load (e.g., through an unauthorized breaker operation). This metric will provide an indication of the number of Reportable Cyber Security Incidents and the resilience of the BES to operate reliably and continue to serve load. This metric is based on data reported by entities, as required by Reliability Standard CIP-008-3, to NERC’s ES-ISAC, where it is analyzed. Data for this metric is provided in Table 9.1. Given the current relatively low number of such incidents, it is anticipated that the data will be gathered and summarized quarterly. Analysis of this security performance metric data shows that no Reportable Cyber Security Incident resulted in loss of load on the BPS in 2014.
Preliminary Results Based on Data Collected During 2014
Table 9.1: Reportable Cyber Security Incidents
Metric 2014 2015 2016
Q1 Q2 Q3 Q4 Q1 Q2 Q3 Q4 Q1 Q2 Q3 Q4
Total number of Reportable Cyber Security Incidents
3
Total number of Reportable Cyber Security Incidents resulting in loss of load
0
BES Security Metric 2: Reportable Physical Security Events This metric reports the total number of physical security reportable events81 that occur over time and identifies how many of these events have resulted in a loss of load. It is important to note that any loss of load will be counted, regardless of direct cause. For example, if load was shed as a result of safety concerns due to a break-in at a substation, the event would be counted even though no equipment was damaged to directly cause the loss of load. The metric will provide an indication of the number of physical security reportable events and the resilience of the BES to operate reliably and continue to serve load. This metric is based on data reported by entities as required by Reliability Standard EOP-004-2to NERC’s Bulk Power System Awareness group, which is then analyzed by NERC’s ES-ISAC. Data for this metric is provided in Table 9.2. Given the current relatively low frequency of such incidents, it is anticipated that the data will be gathered and summarized quarterly. Analysis of this security performance metric data showed that no physical security reportable event resulted in loss of load on the BPS in 2014.
80 Ref. NERC Glossary of Terms: “A Cyber Security Incident that has compromised or disrupted one or more reliability tasks of a functional
entity.” 81 Reportable Events are defined in Reliability Standard EOP-004-2 Event Reporting, Attachment 1.

Chapter 9: BES Security Metrics
NERC | State of Reliability Report 2015 | May 2015 81
Preliminary Results Based on Data Collected During 2014
Table 9.2: Reportable Physical Security Events
Metric 2014 2015 2016
Q1 Q2 Q3 Q4 Q1 Q2 Q3 Q4 Q1 Q2 Q3 Q4
Total number of reportable events as a result of physical security threats to a Facility or BES control center
47
Total number of reportable events that caused physical damage or destruction to a Facility
9
Total number of reportable events as a result of physical security threats to a Facility or BES control center, or that caused physical damage or destruction to a Facility, that resulted in a loss of load
0
BES Security Metric 3: ES-ISAC Membership This metric reports the total number of electricity sector organizations and individuals registered as members of the ES-ISAC. ES-ISAC member organizations include NERC registered entities and others in the electricity sector. Given today’s rapidly changing threat environment, it is important that electricity entities be able to quickly receive and share security-related information. This metric provides the number of organizations registered, as well as the number of individuals. Increasing ES-ISAC membership should serve to collectively increase awareness of security threats and vulnerabilities and enhance the sector’s ability to respond quickly and effectively. This metric is based on data available from the ES-ISAC. Data for this metric is provided in Table 9.3. It is anticipated that the data will be gathered and summarized quarterly. The data shows that registered membership of the ES-ISAC is increasing every quarter.
Preliminary Results Based on Data Collected During 2014
Table 9.3: ES-ISAC Membership
Metric 2014 2015 2016
Q1 Q2 Q3 Q4 Q1 Q2 Q3 Q4 Q1 Q2 Q3 Q4
Total number of electricity sector organizations registered as members of the ES-ISAC
496 557 578 827
Total number of individuals in ES-ISAC member organizations who have ES-ISAC accounts
1514 1844 2010 2770

Chapter 9: BES Security Metrics
NERC | State of Reliability Report 2015 | May 2015 82
BES Security Metric 4: Industry-Sourced Information Sharing This metric reports the total number of Incident Bulletins published by the ES-ISAC based on information voluntarily submitted by ES-ISAC member organizations. ES-ISAC member organizations include NERC registered entities and others in the electricity sector. Incident Bulletins describe cyber and physical security incidents and provide timely, relevant, and actionable information of broad interest to the electricity sector. But given security issues, they do not represent the complete picture of physical and cyber information available to or distributed by the ES-ISAC. This metric is based on data reported to and analyzed by the ES-ISAC. Data for this metric is provided in Table 9.4. Given the current relatively low frequency of such incidents, it is anticipated that the metric data will be gathered and summarized quarterly.
Preliminary Results Based on Data Collected During 2014
Table 9.4: Industry-Sourced Information Sharing
Metric 2014 2015 2016
Q1 Q2 Q3 Q4 Q1 Q2 Q3 Q4 Q1 Q2 Q3 Q4
Total number of ES-ISAC Incident Bulletins based on information provided by the electricity sector
18 26 22 14
BES Security Metric 5: Global Cyber Vulnerabilities This metric reports the number of global cybersecurity vulnerabilities that are considered to be high severity. This metric is based on data published by the National Institute of Standards and Technology (NIST). NIST defines high-severity vulnerabilities as those with a common vulnerability scoring system82 (CVSS) of seven or higher. As the term “global” implies, this metric is not limited to information technology typically used by electricity sector entities. As a result, this metric received a relatively low score using the SMART rating criteria. However, the BESSMWG recommends that this metric be adopted as it provides a leading indicator of the extent of constantly evolving cyber vulnerabilities and identifies trends beyond the electricity sector that may be relevant to the sector. Data for this metric is provided in Table 9.5. The data will be gathered and summarized quarterly.
Preliminary Results Based on Data Collected During 2014
Table 9.5: Global Cyber Vulnerabilities
Metric 2014 2015 2016
Q1 Q2 Q3 Q4 Q1 Q2 Q3 Q4 Q1 Q2 Q3 Q4
Number of global cyber vulnerabilities considered to be high severity
446 499 418 557
82 Ref. NIST http://nvd.nist.gov/cvss.cfm.

Chapter 9: BES Security Metrics
NERC | State of Reliability Report 2015 | May 2015 83
Next Steps The BESSMWG acknowledges that these five metrics represent only the first step in developing meaningful security performance metrics on behalf of the electricity industry. Through 2015, the BESSMWG will work with the ES-ISAC to help validate the data for these five metrics and continue to define additional metrics that can be developed with readily available data. In addition, the BESSMWG will develop a longer-term roadmap to explore other metrics that would be valuable, regardless of the extent to which the data is currently readily available.

NERC | State of Reliability Report 2015 | May 2015 84
Appendix A – Statistical Analysis for Risk Issue Identification
and Transmission Outage Severity Analysis
Study Method Defining BPS Impact from Transmission Risk The SRI presented in Chapter 2 consists of several weighted risk impact components: generation, transmission, and load loss.83 The transmission outage impact component of the SRI is defined as wT×NT, where wT is a weighting factor of 30 percent and NT is the severity impact of a given day’s transmission outages on the BPS based on TADS outages. Since transmission outages are a significant contributor to the overall SRI, this appendix provides an analysis of the individual TADS events based on TADS outage ICCs. Equation A.1 is used to calculate the transmission outage severity component of a TADS event. The severity of a transmission outage is calculated based on its assumed contribution of power flow through transmission circuits. The average power flow MVA values, or Equivalent MVA Values, used in Equation A.1, are shown in Table A.1. These Equivalent MVA Values are also applied to the denominator of the transmission outage severity equation to normalize the function. The TADS event severity is then analyzed by ICC to investigate relative information between the ICCs. For normalization, the total number of transmission circuits from the same year as the event is multiplied by each voltage class’s Equivalent MVA value. For example, if an outage occurred in 2014, the normalization would use the total number of transmission circuits in 2014. This allows comparison of TADS events across years while taking into account the changing number of circuits within the BPS.
𝑇𝑟𝑎𝑛𝑠𝑚𝑖𝑠𝑠𝑖𝑜𝑛 𝑆𝑒𝑣𝑒𝑟𝑖𝑡𝑦 (𝑇𝐴𝐷𝑆 𝑒𝑣𝑒𝑛𝑡) = [∑ (𝐸𝑞𝑢𝑖𝑣𝑎𝑙𝑒𝑛𝑡 𝑀𝑉𝐴)𝐴𝐶 𝑐𝑖𝑟𝑐𝑢𝑖𝑡 𝑂𝑢𝑡𝑎𝑔𝑒𝑠 𝑖𝑛 𝐸𝑣𝑒𝑛𝑡
∑ (𝐸𝑞𝑢𝑖𝑣𝑎𝑙𝑒𝑛𝑡 𝑀𝑉𝐴)𝐴𝐶 𝑐𝑖𝑟𝑐𝑢𝑖𝑡 𝐼𝑛𝑣𝑒𝑛𝑡𝑜𝑟𝑦 𝐶𝑜𝑢𝑛𝑡𝑠] ∙ 1000
Equation A.1
Table A.1: Transmission Outage Severity Equivalent
MVA Values
Voltage Class Equivalent MVA
Value
200–299 kV 700
300–399 kV 1300
400–599 kV 2000
600–799 kV 3000
In these studies, TADS events associated with automatic (forced) ac circuit outages that occurred from 2012 to 2014 are analyzed. Four data sets of TADS events studied separately are described further in Appendix A:
All TADS events
Common and Dependent Mode events
Sustained events
TADS events by Region
83 http://www.nerc.com/docs/pc/rmwg/pas/index_team/sri_equation_refinement_may6_2011.pdf, pp. 2-3.

Appendix A – Statistical Analysis for Risk Issue Identification and Transmission Outage Severity Analysis
NERC | State of Reliability Report 2015 | May 2015 85
Determining Initiating Causes and Modification Method TADS events are categorized by ICCs.84 These ICCs facilitate the study of cause-effect relationships between each event’s ICC and event severity. The procedure illustrated in Figure A.1 is used to determine a TADS event’s ICC. The procedure that defines ICCs for a TADS event allows ICC assignment to a majority of transmission outage events recorded in TADS.
Figure A.1: TADS Event Initiating Cause Code Selection Procedure
Previous state of reliability reports have analyzed the TADS data set and its ICCs. The 2013 and 2014 State of Reliability reports also included analysis based on an augmented data set that defined changes in ICCs to further distinguish normal clearing events from abnormal clearing events. Two TADS ICCs are impacted: Human Error and Failed Protection System Equipment.
TADS Human Error ICC is subdivided by type codes, which first became available in 2012. For the purpose of the state of reliability, data for two specific type codes related to protection system misoperation have been removed from the Human Error ICC and added to the Failed Protection System Equipment ICC. Those type codes are 61 dependability85 (failure to operate) and 62 security86 (unintended operation).
TADS Failed Protection System Equipment ICC plus the Human Error type code 61 and 62 data are added together in a new or augmented ICC labeled “Misoperation” in each state of reliability report.
The 2013 and 2014 State of Reliability reports have revealed that analyzing data based on both data sets (TADS ICCs and TADS augmented ICCs to include the Misoperation cause code) has not provided additional information. Therefore, starting with this report, the data and analysis in this appendix will be based on the augmented ICC data set, which currently contains three years of data. In future years, the analysis will be based on the most recent five years of augmented ICC data. In this report, references to ICC mean the augmented ICC as described above.
Event Statistics by Year There are 10,748 TADS events with ICCs assigned, comprising 99.6 percent of the total number of TADS events for the years 2012 to 2014. These events contribute 99.1 percent of the total calculated transmission outage severity of the database. Table A.2 provides the corresponding event statistics by year.
84 For detailed definitions of TADS cause codes, please refer to: http://www.nerc.com/pa/RAPA/tads/Transmission Availability Data
System Working Group/TADS Definitions (Appendix 7).pdf, January 14, 2013, pp. 19-20. 85 Event Type 61 Dependability (failure to operate): one or more automatic outages with delayed fault clearing due to failure of a single
protection system (primary or secondary backup) under either of these conditions:
Failure to initiate the isolation of a faulted power system Element as designed, or within its designed operating time, or
In the absence of a fault, failure to operate as intended within its designed operating time. 86 Event Type 62 Security (unintended operation): one or more automatic outages caused by improper operation (e.g., overtrip) of a
protection system resulting in isolating one or more TADS elements it is not intended to isolate, either during a fault or in the absence of a fault.

Appendix A – Statistical Analysis for Risk Issue Identification and Transmission Outage Severity Analysis
NERC | State of Reliability Report 2015 | May 2015 86
Table A.2: TADS Outage Events Summary (2012–2014)
Summary 2012 2013 2014 2012–2014
Number of TADS events 3,753 3,557 3,477 10787
Number of events with ICC assigned 3,724 3,557 3,467 10748
Percentage of events with ICC assigned 99.2% 100.0% 99.7% 99.6%
Transmission outage severity all TADS events 612.4 506.0 448.2 1566.6
Transmission outage severity of TADS events with ICC assigned
602.1 506.0 445.0 1553.1
Percentage of Transmission outage severity of events with TADS ICC assigned
98.3% 100.0% 99.3% 99.1%
In particular, the statistics in Table A.2 show that, on average, one transmission event occurs in North America every 2 hours and 26 minutes.
Events with Common ICC by Year and Estimates of Event Probability Table A.3 lists annual counts and hourly event probability of TADS events by ICC. The ICCs with the largest number of events are weather (with and without lightning), Unknown, Misoperation, Failed AC Circuit Equipment, and Failed AC Substation Equipment. These groups together amount to 76 percent of TADS events for three years. Almost all TADS ICC groups have sufficient data available to be used in a statistical analysis. Only three ICCs (Vegetation; Vandalism, Terrorism, or Malicious Acts; and Environmental) do not have enough observations for reliable statistical inferences. These are combined into a new group, named “Combined Smaller ICC Groups,” that can be statistically compared to every other group and also studied with respect to annual changes of transmission outage severity. With the development of the transmission outage severity measure and TADS event ICCs, it is possible to statistically analyze the most recent three years of TADS data (2012–2014). For TADS events initiated by a common cause, the probability87 of observing the initiation of an event during a given hour is estimated using the corresponding historical event occurrences reported in TADS. Namely, the event occurrence probability is the total number of occurrences for a given type of event observed during the historical data period divided by the total number of hours in the same period. Therefore, the sum of the estimated probabilities for all events is equal to the estimated probability of any event during a given hour.
87 Probability is estimated using event occurrence frequency of each ICC type without taking into account the event duration.

Appendix A – Statistical Analysis for Risk Issue Identification and Transmission Outage Severity Analysis
NERC | State of Reliability Report 2015 | May 2015 87
Table A.3: TADS Events and Hourly Event Probability by ICC (2012–2014)
Initiating Cause Code 2012 2013 2014 2012–2014 Event Initiation
Probability/Hour
Lightning 852 813 709 2374 0.090
Unknown 710 712 779 2201 0.084
Weather, excluding lightning 446 433 441 1320 0.050
Misoperation 321 281 314 916 0.035
Failed AC Circuit Equipment 261 248 224 733 0.028
Failed AC Substation Equipment 248 191 223 662 0.025
Foreign Interference 170 181 226 577 0.022
Human Error (w/o Type 61 OR Type 62) 212 191 149 552 0.021
Contamination 160 151 149 460 0.017
Fire 106 130 44 280 0.011
Power System Condition 77 109 83 269 0.010
Other 104 64 77 245 0.009
Combined Smaller ICC groups 57 53 49 159 0.006
Vegetation 43 36 39 118 0.004
Vandalism, Terrorism, or Malicious Acts 10 9 8 27 0.001
Environmental 4 8 2 14 0.001
All with ICC assigned 3724 3557 3467 10748 0.409
All TADS Events 3753 3557 3477 10787 0.410
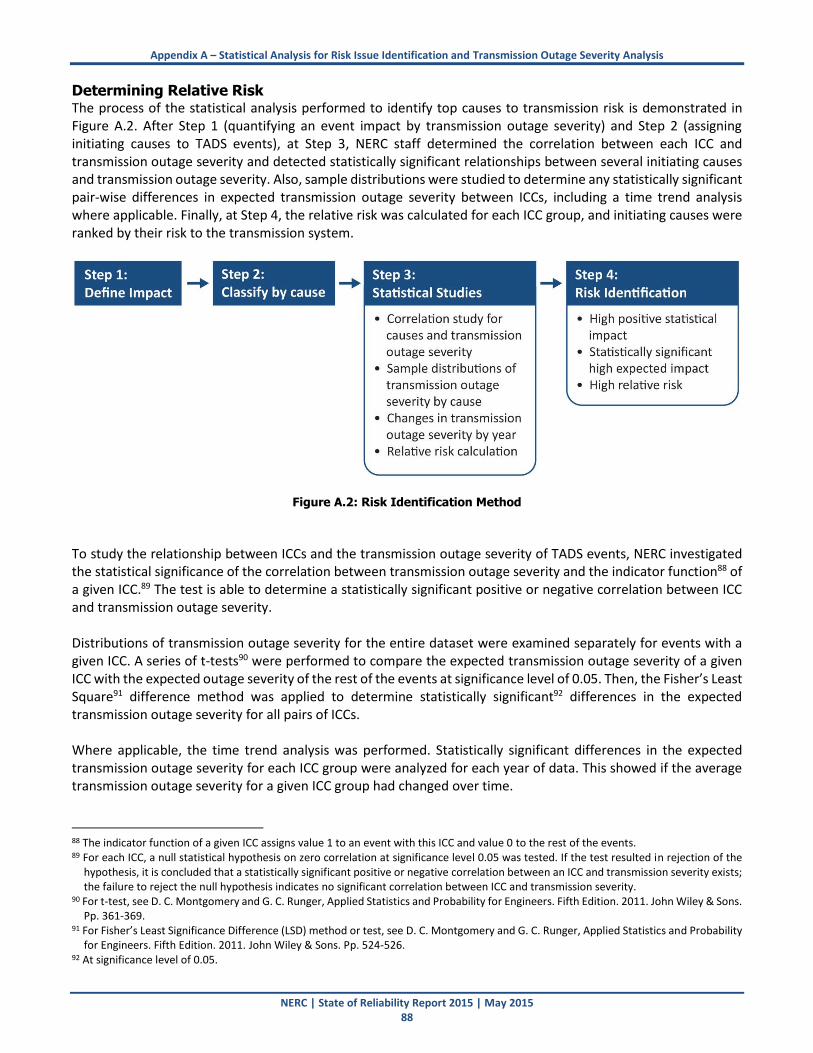
Appendix A – Statistical Analysis for Risk Issue Identification and Transmission Outage Severity Analysis
NERC | State of Reliability Report 2015 | May 2015 88
Determining Relative Risk The process of the statistical analysis performed to identify top causes to transmission risk is demonstrated in Figure A.2. After Step 1 (quantifying an event impact by transmission outage severity) and Step 2 (assigning initiating causes to TADS events), at Step 3, NERC staff determined the correlation between each ICC and transmission outage severity and detected statistically significant relationships between several initiating causes and transmission outage severity. Also, sample distributions were studied to determine any statistically significant pair-wise differences in expected transmission outage severity between ICCs, including a time trend analysis where applicable. Finally, at Step 4, the relative risk was calculated for each ICC group, and initiating causes were ranked by their risk to the transmission system.
Figure A.2: Risk Identification Method
To study the relationship between ICCs and the transmission outage severity of TADS events, NERC investigated the statistical significance of the correlation between transmission outage severity and the indicator function88 of a given ICC.89 The test is able to determine a statistically significant positive or negative correlation between ICC and transmission outage severity. Distributions of transmission outage severity for the entire dataset were examined separately for events with a given ICC. A series of t-tests90 were performed to compare the expected transmission outage severity of a given ICC with the expected outage severity of the rest of the events at significance level of 0.05. Then, the Fisher’s Least Square91 difference method was applied to determine statistically significant92 differences in the expected transmission outage severity for all pairs of ICCs. Where applicable, the time trend analysis was performed. Statistically significant differences in the expected transmission outage severity for each ICC group were analyzed for each year of data. This showed if the average transmission outage severity for a given ICC group had changed over time.
88 The indicator function of a given ICC assigns value 1 to an event with this ICC and value 0 to the rest of the events. 89 For each ICC, a null statistical hypothesis on zero correlation at significance level 0.05 was tested. If the test resulted in rejection of the
hypothesis, it is concluded that a statistically significant positive or negative correlation between an ICC and transmission severity exists; the failure to reject the null hypothesis indicates no significant correlation between ICC and transmission severity.
90 For t-test, see D. C. Montgomery and G. C. Runger, Applied Statistics and Probability for Engineers. Fifth Edition. 2011. John Wiley & Sons. Pp. 361-369.
91 For Fisher’s Least Significance Difference (LSD) method or test, see D. C. Montgomery and G. C. Runger, Applied Statistics and Probability for Engineers. Fifth Edition. 2011. John Wiley & Sons. Pp. 524-526.
92 At significance level of 0.05.

Appendix A – Statistical Analysis for Risk Issue Identification and Transmission Outage Severity Analysis
NERC | State of Reliability Report 2015 | May 2015 89
Finally, relative risk was calculated for each ICC group. The impact of an outage event was defined as the expected transmission outage severity associated with a particular ICC group. The probability that an event from a given group initiates during a given hour is estimated from the frequency of the events of each type without taking into account the event duration. The risk per hour of a given ICC was calculated as the product of the probability per hour and the expected severity (impact) of an event from this group. The relative risk was then defined as the percentage of the risk associated with each ICC out of the total (combined for all ICC events) risk per hour. Finally, risk profiles of TADS events initiated by common causes are visualized as bubble charts that summarize results of correlational, distributional, and risk ranking analyses.
Correlation between ICC and Transmission Outage Severity To study a relationship between ICC and transmission outage severity of TADS events, the statistical significance of the correlation between transmission outage severity and the indicator function93 of a given ICC was investigated.94 A statistically significant positive or negative correlation between ICC and transmission outage severity could be determined by the statistical test. There were three key outcomes of all the tests. A statistically significant positive correlation of ICC to transmission outage severity indicates a greater likelihood that an event with this ICC would result in a higher transmission outage severity. A stark negative correlation indicates the contrary; in this case, a lower transmission outage severity would be likely. If no significant correlation is found, it indicates the absence of a linear relationship between ICC and the transmission outage severity, and that the events with this ICC have an expected transmission outage severity similar to all other events from the database. Figure A.3 shows the correlations between calculated transmission outage severity and the given ICC. A red bar corresponds to an ICC with statistically significant positive correlation with transmission outage severity, a green bar corresponds to an ICC with statistically significant negative correlation, and a blue bar indicates no significant correlation. Thus, Misoperation, Failed AC Substation Equipment, and Power System Condition have statistically significant positive correlation with transmission outage severity. The expected severity of events with each of these ICCs is greater than the expected severity of other ICC events. Secondly, Weather Excluding Lightning, Foreign Interference, Unknown, and Combined Smaller ICC Groups have a statistically significant negative correlation with transmission outage severity. The expected severity of events initiated by these causes is less than the expected transmission outage severity of other TADS events. Finally, events with each of the ICCs with blue bars have the expected transmission outage severity similar to all other events in TADS.
93 The indicator function of a given ICC assigns value 1 to an event with this ICC and value 0 to the rest of the events. 94 For each ICC, a null statistical hypothesis on zero correlation at significance level 0.05 was tested. If the test resulted in rejection of the
hypothesis, it is concluded that a statistically significant positive or negative correlation between an ICC and transmission outage severity exists; the failure to reject the null hypothesis indicates no significant correlation between ICC and transmission outage severity.
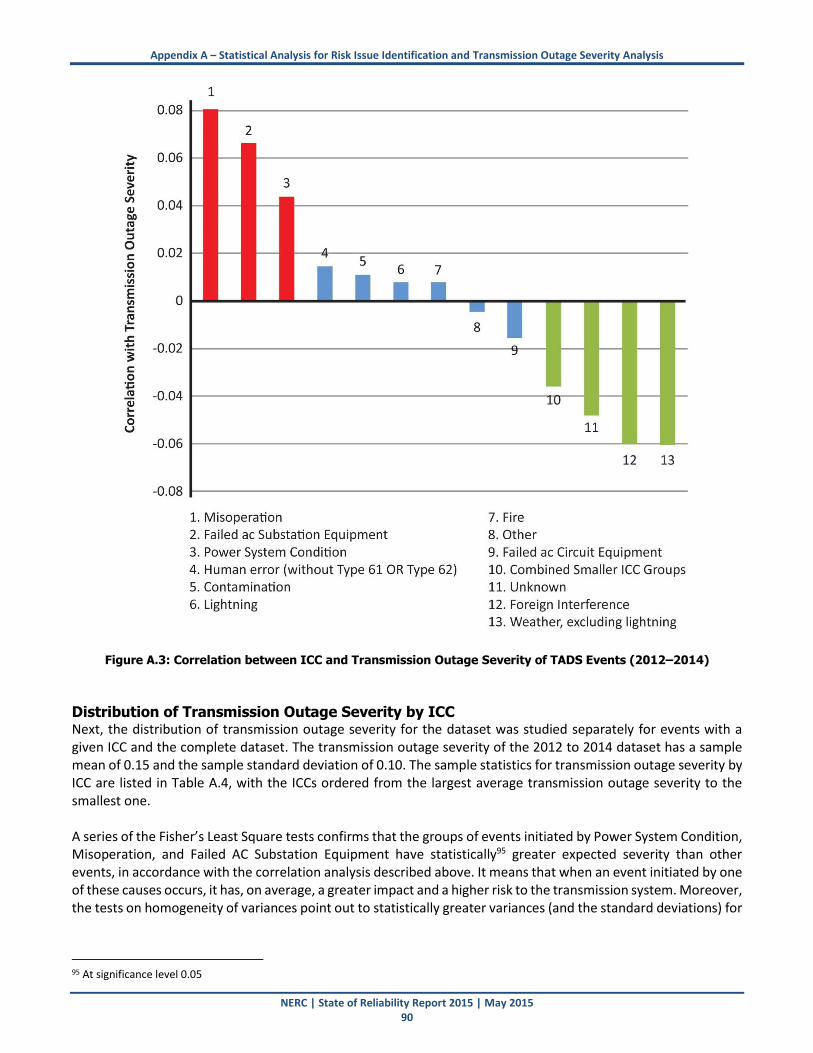
Appendix A – Statistical Analysis for Risk Issue Identification and Transmission Outage Severity Analysis
NERC | State of Reliability Report 2015 | May 2015 90
Figure A.3: Correlation between ICC and Transmission Outage Severity of TADS Events (2012–2014)
Distribution of Transmission Outage Severity by ICC Next, the distribution of transmission outage severity for the dataset was studied separately for events with a given ICC and the complete dataset. The transmission outage severity of the 2012 to 2014 dataset has a sample mean of 0.15 and the sample standard deviation of 0.10. The sample statistics for transmission outage severity by ICC are listed in Table A.4, with the ICCs ordered from the largest average transmission outage severity to the smallest one. A series of the Fisher’s Least Square tests confirms that the groups of events initiated by Power System Condition, Misoperation, and Failed AC Substation Equipment have statistically95 greater expected severity than other events, in accordance with the correlation analysis described above. It means that when an event initiated by one of these causes occurs, it has, on average, a greater impact and a higher risk to the transmission system. Moreover, the tests on homogeneity of variances point out to statistically greater variances (and the standard deviations) for
95 At significance level 0.05
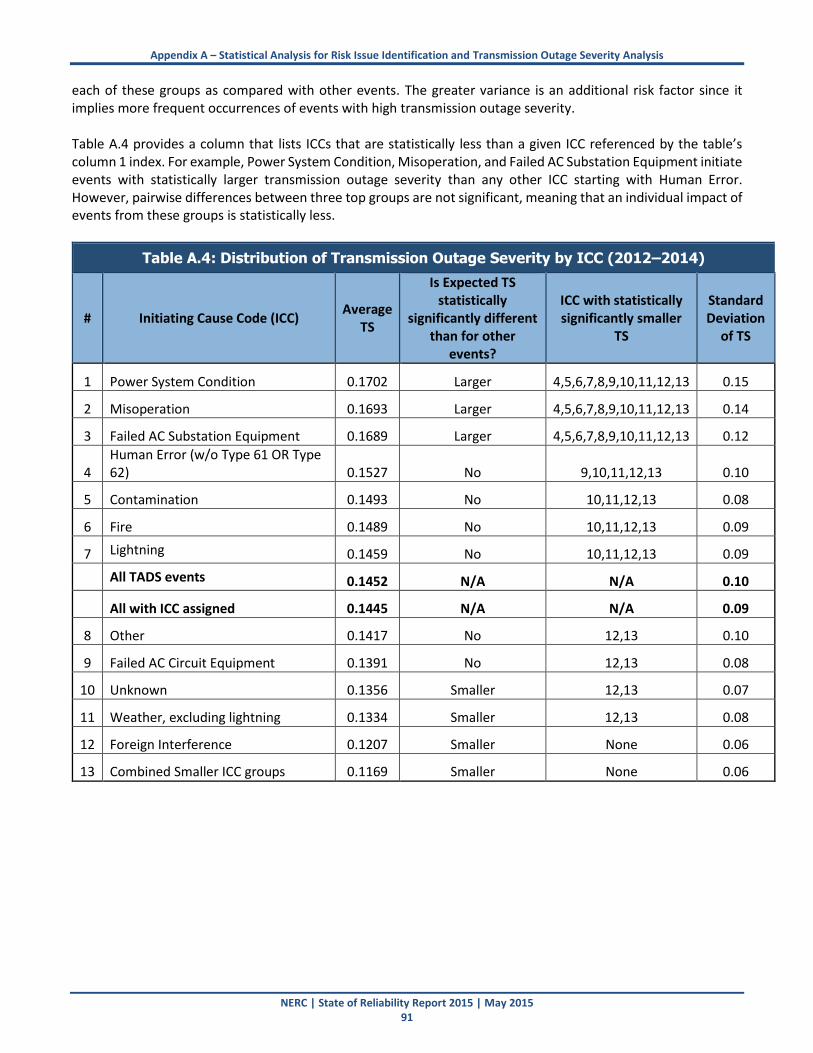
Appendix A – Statistical Analysis for Risk Issue Identification and Transmission Outage Severity Analysis
NERC | State of Reliability Report 2015 | May 2015 91
each of these groups as compared with other events. The greater variance is an additional risk factor since it implies more frequent occurrences of events with high transmission outage severity. Table A.4 provides a column that lists ICCs that are statistically less than a given ICC referenced by the table’s column 1 index. For example, Power System Condition, Misoperation, and Failed AC Substation Equipment initiate events with statistically larger transmission outage severity than any other ICC starting with Human Error. However, pairwise differences between three top groups are not significant, meaning that an individual impact of events from these groups is statistically less.
Table A.4: Distribution of Transmission Outage Severity by ICC (2012–2014)
# Initiating Cause Code (ICC) Average
TS
Is Expected TS statistically
significantly different than for other
events?
ICC with statistically significantly smaller
TS
Standard Deviation
of TS
1 Power System Condition 0.1702 Larger 4,5,6,7,8,9,10,11,12,13 0.15
2 Misoperation 0.1693 Larger 4,5,6,7,8,9,10,11,12,13 0.14
3 Failed AC Substation Equipment 0.1689 Larger 4,5,6,7,8,9,10,11,12,13 0.12
4 Human Error (w/o Type 61 OR Type 62) 0.1527 No 9,10,11,12,13 0.10
5 Contamination 0.1493 No 10,11,12,13 0.08
6 Fire 0.1489 No 10,11,12,13 0.09
7 Lightning 0.1459 No 10,11,12,13 0.09
All TADS events 0.1452 N/A N/A 0.10
All with ICC assigned 0.1445 N/A N/A 0.09
8 Other 0.1417 No 12,13 0.10
9 Failed AC Circuit Equipment 0.1391 No 12,13 0.08
10 Unknown 0.1356 Smaller 12,13 0.07
11 Weather, excluding lightning 0.1334 Smaller 12,13 0.08
12 Foreign Interference 0.1207 Smaller None 0.06
13 Combined Smaller ICC groups 0.1169 Smaller None 0.06

Appendix A – Statistical Analysis for Risk Issue Identification and Transmission Outage Severity Analysis
NERC | State of Reliability Report 2015 | May 2015 92
Average Transmission Outage Severity by ICC: Annual Changes Year-over-year changes in calculated transmission outage severity by ICC were reviewed next. Figure A.4 shows changes in the average transmission outage severity for each ICC for the 2012 to 2014 dataset. The groups of ICC events are listed from left to right by descending average transmission outage severity for the three years. The largest average transmission outage severity over the data period was observed for events initiated by Power System Condition.
Figure A.4: Average Transmission Outage Severity of TADS Events by ICC (2012–2014)
It should be noted that Power System Condition ICC, which in the State of Reliability 2014 report followed Failed AC Substation Equipment and Misoperations ICCs, moved to the top spot based on the three-year data. Power System Condition is defined as “Automatic Outages caused by power system conditions such as instability, overload trip, out‐of‐step, abnormal voltage, abnormal frequency, or unique system configurations (e.g., an abnormal terminal configuration due to existing condition with one breaker already out of service).” In Figure A.4, one can see that both Failed AC Substation Equipment and Misoperations ICCs have a large reduction in the average transmission outage severity from 2012 to 2013 and stayed essentially flat from 2013 to 2014. Statistical tests confirm that these decreases from 2012 to 2013 were statistically significant.96 In contrast, the average transmission outage severity of events initiated by Power System Condition had no significant year-over-year changes over these three years. Another important conclusion comes from the analysis of transmission outage severity of all TADS events with ICC assigned. Their average transmission outage severity significantly decreased from 2012 to 2013 and then again from 2013 to 2014. The same trend is observed for events with ICCs Lightning, Unknown, and Weather excluding Lightning—the three largest groups of TADS events.
96 This summary only lists changes that are statistically significant at the 0.05 level.

Appendix A – Statistical Analysis for Risk Issue Identification and Transmission Outage Severity Analysis
NERC | State of Reliability Report 2015 | May 2015 93
Transmission Outage Severity Risk and Relative Risk of TADS Events by ICC The risk of each ICC group can be defined as the total transmission outage severity associated with this group; its relative risk is equal to the percentage of the group transmission outage severity in the 2012 to 2014 database. Equivalently, the risk of a given ICC per hour can be defined as the product of the probability that an event with this ICC initiates during an hour and the expected severity (impact) of an event from this group. For any ICC group, the relative risk per hour is the same as the relative risk for a year (or any other time period) if estimated from the same dataset. Relative risk of the 2012 to 2014 TADS events by ICC is listed in Table A.5. The probability that an event from a given group initiated during a given hour is estimated from the frequency of the events of each type without taking into account the event duration. Excluding weather-related events and events with Unknown ICC, events initiated by Misoperations and by Failed AC Substation Equipment had the largest shares in the total transmission outage severity and contributed 9.9 and 7.1 percent, respectively, to transmission outage severity relative risk. Note that Power System Condition has a low rank despite having the largest average transmission outage severity of an individual event from this group. The reason is that there is a small number of events with this ICC and, therefore, rare occurrences of these events are reflected by their small probability.
Table A.5: Relative Risk by ICC (2012–2014)
Group of TADS events
Probability that an event from a group starts during a given
hour
Expected Impact (expected
transmission outage severity of an event)
Risk associated
with a group per hour
Relative Risk by group
All TADS events 0.410 0.145 0.0596 100.0%
All with ICC assigned 0.409 0.144 0.0590 99.1%
Lightning 0.090 0.146 0.0132 22.1%
Unknown 0.084 0.136 0.0113 19.1%
Weather, excluding lightning 0.050 0.133 0.0067 11.2%
Misoperation 0.035 0.169 0.0059 9.9%
Failed AC Substation Equipment 0.025 0.169 0.0043 7.1%
Failed AC Circuit Equipment 0.028 0.139 0.0039 6.5%
Human Error (w/o Type 61 OR Type 62) 0.021 0.153 0.0032 5.4%
Foreign Interference 0.022 0.121 0.0026 4.4%
Contamination 0.017 0.149 0.0026 4.4%
Power System Condition 0.010 0.170 0.0017 2.9%
Fire 0.011 0.149 0.0016 2.7%
Other 0.009 0.142 0.0013 2.2%
Combined Smaller ICC groups 0.006 0.117 0.0007 1.2%
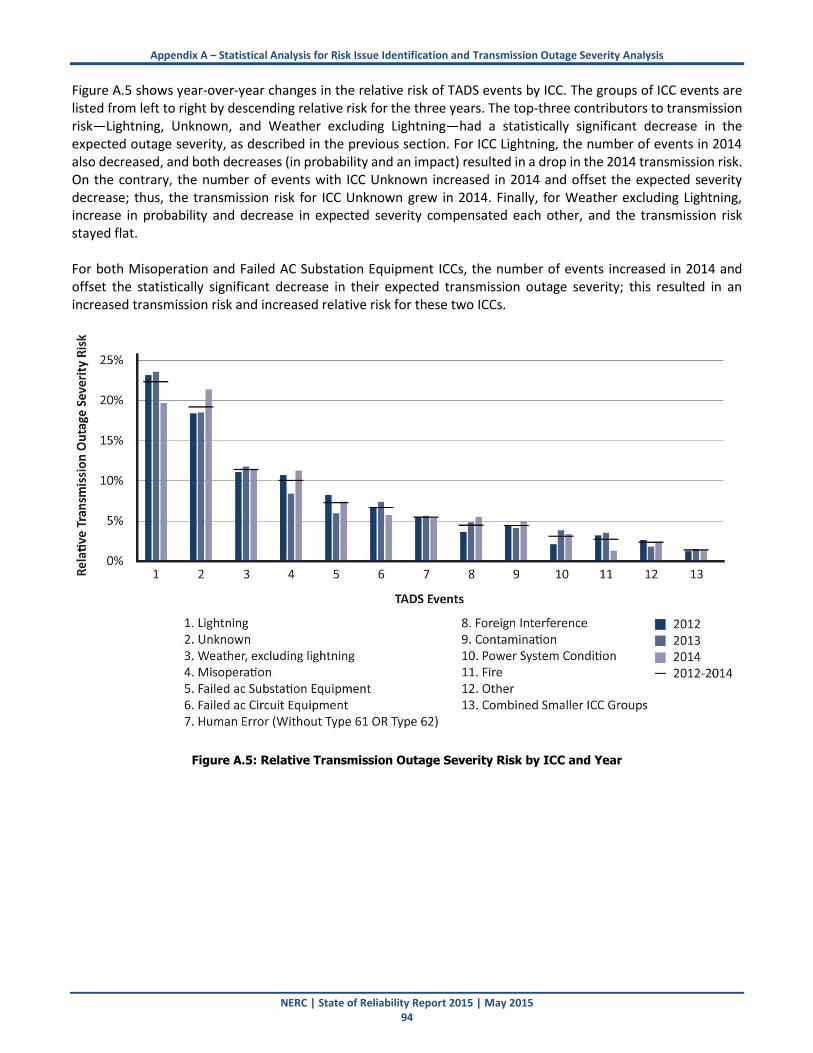
Appendix A – Statistical Analysis for Risk Issue Identification and Transmission Outage Severity Analysis
NERC | State of Reliability Report 2015 | May 2015 94
Figure A.5 shows year-over-year changes in the relative risk of TADS events by ICC. The groups of ICC events are listed from left to right by descending relative risk for the three years. The top-three contributors to transmission risk—Lightning, Unknown, and Weather excluding Lightning—had a statistically significant decrease in the expected outage severity, as described in the previous section. For ICC Lightning, the number of events in 2014 also decreased, and both decreases (in probability and an impact) resulted in a drop in the 2014 transmission risk. On the contrary, the number of events with ICC Unknown increased in 2014 and offset the expected severity decrease; thus, the transmission risk for ICC Unknown grew in 2014. Finally, for Weather excluding Lightning, increase in probability and decrease in expected severity compensated each other, and the transmission risk stayed flat. For both Misoperation and Failed AC Substation Equipment ICCs, the number of events increased in 2014 and offset the statistically significant decrease in their expected transmission outage severity; this resulted in an increased transmission risk and increased relative risk for these two ICCs.
Figure A.5: Relative Transmission Outage Severity Risk by ICC and Year

Appendix A – Statistical Analysis for Risk Issue Identification and Transmission Outage Severity Analysis
NERC | State of Reliability Report 2015 | May 2015 95
Common/Dependent Mode Event ICC Study (2012–2014) TADS also provides information to classify outages as single-mode or common or dependent mode (CDM) events that should be evaluated separately from single-mode events. CDM events result in multiple transmission element outages. It is important to monitor and understand CDM events due to their potential risk to system reliability. These TADS events have more transmission outage severity than TADS events with a Single Mode outage. A Single Mode event is defined as a TADS event with a single-element outage. A CDM TADS event is a TADS event where all outages have one of the modes (other than Single Mode) in Table A.6. Based on this definition, every TADS event was categorized as either a Single Mode event or a CDM event. Some TADS events were entered as a combination of Single Mode outages and other outage modes. These events were manually examined to determine if the event was Single Mode or CDM. For some events, it was not possible to determine whether the event was Single Mode or CDM, nor was it possible to tell the ICC for the event. These events, approximately 0.3 percent of all TADS events, were removed from the study.
Table A.6: Outage Mode Codes
Outage Mode Code Automatic Outage Description
Single Mode A single-element outage that occurs independently of another automatic outage
Dependent Mode Initiating A single-element outage that initiates at least one subsequent element automatic outage
Dependent Mode
An automatic outage of an element that occurred as a result of an initiating outage, whether the initiating outage was an element outage or a non-element outage
Common Mode
One of at least two automatic outages with the same initiating cause code where the outages are not consequences of each other and occur nearly simultaneously
Common Mode Initiating A common-mode outage that initiates one or more subsequent automatic outages
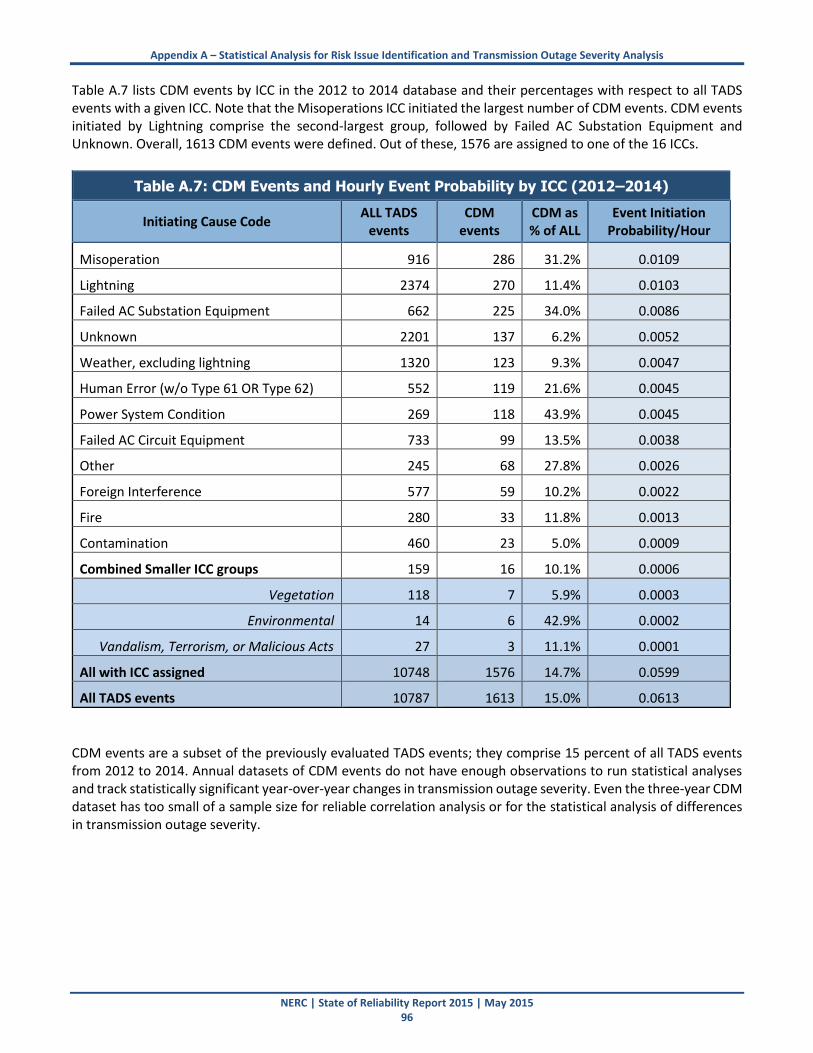
Appendix A – Statistical Analysis for Risk Issue Identification and Transmission Outage Severity Analysis
NERC | State of Reliability Report 2015 | May 2015 96
Table A.7 lists CDM events by ICC in the 2012 to 2014 database and their percentages with respect to all TADS events with a given ICC. Note that the Misoperations ICC initiated the largest number of CDM events. CDM events initiated by Lightning comprise the second-largest group, followed by Failed AC Substation Equipment and Unknown. Overall, 1613 CDM events were defined. Out of these, 1576 are assigned to one of the 16 ICCs.
Table A.7: CDM Events and Hourly Event Probability by ICC (2012–2014)
Initiating Cause Code ALL TADS
events CDM
events CDM as % of ALL
Event Initiation Probability/Hour
Misoperation 916 286 31.2% 0.0109
Lightning 2374 270 11.4% 0.0103
Failed AC Substation Equipment 662 225 34.0% 0.0086
Unknown 2201 137 6.2% 0.0052
Weather, excluding lightning 1320 123 9.3% 0.0047
Human Error (w/o Type 61 OR Type 62) 552 119 21.6% 0.0045
Power System Condition 269 118 43.9% 0.0045
Failed AC Circuit Equipment 733 99 13.5% 0.0038
Other 245 68 27.8% 0.0026
Foreign Interference 577 59 10.2% 0.0022
Fire 280 33 11.8% 0.0013
Contamination 460 23 5.0% 0.0009
Combined Smaller ICC groups 159 16 10.1% 0.0006
Vegetation 118 7 5.9% 0.0003
Environmental 14 6 42.9% 0.0002
Vandalism, Terrorism, or Malicious Acts 27 3 11.1% 0.0001
All with ICC assigned 10748 1576 14.7% 0.0599
All TADS events 10787 1613 15.0% 0.0613
CDM events are a subset of the previously evaluated TADS events; they comprise 15 percent of all TADS events from 2012 to 2014. Annual datasets of CDM events do not have enough observations to run statistical analyses and track statistically significant year-over-year changes in transmission outage severity. Even the three-year CDM dataset has too small of a sample size for reliable correlation analysis or for the statistical analysis of differences in transmission outage severity.

Appendix A – Statistical Analysis for Risk Issue Identification and Transmission Outage Severity Analysis
NERC | State of Reliability Report 2015 | May 2015 97
Upon combining the three smallest ICC group (Vegetation; Environmental; and Vandalism, Terrorism, or Malicious Acts) into a new group (Combined Smaller ICC groups), the transmission risk and relative risk by ICC were calculated and ranked. Table A.8 provides a breakdown of relative risk of CDM events by ICC.
Table A.8: Evaluation of CDM Event ICC Contribution to Transmission Outage Severity (2012–2014)
Group of TADS events
Probability that an event from a group starts during a given
hour
Expected Impact (expected
transmission outage severity of an event)
Risk associated
with a group per hour
Relative Risk by group
All TADS events 0.410 0.145 0.060 100.0%
All CDM events 0.061 0.226 0.014 23.3%
All CDM with ICC assigned 0.060 0.224 0.013 22.5%
CDM Lightning 0.0103 0.2394 0.002 4.1%
CDM Misoperation 0.0109 0.2202 0.002 4.0%
CDM Failed AC Substation Equipment 0.0086 0.2270 0.002 3.3%
CDM Unknown 0.0052 0.2270 0.001 2.0%
CDM Weather, excluding lightning 0.0047 0.2221 0.001 1.7%
CDM Human Error (w/o Type 61 OR Type 62) 0.0045 0.2273 0.001 1.7%
CDM Power System Condition 0.0045 0.2152 0.001 1.6%
CDM Failed AC Circuit Equipment 0.0038 0.2378 0.001 1.5%
CDM Other 0.0026 0.1854 0.000 0.8%
CDM Foreign Interference 0.0022 0.1823 0.000 0.7%
CDM Fire 0.0013 0.2440 0.000 0.5%
CDM Contamination 0.0009 0.2530 0.000 0.4%
CDM Combined Smaller ICC groups 0.0006 0.1467 0.000 0.1%
Analysis of the TADS CDM events indicated that events with ICCs of Misoperation and Failed AC Substation Equipment are the two largest contributors to transmission outage severity with the exception of weather-related events. However, there is no significant correlation between any ICC and the transmission outage severity, which might be due to insufficient sample size of ICC groups and the whole CDM dataset for three years.
Appendix A – Statistical Analysis for Risk Issue Identification and Transmission Outage Severity Analysis
NERC | State of Reliability Report 2015 | May 2015 98
Sustained Event ICC Study (2012 to 2014) TADS provides information to classify automatic outages as momentary or sustained.97 A momentary outage is defined as an automatic outage with an outage duration less than one minute. If the circuit recloses and trips again within less than a minute of the initial outage, it is only considered one outage. The circuit would need to remain in service for longer than one minute between the breaker operations to be considered as two outages. A sustained outage98 is defined as an automatic outage with an outage duration of a minute or greater. The definition of sustained outage has been extended to a TADS event with duration of a minute or greater. It is important to monitor and understand sustained outages and sustained events due to their potential risk to system reliability. Since outage duration is not included in the definition of transmission outage severity (Equation A.1), NERC staff studied the transmission outage severity of sustained events by ICC. Table A.9 lists sustained events by ICC in the 2012 to 2014 database and their percentages with respect to all TADS events with a given ICC. Unlike all TADS events and CDM events, events with an Unknown ICC represented the largest number of sustained events. Sustained events initiated by Weather excluding Lightning ICC comprise the second largest group, followed by Lightning and Misoperation. Overall, 5908 sustained events were reported, representing 54.8 percent of all TADS events from 2012 to 2014. Out of these, 5878 are assigned to one of the 16 ICCs. Almost all ICC groups of sustained events have sufficient data available to be used in a statistical analysis. Only two ICCs (Vandalism, Terrorism, or Malicious Acts; and Environmental) do not have enough observations for reliable statistical inferences based on the 2012 to 2014 data. These are combined into a new group, named “Combined Smaller ICC Groups,” that can be statistically compared to every other group and used for reliable correlation analysis and for the statistical analysis of differences in transmission outage severity.
97 http://www.nerc.com/pa/RAPA/tads/Pages/default.aspx. 98 The TADS definition of Sustained Outage is different from the NERC Glossary of Terms Used in Reliability Standards definition of Sustained
Outage that is presently only used in FAC‐003‐1. The glossary defines a Sustained Outage as follows: “The deenergized condition of a transmission line resulting from a fault or disturbance following an unsuccessful automatic reclosing sequence and/or unsuccessful manual reclosing procedure.” The definition is inadequate for TADS reporting for two reasons. First, it has no time limit that would distinguish a sustained outage from a momentary outage. Second, for a circuit with no automatic reclosing, the outage would not be “counted” if the TO has a successful manual reclosing under the glossary definition.

Appendix A – Statistical Analysis for Risk Issue Identification and Transmission Outage Severity Analysis
NERC | State of Reliability Report 2015 | May 2015 99
Table A.9: Sustained Events and Hourly Event Probability by ICC (2012–2014)
Initiating Cause Code ALL
TADS events
Sustained events
Sustained as % of ALL
Sustained Event Initiation
Probability/Hour
Unknown 2201 864 39.3% 0.0328
Weather, excluding lightning 1320 836 63.3% 0.0318
Lightning 2374 702 29.6% 0.0267
Misoperation 916 697 76.1% 0.0265
Failed AC Circuit Equipment 733 572 78.0% 0.0217
Failed AC Substation Equipment 662 562 84.9% 0.0214
Human Error (w/o Type 61 OR Type 62) 552 475 86.1% 0.0181
Foreign Interference 577 298 51.6% 0.0113
Fire 280 209 74.6% 0.0079
Power System Condition 269 188 69.9% 0.0071
Other 245 181 73.9% 0.0069
Contamination 460 171 37.2% 0.0065
Vegetation 118 89 75.4% 0.0034
Combined Smaller ICC groups 41 34 82.9% 0.0013
Vandalism, Terrorism, or Malicious Acts 27 22 81.5% 0.0008
Environmental 14 12 85.7% 0.0005
All with ICC assigned 10748 5878 54.7% 0.2235
All TADS events 10787 5908 54.8% 0.2246
Figure A.6 shows the correlation between calculated transmission outage severity and each ICC in the same format as Figure A.3.

Appendix A – Statistical Analysis for Risk Issue Identification and Transmission Outage Severity Analysis
NERC | State of Reliability Report 2015 | May 2015 100
Figure A.6: Correlation between ICC and Transmission Outage Severity of Sustained Events (2012–2014)

Appendix A – Statistical Analysis for Risk Issue Identification and Transmission Outage Severity Analysis
NERC | State of Reliability Report 2015 | May 2015 101
Next, the distribution of transmission outage severity for the dataset was studied separately for sustained events with a given ICC. The sample statistics for transmission outage severity by ICC are listed in Table A.10 in the same format as Table A.4. Sustained events initiated by Power System Condition have the highest expected transmission outage severity, followed by events with ICCs Misoperation and Failed AC Substation Equipment. These groups not only have the statistically greater than expected outage severity than other sustained events, but also the greater variation, which means more frequent occurrences of events with these ICCs, which have very high transmission outage severity.
Table A.10: Distribution of Transmission Outage Severity of Sustained Events by ICC (2012–2014)
# Initiating Cause Code (ICC) Average
TS
Is Expected TS statistically significantly
different than for other sustained
events?
ICC with statistically significantly smaller TS
Standard Deviation
of TS
1 Power System Condition 0.196 Larger 2,3,4,5,6,7,8,9,10,1
1,12,13,14 0.18
2 Misoperation 0.175 Larger 5,6,7,8,9,10,11,12,1
3,14 0.15
3 Failed AC Substation Equipment 0.174 Larger 7,8,9,10,11,12,13,1
4 0.13
4 Contamination 0.171 Larger 9,10,11,12,13,14 0.10
5 Lightning 0.163 Larger 9,10,11,12,13,14 0.11
6 Fire 0.157 No 10,11,13,14 0.10
7 Human Error (w/o 61 OR Type 62) 0.155 No 10,11,13,14 0.11
All Sustained Events 0.154 N/A N/A 0.11
Sustained with ICC 0.153 N/A N/A 0.11
8 Other 0.150 No 11,13,14 0.12
9 Unknown 0.146 Smaller 11,13,14 0.09
10 Failed AC Circuit Equipment 0.140 Smaller 13,14 0.09
11 Weather, excluding lightning 0.132 Smaller None 0.08
12 Combined Smaller ICC groups 0.123 Smaller None 0.05
13 Foreign Interference 0.122 Smaller None 0.07
14 Vegetation 0.110 Smaller None 0.05

Appendix A – Statistical Analysis for Risk Issue Identification and Transmission Outage Severity Analysis
NERC | State of Reliability Report 2015 | May 2015 102
Finally, the transmission risk and relative risk by ICC were calculated and ranked. Table A.11 provides a breakdown of relative risk of CDM events by ICC.
Table A.11: Evaluation of Sustained Event ICC Contribution to Transmission Outage Severity (2012–2014)
Group of Sustained events
Probability that an event from a
group starts during a given
hour
Expected Impact (expected
transmission outage severity
of an event)
Risk associated
with a group per
hour
Relative Risk by group
All TADS events 0.410 0.145 0.0596 100.0%
All Sustained events 0.225 0.154 0.0346 58.1%
Sustained with ICC assigned 0.223 0.153 0.0342 57.5%
Unknown 0.033 0.146 0.0048 8.0%
Misoperation 0.026 0.175 0.0046 7.8%
Lightning 0.027 0.163 0.0044 7.3%
Weather, excluding lightning 0.032 0.132 0.0042 7.0%
Failed AC Substation Equipment 0.021 0.174 0.0037 6.2%
Failed AC Circuit Equipment 0.022 0.140 0.0030 5.1%
Human Error (w/o Type 61 OR Type 62)
0.018 0.155 0.0028 4.7%
Power System Condition 0.007 0.196 0.0014 2.4%
Foreign Interference 0.011 0.122 0.0014 2.3%
Fire 0.008 0.157 0.0013 2.1%
Contamination 0.007 0.171 0.0011 1.9%
Other 0.007 0.150 0.0010 1.7%
Vegetation 0.003 0.110 0.0004 0.6%
Combined Smaller ICC groups 0.001 0.123 0.0002 0.3%
Analysis of the TADS sustained events indicated that the ICC Unknown has the greatest relative risk for sustained events from 2012 to 2014. Sustained events with ICCs of Misoperation and Failed AC Substation Equipment are the two largest contributors to transmission outage severity with the exception of weather-related events. Also, they have a significant positive correlation with transmission outage severity. The ICC with the highest expected severity, Power System Condition, ranks low in Table A.11; its relative risk is small due to rare occurrences of sustained events with this ICC.

Appendix A – Statistical Analysis for Risk Issue Identification and Transmission Outage Severity Analysis
NERC | State of Reliability Report 2015 | May 2015 103
Regional Entity Transmission Analysis For the first time, NERC performed a study of the transmission outage severity of TADS events by Region. This analysis is based on the 2012–2014 TADS data and utilizes the general methodology described in the previous sections. Here, a summary of this analysis is introduced and similarities and differences in transmission risk profiles by Region are examined. Figure A.7 shows the breakdown of NERC-wide inventory and transmission outage severity risk by Region.
Figure A.7: NERC Inventory and Transmission Outage Severity Breakdown by Region (2012–2014)
Next, the transmission outage severity by initiating cause was studied for each Region. As for the entire NERC study described in the previous sections, three ICCs (Vegetation; Vandalism, Terrorism, or Malicious Acts; and Environmental) were grouped into a new group, named “Combined Smaller ICCs.” A comparative analysis of Regional Entity relative risks by ICC is summarized in Figure A.8. Figure A.8 represents the breakdown by relative risk by Region and for NERC. Initiating causes are listed from left to right by decreasing relative risk for NERC data. For the top NERC ICCs, the relative risks vary dramatically among Regions. Relative risk for Lightning ranges from 10 percent in FRCC to 32 percent for SPP. Events with ICC Unknown contribute between 9 percent for RFC and 30 percent in WECC. Weather excluding Lightning, as an outage cause code, initiates events comprising 9 percent transmission outage severity in NPCC and 24 percent in MRO. Misoperation has the highest relative risk in NPCC (18 percent) and the lowest in FRCC (6 percent) with other Regions’ numbers close to the NERC average of 10 percent. For MRO, AC Substation Equipment failures resulted in only 4 percent of the total transmission outage severity, while they contributed 13 percent in RFC. FRCC has a very distinctive profile with unique risk breakdown. First, the top-three ICCs for North America (two weather-related and Unknown) comprise only 34 percent of the transmission outage severity in FRCC, versus 54 percent for NERC. Second, FRCC’s top-risk ICC is Foreign Interference, which ranks very low for NERC and other

Appendix A – Statistical Analysis for Risk Issue Identification and Transmission Outage Severity Analysis
NERC | State of Reliability Report 2015 | May 2015 104
Regions. Note that NERC’s top non-weather-related contributors, Misoperation and Failed AC Substation Equipment, together comprise only 13 percent of FRCC’s transmission risk compared with 14 percent for Failed AC Circuit Equipment.
Figure A.8: Relative Transmission Risk by ICC and Region (2012–2014)
Summary of Analysis The summary of the analysis of the risk profile of the 2012 to 2014 TADS events combined study is provided in Chapter 3. The Misoperation ICC (which represents TADS ICCs Failed Protection System Equipment and Human Error associated with Misoperations) and the Failed AC Substation Equipment ICC both show a statistically significant positive correlation with transmission outage severity and a higher relative transmission risk. Power System Condition ICC, while showing a positive correlation of transmission outage severity, has a lower relative transmission risk, based on the probability of this TADS outage event initiating in any hour and its expected transmission outage severity. On the other end of the risk spectrum, Lightning ICC shows a high relative transmission risk but has no significant correlation with transmission outage severity. Figure A.9 represents an analysis of the risk profile of the 2012 to 2014 ICC study of sustained events. The x-axis is the magnitude of the correlation of a given ICC with transmission outage severity. The y-axis represents the expected transmission outage severity of an event when it occurs. The color of the marker indicates if there is a correlation of transmission outage severity with the given ICC (either positive – Red, negative – Green, or no significant correlation – Blue). The size of the marker indicates the probability of an event initiating in any hour

Appendix A – Statistical Analysis for Risk Issue Identification and Transmission Outage Severity Analysis
NERC | State of Reliability Report 2015 | May 2015 105
with a given ICC. Note that Failed AC Substation Equipment and Lightning both show a statistically significant positive correlation with transmission outage severity and show a higher relative transmission risk. On the other end of the risk spectrum, Weather excluding Lightning shows a high relative transmission risk but has no significant correlation with transmission outage severity.
Figure A.9: Risk Profile of the 2012–2014 Sustained Events by ICC
The statistical analysis of the 2012 to 2014 TADS data on the transmission outage severity and initiating causes of TADS outage events yields the following observations:
Excluding Weather-related and Unknown ICCs, Misoperations and Failed AC Substation Equipment ICCs remain the two largest contributors to transmission outage severity risk for all TADS events and all sustained TADS events.
TADS outage events initiated by either of these ICCs have statistically significant greater expected outage severity than all other TADS outage events.
Among other ICCs, only Power System Condition has a statistically significant positive correlation with transmission outage severity, but events initiated by this reported cause are less frequent and together contribute only 2.9 percent to the total transmission outage severity of the 2012–2014 TADS events.
Statistical tests show that the average transmission outage severity of the events initiated by both Misoperations and Failed AC Substation Equipment ICC significantly decreased in 2014 versus 2012.

Appendix A – Statistical Analysis for Risk Issue Identification and Transmission Outage Severity Analysis
NERC | State of Reliability Report 2015 | May 2015 106
Sustained TADS events with Unknown ICCs is an area that warrants further investigation by the TADSWG to determine:
o The sustained outage events that have an Unknown ICC, and o The relative risk of events with both an initiating and sustained cause code of Unknown.
The ICCs of TADS outage events are very different by Region.

NERC | State of Reliability Report 2015 | May 2015 107
Appendix B – Analysis of Generation Data
Introduction The development of the Generating Availability Data System (GADS) began in 1982. GADS collects and stores unit operating information on a quarterly basis. By pooling individual unit information, overall generating unit availability performance is calculated. The information supports equipment reliability, availability analyses, and risk-informed decision making to industry. Finally, reports and information resulting from the data collected through GADS are used for benchmarking and analyzing electric power plants. Table B.1 shows some key characteristics of the population in the GADS database. The processing of 2014 GADS data is planned for completion by June 30, 2015.
Table B.1: Key Characteristics of the GADS Database
Metric/Year 2011 2012 2013
Number of Units > 20 MW 5,398 6,991 5,812
Average Age of the Fleet in Years 37.99 34.97 35.69
Average Age Fossil Units in Years 43.84 42.53 42.94
The age of the generating fleet is a particularly revealing statistic for GADS, since an aging fleet will potentially see increasing outages. Figure B.1 uses the GADS dataset to plot fleet capacity against age by fuel type. Figure B.1 shows two characteristics of the fleet reported to GADS: (1) there is an age bubble around 39–47 years, and that population is driven by coal and some gas units; (2) there is a significant age bubble around 11–13 years comprised almost exclusively of gas units. The data set shows a clear shift toward gas-fired unit additions, and the overall age of the fleet across North America is almost 10 years younger than the age of the coal-fired baseload plants that have been the backbone of power supply for many years. This trend is projected to continue given current forecasts around price and availability of natural gas as a power generation fuel, as well as regulatory impetus.
Generator Fleet Reliability The GADS data set contains information that can be used to compute a number of reliability measures, including EFORd, a metric that measures the probability that a unit will not meet its demand periods for generating requirements because of forced outages or deratings. Figure B.2 presents the monthly megawatt-weighted EFORd across the NERC footprint for the five-year period 2009–2013. The average outage rate over that period is 4.8 percent. EFORd has been fairly stable with only a few significant excursions, as indicated by the highlighted bars in the chart. In this case, significant excursions are at least one standard deviation higher.
Appendix B – Analysis of Generation Data
NERC | State of Reliability Report 2015 | May 2015 108
Figure B.2: Fleet Capacity against Age by Fuel Type
Figure B.2: Monthly Capacity Weighted EFORd 2009–2013

Appendix B – Analysis of Generation Data
NERC | State of Reliability Report 2015 | May 2015 109
Top-10 Outage Causes To better understand the cause of generator outages, the top-10 causes of unit outages for the summer and winter seasons were reviewed, as well as the annual causes, for the period 2012–2014. This analysis is focused on the top causes other than weather-related causes, measured in terms of lost megawatt hours, so it captures both the amount of capacity affected and the duration of the outages. The level of outages reported into the GADS database is presented in Figure B.3, which shows the total duration of unit outages for the period 2012 to 2014 by season.
Figure B.3: Total Duration of Unit Outages 2012–2014
Based on the three years of available data, the following observations can be made:
Summer lost megawatt hours have remained relatively consistent over the three-year period.
Generally, lost megawatt hours in the winter season are greater than other periods of the year.
The winter season lost megawatt hours show a significant excursion in 2014, driven in large part by outages related to the polar vortex.
The sharp increase in the annual value of lost megawatt hours reported in 2014 is driven by the winter seasonal outages.
To provide insight into the drivers for the reported lost megawatt hours, the top-10 causes (exclusive of weather-related causes) have been examined to determine how much of a contribution is made by the top causes. Figure B.4 shows the contribution of the top-10 causes on a NERC-wide basis over the period 2012–2014. This is a three-year snapshot of the contributions by summer, winter, and annual impact.
NERC Annual MWh Summer Winter Spring/Fall
2012 292,002,962 77,110,158 110,215,976 104,676,828
2013 306,500,709 82,522,997 131,075,905 92,901,806
2014 515,967,236 108,357,518 232,204,485 175,405,232

Appendix B – Analysis of Generation Data
NERC | State of Reliability Report 2015 | May 2015 110
Figure B.4: Contribution of Top-10 Cause Codes 2012–2014
Based on this data set, the contribution from the top-10 causes to the total non-weather megawatt hours lost is about 30 percent; the remaining 70 percent of causes contribute less than 1 percent of the lost megawatt hours. It appears that in the 2014 data, the summer top-10 contributions have increased almost 10 percent compared to the results from 2012–2013. This change will be more fully analyzed as additional data becomes available. The contribution of the top-10 in the winter season is greater than the summer contribution and appears more variable. The top-10 causes changes across the years and seasons, and the contribution from each of the top-10 causes to the total megawatt hours lost varies as well. Figure B.5 shows the contribution from each of the top-10 causes that accumulate to the total top-10 annual impacts shown in Figure B.4.
Figure B.5: Contribution of the Individual Top-10 Cause Codes to Top-10 Impacts
NERC Annual Summer Winter
2012 0.2930 0.2957 0.4609
2013 0.2803 0.3237 0.3576
2014 0.3085 0.4027 0.4308
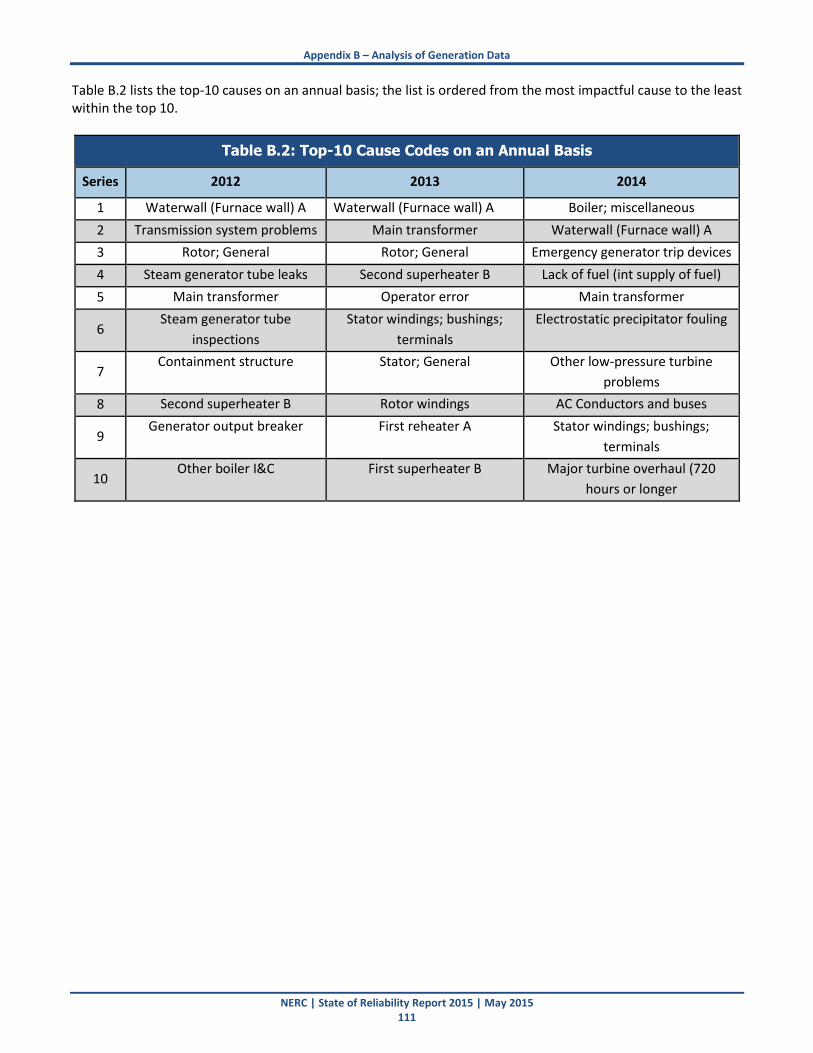
Appendix B – Analysis of Generation Data
NERC | State of Reliability Report 2015 | May 2015 111
Table B.2 lists the top-10 causes on an annual basis; the list is ordered from the most impactful cause to the least within the top 10.
Table B.2: Top-10 Cause Codes on an Annual Basis
Series 2012 2013 2014
1 Waterwall (Furnace wall) A Waterwall (Furnace wall) A Boiler; miscellaneous
2 Transmission system problems Main transformer Waterwall (Furnace wall) A
3 Rotor; General Rotor; General Emergency generator trip devices
4 Steam generator tube leaks Second superheater B Lack of fuel (int supply of fuel)
5 Main transformer Operator error Main transformer
6 Steam generator tube
inspections
Stator windings; bushings;
terminals
Electrostatic precipitator fouling
7 Containment structure Stator; General Other low-pressure turbine
problems
8 Second superheater B Rotor windings AC Conductors and buses
9 Generator output breaker First reheater A Stator windings; bushings;
terminals
10 Other boiler I&C First superheater B Major turbine overhaul (720
hours or longer

Appendix B – Analysis of Generation Data
NERC | State of Reliability Report 2015 | May 2015 112
Within the top-10 causes, there is some consistency and also some variability, although of limited sample size to draw long-term trends or conclusions. In addition to this type of annual view of the top-10 causes, seasonal variation in outage causes is summarized in Table B.3; this listing is organized around the top-5 annual outage causes and shows the seasonal ranking of these annual top 5 for the summer and winter periods.
Table B.3: Seasonal Ranking of the Top-5 Summer and Top-5 Winter Cause Codes
Year Cause Code Annual Summer Winter
2012 Waterwall (Furnace wall) A 1 1 6
Transmission System Problems 2 3 3
Rotor; General 3 8
Steam generator tube leaks 4 1
Main transformer 5 5 7
2013 Waterwall (Furnace wall) A 1 1
Main transformer 2 1
Rotor; General 3 2
Second superheater B 4 5 8
Operator error 5
2014 Boiler; miscellaneous 1 1
Waterwall (Furnace wall) A 2 2 4
Emergency generator trip devices 3
Lack of fuel (int supply of fuel) 4 2
Main transformer 5 4
Recommendations
NERC, through the GADSWG, should continue to investigate seasonal performance trends for all types of reported generation. As the generation fleet continues to shift toward gas-fired units, and the overall age of the fleet reduces, new emerging trends must be examined to identify common outage concerns across fuel types.
NERC, through the GADSWG, should trend forced outage rates to determine if there are immediate concerns with newly installed generation.
NERC, through the GADSWG, should examine outage cause codes for specific equipment types (e.g., generator, boiler, turbine, etc.)
NERC should investigate a shorter deadline for reporting annual data to facilitate better analysis in future state of reliability reports.

NERC | State of Reliability Report 2015 | May 2015 113
Appendix C – Analysis of Demand Response Data
Overview Since 2012, the DADS Working Group (DADSWG) has continued to work to improve the detailed demand response data. Actions taken in the last year include revising the DADS glossary of definitions, streamlining event type reporting, implementing changes to the webDADS portal, and updating the historically reported event type to align with revised terms. While these efforts have begun to address the issues identified, more work is necessary, and the work will continue throughout 2015 and into 2016. The data represented here reflects the improved process and is an accurate portrayal of information.
Demand Response – Registered Programs Demand Response Registered Program data provides important information about the individual programs that include product type, service type, relationships to other entities and programs, and monthly registered capacities. The webDADS portal collects information about demand response programs based on product type and product service type. Current product types in webDADS include Energy, Capacity, and Reserves. Table C.1 shows the product service types related to reliability within each product type. When a reporting entity registers a demand response program in webDADS, it identifies the product type and product service type.
Table C.1: DADS Product Type Categories
Product Type Product Service Type
Energy Emergency
Capacity Direct Control Load Management Interruptible Load Load as a Capacity Resource
Reserves Spinning Non-Spinning
Due to the efforts undertaken in 2014, comparisons between registered program capacities in 2013 and 2014 by Regional Entities and service product types are available.

Appendix C – Analysis of Demand Response Data
NERC | State of Reliability Report 2015 | May 2015 114
Registered Capacity by Region Figure C.1 compares the registered capacity megawatts for all Product Service Types by Region for the month of August in 2013 and 2014. The August 2013 value was 44,285 MW, and the August 2014 value was 44,583 MW, an increase of less than 1 percent.
Figure C.3: Registered Capacity MW for all Product Service Types by Region – Aug. 2013 and 2014

Appendix C – Analysis of Demand Response Data
NERC | State of Reliability Report 2015 | May 2015 115
Registered Capacity by Service Type Figure C.2 shows a comparison of registered capacity megawatts by the product service type. In August, Load as a Capacity Resource appears to be the most common use of demand response resources for reliability (66 percent in 2013 and 58 percent in 2014), followed by Direct Control Load Management.
Figure C.4: Registered Capacity MW for all Regions by Service Type – Aug. 2013 and 2014
Demand Response – Reliability Events When a demand response program is registered in webDADS, the entity selects a reporting type. The reporting type includes Reliability Events, Ancillary Services, or Market Participation. Figure C.3 represents all 2011–2014 reported Reliability Events as aggregated to the ISOs’, RTOs’, and BAs’ webDADS hierarchy level. Reliability Event reasons reported and summarized in webDADS are categorized as one of three types: Reliability Event, Frequency Control, and Forecast or Actual Reserve Shortage. Figure C.3 shows the number of days in each month, by Region, since demand response event reporting became mandatory in webDADS in April 2011. The black diamond shown on each column reflects the total number of days that a demand response event occurred in the month. When the column extends above the black diamond, it indicates that more than one Region used demand response on the same day. This view provides a perspective on how frequently demand response is used to resolve reliability issues.

Appendix C – Analysis of Demand Response Data
NERC | State of Reliability Report 2015 | May 2015 116
For example, the summers of 2011 and 2012 were exceptionally hot, and the number of days demand response was dispatched in those summer months is much greater than in the other report years, even exceeding the number of days and regions where demand response was dispatched during the summer heat wave of 2013. The impact of the polar vortex is also evident in the number of days and regions that dispatched demand response in January 2014. Figure C.3 illustrates that entities in the SERC and FRCC Regions use reliability demand response each month. The registered programs in these Regions are primarily Direct Control Load Management and Interruptible Load. The frequency of use of demand response in these programs may reflect a specific design characteristic of the program rather than an ongoing reliability issue.
Figure C.5: Demand Response Events by Month and Region 2011–2014
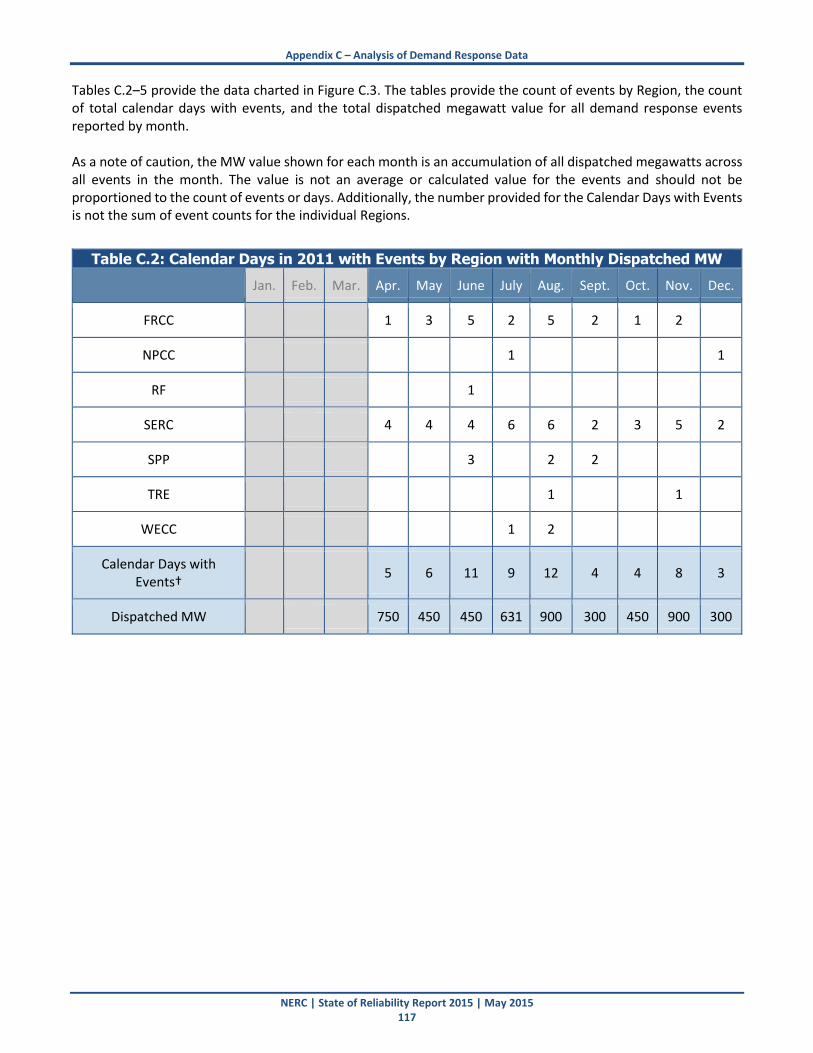
Appendix C – Analysis of Demand Response Data
NERC | State of Reliability Report 2015 | May 2015 117
Tables C.2–5 provide the data charted in Figure C.3. The tables provide the count of events by Region, the count of total calendar days with events, and the total dispatched megawatt value for all demand response events reported by month. As a note of caution, the MW value shown for each month is an accumulation of all dispatched megawatts across all events in the month. The value is not an average or calculated value for the events and should not be proportioned to the count of events or days. Additionally, the number provided for the Calendar Days with Events is not the sum of event counts for the individual Regions.
Table C.2: Calendar Days in 2011 with Events by Region with Monthly Dispatched MW
Jan. Feb. Mar. Apr. May June July Aug. Sept. Oct. Nov. Dec.
FRCC 1 3 5 2 5 2 1 2
NPCC 1 1
RF 1
SERC 4 4 4 6 6 2 3 5 2
SPP 3 2 2
TRE 1 1
WECC 1 2
Calendar Days with Events†
5 6 11 9 12 4 4 8 3
Dispatched MW 750 450 450 631 900 300 450 900 300

Appendix C – Analysis of Demand Response Data
NERC | State of Reliability Report 2015 | May 2015 118
Table C.3: Calendar Days in 2012 with Events by Region with Monthly Dispatched MW
Jan. Feb. Mar. Apr. May June July Aug. Sept. Oct. Nov. Dec.
FRCC 1 2 2 2 4 2 2 2 2
NPCC
RF
SERC 3 2 7 2 6 3 11 3 1 5 3 3
SPP 2
TRE 1 1
WECC 1 1 1 3 2 1
Calendar Days with Events†
3 3 8 5 9 9 14 5 3 7 4 5
Dispatched MW 300.0 161.8 1,200.0 296.9 583.6 311.7 1,026.0 167.0 - 712.5 570.0 427.5
Table C.4: Calendar Days in 2013 with Events by Region with Monthly Dispatched MW
Jan. Feb. Mar. Apr. May June July Aug. Sept. Oct. Nov. Dec.
FRCC 1 2 2 1 3 1 1 1 1
NPCC 4 1 1
RF
SERC 6 7 2 2 5 3 3 4 1 6 3
SPP 1
TRE 1
WECC 1 1 1 4 3 3
Calendar Days with Events†
6 5 6 5 4 9 7 6 5 2 6 4
Dispatched MW - 712.5 997.5 290.3 293.6 1,001.1 712.5 163.0 570.0 142.5 855.0 427.5

Appendix C – Analysis of Demand Response Data
NERC | State of Reliability Report 2015 | May 2015 119
Across North America, demand response is used an average of six times a month to respond to reliability events, dispatching an average of 500 MW each month. Additional analysis of the data collected using webDADS is needed; for example, it may be of interest to know if any of the days with demand response events experienced significant reliability problems. The DADSWG will continue to work on data collection and reporting issues while monitoring and reporting on the availability and performance of demand response.
Table C.5: Calendar Days in 2014 with Events by Region with Monthly Dispatched MW
Jan. Feb. Mar. Apr. May June July Aug. Sept. Oct. Nov. Dec.
FRCC 1 1 2 1
NPCC
RF
SERC 8 2 1 5 3 4 4 5 2
SPP
TRE 2
WECC 2
Calendar Days with Events†
10 3 1 5 3 6 7 5 2
Dispatched MW
570.0
285.0 142.5 712.5 427.5 1,242.0 582.5 750.0 142.5
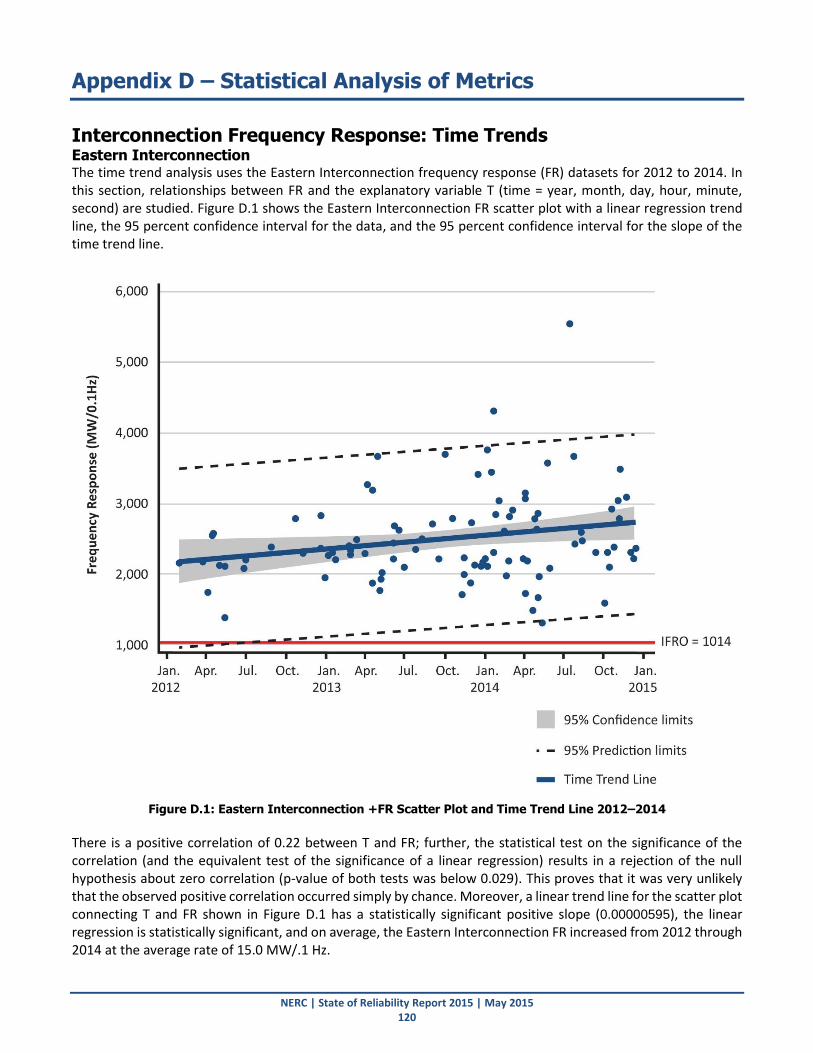
NERC | State of Reliability Report 2015 | May 2015 120
Appendix D – Statistical Analysis of Metrics
Interconnection Frequency Response: Time Trends Eastern Interconnection The time trend analysis uses the Eastern Interconnection frequency response (FR) datasets for 2012 to 2014. In this section, relationships between FR and the explanatory variable T (time = year, month, day, hour, minute, second) are studied. Figure D.1 shows the Eastern Interconnection FR scatter plot with a linear regression trend line, the 95 percent confidence interval for the data, and the 95 percent confidence interval for the slope of the time trend line.
Figure D.1: Eastern Interconnection +FR Scatter Plot and Time Trend Line 2012–2014
There is a positive correlation of 0.22 between T and FR; further, the statistical test on the significance of the correlation (and the equivalent test of the significance of a linear regression) results in a rejection of the null hypothesis about zero correlation (p-value of both tests was below 0.029). This proves that it was very unlikely that the observed positive correlation occurred simply by chance. Moreover, a linear trend line for the scatter plot connecting T and FR shown in Figure D.1 has a statistically significant positive slope (0.00000595), the linear regression is statistically significant, and on average, the Eastern Interconnection FR increased from 2012 through 2014 at the average rate of 15.0 MW/.1 Hz.

Appendix D – Statistical Analysis of Metrics
NERC | State of Reliability Report 2015 | May 2015 121
Western Interconnection The time trend analysis uses the Western Interconnection FR data sets from 2012 through 2014. The FR values represent the observed values of the analysis (response) variable FR. In this section, the relationship is investigated between FR and the explanatory variable T, when an FR event happened. Figure D.2 shows the Western Interconnection frequency response scatter plot with a linear regression trend line, the 95 percent confidence interval for the data, and the 95 percent confidence interval for the slope of the time trend line.
Figure D.2: Western Interconnection Frequency Response Scatter Plot and Time Trend Line 2012—2014
There is a negative correlation of -0.19 between T and FR; however, the statistical test on the significance of the correlation (and the equivalent test of the significance of a linear regression) fails to reject the null hypothesis about zero correlation at a standard significance level (p value of both tests is 0.13). This result leads to the conclusion that the negative correlation could have occurred simply by chance. It implies that even though a linear trend line for the scatter plot connecting T and FR shown in Figure D.2 has a negative slope (-0.00000336), the linear regression is not statistically significant, and on average, the Western Interconnection FR has been stable from 2012 through 2014.

Appendix D – Statistical Analysis of Metrics
NERC | State of Reliability Report 2015 | May 2015 122
ERCOT Interconnection The time trend analysis uses the ERCOT Interconnection FR datasets for 2012 to 2014. In this section, the relationship is investigated between FR and the explanatory variable T, when an FR event happened. Figure D.3 shows the ERCOT Interconnection FR scatter plot with a linear regression trend line, the 95 percent confidence interval for the data, and the 95 percent confidence interval for the slope of the time trend line.
Figure D.3: ERCOT Interconnection Frequency Response Scatter Plot and Time Trend Line 2012—2014
There is a positive correlation of 0.12 between T and FR; however, the statistical test on the significance of the correlation (and the equivalent test of the significance of a linear regression) fails to reject the null hypothesis about zero correlation at a standard significance level (p-value of both tests is 0.17). This result leads to the conclusion that with high probability the positive correlation could occur simply by chance. It implies that even though a linear trend line for the scatter plot connecting T and FR shown in Figure D.3 has a positive slope (0.00000304), the linear regression is not statistically significant, and on average, the ERCOT Interconnection FR has been stable from 2012 through 2014.
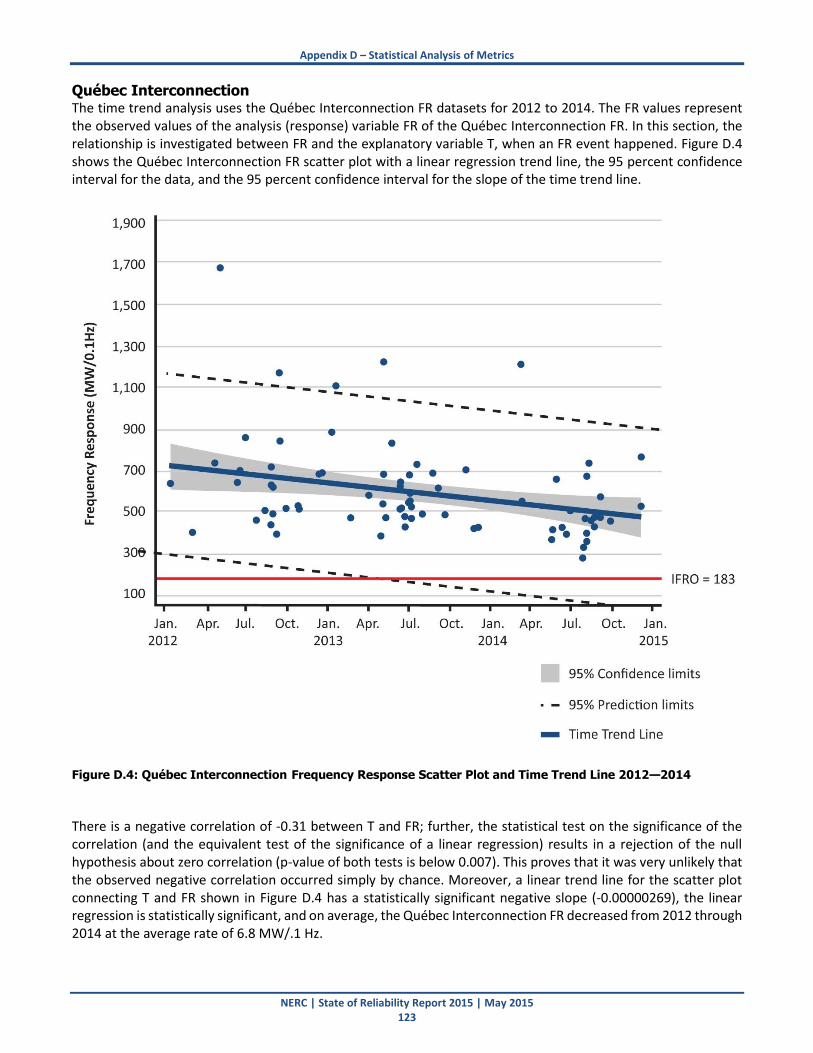
Appendix D – Statistical Analysis of Metrics
NERC | State of Reliability Report 2015 | May 2015 123
Québec Interconnection The time trend analysis uses the Québec Interconnection FR datasets for 2012 to 2014. The FR values represent the observed values of the analysis (response) variable FR of the Québec Interconnection FR. In this section, the relationship is investigated between FR and the explanatory variable T, when an FR event happened. Figure D.4 shows the Québec Interconnection FR scatter plot with a linear regression trend line, the 95 percent confidence interval for the data, and the 95 percent confidence interval for the slope of the time trend line.
Figure D.4: Québec Interconnection Frequency Response Scatter Plot and Time Trend Line 2012—2014 There is a negative correlation of -0.31 between T and FR; further, the statistical test on the significance of the correlation (and the equivalent test of the significance of a linear regression) results in a rejection of the null hypothesis about zero correlation (p-value of both tests is below 0.007). This proves that it was very unlikely that the observed negative correlation occurred simply by chance. Moreover, a linear trend line for the scatter plot connecting T and FR shown in Figure D.4 has a statistically significant negative slope (-0.00000269), the linear regression is statistically significant, and on average, the Québec Interconnection FR decreased from 2012 through 2014 at the average rate of 6.8 MW/.1 Hz.

Appendix D – Statistical Analysis of Metrics
NERC | State of Reliability Report 2015 | May 2015 124
Interconnection Frequency Response: Year-to-Year Changes Eastern Interconnection The time trend analysis uses the Eastern Interconnection FR datasets from 2012 through 2014. The sample statistics by year are listed in Table D.1. The last column lists the number of FR events that fell below the absolute IFRO.99 Next, Fisher’s Least Significant Difference test was used to analyze all pair-wise changes in FR. These tests result in the conclusion that there was a statistically significant increase of FR in 2014 compared with 2012, and there were no other statistically significant changes in the expected FR by year for the Eastern Interconnection.
Table D.1: Sample Statistics for Eastern Interconnection
Year Number
of Values
Mean of Frequency Response
Standard Dev. of Frequency
Response Median Minimum Maximum
Number of events with FR below the
IFRO of 1014 MW/0.1 Hz
2012-2014
97 2488.28 642.43 2307.43 1300.26 5552.36 0
2012 16 2229.13 368.22 2187.47 1374.02 2824.55 0
2013 36 2415.84 500.78 2282.03 1707.03 3696.28 0
2014 45 2638.38 776.53 2469.33 1300.26 5552.36 0
99 http://www.nerc.com/FilingsOrders/us/NERC Filings to FERC DL/Final_Info_Filing_Freq_Resp_Annual_Report_03202015.pdf

Appendix D – Statistical Analysis of Metrics
NERC | State of Reliability Report 2015 | May 2015 125
Figure D.5 shows the box plot of the annual distribution of the Eastern Interconnection FR. Each box encloses the interquartile range with the lower edge at the first quartile and the upper edge at the third quartile. A line is drawn through the box at the second quartile, which is the median. A diamond shows the mean. A lower (upper) whisker connects the box with the smallest (the largest) data point within 1.5 interquartile ranges from the first (the third) quartile. Data farther from the box than the whiskers, plotted as individual points, are outliers. Table D.1 and Figure D.5 illustrate year-to year increases in the average FR as well as in its variation. Statistical tests find the only statistically significant difference in the year-over-year changes—the expected FR in 2012 is significantly less than in 2014.
Figure D.5: Eastern Interconnection Frequency Response Distribution by Year 2012–2014

Appendix D – Statistical Analysis of Metrics
NERC | State of Reliability Report 2015 | May 2015 126
Western Interconnection The time trend analysis uses the Western Interconnection FR datasets for 2012 through 2014. The sample statistics are listed by year in Table D.2. The last column lists the number of FR events that fell below the absolute IFRO.
Table D.2: Sample Statistics for Western Interconnection
Year Number
of Values
Mean of Frequency Response
Standard Dev. of Frequency
Response Median Minimum Maximum
Number of events with FR below the
IFRO of 907 MW/0.1 Hz
2012-2014
68 1419.06 444.92 1336.80 798.34 3439.70 4
2012 10 1590.47 677.49 1396.43 1120.51 3439.70 0
2013 23 1489.99 421.93 1463.11 821.85 2850.99 1
2014 35 1323.47 363.24 1265.64 798.34 2695.58 3
Figure D.6 shows the box plot of the annual distribution of the Western Interconnection FR. There are no statistically significant differences in the expected FR by year. In particular, this is due to too small of a sample size for 2012.
Figure D.6: Western Interconnection Frequency Response Distribution by Year 2012–2014

Appendix D – Statistical Analysis of Metrics
NERC | State of Reliability Report 2015 | May 2015 127
ERCOT Interconnection The time trend analysis uses the ERCOT Interconnection FR datasets from 2012 through 2014. The sample statistics by year are listed in Table D.3. The last column lists the number of FR events that fell below the absolute IFRO.
Table D.3: Sample Statistics for ERCOT Interconnection
Year Number of Values
Mean of Frequency Response
Standard Dev. of
Frequency Response
Median Minimum Maximum
Number of events with FR below the
IFRO of 471 MW/0.1 Hz
2012-2014
138 809.70 661.67 663.83 336.77 5530.50 21
2012 53 650.58 386.28 577.88 336.77 3082.64 12
2013 48 921.60 777.52 745.51 406.60 5530.50 5
2014 37 892.45 774.79 725.26 425.66 4879.72 4
Next, Fisher’s Least Significant Difference test was used to analyze all pair-wise changes in FR. These tests result in the conclusion that there was a statistically significant increase of FR in 2013 compared with 2012, and there were no other statistically significant changes in the expected FR by year for the ERCOT Interconnection. Figure D.7 shows the box plot of the annual distribution of the ERCOT FR. Statistical tests find the only statistically significant difference in the year-over-year changes—the expected frequency response in 2012 is significantly smaller than in 2013.
Figure D.7: ERCOT Frequency Response Distribution by Year 2012–2014

Appendix D – Statistical Analysis of Metrics
NERC | State of Reliability Report 2015 | May 2015 128
Several factors contributed to the FR performance in the ERCOT Interconnection during the years in which the FR did not meet the recommended IFRO (2011 and 2012).
ERCOT has a small hydro fleet that suffered significantly due to the extreme drought of 2011. There was some relief in 2012, but not in the geographical area of these hydro facilities. Additionally, the owners of the facilities have changed the facilities’ operation. Prior to the ERCOT nodal market implementation in December 2010, many of these facilities were operated as frequency responsive reserves. They were on-line in synchronous condenser mode and ramped to full output in about 20 seconds anytime frequency dropped to 59.900 Hz or below, providing 50 to 240 MW of primary FR (during the first 20 seconds of a disturbance). Since early 2011, this service has been discontinued.
There was a drop in natural gas prices and a change in dispatch. The price change caused many of the large coal generators to shut down, and FR from these generators had been excellent. The combined-cycle facilities that replaced these units had difficulty getting FR to work consistently and correctly. Since the fall of 2012, FR from combined-cycle facilities has improved, due to TRE’s efforts to work with these generators to improve their performance.
Another contributing factor was the continued increase in wind generation in ERCOT that typically operates at maximum output. Without margin in the up direction, the Interconnection only benefits by curtailing wind generators during high-frequency excursions from these generators. When low-frequency excursions occur, the wind generators cannot provide additional output to increase Interconnection frequency.

Appendix D – Statistical Analysis of Metrics
NERC | State of Reliability Report 2015 | May 2015 129
Québec Interconnection The time trend analysis uses the Québec Interconnection FR datasets for the years 2012 through 2014. The sample statistics by year are listed in Table D.4. The last column lists the number of FR events that fell below the absolute IFRO.
Table D.4: Sample Statistics for Quebec Interconnection
Year Number
of Values
Mean of Frequency Response
Standard Dev. of
Frequency Response
Median Minimum Maximum
Number of events with FR below the
IFRO of 183 MW/0.1 Hz
2012-2014 74 591.8 220.6 526.9 288.3 1673.6
0
2012 21 656.2 268.0 635.0 397.2 1673.6 0
2013 29 606.5 192.2 545.9 389.1 1227.8 0
2014 24 517.7 192.8 465.1 288.3 1212.4 0
Next, Fisher’s Least Significant Difference test was applied to analyze all pair-wise changes in FR. Statistical tests find the only statistically significant difference in the year-over-year changes—the expected FR in 2012 is significantly greater than in 2014. Figure D.8 shows the box plot of the annual distribution of the Québec Interconnection FR. Table D.4 and Figure D.8 illustrate year-to-year decreases in the average FR.
Figure D.8: Québec Interconnection Frequency Response Distribution by Year 2012–2014

Appendix D – Statistical Analysis of Metrics
NERC | State of Reliability Report 2015 | May 2015 130
Explanatory Variables for Frequency Response and Multiple Regression
Explanatory Variables In the 2012 State of Reliability report, Key Finding #2 proposed further work to see if specific indicators could be tied to severity of frequency deviation events. For each interconnection, the following set of six variables is included as explanatory variables (regressors) in the multiple regression models that describe the interconnection FR. These variables are not pair-wise uncorrelated, and some pairs are strongly correlated; however, all are included as candidates to avoid the loss of an important contributor to the FR variability. Model selection methods help ensure the removal of highly correlated regressors and run multicollinearity diagnostics (variance inflation diagnostics) for a multiple regression model selected. Summer (Indicator Function) – Defined as 1 for FR events that occur from June through August, and 0 otherwise. Winter (Indicator Function) – Defined as 1 for FR events that occur from December through February, and 0 otherwise. High Pre-Disturbance Frequency (Indicator Function) – Defined as 1 for FR events with pre-disturbance frequency (point A) > 60 Hz, and 0 otherwise. On-peak Hours (Indicator Function) – Defined as 1 for FR events that occurred during on-peak hours, and 0 otherwise. On-peak hours are designated as follows: Monday to Saturday from 0700 to 2200 (Central Time) excluding six holidays: New Year’s Day, Memorial Day, Independence Day, Labor Day, Thanksgiving Day, and Christmas Day. Time – A moment in time (year, month, day, hour, minute, second) when an FR event happened. Time is measured in seconds elapsed between midnight of January 1, 1960 (the time origin for the date format in SAS), and the time of a corresponding FR event. This is used to determine trends over the study period. Interconnection Load Level – Measured in megawatts. Data Sets – Since the Interconnection Load Level data are available for 2012 and 2013 only, the correlation study and multivariate analysis with the explanatory variables are performed for 2012 through 2013 FR data for each interconnection. The two-year data sets have insufficient sizes for a good explanatory and predictive model, which requires estimates of big number parameters. An adequate model for each interconnection can only come with an annual increase of the FR data sets. Table D.5 lists the ranks of statistically significant variables of FR for each interconnection. Positive indicates a statistically significant positive correlation, negative indicates a statistically significant negative correlation, and a dash indicates no statistically significant linear relation. A high pre-disturbance frequency has a statistically significant impact to FR in three interconnections. Events with A > 60 Hz on average have smaller FR than the events with A ≤ 60 Hz. If the initial predisturbance frequency is higher than 60 Hz, it is more likely that governor actions will be delayed because of the time it takes for the frequency to drop to the upper dead-band setting.
Table D.5: Observation Summary
Explanatory Valuable Western Eastern ERCOT Québec
Summer 1 (positive) - - - Winter - - 1 (positive) - High Pre-disturbance Frequency (A>60 Hz)
- 1 (negative) 3 (negative) 1 (negative)
On-Peak hours 3 (negative) - - - Time - - 2 (positive) - Load Level 2 (positive) - - -

Appendix D – Statistical Analysis of Metrics
NERC | State of Reliability Report 2015 | May 2015 131
Eastern Interconnection: Correlation Analysis and Multivariate Model Descriptive statistics for the six explanatory variables and the Eastern Interconnection FR are listed in Table D.6.
Table D.6: Descriptive Statistics
Variable N Mean Standard
Dev. Minimum Maximum
Time 52 1/1/2012 12/31/2014
Winter 52 0.29 0.46 0 1
Summer 52 0.21 0.41 0 1
A > 60 52 0.38 0.49 0 1
On-Peak Hours 52 0.54 0.50 0 1
Interconnection Load 52 344906 50831 238949 472683
Frequency Response 52 2358.4 468.6 1374.0 3696.3
The correlation and a single regression analysis result in the hierarchy of the explanatory variables for the Eastern Interconnection frequency response shown in Table D.7. The value of a coefficient of determination R2 indicates the percentage in variability of frequency response that can be explained by variability of the corresponding explanatory variable.
Table D.7: Correlation and Regression Analysis
Explanatory Variable Correlation
with FR Statistically Significant
(Yes/No) Coefficient of Determination of
Single Regression (If SS)
A > 60 -0.35 Yes 12.1%
Time 0.20 No N/A
On-Peak Hours 0.07 No N/A
Interconnection Load 0.05 No N/A
Summer -0.03 No N/A
Winter 0.02 No N/A
Out of the six parameters, only the indicator of high pre-disturbance frequency has a statistically significant correlation with FR. High predisturbance frequency is negatively correlated with FR; thus, the events with A > 60 Hz have statistically significantly smaller expected FR than the events with A ≤ 60 Hz. The other five variables do not have a statistically significant100 linear relationship with FR.
100 At significance level 0.1

Appendix D – Statistical Analysis of Metrics
NERC | State of Reliability Report 2015 | May 2015 132
Both step-wise selection and backward elimination algorithms101 result in a single regression model that connects the Eastern Interconnection FR with the indicator of high predisturbance frequency (the other five variables are not selected or were eliminated). The model’s coefficients are listed in Table D.8.
Table D.8: Coefficients of Multiple Model
Variable DF Parameter Estimate
Standard Error
t-value p-value Variance
Inflation Value
Intercept 1 2485.83 78.45 31.69 <.0001 0.00
A> 60 1 -331.33 126.49 -2.62 0.01 1.00
The adjusted coefficient of the determination of the model is 10.3 percent; the model is statistically significant (p < 0.01). The random error has a zero mean and the sample deviation σ of 443.8 MW/.1 Hz. Since the multiple model for the Eastern Interconnection FR is reduced to a single model, no multicollinearity diagnostics are needed. The parameter estimate, or the coefficient for the high predisturbance frequency, indicates that on average, the Eastern Interconnection events with the predisturbance frequency A > 60 Hz have FR of 331 MW/.1 Hz smaller than events with A ≤ 60 Hz. Frequency responses in the Eastern Interconnection are higher due to the large number of disturbances in the data set in which frequency changes were greater than the generator dead bands. Also, in earlier studies, the gross output of the unit trip was reported, rather than the net generation102 megawatt loss to the interconnection.
101 For step-wise regression algorithm and Backward Elimination algorithm see D. C. Montgomery and G. C. Runger. Applied Statistics and
Probability for Engineers. Fifth Edition. 2011. John Wiley & Sons. Pp. 499-501. 102 There could be a coincident loss of load also.

Appendix D – Statistical Analysis of Metrics
NERC | State of Reliability Report 2015 | May 2015 133
Western Interconnection: Correlation Analysis and Multivariate Model Descriptive statistics for the six explanatory variables and the Western Interconnection FR are listed in Table D.9.
Table D.9: Descriptive Statistics
Variable N Mean Standard
Dev. Minimum Maximum
Time 33 1/1/2012 12/31/2014
Winter 33 0.09 0.29 0 1
Summer 33 0.48 0.51 0 1
A > 60 33 0.58 0.50 0 1
On-Peak Hours 33 0.45 0.51 0 1
Interconnection Load 33 91285.2 16015 38321 118936
Frequency Response 33 1520.4 503.7 821.9 3439.7
The correlation and a single regression analysis result in the hierarchy of the explanatory variables for the Western Interconnection FR shown in Table D.10. The value of a coefficient of determination R2 indicates the percentage in variability of FR that can be explained by variability of the corresponding explanatory variable.
Table D.10: Correlation and Regression Analysis
Explanatory Variable Correlation
with FR Statistically Significant
(Yes/No) Coefficient of Determination of
Single Regression (If SS)
Summer 0.36 Yes 13.1%
Interconnection Load 0.36 Yes 0.127985063
On-Peak Hours -0.31 Yes 0.097144422
Winter -0.18 No N/A
A > 60 -0.16 No N/A
Time -0.06 No N/A
Out of the six parameters, the three on the top have a statistically significant correlation with FR. The indicators of summer and interconnection load have a positive correlation with FR (the summer events have a greater FR, and the higher interconnection load, the greater FR). The indicator of on-peak hours has a negative correlation with FR, which is: on-peak-hour events have, on average, a smaller response. The other three variables are not statistically significantly103 correlated with FR.
103 At significance level 0.1

Appendix D – Statistical Analysis of Metrics
NERC | State of Reliability Report 2015 | May 2015 134
Finally, both the step-wise selection algorithm and the backward elimination algorithm result in a single regression model that connects the Western Interconnection FR with one regressor, the indicator of summer (the other five variables are not selected or were eliminated).104 The coefficients of the single model are listed in Table D.11.
Table D.11: Coefficients of Multiple Model
Variable DF Parameter Estimate
Standard Error t-value p-
value Variance
Inflation Value
Intercept 1.00 1356.53 112.43 12.07 <.0001 0.00
Summer 1.00 360.6045300 166.765580 2.16 0.04 1.00
The adjusted coefficient of determination of the model is 10.3 percent; the model is statistically significant (p = 0.04). The random error has a zero mean and the sample deviation σ of 477.0 MW/.1 Hz. Since the multiple model for the Western Interconnection FR is reduced to a single model, no multicollinearity diagnostics are needed. The parameter estimate, or the coefficient for summer, indicates that on average, the summer events have FR 361 MW/.1 Hz greater than other events. Note that although Table D.10 lists three explanatory variables for the Western Interconnection FR, Interconnection Load and On-Peak hours are eliminated from the final model due to their significant correlation with summer.
104 Regressors in the final model have p-values not exceeding 0.1.

Appendix D – Statistical Analysis of Metrics
NERC | State of Reliability Report 2015 | May 2015 135
ERCOT: Correlation Analysis and Multivariate Model
Descriptive statistics for the six explanatory variables and the ERCOT Interconnection FR are listed in Table D.12.
Table D.12: Descriptive Statistics
Variable N Mean Standard Dev. Minimum Maximum
Time 101 1/1/2012 12/31/2014
Winter 101 0.23 0.42 0 1
Summer 101 0.29 0.45 0 1
A > 60 101 0.42 0.50 0 1
On-Peak Hours 101 0.61 0.49 0 1
Interconnection Load 101 40532.4 9096 23252 64273
Frequency Response 101 779.4 616.6 336.8 5530.5
The correlation and a single-regression analysis result in the hierarchy of the explanatory variables for the ERCOT Interconnection FR shown in Table D.13. The value of a coefficient of determination R2 indicates the percentage in variability of FR that can be explained by variability of the corresponding explanatory variable.
Table D.13: Correlation and Regression Analysis
Explanatory Variable Correlation
with FR Statistically Significant
(Yes/No) Coefficient of Determination of
Single Regression (If SS)
Winter 0.26 Yes 6.9%
Time 0.17 Yes 3.0%
A > 60 -0.17 Yes 2.8%
Interconnection Load -0.13 No N/A
Summer -0.12 No N/A
On-Peak Hours 0.04 No N/A
Out of the six parameters, Winter and Time are statistically significantly positively correlated with FR (on average, frequency response increases in winter and grows with time). The indicator of high pre-disturbance frequency is statistically significantly negatively correlated with FR (the events with A > 60 Hz have smaller FR than the events with A ≤ 60 Hz). The other three variables do not have a statistically significant105 linear relationship with FR.
105 At significance level 0.1
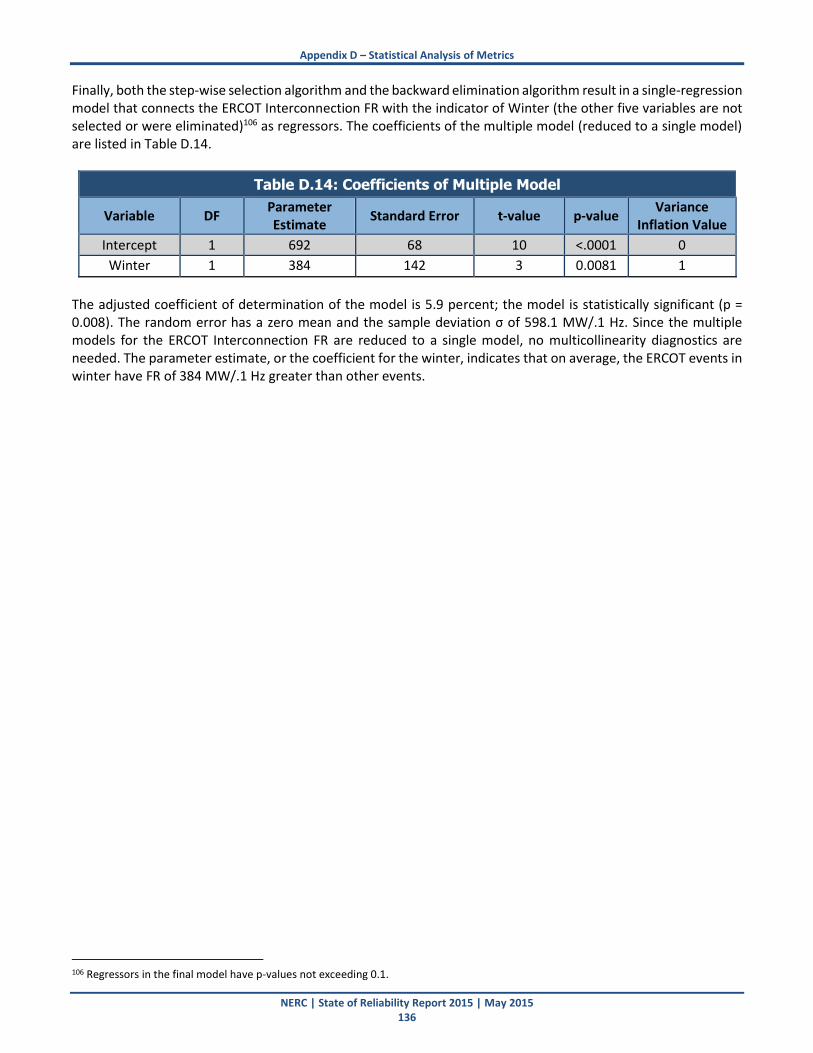
Appendix D – Statistical Analysis of Metrics
NERC | State of Reliability Report 2015 | May 2015 136
Finally, both the step-wise selection algorithm and the backward elimination algorithm result in a single-regression model that connects the ERCOT Interconnection FR with the indicator of Winter (the other five variables are not selected or were eliminated)106 as regressors. The coefficients of the multiple model (reduced to a single model) are listed in Table D.14.
Table D.14: Coefficients of Multiple Model
Variable DF Parameter Estimate
Standard Error t-value p-value Variance
Inflation Value
Intercept 1 692 68 10 <.0001 0
Winter 1 384 142 3 0.0081 1
The adjusted coefficient of determination of the model is 5.9 percent; the model is statistically significant (p = 0.008). The random error has a zero mean and the sample deviation σ of 598.1 MW/.1 Hz. Since the multiple models for the ERCOT Interconnection FR are reduced to a single model, no multicollinearity diagnostics are needed. The parameter estimate, or the coefficient for the winter, indicates that on average, the ERCOT events in winter have FR of 384 MW/.1 Hz greater than other events.
106 Regressors in the final model have p-values not exceeding 0.1.
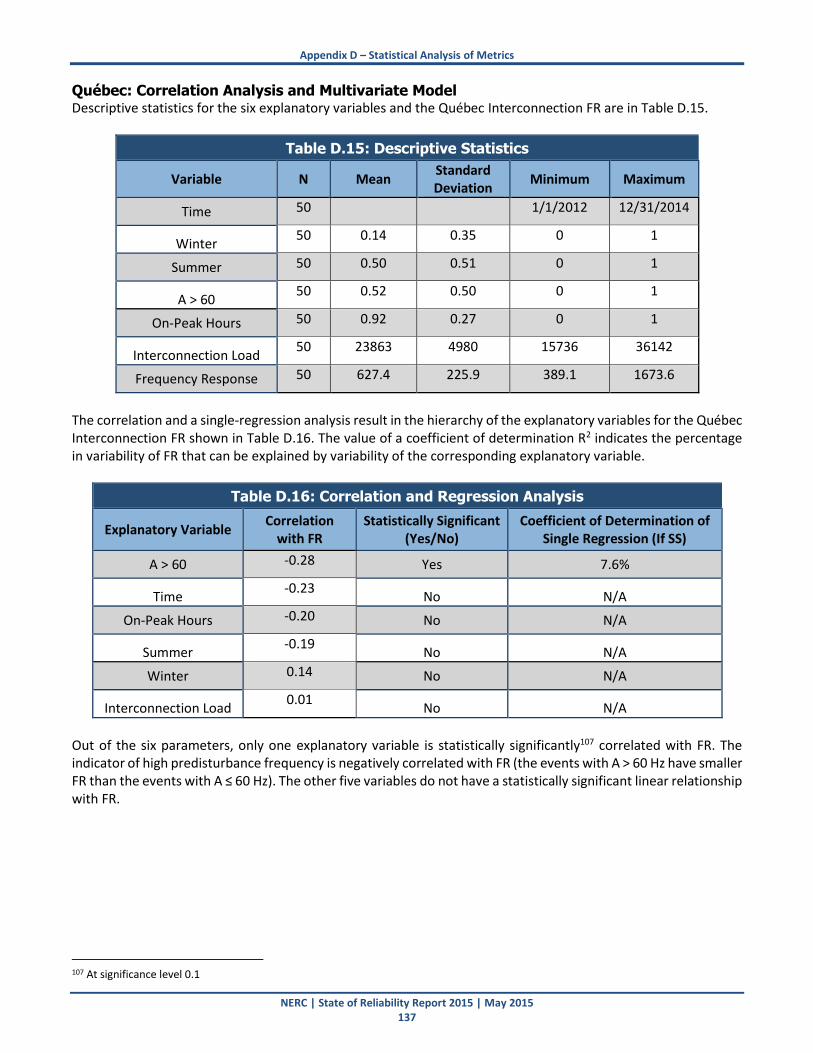
Appendix D – Statistical Analysis of Metrics
NERC | State of Reliability Report 2015 | May 2015 137
Québec: Correlation Analysis and Multivariate Model Descriptive statistics for the six explanatory variables and the Québec Interconnection FR are in Table D.15.
Table D.15: Descriptive Statistics
Variable N Mean Standard Deviation
Minimum Maximum
Time 50 1/1/2012 12/31/2014
Winter 50 0.14 0.35 0 1
Summer 50 0.50 0.51 0 1
A > 60 50 0.52 0.50 0 1
On-Peak Hours 50 0.92 0.27 0 1
Interconnection Load 50 23863 4980 15736 36142
Frequency Response 50 627.4 225.9 389.1 1673.6
The correlation and a single-regression analysis result in the hierarchy of the explanatory variables for the Québec Interconnection FR shown in Table D.16. The value of a coefficient of determination R2 indicates the percentage in variability of FR that can be explained by variability of the corresponding explanatory variable.
Table D.16: Correlation and Regression Analysis
Explanatory Variable Correlation
with FR Statistically Significant
(Yes/No) Coefficient of Determination of
Single Regression (If SS)
A > 60 -0.28 Yes 7.6%
Time -0.23
No N/A
On-Peak Hours -0.20 No N/A
Summer -0.19
No N/A
Winter 0.14 No N/A
Interconnection Load 0.01
No N/A
Out of the six parameters, only one explanatory variable is statistically significantly107 correlated with FR. The indicator of high predisturbance frequency is negatively correlated with FR (the events with A > 60 Hz have smaller FR than the events with A ≤ 60 Hz). The other five variables do not have a statistically significant linear relationship with FR.
107 At significance level 0.1

Appendix D – Statistical Analysis of Metrics
NERC | State of Reliability Report 2015 | May 2015 138
Finally, both the step-wise selection algorithm and the backward elimination algorithm result in a multiple regression model that connects the Québec Interconnection FR with Time, Summer and high predisturbance frequency (the other three variables are not selected or were eliminated).108 The coefficients of the multiple model are in Table D.17.
Table D.17: Coefficients of Multiple Model
Variable DF Parameter Estimate
Standard Error
t-value p-value Variance
Inflation Value
Intercept 1 9316.77 3300.09 2.82 0.01 0.00
Time 1 0.0000 0.00 -2.60 0.01 1.11
Summer 1 -103 58.21 -1.78 0.08 1.03
A > 60 1 -190 61.35 -3.10 0.003 1.14
The model’s adjusted coefficient of multiple determination is 19.2 percent (that is almost 20 percent of the Québec Interconnection FR variability and can be explained by the combined variability of these three parameters); the model is statistically significant (p = 0.005). The random error has a zero mean and the sample deviation σ of 203 MW/.1 Hz. Variance inflation factors for the regressors do not exceed 1.14, which confirms an acceptable level of multicollinearity that does not affect a general applicability of the model. A parameter estimate for time indicates a rate of decrease of the FR per unit of time (a second). It translated to the monthly decrease rate of 6.8 MW/0.1Hz. Parameter estimate for summer means that for fixed values of other variables, the summer events on average have FR of 103 MW/0.1 Hz smaller than other events. The main reason summer events have a smaller FR is because winter is the peak usage season in the Québec Interconnection. More generator units are on-line; therefore, there is more inertia in the system, so it is more robust in responding to frequency changes in the winter. Parameter estimate for high predisturbance frequency means that for fixed values of other variables, events with the predisturbance frequency A > 60 Hz have, on average, FR of 190 MW/.1 Hz smaller than events with A ≤ 60 Hz.
108 Regressors in the final model have p-values not exceeding 0.1.

Appendix D – Statistical Analysis of Metrics
NERC | State of Reliability Report 2015 | May 2015 139
Misoperations Analysis Misoperation Rate by Region and for NERC Table D.18 lists the operation and misoperation counts and the corresponding misoperation rate by Region and for NERC for the eight quarters available.
Table D.18 Operations and Misoperations by Region from Q4 2012 to Q3 2014
Region Operations Misoperations Misoperation Rate
RF 5839 790 13.53%
SPP 3328 432 12.98%
FRCC 1258 155 12.32%
MRO 2808 307 10.93%
SERC 8499 763 8.98%
TRE 3919 314 8.01%
NPCC 5375 413 7.68%
NERC 31026 3174 10.23%
Figure D.9 illustrates the misoperation rate ranking and summarizes results of the statistical tests on misoperation rate comparison.
Figure D.9 Two-Year Misoperation Rate by Region (Q4 2012–Q3 2014)
In Figure D.9, red bars show the rates that are statistically significantly higher than NERC’s rate, and green bars correspond to the rates significantly lower than NERC’s rate. Finally, there is no significant difference between MRO and NERC misoperation rates for the two years.

Appendix D – Statistical Analysis of Metrics
NERC | State of Reliability Report 2015 | May 2015 140
Comparison of Regional Misoperation Rates Next, Regional Entity misoperation data was analyzed to find statistically significant differences in misoperation rates between Regions. Table D.19 lists all the pairs of Regions with statistically significant differences in misoperation rate.
Table D.19: Regions with Misoperation Rate Statistically Significantly Different
Higher Lower
RFC none MRO, SERC, TRE, NPCC
SPP none MRO, SERC, TRE, NPCC
FRCC none SERC, TRE, NPCC
MRO RFC, SPP SERC, TRE, NPCC
SERC RFC, SPP, FRCC, MRO NPCC
TRE RFC, SPP, FRCC, MRO none
NPCC RFC, SPP, FRCC, MRO, SERC none
For example, Table D.19 and Figure D.9 show that the RFC misoperation rate is numerically greater than for any other Region presented. However, there is no significant difference with SPP and FRCC, so Table D.19 lists as statistically significant smaller only rates for MRO, SERC, TRE, and NPCC.
Year-Over-Year Changes by Region Next, changes from the first four quarters (Q4 2012–Q3 2013, Year 1) to the second four quarters (Q4 2013–Q3 2014, Year 2) were studied to compare time periods with similar composition of seasons. The changes are shown in Figure D.10.
Figure D.10. Year-Over-Year Changes in Misoperation Rate by Region and NERC

Appendix D – Statistical Analysis of Metrics
NERC | State of Reliability Report 2015 | May 2015 141
By testing the hypotheses on the population proportion, there are only two statistically significant changes in misoperation rate between 2013 and 2014: an increase for the RFC misoperation rate and a decrease for the SPP misoperation rate. The decrease of misoperations in SPP RE may be due in part to SPP RE’s outreach efforts to increase successful protection system operations. SPP RE established a goal of a 92 percent successful operations rate and has made this goal part of the SPP RE staff’s performance matrix. SPP RE has presented its misoperation analysis, findings, and conclusions in workshops, SPP RE Trustee meetings, and the monthly newsletter. SPP RE participates in the System Protection and Control Working Group (SPCWG), which completed a white paper on its analysis of Regional Entity relay misoperations caused by communication failures. Communication failures are the primary root cause of misoperations in SPP RE. The SPCWG is working on an additional white paper on misoperations109 caused by Incorrect Setting/Logic/Design Errors, which is the second-highest root cause of Regional Entity misoperations.
109 http://www.spp.org/section.asp?group=129&pageID=27

NERC | State of Reliability Report 2015 | May 2015 142
Appendix E – Event Analysis Discussion
Background The industry’s voluntary Event Analysis Process continues to provide valuable information for the ERO and industry to address potential reliability risks or vulnerabilities of the BPS. Since its initial implementation in October of 2010, the process has reported 569 Qualified Events to the ERO and yielded 96 Lessons Learned,
including 19 published in 2014.110 NERC and the Regions assess every Qualified Event to identify causal factors and share with industry the possible risks to reliability. This year, the NERC Cause Code Assignment Process provided greater ability for historical trending and predictive analysis. Industry continued to actively participate in assigning cause codes for events, providing greater transparency on how the ERO analyzes and trends events. This active collaboration is a testament to the importance and effectiveness placed on this area by the industry, and also how important it is for the ERO and industry to truly understand the different contributors to events. The Event Analysis Subcommittee (EAS) has been essential in the maturation of this process and has facilitated the active dissemination of many of the products that have been delivered to date. This chapter highlights some of the significant products that have been produced from this active collaboration.
Bulk Power System Awareness The first step in the ERO Event Analysis Process is to monitor BPS occurrences above a certain threshold of impact or risk. Bulk Power System Awareness (BPSA) is the process for understanding the potential threats or vulnerabilities to the reliability of the BPS. This starts with understanding occurrences and events in the context in which they occur. NERC’s BPSA group and the eight Regional Entities monitor BPS conditions, significant occurrences, and emerging risks and threats across the 14 RCs in North America to maintain an understanding of conditions and situations that could impact the reliable operation of the BPS. The 2014 incoming information consisted of:
Mandatory reports
500 DOE OE-417 reports
282 EOP-004-2 reports
4 EOP-002-3 reports
Other information (in no particular order or priority, and not limited to these resources)
1,741 Intelligent Alarms notifications
2,356 FNet notifications and 602 FNet daily summaries
6,172 WECCnet messages
1,691 RCIS messages
186 Space Weather Predictive Center Alerts
1,789 assorted U.S. Government products
3,588 assorted confidential, proprietary or non-public products
13,184 open source media reports
1,257 RC and ISO/RTO notifications
110 The link to the NERC Lessons Learned page: http://www.nerc.com/pa/rrm/ea/Pages/Lessons-Learned.aspx.

Appendix E – Event Analysis Discussion
NERC | State of Reliability Report 2015 | May 2015 143
The information gathered allows the ERO to identify and conduct in-depth, critical self-analyses of Qualified Events to identify trends and provide experience-based insight to prevent repeat occurrences. The BPSA group also supports the development and publication of Industry Alerts and awareness products and facilitates information sharing among industry, Regions, and the government during crisis situations and major system disturbances.
Products:
252 daily reports
33 special reports for significant occurrences
4 security-related NERC Advisory (Level 1) Alerts for ES-ISAC
1 reliability-related NERC Advisory (Level 1) Alert
503 new Event Analysis database entries
170 qualified Event Analysis Process events
Analysis and Reporting of Events BPS conditions provide recognizable signatures through automated tools, mandatory reports, voluntary information sharing, and third-party publicly available sources. The significant majority of these signatures represent conditions and occurrences that have little or no reliability impact, either positive or adverse, on the BPS. However, being continually cognizant of the short-term condition of the BPS and the signatures associated with the entire range of reliability performance helps the ERO identify significant occurrences and events. Registered entities continue to share information and collaborate with the ERO well beyond what is required to maintain and improve the overall reliability of the grid. Only a small subset of the occurrences of which the BPSA group is made aware rise to the level of a reportable event. When a registered entity experiences an event, the registered entity will recommend an initial category for the event. The categories listed in the Categorization of Events section of the process do not cover all possible events.111
The quality, detailed analysis, and investigations that entities have performed have led to quality reports.112 Good-quality event analysis reports allow for more accurate cause coding of events and has led to better trending. Better trending leads to timely identification of issues being communicated back to the industry.
NERC Cause Code Assignment Process Through the Event Analysis Process, NERC assesses every event report to identify and then share, industry-wide, the apparent threats to reliability that may be emerging. The NERC CCAP manual113 was updated in March 2014. Cause coding has allowed for easier trending for all event causes. While the root cause of every event can not necessarily be determined, many of the contributing causes or failed defenses can be determined, analyzed, and trended to provide valuable information to the industry. Through the Event Analysis Process, cause codes were assigned to 401 events with 342 contributing cause codes. A similar identification of trends can be observed in the large contribution of “less than adequate” or “needs improvement” cause factors in the area of Management and Organizational practices that contribute to events. Many of these threats can be identified and shared with the industry for awareness. For example, in Figure E.1 below, the identification of some of the particular challenges to organization and management effectiveness are
111 For a more thorough review of the process, see:
http://www.nerc.com/pa/rrm/ea/EA Program Document Library/Final_ERO_EA_Process_V2.1.pdf. 112 http://www.nerc.com/pa/rrm/ea/EA Program Document Library/NERC-Report-Quality.pdf 113 http://www.nerc.com/files/NERC_Cause_Code_Assignment_Process_February_2013.pdf
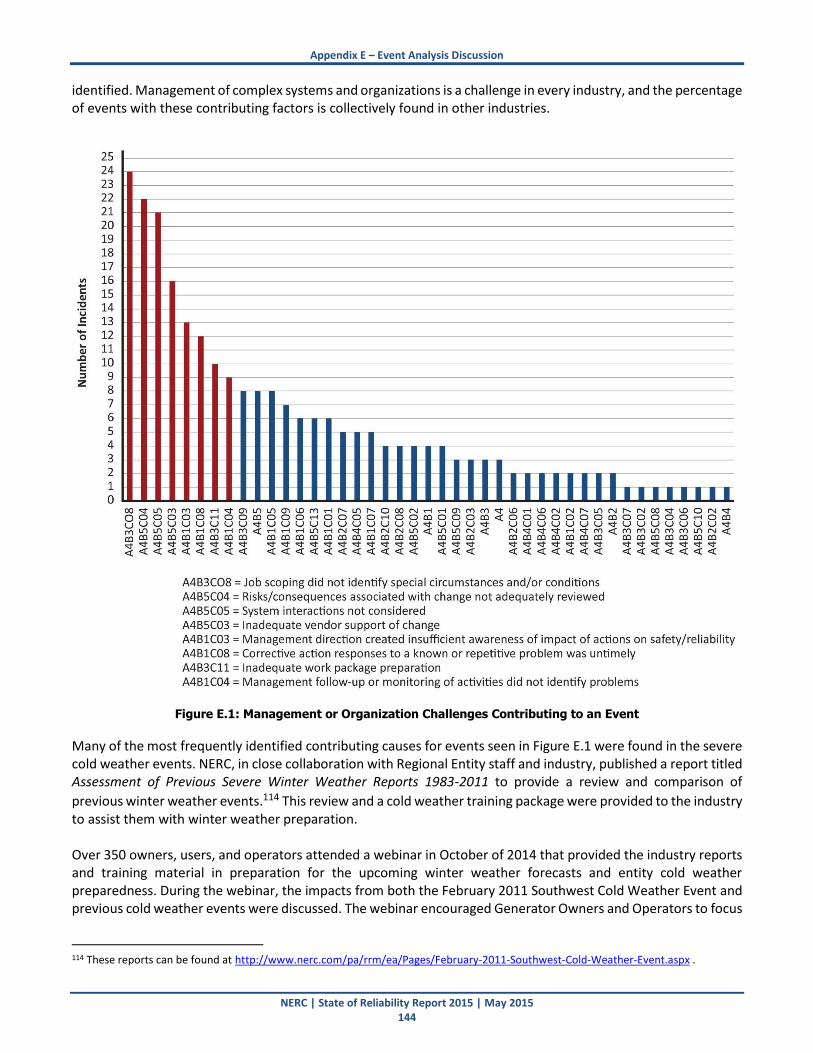
Appendix E – Event Analysis Discussion
NERC | State of Reliability Report 2015 | May 2015 144
identified. Management of complex systems and organizations is a challenge in every industry, and the percentage of events with these contributing factors is collectively found in other industries.
Figure E.1: Management or Organization Challenges Contributing to an Event
Many of the most frequently identified contributing causes for events seen in Figure E.1 were found in the severe cold weather events. NERC, in close collaboration with Regional Entity staff and industry, published a report titled Assessment of Previous Severe Winter Weather Reports 1983-2011 to provide a review and comparison of
previous winter weather events.114 This review and a cold weather training package were provided to the industry to assist them with winter weather preparation. Over 350 owners, users, and operators attended a webinar in October of 2014 that provided the industry reports and training material in preparation for the upcoming winter weather forecasts and entity cold weather preparedness. During the webinar, the impacts from both the February 2011 Southwest Cold Weather Event and previous cold weather events were discussed. The webinar encouraged Generator Owners and Operators to focus
114 These reports can be found at http://www.nerc.com/pa/rrm/ea/Pages/February-2011-Southwest-Cold-Weather-Event.aspx .

Appendix E – Event Analysis Discussion
NERC | State of Reliability Report 2015 | May 2015 145
on areas that were observed in past events, such as inspecting and maintaining heat trace equipment and thermal insulation, erecting adequate wind breaks and enclosures, and taking measures to protect instrument lines and equipment prior to the onset of winter weather. The Assessment of Previous Severe Winter Weather Reports 1983-2011 report was also reviewed during the webinar. This was to remind industry that generators experienced weather-related outages, and rolling blackouts in previous events and lessons learned from these events could have prevented outages in more recent winter events. The Reliability Guideline Generating Unit Winter Weather Readiness – Current Industry Practices was also reviewed. This guideline provides a general framework for developing an effective winter weather readiness program for generating units throughout North America. Although the NERC Winter Reliability Assessment 2014-15 was expected to be published later in November, attendees were given a preview of the draft. The NOAA winter outlook, resource adequacy, and seasonal reliability issues were also covered during the webinar. Attendees were introduced to a Cold Weather Event Training Package designed by NERC training staff to assist nontraditional cold weather registered entities with properly preparing for cold weather events. The materials were designed to be a guide to training sessions. These materials have been created as a foundation for training and remain in PowerPoint115 format to allow for customization based on registered entity needs. The Event Analysis Process continues to establish the appropriate balance of data reporting for analysis and use by the industry. NERC is investigating ways to sustain positive efforts and to improve the process.
Individual and Organizational Human Performance Analysis of the event reports to date have identified possible workforce capability and human performance challenges that pose threats to reliability. Workforce capability and human performance is a broad topic and can most simply be divided into management, team, and individual levels. To provide more detailed information on the types of errors that were observed in BPS events since the inception of the NERC Event Analysis program, and specifically events that involved human error or potentially less-than-adequate training, the following summary is provided. Generally, individual error is classified in the mode of performance in which the individual was operating when the error was committed. The NERC Cause Code Assignment Process uses a popular methodology as prescribed in one of the three modes, depending on the nature of the task and the level of experience with the particular situation. That is, when information is first perceived and interpreted in the processing system, that information is processed cognitively in either the skill-based, knowledge-based, or rule-based levels, depending on the individual’s degree of experience with the particular situation. Additionally, when contributing causes are considered, over half of the event reports to date indicate some management or organizational challenges. To support industry with these challenges, NERC held its third annual HP conference in Atlanta, Improving Human Performance on the Grid,116 at the end of March 2014. The focus this year was not only on individual human performance, but the organizational and management challenges around human capital. The conference included industry and related industry professionals in the field, with over 200 attendees from all Regions. The conference and associated workshops were very well received. NERC supported WECC for a similar venue for industry in the fall. NERC provided industry support in this area to well over 250 registered entities across the eight Regions.
115 This webinar presentation can be found at: http://www.nerc.com/pa/rrm/ea/Pages/February-2011-Southwest-Cold-Weather-Event.aspx. 116 The full conference presentations for the past Human Performance Conference at NERC can be found at http://www.nerc.com/pa/rrm/hp/Pages/default.aspx.

Appendix E – Event Analysis Discussion
NERC | State of Reliability Report 2015 | May 2015 146
Monitoring and Situation Awareness (Real-Time Tools) Energy Management Systems (EMS), including SCADA, digital, or analog communications and real time tools, are vital for maintaining situational awareness and making operating decisions at both the individual and the organizational level. EMS systems are extremely reliable and are typically redundant. However, an outage of the EMS system increases the potential risk to the reliability of the BPS. The NERC Event Analysis program has received 111 Category 2b event reports, where a complete loss of SCADA, monitoring, or control has lasted for more than 30 minutes. NERC’s commitment to active collaboration and sharing has allowed more information to be adequately reviewed and shared about these events in conjunction with the NERC Regions and the affected entities. In October 2013, the Event Analysis Process changed to add a new category of events. Category 1h, for the partial loss of EMS, is defined as:
Loss of monitoring or control, at a control center, such that it significantly affects the entity’s ability to make operating decisions for 30 continuous minutes or more.
Examples include but are not limited to the following:
1. Loss of operator ability to remotely monitor, control BES Elements, or both
2. Loss of communications from SCADA RTUs
3. Unavailability of ICCP links reducing BES visibility
4. Loss of the ability to remotely monitor and control generating units via AGC
5. Unacceptable State Estimator or Contingency Analysis solutions The EAS transitioned the Energy Management System Task Force (EMSTF) to a permanent working group to analyze the events and data that were being collected about EMS outages and challenges. Industry also recognized that many EMS outages were significantly less than the Category 2b, but impacted the decision-making activities for which the EMS is used. Category 1h was created to learn more about these type of events. This category allows the EMSWG to collect a greater number of the occurrences of EMS partial outages and share this information with the industry. With this modification of reporting EMS events, the number of Category 1h events reported by the industry has provided useful information and has decreased the number of Category 2b events. The active participation has led to even more detailed reporting and sharing of information, all helping the industry understand and mitigate the risk of these events. From the Event Analysis reports and the work of the EAS, NERC published multiple lessons learned specifically about EMS outages and worked to build and support an industry-led EMSTF to support the EAS. The hard work and active sharing of this group has reduced some of the residual risk associated with this potential loss of situation awareness and monitoring capability associated with this type of event, and will continue to provide valuable information to the industry.
With the support of the EMSTF, NERC hosted its second Monitoring and Situational Awareness Conference, focused on improving Energy Management Systems reliability, September 23–24, 2014. The conference brought together more than 90 Operations and EMS experts from more than 55 registered entities, and a variety of vendors and consultants. The entities that attended came from across all of the Regions and Canada. The feedback from participants has been extremely positive for the two conferences. Attendees liked the technical nature of the presentations and the takeaways they could use to improve the processes and procedures at their own companies. The openness with which the EMS issues and their corrective actions were shared was greatly appreciated by the attendees. Also appreciated was the platform that NERC provided to transparently share the events and learn from them. A third workshop was requested by industry for 2015. Industry has demonstrated
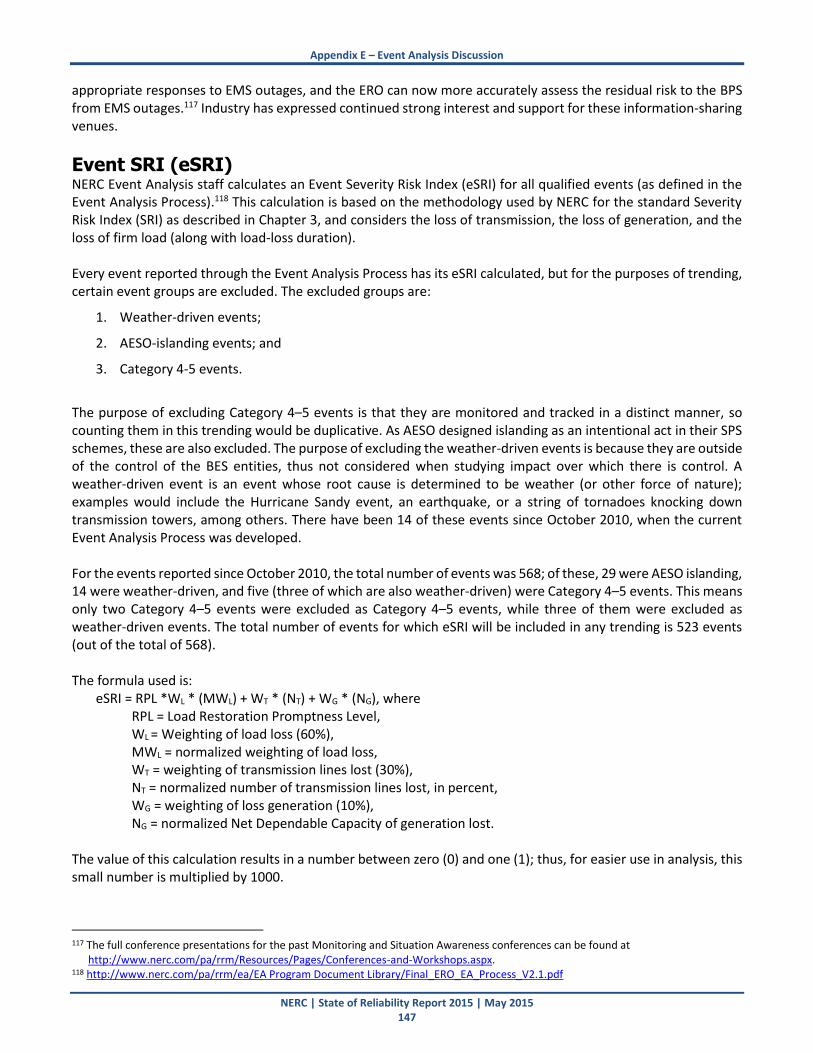
Appendix E – Event Analysis Discussion
NERC | State of Reliability Report 2015 | May 2015 147
appropriate responses to EMS outages, and the ERO can now more accurately assess the residual risk to the BPS from EMS outages.117 Industry has expressed continued strong interest and support for these information-sharing venues.
Event SRI (eSRI) NERC Event Analysis staff calculates an Event Severity Risk Index (eSRI) for all qualified events (as defined in the Event Analysis Process).118 This calculation is based on the methodology used by NERC for the standard Severity Risk Index (SRI) as described in Chapter 3, and considers the loss of transmission, the loss of generation, and the loss of firm load (along with load-loss duration). Every event reported through the Event Analysis Process has its eSRI calculated, but for the purposes of trending, certain event groups are excluded. The excluded groups are:
1. Weather-driven events;
2. AESO-islanding events; and
3. Category 4-5 events.
The purpose of excluding Category 4–5 events is that they are monitored and tracked in a distinct manner, so counting them in this trending would be duplicative. As AESO designed islanding as an intentional act in their SPS schemes, these are also excluded. The purpose of excluding the weather-driven events is because they are outside of the control of the BES entities, thus not considered when studying impact over which there is control. A weather-driven event is an event whose root cause is determined to be weather (or other force of nature); examples would include the Hurricane Sandy event, an earthquake, or a string of tornadoes knocking down transmission towers, among others. There have been 14 of these events since October 2010, when the current Event Analysis Process was developed. For the events reported since October 2010, the total number of events was 568; of these, 29 were AESO islanding, 14 were weather-driven, and five (three of which are also weather-driven) were Category 4–5 events. This means only two Category 4–5 events were excluded as Category 4–5 events, while three of them were excluded as weather-driven events. The total number of events for which eSRI will be included in any trending is 523 events (out of the total of 568). The formula used is:
eSRI = RPL *WL * (MWL) + WT * (NT) + WG * (NG), where RPL = Load Restoration Promptness Level, WL = Weighting of load loss (60%), MWL = normalized weighting of load loss, WT = weighting of transmission lines lost (30%), NT = normalized number of transmission lines lost, in percent, WG = weighting of loss generation (10%), NG = normalized Net Dependable Capacity of generation lost.
The value of this calculation results in a number between zero (0) and one (1); thus, for easier use in analysis, this small number is multiplied by 1000.
117 The full conference presentations for the past Monitoring and Situation Awareness conferences can be found at http://www.nerc.com/pa/rrm/Resources/Pages/Conferences-and-Workshops.aspx. 118 http://www.nerc.com/pa/rrm/ea/EA Program Document Library/Final_ERO_EA_Process_V2.1.pdf

Appendix E – Event Analysis Discussion
NERC | State of Reliability Report 2015 | May 2015 148
Once this number is calculated for each event and is plotted in chronological sequence, the slope of the trend line is calculated and plotted. In this way, the trend can be visually identified (as well as numerically calculated using statistical software). Every day has its eSRI calculated (meaning a day with no events has an eSRI = 0.000). For any days with multiple events, the eSRIs are additive.
Summary The Event Analysis Process continues to provide valuable information for the industry to address potential threats or vulnerabilities to the reliability of the BPS. This continued active collaboration remains a testament to how much effort and resources are being expended in this area by the industry as well as how important it is for the ERO and industry to truly understand the different contributors to events. The continued cooperation and collaboration with the industry is the hallmark to this program’s success. The ability to identify specific pieces of equipment that are potential threats, as well as emerging trends that increase risk to the system, illustrates the value of the Event Analysis Process. These outcomes, coupled with the ability to actively share the information through Lessons Learned, webinars, technical conferences, and related venues, remain critical to the sustainment of high reliability.

NERC | State of Reliability Report 2015 | May 2015 149
Appendix F – Statistical Summary of SRI Assessment
The PAS has investigated the SRI performance for 2010 through 2014 as well as a year-by-year comparison and seasonal changes. A statistical test indicated statistically significant changes among annual SRI. ANOVA analysis showed that 2011 performance was the best SRI since 2010; moreover, the difference in all other years was statistically significant.119 The 2014 SRI performance was statistically similar to 2010 and 2012 but worse than 2011 and 2013. The descriptive statistics of annual SRI are listed in Table F.1.
Table F.1: Descriptive Statistics of Annual SRI
Year N Mean Standard Deviation
Minimum Maximum Median
2010 365 1.74 0.61 0.59 4.64 1.70
2011 365 1.50 1.04 0.48 13.97 1.34
2012 366 1.78 0.81 0.55 8.87 1.65
2013 365 1.67 0.60 0.46 4.06 1.57
2014 365 1.85 0.87 11.14 11.14 1.72
119 ANOVA with Fisher’s least significant difference test at the significant level 0.05.

Appendix F – Statistical Summary of SRI Assessment
NERC | State of Reliability Report 2015 | May 2015 150
The relative SRI performance by year is further visible in Figure F.1. The year 2011 was the best as measured by a median as well as a mean, in spite of the relatively large standard deviation (whose outliers included the September 8, 2011, load shed event, in addition to the February 2, 2011, cold weather load loss event).
Figure F.1: Boxplot of Annual SRI
The performance of each year compared to every other year is depicted in Table F.2 below; if no reference to statistical significance is made within the table, it is assumed to be statistically significant.120
Table F.2: Pairwise Comparison of Annual SRI
Compared to Year
Base Year 2011 2012 2013 2014
2010 2011 Better No Statistically
Significant Difference
No Statistically Significant Difference
No Statistically Significant Difference
2011 2011 Better 2011 Better 2011 Better
2012 No Statistically
Significant Difference
No Statistically Significant Difference
2013 2013 Better
120 At significance level 0.05.

Appendix F – Statistical Summary of SRI Assessment
NERC | State of Reliability Report 2015 | May 2015 151
In Figure F.2, the trend of performance is shown over the five-year history along with a time trend line.
Figure F.2: Fit Plot for SRI 2010–2014
The time trend line has a statistically significant positive slope (p = 0.032). The same result can be drawn for the correlations analysis: on average, the trend line for SRI is increasing over time (i.e., the hypothesis on a stable performance SRI over 2010 to 2014 cannot be accepted at 0.05 significance level).

Appendix F – Statistical Summary of SRI Assessment
NERC | State of Reliability Report 2015 | May 2015 152
Finally, the statistical analysis of the seasonal performance was done. It revealed statistically significant differences in SRI by season. The fall SRI has the best performance, the summer SRI has the worst. Table F.3 shows the statistics by season based on the 2010 to 2014 data.
Table F.3: Descriptive Statistics of SRI by Season
Season N
SRI
Mean Standard Deviation
Winter 452 1.66 0.97
Spring 460 1.66 0.55
Summer 460 2.05 0.71
Fall 454 1.47 0.84
A statistical test121 indicated that all differences in the seasonal expected SRI are statistically significant except those for winter and spring, which is also illustrated in Figure F.3.
Figure F.3: Boxplot for SRI by Season 2010–2014
121ANOVA with Fisher’s least significant difference test at the significant level 0.05.

NERC | State of Reliability Report 2015 | May 2015 153
Appendix G – Abbreviations Used in This Report
Acronym Description
ALR Adequate Level of Reliability
BES Bulk Electric System
BPS Bulk Power System
CDM Common/Dependent Mode
EEA Energy Emergency Alert
ERO Electric Reliability Organization
ERCOT Electric Reliability Council of Texas
FERC Federal Energy Regulatory Commission
FRCC Florida Reliability Coordinating Council
ICC Initiating Cause Code
IROL Interconnection Reliability Operating Limit
ISO Independent System Operator
ISO-NE ISO New England
KCMI Key Compliance Monitoring Index
MRO Midwest Reliability Organization
NERC North American Electric Reliability Corporation
NPCC Northeast Power Coordinating Council
NYISO New York Independent Service Operator
PAS Performance Analysis Subcommittee
PSMTF Protection System Misoperation Task Force
RC Reliability Coordinator
RE Regional Entities
RF ReliabilityFirst
RSG Reserve-Sharing Group
SERC SERC Reliability Corporation
SNL Sandia National Laboratories
SOL System Operating Limit
SPS Special Protection Schemes
SPCS System Protection and Control Subcommittee
SPP Southwest Power Pool
SRI Severity Risk Index
TADS Transmission Availability Data System
TADSWG Transmission Availability Data System Working Group
TO Transmission Owner
TRE Texas Reliability Entity
WECC Western Electricity Coordinating Council

NERC | State of Reliability Report 2015 | May 2015 154
Appendix H – Contributions
Acknowledgements NERC would like to express its appreciation to the many people who provided technical support and identified areas for improvement.
NERC Industry Groups Table H.1 lists the NERC industry group contributors.
Table H.1: NERC Group Acknowledgements
Group Officers
Planning Committee Reviewers
Gary Brownfield, Ameren Services
Carl Turner, Florida Municipal Power Agency
Herb Schrayshuen
Operating Committee Reviewers
Todd Lucas, Southern Company Doug Peterchuck, OPPD Hassan Hamdar, FRCC
Performance Analysis Subcommittee
Chair: Melinda Montgomery, Entergy
Vice Chair: Heide Caswell, PacifiCorp
Demand Response Availability Data System Working Group
Chair: Maggie Peacock, WECC
Event Analysis Subcommittee
Chair: Sam Holeman, Duke Energy
Vice Chair: Hassan Hamdar, FRCC
Generation Availability Data System Working Group
Chair: Gary Brinkworth, TVA
Vice Chair: Leeth DePriest, Southern Company
Transmission Availability Data System Working Group
Chair: Jeff Schaller, Hydro One Networks, Inc.
Resources Subcommittee
Chair: Gerald Beckerle, Ameren Services
Vice Chair: John Blalock, SCE&G
Operating Reliability Subcommittee
Chair: Joel Wise, TVA
Vice Chair: Eric Senkowicz, FRCC
Frequency Working Group Chair: Sydney Niemeyer, NRG Energy
Operating Committee
Chair: James D. Castle, New York Independent System Operator
Vice Chair: James Case, Entergy Services
Planning Committee
Chair: Dave Weaver, Exelon Corporation
Vice Chair: Brian Evans-Mongeon, Utility Services, Inc.
Reliability Assessment Subcommittee
Chair: Layne Brown, WECC
System Protection and Control Subcommittee
Chair: William J. Miller, Exelon Corporation
Vice Chair: Philip B. Winston, Southern Company
Protection System Misoperations Task Force Chair: John Seidel, Midwest Reliability Organization
Spare Equipment Working Group
Vice Chair: Puesh Kumar, APPA
Compliance and Certification Committee
Chair: Patricia E. Metro, National Rural Electric Cooperative Association
Vice Chair: Jennifer Flandermeyer, KCP&L

Appendix H – Contributions
NERC | State of Reliability Report 2015 | May 2015 155
Regional Entity Staff Table H.2 provides a list of the Regional Entity staff that provided data and content review.
Table H.2: Contributing Regional Entity Staff
Name Regional Entity
Hassan Hamdar FRCC
John Seidel MRO
Rafael Sahiholamal NPCC
Paul Kure RF
Maria Haney SERC
Alan Wahlstrom SPP
Bob Collins TRE
Matthew Elkins and Maggie Peacock WECC
NERC Staff Table H.3 provides a list of the NERC staff who contributed to this report.
Table H.3: NERC Staff
Name Title E-mail Address
Thomas Burgess Vice President and Director, Reliability Assessment and Performance Analysis [email protected]
Howard Gugel Director of Performance Analysis [email protected]
Naved Khan Engineer, Performance Analysis [email protected]
Svetlana Ekisheva Principal Statistician, Performance Analysis [email protected]
Matthew Varghese Senior Performance Analysis Engineer [email protected]
Trinh Ly Engineer, Performance Analysis [email protected]
Andrew Slone Engineer, Event Analysis [email protected]
Lee Thaubald Data Analyst, Performance Analysis [email protected]
Michelle Marx Administrative Assistant [email protected]
Ben McMillan Senior Risk Analysis Engineer [email protected]
James Merlo Director of Reliability Risk Management [email protected]
Robert W. Cummings
Director of Reliability Initiatives and System Analysis [email protected]
Rich Bauer Senior Reliability Specialist [email protected]
Margaret Pate Reliability Risk Control Program Liaison [email protected]
Alex Carlson Technical Publications Specialist [email protected]

�������������� ������������������������������������ ��� ����
���������������������������������������������������������������������������������������������������������� ����!����������������