STATE OF FLORIDA · STATE OF FLORIDA Research Report ... Pavement Supporting Soils Test Facility...
27
STATE OF FLORIDA Research Report FL/DOT/SMO/99-432 Bouzid Choubane Robert K. Ho Jamshid M. Armaghani July 1999 STATE MATERIALS OFFICE FULL-SCALE LABORATORY EVALUATION OF POLYPROPYLENE FIBER REINFORCEMENT OF SUBGRADE SOILS
-
Upload
truonghanh -
Category
Documents
-
view
218 -
download
2
Transcript of STATE OF FLORIDA · STATE OF FLORIDA Research Report ... Pavement Supporting Soils Test Facility...
STATE OF FLORIDA
Research Report FL/DOT/SMO/99-432
Bouzid Choubane Robert K. Ho
Jamshid M. Armaghani
July 1999
STATE MATERIALS OFFICE
FULL-SCALE LABORATORY EVALUATION OF POLYPROPYLENE FIBER REINFORCEMENT OF
SUBGRADE SOILS
TABLE OF CONTENTS
LIST OF TABLES.......................................................................................................................... ii
LIST OF FIGURES ....................................................................................................................... iii
EXECUTIVE SUMMARY ........................................................................................................... iv
INTRODUCTION ...........................................................................................................................1
OBJECTIVES..................................................................................................................................2
EXPERIMENTAL PROGRAM ......................................................................................................2 Pavement Supporting Soils Test Facility.............................................................................2 Loading System ...................................................................................................................3 Materials ..............................................................................................................................4
Soils ......................................................................................................................4 Stabilizing Materials ................................................................................................4
Fibers ..........................................................................................................4 Limerock ......................................................................................................5
Materials Preparation ...........................................................................................................5 Materials Testing .................................................................................................................6
DATA ANALYSIS..........................................................................................................................8
Maximum Dry Density ........................................................................................................8 LBR ..................................................................................................................................9 Deformations........................................................................................................................9 Resilient Modulus ..............................................................................................................10
CONCLUSIONS............................................................................................................................10
RECOMMENDATIONS...............................................................................................................11
ACKNOWLEDGEMENTS...........................................................................................................12
REFERENCES ..............................................................................................................................12
i

LIST OF TABLES
Table Page
1 Soil Description ....................................................................................................................14
2 Results of Modified Proctor and LBR Tests.........................................................................14
ii
LIST OF FIGURES
Figure Page
1 Schematic drawing of a sectional view of the Test Pit .........................................................15
2 Schematic illustration of the testing set up ...........................................................................15
3 Lay out of loading locations per test section ........................................................................16
4 Strength-density relationship of soil test samples.................................................................16
5 Average deformations as recorded for Orlando sand under soaked moisture condition ..........................................................................................17
6 Average deformations as recorded for Orlando sand under optimum moisture condition.......................................................................................17
7 Average deformations as recorded for Orlando sand under drained moisture condition .........................................................................................18
8 Average deformations as recorded for St. Augustine sand under soaked moisture condition ................................................................................18
9 Average deformations as recorded for St. Augustine sand under optimum moisture condition.............................................................................19
10 Average deformations as recorded for St. Augustine sand under drained moisture condition ...............................................................................19
11 Resilient Modulus as recorded for Orlando sand under soaked moisture condition ..........................................................................................20
12 Resilient Modulus as recorded for Orlando sand under optimum moisture condition.......................................................................................20
13 Resilient Modulus as recorded for Orlando sand under drained moisture condition .........................................................................................21
14 Resilient Modulus as recorded for St. Augustine sand under soaked moisture condition ................................................................................21
15 Resilient Modulus as recorded for St. Augustine sand under optimum moisture condition.............................................................................22
16 Resilient Modulus as recorded for St. Augustine sand under drained moisture condition ...............................................................................22
iii
EXECUTIVE SUMMARY
Full scale laboratory testing was carried out to establish the magnitude of the resilient and
strength properties of polypropylene fiber reinforced subgrade soils as compared to those
obtained on both the traditional Florida limerock stabilized and non-stabilized (control) soils.
Two soils, from different sources, were used for the purpose of this study. The first,
obtained from a St. Augustine source, had 3 percent passing a 75-�m (#200) sieve and an LBR
value of 19. The second, from the Orlando area, had 10 percent passing a 75-�m sieve size and
an LBR value of 32. Both sands were classified as A-3 materials based on the AASHTO
classification system. A total of six material combinations were considered, namely: (1) St.
Augustine sand with fibers, (2) Orlando sand with fibers, (3) St. Augustine sand with limerock,
(4) Orlando sand with limerock, (5) control St. Augustine sand, and (6) control Orlando sand.
Each test mixture was evaluated using a repeated load testing in the State Materials Office Test
Facility for Pavement Support Layers referred to as Test Pit. Both cyclic load-deformation and
resilient modulus data were collected. In addition, modified Proctor and Limerock Bearing Ratio
(LBR) tests were also performed on each of the test samples.
The findings indicate that the polypropylene fibers, although significantly enhanced the
strength behavior of the virgin soils, are neither a practical nor an effective alternative to
limerock stabilization for pavement subgrade layers.
iv
INTRODUCTION
The long-term performance of a pavement structure is strongly dependent upon its
supporting soil conditions. Therefore, it is imperative to improve poor properties of native soil
such as high plasticity, poor workability, potential for high volume changes, and low shear
strength in pavement applications. These unsuitable materials characteristics are traditionally
altered using stabilizing materials such as lime and cement. When added under the right
temperature and moisture conditions, the stabilizing materials induce several reactions that
modify some of the soil characteristics (1). The changes would then result in increased strength
and stiffness of the compacted soil mixtures, thus improving the structural adequacy of the
pavement system. Yet, under certain field conditions, they may also lead to weaker supporting
layers due to potential infiltration of sulfate- and carbonate-bearing moisture or strong alkaline
ground water conditions (2). Consequently, there has been a continuous search for potential
mechanical alternative forms to chemical stabilization methods. Of interest are geosynthetic
systems that include fabrics, geogrids, and fibers.
Several studies have been performed to investigate the effects of fiber reinforcements on
compacted soil-cement (3, 4). The reported findings were mixed, showing that different fibers
either improved or weakened the engineering properties of the test samples, depending on the
type of fibers, materials tested, and the tests performed. However, the data concerning the
impact due to the addition of random discrete fibers on the characteristics of compacted native or
virgin soils are limited (5). Thus, there is a need for information on the effects of fibers on the
properties of the pavement supporting soil layers. Ideally, the fibers themselves should be
readily available, non-degradable and capable of being easily blended into the soils and
compacted. The workability of fiber-reinforced materials implies that the fibers should be
resistant to bulking and clumping.
1
OBJECTIVES
The primary objective of this study was to evaluate the effect of discrete polypropylene
fibers on the performance of pavement supporting soils. The inherent goal was to produce a
stabilized material with enhanced properties relative to the traditional Florida limerock
stabilization. The evaluation process consisted of comparing the resilient and strength
characteristics of compacted fiber-reinforced soils to those of limerock-stabilized and control
(non-stabilized) virgin soils and establishing the magnitude of inherent variations in these
fundamental properties.
EXPERIMENTAL PROGRAM
Test Facility for Pavement Support Layers
The Florida Department of Transportation (FDOT) maintains a full scale test facility for
pavement support layers located at the State Materials Office. The schematic drawing of its
principal structural components is shown in Figure 1. The test facility is a 7.2-m long by 2.4-m
wide by 2.1-m deep (24x8x7 ft) concrete dugout that is commonly referred as the Test Pit. The
reinforced walls of the pit confine three support layers over a structural reinforced concrete floor. The
bottom layers consist of 300 mm (12 inches) of river gravel and 300 mm of builders sands
separated by a fiber fabric. These layers are used to allow water to rise to the overlying materials
during the soaked portion of the test series. The third layer is a 900 mm (36 inch) thickness of an
A-3 sand serving as a subgrade material for all tests. This sand has 3 percent passing a 75 �m
(#200) sieve size and a Limerock Bearing Ratio (LBR) of about 23. Note that the LBR is similar
to the California Bearing Ratio (CBR), with the primary exception of using the penetration of a
crushed Florida limerock as the standard reference (6). The upper part of the pit can be
bulkheaded to test three combined base/subgrade sections simultaneously. The pit is also
designed so that a material may be tested at different moisture levels. A sump that is filled with
2
river gravel surrounds the test pit. The water moves from this sump through a series of
connecting galleries located at the bottom of the pit walls. Such a design feature allows the
water table to be raised and lowered either to saturate or drain the test layers. The major
advantage of the test pit is that it provides for testing under controlled conditions related to
material properties, quality of construction, loading, and moisture. Thus, the effect of one or a
combination of specific variables on the performance of the supporting layers may be isolated
and evaluated.
Loading System
A Materials Testing Services (MTS) closed-loop servo-hydraulic system is used for
loading application. The system is on a movable track both in lateral and transverse directions.
The load is applied through a 300-mm (12-inch) diameter rigid plate. The loading plate is
positioned on top of a thin layer of a gypsum cement which is cast to provide for a uniform and
leveled contact area during testing. The load levels are measured using a load cell while the
resulting deflections are monitored through two linear variable differential transducers (LVDT)
placed 180 degrees apart on the rigid plate. It should be noted that the LVDTs are mounted on
an aluminum beam which rests on the longitudinal sides of the pit. Thus, the transducers are
completely independent of the loading assembly, and, hence, are not affected by the potential
deflection of the load supporting beam during testing. Figure 2 shows a schematic illustration of
the loading system.
The testing system is linked to a PC computer through an analog-to-digital card that
converts the analog voltage signals from the load cell and LVDTs into a digital voltage output.
A data acquisition system is also provided for automatic data collection and processing.
3
Materials
Soils
Two native soils, from different sources, were used in this study. The first was obtained
from a St. Augustine source. It was a tan colored sand having 3 percent passing a 75-�m (#200)
sieve and an LBR value of 19. The second was a darker sand from the Orlando area. It had 10
percent passing a 75-�m sieve size and an LBR value of 32. Both sands were classified as A-3
materials based on the AASHTO classification system. The soil descriptions are given in Table
1. These two materials were chosen because of their poor LBR characteristics for subgrade
applications. The current Florida specifications require subgrade materials to have a minimum
LBR value of 40, as determined using the Florida test method FM 5-515 (6).
Stabilizing Materials
Fibers
As stated previously, two stabilizing materials were considered for the purpose of this
investigation, namely synthetic fibers and limerock. The fibers used were 50-mm long discrete
fibrillated polypropylene strands that resemble a lattice-work when stretched. Polypropylene
was chosen because it is a chemically stable and inert polymer with reasonably high strength
characteristics and its availability. Presumably, during the blending process, the fibrillated fibers
would open into nets or grids that would mechanically reinforce a soil. Preliminary laboratory
test results indicated that a dosage at 0.2 percent of the soil�s dry weight is an optimal fiber
content beyond which LBR values decrease. It is possible that larger amount of fibers would
cause considerable clumping of fibers, thus, decreasing the punching shear resistance of the soil-
fiber mixtures (5). Therefore, a fiber content of 0.2 percent based on dry weight of soil was used
for all subsequent testing.
4
Limerock
Florida limerocks consist of different types of grains formed from the calcium carbonate
minerals calcite and aragonite. They are formed by chemical precipitation of calcium carbonate
from sea water and by accumulation of skeletal remains of marine animals. These deposits are
generally known by their formation names. The limerock used in this evaluation was from the
Ocala formation. It was a non-plastic material with a fairly uniform gradation and a carbonate
content of 94 percent. Preliminary laboratory tests showed that the optimum limerock content
for stabilization applications, based on dry weight of soils, was 20 percent when blended with St.
Augustine sand and 10 percent when added to the Orlando sand.
Materials Preparation
Six mixture combinations were respectively prepared and evaluated, namely, (1) St.
Augustine sand-fibers, (2) Orlando sand-fibers, (3) St. Augustine sand-limerock, (4) Orlando
sand-limerock, (5) raw St. Augustine sand, and (6) raw Orlando sand. Raw soils and stabilizing
materials were blended using a standard concrete mixer. As mentioned earlier, a fiber content of
0.2 percent was added to both soil types while 10 and 20 percent of limerock were respectively
added to Orlando and St. Augustine sands. All these dosages were based on the dry weight of
soils as determined during preliminary laboratory tests. Modified Proctor compaction and LBR
tests were performed on each of the soil-fiber and soil-limerock mixtures as well as on control
(raw) soil specimens in accordance with the Florida test methods FM 5-515 (6) and FM 5-521
(7), respectively.
After the mixing process, the upper part of the pit was bulkheaded into three 2.4 m x 2.4
m sections. The two opposite sections were then used so that two different mixture types could
be independently placed and tested at one time. Test materials were placed into the pit sections
5
in two 150-mm (6-inch) lifts. Each lift was compacted to a minimum of 98 percent of the lab
density. Fiber-reinforced mixtures were first placed and evaluated, followed by the limerock
blends then the virgin soils. It should be noted that the soil-fiber mixtures were not easily
workable because of the fiber webbing during mixing. In addition, though the target density
was fairly easy to achieve on the St. Augustine sand-fiber mixture, it took comparatively four
times as much compactive effort to obtain that of the Orlando sand-fiber blend. This observation
may be due to a combination of factors that include the type of fibers used in this application and
the larger amount of fines in Orlando sand. It is possible then to speculate that the inclusion of
fibrillated fibers may increase the resistance to densification of cohesive soils. The remaining
soil mixtures were placed and compacted to the desired density level without difficulty. All the
test mixtures were compacted using a hand-held vibratory compactor and the compaction level
was monitored using a nuclear gauge density.
Materials Testing
In order to account for the effect of moisture, the different soil mixtures were tested under
three moisture conditions. These conditions were, namely, (1) as compacted at or near optimum
moisture, (2) drained and dried, and (3) soaked condition. Repeated loading tests were
performed for 30,000 cycles and the corresponding deflections were measured for each
condition.
As a conditioning phase, a static load of 8.8 kN (2000 lb) was applied in 2.2-kN (500 lb)
increments. The resulting deflections were allowed to stabilize after each load increase. Then,
the loading was released and the material was let to recover. This conditioning process was
repeated three times to stabilize the resilient deformation.
After the initial conditioning period, the repeated (fatigue) testing phase was initiated. It
6
was estimated that a stress level of approximately 135 kPa (20 psi) would simulate the effects of
a 40 kN (9,000 lb) wheel tire on a subgrade layer surface of a typical flexible pavement section.
Thus, using the MTS loading system, a 135 kPa constant stress level was applied for up to
30,000 cycles or until fatigue failure, whichever came first. The adopted criterion for failure was
a total deformation of more than 10 mm (0.4 inches). A haversine loading with a duration of 0.1
second and a rest period of 0.9 second was used in this repeated load test. It is generally
accepted that a haversine waveform better simulate the actual loading occurring in the field (8).
Both total and permanent deformations were recorded at a number of designated cycles. In
addition, since the basis for materials characterization in the AASHTO Guide for Pavement
Design is the resilient modulus (9), resilient modulus data were also collected. The resilient
modulus is the elastic modulus determined based on the recoverable deformation under repeated
loads. For the purpose of this investigation, the resilient modulus, Mr, at each designated number
of cycles, was determined based on Burmister’s theory on rigid plate loading using the following
equation:
Mr = 1.18pa / ∆r (1)
Where:
p is the applied stress, Mpa;
a is the radius of the circular loading plate, mm; and
∆r is the recoverable deformation at the designated number of cycles, mm.
For each moisture condition, a dynamic loading test was conducted at three different
locations on each of the compacted soil mixtures. Therefore, a total of nine tests were performed
per mixture type. The locations were randomly chosen, for each moisture condition, within the
pattern shown in Figure 3. Each of these locations was not used more than once per soil mixture
type.
7
DATA ANALYSIS
All the data collected during this investigation were analyzed to establish the magnitude
of inherent variations in the resilient and fundamental strength properties of compacted fiber-
reinforced soils as well as of those of limerock-stabilized and control (non-stabilized) virgin
soils.
Maximum Dry Density
Modified Proctor test results are summarized in Table 2. As it can be seen, the inclusion
of stabilizers (both fibers and limerock) significantly increased the maximum dry density of the
St. Augustine sand but caused, comparatively, only a modest increase to that of Orlando sand.
These laboratory results do not seem to substantiate the general premise that the addition of
fibers would increase the resistance to densification. During the full scale testing phase,
however, even though the target density was fairly easy to obtain on the St. Augustine sand-fiber
mixture, four times as much compactive effort was required to achieve that of the Orlando sand-
fibers blend. Again, as stated previously, this observation may be due to a combination of
factors that include the type of fibers used for the purpose of this investigation and the
cohesiveness level of Orlando sand. The material preparation and placement phase of this
evaluation showed that the inclusion of fibrillated fibers significantly reduced the soil
workability and, depending on the soil types, could increase the soil resistance to densification.
Table 2 also shows that the addition of fibers caused a reduction in the optimum moisture
content, though more significantly in the St. Augustine sand than in the Orlando sand sample.
Note that the moisture content was determined based on the weight of solids, including soil and
fibers, since it would not have been practical to remove the fiber strands from the soil samples.
The addition of limerock, however, significantly increased the optimum moisture content in St.
Augustine sand but decreased it in the Orlando sand.
8

LBR
Table 2 also includes the results of the LBR test. In all instances, the addition of
limerock and fibers significantly improved the LBR values as compared to those of unreinforced
soils. In addition, regardless of the soil and reinforcement types, the strength of test samples
increased with the increase of the maximum dry density, independently of the optimum moisture
content levels. This strength-density relationship is illustrated in Figure 4. Therefore, it appears
that the use of the traditional soil mechanics index of maximum dry density alone as an indicator
to assess the strength of reinforced soils may be appropriate.
Deformations
The average total and permanent deflections as measured on three different locations for
each materials type and moisture condition during the full scale testing are illustrated in Figures
5 through 10. In all instances, as one would expect, the magnitude of the deformations decreased
with the decrease of moisture level. In the case of St. Augustine sand, limerock stabilization
resulted in significantly better performance at all the three moisture levels as compared to those
of virgin and fiber-reinforced soils. Further, in the soaked state, which represents the most
critical field condition, virgin and fiber-reinforced St. Augustine Sands failed prematurely at less
than 2,000 loading cycles. These observations are also valid for the Orlando sand when drained.
However, at both soaked and optimum moistures, the virgin Orlando sand resulted in lower
deformation values while those of the fiber-reinforced soil were the highest. In addition, the
latter material failed at 10,000 loading cycle when tested in a soaked condition. Permanent
deformations as measured during a repeated load test are synonymous of rut depth. Therefore,
based on these results, it may be speculated that, overall, the limerock-stabilized soils would
have a better rut resistance under actual field conditions.
9
Resilient Modulus
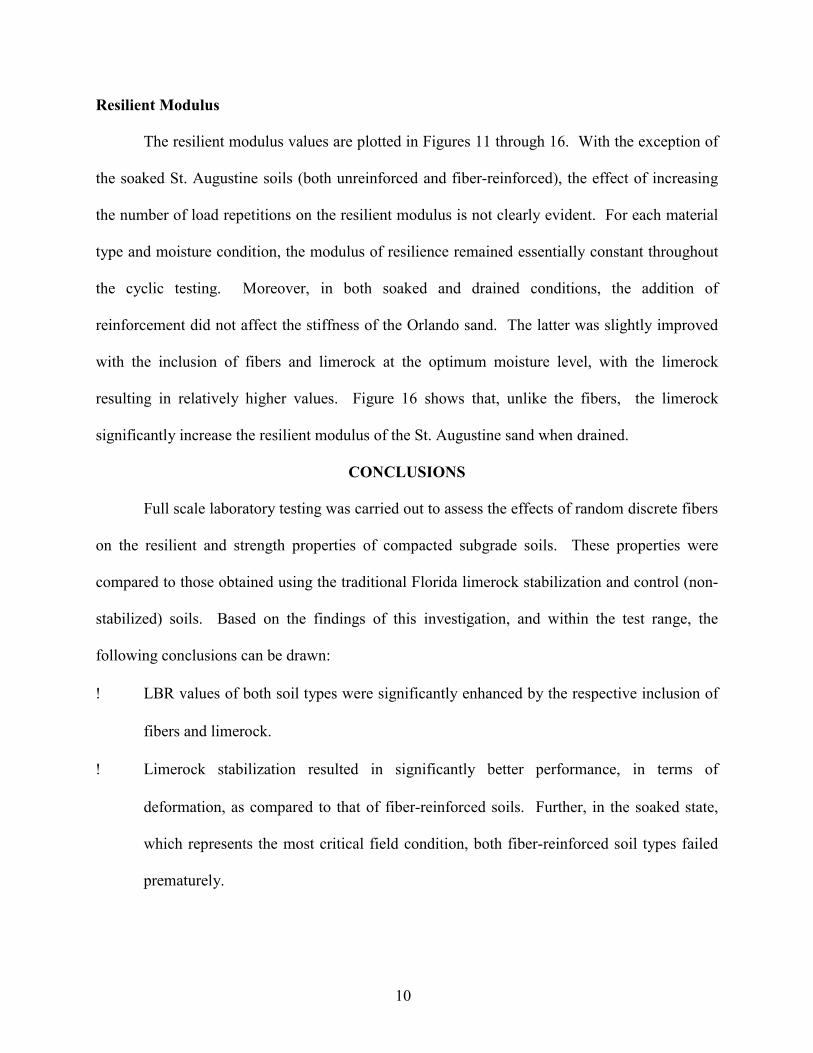
The resilient modulus values are plotted in Figures 11 through 16. With the exception of
the soaked St. Augustine soils (both unreinforced and fiber-reinforced), the effect of increasing
the number of load repetitions on the resilient modulus is not clearly evident. For each material
type and moisture condition, the modulus of resilience remained essentially constant throughout
the cyclic testing. Moreover, in both soaked and drained conditions, the addition of
reinforcement did not affect the stiffness of the Orlando sand. The latter was slightly improved
with the inclusion of fibers and limerock at the optimum moisture level, with the limerock
resulting in relatively higher values. Figure 16 shows that, unlike the fibers, the limerock
significantly increase the resilient modulus of the St. Augustine sand when drained.
CONCLUSIONS
Full scale laboratory testing was carried out to assess the effects of random discrete fibers
on the resilient and strength properties of compacted subgrade soils. These properties were
compared to those obtained using the traditional Florida limerock stabilization and control (non-
stabilized) soils. Based on the findings of this investigation, and within the test range, the
following conclusions can be drawn:
� LBR values of both soil types were significantly enhanced by the respective inclusion of
fibers and limerock.
� Limerock stabilization resulted in significantly better performance, in terms of
deformation, as compared to that of fiber-reinforced soils. Further, in the soaked state,
which represents the most critical field condition, both fiber-reinforced soil types failed
prematurely.
10
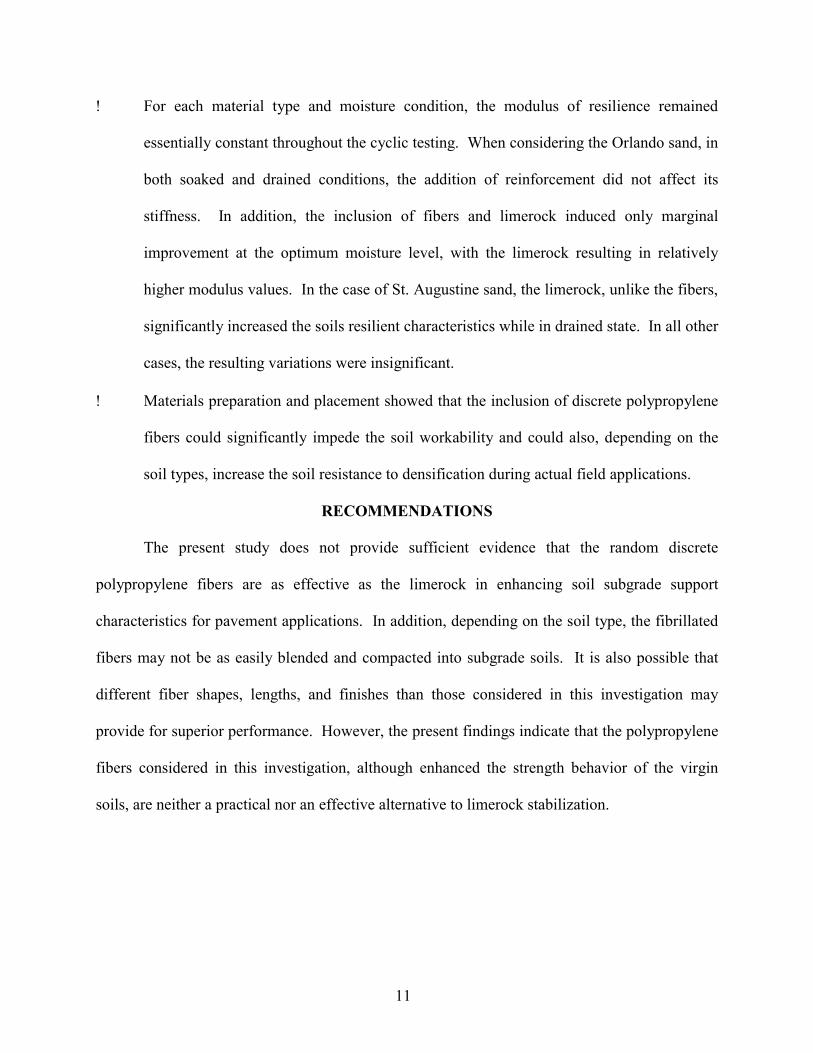
�� For each material type and moisture condition, the modulus of resilience remained
essentially constant throughout the cyclic testing. When considering the Orlando sand, in
both soaked and drained conditions, the addition of reinforcement did not affect its
stiffness. In addition, the inclusion of fibers and limerock induced only marginal
improvement at the optimum moisture level, with the limerock resulting in relatively
higher modulus values. In the case of St. Augustine sand, the limerock, unlike the fibers,
significantly increased the soils resilient characteristics while in drained state. In all other
cases, the resulting variations were insignificant.
�� Materials preparation and placement showed that the inclusion of discrete polypropylene
fibers could significantly impede the soil workability and could also, depending on the
soil types, increase the soil resistance to densification during actual field applications.
RECOMMENDATIONS
The present study does not provide sufficient evidence that the random discrete
polypropylene fibers are as effective as the limerock in enhancing soil subgrade support
characteristics for pavement applications. In addition, depending on the soil type, the fibrillated
fibers may not be as easily blended and compacted into subgrade soils. It is also possible that
different fiber shapes, lengths, and finishes than those considered in this investigation may
provide for superior performance. However, the present findings indicate that the polypropylene
fibers considered in this investigation, although enhanced the strength behavior of the virgin
soils, are neither a practical nor an effective alternative to limerock stabilization.
11
12
ACKNOWLEDGMENTS
The work reported herein was the result of a team effort. Annette Malpartida provided
project oversight and report on the initial data analysis and preliminary findings. Rick Venick
and Kelly Hamm performed the full scale tests and collected the deflection data, while Rufus
Green and the Soil Lab staff performed the modified Proctor and LBR tests. The authors are
grateful for their diligent efforts and contributing knowledge.
REFERENCES
1. Lockett L. W., and R. K. Moore. Lime-Soil Mixture Design Considerations for Soils of Southeastern
United States. In Transportation Research Record 839, TRB, National Research Council, Washington,
D.C., 1982.
2. Ajayi-Majebi, A., W. A. Grissom, and L. S. Smith. Epoxy-Resin-Based Chemical Stabilization of a Fine,
Poorly Graded Soil System. In Transportation Research Record 1295, TRB, National Research Council,
Washington, D.C., 1991.
3. Fletcher, C. S., and W. K. Humphries. California Bearing Ratio Improvement of Remolded Soils by the
Addition of Polypropylene Fiber Reinforcement. In Transportation Research Record 1295, TRB, National
Research Council, Washington, D.C., 1991.
4. Craig, R., J. Schuring, W. Costello, and L. Soong. Fiber Reinforced Soil Cement. American Concrete
Institute, SP-105, 1987.
5. Maher, M. H., and Y. C. Ho. Behavior of Fiber-Reinforced Cemented Sand under Static and Cyclic Loads.
In Geotechnical Testing Journal, American Society for Testing and Materials, Vol. 16, 1993.
6. Florida Method of Test for Limerock Bearing Ratio. Florida Department of Transportation, September
1993.
7. Florida Method of Test for Moisture Density Relations of Soils. Florida Department of Transportation,
September 1994.

13
8. Huang, Y. H. Pavement Analysis and Design. Prentice Hall, New Jersey, 1993.
9. AASHTO Guide for the Design of Pavement Structures. American Association of State Highway and
Transportation Officials, Washington, D.C., March 1993.
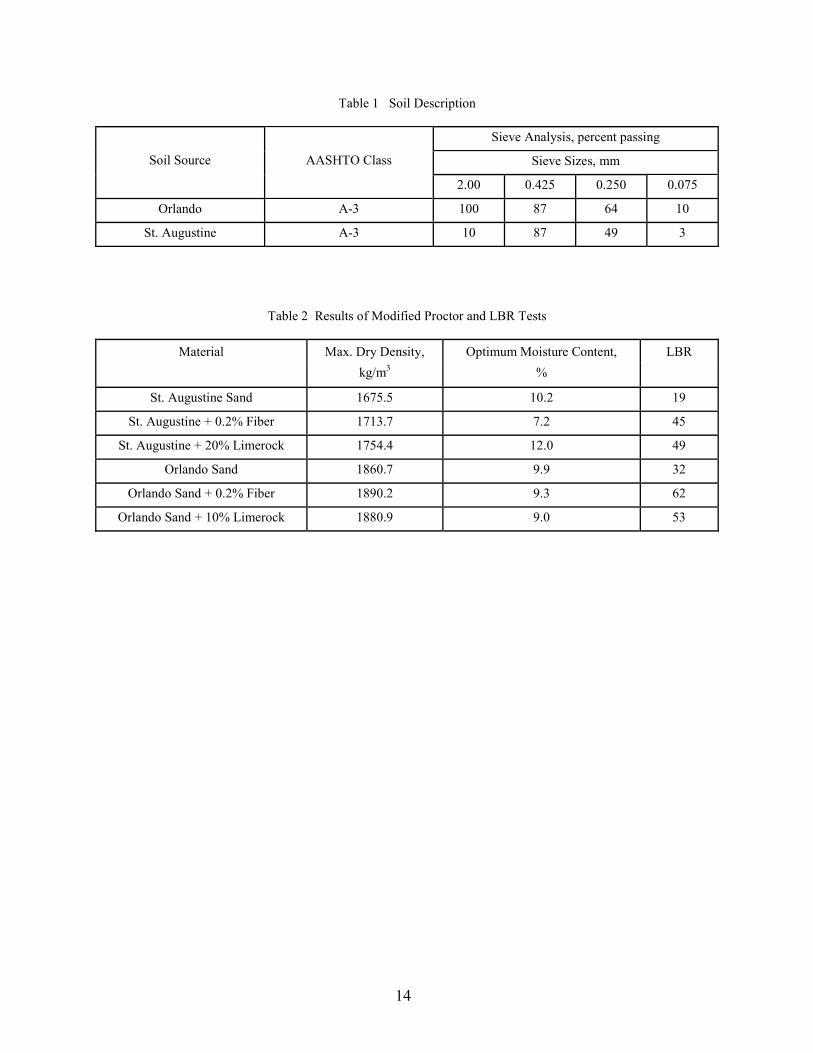
Table 1 Soil Description
Sieve Analysis, percent passing
Sieve Sizes, mm Soil Source AASHTO Class
2.00 0.425 0.250 0.075
Orlando A-3 100 87 64 10
St. Augustine A-3 10 87 49 3
Table 2 Results of Modified Proctor and LBR Tests
Material Max. Dry Density, Optimum Moisture Content, LBR kg/m3 %
St. Augustine Sand 1675.5 10.2 19
St. Augustine + 0.2% Fiber 1713.7 7.2 45
St. Augustine + 20% Limerock 1754.4 12.0 49
Orlando Sand 1860.7 9.9 32
Orlando Sand + 0.2% Fiber 1890.2 9.3 62
Orlando Sand + 10% Limerock 1880.9 9.0 53
14
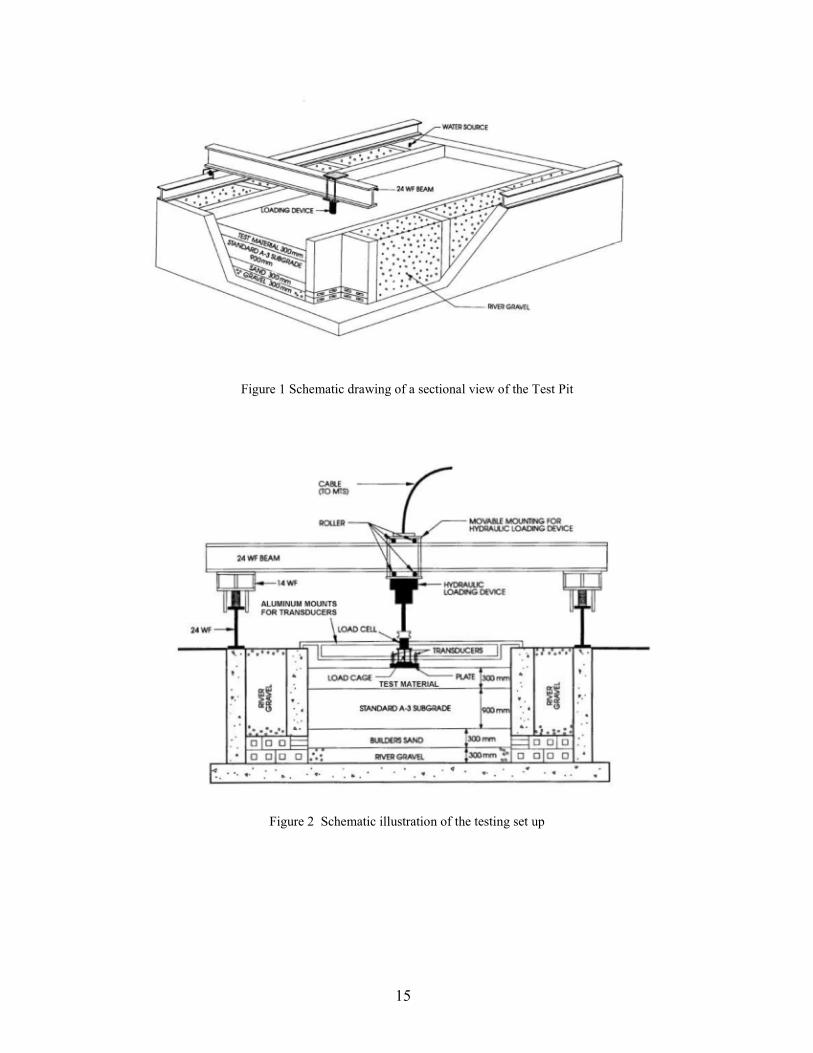
Figure 1 Schematic drawing of a sectional view of the Test Pit
Figure 2 Schematic illustration of the testing set up
15
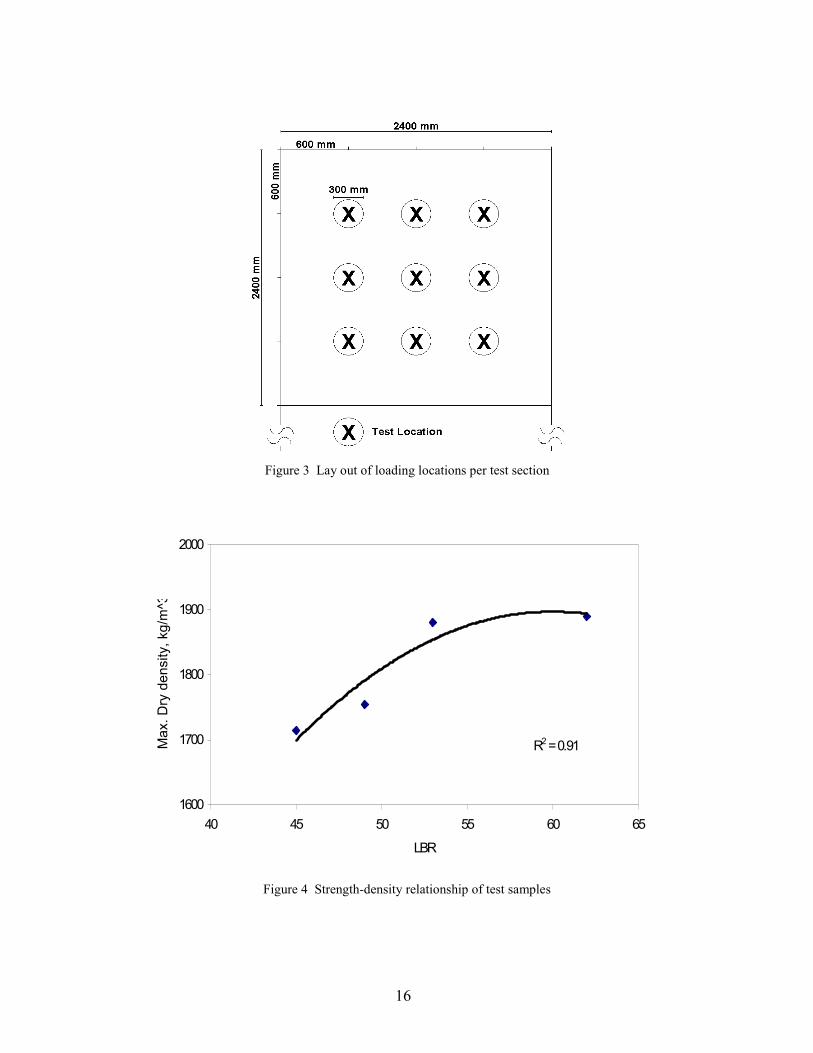
Figure 3 Lay out of loading locations per test section Figure 4 Strength-density relationship of test samples
16
R2 = 0.91
1600
1700
1800
1900
2000
40 45 50 55 60 65
LBR
Max
. Dry
den
sity
, kg/
m^3
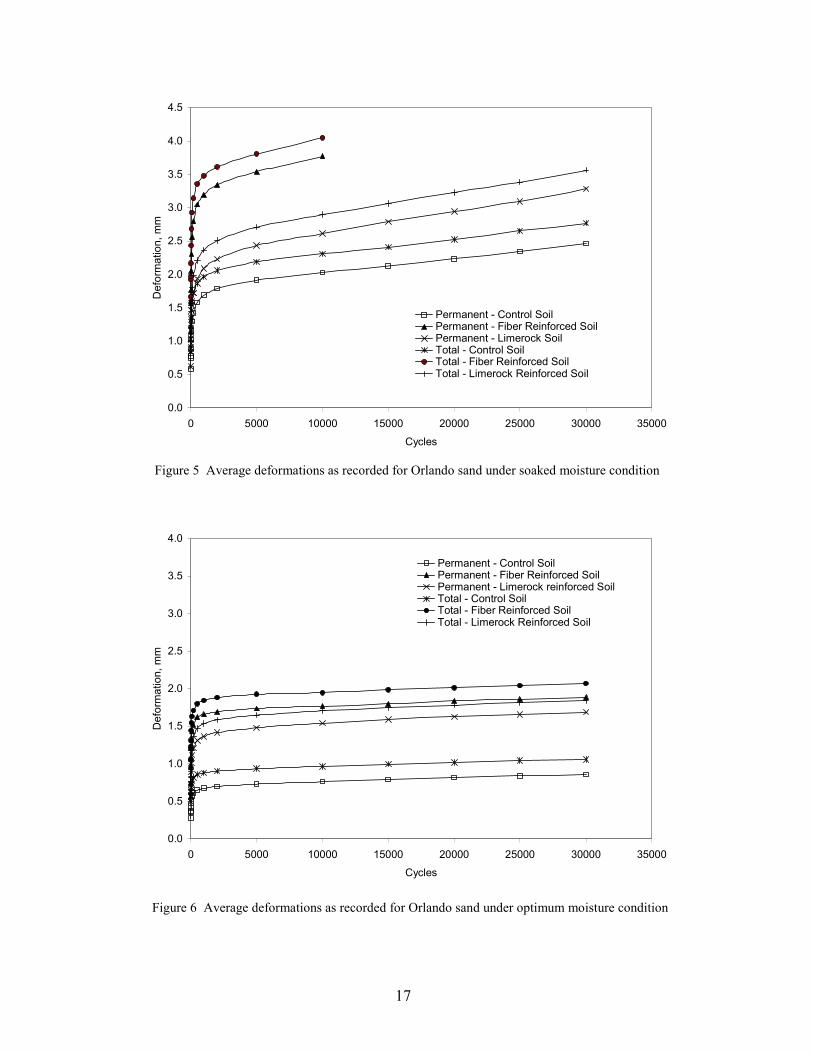
Figure 5 Average deformations as recorded for Orlando sand under soaked moisture condition Figure 6 Average deformations as recorded for Orlando sand under optimum moisture condition
0.0
0.5
1.0
1.5
2.0
2.5
3.0
3.5
4.0
4.5
0 5000 10000 15000 20000 25000 30000 35000Cycles
Def
orm
atio
n, m
m
Permanent - Control SoilPermanent - Fiber Reinforced SoilPermanent - Limerock SoilTotal - Control SoilTotal - Fiber Reinforced SoilTotal - Limerock Reinforced Soil
0.0
0.5
1.0
1.5
2.0
2.5
3.0
3.5
4.0
0 5000 10000 15000 20000 25000 30000 35000Cycles
Def
orm
atio
n, m
m
Permanent - Control SoilPermanent - Fiber Reinforced SoilPermanent - Limerock reinforced SoilTotal - Control SoilTotal - Fiber Reinforced SoilTotal - Limerock Reinforced Soil
17
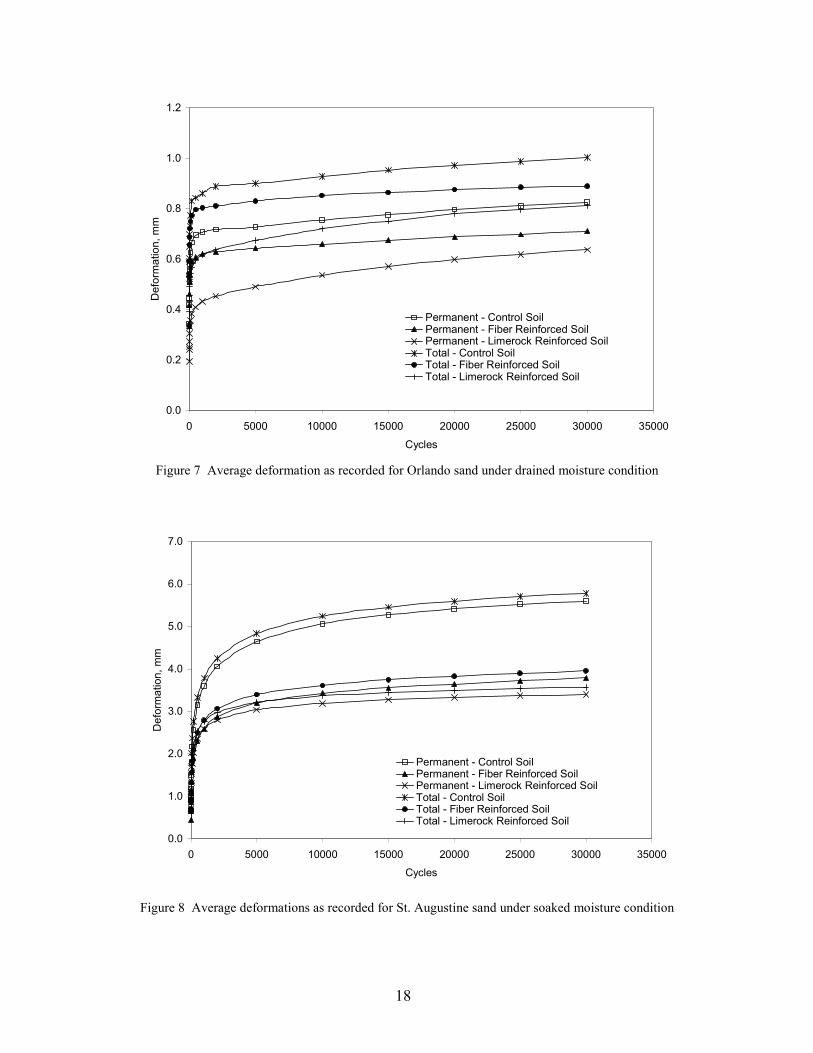
Figure 7 Average deformation as recorded for Orlando sand under drained moisture condition Figure 8 Average deformations as recorded for St. Augustine sand under soaked moisture condition
0.0
1.0
2.0
3.0
4.0
5.0
6.0
7.0
0 5000 10000 15000 20000 25000 30000 35000Cycles
Def
orm
atio
n, m
m
Permanent - Control SoilPermanent - Fiber Reinforced SoilPermanent - Limerock Reinforced SoilTotal - Control SoilTotal - Fiber Reinforced SoilTotal - Limerock Reinforced Soil
0.0
0.2
0.4
0.6
0.8
1.0
1.2
0 5000 10000 15000 20000 25000 30000 35000Cycles
Def
orm
atio
n, m
m
Permanent - Control SoilPermanent - Fiber Reinforced SoilPermanent - Limerock Reinforced SoilTotal - Control SoilTotal - Fiber Reinforced SoilTotal - Limerock Reinforced Soil
18
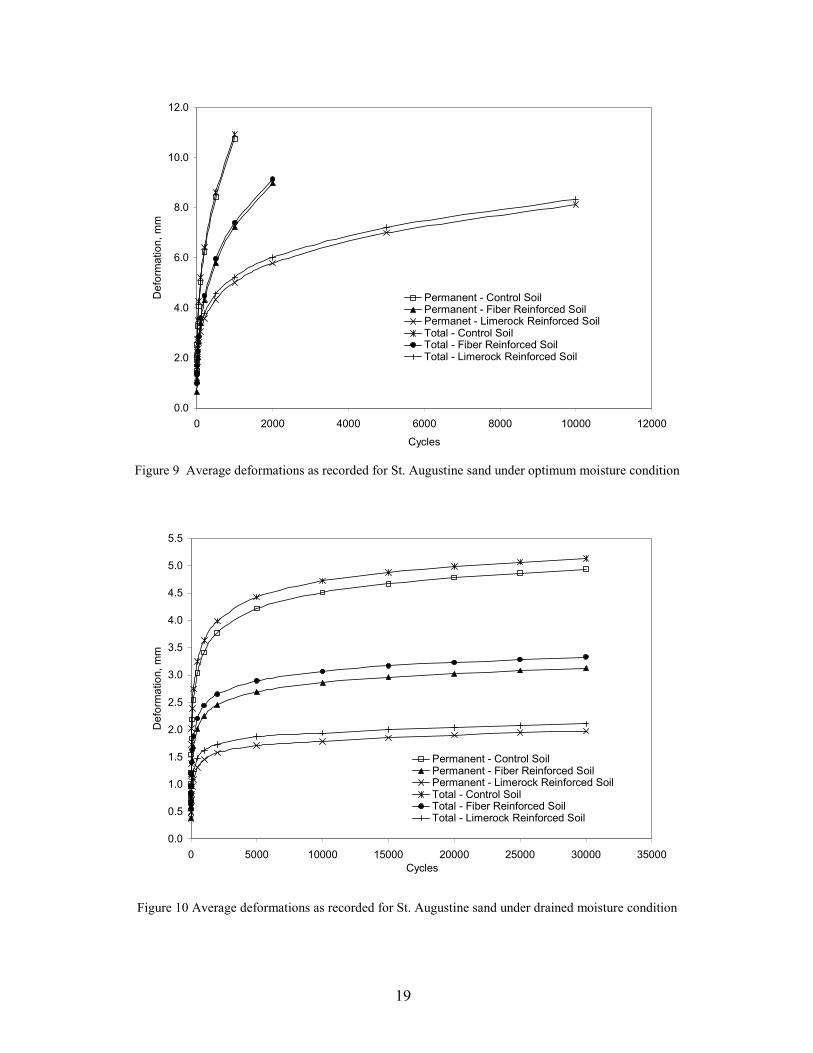
Figure 9 Average deformations as recorded for St. Augustine sand under optimum moisture condition Figure 10 Average deformations as recorded for St. Augustine sand under drained moisture condition
0.0
2.0
4.0
6.0
8.0
10.0
12.0
0 2000 4000 6000 8000 10000 12000Cycles
Def
orm
atio
n, m
m
Permanent - Control SoilPermanent - Fiber Reinforced SoilPermanet - Limerock Reinforced SoilTotal - Control SoilTotal - Fiber Reinforced SoilTotal - Limerock Reinforced Soil
0.0
0.5
1.0
1.5
2.0
2.5
3.0
3.5
4.0
4.5
5.0
5.5
0 5000 10000 15000 20000 25000 30000 35000Cycles
Def
orm
atio
n, m
m
Permanent - Control SoilPermanent - Fiber Reinforced SoilPermanent - Limerock Reinforced SoilTotal - Control SoilTotal - Fiber Reinforced SoilTotal - Limerock Reinforced Soil
19
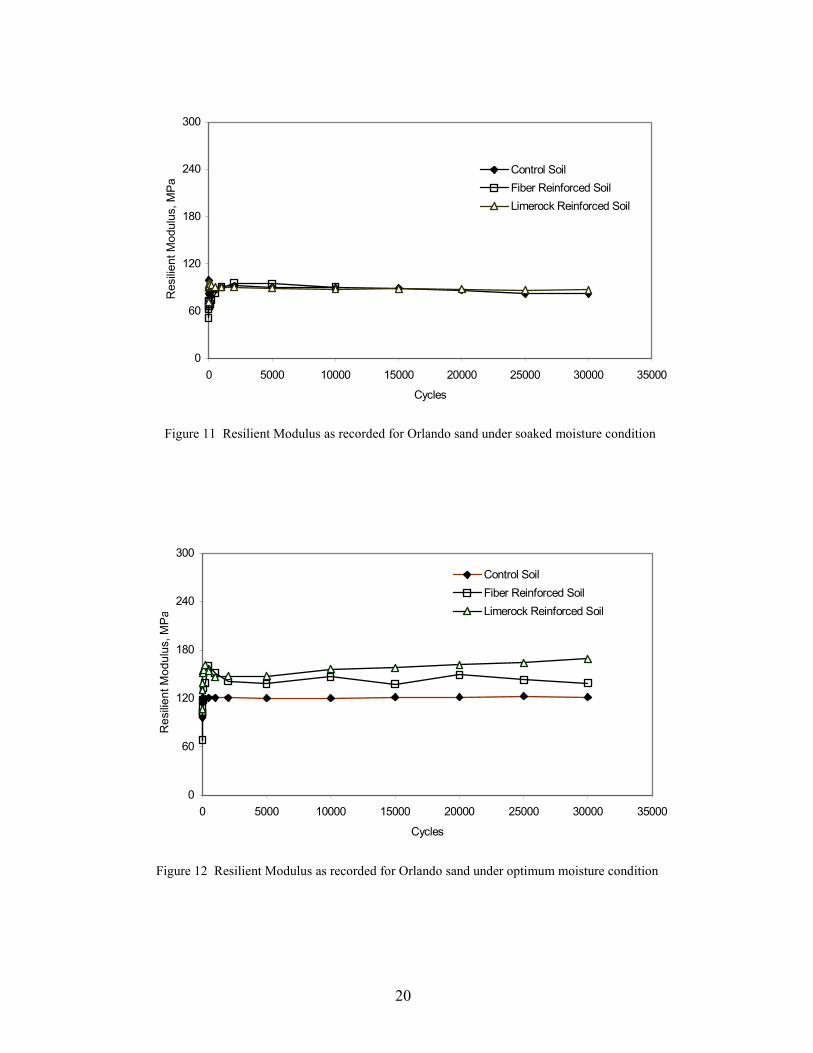
Figure 11 Resilient Modulus as recorded for Orlando sand under soaked moisture condition Figure 12 Resilient Modulus as recorded for Orlando sand under optimum moisture condition
0
60
120
180
240
300
0 5000 10000 15000 20000 25000 30000 35000
Cycles
Res
ilient
Mod
ulus
, MPa
Control SoilFiber Reinforced SoilLimerock Reinforced Soil
0
60
120
180
240
300
0 5000 10000 15000 20000 25000 30000 35000
Cycles
Res
ilient
Mod
ulus
, MPa
Control SoilFiber Reinforced SoilLimerock Reinforced Soil
20
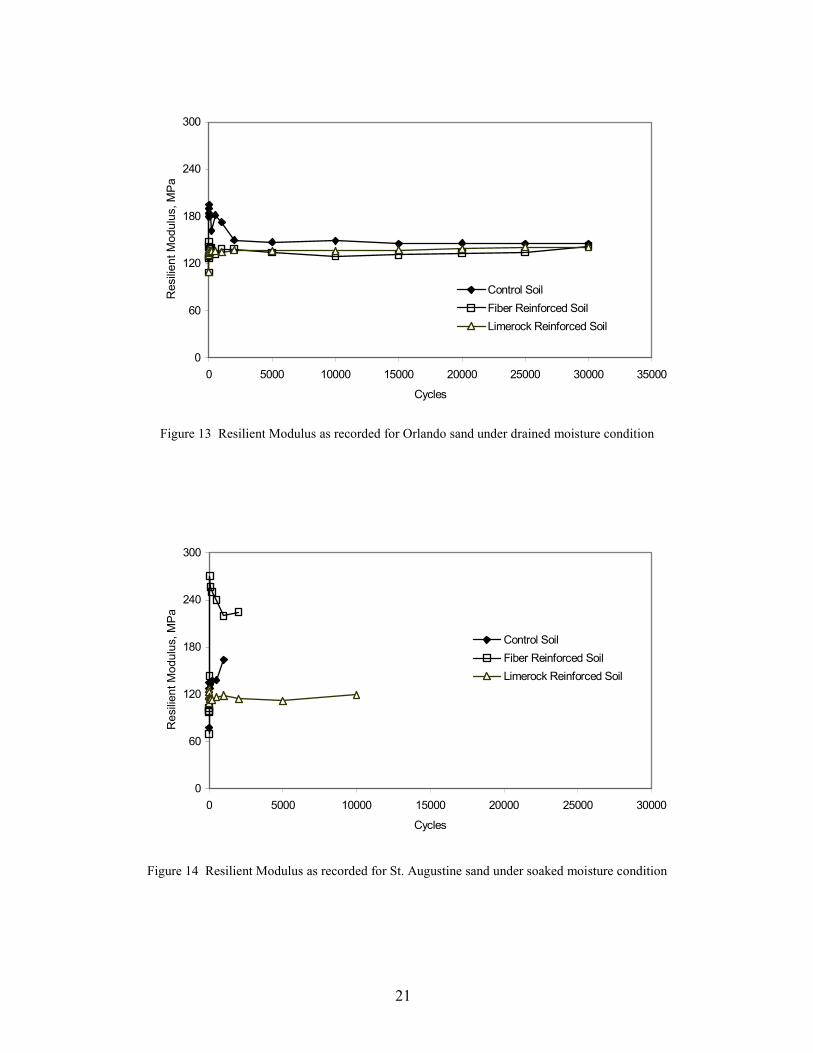
Figure 13 Resilient Modulus as recorded for Orlando sand under drained moisture condition Figure 14 Resilient Modulus as recorded for St. Augustine sand under soaked moisture condition
0
60
120
180
240
300
0 5000 10000 15000 20000 25000 30000 35000
Cycles
Res
ilient
Mod
ulus
, MPa
Control SoilFiber Reinforced SoilLimerock Reinforced Soil
0
60
120
180
240
300
0 5000 10000 15000 20000 25000 30000
Cycles
Res
ilient
Mod
ulus
, MPa
Control SoilFiber Reinforced SoilLimerock Reinforced Soil
21
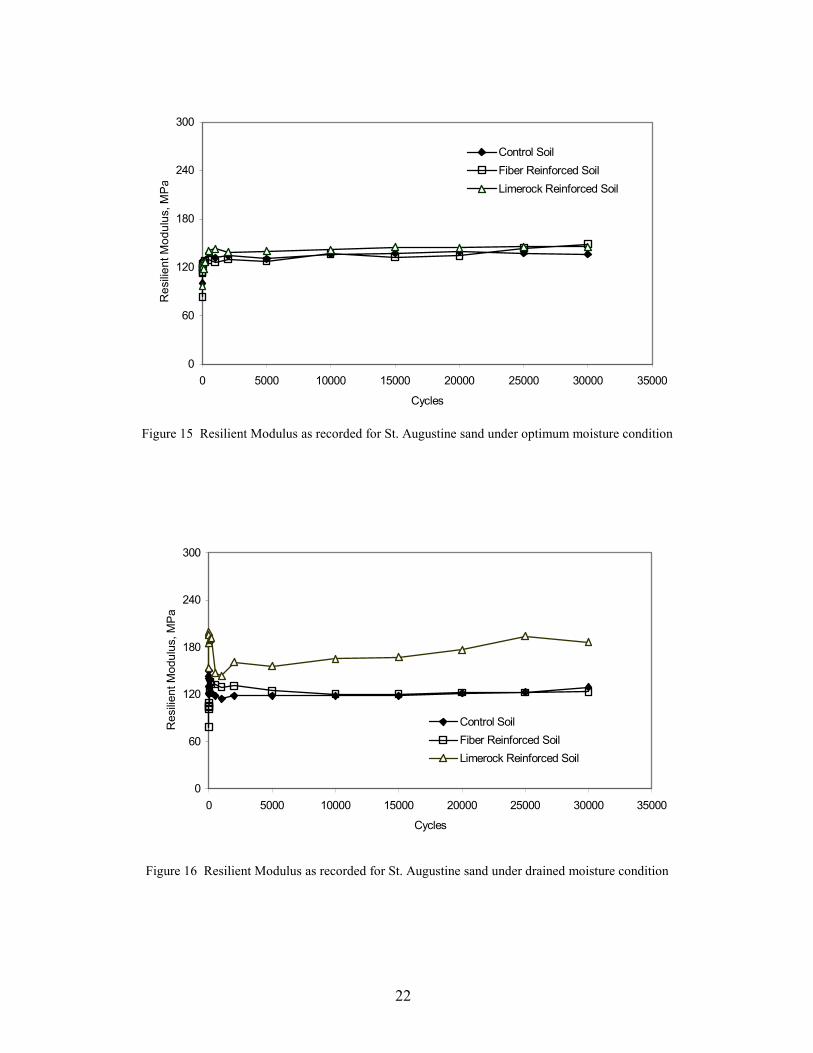
Figure 15 Resilient Modulus as recorded for St. Augustine sand under optimum moisture condition Figure 16 Resilient Modulus as recorded for St. Augustine sand under drained moisture condition
22
0
60
120
180
240
300
0 5000 10000 15000 20000 25000 30000 35000
Cycles
Res
ilient
Mod
ulus
, MPa
Control SoilFiber Reinforced SoilLimerock Reinforced Soil
0
60
120
180
240
300
0 5000 10000 15000 20000 25000 30000 35000
Cycles
Res
ilient
Mod
ulus
, MPa
Control SoilFiber Reinforced SoilLimerock Reinforced Soil