STATE OF OCEANS AND COASTS 2018 Blue Economy Growth...
20
1 T he East Asian Seas (EAS) region is recognized as the center of marine biodiversity globally, being home to 31% of the world’s mangroves, 33% of seagrass beds and a third of the world’s coral reefs. Countries of the EAS region account for 80% of global aquaculture, and around 60% of the world’s capture fisheries. The region’s seas serve as an important conduit for 90% of world trade through shipping. Moreover, the EAS region is a center of economic growth, home to the 2 nd and 3 rd largest economies of the world (China and Japan, respectively), and the combined economies of ASEAN, which represent the world’s 5 th largest economy and the 3rd largest global market with more than 630 million people. Blue Economy Growth in the East Asian Seas Region The blue economy paradigm 1 is focused on the economic perspective of the ocean economy and the natural capital assets of oceans, harnessing the oceans for economic growth and livelihoods while meeting the goals of healthy oceans and sustainable development. This has emerged as a feasible development path where economic growth is driven by consumption and investments that prevent the loss of biodiversity and ecosystem services, reduce pollution, enhance resource efficiency, reduce carbon and water footprints, and promote inclusiveness. Blue Economy 1 Changwon Declaration, EAS Congress 2012 Ministerial Forum: “We understand the Blue Economy to be a practical ocean-based economic model using green infrastructure and technologies, innovative financing mechanisms, and proactive institutional arrangements for meeting the twin goals of protecting our oceans and coasts and enhancing their potential contribution to sustainable development, including improving human well-being, and reducing environmental risks and ecological scarcities.” STATE OF OCEANS AND COASTS 2018
-
Upload
nguyenhanh -
Category
Documents
-
view
217 -
download
0
Transcript of STATE OF OCEANS AND COASTS 2018 Blue Economy Growth...

1
The East Asian Seas (EAS) region is recognized as the center of marine biodiversity globally, being home to 31% of the world’s mangroves, 33% of seagrass beds and a third of the world’s
coral reefs. Countries of the EAS region account for 80% of global aquaculture, and around 60% of the world’s capture fisheries. The region’s seas serve as an important conduit for 90% of world trade through shipping. Moreover, the EAS region is a center of economic growth, home to the 2nd and 3rd largest economies of the world (China and Japan, respectively), and the combined economies of ASEAN, which represent the world’s 5th largest economy and the 3rd largest global market with more than 630 million people.
Blue Economy Growth in the East Asian Seas Region
The blue economy paradigm1 is focused on the economic perspective of the ocean economy and the natural capital assets of oceans, harnessing the oceans for economic growth and livelihoods while meeting the goals of healthy oceans and sustainable development. This has emerged as a feasible development path where economic growth is driven by consumption and investments that prevent the loss of biodiversity and ecosystem services, reduce pollution, enhance resource efficiency, reduce carbon and water footprints, and promote inclusiveness.
Blue Economy
1 Changwon Declaration, EAS Congress 2012 Ministerial Forum: “We understand the Blue Economy to be a practical ocean-based economic model using green infrastructure and technologies, innovative financing mechanisms, and proactive institutional arrangements for meeting the twin goals of protecting our oceans and coasts and enhancing their potential contribution to sustainable development, including improving human well-being, and reducing environmental risks and ecological scarcities.”
STATE OF OCEANS AND COASTS 2018

2
Ocean-based economic activities are those sectors conducted in the marine waters (e.g., fisheries, marine tourism, ports and shipping, offshore oil and gas, desalination, ocean energy, marine construction; etc.). Ocean-related economic activities are those sectors that use inputs from the oceans – forward linkages (e.g., seafood processing, marine biotechnology, etc.), and those that produce outputs for the oceans and ocean-based activities –building and repair of ships and boats; manufacturing and repair of marine equipment; maritime finance and insurance; marine education and R&D; etc. Information for the ocean economy accounts comes from the National Income Accounts (outputs, gross value added and employment), industry classification (ISIC or country equivalent), Input-Output tables, census, and survey of establishments.
Harnessing the Ocean
State of Ocean and Coasts (SOC) Reports of Cambodia, China, Indonesia, Japan, Malaysia, Philippines, RO Korea, Singapore, Thailand, Timor-Leste, and Viet Nam capture initial estimates of their ocean economies – measured as the sum of the economic activities of
ocean-based and ocean-related industries, together with the natural assets, goods and services of marine ecosystems upon which these industries depend and people rely on for food, income, livelihood, recreation, shoreline protection and climate regulation, among others.
The ocean economy (including blue economy initiatives) as reported by 10 countries is estimated to be approximately US$1.4 trillion in value added. Around 54 million people are reported to be employed in ocean industries in 10 countries.

3
The region’s ocean provides services that are not usually quantified, such as regulating services (e.g., carbon storage, shoreline protection, waste assimilation, nutrient cycling), supporting services (e.g., habitat, nursery), and cultural services. For the provisioning services (e.g., fisheries), market prices are available, and usually captured in the GDP (production or supply side -- GVA of ocean economic activities). For the supporting and regulating services, these are the indirect use and non-use values, and usually do not have market prices. For cultural services, these include the spiritual, cultural and recreational values. Recreation may already be reflected in national income accounts to some extent.
Coastal and Marine Ecosystem Services
For 8 countries, the total estimated value of coastal and marine ecosystems is around US$684 billion. The potential blue carbon value in the region in terms of carbon sequestration was estimated to be US$111 billion for mangroves, and US$77-95 billion for seagrass.
The EAS region faces an urgent need to protect its coasts and waterways and conserve its ecosystems and biodiversity, while addressing the cross-cutting issues of poverty alleviation, food, water and energy security, and climate change. In as much as these challenges appear daunting, they also offer opportunities for governments, communities, NGOs, businesses and professionals to collaborate and work towards an alternative economic growth
Oceans as a good, sustainable businessstrategy for the coasts and oceans – a Blue Economy – one that reduces environmental impacts, protects the ocean’s natural capital assets, lowers carbon footprints, advances the development and use of new and innovative technologies, creates sustainable job opportunities and enhanced skill levels, and strengthens the robustness and resilience of economies, ecosystems and communities of the region.

4
Cambodia 2.39 billion
16% 200.42 million–583.42 million
• Ecotourism• Sustainable ports • Revolving fund for to support
supplemental livelihood and micro-enterprise projects to reduce fishing pressure
0.5% 100% • Sihanoukville: coastal use plan and zoning scheme, beach management, MPA in Koh Rong islands, wastewater treatment system, community-based solid waste management system, mangrove rehabilitation
• Protected areas in the coastal provincesChina 959.04
billion 9.5% 150
billion• Sustainable tourism• Green ports and shipping• Marine renewable energy• Sustainable aquaculture:
marine ranching• Biodiversity conservation/MPA
networking• Artificial reefs; zoning for
coastal sightseeing and fishing; and marine ranching for aquaculture, breeding of benthic fish, etc.
• Marine biotechnology • Coastal wind power as
alternative, renewable source of energy
• Solar energy/pollution reduction• Desalination and reuse of brine
5.4% 29% • Multi-functional Sea Use Plan: zoning scheme, environmental user fees
• Ecological Remediation Project of Mangrove Forests in Southern China, and Chinese Tamarix Forests in Northern China
Indonesia 182.54 billion
28% 105.4 billion
• Ecotourism and MPAs• Green ports: PT Terminal Teluk
Lamong• Sustainable fisheries • Development of the Ciletuh-
Palabuhanratu Geopark in Sukabumi Regency through ICM
5.8% 47% • Mangrove restoration and coral reef rehabilitation
• PROPER program: awarding and recognition system for industries complying to pollution regulations
• National Action Plan on Plastic Waste Management, 2017-2025
Japan • Sustainable ports: Hanshin Port and Keihin Port
• Sustainable tuna fisheries• Marine renewable energy• Ecotourism
8.23%* 1.4% • Basic Plan on Ocean Policy • Action Plans and Nature Restoration projects
(mangroves, coral reefs, seagrass, tidal swamps)
• Shima City, Mie, Japan: Sato-umi, balance between utilization according to the current social situation and conservation of the natural environment
• Wastewater management, cleanup of rivers and bays
Malaysia 63 billion 23% 17.7 billion
• Marine parks and ecotourism• Green ports• Sustainable marine aquaculture• Sustainable fisheries: stock
assessment; management strategies, e.g., zoning; gear based licensing; fish sanctuaries; monitoring and enforcement
• Alternative livelihood: seaweed cultivation; tourism
2.3%* 5.72% • Wastewater and septage management• Climate change response: National Coastal
Vulnerability Index study; Implementation of the Integrated Shoreline Management Plan; Adaptation measures
Country
Ocean economy (2015) Value of
ecosystem services
(US$)
Blue Economy Focus
Protecting Ocean Health for Blue Economy
(US$) Share to GDP
MPA (% of
territorial waters)
ICM (% of
oastline)Initiatives

5
Philippines 11.81 billion
7% 17 billion
• Sustainable fisheries: working with seafood producers and processors for conservation of blue crabs and swordfish
• Sustainable tourism: National Ecotourism Strategy and Action Plan(2013-2022); Zero Carbon Resorts; Green Fins program (Green Fins program: involving diving operators in coral reef monitoring and conservation); MPA/tourism branding; marine and coastal heritage sites and parks
• Green ports; shore-based power supply using renewable energy; shore reception facilities
• Marine biotechnology and new medicines
• Coastal wind power as alternative, renewable source of energy
• Biodiversity-friendly enterprises for coastal communities
12% >20% • Sustainable fisheries: amended Fisheries Code; ecosystem approach to fisheries management; 10-Year Plan of Action to address IUU fishing; registration of fisherfolk, fishing vessels and gears;; closed season for sardines and small pelagics; ban on sargassum and black corals
• Ecosystem and biodiversity conservation: Mangrove and Beach Forest Development Project; coral reef rehabilitation; SmartSeas Program; MPA Network for sea turtles
• National Sewerage and Septage Management Program: national government will provide subsidies to local governments of up to 50% of capital cost
• Various cost-effective technologies applied in the wastewater and septage treatment facilities
RO Korea 43.53 billion
3.3% 40.5 billion - 42.6 billion
• Sustainable fisheries: Fishery Resources Protection Zone; TAC program; Marine ranching
• Comprehensive Plan for Green Busan Port
• Marine renewable energy• Marine biotechnology for food
and medicines
4.3% 100% • Wetland conservation sites• Marine protected areas• Coastal Total Pollutant Load Control System:
in Masan Bay (2008), Siwha-Incheon (2013), Busan (2015), Ulsan (2017), Gwangyang (2019)
Singapore 7% ** • Green ports• LNG bunker-ready port• Ecotourism, nature reserves
and marine parks• Biotechnology and aquaculture• Marine renewable energy• Desalination
1.5%* 100% • Wastewater management integrated with water supply management
• Solid waste management: up to 70% waste recycling, waste-to-energy for non-recyclable waste, sanitary landfill for non-recyclable and non-incinerable waste
• Marine parks• Coral restoration and conservation• Endangered species recovery• Mangrove rehabilitation and coastal
protection
Country
Ocean economy (2015) Value of
ecosystem services
(US$)
Blue Economy Focus
Protecting Ocean Health for Blue Economy
(US$) Share to GDP
MPA (% of
territorial waters)
ICM (% of
oastline)Initiatives
6
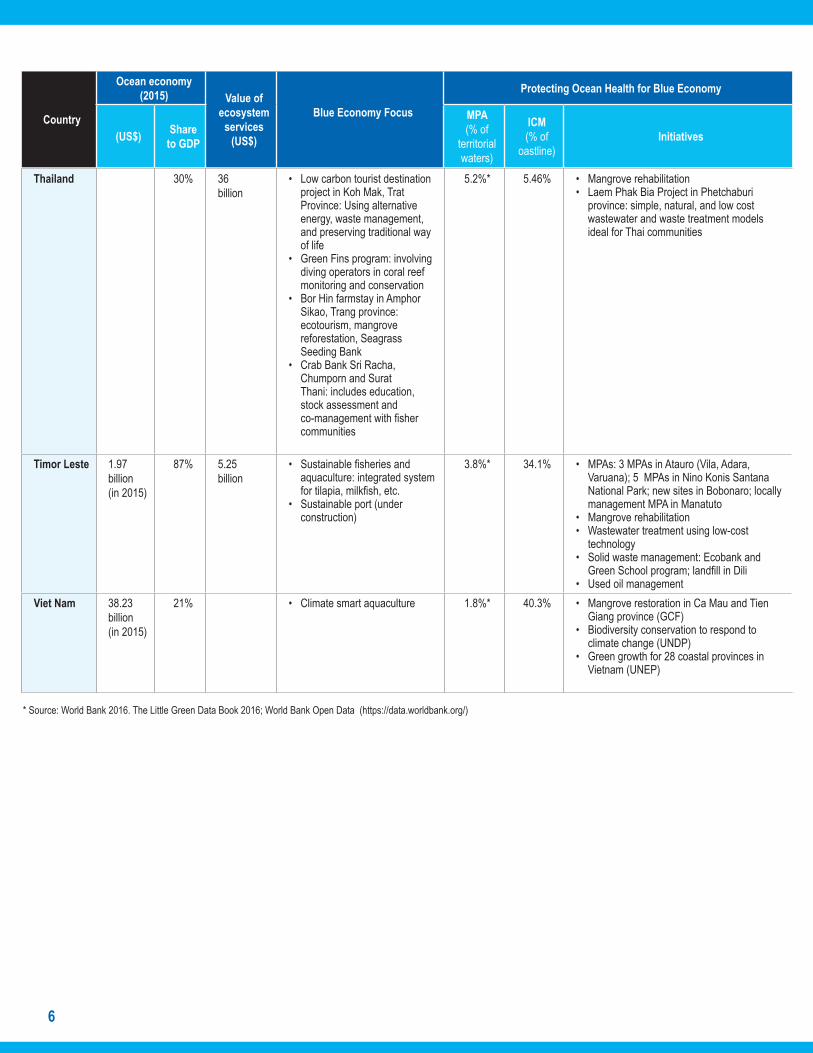
Thailand 30% 36 billion
• Low carbon tourist destination project in Koh Mak, Trat Province: Using alternative energy, waste management, and preserving traditional way of life
• Green Fins program: involving diving operators in coral reef monitoring and conservation
• Bor Hin farmstay in Amphor Sikao, Trang province: ecotourism, mangrove reforestation, Seagrass Seeding Bank
• Crab Bank Sri Racha, Chumporn and Surat Thani: includes education, stock assessment and co-management with fisher communities
5.2%* 5.46% • Mangrove rehabilitation• Laem Phak Bia Project in Phetchaburi
province: simple, natural, and low cost wastewater and waste treatment models ideal for Thai communities
Timor Leste 1.97 billion (in 2015)
87% 5.25 billion
• Sustainable fisheries and aquaculture: integrated system for tilapia, milkfish, etc.
• Sustainable port (under construction)
3.8%* 34.1% • MPAs: 3 MPAs in Atauro (Vila, Adara, Varuana); 5 MPAs in Nino Konis Santana National Park; new sites in Bobonaro; locally management MPA in Manatuto
• Mangrove rehabilitation• Wastewater treatment using low-cost
technology• Solid waste management: Ecobank and
Green School program; landfill in Dili• Used oil management
Viet Nam 38.23 billion (in 2015)
21% • Climate smart aquaculture 1.8%* 40.3% • Mangrove restoration in Ca Mau and Tien Giang province (GCF)
• Biodiversity conservation to respond to climate change (UNDP)
• Green growth for 28 coastal provinces in Vietnam (UNEP)
Country
Ocean economy (2015) Value of
ecosystem services
(US$)
Blue Economy Focus
Protecting Ocean Health for Blue Economy
(US$) Share to GDP
MPA (% of
territorial waters)
ICM (% of
oastline)Initiatives
* Source: World Bank 2016. The Little Green Data Book 2016; World Bank Open Data (https://data.worldbank.org/)

7
Large Marine Ecosystems
The LMEs in the EAS region are being given high priority because of the diversity of life they support, and the potential destruction they face. The connectivity between the LMEs also needs to be emphasized. Studies indicate the high-risk levels of the LMEs, especially in terms of plastic waste (microplastics), nutrients, and loss of coral reefs. The major economic activities, which will be most affected are fisheries and tourism – the main source of income and livelihood in coastal communities. Implementation of LME Actions Plans (e.g., Sulu-Sulawesi Seas, Arafura-Timor Seas, South China Sea, Yellow Sea) is crucial to address the transboundary issues, and ensure future delivery of ecosystem services these LMEs provide.
Integrated coastal management (ICM)
The SOC Reports share the experiences of EAS countries in implementing ICM as a key approach toward achieving an ocean-based economy. Benefits and outcomes of programs and projects implemented under ICM can be quantified and linked to the SDGs and blue economy development. This improves advocacy and encourages countries to increase ICM sites and improve management efforts, which currently stands at 18% of the region’s coastline (2017).
Marine protected areas (MPAs)
Economic and environmental benefits of MPAs include reconstituting ecosystem services, stabilization of fish population, more sustainable catch level, tourism, reducing risks from natural hazards, and providing carbon sink. Although countries in the EAS region have made major efforts, more concerted regional and global action is still needed in targeting key biodiversity areas to come under protection, and assessments of how MPAs are effectively and equitably managed and connected to meet the overall target and elements under Aichi Biodiversity Target 11 and SDG 14.
Coral reef in Malaysia (Photo credit: Yusri Yusuf).

8
The EAS region recognizes that the oceans and coasts are drivers for the economy, with greater potential for growth, innovation, and job creation – from small-scale fisheries to marine manufacturing (seaweed industry, seafood processing, high-end marine biotechnology, ship-building and offshore marine engineering) to maritime finance, to tourism, which has become the largest service sector in many EAS countries. Sustainable fisheries
Transforming to Blue Economy and aquaculture practices, green ports, and ecotourism involve transformational changes in practices to shift from the traditional industries to the blue economy paradigm. Emerging technologies combined with habitat and environmental protection contribute to food, energy and water security, new medicines, coastal protection, and climate change resiliency. Some examples follow.
The tourism sector plays a major role in promoting economic growth and infrastructure development, alleviating poverty, creating opportunities for small- and medium-scale industries, and supporting conservation. Ecotourism, in particular, is becoming popular among environmentally-conscious tourists. In 2016, travel and tourism continued to contribute a significant portion of the GDP of countries in the EAS region – from 5.1% of RO Korea’s GDP to as much as 28% of Cambodia’s GDP. This is greater than the GDP contribution of other sectors, including mining. For coastal and marine tourism, the gross value added in the region is worth around US$200 billion (based on information from 7 countries). Marine tourism generates a significant portion of the ocean economy. From 2013-2016, the number of cruise ships in Asia grew at a 12% compound annual rate, and this trend is likely to continue.
Massive influxes of tourists, often to a relatively small area, can have huge social and environmental impacts. They add to the pollution, waste, and water needs of the local population, putting local infrastructure and habitats under enormous pressure. In many areas, massive new tourist developments have been built—including airports, marinas, resorts, and golf courses. Overdevelopment by the tourism industry has the same problems as other coastal developments, but often has a greater impact as the tourist developments are located at or near fragile marine ecosystems. The damage does not end with the construction of tourist infrastructure. Some tourist resorts discharge their sewage and other wastes directly into coastal waters surrounding coral
Sustainable Tourism
reefs and other sensitive marine habitats. Recreational activities also can have a huge impact. For example, careless boating, diving, snorkeling, and fishing have substantially damaged coral reefs in many parts of the region, through people touching corals, stirring up sediment, and dropping anchors. Marine animals, such as whale sharks, seals, dugongs, dolphins, whales, and birds are also disturbed by increased numbers of boats, and by people approaching too closely. Tourism can also add to the consumption of seafood in an area, putting pressure on local fish populations and sometimes contributing to overfishing. Collection of corals, shells, and other marine souvenirs—either by individual tourists, or local people who then sell the souvenirs to tourists—also has a detrimental effect on the local environment

9
• Formulate and apply specific criteria that address sustainability, informed by existing third-party certification standards, to promote businesses that truly represent these values.
• Scale up ICM programs with a particular focus on conservation of coastal and marine resources, sustainable tourism and ecotourism, and sustainable development of coastal communities.
• Develop and implement policy instruments, MSP/coastal use plans, regulations on waste management and habitat protection, and planning and licensing processes to prevent uncontrolled shoreline development and resource-use conflicts, avoid degradation and destruction of coastal ecosystems, and ensure public accessibility.
• Undertake deliberative, inclusive planning before embarking on any tourist-related development, and embed a long-term vision of sustainability among local governments, coastal communities, and local businesses.
• Invest in, operate and sustain solid waste and wastewater management systems that protect and maintain healthy and resilient coastal and marine resources, in partnership with the tourism industry and local businesses benefiting from tourism.
• Manage MPAs to effectively protect and conserve the very natural resource that draws tourism, and ensure capable and adequate human resources, facilities and funding mechanisms are in place to sustain operations.
Lessons Learned inSustainable Tourism
Case Studies in Sustainable Tourism
In Timor-Leste, dugong and seagrass conservation is being developed to become a model of ecotourism. Community-based ecotourism is also being promoted as it brings an alternative source of income and livelihood. This type of tourism aims to develop locally-run hotels and restaurants employing local people, and offering local products, thereby increasing income, creating new employment opportunities, and increasing demand for fresh produce.
In Cambodia, the beach management program together with the coastal use zoning scheme was adopted in Sihanoukville to ensure sustainability of tourism and protection of coastal resources. The improved management of Occheauteal Beach resulted in several key outcomes as observed by the Ministry of Tourism. Through a combination of planning, light persuasion, follow-through and public-private partnerships, the Cambodian government radically reformed Occheauteal Beach’s management to align with the blue economy. The results: tourism quadrupled in just a few years after relocating commercial stall owners a little farther from the shore and with a demonstration of good faith on the part of the government by installing beachfront infrastructure for tourists. Environmental impacts were reduced, and stall owners made twice as much money, spurring shopkeepers from a nearby beach to copy these efforts. Meaningful government-led ICM at the local level, with stakeholder participation and a coastal use zoning plan, resulted in knock-on effects and spurred neighboring communities to readily accept changes that bolster the blue economy.
In Indonesia, by the late 1990s, the eroded beach in the Denpasar region of Bali had become heavily polluted from untreated sewage. Coral reefs—one of the biggest draws for tourists—were dying and covered in harmful green algae because of the excess nutrients in the water. Two programs addressed the issues of wastewater management and coral restoration. An ICM program created public awareness on the wastewater issue, and a subsequent survey gauged the public’s willingness to pay for improved wastewater management. A sewage treatment system was constructed with a loan from Japan. The National Program on Coral Reef Destruction Mitigation (2004) incorporated coral transplantation along with the creation of new diving sites—tourists actually paid to transplant the coral themselves (purchased from nearby communities’ coral nurseries), and this concept generated more income for all communities involved. Also, there was a strong enforcement angle that was a prerequisite for true results to control pollution in coastal waters, and to ensure that the coral rehabilitation project would not be in vain.

10
East Asia is still brimming with shipping and port-related activity. The East Asian Seas serve as a conduit of 90% of the world’s trade through shipping. The top five busiest seaports in the world are in East Asia: Shanghai, Singapore, Hong Kong, Shenzhen and Busan. The demand for container shipment is expected to triple in the next 25 years, from about 100 million TEUs at present to around 350 million TEUs by 2040. Every additional ton of cargo handled by a port can generate an additional US$100 of economic benefit, with 300 new jobs created for every 1 million tons of cargo volume. Considering the forecast huge market and increasing trade, East Asia as a whole is planning to invest in improving maritime transport and related port services.
These projected increases in shipping and port activities in the region provide a win-win potential of growing while protecting critical ecosystem services and local communities. Alternatively, when holistic planning is absent, expanding port facilities can harm the environment and the people living in nearby cities and communities. For example, during construction, damage can occur through destruction of coastal habitats, land reclamation, dredging, and the construction of buildings and roads to connect to the port. Once operational, there are air and water pollutants, solid waste, noise pollution, and a higher than normal emission level of greenhouse gases (GHG). In addition, there are problems associated with the discharge of ballast water, which can pose serious ecological, economic and health problems. The economic
Sustainable Ports and Shipping
damage associated with invasive aquatic species is estimated to be US$100 billion per year, and the projected cost to respond globally to this threat is roughly 4% of this figure.
The International Maritime Organization (IMO) has taken the lead on issues, such as the regulation of air pollution (via MARPOL Annex VI) and ballast water management (the Ballast Water Management Convention covers over 73% of the world’s merchant fleet tonnage and entered into force in September 2017). MARPOL Annex VI sets regulations to limit the amount of ozone-depleting substances, sulphur oxides (SOx), nitrogen oxides (NOx) and particulate matter emitted from ships. It also has amendments with phased reductions; for example, since 2012 the global SOx cap has been at 3.5%, but it is set to gradually decrease to 0.5% by 2020. A 2013 amendment to MARPOL Annex VI mandates that all new ships are built according to the IMO’s Energy Efficiency Design Index (EEDI), and that all ships follow the Ship Energy Efficiency Management Plan (SEEMP).
The APEC Port Services Network (APSN) has established a Green Port Award System (GPAS) with voluntary participation, ranking ports and encouraging them to improve their green performance through both self-evaluation and expert evaluation. Ports in Singapore, Malaysia (Port of Tanjung Pelepas and Westports, Port Klang), Indonesia (PT Terminal Teluk Lamong), Philippines (Port of Batangas), and Thailand (Laem Chabanag Port) have received the Green Port Award.

11
Port in Thailand.

12
Ports• Develop and adopt a uniform set of blue economy criteria
covering air quality, water quality, the aquatic ecosystem and marine habitats, waste management, building standards, safety (emergency response for an oil spill) and efficiency. The criteria may be applied equally to all ports, but allowing for flexibility in how they are achieved.
Ships• Implement a green ships certification program, such as the
Green Award program or a program that incorporates World Ports Sustainability Program’s (WPSP) Environmental Ship Index (ESI. For regional green ports to have a broader impact, the ports could incentivize eco-innovations in the shipping sector, with a future eye towards vessels that perform better in reducing air emissions than required by the emission standards of the International Maritime Organization and prohibiting certain vessels that do not meet a certain minimum threshold standard.
Linking Ports and Shipping• Consider a harmonized set of blue economy standards across
all East Asian ports and shipping companies. There could be material repercussions or rewards for meeting the standards. Countries may want to consider using both regulatory and incentive-based policies to set a floor and drive upward innovation, respectively.
• Capacity building and political will are key. Once there is a blue economy plan for ports and shipping, a willingness and ability among members is required to enact these changes. In-person and virtual training programs to improve regional expertise and buy-in by leaders at the national level are essential. This ensures that port staff and the environment and transportation sectors are enabled to meet the relevant objectives and targets in the shipping and ports sector to bolster the blue economy.
Lessons Learned inSustainable Ports and Shipping
Case Studies in Green Ports and Shipping
Singapore’s Maritime and Port Authority (MPA) is well-regarded globally. Its policy seeks to move past the notion of simply having the largest port in the world to becoming a true global hub for shipping, trade and finance. Its policy tools include: (1) fiscal incentives; (2) a shipping registry with associated tax benefits; and (3) training, education and innovation programs, such as the Maritime Innovation and Technology Fund (MITF) and the Maritime Cluster Fund (MCF).
In 2011, Singapore invested in the “Green Initiative”. The program focuses on a pricing policy to incentivize uptake, including a 25% reduction on port dues for all ships that switch to low sulphur fuels far below the MARPOL threshold. A substantial “number of shipping companies are participating to comply with green policy, and to save costs. The Green Ship Program encourages Singapore-flagged ships to reduce carbon dioxide and sulphur oxide emissions by adopting energy efficient ship designs and/or adopting approved SOx scrubber technology in order to avail of substantially reduced registration fees and a major tax break. The Green Technology Program also provides grants to local maritime companies to develop and adopt green technologies, a targeted effort to support the local population in capturing a share of the wealth generated by port activities in an environmentally-protective manner.
In Malaysia, the Johor Port Authority (JPA) is the government’s regulatory agency in charge of two major shipping ports—Pasir Gudang Port and Port of Tanjung Pelepas. In 2016, the JPA released its Green Port Policy to address air quality (reducing ship emissions), water quality, the aquatic ecosystem and marine habitats (addressing ballast water management and restoring mangroves), waste management and improved efficiency for customers. It also included a community engagement component and an incentive program to encourage compliance among port operators. The program is heralded as a holistic and cohesive development plan, which would see Malaysia transform into a competitive transportation hub in the region… helping Malaysia achieve its pledge to reduce GHG emissions by 45% by 2030.
Onshore power, where ships berth and tap into the local electrical grid instead of idling their engines, is a clean technology that is typically more common in North America and Europe. Japan’s Kitakyushu Port provides onshore power connected to renewable energy sources sited right on the waterfront, and boasts one of the fastest vessel turnaround times in the world. Likewise, shore-based power supply using renewable energy was installed at the Port of Cagayan de Oro, one of the busiest ports in the Philippines.

13
Countries of East Asia region account for 63% of total world fisheries production, contributing 40% of global wild fisheries production and 80% of global aquaculture production. The estimated value of capture fisheries of the region is US$35 billion, while aquaculture production is valued at US$100 billion in 2014. East Asia is both a massive producer and consumer of seafood; the average Southeast Asian consumes 36 kg of seafood per year, which is double the global average. As wild capture fisheries taper off, aquaculture is rapidly growing to fill the demand for seafood, and has recently made up nearly half of the seafood consumed by humans worldwide. From 2000-2015, Indonesia, Thailand and Vietnam invested heavily in intensive inland aquaculture, and output grew by 460% at these farms. China is the largest wild capture and aquaculture producer in the world.
Blue economy growth in the capture fisheries sector requires a central focus on ecological sustainability, as 58% of monitored global fish stocks are fully exploited, and an additional 31% of stocks are overexploited. Illegal, unreported and unregulated (IUU) fishing worldwide is estimated at somewhere “between 13% and 31% of reported catches, and over 50% in some regions,” and valued at up to US$23 billion per year.
Port State and Flag State Measures Agreements to Prevent, Deter and Eliminate IUU Fishing (PSMA) has become a binding law as of 2016 among countries that have ratified the agreement (East Asian members include Indonesia, RO Korea, and Thailand). The PSMA seeks to stop fish pirates from “port shopping” for a safe haven, a practice where they can unload their illegal catch at ports with little oversight. Its provisions include a “denial of access
Sustainable Coastal Fisheries and Aquaculture
to ports, port inspections, prohibition of landing, and detention and sanction, in order to prevent IUU fish from reaching national and international markets. Some countries have also decided to prohibit trade with countries that do not have port state measures in place. The PSMA also requires “the flag State to take certain actions, at the request of the port State, or when vessels flying their flag are determined to have been involved in IUU fishing…[even] over vessels flying their flags in areas beyond their national jurisdiction. The PSMA, the FAO Code of Conduct for Responsible Fisheries and improved monitoring, control and surveillance are key tools in combating IUU fish, but there is far more work needed to address the issue.
The EAS region is the aquaculture hub of the world, but at a cost to ocean health and security. Instead of relieving fishing pressure, many global forage fish stocks and so-called “trash fish” can be overfished in an effort to derive fish oil and fish meal to feed farmed fish. There are also unresolved concerns with effluent discharge, the use of chemicals, disease transfer and the destruction or alteration of important ecosystems to create fish farms, such as the destruction of mangroves to create farmed shrimp ponds. As a 2016 study found, the conversion of mangroves to aquaculture farms is a leading cause of deforestation in Southeast Asia. Each year, 450 million metric tons of CO2 from blue carbon ecosystems are released from land use change, costing US$18 billion in economic loss. To address these challenges, the U.N. Food and Agriculture Organization (FAO) has promoted policies to support innovative closed-loop aquaculture practices like aquaponics.

14

15
• Invest in strong data on fisheries management to make well-informed management decisions for more resilient fish stocks
• Facilitate and support locally-initiated efforts to improve coastal fisheries, and promote those efforts at a higher level to ensure a broader impact
• Improve scientific soundness of MPA/MPA networks, including their socio-economic and ecological objectives, impacts and benefits, and enhance the management effectiveness of MPAs and MPA networks, thereby improving fish populations and generating more fish to be harvested outside the boundaries
• Consider how non-marine sectors, such as land use policy, can be oriented towards geographically-appropriate, sustainable and highly productive aquaculture (e.g. FAO aquaponics; rice-fish farming in China)
• Offer government-supported disaster insurance schemes that not only reinvigorate a sector but also promote greater cooperation of industry with government officials
• Invest in a more vertically-integrated supply chain that includes value-added processing to generate more wealth for locals (e.g., Indonesia (processing seaweed).
Lessons Learned inSustainable Fisheries and Aquaculture
Case Studies in Sustainable Fisheries and Aquaculture
National governments are joining technology providers in casting wider transparency on illegal fishing activities. In June 2017, the head of Indonesia’s Ministry of Marine Affairs and Fisheries made an “unprecedented move” by allowing Global Fishing Watch, a joint project of SkyTruth, Google and Oceana, to have access to all of the country’s vessel monitoring system data. While few countries allow the public this level of access, the Ministry Head “believes that making government fisheries data visible to the public is a powerful way to engage civil society in the fight against…IUU fishing.”
Given Global Fishing Watch’s standing offer to process and analyze these data for free, other East Asian countries may want to take them up on this unique offer to “leapfrog” and rely on free, cutting-edge technological services to tackle IUU fishing in their territorial waters.
A global review of marine protected areas (MPAs) demonstrates that they can, on average, increase fish size by 28%, density by 166%, species richness by 21% and fish biomass by a whopping 446%. This increased productivity can spill over into adjacent areas where fishing is allowed, thereby boosting the income of coastal fishermen. After the creation of a marine reserve in Apo Island, Philippines, surgeonfish and jackfish populations tripled.
China boasts a large “Special Marine Protected Area” (SMPA) Network that addresses the sustainable financing problem up front by establishing a multi-functional zoning system, and a user fee and payment system that all ocean users must pay (from which the money goes to both the provincial and national governments). The SMPA Network is a collection of MPAs that allow some extractive uses and others that do not. Enforcement is a shared responsibility between the national and local governments.
Advanced science and technologies are crucial to reach targets for blue growth in fisheries and aquaculture and cope with climate change in the EAS region. In Thanh Hoa Province, Viet Nam, an integrated system of tilapia and brackish water shrimp ponds was introduced. This resulted in cleaner shrimp ponds, reduction of feed conversion ratio for farmed tilapia, and reduction of production costs. In Ben Tre Province, Viet Nam, the local clam fishery became the first ever Marine Stewardship Council (MSC)-certified fishery in Southeast Asia. With support from the Ben Tre Department of Agriculture and Rural Development, the fishery has spurred greater protection (and replanting) of the mangrove swamps, in order to expand the habitat.

16
Marine renewable energy
Over the next ten years, East Asia’s energy demands are expected to increase by 50% due to a rapidly-growing economy, and over that same time period, external costs related to air pollution from the combustion of fossil fuels will increase by 35% (to US$225 billion in 2025) and energy-related CO2 emissions are expected to increase by 61% under a business-as-usual scenario. Land-based solar and wind energy are mature forms of renewable energy (RE) technology, and they continue to improve over time. They have benefitted from favorable policies that have allowed them to advance, in some cases, to be price-comparable with fossil fuels, without government assistance. Yet East Asia’s unique geography increasingly points towards incorporating ocean-based renewable energy as a part of the renewable energy mix. Policy-makers can rely on a blend of existing policy tools that have helped spur land (and water) based solar and wind energy to the forefront, as well as other policy tools to spur more emerging forms of ocean-based energy, in order to meet climate change related regional and national goals.
New and Innovative Blue Technologies: Creating our Future Today
RO Korea has operated the national research, development and deployment (RD&D) program on ocean energy since 2000, with supporting policies and incentives. An innovative market incentive is the tradable Renewable Energy Certificate (REC), which is issued by the government to support renewable energy, including ocean energy. This has resulted in the construction and operationalization of tidal barrage power, tidal current energy, wave energy, and ocean thermal energy conversion power plants in RO Korea. Feed-in-tariff (FiT) supports the tidal barrage power plant projects. The 254-megawatt Sihwa Lake Tidal Power Plant, with an annual generation of 552.7GW, is the largest in the world. It supplies energy to around 200,000 residents, contributes to cutting down oil imports by 862,000 barrels per year, and reduces CO2 emissions by 315,000 tons per year. It also enhanced the economy by forming waterfront attraction.
Wind power in the Philippines has gained traction, with installed capacity of 427 MW, and 66 awarded projects in 2017 with potential capacity of 2,461.5 MW. The wind farms in the coastal areas have become tourist attractions as well.
Sihwa Lake Tidal Power Plant, RO Korea (KS Lee)

17
For offshore wind power generation, China has entered the commercialized operation stage, with total installed capacity of 1,014.68 MW. China supports feed-in tariffs (FiTs) for electricity from RE sources, charges energy-intensive industry higher rates for electricity and has also piloted an emissions cap and trade scheme that incentivizes low-emission energy generation technologies. It is leading the region on RE policy. In January 2017, China’s National Energy Administration ordered a halt on the construction of over 100 coal-fired power plants (across 11 provinces) with a combined installed capacity of over 100 gigawatts. It also invested more money in renewable energy (US$1.9 billion) in 2016 than any other country in the world, and it is the global leader in floating solar projects. In June 2017, China completed the largest floating solar power plant in the world at 40 megawatts (MW), and by the end of 2017 it will finish another floating solar project that will deliver 70 MW. This planned facility also has a restorative feature in that it can also clean the water on which it is floating. Incentivizing this technology through policy
Wind farm in the Philippines
could allow countries to rehabilitate polluted waterways and generate power at the same time.
In Japan, renewable ocean energy projects are supported by the New Energy and Industrial Technology Development (NEDO), Ministry of Environment (MOE), and Ministry of Education, Culture, Sports, Science and Technology (MEXT) in collaboration with private sector companies and academe. In 2016, under a project of NEDO, an ocean tidal current project was undertaken by IHI Corporation, Tokyo University, and Mitsui & Co. A consortium consisting of Kyuden Mirai Energy Co., Inc., Nippon Steel & Sumikin Engineering Co., Ltd., NPO Nagasaki Marine Industry Cluster Promotion Association and Open Hydro Technology was selected by the Ministry of Environment of Japan to supply a 2-MW tidal turbine system for installation in the Okinawase Seto area of Goshima City, Nagasaki. This demonstration project aims to establish technologies conforming to domestic environments and technical standards.

18
Desalination
Through strategic planning and investment in research and innovative technology, Singapore has built a diversified water supply system comprised of: (a) local catchment water; (b) imported water (from Malaysia); (c) highly-treated and purified reclaimed water (called NEWater); and (d) desalinated water. There are three desalination plants, with two more in the pipeline to be completed by 2020. The current focus is on technological improvements that will reduce desalination’s energy use and cost, and ensure its long-term sustainability.
A major environmental impact of desalination is caused by the high concentration of brine discharge. One example of solving this problem in China is utilizing the brine in salt fields after being processed using appropriate technologies. This has reduced the evaporating time of salt fields, increased crude salt output, and created benefits with less human resource cost.
Marine biotechnology and new medicines.
The Philippine PharmaSeas Drug Discovery Program is tapping the rich marine biodiversity in the Philippines. It is focused on bioactives from marine organisms, including pain killers using marine snails, and anti-infectives from sponges. In China, marine natural products (MNPs) have been traditionally used in drug and food development. Likewise, in RO Korea, marine biotechnology supports developments in food, chemicals and medicines. The domestic marine biotechnology market in RO Korea is expected to grow more than 14% annually from $70 million in 2012 to $360 million in 2020, which will share 5% of the world marine biotechnology market.
Biotechnology and aquaculture.
The key initiatives of the Marine Aquaculture Centre (MAC) in Singapore include the application of Recirculation Aquaculture Systems technology, with the accompanying culture protocols for intensive fry production, genetic improvement of the Asian seabass, captive breeding of new species, and the development of closed containment systems for coastal fish farms. Another example is the selective breeding project with Temasek Life Sciences Laboratory using advanced molecular biotechnology, such as marker-assisted selection technique, allowing desired traits to be selected more accurately and effectively, without any genetic modification.
Climate resiliency and green infrastructure.
In China, the eco-sponge city is the new concept of urban stormwater management in view of waterlogging, water quality degradation and other major hydrological safety problems in the cities. The government has called for “strengthening the building of sponge cities characterized by natural storage, natural infiltration, and natural purification” to ensure that cities are resilient to deal with environmental changes and natural disasters brought about by rainwater and flooding.
Similarly, a project in Cambodia combined hard infrastructure with green infrastructure to adapt to climate change. The polder and outer polder dyke at Prey Nob District in Preah Sihanouk were rehabilitated to prevent seawater intrusion. The project also involved planting of 60,000 seedlings of Teaptoas trees to protect the polders, as well as mangrove planting and integrated farming system to improve resilience of coastal communities against both flooding and drought.

19
Oceans and seas play a major role in contributing to achieving sustainable development, economic growth, livelihoods, and jobs. An important constraint on the development of the blue economy is the current deterioration of ocean health. There are complex pressures and threats affecting the state of ocean health and ocean
Gearing Up for the Challengeseconomy. Economic activity in the ocean is expanding rapidly, driven primarily by population growth, changing demographics, developments in economic growth, trade, logistics, rising income levels, and technology, and changes in climate and environment. The consequences of continued inaction could be catastrophic as millions of people rely on oceans for their food and livelihood. Knowing the structure of the ocean economy and ecosystem services can be used to see the benefits and how environmental degradation, biodiversity loss, and climate change can affect development and human welfare, and take the edge off the economic growth and poverty alleviation that have been gained in the region.
Lessons Learned from SOC Reporting in the East Asian Seas Region
Regular SOC Reporting
The first set of SOC reports provide the baseline for future assessments. Initial estimates show that the SOC provides a comprehensive approach to evaluate the contribution of oceans and coasts, impacts of human activity on the ocean, as well as
The East Asian Seas are under increasing pressure, from the growing range and intensity of ocean economic activities and their impacts on resources, habitats, biodiversity, and marine water quality, as well as from climate change. The long-term potential of oceans cannot be realized unless the major problems affecting ocean health and coastal communities are addressed.
• Habitat destruction and biodiversity loss
• Invasive species
• Fisheries: –Overfishingandillegal,unreportedandunregulated(IUU)
fishing–Depletionoffishstocks– Changesinspeciescompositionandmigrationpatterns
• Pollution: –Untreateddomesticandindustrialwastewater–Nutrients,eutrophication,harmfulalgalbloom,andhypoxia–Macro-andmicroplasticsandmarinedebris– Oilspills– Toxicandhazardouswastes
• Climate change: –Oceanacidification–Risingseatemperaturesandsealevels– Coralbleaching– Shiftingoceancurrents–Higherfrequencyofsevereoceanweatherevents
But the oceans are under stress…
Mangroves in Bali, Indonesia.

20
monitor progress towards the SDGs, SDS-SEA, and other international agreements through the blue economy and ocean governance initiatives. The SOC is an important tool to advance scientific support, raise public awareness, promote good governance and partnerships for blue economy, and foster the development of synergies among the various sectors and stakeholders. The evidence base provided by the SOC reports is fundamental in informing policy- and decision-makers on ocean-related issues as well as best practices that can be replicated and scaled up.
Ocean accounts
Resources and capacity are needed to develop the ocean economy-environment accounts following the UN System of Environmental-Economic Accounting (SEEA) approach. Current national income accounts do not have the breakdown for the ocean economic activities (e.g., small-scale fisheries, coastal and marine tourism, maritime shipping, maritime services, etc.). Moreover, there is also lack of waste accounting, and availability of studies showing the environmental cost and economic losses. However, it is critical to transform the ‘growth’ paradigm, and highlight the value and contribution of natural oceanic capital to guide the policy decisions that consider trade-offs and complementarities of different ocean sectors, environment protection and resource conservation. It is therefore essential to improve the statistical and methodological base and accessibility at national and regional levels for measuring the ocean economy, scale and performance of ocean-based and ocean-related economic activities, value of coastal and marine ecosystem services and environmental damage, and the economic-environmental linkages in the ocean.
Ocean governance for blue economy
• National ocean policies that include support for blue economy development– Identification of entry points, new business models, revenue
streams and financing mechanisms that can be leveraged to accelerate blue economy investments (e.g., ecotourism, sustainable fisheries, aquaculture and seafood processing, green ports, green ships and marine engineering, marine renewable energy, marine biotechnology; etc.)
– Science-Economy-Policy linkage: Research, development and deployment (RD&D) support, testbed platforms, and incentives for commercialization in emerging blue economy industries, alternatives to plastics, and cost-effective technologies in wastewater treatment to allow reuse and recovery of water, energy and nutrients.
– Assessment of blue carbon market potential
– Knowledge management and capacity development of institutions at the national and local levels to enable adoption, implementation and sustainability of innovative blue economy initiatives.
– Connection of blue economy initiatives to the achievement of the SDGs: Show the synergies to accelerate actions and achieve the targets of SDGs, SDS-SEA, and other international agreements. Review the value added of blue economy, and its contribution to income, jobs, and the overall ocean agenda.
• More coherent and integrated policies, procedures, incentives and financing modalities to provide for the sustainable use of coastal and marine resources and protection of ocean health– Marine spatial planning, including mix of regulations and
economic instruments – Marine protected areas that are more effectively managed– More investments in wastewater, solid and plastic waste
management systems– Determined promotion of 3Rs (reduce, reuse and recycle) for solid
and plastic waste management in communities, businesses and institutions
– Habitat restoration and conservation with co-management arrangements and biodiversity-friendly livelihood and enterprises in coastal communities.
– Climate-resilient development and green infrastructure in coastal areas.
• Regular monitoring of: (a) marine water quality, (b) condition of habitats and biodiversity, (c) status and outcomes of research; (d) projects, tools and processes applied for addressing related issues.