State of New York of New York. Department of Correctional Services. Building Number 2 . Harriman...
33
State of New York Department of Correctional Services Building Number 2 Harriman Office Campus Albany, New York 12226 MERIT TIME PROGRAM SUMMARY October 1997 – December 2006 Eliot Spitzer Brian Fischer Governor Commissioner
Transcript of State of New York of New York. Department of Correctional Services. Building Number 2 . Harriman...

State of New York
Department of Correctional Services
Building Number 2 Harriman Office Campus Albany, New York 12226
MERIT TIME PROGRAM SUMMARY
October 1997 – December 2006
Eliot Spitzer Brian Fischer
Governor Commissioner

MERIT TIME PROGRAM SUMMARY
October 1997 - December 2006
EXECUTIVE SUMMARY In 1997, the legislature authorized the creation of the Merit Time Program. It allows for inmates who are serving prison sentences for certain non-violent crimes to earn a possible one-sixth reduction of the minimum term if they have achieved significant programmatic objectives and have not committed any serious disciplinary infractions. The first Merit Time appearances occurred in October 1997. This report provides a statistical overview of the Merit Time Program for the period from October 1997 through December 2006. This report examines inmates who were released to parole supervision prior to their Parole Eligibility date as a result of being approved as a Merit Time release by the New York State Board of Parole. Merit Time Program Expansion. Eligibility for the Merit Time program is based upon the crimes for which an inmate is currently serving a sentence. An inmate cannot be serving a sentence for a legislatively designated violent felony offense, manslaughter in the second degree, vehicular manslaughter in the second degree, vehicular manslaughter in the first degree, criminally negligent homicide, incest, any offense defined in Article 130 of the Penal Law (sex offenses), or any offense defined in Article 263 of the Penal Law (use of a child in a sex performance). When the Merit Time program began in 1997, all Class A-1 felons were ineligible for the program. However, effective May 15, 2003, the Legislature expanded the eligibility criteria to include inmates committed for Class A-1 drug offenses. The first Class A-1 drug felons were released through the Merit Time program in September 2003. Through December 2006, 98 Class A-1 drug offenders were released early due to the Merit Time program. Merit Time Disposition. There were 37,914 merit hearings between October 1997 and December 2006. These merit hearings resulted in 25,997 inmates (69%) being approved for merit release (refer to Table 1, p.3). Of the Merit approvals, 24,407 individuals were actually released prior to their Parole Eligibility date (refer to Table 2, p. 4). Not all of the 24,407 were released by December 31, 2006; 355 were released after January 1, 2006. The remaining 24,052 releases are the basis of this report. Legal Characteristics of Merit Releases. Between 1997 and 2006, more than three-quarters (78%) of Merit Time releases were committed for drug offenses (see Table 3, p. 5). Additionally, 75% of merit releases were sentenced as second felony offenders (see Table 5, p. 7). The average minimum sentence for merit releases was 37 months (see Table 6, p. 8), while the average maximum sentence was 93 months (see Table 7, p. 8). The average time served by merit releases was 31 months (see Table 8, p. 9), or about 6 months less than the average minimum sentence (see Table 6, p. 8).
i
Demographic Characteristics of Merit Releases. A typical merit release is most likely to be male, from New York City (or the surrounding metropolitan area), and about 37 years old at release (see Tables 9, 11, & 12, p. 10-11). Cumulative Extra Time Released from DOCS’ Custody and Estimated Cost Savings. During the period October 1997 through December 2006, the Merit Program generated 24,052 early releases. Among the 24,052 releases, 98 were Class A-1 drug offenders. Prior to the Merit Program, the 23,954 non-Class A-1 drug offenders would typically have been held for an additional six months prior to their next Parole Board hearing. The savings generated by these additional releases can be estimated by a maintenance cost of $29,000 per inmate per year for the estimated six months of additional incarceration. This is a savings of nearly $359 million. The Class A-1 drug offenders released through the expansion of the Merit Time program left DOCS custody at an average of 42 months before their parole eligibility dates, for a savings of approximately $10 million. Overall, it is estimated that the 24,052 additional releases resulted in a savings of $369 million since the inception of the Merit Program (see Tables 13A and 13B, p.14). The Research Division decided that beginning January 1, 2001, avoidance of capital expenditure should not be credited to programs until the Department either makes plans for new construction or makes double bunks, placed into emergency status, operational once again. Capital costs avoided and accrued prior to January 1, 2001 will continue to be reported. Therefore, construction avoidance savings calculations are based on the 7,647 early releases between October 1997 and December 2000. As a result of a suggestion from auditors in the Office of the State Controller, DOCS’ cost avoidance estimates amortize the cost of building correctional facilities. For the cost avoidance estimates, we have used the $75,975,000 cost of a medium security facility, fully double-bunked with a total capacity of 1,302 inmates, depreciable over thirty years, and a 6.35% interest rate. Using this model, the 7,647 early releases (between October 1997 and December 2000) reduced the need for capital construction by almost $15 million. Combining the estimated $369 million in operational savings with the $15 million in construction avoidance savings, the Merit Program has reduced the need for the DOCS expenditures by approximately $384 million dollars since its inception in 1997 (refer to page 13). Return Rate of Merit Time and Comparison Cases. The purpose of the Merit Time program is to release certain non-violent inmates to parole supervision earlier than they would normally be released, without increasing the risk to the community. A one-year follow-up of 1997 through 2005 releases is presented according to release status. Additionally, a two-year follow-up of 1997 through 2004 releases is presented. Finally, a three-year follow-up of 1997 through 2003 cases is provided.
ii

Between October 1997 and December 2005, the 21,200 inmates released due to Merit Time approval had a return to custody rate that was the next to the lowest rate of all of the comparison groups. Specifically, inmates with a merit approval that were released prior to their Parole Eligibility (PE) date returned at a rate of 11% within the first year. All other releases returned at a rate of 18% within the first year (see Tables 16A and 16B, p. 19-20). With respect to the two-year follow-up, the results were similar. Inmates with a merit approval that were released prior to their PE date returned at a rate of 23% within two years. All other releases returned at a rate of 31% within the two-year follow-up (see Tables 17A and 17B, p. 22-23). For the three-year follow-up, inmates with a merit approval that were released prior to their PE date returned at a rate of 31% within three years. All other releases returned at a rate of 39% within the three-year follow-up (see Tables 18A and 18B, p. 25-26).
iii

TABLE OF CONTENTS
EXECUTIVE SUMMARY ........................................................................................ i TABLE OF CONTENTS ......................................................................................... iv INTRODUCTION ....................................................................................................1 Overview of Merit Time Program Merit Time Program Expansion MERIT TIME DISPOSITIONS.................................................................................3 CHARACTERISTICS OF MERIT RELEASES .......................................................5 Crime of Commitment Sentence Status and Length Time Served Demographic Characteristics ESTIMATED SAVINGS SINCE PROGRAM INCEPTION ......................................12 Operational Savings Construction Avoidance Savings Total Savings MERIT TIME FOLLOW-UP STUDY .......................................................................16 Follow-up Method Follow-up Population Follow-up Period One Year Out Follow-up Results Two Year Out Follow-up Results Three Year Out Follow-up Results Conclusion
iv

MERIT TIME PROGRAM SUMMARY
October 1997 - December 2006
INTRODUCTION The purpose of this report is to provide a summary and evaluation of the Merit Time Program. This report covers Merit Time hearings for the period of October 1997 through December 2006. The information in this report is based on Merit Time hearings and dispositions. Data on Merit Eligibility status are maintained by the Department of Correctional Services (DOCS) and data about parole dispositions are supplied by the Division of Parole through a monthly computer file. The data in this report relies on the information from both of these files. For individuals with more than one hearing during the relevant time period, (due to postponements at their initial hearing) information is provided on each hearing and corresponding Merit Time disposition. A summary is provided on Merit Eligibility outcomes, parole dispositions, characteristics of merit releases, and estimated cost savings since program implementation. The last section of the report provides a follow-up of merit releases compared with other release categories. Overview of Merit Time Program Legislation authorizing Merit Time was signed into law by Governor Pataki on August 20, 1997 as Chapter 435 of the Laws of 1997. The legislation specifically amended Correction Law Section 803. It allows inmates who are serving prison terms with a minimum sentence greater than one year for certain non-violent crimes to earn a possible one-sixth reduction of the minimum term if they have achieved certain significant programmatic objectives and have not engaged in any serious disciplinary infractions. Specifically, inmates must achieve one of the following program goals in order to be eligible for Merit Time release: obtain a GED, obtain an alcohol and substance abuse treatment certificate, obtain a vocational training certificate following at least six months of vocational programming, or perform 400 hours of service as part of a community work crew. To be eligible for a Merit Time early release, an inmate cannot be serving a sentence for a legislatively designated violent felony offense, manslaughter in the second degree, vehicular manslaughter in the second degree, vehicular manslaughter in the first degree, criminally negligent homicide, incest, any offense defined in Article 130 of the Penal Law (sex offenses), or any offense defined in Article 263 of the Penal Law (use of a child in a sex performance).

2
If an inmate is serving multiple sentences of imprisonment for different crimes, whether such sentences are concurrent or consecutive, in order for the inmate to possibly receive a Merit Time credit, all of the crimes must be Merit Time eligible crimes. In addition, if a parole violator or conditional release violator is returned to the Department under a new conviction that is a Merit Time eligible crime, but the original crime was an ineligible offense which is still running, the inmate is ineligible for any Merit Time reduction (see Penal Law Section 70.30(1)). The objective of the Merit Time Program is to provide non-violent inmates who have demonstrated an overall pattern of good behavior with the opportunity to be released early. Any inmate who receives the benefit of Merit Time must either appear before the Board of Parole for a possible release on parole at the Merit Time release date (which is calculated at five-sixths of the minimum term) or be presumptively approved1 for such a release by DOCS. If the Board of Parole or DOCS grants the inmate early release to parole, he or she may be released to parole supervision prior to the inmate’s parole eligibility date. If release to parole is denied by the Board, then the inmate will again appear before the Board of Parole at his or her original parole eligibility date. Legislation in 2004, to reform the Rockefeller drug laws, resulted in determinate sentences for drug felony convictions. Some of the inmates sentenced under this new legislation were also eligible for merit time. These eligible inmates are required to serve the full sentence with a possibility of 1/7 off for good time and another 1/7 off for merit time. These individuals are released by law as “conditional releases” without decision by the Board of Parole or the Commissioner of DOCS. The legislation also established “supplemental merit” for drug offenders serving time on indeterminate sentences. Supplemental merit inmates are eligible for an additional 1/6 reduction in the minimum term. This can be earned by completing 2 of 5 milestones. In addition to the four areas identified above, successfully completing three months of work release is the fifth milestone. For inmates who have a parole approval hearing before the Parole Board, the inmate’s final disposition can be one of three outcomes. An inmate may be approved for release and actually be released to parole supervision early, as a merit release. An inmate may be denied parole and therefore not be released early. Finally, an inmate may be approved for merit release but not actually be released to parole supervision early. Merit Time Program Expansion. As discussed previously, eligibility for the Merit Time program is based upon the crimes for which an inmate is currently serving a sentence. When the Merit Time program began in 1997, all Class A-1 felons were ineligible for the
1 Presumptive Release is an initiative that became effective in April 2003. Certain eligible inmates are reviewed by DOCS prior to their Parole Board hearing to determine if they meet the criteria for Presumptive Release. Inmates approved for Presumptive Release see the Parole Board only for a hearing to set the conditions of their parole since DOCS has already approved them for release. Inmates can be presumptively released on their merit date (as a merit presumptive release) or on their parole eligibility date (as a regular presumptive release). As of December 2006, 4,080 inmates were released from DOCS as merit presumptive releases.

program. However, effective May 15, 2003, the Legislature expanded the eligibility criteria to include inmates committed for Class A-1 drug offenses. The first Class A-1 drug felons were released through the Merit Time program in September 2003. Through December 2006, 97 Class A-1 drug felons were released early through the Merit Time Program. The first Merit Time appearances occurred in October 1997. This report will include all merit hearings and releases between October 1997 and December 2006. Through December 2006, there were 1,847 supplemental merit releases; 1,053 were presumptive releases. MERIT TIME DISPOSITIONS
From October 1997 through December 2006, there were 37,914 Parole Board hearings for Merit Time release. As a product of those hearings, 25,997 (69%) inmates were approved for merit release by the Board of Parole (see Table 1). The remaining 31% of the inmates were denied merit release by the Parole Board. Of the 25,997, only 24,407 were merit releases, because 1,575 individuals did not get released from the Department prior to their Parole Eligibility date and 15 were still awaiting release (see Table 2).
Table 1. Merit Outcome by Hearing Year Cases Receiving a Merit Hearing
Merit Merit TotalHearing Parole Parole MeritYear Approved Denied Hearings1997* 831 79.8% 211 20.2% 1,042 100.0%
1998 2,555 67.3% 1,241 32.7% 3,796 100.0%
1999 2,446 63.4% 1,414 36.6% 3,860 100.0%
2000 2,875 70.4% 1,208 29.6% 4,083 100.0%
2001 3,246 69.7% 1,413 30.3% 4,659 100.0%
2002 2,441 63.5% 1,404 36.5% 3,845 100.0%
2003 2,774 72.2% 1,066 27.8% 3,840 100.0%
2004 2,746 72.7% 1,031 27.3% 3,777 100.0%
2005 3,167 69.4% 1,395 30.6% 4,562 100.0%
2006 2,916 65.5% 1,534 34.5% 4,450 100.0%
Total 25,997 68.6% 11,917 31.4% 37,914 100.0%
3
* The first merit releases occurred in October 1997, so 1997 includes only October through December hearings.
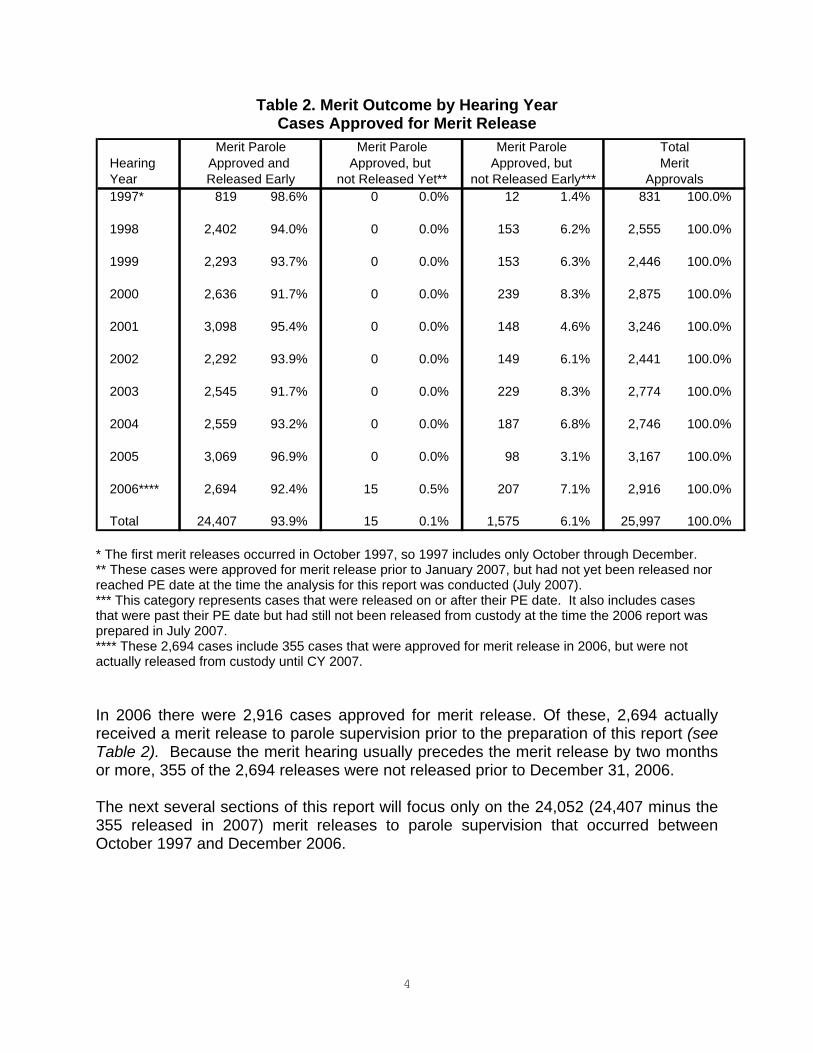
Table 2. Merit Outcome by Hearing Year Cases Approved for Merit Release
Merit Parole Merit Parole Merit Parole TotalHearing Approved and Approved, but Approved, but MeritYear Released Early not Released Yet** not Released Early*** Approvals1997* 819 98.6% 0 0.0% 12 1.4% 831 100.0%
1998 2,402 94.0% 0 0.0% 153 6.2% 2,555 100.0%
1999 2,293 93.7% 0 0.0% 153 6.3% 2,446 100.0%
2000 2,636 91.7% 0 0.0% 239 8.3% 2,875 100.0%
2001 3,098 95.4% 0 0.0% 148 4.6% 3,246 100.0%
2002 2,292 93.9% 0 0.0% 149 6.1% 2,441 100.0%
2003 2,545 91.7% 0 0.0% 229 8.3% 2,774 100.0%
2004 2,559 93.2% 0 0.0% 187 6.8% 2,746 100.0%
2005 3,069 96.9% 0 0.0% 98 3.1% 3,167 100.0%
2006**** 2,694 92.4% 15 0.5% 207 7.1% 2,916 100.0%
Total 24,407 93.9% 15 0.1% 1,575 6.1% 25,997 100.0%
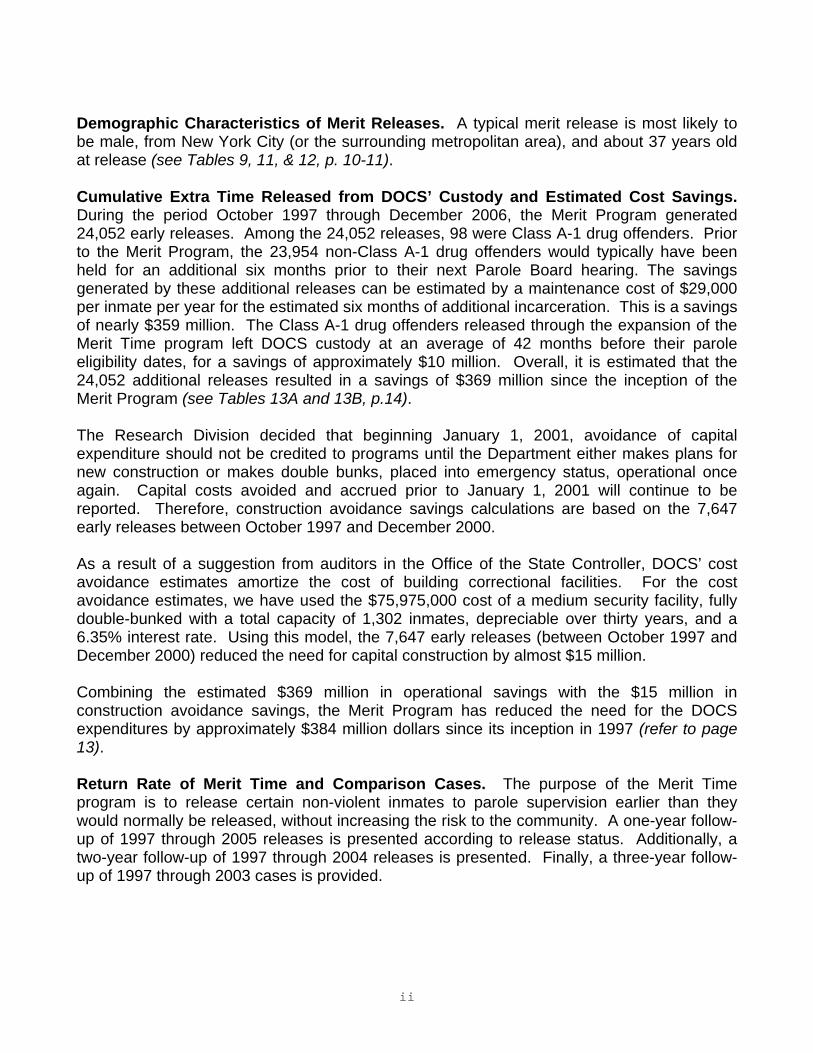
* The first merit releases occurred in October 1997, so 1997 includes only October through December. ** These cases were approved for merit release prior to January 2007, but had not yet been released nor reached PE date at the time the analysis for this report was conducted (July 2007). *** This category represents cases that were released on or after their PE date. It also includes cases that were past their PE date but had still not been released from custody at the time the 2006 report was prepared in July 2007. **** These 2,694 cases include 355 cases that were approved for merit release in 2006, but were not actually released from custody until CY 2007. In 2006 there were 2,916 cases approved for merit release. Of these, 2,694 actually received a merit release to parole supervision prior to the preparation of this report (see Table 2). Because the merit hearing usually precedes the merit release by two months or more, 355 of the 2,694 releases were not released prior to December 31, 2006. The next several sections of this report will focus only on the 24,052 (24,407 minus the 355 released in 2007) merit releases to parole supervision that occurred between October 1997 and December 2006.
4

CHARACTERISTICS OF MERIT RELEASES Crime of Commitment By definition, inmates released as a result of the Merit Time Program cannot have been committed for a violent felony or a sex offense. Between 1997 and 2006, more than three-quarters (78%) of merit releases were committed for a drug offense. After drug offenders, the next largest category of merit releases was composed of offenders committed for property offenses (17%), followed by other coercive offenses (4%). With respect to specific offenses, the majority of merit releases were committed for either Criminal Sale of a Controlled Substance 3rd (N = 6,539 or 27%) or Criminal Sale of a Controlled Substance 5th (N = 4,732 or 20%) (see Table 4).
Table 3. Crime of Commitment by Release Year Merit Releases to Parole Supervision: 1997 to 2006
5
64
8246
39
63
CRIME 1997 - 2000 2001 2002 2003 2004 2005 2006 TOTAL
OTHER COERCIVEROBBERY 3RD 129 67 35 59 69 36 54 449ASSAULT 2ND (ATTEMPTED) 28 8 15 13 8 10 6 88CONSPIRACY 2,3,4 43 19 20 12 17 30 35 17OTHER WEAPONS 62 18 18 24 29 29 34 21RECKLESS ENDANGERMENT 26 7 7 9 11 11 11OTHER COERCIVE 16 2 2 8 9 5 4CRIME SUBTOTAL 304 121 97 125 143 121 144 1,055
4.0% 4.2% 4.1% 4.8% 5.4% 3.9% 5.0% 4.4%DRUG OFFENSESA-1 DRUG SALE 0 0 0 29 16 6 2 53A-1 DRUG POSSESSION 0 0 0 23 12 3 6 44DRUG SALE 4,703 1,686 1,326 1,323 1,195 1,379 1,237 12,849DRUG POSSESSION 1,544 654 586 639 720 908 862 5,913CRIME SUBTOTAL 6,247 2,340 1,912 2,014 1,943 2,296 2,107 18,859
81.7% 80.9% 80.9% 77.6% 73.6% 74.9% 73.9% 78.4%PROPERTY AND OTHERBURGLARY 3RD 381 153 107 122 167 202 183 1,315GRAND LARCENY 197 75 78 91 129 141 140 851AUTO CRIMES 84 28 21 31 30 29 29 252FORGERY 147 70 59 69 94 101 80 620STOLEN PROPERTY 151 54 37 47 58 52 51 450DRIVE INTOXICATED 19 14 21 23 16 45 54 192FRAUD CRIMES 25 7 8 17 18 32 30 137CONTEMPT 1ST 17 6 4 5 3 3 1ALL OTHER FELONIES 62 17 14 43 32 30 21 219CRIME SUBTOTAL 1,083 424 349 448 547 635 589 4,075
14.2% 14.7% 14.8% 17.3% 20.7% 20.7% 20.7% 16.9%
YOUTHFUL OFFENDER 10 7 5 8 7 14 120.1% 0.2% 0.2% 0.3% 0.3% 0.5% 0.4% 0.3%
GRAND TOTAL 7,644 2,892 2,363 2,595 2,640 3,066 2,852 24,052100.0% 100.0% 100.0% 100.0% 100.0% 100.0% 100.0% 100.0%

Table 4. Crime of Commitment by Release Year Merit Releases to Parole Supervision: 1997 to 2006
CRIME 1997 - 2000 2001 2002 2003 2004 2005 2006 TOTAL
OTHER COERCIVEROBBERY 3RD 129 67 35 59 69 36 54 449ASSAULT 2ND (ATT) 28 8 15 13 8 10 6 8RECK ENDANGER 1ST 26 7 7 9 11 11 11VEHIC ASSAULT 2ND 1 0 1 1 1 1 0 5ARSON 3RD 9 2 1 5 5 1 2ARSON 4TH 0 0 0 2 0 0 0 2CR POS WEAP 3 SUB 1
882
25
,2,3 60 17 17 24 29 27 31 20SALE FIREARM 3RD 2 1 1 0 0 2 3 9UNLAWFUL IMPRIS 1ST 1 0 0 0 0 0 1 2COERCION 1ST 3 0 0 0 3 3 1TAMP WITNESS 3RD 1 0 0 0 0 0 0 1INTIMIDATE WIT 3RD 1 0 0 0 0 0 0 1CONSPIRACY 2ND 34 15 18 11 15 27 28 14CONSPIRACY 3RD 3 1 1 0 0 1 2 8CONSPIRACY 4TH 6 3 1 1 2 2 5CRIME SUBTOTAL 304 121 97 125 143 121 144 1,055
4.0% 4.2% 4.1% 4.8% 5.4% 3.9% 5.0% 4.4%DRUG OFFENSES
CSCS 1ST 0 0 0 29 16 6 2 53CPCS 1ST 0 0 0 23 12 3 6 44CSCS 2ND 232 93 76 113 95 129 93 831CPCS 2ND 351 146 126 150 172 209 141 1,295CSCS 3RD 2,406 927 717 704 610 664 511 6,539CPCS 3RD 533 237 238 223 224 301 281 2,037CSCS 4TH 63 18 19 14 31 120 159 42CPCS 4TH 135 68 46 57 62 100 144 612CSCS 5TH 1
5
10
8
20
4
,960 609 479 458 402 402 422 4,732CPCS 5TH 501 194 166 197 245 279 270 1,852CRIM SALE MAR 1 2 3 0 0 0 2 2 9CRIM POS MAR 1 3 4 4 4 2 7 12CRIM SALE MAR 2 1 2 0 0 2 1 1 7CRIM POS MAR 2 13 3 4 5 9 10 10CRIM SALE MAR 3 5 1 4 1 2 4 3CRIM POS MAR 3 8 1 2 3 6 2 4CSCS AT SCHOOL 34 34 31 33 53 57 46 288CRIME SUBTOTAL 6
36
542026
,247 2,340 1,912 2,014 1,943 2,296 2,107 18,85981.7% 80.9% 80.9% 77.6% 73.6% 74.9% 73.9% 78.4%
PROPERTY AND OTHERBURGLARY 3RD 381 153 107 122 167 202 183 1,315GRAND LARCENY 1ST 7 2 2 2 5 2 7GRAND LARCENY 2ND 25 10 9 13 24 22 27 130GRAND LARCENY 3RD 61 23 22 25 40 49 41 26GRAND LARCENY 4TH 104 40 45 51 60 68 65 433UNAU USE VEHIC 1ST
27
1
,2ND 15 5 3 2 5 3 3AUTO STRIPPING 1ST
36,2ND 19 5 6 6 3 7 5
GR LAR 151
,2,3,4 AUTO 50 18 12 23 22 19 21 165STOLEN PROP 2,3,4 151 54 37 47 58 52 51 450DEFRAUD 1ST 4 1 4 1 4 6 2INSUR FRAUD 2
22,3,4 5 0 0 5 4 3 3
BUS CORRUPTION 9 4 3 7 7 6 8FORGERY 1
2044
,2 73 30 25 31 26 43 32 26POS FORGE INS 1
0,2 74 39 34 38 67 58 48 35
DRIVE INTOX 28
,3 OFF 19 14 21 23 16 45 53 19UNLICENSED DRIVER 3 0 2 4 1 1 2CRIM MISCHIEF 1,2,3 17 7 3 14 13 7 3 64CONTRABAND 1ST 4 0 0 9 4 5 2BAIL JUMPING 1,2 13 3 2 8 2 5 5CONTEMPT 1ST 17 6 4 5 3 3 1OTHER 32 10 8 12 16 29 27 134CRIME SUBTOTAL 1,083 424 349 448 547 635 589 4,075
14.2% 14.7% 14.8% 17.3% 20.7% 20.7% 20.7% 16.9%
YO - JO 10 7 5 8 7 14 120.1% 0.2% 0.2% 0.3% 0.3% 0.5% 0.4% 0.3%
GRAND TOTAL 7,644 2,892 2,363 2,595 2,640 3,066 2,852 24,052100.0% 100.0% 100.0% 100.0% 100.0% 100.0% 100.0% 100.0%
113
243839
63
6

Sentence Status and Length Overall, three-quarters (75%) of merit releases were sentenced as second felony offenders. However this proportion has decreased over time, from 80% in 1997 through 2000 to 70% in 2006 (see Table 5).
Table 5. Second Felony Offender Status by Release Year
Merit Releases to Parole Supervision: 1997 to 2006
7
6
Second Felony Latest Release Year
Offender Status 1997 - 2000 2001 2002 2003 2004 2005 2006 TOTAL
First Felony Offender 1,558 696 586 731 681 839 843 5,934Second Felony Offender 6,067 2,196 1,773 1,858 1,958 2,222 2,008 18,082Persistent Felony Offender 19 0 4 6 1 5 1 3Total 7,644 2,892 2,363 2,595 2,640 3,066 2,852 24,052First Felony Offender 20.4% 24.1% 24.8% 28.2% 25.8% 27.4% 29.6% 24.7%Second Felony Offender 79.4% 75.9% 75.0% 71.6% 74.2% 72.5% 70.4% 75.2%Persistent Felony Offender 0.2% 0.0% 0.2% 0.2% 0.0% 0.2% 0.0% 0.1%Total 100.0% 100.0% 100.0% 100.0% 100.0% 100.0% 100.0% 100.0%
The average minimum sentence received by all merit releases between 1997 and 2006 was 37 months (see Table 6).
Table 6. Aggregate Minimum Sentence by Release Year Merit Releases to Parole Supervision: 1997 to 2006
Minimum Latest Release YearSentence 1997-2000 2001 2002 2003 2004 2005 2006 TOTALLT 18 Months 76 52 41 54 59 129 290 70118-23 Months 964 361 297 344 395 394 374 3,12924-35 Months 2,944 1002 795 876 890 937 861 8,30536-47 Months 1,976 707 562 547 612 647 610 5,66148-71 Months 1,312 609 507 511 475 673 537 4,62472-119 Months 333 149 150 200 166 240 152 1,390120-179 Months 39 10 10 12 14 37 25 147180-239 Months 0 2 1 38 15 7 3 66240 + Months 0 0 0 13 14 2 0 29Total 7,644 2,892 2,363 2,595 2,640 3,066 2,852 24,052Median 30.0 36.0 36.0 36.0 30.0 36.0 30.0 30.0Average 35.7 36.8 37.4 40.7 38.3 39.0 35.5 37.2LT 18 Months 1.0% 1.8% 1.7% 2.1% 2.2% 4.2% 10.2% 2.9%18-23 Months 12.6% 12.5% 12.6% 13.3% 15.0% 12.9% 13.1% 13.0%24-35 Months 38.5% 34.6% 33.6% 33.8% 33.7% 30.6% 30.2% 34.5%36-47 Months 25.9% 24.4% 23.8% 21.1% 23.2% 21.1% 21.4% 23.5%48-71 Months 17.2% 21.1% 21.5% 19.7% 18.0% 22.0% 18.8% 19.2%72-119 Months 4.4% 5.2% 6.3% 7.7% 6.3% 7.8% 5.3% 5.8%120-179 Months 0.5% 0.3% 0.4% 0.5% 0.5% 1.2% 0.9% 0.6%180-239 Months 0.0% 0.1% 0.0% 1.5% 0.6% 0.2% 0.1% 0.3%240 + Months 0.0% 0.0% 0.0% 0.5% 0.5% 0.1% 0.0% 0.1%Total 100.0% 100.0% 100.0% 100.0% 100.0% 100.0% 100.0% 100.0%

Overall, the average maximum sentence received by all merit releases was 93 months (see Table 7). A life maximum sentence was treated as 25 years for purposes of calculating the average maximum sentence.
Table 7. Aggregate Maximum Sentence by Release Year Merit Releases to Parole Supervision: 1997 to 2006
Maximum Latest Release YearSentence 1997-2000 2001 2002 2003 2004 2005 2006 TOTAL12-35 Months 0 0 0 0 0 0 258 25836 Months 861 320 264 310 336 409 329 2,82937-53 Months 1,753 604 511 538 579 606 542 5,13354-71 Months 944 332 222 229 257 263 225 2,47272-95 Months 2,060 727 582 635 650 694 671 6,01996-107 Months 198 72 67 68 75 96 71 647108-143 Months 948 459 387 371 342 474 389 3,370144-179Months 185 82 78 85 54 101 91 676180 + Months 113 56 49 45 53 79 55 450Life Max 582 240 203 314 294 344 198 2,175Total 7,644 2,892 2,363 2,595 2,640 3,066 2,829 24,029Median 72.0 72.0 72.0 72.0 72.0 72.0 72.0 72.0Average 88.8 93.1 94.7 101.2 97.7 100.8 85.4 93.312-35 Months 0.0% 0.0% 0.0% 0.0% 0.0% 0.0% 9.1% 1.1%36 Months 11.3% 11.1% 11.2% 11.9% 12.7% 13.3% 11.6% 11.8%37-53 Months 22.9% 20.9% 21.6% 20.7% 21.9% 19.8% 19.2% 21.4%54-71 Months 12.3% 11.5% 9.4% 8.8% 9.7% 8.6% 8.0% 10.3%72-95 Months 26.9% 25.1% 24.6% 24.5% 24.6% 22.6% 23.7% 25.0%96-107 Months 2.6% 2.5% 2.8% 2.6% 2.8% 3.1% 2.5% 2.7%108-143 Months 12.4% 15.9% 16.4% 14.3% 13.0% 15.5% 13.8% 14.0%144-179Months 2.4% 2.8% 3.3% 3.3% 2.0% 3.3% 3.2% 2.8%180 + Months 1.5% 1.9% 2.1% 1.7% 2.0% 2.6% 1.9% 1.9%Life Max 7.6% 8.3% 8.6% 12.1% 11.1% 11.2% 7.0% 9.1%Total 100.0% 100.0% 100.0% 100.0% 100.0% 100.0% 100.0% 100.0%
Increases in average sentence length can be noted in 2003 for both minimum and maximum sentences. These were due primarily to the addition of Class A-1 drug felons to the Merit Program that year. Since 2003, the number of A-1 felons released as a merit release has dropped each year. The number was higher in 2003 because of the pool of A-1 drug offenders under custody who were made eligible for the Merit Program by legislative action.
8

Time Served Between 1997 and 2006, average time served (including jail time) by inmates who received a merit release was 31 months (see Table 8). In 2003, average time served increased to 34 months, due partly to the inclusion of Class A-1 drug offenders in the Merit Program. Between 2003 and 2006, average time served decreased from 34 to 28 months, due in part to fewer class A-1 offenders and shorter sentences for determinate drug offenders (see Table 3). According to Table 6, the average minimum sentence was 37 months while table 8 indicates the average time served was 31 months. Therefore, merit released inmates served, on average, about 6 months less than they would have if they were released at their court-set eligibility date.
Table 8. Total Time Served Under Custody by Release Year Merit Releases to Parole Supervision: 1997 to 2006
Latest Release Year
Time Served 1997 - 2000 2001 2002 2003 2004 2005 2006 TOTAL
06-11 Months 55 11 15 15 26 62 92 27612-17 Months 992 374 319 372 414 485 570 3,52618-23 Months 2,030 688 575 652 656 722 755 6,07824-29 Months 962 322 221 234 256 369 408 2,77230-35 Months 1,741 670 513 508 575 589 471 5,06736-41 Months 473 184 146 161 146 258 196 1,56442-47 Months 590 301 263 243 230 208 107 1,94248-59 Months 425 181 145 148 129 180 159 1,36760-71 Months 230 110 127 153 116 94 48 87872-119 Months 133 48 32 56 61 87 38 455120-179 Months 13 3 7 37 19 10 7 96180 + Months 0 0 0 16 12 2 1 31Total 7,644 2,892 2,363 2,595 2,640 3,066 2,852 24,052Average 31.8 31.0 31.4 34.0 31.8 30.9 27.6 30.8Median 24.0 29.8 29.8 29.8 26.1 26.4 23.7 25.806-11 Months 0.7% 0.4% 0.6% 0.6% 1.0% 2.0% 3.2% 1.1%12-17 Months 13.0% 12.9% 13.5% 14.3% 15.7% 15.8% 20.0% 14.7%18-23 Months 26.6% 23.8% 24.3% 25.1% 24.8% 23.5% 26.5% 25.3%24-29 Months 12.6% 11.1% 9.4% 9.0% 9.7% 12.0% 14.3% 11.5%30-35 Months 22.8% 23.2% 21.7% 19.6% 21.8% 19.2% 16.5% 21.1%36-41 Months 6.2% 6.4% 6.2% 6.2% 5.5% 8.4% 6.9% 6.5%42-47 Months 7.7% 10.4% 11.1% 9.4% 8.7% 6.8% 3.8% 8.1%48-59 Months 5.6% 6.3% 6.1% 5.7% 4.9% 5.9% 5.6% 5.7%60-71 Months 3.0% 3.8% 5.4% 5.9% 4.4% 3.1% 1.7% 3.7%72-119 Months 1.7% 1.7% 1.4% 2.2% 2.3% 2.8% 1.3% 1.9%120-179 Months 0.2% 0.1% 0.3% 1.4% 0.7% 0.3% 0.2% 0.4%180 + Months 0.0% 0.0% 0.0% 0.6% 0.5% 0.1% 0.0% 0.1%Total 100.0% 100.0% 100.0% 100.0% 100.0% 100.0% 100.0% 100.0%
9

Demographic Characteristics Consistent with the total population of DOCS’ inmates released, the majority of merit releases were men. However, women comprised 13% of merit releases between 1997 and 2006, which is a larger proportion than the 7% of all first releases from DOCS during this period (Table 9). The proportion of merit releases that were women was 14% during 1997 to 2002 and decreased to 11% in 2006.
Table 9. Gender by Release Year Merit Releases vs. All Other First Releases to Parole Supervision: 1997 to 2006
Merit Releases All
Latest Release Year Other 1st
Gender 1997 - 2000 2001 2002 2003 2004 2005 2006 Total Releases
Male 6,572 2,496 2,023 2,267 2,351 2,757 2,546 21,012 139,566
Female 1,072 396 340 328 289 309 306 3,040 10,156
Total 7,644 2,892 2,363 2,595 2,640 3,066 2,862 24,062 149,722
Male 86.0% 86.3% 85.6% 87.4% 89.1% 89.9% 89.0% 87.3% 93.2%
Female 14.0% 13.7% 14.4% 12.6% 10.9% 10.1% 10.7% 12.6% 6.8%
Total 100.0% 100.0% 100.0% 100.0% 100.0% 100.0% 100.0% 100.0% 100.0%
There was a higher proportion of Hispanics represented among the merit releases (36%) than in the total population of first releases (32%) (see Table 10). Half (50%) of the merit release population were African-American, which is slightly higher than the 47% of first releases composed of African-Americans. Thirteen percent of the merit release population were White, compared to 19% of all first releases.
Table 10. Race/Ethnicity by Release Year
Merit Releases vs. All Other First Releases to Parole Supervision: 1997 to 2006
Merit ReleasesLatest Release Year
Race/Ethnicity 1997 - 2000 2001 2002 2003 2004 2005 2006 Total
White 834 312 266 338 384 462 482 3,078 28,421African-American 3,917 1,488 1,233 1,297 1,234 1,439 1,386 11,994 70,933Hispanic 2,839 1,067 847 926 971 1,114 955 8,719 47,775Other 36 17 11 16 22 35 22 159 2,041Unknown 18 8 6 18 29 16 7 102 552Total 7,644 2,892 2,363 2,595 2,640 3,066 2,852 24,052 149,722White 10.9% 10.8% 11.3% 13.0% 14.5% 15.1% 16.9% 12.8% 19.0%African-American 51.2% 51.5% 52.2% 50.0% 46.7% 46.9% 48.6% 49.9% 47.4%Hispanic 37.1% 36.9% 35.8% 35.7% 36.8% 36.3% 33.5% 36.3% 31.9%Other 0.5% 0.6% 0.5% 0.6% 0.8% 1.1% 0.8% 0.7% 1.4%Unknown 0.2% 0.3% 0.3% 0.7% 1.1% 0.5% 0.2% 0.4% 0.4%Total 100.0% 100.0% 100.0% 100.0% 100.0% 100.0% 100.0% 100.0% 100.0%
All Other 1st
Releases
About two-thirds (65%) of merit releases were committed from New York City, with an additional 11% from the suburbs surrounding New York City. The remaining 24% of merit releases were committed from Upstate New York (see Table 11). The proportion
10
of Upstate merit releases (24%) was lower than the population of all first releases (29%).
Table 11. Region of Commitment by Release Year Merit Releases vs. All Other First Releases to Parole Supervision: 1997 to 2006
Merit Releases AllLatest Release Year Other 1st
Region 1997-2000 2001 2002 2003 2004 2005 2006 Total ReleasesNew York City 5,410 1,962 1,525 1,625 1,666 1,823 1,584 15,595 91,029Suburban New York 827 318 289 304 249 336 306 2,629 15,780Upstate Urban 760 343 283 343 393 460 506 3,088 21,886Upstate Other 646 269 266 322 331 447 456 2,737 21,003Total 7,643 2,892 2,363 2,594 2,639 3,066 2,852 24,049 149,698New York City 70.8% 67.8% 64.5% 62.6% 63.1% 59.5% 55.5% 64.8% 60.8%Suburban New York 10.8% 11.0% 12.2% 11.7% 9.4% 11.0% 10.7% 10.9% 10.5%Upstate Urban 9.9% 11.9% 12.0% 13.2% 14.9% 15.0% 17.7% 12.8% 14.6%Upstate Other 8.5% 9.3% 11.3% 12.4% 12.5% 14.6% 16.0% 11.4% 14.0%Total 100.0% 100.0% 100.0% 100.0% 100.0% 100.0% 100.0% 100.0% 100.0%
Overall, inmates released early due to Merit Time are somewhat older than other inmates when released from DOCS’ custody. Merit releases were 37 years of age, on average, at their release from custody (see Table 12), compared with an average age of 34 years old among all other first releases between 1997 and 2006.
Table 12. Age at Release by Release Year Merit Releases vs. All Other First Releases to Parole Supervision: 1997 to 2006
Merit Releases AllLatest Release Year Other 1st
Age 1997-2000 2001 2002 2003 2004 2005 2006 Total Releases16-18 Yr 8 3 2 4 4 6 9 36 2,919-20 Yr 58 18 30 23 15 27 22 193 9,22121-24 Yr 441 202 152 172 169 207 199 1,542 25,22125-29 Yr 1,140 447 394 399 441 522 498 3,841 27,05630-34 Yr 1,605 537 430 480 432 556 456 4,496 25,81835-39 Yr 1,833 613 457 530 500 519 491 4,943 23,95840-44 Yr 1,381 557 439 472 504 569 527 4,449 17,30845-49 Yr 672 295 247 257 322 356 349 2,498 9,52750-54 Yr 319 136 129 140 142 177 165 1,208 4,57755-59 Yr 110 59 44 57 68 77 79 494 2,28060-64 Yr 46 20 19 36 23 32 30 206 1,03265 and over 31 5 20 25 20 18 27 146 740Total 7,644 2,892 2,363 2,595 2,640 3,066 2,852 24,052 149,722Mean 36.9 37.2 37.3 37.7 37.9 37.6 37.9 37.4 33.2Median 36.5 36.9 36.8 37.0 37.5 37.1 37.5 36.9 32.016-18 Yr 0.1% 0.1% 0.1% 0.2% 0.2% 0.2% 0.3% 0.1% 2.0%19-20 Yr 0.8% 0.6% 1.3% 0.9% 0.6% 0.9% 0.8% 0.8% 6.2%21-24 Yr 5.8% 7.0% 6.4% 6.6% 6.4% 6.8% 7.0% 6.4% 16.8%25-29 Yr 14.9% 15.5% 16.7% 15.4% 16.7% 17.0% 17.5% 16.0% 18.1%30-34 Yr 21.0% 18.6% 18.2% 18.5% 16.4% 18.1% 16.0% 18.7% 17.2%35-39 Yr 24.0% 21.2% 19.3% 20.4% 18.9% 16.9% 17.2% 20.6% 16.0%40-44 Yr 18.1% 19.3% 18.6% 18.2% 19.1% 18.6% 18.5% 18.5% 11.6%45-49 Yr 8.8% 10.2% 10.5% 9.9% 12.2% 11.6% 12.2% 10.4% 6.4%50-54 Yr 4.2% 4.7% 5.5% 5.4% 5.4% 5.8% 5.8% 5.0% 3.1%55-59 Yr 1.4% 2.0% 1.9% 2.2% 2.6% 2.5% 2.8% 2.1% 1.5%60-64 Yr 0.6% 0.7% 0.8% 1.4% 0.9% 1.0% 1.1% 0.9% 0.7%65 and over 0.4% 0.2% 0.8% 1.0% 0.8% 0.6% 0.9% 0.6% 0.5%Total 100.0% 100.0% 100.0% 100.0% 100.0% 100.0% 100.0% 100.0% 100.0%
84
11

ESTIMATED SAVINGS SINCE PROGRAM INCEPTION As previously stated, the objective of the Merit Time Program is to allow for early release to parole supervision for non-violent offenders who have demonstrated progress in programs and have a good discipline history. Prior to the Merit Time Program, the earliest an offender would have had the opportunity to be released from custody was at his parole eligibility date (except for inmates who successfully complete the Shock Incarceration Program). Merit releases can be released after serving 5/6th of the minimum sentence. Operational Savings During the period October 1997 through December 2006, the Merit Time Program generated 24,052 “early releases”. Among the 24,052 releases, 97 were Class A-1 drug offenders released under the Expanded Merit Criteria and 1,847 were Supplemental Merit releases. Savings from Merit Releases based on Original Merit Criteria. Prior to the Merit Program, the 22,108 Non-Class A-1 drug offenders would typically have been held for an additional 5.6 months prior to their next Parole Board hearing (see Table 13A). The savings generated by these early releases can be estimated by using a maintenance cost of $29,000 per inmate per year for the estimated six months of additional incarceration, which produces a savings of $13,533 per inmate. This is a savings of over $299 million.
Table 13A. Merit Releases to Parole Supervision: 1997 to 2006 Excluded: A-1 Drug and Supplemental Merit Cases
Number of Months Released Before Parole Eligibility Date by Release Year
12
Time From Release Latest Release Year - Not Supplemental, non A1 drug to PE Date 1997-2000 2001 2002 2003 2004 2005 2006 TOTALLT 1 Month 121 63 23 63 63 91 123 547LT 2 Months 118 89 80 108 105 115 197 1,015LT 3 Months 141 260 237 257 216 254 267 2,320LT 4 Months 111 370 303 316 364 311 262 2,965LT 5 Months 77 549 431 454 506 475 382 4,392LT 6 Months 53 279 238 235 240 172 149 2,151LT 7 Months 40 409 304 297 366 261 162 2,850LT 8 Months 18 167 136 153 156 107 64 1,234LT 9 Months 12 167 135 137 132 81 47 1,041LT 10 Months 9 263 220 212 202 126 63 1,57310 + Months 14 276 256 311 262 210 135 2,020Total 714 2,892 2,363 2,543 2,612 2,203 1,851 22,108Average 5.5 5.9 6.0 5.9 5.8 5.5 4.7 5.6Median 5.0 5.1 5.1 5.1 5.1 4.1 4.0 5.0LT 1 Month 16.9% 2.2% 1.0% 2.5% 2.4% 4.1% 6.6% 2.5%LT 2 Months 16.5% 3.1% 3.4% 4.2% 4.0% 5.2% 10.6% 4.6%LT 3 Months 19.7% 9.0% 10.0% 10.1% 8.3% 11.5% 14.4% 10.5%LT 4 Months 15.5% 12.8% 12.8% 12.4% 13.9% 14.1% 14.2% 13.4%LT 5 Months 10.8% 19.0% 18.2% 17.9% 19.4% 21.6% 20.6% 19.9%LT 6 Months 7.4% 9.6% 10.1% 9.2% 9.2% 7.8% 8.0% 9.7%LT 7 Months 5.6% 14.1% 12.9% 11.7% 14.0% 11.8% 8.8% 12.9%LT 8 Months 2.5% 5.8% 5.8% 6.0% 6.0% 4.9% 3.5% 5.6%LT 9 Months 1.7% 5.8% 5.7% 5.4% 5.1% 3.7% 2.5% 4.7%LT 10 Months 1.3% 9.1% 9.3% 8.3% 7.7% 5.7% 3.4% 7.1%10 + Months 2.0% 9.5% 10.8% 12.2% 10.0% 9.5% 7.3% 9.1%Total 100.0% 100.0% 100.0% 100.0% 100.0% 100.0% 100.0% 100.0%

Savings from Merit Releases based on Expanded Merit Criteria. The 97 Class A-1 drug offenders released through the expansion of the Merit Time program left DOCS custody at an average of 41.5 months before their parole eligibility dates (see Table 13B). The savings generated by these early releases can be estimated by using a maintenance cost of $29,000 per inmate per year for the estimated 41.5 months of additional incarceration, which produces a savings of $100,292 per inmate. This is a savings of approximately $10 million.
Table 13B. Merit Releases to Parole Supervision: 2003 to 2006 A-1 Drug Number of Months Released Before Parole Eligibility Date by Release Year
Time from A1 Merit Releases12/31/2006 Latest Release Yearto PE Date 2003 2004 2005 2006 TOTALLT 2 Months 2 0 0 0 2LT 6 Months 1 0 0 0 1LT 7 Months 2 0 0 0 2LT 9 Months 1 0 0 0 1LT 10 Months 0 0 1 0 110 + Months 46 28 8 8 90Total 52 28 9 8 9Average 36.6 54.3 49.9 19.7 41.5Median 31.0 53.5 60.0 20.1 37.3LT 2 Months 3.8% 0.0% 0.0% 0.0% 2.1%LT 6 Months 1.9% 0.0% 0.0% 0.0% 1.0%LT 7 Months 3.8% 0.0% 0.0% 0.0% 2.1%LT 9 Months 1.9% 0.0% 0.0% 0.0% 1.0%LT 10 Months 0.0% 0.0% 11.1% 0.0% 1.0%10 + Months 88.5% 100.0% 88.9% 100.0% 92.8%Total 100.0% 100.0% 100.0% 100.0% 100.0%
7
13

Savings from Supplemental Merit Releases. The 1,847 supplemental merit releases were released before their regular merit dates. On average, supplemental merit cases were released 14.1 months before their parole eligibility date (see table 13C). The savings generated by these early releases can be estimated by using a maintenance cost of $29,000 per inmate per year for the estimated fourteen months of additional incarceration, which produces a savings of $34,075 per inmate. This is a savings of nearly $63 million. These supplemental merit cases were released on average 5.9 months before their merit dates. The result was a savings of $14,258 per inmate greater than what could have been realized if all of the 1,847 were released on their merit dates. Total additional savings were $26 million.
Table 13C. Supplemental Merit Releases to Parole Supervision: Number of Months Released Before Parole Eligibility Date by Release Year
Time From Release Supplemental Merit to PE Date 2005 2006 TOTALLT 1 Month 2 0 2LT 2 Months 5 2 7LT 3 Months 4 7 11LT 4 Months 5 8 13LT 5 Months 19 37 56LT 6 Months 21 28 49LT 7 Months 31 38 69LT 8 Months 28 32 60LT 9 Months 63 80 143LT 10 Months 41 30 7110 + Months 635 731 1,366Total 854 993 1,847Average 14.2 14.0 14.1Median 13.5 12.2 12.8LT 1 Month 0.2% 0.0% 0.1%LT 2 Months 0.6% 0.2% 0.4%LT 3 Months 0.5% 0.7% 0.6%LT 4 Months 0.6% 0.8% 0.7%LT 5 Months 2.2% 3.7% 3.0%LT 6 Months 2.5% 2.8% 2.7%LT 7 Months 3.6% 3.8% 3.7%LT 8 Months 3.3% 3.2% 3.2%LT 9 Months 7.4% 8.1% 7.7%LT 10 Months 4.8% 3.0% 3.8%10 + Months 74.4% 73.6% 74.0%Total 100.0% 100.0% 100.0%
14

15
Total Operational Savings. Combining the operational savings of $299 million for the Original Criteria merit releases with the $10 million in operational savings for the A1 Drug merit releases and $63 million for the supplemental merit releases results in a total operational savings of approximately $372 million since the inception of the Merit Program. Construction Avoidance Savings The Research Division decided that beginning January 1, 2001, avoidance of capital expenditure should not be credited to programs until the Department either makes plans for new construction or makes double bunks, placed into emergency status, operational once again. Capital costs avoided and accrued prior to January 1, 2001 continue to be reported. Therefore, construction avoidance savings calculations are based on the 7,647 early releases between October 1997 and December 2000. Based on a suggestion from auditors in the Office of the State Controller, DOCS’ cost avoidance estimates amortize the cost of building correctional facilities. For the cost avoidance estimates, we have used the $75,975,000 cost of a medium security facility, fully double-bunked with a total capacity of 1,302 inmates, depreciable over thirty years, and a 6.35% interest rate. This method shows a monthly cost of $472,744 per facility, or a monthly cost of $363 per inmate. For a period of 5.4 months (average time saved per inmate for 1997-2000), construction avoidance savings are $1,960 per inmate for each additional inmate who was released early due to the Merit Time Program. Using this model, the 7,647 early releases have reduced the need for capital construction by almost $15 million.
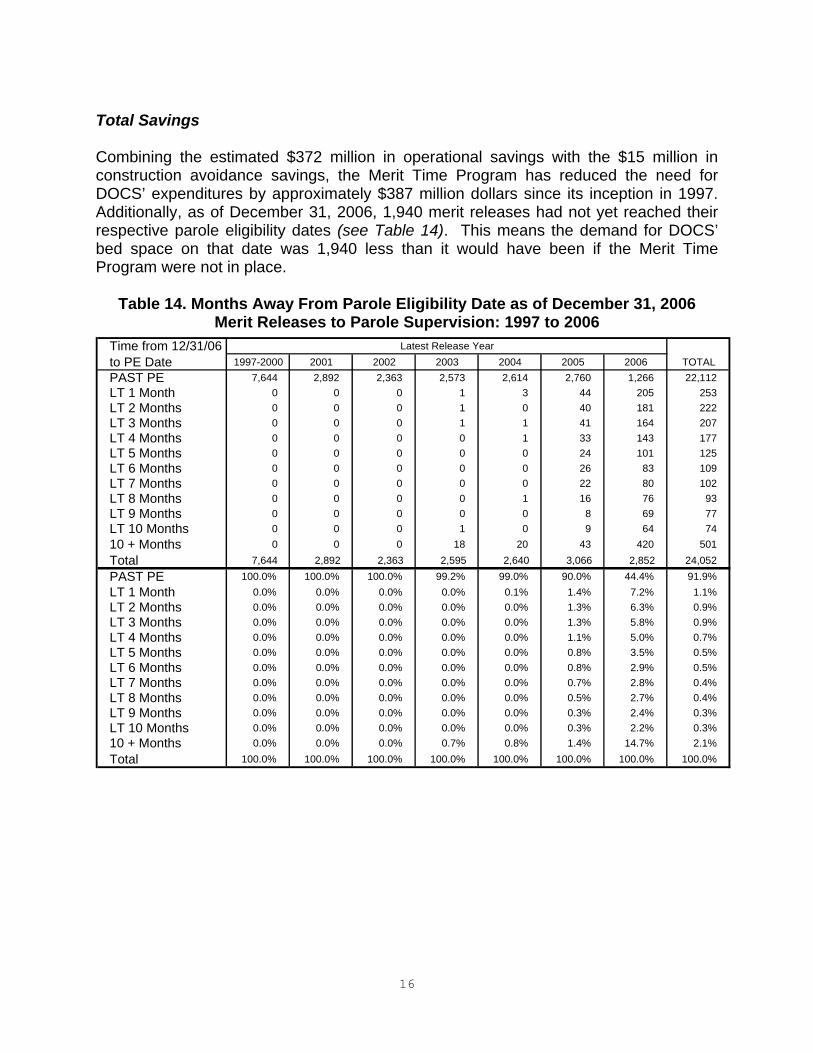
Total Savings Combining the estimated $372 million in operational savings with the $15 million in construction avoidance savings, the Merit Time Program has reduced the need for DOCS’ expenditures by approximately $387 million dollars since its inception in 1997. Additionally, as of December 31, 2006, 1,940 merit releases had not yet reached their respective parole eligibility dates (see Table 14). This means the demand for DOCS’ bed space on that date was 1,940 less than it would have been if the Merit Time Program were not in place.
Table 14. Months Away From Parole Eligibility Date as of December 31, 2006 Merit Releases to Parole Supervision: 1997 to 2006
16
923
7774
Time from 12/31/06 Latest Release Yearto PE Date 1997-2000 2001 2002 2003 2004 2005 2006 TOTALPAST PE 7,644 2,892 2,363 2,573 2,614 2,760 1,266 22,112LT 1 Month 0 0 0 1 3 44 205 253LT 2 Months 0 0 0 1 0 40 181 222LT 3 Months 0 0 0 1 1 41 164 207LT 4 Months 0 0 0 0 1 33 143 177LT 5 Months 0 0 0 0 0 24 101 125LT 6 Months 0 0 0 0 0 26 83 10LT 7 Months 0 0 0 0 0 22 80 10LT 8 Months 0 0 0 0 1 16 76 9LT 9 Months 0 0 0 0 0 8 69LT 10 Months 0 0 0 1 0 9 6410 + Months 0 0 0 18 20 43 420 501Total 7,644 2,892 2,363 2,595 2,640 3,066 2,852 24,052PAST PE 100.0% 100.0% 100.0% 99.2% 99.0% 90.0% 44.4% 91.9%LT 1 Month 0.0% 0.0% 0.0% 0.0% 0.1% 1.4% 7.2% 1.1%LT 2 Months 0.0% 0.0% 0.0% 0.0% 0.0% 1.3% 6.3% 0.9%LT 3 Months 0.0% 0.0% 0.0% 0.0% 0.0% 1.3% 5.8% 0.9%LT 4 Months 0.0% 0.0% 0.0% 0.0% 0.0% 1.1% 5.0% 0.7%LT 5 Months 0.0% 0.0% 0.0% 0.0% 0.0% 0.8% 3.5% 0.5%LT 6 Months 0.0% 0.0% 0.0% 0.0% 0.0% 0.8% 2.9% 0.5%LT 7 Months 0.0% 0.0% 0.0% 0.0% 0.0% 0.7% 2.8% 0.4%LT 8 Months 0.0% 0.0% 0.0% 0.0% 0.0% 0.5% 2.7% 0.4%LT 9 Months 0.0% 0.0% 0.0% 0.0% 0.0% 0.3% 2.4% 0.3%LT 10 Months 0.0% 0.0% 0.0% 0.0% 0.0% 0.3% 2.2% 0.3%10 + Months 0.0% 0.0% 0.0% 0.7% 0.8% 1.4% 14.7% 2.1%Total 100.0% 100.0% 100.0% 100.0% 100.0% 100.0% 100.0% 100.0%

17
MERIT TIME PROGRAM FOLLOW-UP STUDY Follow-up Method The Merit Time follow-up procedure is the same as that employed in other Department recidivism studies2. In most program follow-up studies, comparisons are made between successful program participants and unsuccessful participants. The outcome measure which is used for this comparison is a return to state prison during the follow-up period. The Merit Time Program lends itself to such comparisons depending on the result of the merit hearing process. Inmates are evaluated by the Parole Board and are either approved or denied for merit release. In order to compare merit releases with other groups of released inmates, additional comparison groups are included in the follow-up study. These comparison groups include inmates eligible for the Merit Time Program or the Earned Eligibility Program (EEP)3, as well as inmates who are ineligible for both EEP and Merit Time. Specifically, the following groups are included as comparisons to Merit Releases: 1) Merit approvals denied release, 2) Merit approvals that were not released before parole eligibility date, 3) Shock Graduates4, 4) non-Merit EEP approvals, 5) non-Merit EEP denials, 6) non-violent felony offenders who were not eligible for EEP, 7) violent felony offenders (VFOs) who were ineligible for both EEP and Merit Time, and 8) Returned Parole Violators (RPVs) (see Table 15). The statistical method of Survival Analysis was used to calculate the probability of return to the Department between the different comparison groups. This method calculates the cumulative rate of return across groups while controlling for the number of cases at risk. Follow-up Population This year’s report includes individuals who were released from the Department’s custody between October 1997 and December 2005. The release years are selected to provide the most recent review possible while having a long enough period of exposure time to obtain reliable results.
2 Refer to “2002 Releases: Three Year Post Release Follow-Up”, prepared by Leslie Kellam of the DOCS’ Research Unit (2006). 3 The Earned Eligibility Program, established in 1987, increases the likelihood of an inmate being released at his or her initial parole hearing if certain eligibility and programmatic criteria have been met. An inmate must have a minimum sentence of no longer than 8 years and must have demonstrated an acceptable level of progress and participation in appropriate programs to receive a Certificate of Earned Eligibility (see “Earned Eligibility Program Summary: Semiannual Report April 2006 to September 2006”, prepared by Lorraine Hogan of the DOCS’ Research Unit, 2007.). 4 The Shock Incarceration Program is a six-month program of intensive physical training, educational programming, counseling and drug treatment that offers inmates the possibility of early release. Most inmates who successfully complete this program are approved by the Board of Parole for release to parole supervision prior to serving their full minimum sentence (see “Nineteenth Annual Shock Legislative Report, 2007”, prepared by Leslie Kellam of the DOCS’ Research Unit, 2007).
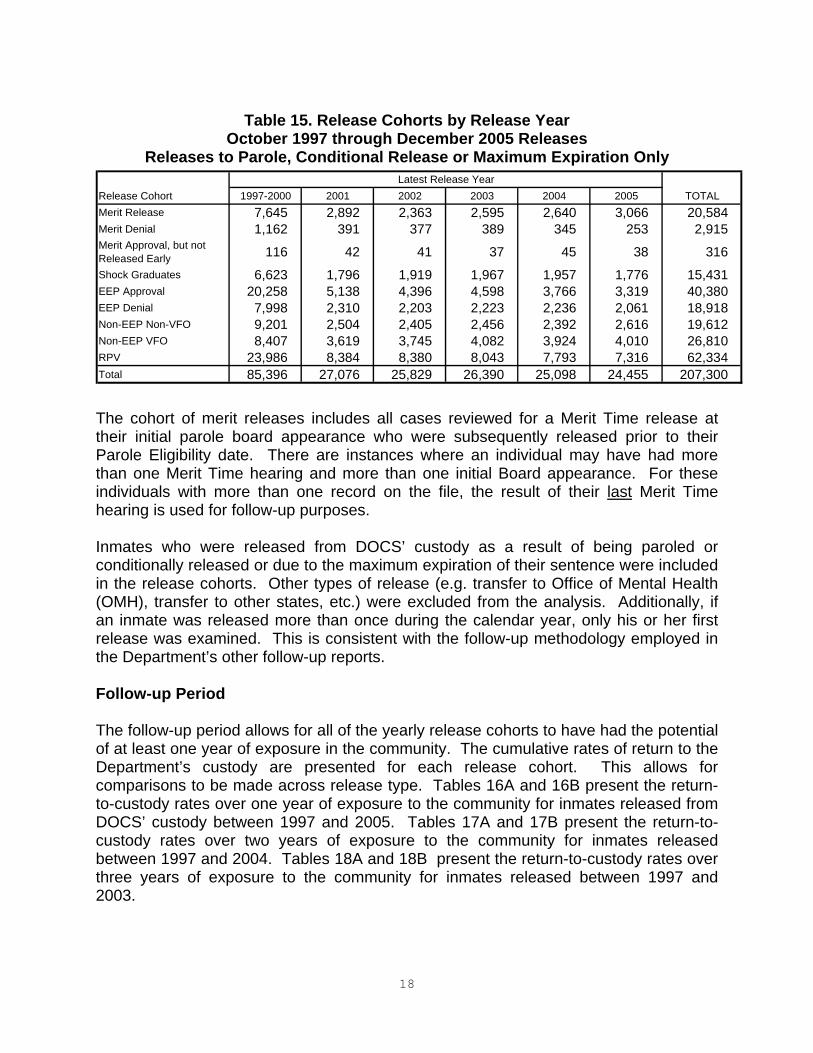
Table 15. Release Cohorts by Release Year
October 1997 through December 2005 Releases Releases to Parole, Conditional Release or Maximum Expiration Only
Latest Release YearRelease Cohort 1997-2000 2001 2002 2003 2004 2005 TOTALMerit Release 7,645 2,892 2,363 2,595 2,640 3,066 20,584Merit Denial 1,162 391 377 389 345 253 2,915Merit Approval, but not Released Early 116 42 41 37 45 38 316Shock Graduates 6,623 1,796 1,919 1,967 1,957 1,776 15,431EEP Approval 20,258 5,138 4,396 4,598 3,766 3,319 40,380EEP Denial 7,998 2,310 2,203 2,223 2,236 2,061 18,918Non-EEP Non-VFO 9,201 2,504 2,405 2,456 2,392 2,616 19,612Non-EEP VFO 8,407 3,619 3,745 4,082 3,924 4,010 26,810RPV 23,986 8,384 8,380 8,043 7,793 7,316 62,334Total 85,396 27,076 25,829 26,390 25,098 24,455 207,300
The cohort of merit releases includes all cases reviewed for a Merit Time release at their initial parole board appearance who were subsequently released prior to their Parole Eligibility date. There are instances where an individual may have had more than one Merit Time hearing and more than one initial Board appearance. For these individuals with more than one record on the file, the result of their last Merit Time hearing is used for follow-up purposes. Inmates who were released from DOCS’ custody as a result of being paroled or conditionally released or due to the maximum expiration of their sentence were included in the release cohorts. Other types of release (e.g. transfer to Office of Mental Health (OMH), transfer to other states, etc.) were excluded from the analysis. Additionally, if an inmate was released more than once during the calendar year, only his or her first release was examined. This is consistent with the follow-up methodology employed in the Department’s other follow-up reports. Follow-up Period The follow-up period allows for all of the yearly release cohorts to have had the potential of at least one year of exposure in the community. The cumulative rates of return to the Department’s custody are presented for each release cohort. This allows for comparisons to be made across release type. Tables 16A and 16B present the return-to-custody rates over one year of exposure to the community for inmates released from DOCS’ custody between 1997 and 2005. Tables 17A and 17B present the return-to-custody rates over two years of exposure to the community for inmates released between 1997 and 2004. Tables 18A and 18B present the return-to-custody rates over three years of exposure to the community for inmates released between 1997 and 2003.
18

19
One Year Out Follow-up Results Table 16A shows the number of inmates tracked according to release cohort and the cumulative rate of return after one year of exposure in the community for merit releases and for selected comparison groups from 1997 through 2005. Inmates released with a Merit Time approval were returned to custody at lower rates than most other release cohorts (see Table 16B). Inmates with a merit approval who were released prior to their parole eligibility date were returned at a rate of 11%, while non-Merit first releases were returned at a rate of 18% (see Table 16B category Subtotal All Comparison Groups, near the bottom of the table). The only release cohort that returned to custody at a lower rate than the Merit Time releases was Shock Graduates (6%). Shock Graduates have a low return-to-custody rate because of the specialized program they must successfully complete prior to early release to parole supervision5. Since 1997, the proportion of merit releases that were returned to custody as New Court Commitments (for a new crime) has steadily decreased, from 5% in 1997 to 2% since 2001 (see Table 16B). Overall, Shock Graduates and Merit Releases were returned to custody within one year as new court commitments 3% of the time.
5 Refer to “Nineteenth Annual Shock Legislative Report, 2007”, prepared by Leslie Kellam of the DOCS’ Research Unit, (2007).

Table 16A. Release Cohorts by Release Year October 1997 through December 2005 Releases
Releases to Parole, Conditional Release or Maximum Expiration Only Number Returned to Custody Within 1 Year of Release
20
22
19
43
27
1997 1998 1999 2000 2001 2002 2003 2004 2005Merit Approval and Release
Total Released 617 2,239 2,219 2,569 2,892 2,363 2,595 2,640 3,066 21,200Total Returned 80 202 226 281 299 234 310 305 376 2,313Returned as New Commitment 29 72 58 66 68 55 55 51 69 523Returned as RPV 51 130 168 215 231 179 252 254 307 1,787
Merit DenialTotal Released 2 287 468 405 391 377 389 345 253 2,917Total Returned 0 41 83 67 74 69 68 70 50 5Returned as New Commitment 0 6 20 13 14 14 15 13 5 100Returned as RPV 0 35 63 54 60 55 53 57 45 422
Merit Approval, but not Released Early
Total Released 3 25 47 41 42 41 37 45 38 3Total Returned 1 1 8 7 10 6 7 6 9 55Returned as New Commitment 0 0 3 2 3 0 1 1 2 12Returned as RPV 1 1 5 5 7 6 6 5 7
Shock GraduatesTotal Released 607 2,031 1,998 1,987 1,787 1,919 1,967 1,957 1,776 16,029Total Returned 23 116 135 97 104 97 101 124 96 893Returned as New Commitment 12 69 71 50 52 46 52 63 51 466Returned as RPV 11 47 64 47 52 51 49 61 45 4
EEP Approval (non-Merit)Total Released 1,095 7,493 5,720 5,950 5,138 4,396 4,598 3,766 3,319 41,475Total Returned 244 805 759 854 724 605 785 609 541 5,926Returned as New Commitment 39 223 146 177 147 125 107 91 91 1,146Returned as RPV 205 582 613 677 577 480 678 518 450 4,780
EEP Denial (non-Merit)Total Released 113 2,471 2,883 2,531 2,310 2,203 2,223 2,236 2,061 19,031Total Returned 52 444 555 500 386 378 385 380 356 3,436Returned as New Commitment 7 75 96 80 67 62 66 70 42 565Returned as RPV 45 369 459 420 320 316 319 310 314 2,872
Non-EEP Non-VFOTotal Released 1,962 1,995 2,300 2,944 2,504 2,405 2,456 2,392 2,616 21,574Total Returned 203 315 461 520 399 411 440 386 522 3,657Returned as New Commitment 86 73 73 101 54 62 70 62 67 648Returned as RPV 117 242 388 419 345 349 370 324 455 3,009
Non-EEP VFOTotal Released 977 1,939 2,378 3,113 3,619 3,745 4,082 3,924 4,010 27,787Total Returned 114 302 306 379 335 481 491 415 487 3,310Returned as New Commitment 36 52 44 63 55 69 84 60 69 532Returned as RPV 78 250 262 316 290 412 407 355 418 2,788
Returned Parole Violator*Total Released 1,568 6,380 7,791 8,247 8,384 8,380 8,043 7,793 7,316 63,902Total Returned 336 1,317 1,950 2,087 2,017 1,922 2,293 2,148 2,199 16,269Returned as New Commitment 89 302 419 415 376 357 334 280 257 2,829Returned as RPV 247 1,015 1,531 1,672 1,641 1,565 1,959 1,868 1,942 13,440
Sub-Total All Comparison GroupsTotal Released 6,327 22,621 23,585 25,218 24,175 23,466 23,795 22,458 21,389 193,034Total Returned 973 3,341 4,257 4,511 4,060 3,969 4,570 4,138 4,260 34,079Returned as New Commitment 269 800 872 901 768 735 729 640 584 6,298Returned as RPV 704 2,541 3,385 3,610 3,292 3,234 3,841 3,498 3,676 27,781
TotalTotal Released 6,944 24,860 25,804 27,787 27,067 25,829 26,390 25,098 24,455 214,234Total Returned** 1,053 3,543 4,483 4,792 4,359 4,203 4,877 4,443 4,636 36,389Returned as New Commitment 298 872 930 967 836 790 784 691 653 6,821Returned as RPV 755 2,671 3,553 3,825 3,523 3,413 4,093 3,752 3,983 29,568
Release Cohort TotalRelease Year
* Returned Parole Violators (RPVs) were previously released from DOCS. Prior to their release in their current release cohort, they were admitted as RPVs for technical parole violations.

Table 16B. Release Cohorts by Release Year - Percent Percent Returned to Custody Within 1 Year of Release
Release Year1997 1998 1999 2000 2001 2002 2003 2004 2005
Merit Approval and ReleasePercent Returned 13.0% 9.0% 10.2% 10.9% 10.3% 9.9% 11.9% 11.6% 12.3% 10.9%Percent New Commitment 4.7% 3.2% 2.6% 2.6% 2.4% 2.3% 2.1% 1.9% 2.3% 2.5%Percent as RPV 8.3% 5.8% 7.6% 8.4% 8.0% 7.6% 9.7% 9.6% 10.0% 8.4%
Merit DenialPercent Returned 0.0% 14.3% 17.7% 16.5% 18.9% 18.3% 17.5% 20.3% 19.8% 17.9%Percent New Commitment 0.0% 2.1% 4.3% 3.2% 3.6% 3.7% 3.9% 3.8% 2.0% 3.4%Percent as RPV 0.0% 12.2% 13.5% 13.3% 15.3% 14.6% 13.6% 16.5% 17.8% 14.5%
Merit Approval, but not Released Early
Percent Returned 33.3% 4.0% 17.0% 17.1% 23.8% 14.6% 18.9% 13.3% 23.7% 17.2%Percent New Commitment 0.0% 0.0% 6.4% 4.9% 7.1% 0.0% 2.7% 2.2% 5.3% 3.8%Percent as RPV 33.3% 4.0% 10.6% 12.2% 16.7% 14.6% 16.2% 11.1% 18.4% 13.5%
Shock GraduatesPercent Returned 3.8% 5.7% 6.8% 4.9% 5.8% 5.1% 5.1% 6.3% 5.4% 5.6%Percent New Commitment 2.0% 3.4% 3.6% 2.5% 2.9% 2.4% 2.6% 3.2% 2.9% 2.9%Percent as RPV 1.8% 2.3% 3.2% 2.4% 2.9% 2.7% 2.5% 3.1% 2.5% 2.7%
EEP Approval (non-Merit)Percent Returned 22.3% 10.7% 13.3% 14.4% 14.1% 13.8% 17.1% 16.2% 16.3% 14.3%Percent New Commitment 3.6% 3.0% 2.6% 3.0% 2.9% 2.8% 2.3% 2.4% 2.7% 2.8%Percent as RPV 18.7% 7.8% 10.7% 11.4% 11.2% 10.9% 14.7% 13.8% 13.6% 11.5%
EEP Denial (non-Merit)Percent Returned 46.0% 18.0% 19.3% 19.8% 16.7% 17.2% 17.3% 17.0% 17.3% 18.1%Percent New Commitment 6.2% 3.0% 3.3% 3.2% 2.9% 2.8% 3.0% 3.1% 2.0% 3.0%Percent as RPV 39.8% 14.9% 15.9% 16.6% 13.9% 14.3% 14.3% 13.9% 15.2% 15.1%
Non-EEP Non-VFOPercent Returned 10.3% 15.8% 20.0% 17.7% 15.9% 17.1% 17.9% 16.1% 20.0% 17.0%Percent New Commitment 4.4% 3.7% 3.2% 3.4% 2.2% 2.6% 2.9% 2.6% 2.6% 3.0%Percent as RPV 6.0% 12.1% 16.9% 14.2% 13.8% 14.5% 15.1% 13.5% 17.4% 13.9%
Non-EEP VFOPercent Returned 11.7% 15.6% 12.9% 12.2% 9.3% 12.8% 12.0% 10.6% 12.1% 11.9%Percent New Commitment 3.7% 2.7% 1.9% 2.0% 1.5% 1.8% 2.1% 1.5% 1.7% 1.9%Percent as RPV 8.0% 12.9% 11.0% 10.2% 8.0% 11.0% 10.0% 9.0% 10.4% 10.0%
Returned Parole Violator*Percent Returned 21.4% 20.6% 25.0% 25.3% 24.1% 22.9% 28.5% 27.6% 30.1% 25.5%Percent New Commitment 5.7% 4.7% 5.4% 5.0% 4.5% 4.3% 4.2% 3.6% 3.5% 4.4%Percent as RPV 15.8% 15.9% 19.7% 20.3% 19.6% 18.7% 24.4% 24.0% 26.5% 21.0%
Sub-Total All Comparison GroupsPercent Returned 15.4% 14.8% 18.0% 17.9% 16.8% 16.9% 19.2% 18.4% 19.9% 17.7%Percent New Commitment 4.3% 3.5% 3.7% 3.6% 3.2% 3.1% 3.1% 2.8% 2.7% 3.3%Percent as RPV 11.1% 11.2% 14.4% 14.3% 13.6% 13.8% 16.1% 15.6% 17.2% 14.4%
TotalPercent Returned 15.2% 14.3% 17.4% 17.2% 16.1% 16.3% 18.5% 17.7% 19.0% 17.0%Percent New Commitment 4.3% 3.5% 3.6% 3.5% 3.1% 3.1% 3.0% 2.8% 2.7% 3.2%Percent as RPV 10.9% 10.7% 13.8% 13.8% 13.0% 13.2% 15.5% 14.9% 16.3% 13.8%
Release Cohort Total
* Returned Parole Violators (RPVs) were previously released from DOCS. Prior to their release in their current release cohort, they were admitted as RPVs for technical parole violations.
21

22
Two Year Out Follow-up Results Table 17A shows the number of inmates tracked according to release cohort and Table 17B shows the cumulative rate of return after two years of exposure in the community for merit releases and for selected comparison groups from 1997 through 2004. Inmates with a merit approval who were released prior to their parole eligibility date were returned at a rate of 23% within two years, while non-Merit first releases were returned at a rate of 31% (see Table 17B, Subtotal All Comparison Groups). After two years of exposure in the community, the only release cohort that returned to custody at a lower rate than Merit Time releases was Shock Graduates (16%). Shock Graduates are expected to have a low return-to-custody rate because of the specialized program they must successfully complete before early release to parole supervision. Although Shock Graduates were less likely overall to return to custody, they were more likely (8%) than Merit Releases (6%) to return as new court commitments.

Table 17A. Release Cohorts by Release Year: October 1997 to December 2004 Releases Releases to Parole, Conditional Release or Maximum Expiration Only
Number Returned to Custody Within 2 Years of Release
23
81
1997 1998 1999 2000 2001 2002 2003 2004Merit Approval and Release
Total Released 617 2,239 2,219 2,569 2,892 2,363 2,595 2,640 18,134Total Returned 199 505 476 623 702 564 645 518 4,232Returned as New Commitment 66 172 142 160 165 141 147 113 1,106Returned as RPV 133 333 334 463 537 423 498 405 3,126
Merit DenialTotal Released 2 287 468 405 391 377 389 345 2,664Total Returned 0 92 162 137 139 139 121 98 888Returned as New Commitment 0 20 52 36 27 30 33 21 219Returned as RPV 0 72 110 101 112 109 88 77 669
Merit Approval, but not Released Early
Total Released 3 25 47 41 42 41 37 45 2Total Returned 1 8 11 16 13 14 9 7 79Returned as New Commitment 0 1 3 4 3 2 1 1 15Returned as RPV 1 7 8 12 10 12 8 6 64
Shock GraduatesTotal Released 607 2,031 1,998 1,987 1,787 1,919 1,967 1,957 14,253Total Returned 89 357 354 328 302 268 310 217 2,225Returned as New Commitment 41 171 163 148 151 126 161 114 1,075Returned as RPV 48 186 191 180 151 142 149 103 1,150
EEP Approval (non-Merit)Total Released 1,095 7,493 5,720 5,950 5,138 4,396 4,598 3,766 38,156Total Returned 433 2,160 1,673 1,848 1,599 1,352 1,474 946 11,485Returned as New Commitment 94 629 416 446 378 308 315 189 2,775Returned as RPV 339 1,531 1,257 1,402 1,221 1,044 1,159 757 8,710
EEP Denial (non-Merit)Total Released 113 2,471 2,883 2,531 2,310 2,203 2,223 2,236 16,970Total Returned 67 837 956 868 673 667 701 514 5,283Returned as New Commitment 11 215 219 202 190 181 191 127 1,336Returned as RPV 56 622 737 666 483 486 510 387 3,947
Non-EEP Non-VFOTotal Released 1,962 1,995 2,300 2,944 2,504 2,405 2,456 2,392 18,958Total Returned 521 586 777 895 724 680 736 579 5,498Returned as New Commitment 191 186 196 220 172 174 181 129 1,449Returned as RPV 330 400 581 675 552 506 555 450 4,049
Non-EEP VFOTotal Released 977 1,939 2,378 3,113 3,619 3,745 4,082 3,924 23,777Total Returned 283 596 624 695 673 933 1,019 711 5,534Returned as New Commitment 86 141 161 182 180 213 278 141 1,382Returned as RPV 197 455 463 513 493 720 741 570 4,152
Returned Parole Violator*Total Released 1,568 6,380 7,791 8,247 8,384 8,380 8,043 7,793 56,586Total Returned 621 2,497 3,136 3,303 3,293 3,208 3,397 2,829 22,284Returned as New Commitment 212 884 993 980 975 900 833 523 6,300Returned as RPV 409 1,613 2,143 2,323 2,318 2,308 2,564 2,306 15,984
Sub-Total All Comparison GroupsTotal Released 6,327 22,621 23,585 25,218 24,175 23,466 23,795 22,458 171,645Total Returned 2,015 7,133 7,693 8,090 7,416 7,261 7,767 5,901 53,276Returned as New Commitment 635 2,247 2,203 2,218 2,076 1,934 1,993 1,245 14,551Returned as RPV 1,380 4,886 5,490 5,872 5,340 5,327 5,774 4,656 38,725
TotalTotal Released 6,944 24,860 25,804 27,787 27,067 25,829 26,390 25,098 189,779Total Returned** 2,214 7,638 8,169 8,713 8,118 7,825 8,412 6,419 57,508Returned as New Commitment 701 2,419 2,345 2,378 2,241 2,075 2,140 1,358 15,657Returned as RPV 1,513 5,219 5,824 6,335 5,877 5,750 6,272 5,061 41,851
Release Cohort TotalRelease Year
* Returned Parole Violators (RPVs) were previously released from DOCS. Prior to their release in their current release cohort, they were admitted as RPVs for technical parole violations.

Table 17B. Release Cohorts by Release Year – Percent October 1997 through December 2004 Releases
Releases to Parole, Conditional Release or Maximum Expiration Only Percent Returned to Custody Within 2 Years of Release
Release Year1997 1998 1999 2000 2001 2002 2003 2004
Merit Approval and ReleasePercent Returned 32.3% 22.6% 21.5% 24.3% 24.3% 23.9% 24.9% 19.6% 23.3%Percent New Commitment 10.7% 7.7% 6.4% 6.2% 5.7% 6.0% 5.7% 4.3% 6.1%Percent as RPV 21.6% 14.9% 15.1% 18.0% 18.6% 17.9% 19.2% 15.3% 17.2%
Merit DenialPercent Returned 0.0% 32.1% 34.6% 33.8% 35.5% 36.9% 31.1% 28.4% 33.3%Percent New Commitment 0.0% 7.0% 11.1% 8.9% 6.9% 8.0% 8.5% 6.1% 8.2%Percent as RPV 0.0% 25.1% 23.5% 24.9% 28.6% 28.9% 22.6% 22.3% 25.1%
Merit Approval, but not Released Early
Percent Returned 33.3% 32.0% 23.4% 39.0% 31.0% 34.1% 24.3% 15.6% 28.1%Percent New Commitment 0.0% 4.0% 6.4% 9.8% 7.1% 4.9% 2.7% 2.2% 5.3%Percent as RPV 33.3% 28.0% 17.0% 29.3% 23.8% 29.3% 21.6% 13.3% 22.8%
Shock GraduatesPercent Returned 14.7% 17.6% 17.7% 16.5% 16.9% 14.0% 15.8% 11.1% 15.6%Percent New Commitment 6.8% 8.4% 8.2% 7.4% 8.4% 6.6% 8.2% 5.8% 7.5%Percent as RPV 7.9% 9.2% 9.6% 9.1% 8.4% 7.4% 7.6% 5.3% 8.1%
EEP Approval (non-Merit)Percent Returned 39.5% 28.8% 29.2% 31.1% 31.1% 30.8% 32.1% 25.1% 30.1%Percent New Commitment 8.6% 8.4% 7.3% 7.5% 7.4% 7.0% 6.9% 5.0% 7.3%Percent as RPV 31.0% 20.4% 22.0% 23.6% 23.8% 23.7% 25.2% 20.1% 22.8%
EEP Denial (non-Merit)Percent Returned 59.3% 33.9% 33.2% 34.3% 29.1% 30.3% 31.5% 23.0% 31.1%Percent New Commitment 9.7% 8.7% 7.6% 8.0% 8.2% 8.2% 8.6% 5.7% 7.9%Percent as RPV 49.6% 25.2% 25.6% 26.3% 20.9% 22.1% 22.9% 17.3% 23.3%
Non-EEP Non-VFOPercent Returned 26.6% 29.4% 33.8% 30.4% 28.9% 28.3% 30.0% 24.2% 29.0%Percent New Commitment 9.7% 9.3% 8.5% 7.5% 6.9% 7.2% 7.4% 5.4% 7.6%Percent as RPV 16.8% 20.1% 25.3% 22.9% 22.0% 21.0% 22.6% 18.8% 21.4%
Non-EEP VFOPercent Returned 29.0% 30.7% 26.2% 22.3% 18.6% 24.9% 25.0% 18.1% 23.3%Percent New Commitment 8.8% 7.3% 6.8% 5.8% 5.0% 5.7% 6.8% 3.6% 5.8%Percent as RPV 20.2% 23.5% 19.5% 16.5% 13.6% 19.2% 18.2% 14.5% 17.5%
Returned Parole Violator*Percent Returned 39.6% 39.1% 40.3% 40.1% 39.3% 38.3% 42.2% 36.3% 39.4%Percent New Commitment 13.5% 13.9% 12.7% 11.9% 11.6% 10.7% 10.4% 6.7% 11.1%Percent as RPV 26.1% 25.3% 27.5% 28.2% 27.6% 27.5% 31.9% 29.6% 28.2%
Sub-Total All Comparison Groups
Percent Returned 31.8% 31.5% 32.6% 32.1% 30.7% 30.9% 32.6% 26.3% 31.0%Percent New Commitment 10.0% 9.9% 9.3% 8.8% 8.6% 8.2% 8.4% 5.5% 8.5%Percent as RPV 21.8% 21.6% 23.3% 23.3% 22.1% 22.7% 24.3% 20.7% 22.6%
TotalPercent Returned 31.9% 30.7% 31.7% 31.4% 30.0% 30.3% 31.9% 25.6% 30.3%Percent New Commitment 10.1% 9.7% 9.1% 8.6% 8.3% 8.0% 8.1% 5.4% 8.3%Percent as RPV 21.8% 21.0% 22.6% 22.8% 21.7% 22.3% 23.8% 20.2% 22.1%
Release Cohort Total
*Returned Parole Violators (RPVs) were previously released from DOCS. Prior to their release in their current release cohort, they were admitted as RPVs for technical parole violations.
24

25
Three Year Out Follow-up Results Table 18A shows the number of inmates tracked according to release cohort and Table 18B shows the cumulative rate of return after three years of exposure in the community for merit releases and for selected comparison groups from 1997 through 2003. Inmates with a merit approval who were released prior to their parole eligibility date were returned at a rate of 31% within three years of exposure in the community while all non-Merit first releases returned at a rate of 39% (see Table 18B, Subtotal All Comparison Groups). The only release cohort that returned to custody at a lower rate than Merit Time releases was Shock Graduates (25%). Again, Shock Graduates have a lower return-to-custody rate because of the specialized program they have successfully completed. Although Shock Graduates were less likely overall to return to custody, they were more likely (11%) than Merit Releases (9%) to return as new court commitments. Conclusion Consistently across the one, two and three year follow-ups, merit releases returned to custody at nearly the lowest rate of all of the release cohorts; only Shock Incarceration graduates had lower return rates. Because Shock Graduates are carefully selected individuals who have successfully completed a rigorous, specialized program, it is not surprising that they return to custody at lower rates.

Table 18A. Release Cohorts by Release Year: October 1997 to December 2003 Releases Number Returned to Custody Within 3 Years of Release
26
236
19
1997 1998 1999 2000 2001 2002 2003 TotalMerit Approval and Release
Total Released 617 2,239 2,219 2,569 2,892 2,363 2,595 15,494Total Returned 264 690 630 824 928 749 739 4,824Returned as New Commitment 91 253 199 221 234 210 185 1,393Returned as RPV 173 437 431 603 694 539 554 3,431
Merit DenialTotal Released 2 287 468 405 391 377 389 2,319Total Returned 0 119 196 174 176 158 138 961Returned as New Commitment 0 31 67 55 40 38 41 272Returned as RPV 0 88 129 119 136 120 97 689
Merit Approval, but not Released Early
Total Released 3 25 47 41 42 41 37Total Returned 2 9 13 16 18 19 10 87Returned as New Commitment 0 1 4 4 5 4 1Returned as RPV 2 8 9 12 13 15 9 68
Shock GraduatesTotal Released 607 2,031 1,998 1,987 1,787 1,919 1,967 12,296Total Returned 137 539 527 517 474 439 398 3,031Returned as New Commitment 64 240 235 224 226 207 196 1,392Returned as RPV 73 299 292 293 248 232 202 1,639
EEP Approval (non-Merit)Total Released 1,095 7,493 5,720 5,950 5,138 4,396 4,598 34,390Total Returned 519 2,745 2,107 2,323 2,008 1,663 1,677 13,042Returned as New Commitment 131 850 586 611 526 422 392 3,518Returned as RPV 388 1,895 1,521 1,712 1,482 1,241 1,285 9,524
EEP Denial (non-Merit)Total Released 113 2,471 2,883 2,531 2,310 2,203 2,223 14,734Total Returned 72 1,007 1,132 1,020 860 801 769 5,661Returned as New Commitment 14 313 321 287 286 265 222 1,708Returned as RPV 58 694 811 733 574 536 547 3,953
Non-EEP Non-VFOTotal Released 1,962 1,995 2,300 2,944 2,504 2,405 2,456 16,566Total Returned 674 700 897 1,060 861 806 822 5,820Returned as New Commitment 258 269 270 319 262 256 235 1,869Returned as RPV 416 431 627 741 599 550 587 3,951
Non-EEP VFOTotal Released 977 1,939 2,378 3,113 3,619 3,745 4,082 19,853Total Returned 348 727 796 884 1,198 1,186 1,197 6,336Returned as New Commitment 120 213 231 272 351 321 352 1,860Returned as RPV 228 514 565 612 847 865 845 4,476
Returned Parole Violator*Total Released 1,568 6,380 7,791 8,247 8,384 8,380 8,043 48,793Total Returned 759 2,986 3,658 3,892 3,873 3,821 3,710 22,699Returned as New Commitment 318 1,227 1,348 1,514 1,369 1,318 1,014 8,108Returned as RPV 441 1,759 2,310 2,565 2,504 2,503 2,696 14,778
Sub-Total All Comparison GroupsTotal Released 6,327 22,621 23,585 25,218 24,175 23,466 23,795 149,187Total Returned 2,511 8,832 9,326 9,886 9,468 8,893 8,721 57,637Returned as New Commitment 905 3,144 3,062 3,286 3,065 2,831 2,453 18,746Returned as RPV 1,606 5,688 6,264 6,787 6,403 6,062 6,268 39,078
TotalTotal Released 6,944 24,860 25,804 27,787 27,067 25,829 26,390 164,681Total Returned 2,775 9,522 9,956 10,710 10,396 9,642 9,460 62,461Returned as New Commitment 996 3,397 3,261 3,507 3,299 3,041 2,638 20,139Returned as RPV 1,779 6,125 6,695 7,390 7,097 6,601 6,822 42,509
Release CohortRelease Year
*Returned Parole Violators (RPVs) were previously released from DOCS. Prior to their release in their current release cohort, they were admitted as RPVs for technical parole violations.

Table 18B. Release Cohorts by Release Year - Percent October 1997 through December 2003 Releases
Releases to Parole, Conditional Release or Maximum Expiration Only Percent Returned to Custody Within 3 Years of Release
Release Year1997 1998 1999 2000 2001 2002 2003
Merit Approval and ReleasePercent Returned 42.8% 30.8% 28.4% 32.1% 32.1% 31.7% 28.5% 31.1%Percent New Commitment 14.7% 11.3% 9.0% 8.6% 8.1% 8.9% 7.1% 9.0%Percent as RPV 28.0% 19.5% 19.4% 23.5% 24.0% 22.8% 21.3% 22.1%
Merit DenialPercent Returned 0.0% 41.5% 41.9% 43.0% 45.0% 41.9% 35.5% 41.4%Percent New Commitment 0.0% 10.8% 14.3% 13.6% 10.2% 10.1% 10.5% 11.7%Percent as RPV 0.0% 30.7% 27.6% 29.4% 34.8% 31.8% 24.9% 29.7%
Merit Approval, but not Released Early
Percent Returned 66.7% 36.0% 27.7% 39.0% 42.9% 46.3% 27.0% 36.9%Percent New Commitment 0.0% 4.0% 8.5% 9.8% 11.9% 9.8% 2.7% 8.1%Percent as RPV 66.7% 32.0% 19.1% 29.3% 31.0% 36.6% 24.3% 28.8%
Shock GraduatesPercent Returned 22.6% 26.5% 26.4% 26.0% 26.5% 22.9% 20.2% 24.7%Percent New Commitment 10.5% 11.8% 11.8% 11.3% 12.6% 10.8% 10.0% 11.3%Percent as RPV 12.0% 14.7% 14.6% 14.7% 13.9% 12.1% 10.3% 13.3%
EEP Approval (non-Merit)Percent Returned 47.4% 36.6% 36.8% 39.0% 39.1% 37.8% 36.5% 37.9%Percent New Commitment 12.0% 11.3% 10.2% 10.3% 10.2% 9.6% 8.5% 10.2%Percent as RPV 35.4% 25.3% 26.6% 28.8% 28.8% 28.2% 27.9% 27.7%
EEP Denial (non-Merit)Percent Returned 63.7% 40.8% 39.3% 40.3% 37.2% 36.4% 34.6% 38.4%Percent New Commitment 12.4% 12.7% 11.1% 11.3% 12.4% 12.0% 10.0% 11.6%Percent as RPV 51.3% 28.1% 28.1% 29.0% 24.8% 24.3% 24.6% 26.8%
Non-EEP Non-VFOPercent Returned 34.4% 35.1% 39.0% 36.0% 34.4% 33.5% 33.5% 35.1%Percent New Commitment 13.1% 13.5% 11.7% 10.8% 10.5% 10.6% 9.6% 11.3%Percent as RPV 21.2% 21.6% 27.3% 25.2% 23.9% 22.9% 23.9% 23.9%
Non-EEP VFOPercent Returned 35.6% 37.5% 33.5% 28.4% 33.1% 31.7% 29.3% 31.9%Percent New Commitment 12.3% 11.0% 9.7% 8.7% 9.7% 8.6% 8.6% 9.4%Percent as RPV 23.3% 26.5% 23.8% 19.7% 23.4% 23.1% 20.7% 22.5%
Returned Parole Violator*Percent Returned 48.4% 46.8% 47.0% 47.2% 46.2% 45.6% 46.1% 46.5%Percent New Commitment 20.3% 19.2% 17.3% 18.4% 16.3% 15.7% 12.6% 16.6%Percent as RPV 28.1% 27.6% 29.6% 31.1% 29.9% 29.9% 33.5% 30.3%
Sub-Total All Comparison GroupsPercent Returned 39.7% 39.0% 39.5% 39.2% 39.2% 37.9% 36.7% 38.6%Percent New Commitment 14.3% 13.9% 13.0% 13.0% 12.7% 12.1% 10.3% 12.6%Percent as RPV 25.4% 25.1% 26.6% 26.9% 26.5% 25.8% 26.3% 26.2%
TotalPercent Returned 40.0% 38.3% 38.6% 38.5% 38.4% 37.3% 35.8% 37.9%Percent New Commitment 14.3% 13.7% 12.6% 12.6% 12.2% 11.8% 10.0% 12.2%Percent as RPV 25.6% 24.6% 25.9% 26.6% 26.2% 25.6% 25.9% 25.8%
Release Cohort Total
* Returned Parole Violators (RPVs) were previously released from DOCS. Prior to their release in their current release cohort, they were admitted as RPVs for technical parole violations.
27

Prepared by:
Dan Bernstein Program Research Specialist III E. Michele Staley Program Research Specialist III Program Planning, Research & Evaluation August 2007


![New York New York [Big Band]](https://static.fdocuments.in/doc/165x107/55cf9017550346703ba2dc98/new-york-new-york-big-band-56499fb54c27d.jpg)