STATE OF NEW HAMPSHIRE HEALTHCARE … of New Hampshire Healthcare-Associated Infections 2016...
155
STATE OF NEW HAMPSHIRE HEALTHCARE-ASSOCIATED INFECTIONS 2016 HOSPITAL REPORT September 1, 2017 New Hampshire Department of Health and Human Services Division of Public Health Services
Transcript of STATE OF NEW HAMPSHIRE HEALTHCARE … of New Hampshire Healthcare-Associated Infections 2016...

STATE OF NEW HAMPSHIRE
HEALTHCARE-ASSOCIATED INFECTIONS 2016 HOSPITAL REPORT
September 1, 2017
New Hampshire Department of Health and Human Services
Division of Public Health Services

State of New Hampshire Healthcare-Associated Infections 2016 Hospital Report
NH Department of Health and Human Services September 1, 2017 Division of Public Health Services
-2-
TABLE OF CONTENTS LIST OF DATA TABLES ..................................................................................................................... 4
LIST OF FIGURES ............................................................................................................................. 5
INDIVIDUAL HOSPITAL REPORTS ................................................................................................... 6
ABBREVIATIONS USED IN THIS DOCUMENT.................................................................................. 7
CONTRIBUTORS AND ACKNOWLEDGMENTS ................................................................................ 8
EXECUTIVE SUMMARY ................................................................................................................... 9
I. INTRODUCTION ......................................................................................................................... 12
A. Purpose ................................................................................................................................. 12
B. Audience................................................................................................................................ 12
C. How to Use this Document ................................................................................................... 12
D. Background on Healthcare-Associated Infections................................................................ 13
E. New Hampshire Healthcare-Associated Infections Program................................................ 13
F. State of New Hampshire Healthcare-Associated Infections Plan ......................................... 14
G. Overview of Healthcare-Associated Infections Prevention Efforts ...................................... 14
H. Healthcare-Associated Infections Technical Advisory Workgroup....................................... 15
II. SURVEILLANCE METHODS ........................................................................................................ 18
A. 2016 Healthcare-Associated Infections Reporting Requirements for New Hampshire
Hospitals .................................................................................................................................... 18
B. Selection of Reporting Requirements ................................................................................... 18
C. Accuracy of Reported Healthcare-Associated Infections Surveillance Data ........................ 20
D. National Healthcare Safety Network .................................................................................... 20
E. Comparisons with National Data........................................................................................... 21
F. Central Line-Associated Bloodstream Infections Surveillance .............................................. 21
G. Central Line Insertion Practices Monitoring ......................................................................... 22
H. Catheter-Associated Urinary Tract Infections Surveillance .................................................. 22
I. Surgical Site Infections Surveillance ....................................................................................... 23
J. Surgical Antimicrobial Prophylaxis Administration Monitoring ............................................ 26
K. Influenza Vaccination Percentage Monitoring...................................................................... 26
III. STATEWIDE DATA .................................................................................................................... 28
A. Statewide Standardized Infection Ratios .............................................................................. 28
B. Overall Standardized Infection Ratios by Hospital................................................................ 31
State of New Hampshire Healthcare-Associated Infections 2016 Hospital Report
NH Department of Health and Human Services September 1, 2017 Division of Public Health Services
-3-
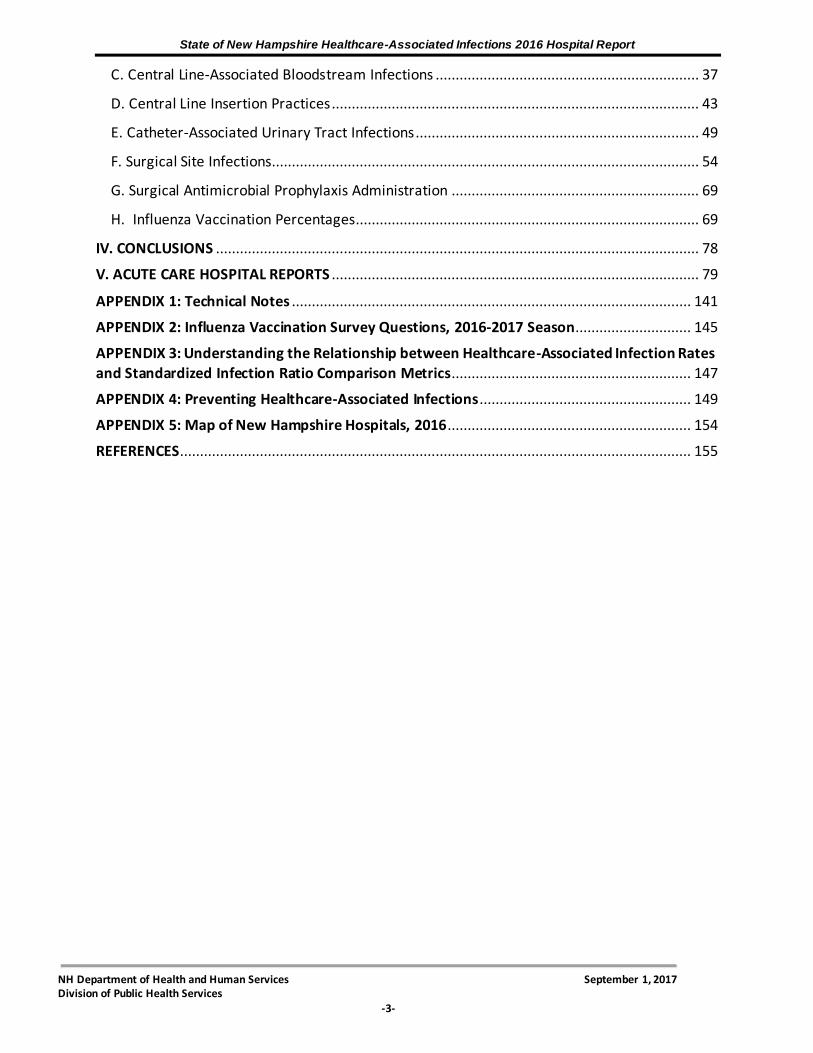
C. Central Line-Associated Bloodstream Infections .................................................................. 37
D. Central Line Insertion Practices ............................................................................................ 43
E. Catheter-Associated Urinary Tract Infections ....................................................................... 49
F. Surgical Site Infections........................................................................................................... 54
G. Surgical Antimicrobial Prophylaxis Administration .............................................................. 69
H. Influenza Vaccination Percentages ...................................................................................... 69
IV. CONCLUSIONS ......................................................................................................................... 78
V. ACUTE CARE HOSPITAL REPORTS ............................................................................................ 79
APPENDIX 1: Technical Notes .................................................................................................... 141
APPENDIX 2: Influenza Vaccination Survey Questions, 2016-2017 Season ............................. 145
APPENDIX 3: Understanding the Relationship between Healthcare-Associated Infection Rates
and Standardized Infection Ratio Comparison Metrics ............................................................ 147
APPENDIX 4: Preventing Healthcare-Associated Infections ..................................................... 149
APPENDIX 5: Map of New Hampshire Hospitals, 2016 ............................................................. 154
REFERENCES ................................................................................................................................ 155
State of New Hampshire Healthcare-Associated Infections 2016 Hospital Report
NH Department of Health and Human Services September 1, 2017 Division of Public Health Services
-4-
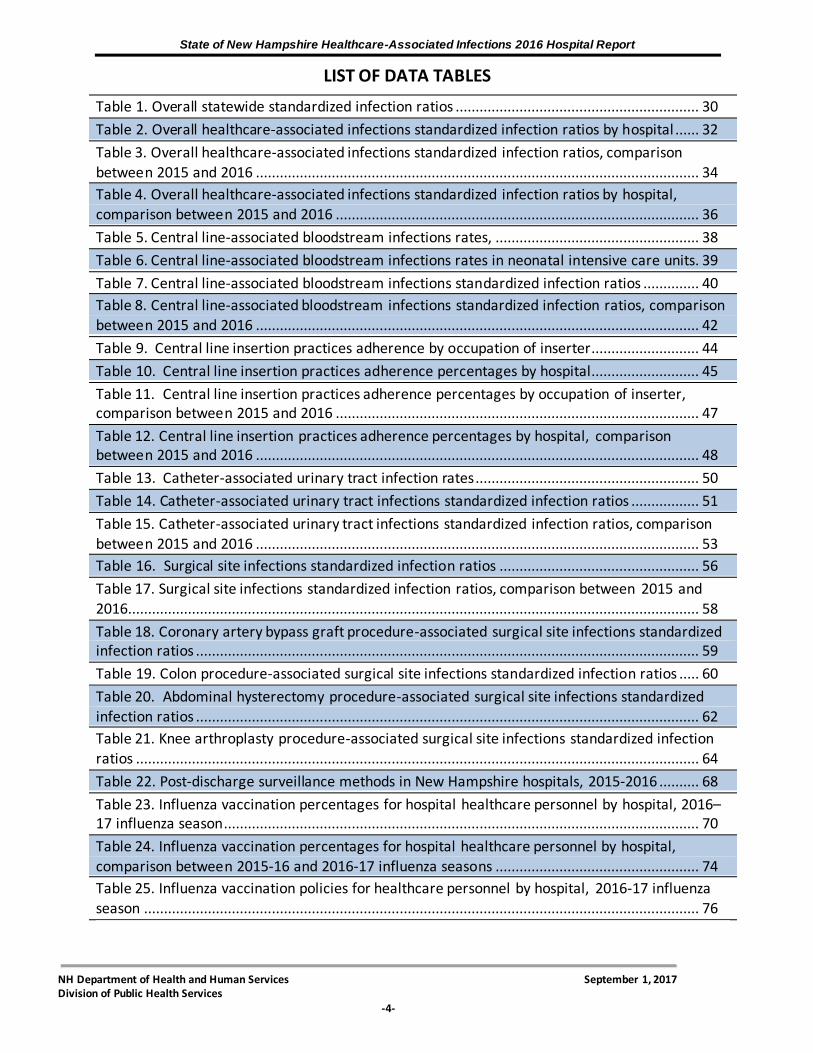
LIST OF DATA TABLES
Table 1. Overall statewide standardized infection ratios ............................................................. 30
Table 2. Overall healthcare-associated infections standardized infection ratios by hospital ...... 32
Table 3. Overall healthcare-associated infections standardized infection ratios, comparison
between 2015 and 2016 ............................................................................................................... 34
Table 4. Overall healthcare-associated infections standardized infection ratios by hospital, comparison between 2015 and 2016 ........................................................................................... 36
Table 5. Central line-associated bloodstream infections rates, ................................................... 38
Table 6. Central line-associated bloodstream infections rates in neonatal intensive care units. 39
Table 7. Central line-associated bloodstream infections standardized infection ratios .............. 40
Table 8. Central line-associated bloodstream infections standardized infection ratios, comparison between 2015 and 2016 ............................................................................................................... 42
Table 9. Central line insertion practices adherence by occupation of inserter........................... 44
Table 10. Central line insertion practices adherence percentages by hospital........................... 45
Table 11. Central line insertion practices adherence percentages by occupation of inserter, comparison between 2015 and 2016 ........................................................................................... 47
Table 12. Central line insertion practices adherence percentages by hospital, comparison between 2015 and 2016 ............................................................................................................... 48
Table 13. Catheter-associated urinary tract infection rates ........................................................ 50
Table 14. Catheter-associated urinary tract infections standardized infection ratios ................. 51
Table 15. Catheter-associated urinary tract infections standardized infection ratios, comparison
between 2015 and 2016 ............................................................................................................... 53
Table 16. Surgical site infections standardized infection ratios .................................................. 56
Table 17. Surgical site infections standardized infection ratios, comparison between 2015 and 2016............................................................................................................................................... 58
Table 18. Coronary artery bypass graft procedure-associated surgical site infections standardized infection ratios .............................................................................................................................. 59
Table 19. Colon procedure-associated surgical site infections standardized infection ratios ..... 60
Table 20. Abdominal hysterectomy procedure-associated surgical site infections standardized infection ratios .............................................................................................................................. 62
Table 21. Knee arthroplasty procedure-associated surgical site infections standardized infection
ratios ............................................................................................................................................. 64
Table 22. Post-discharge surveillance methods in New Hampshire hospitals, 2015-2016 .......... 68
Table 23. Influenza vaccination percentages for hospital healthcare personnel by hospital, 2016–17 influenza season....................................................................................................................... 70
Table 24. Influenza vaccination percentages for hospital healthcare personnel by hospital,
comparison between 2015-16 and 2016-17 influenza seasons ................................................... 74
Table 25. Influenza vaccination policies for healthcare personnel by hospital, 2016-17 influenza
season ........................................................................................................................................... 76

State of New Hampshire Healthcare-Associated Infections 2016 Hospital Report
NH Department of Health and Human Services September 1, 2017 Division of Public Health Services
-5-
LIST OF FIGURES
Figure 1. Types of healthcare-associated infections reported to New Hampshire Department of
Health and Human Services .......................................................................................................... 17
Figure 2. Overall statewide standardized infection ratios............................................................ 31
Figure 3. Overall healthcare-associated infections standardized infection ratios ....................... 33
Figure 4. Statewide standardized infection ratios, comparison between 2011-2016 ................. 35
Figure 5. Central line-associated bloodstream infections standardized infection ratios ............. 41
Figure 6. Overall central line-associated bloodstream infections standardized infection ratios by
year, 2011-2016 ............................................................................................................................ 43
Figure 7. Central line insertion practices adherence percentages by hospital ........................... 46
Figure 8. Catheter-associated urinary tract infections standardized infection ratios .................. 52
Figure 9. Overall catheter-associated urinary tract infections standardized infection ratios by
year, 2012-2016 ............................................................................................................................ 54
Figure 10. Surgical site infections standardized infection ratios ................................................. 57
Figure 11. Coronary artery bypass graft procedure-associated surgical site infections standardized infection ratios ........................................................................................................ 59
Figure 12. Colon procedure-associated surgical site infections standardized infection ratios .... 61
Figure 13. Abdominal hysterectomy procedure-associated surgical site infections standardized infection ratios .............................................................................................................................. 63
Figure 14. Knee arthroplasty procedure-associated surgical site infections standardized
infection ratios .............................................................................................................................. 65
Figure 15. Overall surgical site infection standardized infection ratios by year, 2011-2016 ....... 66
Figure 16. Overall coronary artery bypass graft procedure standardized infection ratios by year,
2011-2016 ..................................................................................................................................... 66
Figure 17. Overall colon procedure standardized infection ratios by year, 2011-2016 ............... 67
Figure 18. Overall abdominal hysterectomy standardized infection ratios by year, 2012-2016 . 67
Figure 19. Overall knee arthroplasty standardized infection ratios by year, 2011-2016 ............. 67
Figure 20. Statewide influenza vaccination percentages for hospital healthcare personnel by
influenza season............................................................................................................................ 69
Figure 21. Influenza vaccination percentages for hospital healthcare personnel by hospital, 2016-17 influenza season ............................................................................................................. 71
Figure 22. Influenza vaccination percentages for hospital healthcare personnel by hospital, 2015-16 and 2016-17 influenza seasons ...................................................................................... 73
Figure 23. Influenza vaccination percentages for hospitals with and without vaccination policies, 2016-17 influenza season ............................................................................................................. 75

State of New Hampshire Healthcare-Associated Infections 2016 Hospital Report
NH Department of Health and Human Services September 1, 2017 Division of Public Health Services
-6-
INDIVIDUAL HOSPITAL REPORTS
Alice Peck Day Memorial Hospital…………………………………………………………………………………………………… 83
Androscoggin Valley Hospital………………………………………………………………………………………………………….. 85
Catholic Medical Center………………………………………………………………………………………………………………….. 87
Cheshire Medical Center…………………………………………………………………………………………………………………. 89
Concord Hospital…………………………………………………………………………………………………………………………….. 91
Cottage Hospital……………………………………………………………………………………………………………………………… 93
Dartmouth-Hitchcock Medical Center…………………………………………………………………………………………….. 95
Elliot Hospital………………………………………………………………………………………………………………………………….. 97
Exeter Hospital……………………………………………………………………………………………………………………………….. 99
Franklin Regional Hospital………………………………………………………………………………………………………………. 101
Frisbie Memorial Hospital……………………………………………………………………………………………………………….. 103
Huggins Hospital…………………………………………………………………………………………………………………………….. 105
Lakes Region General Hospital………………………………………………………………………………………………………… 107
Littleton Regional Hospital………………………………………………………………………………………………………………. 109
Monadnock Community Hospital……………………………………………………………………………………………………. 111
New London Hospital……………………………………………………………………………………………………………………... 113
Parkland Medical Center………………………………………………………………………………………………………………… 115
Portsmouth Regional Hospital………………………………………………………………………………………………………… 117
Southern New Hampshire Medical Center……………………………………………………………………………………… 119
Speare Memorial Hospital………………………………………………………………………………………………………………. 121
St. Joseph Hospital………………………………………………………………………………………………………………………….. 123
The Memorial Hospital……………………………………………………………………………………………………………………. 125
Upper Connecticut Valley Hospital …………………………………………………………………………………………………. 127
Valley Regional Hospital………………………………………………………………………………………………………………….. 129
Weeks Medical Center……………………………………………………………………………………………………………………. 131
Wentworth-Douglass Hospital……………………………………………………………………………………………………….. 133
Crotched Mountain Rehabilitation Center……………………………………………………………………………………… 135
Hampstead Hospital……………………………………………………………………………………………………………………….. 136
HealthSouth Rehabilitation Hospital……………………………………………………………………………………………….. 137
New Hampshire Hospital ……………………………………………………………………………………………………………….. 138
Northeast Rehabilitation Hospital at The Elliot……………………………………………………………………………….. 139
Northeast Rehabilitation Hospital at Pease ……………………………………………………………………………………. 140
Northeast Rehabilitation Hospital, Salem………………………………………………………………………………………… 141
Northeast Rehabilitation Hospital, Southern New Hampshire Medical Center ……………………………….. 142
Note: DHMC refers to Dartmouth-Hitchcock Medical Center (Mary Hitchcock Memorial Hospital). NE Rehab refers to Northeast Rehabilitation Hospital and is presented as four facilities with specified locations. Crotched Mountain refers to Crotched Mountain Rehabilitation Center.

State of New Hampshire Healthcare-Associated Infections 2016 Hospital Report
NH Department of Health and Human Services September 12, 2017 Division of Public Health Services
-7-
ABBREVIATIONS USED IN THIS DOCUMENT
ASA Score American Society of Anesthesiologists (ASA) Classification of Physical Status
ASC Ambulatory surgical center(s)
BSI Bloodstream infection(s)
CABG Coronary artery bypass graft procedure(s)
CAUTI Catheter-associated urinary tract infection(s)
CBGB NHSN operative code for coronary artery bypass graft procedure(s) with both a chest and donor site incision
CBGC NHSN operative code for coronary artery bypass graft procedure(s) with chest incision site only
CCN CMS Certification Number
CDC U.S. Centers for Disease Control and Prevention
CLABSI Central line-associated bloodstream infection(s)
CLIP Central line insertion practices
CMS Centers for Medicare and Medicaid Services
COLO NHSN operative code for colon procedure(s)
Crotched Mountain Crotched Mountain Rehabilitation Center
DHMC Dartmouth-Hitchcock Medical Center (Mary Hitchcock Memorial Hospital)
DHHS New Hampshire Department of Health and Human Services
HAI Healthcare-associated infection(s)
HCP Healthcare personnel
HICPAC Healthcare Infection Control Practices Advisory Committee
HHS U.S. Department of Health and Human Services
HYST NHSN operative code for abdominal hysterectomy procedure(s)
ICU Intensive care unit(s)
KPRO NHSN operative code for knee arthroplasty procedure(s)
NE Rehab Northeast Rehabilitation Hospital
NH New Hampshire
NHHCQAC New Hampshire Healthcare Quality Assurance Commission
NHSN National Healthcare Safety Network
RSA Revised Statutes Annotated
SCIP Surgical Care Improvement Project
SIR Standardized infection ratio(s)
SSI Surgical site infection(s)
TAW Healthcare-Associated Infections Technical Advisory Workgroup
VAP Ventilator-associated pneumonia(s)

State of New Hampshire Healthcare-Associated Infections 2016 Hospital Report
NH Department of Health and Human Services September 12, 2017 Division of Public Health Services
-8-
CONTRIBUTORS AND ACKNOWLEDGMENTS
The following individuals contributed to the review and analysis of data and other content
provided in this report:
Yvette Perron, MPH, Healthcare-Associated Infections Surveillance Coordinator
Carly Zimmermann, MPH, MLS (ASCP)cm, Antimicrobial Resistance
Katrina E. Hansen, MPH, Healthcare-Associated Infections Program Manager
Elizabeth R. Daly, MPH, Chief, Infectious Disease Surveillance Section
Elizabeth A. Talbot, MD, Deputy State Epidemiologist
Benjaman Chan, MD, MPH, State Epidemiologist
Andrey Avakov, MS, NHEDSS Program Planner
John Dreisig, MPH, Vaccine Preventable Disease Surveillance Coordinator
Carolyn Fredette, MPH, Vectorborne Disease Surveillance Coordinator
Zachary McCormic, MPH, Foodborne Disease Epidemiologist
Tylor Young, GIS Analyst, Infectious Disease Surveillance Section Specialist
The HAI Program would also like to thank the Infection Prevention, Quality, and Information
Technology staff at New Hampshire hospitals for collaborating to provide the data presented in this report. Finally, the HAI Program acknowledges the review, comments, input, and other
program contributions provided by the members of the Healthcare-Associated Infections Technical Advisory Workgroup as listed on page 16.
For questions about this report, please contact:
New Hampshire Healthcare-Associated Infections Program
Infectious Disease Surveillance Section
Division of Public Health Services
NH Department of Health and Human Services
29 Hazen Drive, Concord, NH 03301-6504
Phone: (603) 271-4496
Email: [email protected]
Website: http://www.dhhs.nh.gov/dphs/cdcs/hai/index.htm

State of New Hampshire Healthcare-Associated Infections 2016 Hospital Report
NH Department of Health and Human Services September 12, 2017 Division of Public Health Services
-9-
EXECUTIVE SUMMARY A healthcare-associated infection (HAI) is an infection that a patient acquires during the course of receiving treatment for another condition within a healthcare setting. An estimated 722,000
HAI and 75,000 associated deaths occurred in United States (U.S.) acute care hospitals in 2011.i During the 2006 legislative season, the New Hampshire (NH) Legislature passed a bill creating
NH Revised Statutes Annotated (RSA) 151:32-35, which requires hospitals to identify, track, and report selected HAI to the NH Department of Health and Human Services (DHHS). All 26 of NH's acute care hospitals began reporting data to DHHS on two infections and three process measures in January 2009, and eight specialty hospitals reported influenza vaccination coverage. This report represents the seventh summary of HAI-related data reported by hospitals in NH.
Healthcare-Associated Infections in New Hampshire Hospitals
There were fewer infections than predicted in NH based on national data. A total of 202 HAI were reported, representing 124 surgical site infections (SSI), 19 central line-associated bloodstream infections (CLABSI), and 59 catheter-associated urinary tract infections (CAUTI). The observed number of HAI in NH hospitals was 28% fewer than predicted based on national data. There were 61% fewer CLABSI, 1% more CAUTI, and 28% fewer SSI than predicted. Twenty-two hospitals had sufficiently robust data1 to present hospital-specific data for overall HAI. Of these, three hospitals had an overall number of infections that was lower than
predicted based on national data. The remaining 19 all observed a similar number of infections as predicted based on national data. The total number of infections occurring increased in 2016
in comparison to 2015; however, this difference was not statistically significant.
Central Line-Associated Bloodstream Infections
Twenty-four hospitals2 with intensive care units (ICU) reported CLABSI data from their ICU. Data were robust enough for hospitals to present data for 23 individual ICU in this report. All 23 ICU
experienced similar rates of CLABSI when compared with national data. The total number of CLABSI reported increased in 2016 compared to 2015; however, this difference was not
statistically significant.
Central Line Insertion Practices
The hospitals2 with ICU reported information on central line insertion practices (CLIP) for central lines inserted in their ICU. Statewide adherence to the four infection prevention practices during central line insertions was 98.4%. Compared with attending physicians, medical residents more frequently adhered to the four infection prevention practices during central line insertions (99.8% versus 96.2%). Data were sufficiently robust for 11 hospitals to present hospital-specific data in this report. Seven hospitals reported CLIP adherence percentages that were similar to the State percentage. One hospital reported CLIP adherence percentage that
1 Data are not shown for facilities with less than one predicted infection, fewer than 50 central lines or catheter
days, and fewer than 20 central line insertions performed. 2 Of the 34 hospitals licensed in 2016, only 21 hospitals had ICU in which to monitor CAUTI, CLABSI, and CLIP.

State of New Hampshire Healthcare-Associated Infections 2016 Hospital Report
NH Department of Health and Human Services September 12, 2017 Division of Public Health Services
-10-
were higher than the State percentage and three hospitals reported an adherence percentage that was lower than the State percentage. In 2016, the statewide adherence percentage for CLIP increased from 2016 (98.4%); however, this decrease was not statistically significant. Of the 11 hospitals for which availability of data allowed a comparison between the two years, 7 hospitals’ CLIP adherence was similar in 2016 compared to 2015, three hospital’s CLIP adherence was lower than in 2015 and one hospital’s CLIP adherence was higher than in 2015. Catheter-Associated Urinary Tract Infections
Data were sufficiently robust enough for hospitals to present CAUTI data for 14 individual ICU in
this report. Twelve ICU experienced similar rates of CAUTI in comparison with national rates, while one hospital ICU experienced a higher rate of CAUTI compared with national data. The
total number of CAUTI reported in 2016 was similar when compared to 2015. Surgical Site Infections
Twenty-six3 acute care hospitals reported SSI data for four surgical procedures. Coronary Artery Bypass Graft (CABG) procedures: Four acute care hospitals performed
CABG, and data were sufficiently robust for all four hospitals to present hospital-specific data in this report. Three hospitals reported a similar number of CABG procedure-
associated SSI compared with national data, and one hospital reported fewer SSI than predicted based on national data. Overall, there were a similar number of CABG SSI than predicted based on national data.
Colon (COLO) procedures: Twenty-three acute care hospitals performed the procedure, and data were sufficiently robust for 13 hospitals to present hospital-specific data in this report. All thirteen hospitals reported a similar number of colon procedure-associated SSI when compared to national data. Overall, there were a similar number of colon procedure-associated SSI as predicted based on national data.
Abdominal Hysterectomy (HYST) procedures: Twenty-two acute care hospitals performed the procedure, and data were sufficiently robust for seven hospitals to
present hospital-specific data in this report. All seven hospitals reported a similar number of abdominal hysterectomy procedure-associated SSI compared with national
data. Overall, there were a similar number of abdominal hysterectomy procedure-associated SSI as predicted based on national data.
Knee Arthroplasty (KPRO) procedures: Twenty-three acute care hospitals performed the procedure, and data were sufficiently robust for 14 hospitals to present hospital-specific
data in this report. Thirteen hospitals reported a similar number of knee arthroplasty procedure-associated SSI compared with national data, and one hospitals reported
fewer SSI than predicted based on national data. Overall, there were fewer knee arthroplasty-related SSI than predicted based on national data.
Surgical Antimicrobial Prophylaxis Administration
Surgical antimicrobial prophylaxis data is reported to the Centers for Medicare and Medicaid Services (CMS) through the Surgical Care Improvement Project (SCIP). In previous years, DHHS
3 Of the 34 hospitals licensed in 2016, only 26 hospitals performed procedures in which to monitor SSI.

State of New Hampshire Healthcare-Associated Infections 2016 Hospital Report
NH Department of Health and Human Services September 12, 2017 Division of Public Health Services
-11-
accessed these data and presented it in this report. At the time of this report’s publication, 2014-2016 data was unavailable and consequently is not included in this report. Influenza Vaccination Coverage in Hospital Healthcare Personnel
All 34 acute care, psychiatric, and rehabilitation hospitals reported healthcare personnel (HCP)
influenza vaccination percentages. Vaccination coverage by hospital ranged from 62.4% to 100%, and the hospital State percentage was 94.2%. Ten hospitals had vaccination percentages
similar to the overall State vaccination percentage, 13 hospitals reported vaccination percentages that were significantly higher than the overall State vaccination percentage, and
eleven hospitals reported vaccination percentages that were significantly lower than the overall State vaccination percentage. The statewide hospital HCP vaccination percentage increased
from the 2015-16 influenza season (93.7%) to the 2016-17 influenza season (94.2%); this was not statistically significant. Specifically, three hospitals increased HCP influenza vaccination coverage in 2016-17 compared to the 2015-16 influenza season, 26 hospitals had similar
vaccination coverage, and five hospitals decreased vaccination coverage.
Conclusion
This eighth report of hospital HAI data displays continuous progress toward the goal of eliminating HAI in NH. This report provides a picture of selected HAI data, which can be used by
healthcare facilities in the state to identify areas for improvement and prevention as well as healthcare consumers to make informed healthcare decisions.

State of New Hampshire Healthcare-Associated Infections 2016 Hospital Report
NH Department of Health and Human Services September 12, 2017 Division of Public Health Services
-12-
I. INTRODUCTION A. Purpose
This report represents the seventh summary of healthcare-associated infection (HAI)-related data reported by hospitals in New Hampshire (NH) during calendar year 2016. This report can
be used by healthcare facilities in the state to identify areas for improvement as well by healthcare consumers to make informed healthcare decisions.
B. Audience The intended audience may include, but is not limited to: healthcare personnel (HCP), infection control and prevention staff, facility leadership and management, clinicians, and healthcare consumers. C. How to Use this Document This document includes aggregate data reported by all 34 acute care, critical access, and
specialty hospitals in NH. This report also includes individual hospital reports on page 83. The document consists of six sections:
I) Introduction II) Surveillance methods III) Statewide data
a. Overall NH data b. Central line-associated bloodstream infections (CLABSI) c. Central line insertion practices (CLIP)
d. Catheter-associated urinary tract infections (CAUTI) e. Surgical site infections (SSI) following coronary artery bypass graft (CABG), colon
(COLO), abdominal hysterectomy (HYST), and knee arthroplasty (KPRO) procedures
f. Post-discharge surveillance methods g. Surgical antimicrobial prophylaxis administration
h. Percentage of HCP receiving influenza vaccination IV) Conclusions
V) Individual hospital reports
VI) Appendices a. Technical notes
b. Influenza vaccination survey questions, 2016-17 season c. Understanding the relationship between HAI rates and standardized infection
ratio (SIR) comparison metrics d. Preventing HAI
e. Map of NH hospitals

State of New Hampshire Healthcare-Associated Infections 2016 Hospital Report
NH Department of Health and Human Services September 12, 2017 Division of Public Health Services
-13-
Please contact the NH Department of Health and Human Services (DHHS) Healthcare-Associated Infections Program (603-271-4496) with any questions about the content or how to use this document. D. Background on Healthcare-Associated Infections An HAI is an infection that a patient acquires during the course of receiving treatment for another condition within a healthcare setting. An estimated 722,000 HAI and 75,000 associated deaths occurred in United States (U.S.) acute care hospitals in 2011.ii This may represent a
decreasing tend because previous studies depict higher numbers of HAI; 1.7 million infections and 99,000 deaths each year.iii By these estimates, HAI are among the top 10 leading causes of
death in the U.S., and 5–10% of all hospital admissions are complicated by HAI.iv The economic burden of HAI is substantial and increasing. The total cost of HAI has been estimated at $33 billion per year in U.S. hospitals.v The most common HAI are pneumonia, gastrointestinal illness, primary bloodstream infections (BSI), and SSI. ii E. New Hampshire Healthcare-Associated Infections Program The NH DHHS has been developing and improving a HAI surveillance program since 2007. During the 2006 legislative season, the NH Legislature passed a bill creating NH Revised Statutes
Annotated (RSA) 151:32-35, which requires hospitals to identify, track, and report HAI to DHHS. RSA 151:33 specifically requires reporting of CLABSI, SSI, ventilator-associated pneumonia
(VAP), CLIP, surgical antimicrobial prophylaxis, and influenza vaccination coverage. The intent of the bill is to provide HAI data by hospital in a publicly accessible forum. Because the bill did not
include funding to carry out these activities, mandatory reporting was not fully implemented until January 2009.
DHHS, with consideration of the law, required that eligible hospitals initially report the
following measures:
CLABSI in adult intensive care units (ICU) (via NHSN). Only those hospitals with ICU
enroll and report data to NHSN.
CLIP in all ICU (via NHSN). Only those hospitals with ICU enroll and report data to NHSN.
SSI following CABG, colon, and knee arthroplasty procedures (via NHSN). Only those hospitals that perform the selected procedures enroll and report data to NHSN.
Surgical antimicrobial prophylaxis (via Centers for Medicare and Medicaid Services
[CMS]). Only those hospitals that administer antimicrobial prophylaxis report these data.
Influenza vaccination in patients and HCP (via DHHS web-based survey). All hospitals (including rehabilitation and psychiatric) report influenza vaccination in HCP.
All 26 acute care hospitals successfully enrolled in NHSN and began reporting the required data
in January 2009.

State of New Hampshire Healthcare-Associated Infections 2016 Hospital Report
NH Department of Health and Human Services September 12, 2017 Division of Public Health Services
-14-
During the 2010 legislative season, the NH Legislature passed House Bill 1548 (2010) amending RSA 151:32-35 to require all licensed ambulatory surgery centers (ASCs) to report HAI to DHHS. HAI data reported by ASC is published in a separate report and posted to the HAI Program publications website: http://www.dhhs.nh.gov/dphs/cdcs/hai/publications.htm. The administrative rules related to HAI reporting were revised in 2011 to include additional reporting measures for eligible hospitals. Starting January 2012, hospitals were also required to report:
CLABSI in all ICU (via NHSN) CLIP in all ICU (via NHSN)
Catheter-associated urinary tract infections (CAUTI) in all pediatric and adult ICU (via NHSN)
SSI following abdominal hysterectomy (HYST) procedures (via NHSN)
F. State of New Hampshire Healthcare-Associated Infections Plan In response to increasing concerns about the public health impact of HAI, the U.S. Department of Health and Human Services (HHS) developed its “Action Plan to Prevent Healthcare-Associated Infections” (HHS Action Plan) in 2009. The HHS Action Plan includes recommendations for surveillance, research, communication, and metrics for measuring progress toward national goals. In a concurrent development, the 2009 Omnibus Appropriations Act required states receiving Preventive Health and Health Services Block Grant funds to certify that they would submit a plan to reduce HAI to the Secretary of HHS not later
than January 1, 2010. In order to assist states in responding within the short timeline required by that language and to facilitate coordination with national HAI prevention efforts, the Centers for Disease Control and Prevention (CDC) provided a template to assist state planning efforts in the prevention of HAI. The template targeted four areas: 1) Development or Enhancement of HAI Program Infrastructure; 2) Surveillance, Detection, Reporting, and Response; 3) Prevention; and 4) Evaluation, Oversight, and Communication. In 2009, DHHS drafted its State HAI Plan and submitted it to HHS. Updates to the plan is posted to the HAI Program website: http://www.dhhs.nh.gov/dphs/cdcs/hai/index.htm. G. Overview of Healthcare-Associated Infections Prevention Efforts
DHHS participates in statewide prevention activities through the NH Health Care Quality
Assurance Commission (NHHCQAC), on which the Division of Public Health Services Director serves. DHHS is active in various projects coordinated by the NHHCQAC and the CMS Quality
Innovation Network-Quality Improvement Organization (QIN-QIO). Major statewide initiatives through these organizations have included hand hygiene campaigns, patient safety checklists, and programs to prevent BSI, antimicrobial resistance, and Clostridium difficile. Additionally, the
Foundation for Healthy Communities received a large grant through the Partnership for Patients program to conduct additional large, statewide prevention initiatives. For additional information on these various efforts, the following websites may be helpful:
State of New Hampshire Healthcare-Associated Infections 2016 Hospital Report
NH Department of Health and Human Services September 12, 2017 Division of Public Health Services
-15-
New Hampshire Health Care Quality Assurance Commission: http://www.healthynh.com/fhc-initiatives/nh-health-care-quality-assurance-commission.html CMS QIN-QIO for Connecticut, Maine, Massachusetts, NH, Rhode Island, and Vermont: www.HealthCareForNewEngland.org Foundation for Healthy Communities Partnership for Patients: http://www.healthynh.com/partnership-for-patients.html
In addition to supporting and engaging in prevention activities with patient safety groups, the
HAI Program provides educational opportunities to healthcare facilities across the state in order to share best practices for infection prevention and ultimately reduce HAI. H. Healthcare-Associated Infections Technical Advisory Workgroup In the spring of 2009, DHHS formed an HAI Technical Advisory Workgroup (TAW). The purpose of the TAW is to provide scientific and infection prevention expertise to the HAI Program. The TAW meets quarterly, and as a forum for stakeholder participation in decision-making around the HAI Program. The TAW is currently a 27-member group that includes representation from
stakeholders across NH and includes representatives from various sizes and types of hospitals and ASC, infection control associations, a consumer advocate, the NH Hospital Association, the
New Hampshire Healthcare Quality Assurance Commission, the New Hampshire Ambulatory Surgery Association, and the Northeast Health Care Quality Foundation (see page 16 for a list of
TAW members during the 2016 reporting year).

State of New Hampshire Healthcare-Associated Infections 2016 Hospital Report
NH Department of Health and Human Services September 12, 2017 Division of Public Health Services
-16-
HEALTHCARE-ASSOCIATED INFECTIONS TECHNICAL ADVISORY WORKGROUP
Members Organization Representation
Claudia Alvarado* DHHS, HAI Prevention Specialist
Sarah Blodgett, Esq.* DHHS, Office of Professional Licensure and Certification
Benjamin Chan, MD, MPH DHHS, State Epidemiologist
Beth Daly, MPH DHHS, Infectious Disease Surveillance Section Chief
Katrina Hansen, MPH DHHS, Healthcare Associated Infections Program Manager
Michael Fleming DHHS, Health Facilities Administration
Denise Krol, MS, PMP DHHS, Public Health Emergency and Hospital Preparedness Coordinator
Hannah Leeman* DHHS, CDC Public Health Associate
Yvette Perron, MPH* DHHS, HAI Program Surveillance Coordinator
Elizabeth Talbot, MD DHHS, Deputy State Epidemiologist
Antonia Altomare, DO, MPH Dartmouth Hitchcock, Hospital Epidemiologist
Darlene Burrows, RN, BSN, CIC Franklin Regional Hospital (Critical Access)
Lynda Caine, RN, MPH, CIC Concord Hospital (New Hampshire Infection Control and Epidemiology Professionals)
Michael Calderwood, MD* Dartmouth Hitchcock, Hospital Epidemiologist
Ashley Conley, MS, MPH City of Nashua, Division of Public Health and Community Services (Emergency
Preparedness)
Margaret Crowley, RN, PhD Qualidigm NH State Program Director (QIO)
Anne Diefendorf, MS, RD, LD New Hampshire Health Care Quality Assurance Commission
Terri Kangas-Feller, BS, RN, CIC New Hampshire Hospital (Psychiatric)
Jan Larmouth, MS, CIC Southern New Hampshire Medical Center (Acute Care)
Tanya Lord, MPH, PhD Consumer Representative
Elissa Malcolm, MS Dartmouth-Hitchcock Medical Center (Acute Care)
Anne Nolan, RN, BSN,CIC Cheshire Hospital (New Hampshire Hospital Association)
Brenda Paradis HealthSouth Rehab Hospital (Rehabilitiation Hospital)
Donna Quinn, RN, BSN, MBA Orthopaedic Surgery Center (Ambulatory Surgical Center)
Mary Ruppert, RN, BSN, CIC Speare Memorial Hospital (Critical Access Hospital)
Robin Sheppard, RN Bedford Ambulatory Surgical Center (Ambulatory Surgical Center)
*Served on TAW for part of 2016 DHHS: New Hampshire Department of Health and Human Services

State of New Hampshire Healthcare-Associated Infections 2016 Hospital Report
NH Department of Health and Human Services September 12, 2017 Division of Public Health Services
-17-
Figure 1. Types of healthcare-associated infections reported to NH Department of Health and Human Services

State of New Hampshire Healthcare-Associated Infections 2016 Hospital Report
NH Department of Health and Human Services September 12, 2017 Division of Public Health Services
-18-
II. SURVEILLANCE METHODS
A. 2016 Healthcare-Associated Infections Reporting Requirements for New Hampshire Hospitals Reporting requirements are governed by RSA 151:33 with authority given to DHHS to develop administrative rules to provide specific reporting instructions and methodology. Administrative rules, “He-P 309 Healthcare Associated Infections,” were drafted in 2010 with stakeholder input
and approved January 14, 2011 by the Joint Legislative Committee on Administrative Rules. Reporting requirements for 2009-2016 included the following required measures for hospitals:
CLABSI in adult ICU CLIP in adult ICU
SSI following CABG, colon, and knee arthroplasty procedures Surgical antimicrobial prophylaxis
Influenza vaccination in patients and HCP
The rules were updated in 2012 to include the following required measures for hospitals:
CLABSI in all ICU
CLIP in all ICU CAUTI in all adult and ICU
SSI following CABG, colon, abdominal hysterectomy, and knee arthroplasty procedures
Surgical antimicrobial prophylaxis
Influenza vaccination in patients and HCP
While all licensed hospitals including acute care and specialty hospitals are required to report
the selected measures under RSA 151:33, specialty hospitals (rehabilitation and psychiatric hospitals) are not required to report CAUTI, CLABSI and CLIP, because they do not have ICU, nor
SSI and surgical antimicrobial prophylaxis administration data, because they do not perform surgeries. The five rehabilitation and two psychiatric hospitals in NH are only required to report influenza vaccination coverage for patients and HCP.
B. Selection of Reporting Requirements
RSA 151:33 broadly requires reporting of all SSI and CLABSI; however, it is not feasible to
perform surveillance for all of these infections using NHSN. In order to generate infection measures for hospitals and compare them with national data, infection reporting was limited to the capabilities of NHSN and measures were selected in accordance with national
recommendations for HAI surveillance in the context of public reporting.
In 2005, the CDC released a report titled “Guidance on Public Reporting of Healthcare-Associated Infections: Recommendations of the Healthcare Infection Control Practices Advisory
Committee (HICPAC).”vi The group recommended selecting outcome measures for reporting

State of New Hampshire Healthcare-Associated Infections 2016 Hospital Report
NH Department of Health and Human Services September 12, 2017 Division of Public Health Services
-19-
based on the frequency, severity, and preventability of the outcomes and the likelihood that they can be detected and reported accurately. Specifically, the group recommended monitoring the following outcome measures:
CLABSI in ICU
SSI following selected operations
CAUTI and VAP were not recommended because of lower morbidity and mortality resulting in less prevention effectiveness relative to the burden of data collection and
reporting (in the case of CAUTI), and difficulty in detecting infections accurately resulting in invalid and misleading comparisons of infection rates for consumers (in the case of VAP)
Additionally, the group recommended monitoring the following process measures:
CLIP
Surgical antimicrobial prophylaxis
Influenza vaccination of patients and HCP
In 2008, the Healthcare-Associated Infections Working Group4 of the Joint Public Policy Committee released “Essentials of Public Reporting of Healthcare-Associated Infections: A Tool
Kit.”vii The working group agreed with the CDC/HICPAC document, “Guidance on Public Reporting of Healthcare-Associated Infections” (referenced above) and recommended
exclusion of outcome measures related to VAP and CAUTI because the existing surveillance criteria are difficult to apply consistently, making case counts unreliable. The toolkit
recommends monitoring the following outcome measures:
CLABSI in ICU
Surgical procedures that are performed with adequate frequency to permit meaningful comparisons among institutions. Specific reasonable options listed were: 1) CABG; 2) colon resection; 3) total hip arthroplasty; 4) total knee arthroplasty; 5) laminectomy; and 6) total abdominal hysterectomy
The only process measure the group recommended monitoring was HCP influenza vaccination coverage.
Within the context of RSA 151:33, DHHS reviewed the national guidelines and capabilities of NHSN in selecting infection and process measures. It is expected that these reporting requirements may change in the future as we learn from public reporting, as HAI epidemiology evolves, and as new surveillance methods and reporting technologies become available.
4 The Healthcare-Associated Infection Working Group of the Joint Public Policy Committee is a multi-organizational
group represented by the Association for Professionals in Infection Control and Epidemiology, CDC, Council of
State and Territorial Epidemiologists, and Society for Healthcare Epidemiology of America.

State of New Hampshire Healthcare-Associated Infections 2016 Hospital Report
NH Department of Health and Human Services September 12, 2017 Division of Public Health Services
-20-
C. Accuracy of Reported Healthcare-Associated Infections Surveillance Data
DHHS conducted a validation study of 2014-2015 data to assess the degree of under- and over-reporting and to provide additional training to address any common or systematic errors in reporting processes. DHHS contracted with an independent, external agency to perform the validation study and HAI Program staff participated in activities including NHSN data review, medical record review, data analysis, corrections, and follow-up for deficiencies. Overall, validation of 2014- 2015 data showed that there was approximately 15% under-reporting of CLABSI, CAUTI and SSI combined across all NH hospitals. This under-reporting was mostly due to misunderstandings of the NHSN definitions for HAI. In addition to under-reporting, the validation studies also found 10% of CLABSI, CAUTI and SSI were over reported or not classified
accurately (i.e., reporting an infection that was not truly a CLABSI, CAUTI or SSI). The 2014-2015 data presented in this report have not been validated and must be interpreted with the
understanding that in general there are both under- and over reporting of HAI. However, the HAI Program is currently in the process of validating data on a rolling basis.
Several processes are used to ensure that these 2015-16 data are as accurate as possible. First,
DHHS selected NHSN for mandatory reporting, which requires the use of standardized infection definitions and reporting methods. Second, DHHS analyzed and reviewed all data reported for 2015 from each hospital. This review identified any obvious reporting errors or internal
inconsistencies that suggested errors. Third, DHHS provided preliminary data reports to each hospital with the request to confirm accuracy. This reconciliation process was iterative until all
hospitals made corrections and agreed to the reported data. Lastly, 2009-2010 and 2014-2015 data validation was performed, reducing systematic errors that may have occurred during the
reporting process; this has likely resulted in a lasting improvement to data quality, even in years when validation does not take place.
Despite the above measures, there are several limitations to the reporting methods that may
limit comparison of data across hospitals. Definitions for classifying an infection as healthcare-associated are standardized through the use of NHSN; however, methods to identify the infection in each hospital are not. For example, hospitals may use different methods to identify CLABSI (e.g., reviewing laboratory records, reviewing ICU records) or may have different approaches to diagnosing and managing suspect CLABSI in the ICU. For SSI, identifying patients
who develop infections after discharge from the hospital can be difficult, and each hospital may use a different method of post-discharge surveillance (e.g., letters to surgeons, conducting
chart reviews for surgical patients, calling surgeon offices). These different approaches vary in sensitivity. See page 23 for more details about how hospitals identify SSI.
D. National Healthcare Safety Network
NHSN is a voluntary, secure, internet-based surveillance system for healthcare facilities to
monitor patient safety and infection prevention measures. Enrollment is open to all types of healthcare facilities in the U.S. DHHS selected NHSN because it is widely used across the entire U.S., it offers already developed and accepted surveillance definitions and methods, it provides national comparison data, and there is no cost to use or join the system.

State of New Hampshire Healthcare-Associated Infections 2016 Hospital Report
NH Department of Health and Human Services September 12, 2017 Division of Public Health Services
-21-
More information about NHSN is available at: http://www.cdc.gov/nhsn/index.html.
E. Comparisons with National Data All SSI comparisons with national data use 2006–2008 NHSN data published in the “National Healthcare Safety Network (NHSN) report: Data summary for 2006 through 2008, issued December 2009.”viii All device-associated infection (CLABSI and CAUTI) comparisons with national data use 2014 data. At the time of this report, the summary report was not published. Therefore some comparisons routinely included in this report are excluded. When these data are available, they
will be located on the CDC NHSN website.ix
These reports are available at: https://www.cdc.gov/nhsn/datastat/index.html.
F. Central Line-Associated Bloodstream Infections Surveillance
A CLABSI is a laboratory-confirmed BSI that develops after insertion of a central line and is not secondary to an infection at another body site. A central line is an intravascular catheter that terminates at or close to the heart or in one of the great vessels and is used for infusion,
withdrawal of blood, or hemodynamic monitoring. Hospitals are required to monitor and report CLABSI in adult ICU. This monitoring includes reporting the number of infections identified as
well as the total number of central line days in the unit. These metrics are monitored following NHSN protocols and definitions, and reported in NHSN.
Central line days are the number of patients with one or more central lines of any type, which
are counted at the same time each day and aggregated over the reporting period. For example, a patient with a central line in place for five days would be counted as five central line days.
Detailed descriptions of the NHSN CLABSI surveillance protocols are available at: http://www.cdc.gov/nhsn/PDFs/pscManual/4PSC_CLABScurrent.pdf. Limitations for CLABSI surveillance:
NHSN only allows for monitoring CLABSI in inpatient units. In NH in 2016, CLABSI were monitored in all ICU (including pediatric and neonatal ICU) and not in other inpatient locations.
One hospital reclassified three ICU types halfway through 2016, making comparison over multiple years impossible.
Validation of 2014-2015 data showed that there was approximately 19% under-reporting of CLABSI across all NH hospitals. This under-reporting was mostly due to
misunderstandings about the NHSN definition for CLABSI. In addition to under-reporting, the validation studies also found 3% of over-reporting (i.e., reporting an
infection that was not truly a CLABSI). The 2016 CLABSI data presented in this report have not been validated and must be interpreted with the understanding that in general
there are both under-and-overreporting of infections.

State of New Hampshire Healthcare-Associated Infections 2016 Hospital Report
NH Department of Health and Human Services September 12, 2017 Division of Public Health Services
-22-
G. Central Line Insertion Practices Monitoring CLIP monitoring assesses key infection prevention practices that occur during the insertion of a central line. A central line is any intravascular catheter used for infusion, blood withdrawal, or hemodynamic monitoring that terminates at or close to the heart or in one of the great vessels. In order to comply with all infection prevention practices during the insertion, the inserter must 1) perform hand hygiene prior to insertion; 2) use all five barriers (gloves, gown, cap, mask, and drape); 3) use an appropriate skin preparation agent; and 4) ensure skin is dry prior to insertion.
Hospitals monitor and report CLIP data through NHSN using all NHSN protocols and definitions. In 2015, hospitals were required to monitor all central line insertions that were placed in ICU
(which includes pediatric, neonatal, and step down units). The NHSN CLIP protocols are available at: http://www.cdc.gov/nhsn/PDFs/pscManual/5psc_CLIPcurrent.pdf. Occupational groups are compared with the overall State compliance percentage since there are no national data for comparison. Groups with a confidence interval that overlaps the State’s confidence interval are considered to be similar to the State adherence percentage. Any occupation or hospital with a confidence interval that is higher than the State’s confidence interval is considered to have a significantly higher percentage than the State adherence percentage. Groups with a confidence interval that is lower than the State’s confidence interval
are considered to have a significantly lower percentage than the State adherence percentage.
Limitations for central line insertion practices monitoring: In NH, CLIP was monitored in all ICU (including pediatric and neonatal ICU) and not in
other settings where central lines may be inserted (e.g., operating room, procedure rooms, emergency room, dialysis centers).
The person recording the insertion practices may differ in each hospital. This person may be an observer or the person doing the insertion, which may impact quality of data
on adherence reported. H. Catheter-Associated Urinary Tract Infections Surveillance A CAUTI is a urinary tract infection that develops after insertion of an indwelling urinary catheter and is not secondary to an infection at another body site. An indwelling urinary catheter is a drainage tube that is inserted into the urinary bladder through the urethra and left in place, and is connected to a drainage bag. They are sometimes called Foley catheters and are used for intermittent or continuous irrigation or urine drainage. Hospitals are required to monitor and report CAUTI in all ICU (excluding neonatal ICU and step down units). This
monitoring includes reporting the number of infections identified as well as the total number of catheter days in the unit. These metrics are monitored following NHSN protocols and definitions and reported in NHSN.
Catheter days represent the number of patients with one or more indwelling urinary catheters of any type, counted at the same time each day and aggregated over the reporting period. For example, a patient with a catheter in place for five days would be counted as five catheter days;

State of New Hampshire Healthcare-Associated Infections 2016 Hospital Report
NH Department of Health and Human Services September 12, 2017 Division of Public Health Services
-23-
one patient with a catheter for one day and another with a catheter for four days are also counted as five catheter days. Detailed descriptions of the NHSN CAUTI surveillance protocols are available at: http://www.cdc.gov/nhsn/PDFs/pscManual/7pscCAUTIcurrent.pdf. Limitations for CAUTI surveillance:
NHSN only allows for monitoring CAUTI in inpatient units. In NH in 2015, CAUTI were monitored in all ICU (excluding neonatal ICU) and not in other inpatient locations.
The 2015 CAUTI data presented in this report have not been validated and must be interpreted with the understanding that in general there are both under- and over-
reporting of infections.
I. Surgical Site Infections Surveillance
An SSI is an infection that develops at the site of a surgical procedure. There are different ways to classify an SSI, such as whether it is superficial, in deep tissue, or in the organ/space.
Monitoring for an SSI may continue for as little as 30 days or as long as 90 days based on depth and procedure type (e.g., knee arthroplasty, CABG). In 2016, hospitals were required to monitor and report SSI for four procedures:
Coronary Artery Bypass Graft (chest incision and donor site) o NHSN Operative Procedures CBGC (coronary artery bypass graft procedures with
chest incision site only) and CBGB (coronary artery bypass graft procedures with both a chest and donor site incision)
Colon Surgery (incision, resection, or anastomosis of the large intestine; includes large-to-small and small-to-large bowel anastomosis; does not include rectal operations)
o NHSN Operative Procedure COLO Abdominal Hysterectomy (includes that by laparoscope)
o NHSN Operative Procedure HYST Knee Arthroplasty
o NHSN Operative Procedure KPRO
Specific ICD-10 codes can be found at: https://www.cdc.gov/nhsn/xls/2016-icd-10-pcs-code-mapping-opc.xlsx
SSI monitoring includes total counts as well as patient-level information for all patients undergoing the same procedure. This allows for appropriate risk adjustment, because risk for development of an SSI can be influenced by patient- and procedure-specific factors. Patient and procedure risk factors that are considered when assessing SSI SIR by hospital vary by type of procedure but include factors such as:

State of New Hampshire Healthcare-Associated Infections 2016 Hospital Report
NH Department of Health and Human Services September 12, 2017 Division of Public Health Services
-24-
Operation lasting more than the duration of cut point hours5
Contaminated (Class III) or Dirty/Infected (Class IV) surgical wound class
American Society of Anesthesiologists (ASA) Classification of Physical Status score of 3, 4, or 5 (see below)
Age of the patient Gender of the patient
Hospital bed size
Hospital’s medical school affiliation Whether the surgery was the result of trauma
The wound class is a way of determining how clean or dirty the operative body site was at the
time of the operation. Operation body sites are divided into four classes:
Class I/Clean: An uninfected operation body site is encountered and the respiratory, digestive, genital, or uninfected urinary tracts are not entered. Class II/Clean-Contaminated: Operation body sites in which the respiratory, digestive, genital, or urinary tracts are entered under controlled conditions and without unusual contamination.
Class III/Contaminated: Operation body sites that have recently undergone trauma, operations with major breaks in sterile technique (e.g., open cardiac massage), or gross
spillage from the gastrointestinal tract.
Class IV/Dirty or Infected: Includes old traumatic wounds with retained dead tissue and those that involve existing infection or perforated intestines.
The ASA score is a scale used by the anesthesiologist to classify the patient’s physical condition prior to surgery. It is one of the factors that help determine a patient’s risk of possibly
developing SSI.
The ASA scale is: 1. Normally healthy patient
2. Patient with mild systemic disease
3. Patient with severe systemic disease
4. Patient with an incapacitating systemic disease that is a constant threat to life
5. A patient who is not predicted to survive with or without the operation
All SSI metrics are monitored following NHSN protocols and definitions and reported in NHSN. The NHSN SSI protocols are available at: http://www.cdc.gov/nhsn/PDFs/pscManual/9pscSSIcurrent.pdf.
5 Cut points are assigned based upon the time that the majority (75%) of a specific procedure takes to perform.
The duration cut point is measured in minutes and is the time between the skin incision and skin closure.

State of New Hampshire Healthcare-Associated Infections 2016 Hospital Report
NH Department of Health and Human Services September 12, 2017 Division of Public Health Services
-25-
In general, most SSI identified during the initial hospital encounter or those that require readmission are thought to be well-represented in HAI surveillance data. However, the infections that develop after the patient is discharged home that do not require readmission are thought to be less well-represented, as inclusion in surveillance requires the healthcare facility to proactively seek out these infections, a process known as post-discharge surveillance. The proportion of infections detected through post-discharge surveillance in comparison to the state average may provide an indicator of how well the facility is able to identify these infections, which ultimately can impact the facility’s SSI SIR (better surveil lance may result in a higher SIR). SSI data detected through post-discharge surveillance were analyzed for 2013-2014
and infection control staff were interviewed regarding methods of SSI surveillance in 2011. The percent of SSI detected post-discharge was calculated for each hospital and compared to a
moving state average (hospital vs. all other hospitals). Statistical significance was calculated using the NHSN Statistics Calculator. Limitations for SSI surveillance:
Hospitals do not use a standard method of post-discharge surveillance to identify infections once a patient has been discharged. This poses a challenge for data
interpretation, because a higher SSI rate (for example) at a given hospital may represent
either poor infection prevention practices or, conversely, a better system for identifying infections. Post-discharge surveillance methods were analyzed to better understand
these differences between facilities and are presented in this report on page 68. SSI reporting in NHSN requires not only reporting of infections but also detailed
information on each patient undergoing the procedure being monitored. This allows for risk adjustment. As such, DHHS has elected to monitor a subset of procedures based on
national recommendations since it would not be feasible for hospitals to report information on every patient receiving a surgical procedure due to the burden of
reporting.
Some procedures require monitoring for SSI for up to 90 days after the procedure depending on the depth of infection (in NH, this includes CABG and knee arthroplasty). Due to the reporting deadlines required for producing a data report such as this, it is possible that deep or organ/space SSI associated with surgeries performed at the end of 2016 may not be included in this report. As such, this report may not account for all SSI that developed as a result of procedures performed in 2016.
The SSI data presented in this report includes all types of infections, including superficial SSI, which can occur as a result of care in the hospital but also as a result of the patient’s care of the wound site once discharged.
Validation of 2014-2015 data showed that there was approximately 15% under-reporting of SSI across all NH hospitals. This under-reporting was mostly due to
misunderstandings about the NHSN definition for SSI. In addition to under-reporting, the validation studies also found 3% over-reporting (i.e., reporting an infection that was
not truly a SSI). The 2016 SSI data presented in this report have not been validated and must be interpreted with the understanding that in general there are both under- and
over-reporting of infections.
State of New Hampshire Healthcare-Associated Infections 2016 Hospital Report
NH Department of Health and Human Services September 12, 2017 Division of Public Health Services
-26-
J. Surgical Antimicrobial Prophylaxis Administration Monitoring All NH hospitals report surgical antimicrobial prophylaxis data and other measures to CMS through the Surgical Care Improvement Project (SCIP). For this reason, DHHS does not collect surgical antimicrobial prophylaxis data directly from hospitals. In addition to other measures required by CMS, measures relative to NH RSA 151:33 include the following:
SCIP 1: Number and percentage of patients who received prophylactic antibiotic within one hour prior to surgery
SCIP 2: Number and percentage of patients who received the appropriate prophylactic antibiotic
SCIP 3: Number and percentage of patients whose prophylactic antibiotic was discontinued within 24 hours after surgery
These process measures show a hospital’s adherence rate to best practices designed to reduce
surgical complications. Hospitals follow the CMS specification manual appropriate to the date of discharge found at: http://qualitynet.org/dcs/ContentServer?cid=1141662756099&pagename=QnetPublic%2FPage%2FQnetTier2&c=Page.
In previous years, DHHS accessed hospital data on surgical antimicrobial prophylaxis administration from the New Hampshire Quality Care website at:
http://www.healthynh.com/fhc-initiatives/nh-health-care-quality-assurance-commission.html
As of July 1, 2015, SCIP data reported to CMS was unavailable and the HAI Program was unable to conduct further analysis of this measure as routinely included in this report.
K. Influenza Vaccination Percentage Monitoring HCP can become infected with the influenza virus through contact with infected patients and
can transmit influenza to patients and other HCP. Despite documented benefits of HCP influenza vaccination on patient outcomes and HCP absenteeism nationally, vaccination coverage among HCP remains low. In a CDC survey, influenza vaccination coverage in HCP nationally was 86.4% during the 2016-17 influenza season.x Because HCP provide care to patients at high risk for complications of influenza, they should be offered influenza vaccine each year. Currently there are no regulations requiring vaccination in NH, and HCP are free to decline vaccination for any reason. However, some hospitals do have policies requir ing mandatory HCP vaccination. Vaccination coverage in hospital HCP have been monitored in NH for several years.
All hospitals are required to report HCP and patient vaccination data directly to DHHS. This reporting occurs either solely via a web-based survey provided to facilities, or via NHSN in
combination with an abbreviated web-based survey, newly for the 2016-17 influenza season and according to facility discretion. See Appendix 2 for the 2016-17 survey questions regarding
influenza vaccination. Data for the 2016-17 influenza season were reported by all hospitals.
State of New Hampshire Healthcare-Associated Infections 2016 Hospital Report
NH Department of Health and Human Services September 12, 2017 Division of Public Health Services
-27-
Submission of these data meets the requirements of both the HAI law (RSA 151:32-35) and the healthcare immunization law (RSA 151:9-b). HCP influenza vaccination percentages were calculated by dividing the total number of HCP that worked or volunteered in each facility for at least one working day between October 1, 2016 and March 31, 2017 by the total number of HCP immunized against influenza for the 2016-17 influenza season. Limitations for influenza vaccination monitoring:
The data collection tools ask for the total number of HCP vaccinated. This may not reflect the number of HCP to whom the vaccine was offered. Hospitals may vary in the
refusal percentage for vaccination among HCP and the reasons for such refusal. Additionally, some HCP may not be eligible to receive the vaccine. DHHS attempted to
assess why unvaccinated HCP did not receive the vaccine; however, not all hospitals were able to report this information.
Because the web-based survey did not include options for facilities to report unknown vaccination status, patients and HCP with unknown vaccination status were analyzed as though they were not vaccinated. This results in a conservative estimate of vaccination status (e.g., lower than in reality).
Vaccination status is not uniformly available by location where the vaccination was received (e.g., at the reporting facility or elsewhere).
Data collection techniques at hospitals may vary from season to season, potentially affecting comparison of data. DHHS continues to work towards improving the validity
and utility of this measure in order to eliminate issues that pose problems for such comparison.
Reporting patient vaccination percentages is limited by availability of vaccine and by hospitals’ ability to track why patients did not receive the vaccine. For example, the survey asks for admissions through March 31, 2017, by which time some hospitals may have used their vaccine supply and are unable to order more. This scenario would result in a lower vaccination percentage because the survey counts all admissions through March, even though there was no opportunity to vaccinate these patients due to supply. DHHS has elected not to report patient vaccination percentages until a better way to collect the information is identified so that results are reliable, accurate, and
informative.
For the 2016-17 influenza season, CMS began requiring all facilities sharing the same
CMS Certification Number (CCN) to report this measure in aggregate via NHSN. Because some ASC and hospitals may share the same CCN, it is possible that HCP influenza
vaccination data contains more duplicate data than in prior influenza seasons.
State of New Hampshire Healthcare-Associated Infections 2016 Hospital Report
NH Department of Health and Human Services September 12, 2017 Division of Public Health Services
-28-
III. STATEWIDE DATA
HAI data are presented throughout this report as both SIR and rates as appropriate. Presenting data as an SIR allows for aggregating data across risk groups, procedures, and hospitals to gain a better understanding of the incidence of HAI while still adjusting for underlying patient or hospital factors that may affect the occurrence of infections. The SIR allows comparison between how many infections actually occurred and how many were predicted to occur based on national data. Specific annual rate information is also provided where possible, which
represents the number of infections that occurred. Rate data are limited in that they must be stratified by certain factors, such as hospital and type of ICU; they cannot be aggregated over these categories for the purpose of analysis. See technical notes for additional information on rates and the SIR. Because an SIR is a comparison of the number of actual observed infections to the number predicted based on national data, an SIR of 1.0 means that exactly the same number of infections was observed as was predicted. An SIR of less than one means that fewer infections were observed than were predicted (for example, SIR = 0.70 would be interpreted as 30% fewer infections observed than predicted). An SIR of more than one means that more infections were
observed than were predicted (for example, SIR = 1.30 would be interpreted as 30% more infections observed than predicted). A confidence interval is calculated to determine whether
the difference between observed and predicted infections is statistically significant. If the difference is not statistically significant, the observed and predicted numbers of infections are
considered similar. See technical notes for additional information on confidence intervals.
This report provides comparisons with national and State data where appropriate. Comparisons are color coded consistently throughout. For infections, yellow represents infection rates or SIR that are similar to national data, red represents infection rates or SIR that are significantly
higher than national data, and green represents infection rates or SIR that are significantly lower than national data.
For process measures, yellow represents percentages that are similar to the State percentage, red represents percentages that are significantly lower than the State percentage, and green
represents percentages that are significantly higher than the State percentage.
Statistical significance is affected by sample size. If a value is almost or just barely significant,
just a few additional observations can push significance one way or the other (i.e., not significant or significant).
A. Statewide Standardized Infection Ratios
In 2016, 202 HAI were reported by all 26 acutecare hospitals in NH. These infections represent CLABSI and CAUTI in ICU and SSI following colon, knee arthroplasty, abdominal hysterectomy,
and CABG procedures. A total of 279.42 infections were predicted based on national data; the

State of New Hampshire Healthcare-Associated Infections 2016 Hospital Report
NH Department of Health and Human Services September 12, 2017 Division of Public Health Services
-29-
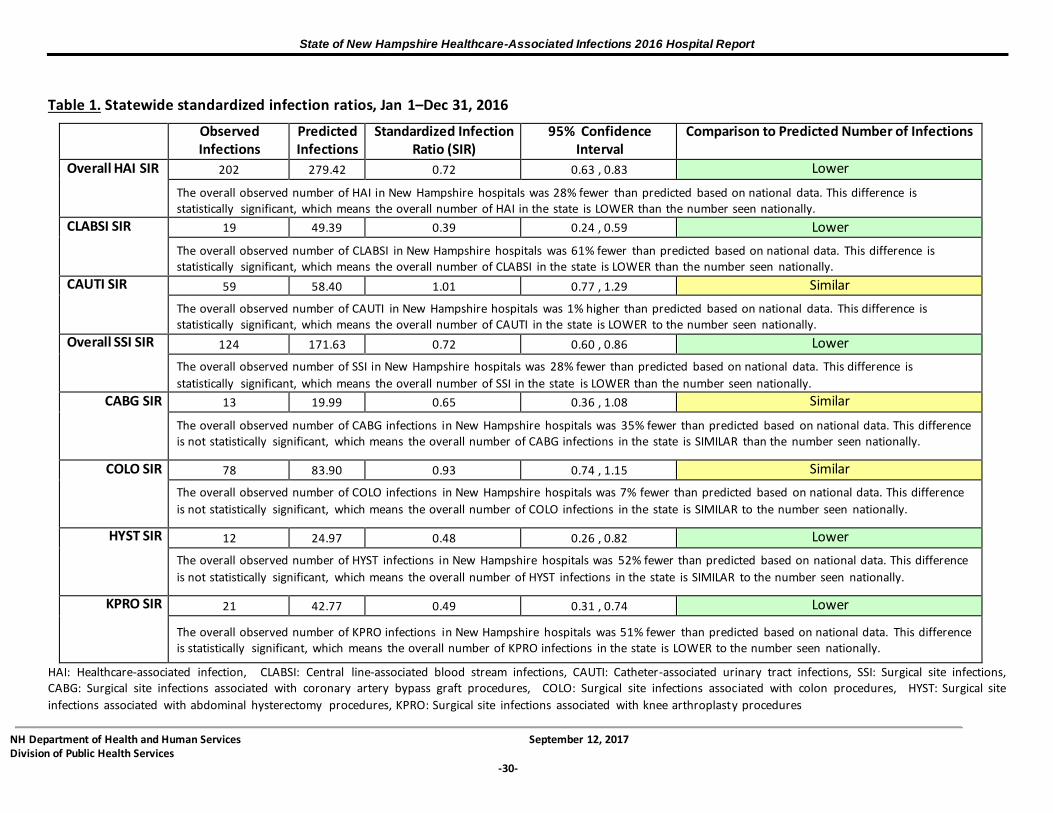
overall observed number of HAI was 28% fewer than predicted. More specifically, there were 61% fewer CLABSI, 1% more CAUTI and 28% fewer SSI. Looking individually at the specific procedures tracked for SSI by NH hospitals, there were 35% fewer infections following CABG procedures, 7% fewer infections following colon procedures, 52% fewer infections following abdominal hysterectomy procedures, and 51% fewer infections following knee arthroplasty procedures. However, the differences for coronary artery bypass, colon, and abdominal hysterectomy procedures are not statistically significant, and the number of infections observed are considered similar to national data. These data are shown in Table 1 and Figure 2.
State of New Hampshire Healthcare-Associated Infections 2016 Hospital Report
NH Department of Health and Human Services September 12, 2017 Division of Public Health Services
-30-
Table 1. Statewide standardized infection ratios, Jan 1–Dec 31, 2016
Observed Infections
Predicted Infections
Standardized Infection Ratio (SIR)
95% Confidence Interval
Comparison to Predicted Number of Infections
Overall HAI SIR 202 279.42 0.72 0.63 , 0.83 Lower
The overall observed number of HAI in New Hampshire hospitals was 28% fewer than predicted based on national data. This difference is statistically significant, which means the overall number of HAI in the state is LOWER than the number seen nationally. CLABSI SIR 19 49.39 0.39 0.24 , 0.59 Lower
The overall observed number of CLABSI in New Hampshire hospitals was 61% fewer than predicted based on national data. This difference is statistically significant, which means the overall number of CLABSI in the state is LOWER than the number seen nationally.
CAUTI SIR 59 58.40 1.01 0.77 , 1.29 Similar
The overall observed number of CAUTI in New Hampshire hospitals was 1% higher than predicted based on national data. This difference is statistically significant, which means the overall number of CAUTI in the state is LOWER to the number seen nationally.
Overall SSI SIR 124 171.63 0.72 0.60 , 0.86 Lower
The overall observed number of SSI in New Hampshire hospitals was 28% fewer than predicted based on national data. This difference is
statistically significant, which means the overall number of SSI in the state is LOWER than the number seen nationally. CABG SIR 13 19.99 0.65 0.36 , 1.08 Similar
The overall observed number of CABG infections in New Hampshire hospitals was 35% fewer than predicted based on national data. This difference is not statistically significant, which means the overall number of CABG infections in the state is SIMILAR than the number seen nationally. COLO SIR 78 83.90 0.93 0.74 , 1.15 Similar
The overall observed number of COLO infections in New Hampshire hospitals was 7% fewer than predicted based on national data. This difference
is not statistically significant, which means the overall number of COLO infections in the state is SIMILAR to the number seen nationally. HYST SIR 12 24.97 0.48 0.26 , 0.82 Lower
The overall observed number of HYST infections in New Hampshire hospitals was 52% fewer than predicted based on national data. This difference
is not statistically significant, which means the overall number of HYST infections in the state is SIMILAR to the number seen nationally.
KPRO SIR 21 42.77 0.49 0.31 , 0.74 Lower
The overall observed number of KPRO infections in New Hampshire hospitals was 51% fewer than predicted based on national data. This difference is statistically significant, which means the overall number of KPRO infections in the state is LOWER to the number seen nationally.
HAI: Healthcare-associated infection, CLABSI: Central line-associated blood stream infections, CAUTI: Catheter-associated urinary tract infections, SSI: Surgical site infections, CABG: Surgical site infections associated with coronary artery bypass graft procedures, COLO: Surgical site infections associated with colon procedures, HYST: Surgical site
infections associated with abdominal hysterectomy procedures, KPRO: Surgical site infections associated with knee arthroplasty procedures
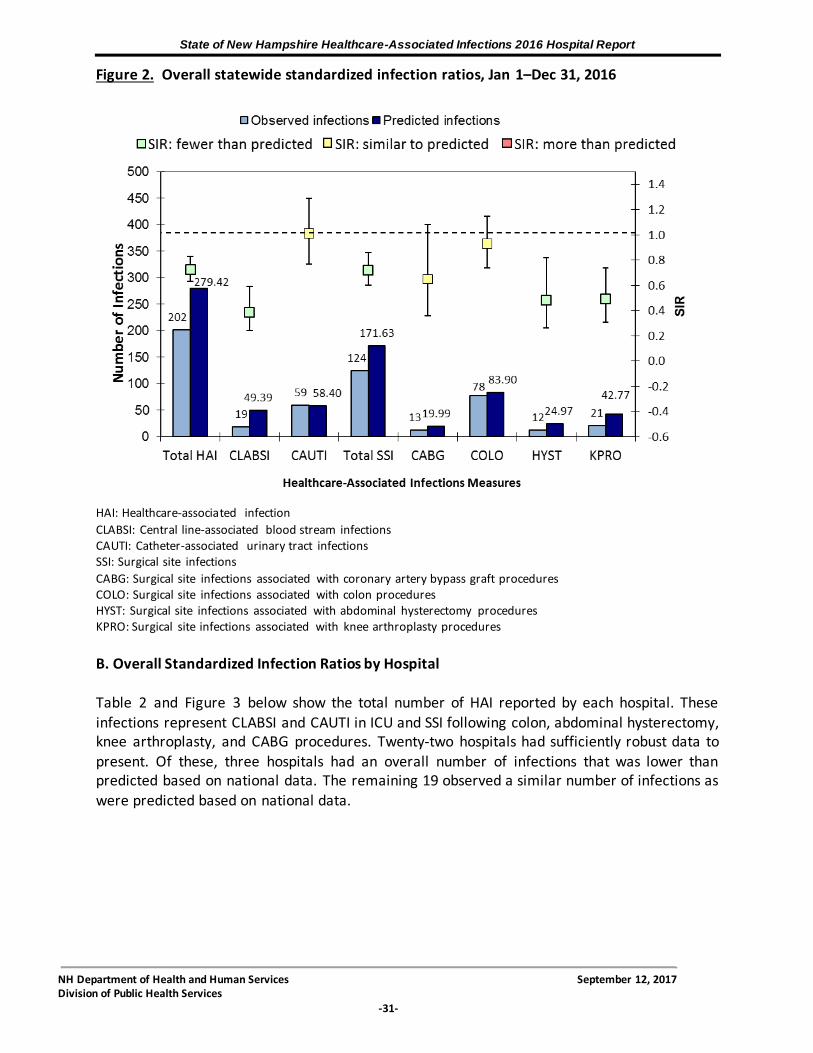
State of New Hampshire Healthcare-Associated Infections 2016 Hospital Report
NH Department of Health and Human Services September 12, 2017 Division of Public Health Services
-31-
Figure 2. Overall statewide standardized infection ratios, Jan 1–Dec 31, 2016
HAI: Healthcare-associated infection
CLABSI: Central line-associated blood stream infections CAUTI: Catheter-associated urinary tract infections SSI: Surgical site infections
CABG: Surgical site infections associated with coronary artery bypass graft procedures COLO: Surgical site infections associated with colon procedures HYST: Surgical site infections associated with abdominal hysterectomy procedures KPRO: Surgical site infections associated with knee arthroplasty procedures
B. Overall Standardized Infection Ratios by Hospital
Table 2 and Figure 3 below show the total number of HAI reported by each hospital. These
infections represent CLABSI and CAUTI in ICU and SSI following colon, abdominal hysterectomy, knee arthroplasty, and CABG procedures. Twenty-two hospitals had sufficiently robust data to
present. Of these, three hospitals had an overall number of infections that was lower than predicted based on national data. The remaining 19 observed a similar number of infections as
were predicted based on national data.

State of New Hampshire Healthcare-Associated Infections 2016 Hospital Report
NH Department of Health and Human Services September 12, 2017 Division of Public Health Services
-32-
Table 2. Overall healthcare-associated infections standardized infection ratios, Jan 1–Dec 31, 2016
† Data are not shown for hospitals with less than one predicted infection.
- Facility did not report any data contributing to a SIR during this time period. * Observed number of infections includes all infections that are required to be reported (central line-associated bloodstream infections, catheter-associated urinary tract infections, and surgical site infections following coronary artery bypass, colon, abdominal hysterectomy, and knee arthroplasty procedures).
Hospital Observed Infections*
Predicted Infections
Standardized Infection
Ratio (SIR)
95% Confidence
Interval
Comparison to Predicted Number
of Infections
Alice Peck Day Memorial 0 1.71 0.00 - , 1.75 Similar
Androscoggin Valley 3 1.95 1.54 0.39 , 4.19 Similar
Catholic Medical Center 6 12.90 0.47 0.19 , 0.97 Lower
Cheshire Medical Center 12 19.12 0.63 0.34 , 1.07 Similar
Concord Hospital 27 25.93 1.04 0.70 , 1.49 Similar
Cottage Hospital † † † † †
DHMC 63 96.38 0.65 0.51 , 0.83 Lower
Elliot Hospital 20 21.33 0.94 0.59 , 1.42 Similar
Exeter Hospital 10 10.87 0.92 0.47 , 1.64 Similar
Franklin Regional † † † † †
Frisbie Memorial 11 8.48 1.30 0.68 , 2.26 Similar
Huggins Hospital 2 1.34 1.49 0.25 , 4.93 Similar
Lakes Region General 4 8.53 0.47 0.15 , 1.13 Similar
Littleton Regional 2 2.96 0.67 0.11 , 2.23 Similar
Monadnock Community 0 1.11 0.00 - , 2.70 Similar
New London Hospital 1 1.24 0.81 - , 2.42 Similar
Parkland Medical Center 4 6.92 0.58 0.18 , 1.39 Similar
Portsmouth Regional 12 21.45 0.56 0.30 , 0.95 Lower
Southern NH Medical 8 11.24 0.71 0.33 , 1.35 Similar
Speare Memorial Hospital 1 1.00 1.00 0.05 , 4.93 Similar
St. Joseph Hospital 5 8.30 0.60 0.22 , 1.34 Similar
The Memorial Hospital 2 1.64 1.22 0.20 , 4.03 Similar
Upper Connecticut Valley - - - - -
Valley Regional Hospital - - - - -
Weeks Medical Center 0 1.02 0 - , 2.94 Similar
Wentworth-Douglass 8 13.21 0.61 0.28 , 1.15 Similar
State Total 202 279.42 0.72 0.63 , 0.83 Lower

State of New Hampshire Healthcare-Associated Infections 2016 Hospital Report
NH Department of Health and Human Services September 12, 2017 Division of Public Health Services
-33-
Figure 3. Overall healthcare-associated infections standardized infection ratios, Jan 1–Dec 31, 2016
Note: Data are not shown for hospitals with less than one predicted infection. Observed number of infections includes all infections that are required to be reported (central line-associated bloodstream infections, catheter-
associated urinary tract infections and surgical site infections following coronary artery bypass, colon, abdominal hysterectomy, and knee arthroplasty procedures).

State of New Hampshire Healthcare-Associated Infections 2016 Hospital Report
NH Department of Health and Human Services September 12, 2017 Division of Public Health Services
-34-
Overall Statewide Standardized Infection Ratios: Comparison to 2015 Data
Table 3 shows that the statewide SIR in 2016 decreased in comparison to 2015; however, this difference was not statistically significant. In 2016, a total of 202 HAI were reported,
representing 124 SSI, 19 CLABSI, and 59 CAUTI compared to 200 HAI (135 SSI, 31 CLABSI, and 34 CAUTI) in 2015.
Table 3. Overall healthcare-associated infections standardized infection ratios, comparison between 2015 and 2016
Hospital Standardized Infection
Ratio (SIR) 2016
95% Confidence
Interval 2016
Standardized Infection
Ratio (SIR) 2015
95% Confidence
Interval 2015
2016 Compared to
2015
Overall HAI SIR 0.72 0.63 , 0.83 0.73 0.63 , 0.83 Similar
CLABSI SIR 0.39 0.24 , 0.59 0.52 0.43 , 0.86 Similar
CAUTI SIR 1.01 0.77 , 1.29 0.56 0.40 , 0.78 Similar
Overall SSI SIR 0.72 0.60 , 0.86 0.82 0.69 , 0.97 Similar
CABG SIR 0.65 0.36 , 1.08 0.66 0.36 , 1.12 Similar
COLO SIR 0.93 0.74 , 1.15 0.96 0.77 , 1.18 Similar
HYST SIR 0.48 0.26 , 0.82 0.84 0.51 , 1.30 Similar
KPRO SIR 0.49 0.31 , 0.74 0.60 0.39 , 0.88 Similar
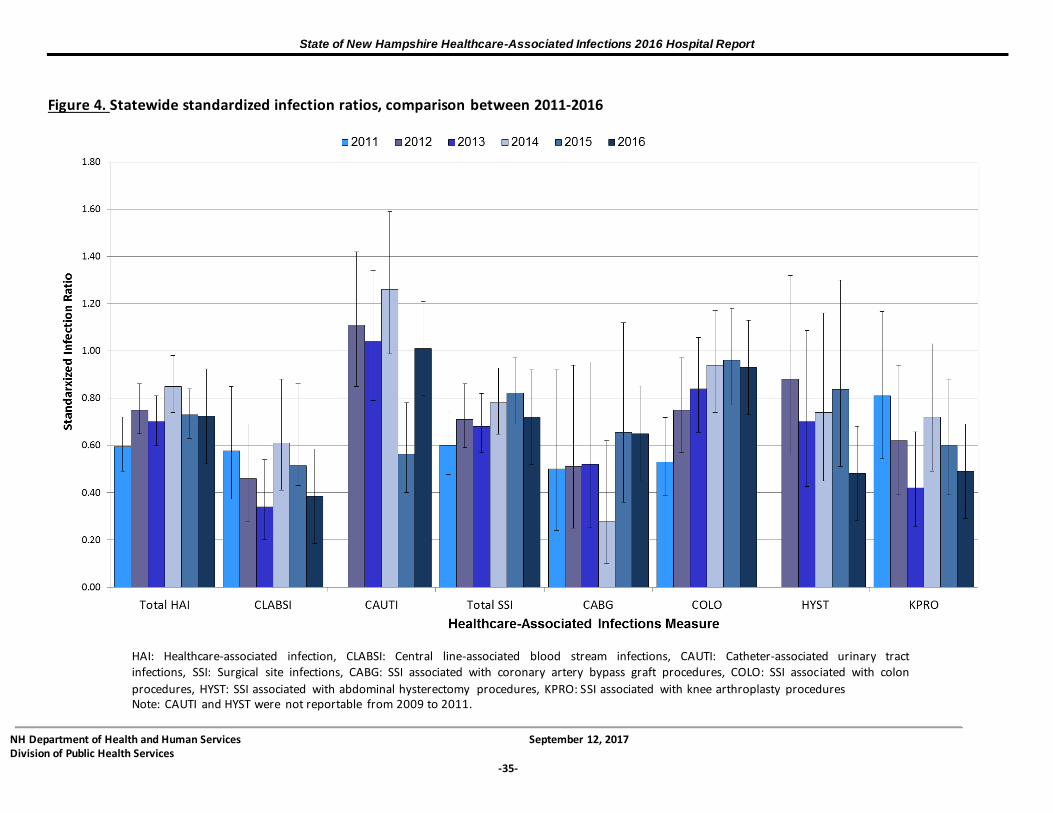
State of New Hampshire Healthcare-Associated Infections 2016 Hospital Report
NH Department of Health and Human Services September 12, 2017 Division of Public Health Services
-35-
Figure 4. Statewide standardized infection ratios, comparison between 2011-2016
HAI: Healthcare-associated infection, CLABSI: Central line-associated blood stream infections, CAUTI: Catheter-associated urinary tract infections, SSI: Surgical site infections, CABG: SSI associated with coronary artery bypass graft procedures, COLO: SSI associated with colon
procedures, HYST: SSI associated with abdominal hysterectomy procedures, KPRO: SSI associated with knee arthroplasty procedures Note: CAUTI and HYST were not reportable from 2009 to 2011.

State of New Hampshire Healthcare-Associated Infections 2016 Hospital Report
NH Department of Health and Human Services September 12, 2017 Division of Public Health Services
-36-
Table 4. Overall healthcare-associated infections standardized infection ratios by hospital, comparison between 2015 and 2016
† Data are not shown for hospitals with less than one predicted infection. N/A or not applicable: Comparison between two years of data at a given facility is not applicable if no data were
reported by that facility and/or if data must be censored for one or more of the years presented.
Hospital Standardized Infection
Ratio (SIR) 2016
95% Confidence
Interval 2016
Standardized Infection
Ratio (SIR) 2015
95% Confidence
Interval 2015
2016 Compared to
2015
Alice Peck Day Memorial 0.00 - , 1.75 1.44 0.16 , 13.74 Similar
Androscoggin Valley 1.54 0.39 , 4.19 1.44 0.29 , 4.21 Similar
Catholic Medical Center 0.47 0.19 , 0.97 0.62 0.34 , 1.02 Similar
Cheshire Medical Center 0.63 0.34 , 1.07 0.32 0.04 , 1.52 Similar
Concord Hospital 1.04 0.70 , 1.49 0.53 0.28 , 0.90 Similar
Cottage Hospital † † † † †
DHMC 0.65 0.51 , 0.83 0.71 0.53 , 0.90 Similar
Elliot Hospital 0.94 0.59 , 1.42 1.04 0.64 , 1.59 Similar
Exeter Hospital 0.92 0.47 , 1.64 1.02 0.51 , 1.83 Similar
Franklin Regional † † † † †
Frisbie Memorial 1.30 0.68 , 2.26 0.81 0.30 , 1.76 Similar
Huggins Hospital 1.49 0.25 , 4.93 0.87 0.01 , 4.84 Similar
Lakes Region General 0.47 0.15 , 1.13 0.37 0.07 , 1.08 Similar
Littleton Regional 0.67 0.11 , 2.23 0.66 0.07 , 2.37 Similar
Monadnock Community 0.00 - , 2.70 0.75 0.01 , 4.19 Similar
New London Hospital 0.81 - , 2.42 1.31 0.15 , 4.75 Similar
Parkland Medical Center 0.58 0.18 , 1.39 0.18 - , 0.99 Similar
Portsmouth Regional 0.56 0.30 , 0.95 0.57 0.29 , 1.00 Similar
Southern NH Medical 0.71 0.33 , 1.35 0.73 0.31 , 1.43 Similar
Speare Memorial Hospital 1.00 0.05 , 4.93 1.78 0.48 , 4.56 Similar
St. Joseph Hospital 0.60 0.22 , 1.34 0.82 0.33 , 1.70 Similar
The Memorial Hospital 1.22 0.20 , 4.03 3.72 1.36 , 8.09 Similar
Upper Connecticut Valley † † † † †
Valley Regional Hospital † † 0.36 0.00 , 2.00 N/A
Weeks Medical Center 0.00 - , 2.94 † † N/A
Wentworth-Douglass 0.61 0.28 , 1.15 0.83 0.40 , 1.52 Similar
State Total 0.72 0.63 , 0.83 0.73 0.63 , 0.84 Similar
State of New Hampshire Healthcare-Associated Infections 2016 Hospital Report
NH Department of Health and Human Services September 12, 2017 Division of Public Health Services
-37-
C. Central Line-Associated Bloodstream Infections Table 5 shows the number of CLABSI identified in ICU at each hospital in NH. Among ICU with sufficiently robust data to present, all ICU observed a similar CLABSI rate to national rates. As shown in Table 6, one hospital observed similar CLABSI rates for all birthweight categories and one hospital saw a significantly higher CLABSI rate in comparison to the national data for
Birthweight categories B, C, and D6. See methods for additional information on data collection.
6 Birthweight Category A ≤750 grams, Birthweight Category B =751-1000 grams, Birthweight Category C =1001-
1500 grams, Birthweight Category D =1501 2500 grams, and Birthweight Category E >2500 grams
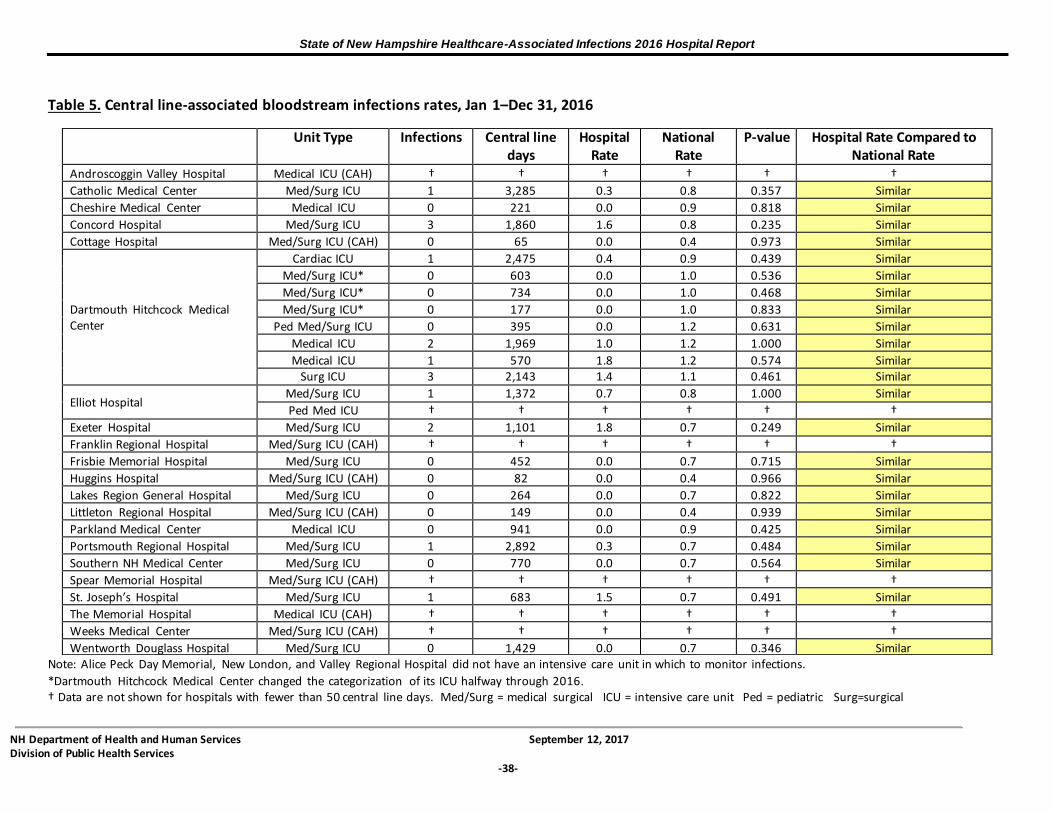
State of New Hampshire Healthcare-Associated Infections 2016 Hospital Report
NH Department of Health and Human Services September 12, 2017 Division of Public Health Services
-38-
Table 5. Central line-associated bloodstream infections rates, Jan 1–Dec 31, 2016
Note: Alice Peck Day Memorial, New London, and Valley Regional Hospital did not have an intensive care unit in which to monitor infections.
*Dartmouth Hitchcock Medical Center changed the categorization of its ICU halfway through 2016. † Data are not shown for hospitals with fewer than 50 central line days. Med/Surg = medical surgical ICU = intensive care unit Ped = pediatric Surg=surgical
Unit Type Infections Central line days
Hospital Rate
National Rate
P-value Hospital Rate Compared to National Rate
Androscoggin Valley Hospital Medical ICU (CAH) † † † † † †
Catholic Medical Center Med/Surg ICU 1 3,285 0.3 0.8 0.357 Similar
Cheshire Medical Center Medical ICU 0 221 0.0 0.9 0.818 Similar
Concord Hospital Med/Surg ICU 3 1,860 1.6 0.8 0.235 Similar
Cottage Hospital Med/Surg ICU (CAH) 0 65 0.0 0.4 0.973 Similar
Dartmouth Hitchcock Medical Center
Cardiac ICU 1 2,475 0.4 0.9 0.439 Similar
Med/Surg ICU* 0 603 0.0 1.0 0.536 Similar
Med/Surg ICU* 0 734 0.0 1.0 0.468 Similar
Med/Surg ICU* 0 177 0.0 1.0 0.833 Similar
Ped Med/Surg ICU 0 395 0.0 1.2 0.631 Similar
Medical ICU 2 1,969 1.0 1.2 1.000 Similar
Medical ICU 1 570 1.8 1.2 0.574 Similar Surg ICU 3 2,143 1.4 1.1 0.461 Similar
Elliot Hospital Med/Surg ICU 1 1,372 0.7 0.8 1.000 Similar
Ped Med ICU † † † † † †
Exeter Hospital Med/Surg ICU 2 1,101 1.8 0.7 0.249 Similar
Franklin Regional Hospital Med/Surg ICU (CAH) † † † † † †
Frisbie Memorial Hospital Med/Surg ICU 0 452 0.0 0.7 0.715 Similar
Huggins Hospital Med/Surg ICU (CAH) 0 82 0.0 0.4 0.966 Similar
Lakes Region General Hospital Med/Surg ICU 0 264 0.0 0.7 0.822 Similar
Littleton Regional Hospital Med/Surg ICU (CAH) 0 149 0.0 0.4 0.939 Similar
Parkland Medical Center Medical ICU 0 941 0.0 0.9 0.425 Similar
Portsmouth Regional Hospital Med/Surg ICU 1 2,892 0.3 0.7 0.484 Similar
Southern NH Medical Center Med/Surg ICU 0 770 0.0 0.7 0.564 Similar
Spear Memorial Hospital Med/Surg ICU (CAH) † † † † † †
St. Joseph’s Hospital Med/Surg ICU 1 683 1.5 0.7 0.491 Similar
The Memorial Hospital Medical ICU (CAH) † † † † † †
Weeks Medical Center Med/Surg ICU (CAH) † † † † † †
Wentworth Douglass Hospital Med/Surg ICU 0 1,429 0.0 0.7 0.346 Similar

State of New Hampshire Healthcare-Associated Infections 2016 Hospital Report
NH Department of Health and Human Services September 12, 2017 Division of Public Health Services
-39-
Table 6. Central line-associated bloodstream infections rates in neonatal intensive care units by birthweight category, Jan 1–Dec 31, 2016
Note: DHMC, Elliot, and Southern NH Medical have neonatal intensive care units. All other hospitals do not and as such, had no data to report.
† Data are not shown for hospitals with fewer than 50 central line days for each birthweight category.
Birthweight Category Infections Central line days
Hospital Rate
National Rate P-value Hospital Rate Compared to National Rate
DHMC
BW Category A ≤750 g 0 186 0.0 2.6 0.618 Similar
BW Category B =751-1000 g 0 168 0.0 1.4 0.784 Similar
BW Category C =1001-1500 g 0 193 0.0 0.9 0.846 Similar
BW Category D =1501-2500 g 0 181 0.0 0.5 0.911 Similar
BW Category E >2500 g 0 212 0.0 0.4 0.914 Similar
Elliot Hospital
BW Category A ≤750 g 0 139 0.0 2.6 0.698 Similar
BW Category B =751-1000 g 1 194 5.2 1.4 0.279 Similar
BW Category C =1001-1500 g 0 151 0.0 0.9 0.877 Similar
BW Category D =1501-2500 g 2 471 4.2 0.5 0.029 Higher
BW Category E >2500 g 0 169 0.0 0.4 0.931 Similar
Southern NH Medical
BW Category A ≤750 g † † † † † †
BW Category B =751-1000 g † † † † † †
BW Category C =1001-1500 g † † † † † †
BW Category D =1501-2500 g † † † † † †
BW Category E >2500 g † † † † † †

State of New Hampshire Healthcare-Associated Infections 2016 Hospital Report
NH Department of Health and Human Services September 12, 2017 Division of Public Health Services
-40-
CLABSI Standardized Infection Ratios Overall, the observed number of CLABSI was 61% fewer than predicted based on national data. The analysis presented in Table 7 and Figure 5 shows that nine hospitals observed a similar number of infections as predicted, one hospital reported fewer infections than predicted and none of the hospitals observed more infections than predicted based on national data.
Table 7. Central line-associated bloodstream infections standardized infection ratios, Jan 1–
Dec 31, 2016
Note: Alice Peck Day Memorial, Monadnock Community Hospital, New London, and Valley Regional Hospital did not have an intensive care unit in which to monitor infections. † Data are not shown for hospitals with less than one predicted infection. - Facility did not report any data contributing to a SIR during this time period.
Observed Infections
Predicted Infections
Standardized Infection
Ratio (SIR)
95% Confidence
Interval
Comparison to Predicted Number
of Infections
Alice Peck Day Memorial - - - - -
Androscoggin Valley † † † † †
Catholic Medical Center 1 4.93 0.20 0.01 , 1.00 Similar
Cheshire Medical Center † † † † †
Concord Hospital 3 2.79 1.08 0.27 , 2.93 Similar
Cottage Hospital † † † † †
DHMC 7 22.96 0.31 0.13 , 0.60 Lower
Elliot Hospital 4 4.36 0.92 0.29 , 2.21 Similar
Exeter Hospital 2 1.65 1.21 0.20 , 4.00 Similar
Franklin Regional † † † † †
Frisbie Memorial † † † † †
Huggins Hospital † † † † †
Lakes Region General † † † † †
Littleton Regional † † † † †
Monadnock Community - - - - -
New London Hospital - - - - -
Parkland Medical Center 0 1.79 0.00 - , 1.68 Similar
Portsmouth Regional 1 4.34 0.23 0.01 , 1.14 Similar
Southern NH Medical 0 1.20 0.00 - , 2.49 Similar
Speare Memorial Hospital † † † † †
St. Joseph Hospital 1 1.02 0.98 0.05 , 4.81 Similar
The Memorial Hospital † † † † †
Upper Connecticut Valley - - - - -
Valley Regional Hospital - - - - -
Weeks Medical Center † † † † †
Wentworth-Douglass 0 2.14 0.00 - , 1.40 Similar
State Total 19 49.39 0.39 0.24 , 0.59 Lower

State of New Hampshire Healthcare-Associated Infections 2016 Hospital Report
NH Department of Health and Human Services September 12, 2017 Division of Public Health Services
-41-
Figure 5. Central line-associated bloodstream infections standardized infection ratios, Jan 1-Dec 31, 2016
Note: Data are not shown for hospitals with less than one predicted infection. Alice Peck Day, New London, Monadnock Community Hospital and Valley Regional Hospital did not have intensive care units in which to monitor
infections.

State of New Hampshire Healthcare-Associated Infections 2016 Hospital Report
NH Department of Health and Human Services September 12, 2017 Division of Public Health Services
-42-
Central Line-Associated Bloodstream Infections: Comparison to 2015 Data
Overall, in 2016 the statewide CLABSI SIR was similar to 2015. The analysis presented in Table 8
shows that all nine hospitals for which data are shown observed a similar number of infections in 2016 and 2015. Figure 6 shows that CLABSI SIR varied since 2011 and was lower than
predicted based on national data.
Table 8. Central line-associated bloodstream infections standardized infection ratios, comparison between 2015 and 2016
Hospital Standardized Infection
Ratio (SIR) 2016
95% Confidence
Interval 2016
Standardized Infection
Ratio (SIR) 2015
95% Confidence
Interval 2015
2016 Compared to
2015
Alice Peck Day Memorial - - - - -
Androscoggin Valley † † † † †
Catholic Medical Center 0.20 0.01 , 1.00 0.60 0.15 , 1.62 Similar
Cheshire Medical Center † † † † †
Concord Hospital 1.08 0.27 , 2.93 0.00 - , 1.19 Similar
Cottage Hospital † † † † †
DHMC 0.31 0.13 , 0.60 0.85 0.54, 1.28 Similar
Elliot Hospital 0.92 0.29 , 2.21 0.41 0.07, 1.36 Similar
Exeter Hospital 1.21 0.20 , 4.00 1.06 0.18, 3.51 Similar
Franklin Regional † † † † †
Frisbie Memorial † † † † †
Huggins Hospital † † † † †
Lakes Region General † † † † †
Littleton Regional † † † † †
Monadnock Community - - - - -
New London Hospital - - - - -
Parkland Medical Center 0.00 - , 1.68 0.00 - , 2.69 Similar
Portsmouth Regional 0.23 0.01 , 1.14 0.49 0.08, 1.61 Similar
Southern NH Medical 0.00 - , 2.49 0.00 - , 2.81 Similar
Speare Memorial Hospital † † † † †
St. Joseph Hospital 0.98 0.05 , 4.81 † † N/A
The Memorial Hospital † † † † †
Upper Connecticut Valley - - † † N/A
Valley Regional Hospital - - - - -
Weeks Medical Center † † † † †
Wentworth-Douglass 0.00 - , 1.40 0.00 - , 1.59 Similar
State Total 0.39 0.24 , 0.59 0.52 0.43, 0.86 Similar
Note: Alice Peck Day Memorial, New London, Monadnock Community Hospital and Valley Regional Hospital did not have an intensive care unit in which to monitor infections in 2015 and/or 2016. † Data are not shown for hospitals with less than one predicted infection. - Facility did not report any data contributing to a SIR during this time period.
N/A or not applicable: Comparison between two years of data at a given facility is not applicable if no data were reported by that facility and/or if data must be censored for one or more of the years presented
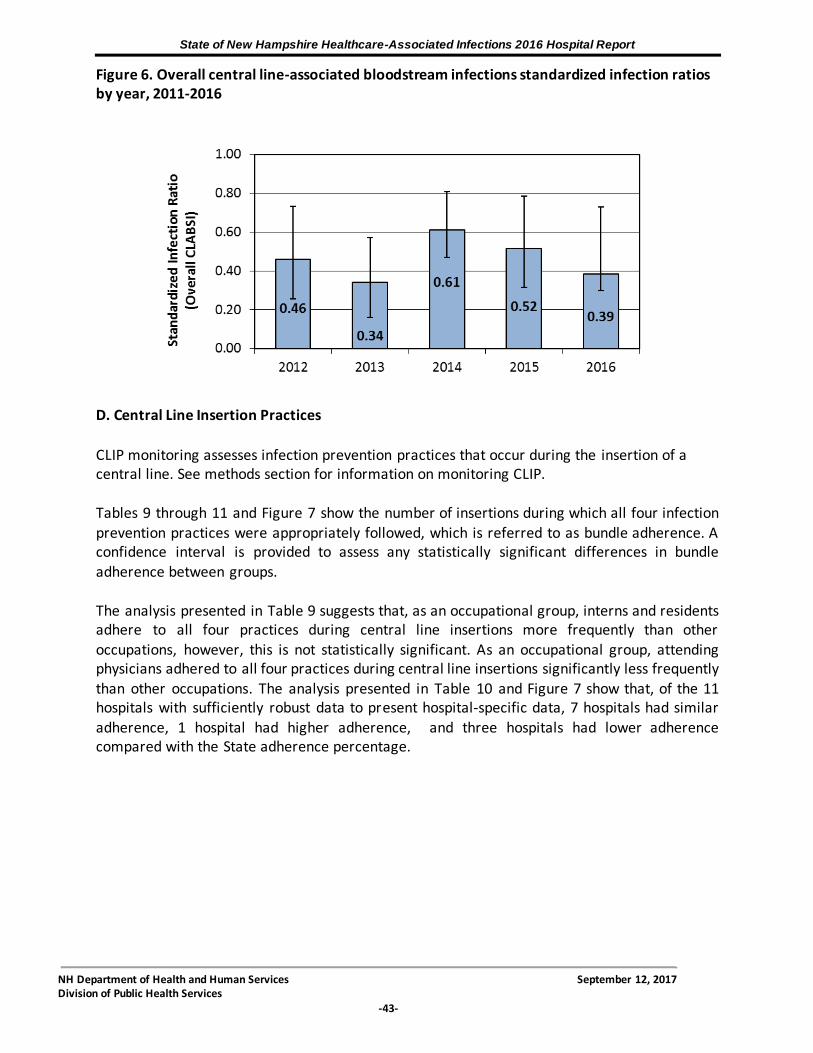
State of New Hampshire Healthcare-Associated Infections 2016 Hospital Report
NH Department of Health and Human Services September 12, 2017 Division of Public Health Services
-43-
Figure 6. Overall central line-associated bloodstream infections standardized infection ratios by year, 2011-2016
D. Central Line Insertion Practices
CLIP monitoring assesses infection prevention practices that occur during the insertion of a central line. See methods section for information on monitoring CLIP. Tables 9 through 11 and Figure 7 show the number of insertions during which all four infection prevention practices were appropriately followed, which is referred to as bundle adherence. A confidence interval is provided to assess any statistically significant differences in bundle adherence between groups. The analysis presented in Table 9 suggests that, as an occupational group, interns and residents adhere to all four practices during central line insertions more frequently than other
occupations, however, this is not statistically significant. As an occupational group, attending physicians adhered to all four practices during central line insertions significantly less frequently
than other occupations. The analysis presented in Table 10 and Figure 7 show that, of the 11 hospitals with sufficiently robust data to present hospital-specific data, 7 hospitals had similar
adherence, 1 hospital had higher adherence, and three hospitals had lower adherence compared with the State adherence percentage.

State of New Hampshire Healthcare-Associated Infections 2016 Hospital Report
NH Department of Health and Human Services September 12, 2017 Division of Public Health Services
-44-
Table 9. Central line insertion practices adherence percentages by occupation of inserter, Jan 1–Dec 31, 2016 Occupation of Inserter Insertions that
Adhered to Bundle*
Total Number of Insertions
% Adherence
*
95% Confidence
Interval
Occupation % Compared to
State %
Advanced Practice Nurse 414 419 98.8% 97.4 , 99.6 Similar
Attending Physician 686 713 96.2% 94.6 , 97.4 Lower
Fellow 184 185 99.5% 97.4 , - Similar
Intern/Resident 414 415 99.8% 98.8 , - Similar
Other † † † † †
Other Medical Staff 132 134 98.5% 95.2 , 99.8 Similar
Physician Assistant 88 89 98.9% 94.6 , 99.9 Similar
Registered Nurse 727 732 99.3% 98.5 , 99.8 Similar
Total State 2,648 2,692 98.4% 97.8 , 98.8
Note: Other Medical Staff represents other (non-attending) physicians. * Bundle adherence refers to performing all four infection prevention practices during central line insertion. † Data are not shown when fewer than 20 insertions were performed.

State of New Hampshire Healthcare-Associated Infections 2016 Hospital Report
NH Department of Health and Human Services September 12, 2017 Division of Public Health Services
-45-
Table 10. Central line insertion practices adherence percentages by hospital, Jan 1–Dec 31, 2016 Hospital Insertions
that Adhered to Bundle*
Total Number of Insertions
% Adherence*
95% Confidence
Interval
Hospital % Compared to State %
Alice Peck Day Memorial - - - - -
Androscoggin Valley † † † † †
Catholic Medical Center † † † † †
Cheshire Medical Center 41 41 100.0 93.0 , - Similar
Concord Hospital 276 279 98.9 97.1 , 99.7 Similar
Cottage Hospital † † † † †
DHMC 1,049 1,052 99.7 99.2 , 99.9 Higher
Elliot Hospital 446 465 95.9 93.8 , 97.5 Lower
Exeter Hospital 115 116 99.1 95.8 , - Similar
Franklin Regional - - - - -
Frisbie Memorial † † † † †
Huggins Hospital † † † † †
Lakes Region General † † † † †
Littleton Regional 24 24 100.0 88.3 , - Similar
Monadnock Community - - - - -
New London Hospital - - - - -
Parkland Medical Center 120 128 93.8 88.5 , 97.1 Lower
Portsmouth Regional 199 199 100.0 98.5 , - Similar
Southern NH Medical 148 149 99.3 96.7 , - Similar
Speare Memorial Hospital † † † † †
St. Joseph Hospital 67 72 93.1 85.3 , 97.4 Lower
The Memorial Hospital † † † † †
Upper Connecticut Valley - - - - -
Valley Regional Hospital - - - - -
Weeks Medical Center † † † † †
Wentworth-Douglass 76 78 97.4 91.8 , 99.6 Similar
State Total 2,648 2,692 98.4 97.8 , 98.8
Note: Alice Peck Day Memorial, New London, Monadnock Community Hospital and Valley Regional Hospital did not have intensive care units in which to monitor insertion practices.
† Data are not shown when fewer than 20 insertions were performed. * Bundle adherence refers to performing all four infection prevention practices during central line insertion. - Facility did not report any data contributing to an adherence percentage during this time period.

State of New Hampshire Healthcare-Associated Infections 2016 Hospital Report
NH Department of Health and Human Services September 12, 2017 Division of Public Health Services
-46-
Figure 7. Central line insertion practices adherence percentages by hospital, Jan 1–Dec 31, 2016
Note: Data are not shown when fewer than 20 insertions were performed. Alice Peck Day Memorial, New London,
Monadnock Community Hospital and Valley Regional Hospital did not have intensive care units in which to monitor insertion practices. * Bundle adherence refers to performing all four infection prevention practices during central line insertion.
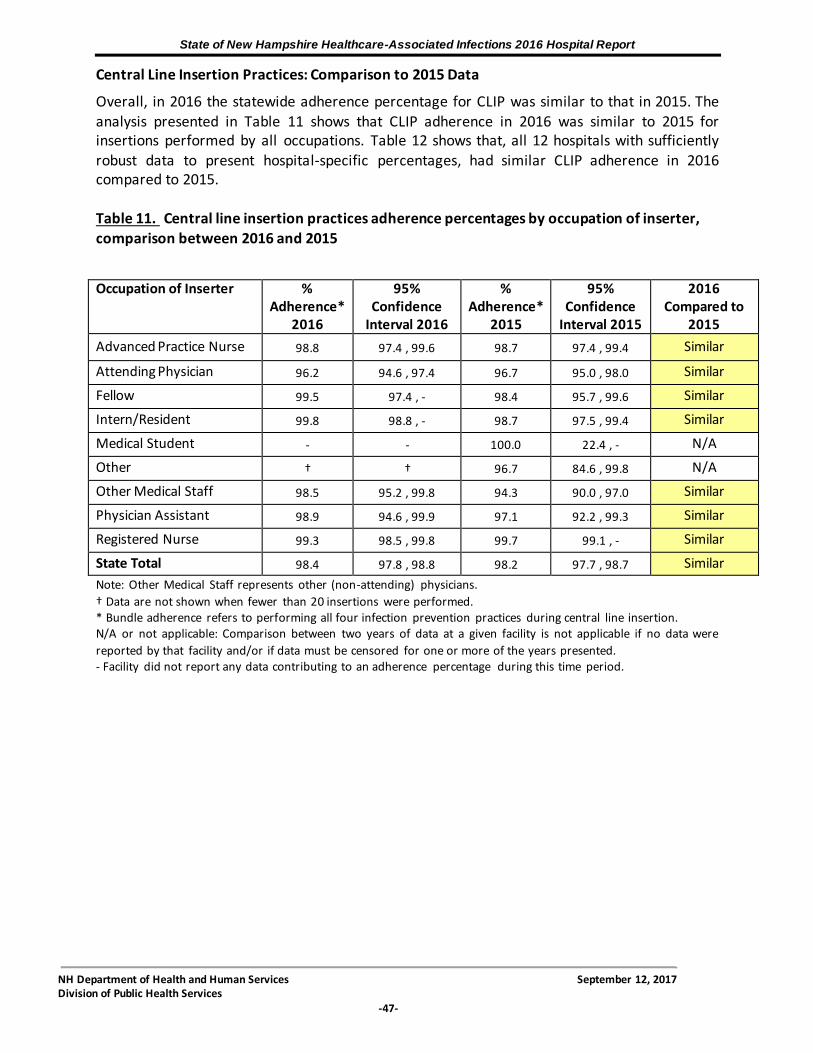
State of New Hampshire Healthcare-Associated Infections 2016 Hospital Report
NH Department of Health and Human Services September 12, 2017 Division of Public Health Services
-47-
Central Line Insertion Practices: Comparison to 2015 Data
Overall, in 2016 the statewide adherence percentage for CLIP was similar to that in 2015. The
analysis presented in Table 11 shows that CLIP adherence in 2016 was similar to 2015 for insertions performed by all occupations. Table 12 shows that, all 12 hospitals with sufficiently
robust data to present hospital-specific percentages, had similar CLIP adherence in 2016 compared to 2015.
Table 11. Central line insertion practices adherence percentages by occupation of inserter,
comparison between 2016 and 2015
Occupation of Inserter %
Adherence* 2016
95% Confidence
Interval 2016
% Adherence*
2015
95% Confidence
Interval 2015
2016 Compared to
2015
Advanced Practice Nurse 98.8 97.4 , 99.6 98.7 97.4 , 99.4 Similar
Attending Physician 96.2 94.6 , 97.4 96.7 95.0 , 98.0 Similar
Fellow 99.5 97.4 , - 98.4 95.7 , 99.6 Similar
Intern/Resident 99.8 98.8 , - 98.7 97.5 , 99.4 Similar
Medical Student - - 100.0 22.4 , - N/A
Other † † 96.7 84.6 , 99.8 N/A
Other Medical Staff 98.5 95.2 , 99.8 94.3 90.0 , 97.0 Similar
Physician Assistant 98.9 94.6 , 99.9 97.1 92.2 , 99.3 Similar
Registered Nurse 99.3 98.5 , 99.8 99.7 99.1 , - Similar
State Total 98.4 97.8 , 98.8 98.2 97.7 , 98.7 Similar
Note: Other Medical Staff represents other (non-attending) physicians.
† Data are not shown when fewer than 20 insertions were performed. * Bundle adherence refers to performing all four infection prevention practices during central line insertion. N/A or not applicable: Comparison between two years of data at a given facility is not applicable if no data were
reported by that facility and/or if data must be censored for one or more of the years presented. - Facility did not report any data contributing to an adherence percentage during this time period.
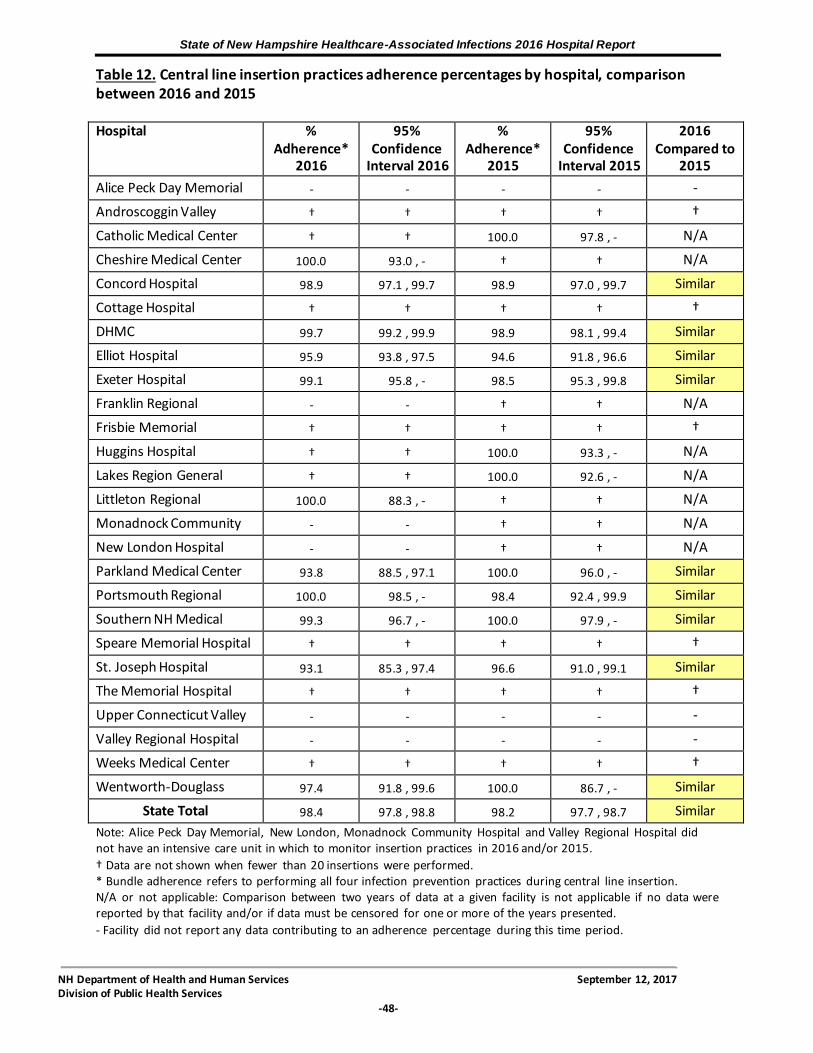
State of New Hampshire Healthcare-Associated Infections 2016 Hospital Report
NH Department of Health and Human Services September 12, 2017 Division of Public Health Services
-48-
Table 12. Central line insertion practices adherence percentages by hospital, comparison between 2016 and 2015 Hospital %
Adherence* 2016
95% Confidence
Interval 2016
% Adherence*
2015
95% Confidence
Interval 2015
2016 Compared to
2015
Alice Peck Day Memorial - - - - -
Androscoggin Valley † † † † †
Catholic Medical Center † † 100.0 97.8 , - N/A
Cheshire Medical Center 100.0 93.0 , - † † N/A
Concord Hospital 98.9 97.1 , 99.7 98.9 97.0 , 99.7 Similar
Cottage Hospital † † † † †
DHMC 99.7 99.2 , 99.9 98.9 98.1 , 99.4 Similar
Elliot Hospital 95.9 93.8 , 97.5 94.6 91.8 , 96.6 Similar
Exeter Hospital 99.1 95.8 , - 98.5 95.3 , 99.8 Similar
Franklin Regional - - † † N/A
Frisbie Memorial † † † † †
Huggins Hospital † † 100.0 93.3 , - N/A
Lakes Region General † † 100.0 92.6 , - N/A
Littleton Regional 100.0 88.3 , - † † N/A
Monadnock Community - - † † N/A
New London Hospital - - † † N/A
Parkland Medical Center 93.8 88.5 , 97.1 100.0 96.0 , - Similar
Portsmouth Regional 100.0 98.5 , - 98.4 92.4 , 99.9 Similar
Southern NH Medical 99.3 96.7 , - 100.0 97.9 , - Similar
Speare Memorial Hospital † † † † †
St. Joseph Hospital 93.1 85.3 , 97.4 96.6 91.0 , 99.1 Similar
The Memorial Hospital † † † † †
Upper Connecticut Valley - - - - -
Valley Regional Hospital - - - - -
Weeks Medical Center † † † † †
Wentworth-Douglass 97.4 91.8 , 99.6 100.0 86.7 , - Similar
State Total 98.4 97.8 , 98.8 98.2 97.7 , 98.7 Similar
Note: Alice Peck Day Memorial, New London, Monadnock Community Hospital and Valley Regional Hospital did not have an intensive care unit in which to monitor insertion practices in 2016 and/or 2015.
† Data are not shown when fewer than 20 insertions were performed. * Bundle adherence refers to performing all four infection prevention practices during central line insertion. N/A or not applicable: Comparison between two years of data at a given facility is not applicable if no data were reported by that facility and/or if data must be censored for one or more of the years presented.
- Facility did not report any data contributing to an adherence percentage during this time period.
State of New Hampshire Healthcare-Associated Infections 2016 Hospital Report
NH Department of Health and Human Services September 12, 2017 Division of Public Health Services
-49-
E. Catheter-Associated Urinary Tract Infections
Tables 13 through 15 and Figure 8 show the number of infections that were identified in adult
and pediatric ICU at NH hospitals. The analysis presented in Table 13 shows that among the 20 hospitals that had sufficiently robust data to present ICU rates, 25 ICU observed similar infections as predicted and one ICU observed a higher number of infections, based on national
data. See methods for additional information on data collection.
Statewide Catheter-Associated Urinary Tract Infections Rates
National CAUTI rate data by ICU category were unavailable and the HAI Program was unable to
conduct further analysis as routinely included in this report.
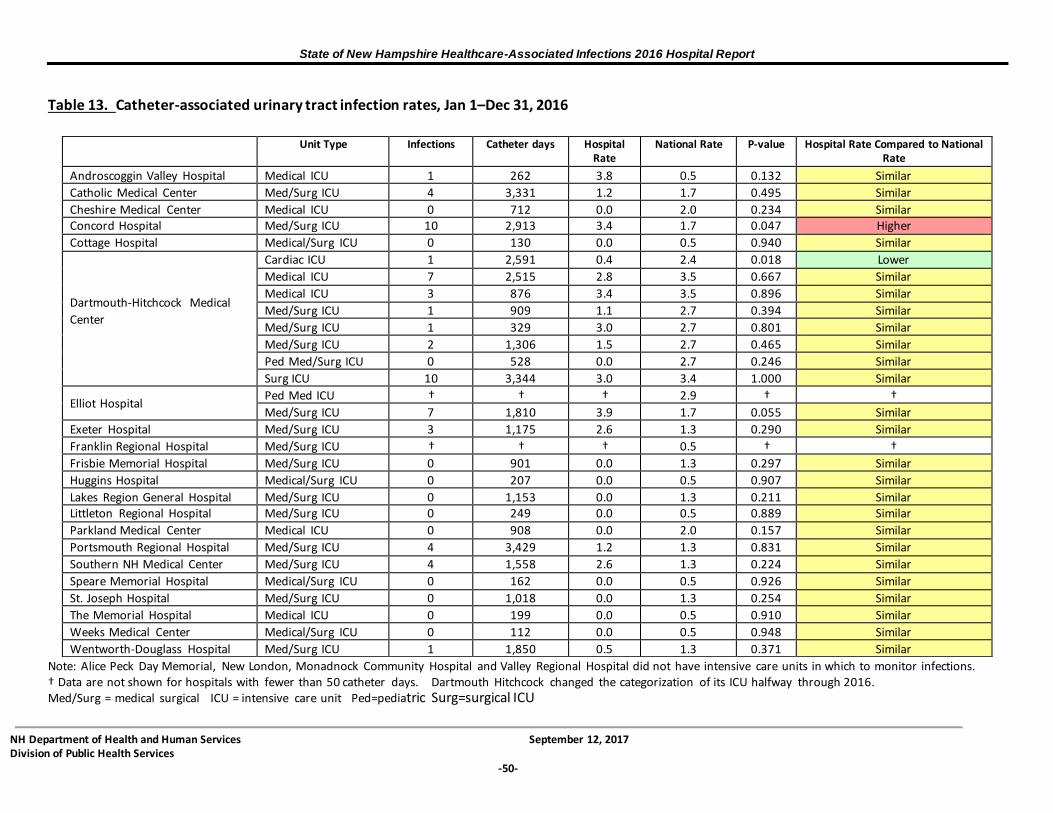
State of New Hampshire Healthcare-Associated Infections 2016 Hospital Report
NH Department of Health and Human Services September 12, 2017 Division of Public Health Services
-50-
Table 13. Catheter-associated urinary tract infection rates, Jan 1–Dec 31, 2016
Note: Alice Peck Day Memorial, New London, Monadnock Community Hospital and Valley Regional Hospital did not have intensive care units in which to monitor infections. † Data are not shown for hospitals with fewer than 50 catheter days. Dartmouth Hitchcock changed the categorization of its ICU halfway through 2016. Med/Surg = medical surgical ICU = intensive care unit Ped=pediatric Surg=surgical ICU
Unit Type Infections Catheter days Hospital Rate
National Rate P-value Hospital Rate Compared to National Rate
Androscoggin Valley Hospital Medical ICU 1 262 3.8 0.5 0.132 Similar
Catholic Medical Center Med/Surg ICU 4 3,331 1.2 1.7 0.495 Similar
Cheshire Medical Center Medical ICU 0 712 0.0 2.0 0.234 Similar Concord Hospital Med/Surg ICU 10 2,913 3.4 1.7 0.047 Higher
Cottage Hospital Medical/Surg ICU 0 130 0.0 0.5 0.940 Similar
Dartmouth-Hitchcock Medical
Center
Cardiac ICU 1 2,591 0.4 2.4 0.018 Lower
Medical ICU 7 2,515 2.8 3.5 0.667 Similar
Medical ICU 3 876 3.4 3.5 0.896 Similar
Med/Surg ICU 1 909 1.1 2.7 0.394 Similar
Med/Surg ICU 1 329 3.0 2.7 0.801 Similar
Med/Surg ICU 2 1,306 1.5 2.7 0.465 Similar
Ped Med/Surg ICU 0 528 0.0 2.7 0.246 Similar
Surg ICU 10 3,344 3.0 3.4 1.000 Similar
Elliot Hospital Ped Med ICU † † † 2.9 † †
Med/Surg ICU 7 1,810 3.9 1.7 0.055 Similar
Exeter Hospital Med/Surg ICU 3 1,175 2.6 1.3 0.290 Similar
Franklin Regional Hospital Med/Surg ICU † † † 0.5 † †
Frisbie Memorial Hospital Med/Surg ICU 0 901 0.0 1.3 0.297 Similar
Huggins Hospital Medical/Surg ICU 0 207 0.0 0.5 0.907 Similar
Lakes Region General Hospital Med/Surg ICU 0 1,153 0.0 1.3 0.211 Similar Littleton Regional Hospital Med/Surg ICU 0 249 0.0 0.5 0.889 Similar
Parkland Medical Center Medical ICU 0 908 0.0 2.0 0.157 Similar
Portsmouth Regional Hospital Med/Surg ICU 4 3,429 1.2 1.3 0.831 Similar
Southern NH Medical Center Med/Surg ICU 4 1,558 2.6 1.3 0.224 Similar
Speare Memorial Hospital Medical/Surg ICU 0 162 0.0 0.5 0.926 Similar
St. Joseph Hospital Med/Surg ICU 0 1,018 0.0 1.3 0.254 Similar
The Memorial Hospital Medical ICU 0 199 0.0 0.5 0.910 Similar
Weeks Medical Center Medical/Surg ICU 0 112 0.0 0.5 0.948 Similar
Wentworth-Douglass Hospital Med/Surg ICU 1 1,850 0.5 1.3 0.371 Similar

State of New Hampshire Healthcare-Associated Infections 2016 Hospital Report
NH Department of Health and Human Services September 12, 2017 Division of Public Health Services
-51-
Catheter-Associated Urinary Tract Infections Standardized Infection Ratios
The observed number of CAUTI was 1% higher than predicted based on national data, however, this was not statistically significant. The analysis presented in Table 14 shows that eleven hospitals
observed a similar number of infections as predicted and two hospitals observed more infections than predicted based on national data.
Table 14. Catheter-associated urinary tract infections standardized infection ratios, Jan 1–Dec 31, 2016
Note: Alice Peck Day Memorial, New London, Monadnock Community Hospital and Valley Regional Hospital did not
have intensive care units in which to monitor infections. † Data are not shown for hospitals with less than one predicted infection. - Facility did not report any data contributing to a SIR during this time period.
Observed Infections
Predicted Infections
Standardized Infection Ratio
(SIR)
95% Confidence
Interval
Comparison to Predicted
Number of Infections
Alice Peck Day Memorial - - - - -
Androscoggin Valley † † † † †
Catholic Medical Center 4 4.00 1.00 0.32 , 2.41 Similar
Cheshire Medical Center 0 1.42 0.00 - , 2.10 Similar
Concord Hospital 10 3.50 2.86 1.45 , 5.10 Higher
Cottage Hospital † † † † †
DHMC 25 29.01 0.86 0.57, 1.25 Similar
Elliot Hospital 7 2.19 3.19 1.40 , 6.31 Higher
Exeter Hospital 3 1.53 1.96 0.50 , 5.35 Similar
Franklin Regional † † † † †
Frisbie Memorial 0 1.17 0.00 - , 2.56 Similar
Huggins Hospital † † † † †
Lakes Region General 0 1.50 0.00 - , 2.00 Similar
Littleton Regional † † † † †
Monadnock Community - - - - -
New London Hospital - - - - -
Parkland Medical Center 0 1.82 0.00 - , 1.65 Similar
Portsmouth Regional 4 4.46 0.90 0.29 , 2.16 Similar
Southern NH Medical 4 2.03 1.98 0.63 , 4.76 Similar
Speare Memorial Hospital † † † † †
St. Joseph Hospital 0 1.32 0.00 - , 2.26 Similar
The Memorial Hospital † † † † †
Upper Connecticut Valley - - - - -
Valley Regional Hospital - - - - -
Weeks Medical Center † † † † †
Wentworth-Douglass 1 2.41 0.42 0.02 , 2.05 Similar
State Total 59 58.40 1.01 0.77 , 1.29 Similar

State of New Hampshire Healthcare-Associated Infections 2016 Hospital Report
NH Department of Health and Human Services September 12, 2017 Division of Public Health Services
-52-
Figure 8. Catheter-associated urinary tract infections standardized infection ratios, Jan 1–Dec 31, 2016
Note: Data are not shown for hospitals with less than one predicted infection. Alice Peck Day Memorial, Monadnock Community Hospital, New London, and Valley Regional Hospital did not have intensive care units in which to monitor infections.
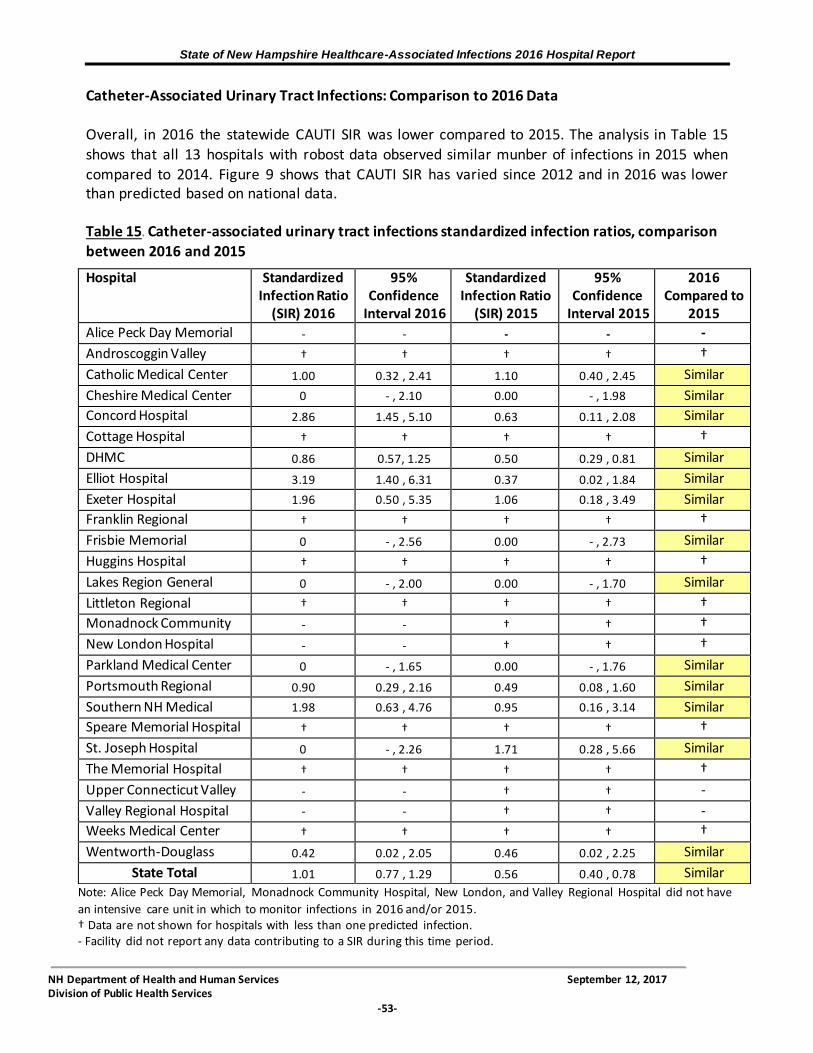
State of New Hampshire Healthcare-Associated Infections 2016 Hospital Report
NH Department of Health and Human Services September 12, 2017 Division of Public Health Services
-53-
Catheter-Associated Urinary Tract Infections: Comparison to 2016 Data Overall, in 2016 the statewide CAUTI SIR was lower compared to 2015. The analysis in Table 15
shows that all 13 hospitals with robost data observed similar munber of infections in 2015 when compared to 2014. Figure 9 shows that CAUTI SIR has varied since 2012 and in 2016 was lower than predicted based on national data.
Table 15. Catheter-associated urinary tract infections standardized infection ratios, comparison between 2016 and 2015
Hospital Standardized Infection Ratio
(SIR) 2016
95% Confidence
Interval 2016
Standardized Infection Ratio
(SIR) 2015
95% Confidence
Interval 2015
2016 Compared to
2015
Alice Peck Day Memorial - - - - -
Androscoggin Valley † † † † †
Catholic Medical Center 1.00 0.32 , 2.41 1.10 0.40 , 2.45 Similar
Cheshire Medical Center 0 - , 2.10 0.00 - , 1.98 Similar
Concord Hospital 2.86 1.45 , 5.10 0.63 0.11 , 2.08 Similar
Cottage Hospital † † † † †
DHMC 0.86 0.57, 1.25 0.50 0.29 , 0.81 Similar
Elliot Hospital 3.19 1.40 , 6.31 0.37 0.02 , 1.84 Similar
Exeter Hospital 1.96 0.50 , 5.35 1.06 0.18 , 3.49 Similar
Franklin Regional † † † † †
Frisbie Memorial 0 - , 2.56 0.00 - , 2.73 Similar
Huggins Hospital † † † † †
Lakes Region General 0 - , 2.00 0.00 - , 1.70 Similar
Littleton Regional † † † † †
Monadnock Community - - † † †
New London Hospital - - † † †
Parkland Medical Center 0 - , 1.65 0.00 - , 1.76 Similar
Portsmouth Regional 0.90 0.29 , 2.16 0.49 0.08 , 1.60 Similar
Southern NH Medical 1.98 0.63 , 4.76 0.95 0.16 , 3.14 Similar
Speare Memorial Hospital † † † † †
St. Joseph Hospital 0 - , 2.26 1.71 0.28 , 5.66 Similar
The Memorial Hospital † † † † †
Upper Connecticut Valley - - † † -
Valley Regional Hospital - - † † -
Weeks Medical Center † † † † †
Wentworth-Douglass 0.42 0.02 , 2.05 0.46 0.02 , 2.25 Similar
State Total 1.01 0.77 , 1.29 0.56 0.40 , 0.78 Similar
Note: Alice Peck Day Memorial, Monadnock Community Hospital, New London, and Valley Regional Hospital did not have
an intensive care unit in which to monitor infections in 2016 and/or 2015. † Data are not shown for hospitals with less than one predicted infection. - Facility did not report any data contributing to a SIR during this time period.

State of New Hampshire Healthcare-Associated Infections 2016 Hospital Report
NH Department of Health and Human Services September 12, 2017 Division of Public Health Services
-54-
Figure 9. Overall catheter-associated urinary tract infections standardized infection ratios by year, 2012-2016
F. Surgical Site Infections
Tables 16-21 and Figures 10-14 below show the number of SSI following the four monitored
procedures reported by each acute care hospital in NH. Overall, the observed number of SSI was 28% fewer than predicted based on national data. The analysis presented in Table 16 shows that all nineteen hospitals with robust data observed similar number of SSI as predicted. For CABG procedures (Table 18), one hospital observed fewer SSI than predicted, and three hospitals observed a similar number of infections as predicted. For colon procedures (Table 19), all 13 hospitals observed a similar number of infections as predicted. For abdominal hysterectomy procedures (Table 20), all seven hospitals observed a similar number of infections as predicted based on national data. For knee arthroplasty procedures (Table 21), one hospitals observed fewer infections and thirteen hospitals observed a similar number of infections as predicted based on national data.
This report does not display SSI rates due to a change in analysis recommendations. SSI data are
presented throughout this report as SIR. This allows more robust adjustment for underlying patient or hospital factors. The SSI SIR is calculated using logistic regression modeling, which
provides better risk adjustment and more appropriate comparisons. See Appendix 1 for technical notes and more detail regarding the SIR. Post-discharge Surveillance for Surgical Site Infections
Hospitals do not use a standard method to identify infections once a patient has been discharged (known as “post-discharge surveillance”). This poses a challenge for data interpretation, because a
higher SSI rate (for example) at a given hospital may represent either poor infection prevention practices or, conversely, a better system for identifying infections. Table 22 shows the percentage
of SSI identified through post-discharge surveillance at each acute care hospital in NH. Of the 22

State of New Hampshire Healthcare-Associated Infections 2016 Hospital Report
NH Department of Health and Human Services September 12, 2017 Division of Public Health Services
-55-
hospitals with sufficiently robust data, 17 hospitals identified a similar number of SSI through post-discharge surveillance, and four hospital identified fewer SSI through post-discharge surveillance when compared to the State rolling average. Out of 153 SSI reported 2016, 38.6% (59) were
detected during admission, 4.5% (7) were detected during readmission at another facility, 33.3% (51) were detected during readmission to the original facility where the procedure took place, and 23.5% (36) were detected post-discharge. Most of the infections detected post-discharge were classified as superficial infections 32.3% (51); 25.3% (40) were deep and zero were organ/space. Of the 37 infections detected post-discharge, 40.5% (15) were colon procedures, 8.1% (3) were CABG procedures, 27.0% (10) were abdominal hysterectomy procedures, and 24.3% (9) were knee arthroplasty procedures. NH hospital infection prevention staff rely primarily on follow-up letters to surgeons, culture reports, and outpatient clinic notes as forms of post-discharge surveillance. Other methods include patient letters and communication with other healthcare facilities.

State of New Hampshire Healthcare-Associated Infections 2016 Hospital Report
NH Department of Health and Human Services September 12, 2017 Division of Public Health Services
-56-
Table 16. Surgical site infections standardized infection ratios, Jan 1–Dec 31, 2016
† Data are not shown for hospitals with less than one predicted infection. - Facility did not perform any of the four procedures being monitored during 2016
Hospital Observed Infections
Predicted Infections
Standardized Infection
Ratio (SIR)
95% Confidence
Interval
Comparison to Predicted Number
of Infections
Alice Peck Day Memorial 0 1.71 0.00 - , 1.75 Similar
Androscoggin Valley 2 1.34 1.49 0.25 , 4.94 Similar
Catholic Medical Center 1 3.98 0.25 0.01 , 1.24 Similar
Cheshire Medical Center 12 17.28 0.70 0.38 , 1.18 Similar
Concord Hospital 14 19.64 0.71 0.41 , 1.17 Similar
Cottage Hospital † † † † †
DHMC 31 44.41 0.70 0.48 , 0.98 Lower
Elliot Hospital 9 14.77 0.61 0.30 , 1.12 Similar
Exeter Hospital 5 7.69 0.65 0.24 , 1.44 Similar
Franklin Regional - - - - -
Frisbie Memorial 11 6.63 1.66 0.87 , 2.88 Similar
Huggins Hospital † † † † †
Lakes Region General 4 6.63 0.60 0.19 , 1.46 Similar
Littleton Regional 2 2.42 0.83 0.14 , 2.73 Similar
Monadnock Community 0 1.11 0.00 - , 2.70 Similar
New London Hospital 1 1.24 0.81 0.04 , 3.98 Similar
Parkland Medical Center 4 3.32 1.21 0.38 , 2.91 Similar
Portsmouth Regional 7 12.66 0.55 0.24 , 1.09 Similar
Southern NH Medical 4 8.02 0.50 0.16 , 1.20 Similar
Speare Memorial Hospital † † † † †
St. Joseph Hospital 4 5.95 0.67 0.21 , 1.62 Similar
The Memorial Hospital 2 1.16 1.72 0.29 , 5.69 Similar
Upper Connecticut Valley - - - - -
Valley Regional Hospital - - - - -
Weeks Medical Center † † † † †
Wentworth-Douglass 7 8.66 0.81 0.35 , 1.60 Similar
State Total 124 171.63 0.72 0.60 , 0.86 Lower

State of New Hampshire Healthcare-Associated Infections 2016 Hospital Report
NH Department of Health and Human Services September 12, 2017 Division of Public Health Services
-57-
Figure 10. Surgical site infections standardized infection ratios, Jan 1–Dec 31, 2016
Note: Data are not shown for hospitals with less than one predicted infection.
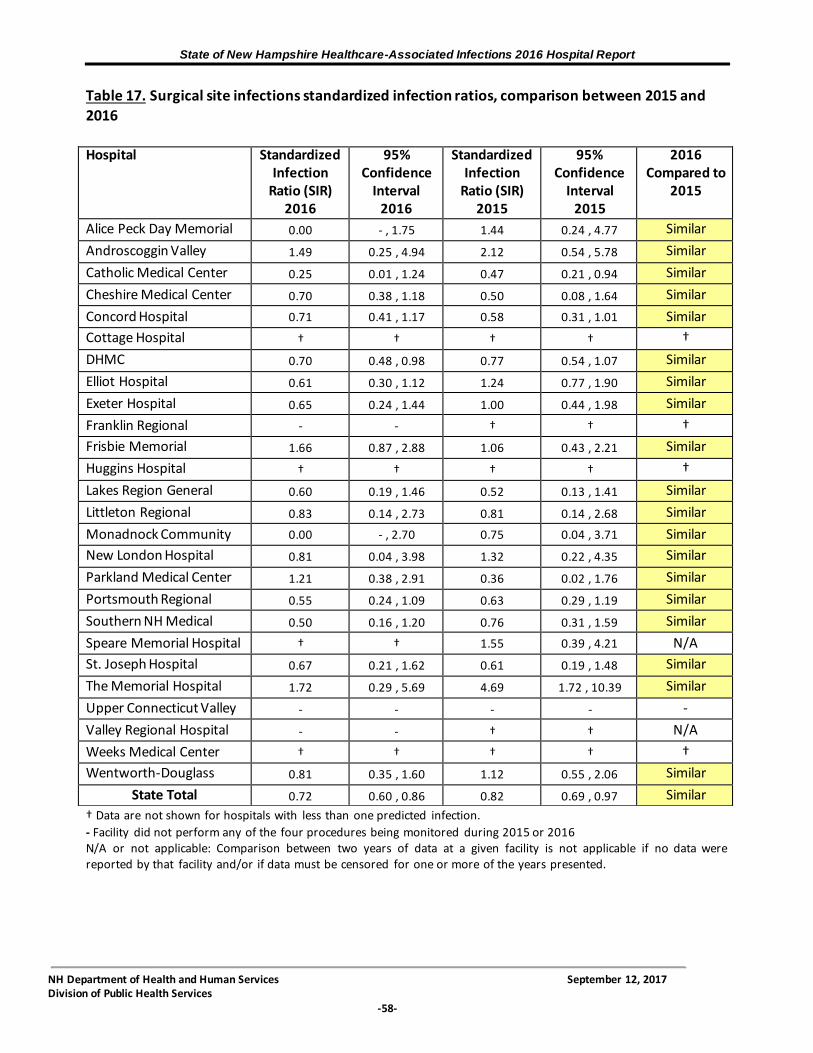
State of New Hampshire Healthcare-Associated Infections 2016 Hospital Report
NH Department of Health and Human Services September 12, 2017 Division of Public Health Services
-58-
Table 17. Surgical site infections standardized infection ratios, comparison between 2015 and 2016
† Data are not shown for hospitals with less than one predicted infection.
- Facility did not perform any of the four procedures being monitored during 2015 or 2016 N/A or not applicable: Comparison between two years of data at a given facility is not applicable if no data were reported by that facility and/or if data must be censored for one or more of the years presented.
Hospital Standardized Infection
Ratio (SIR) 2016
95% Confidence
Interval 2016
Standardized Infection
Ratio (SIR) 2015
95% Confidence
Interval 2015
2016 Compared to
2015
Alice Peck Day Memorial 0.00 - , 1.75 1.44 0.24 , 4.77 Similar
Androscoggin Valley 1.49 0.25 , 4.94 2.12 0.54 , 5.78 Similar
Catholic Medical Center 0.25 0.01 , 1.24 0.47 0.21 , 0.94 Similar
Cheshire Medical Center 0.70 0.38 , 1.18 0.50 0.08 , 1.64 Similar
Concord Hospital 0.71 0.41 , 1.17 0.58 0.31 , 1.01 Similar
Cottage Hospital † † † † †
DHMC 0.70 0.48 , 0.98 0.77 0.54 , 1.07 Similar
Elliot Hospital 0.61 0.30 , 1.12 1.24 0.77 , 1.90 Similar
Exeter Hospital 0.65 0.24 , 1.44 1.00 0.44 , 1.98 Similar
Franklin Regional - - † † †
Frisbie Memorial 1.66 0.87 , 2.88 1.06 0.43 , 2.21 Similar
Huggins Hospital † † † † †
Lakes Region General 0.60 0.19 , 1.46 0.52 0.13 , 1.41 Similar
Littleton Regional 0.83 0.14 , 2.73 0.81 0.14 , 2.68 Similar
Monadnock Community 0.00 - , 2.70 0.75 0.04 , 3.71 Similar
New London Hospital 0.81 0.04 , 3.98 1.32 0.22 , 4.35 Similar
Parkland Medical Center 1.21 0.38 , 2.91 0.36 0.02 , 1.76 Similar
Portsmouth Regional 0.55 0.24 , 1.09 0.63 0.29 , 1.19 Similar
Southern NH Medical 0.50 0.16 , 1.20 0.76 0.31 , 1.59 Similar
Speare Memorial Hospital † † 1.55 0.39 , 4.21 N/A
St. Joseph Hospital 0.67 0.21 , 1.62 0.61 0.19 , 1.48 Similar
The Memorial Hospital 1.72 0.29 , 5.69 4.69 1.72 , 10.39 Similar
Upper Connecticut Valley - - - - -
Valley Regional Hospital - - † † N/A
Weeks Medical Center † † † † †
Wentworth-Douglass 0.81 0.35 , 1.60 1.12 0.55 , 2.06 Similar
State Total 0.72 0.60 , 0.86 0.82 0.69 , 0.97 Similar

State of New Hampshire Healthcare-Associated Infections 2016 Hospital Report
NH Department of Health and Human Services September 12, 2017 Division of Public Health Services
-59-
Table 18. Coronary artery bypass graft procedure-associated surgical site infections standardized infection ratios, Jan 1–Dec 31, 2016
* There were three secondary infections in 2016. Secondary infections at the donor/graft site (where the vessel was taken from) are not included in the SIR, and are not included in the table above.
Figure 11. Coronary artery bypass graft procedure-associated surgical site infections standardized infection ratios, Jan 1–Dec 31, 2016
Hospital Observed Infections
Predicted Infections
Standardized Infection
Ratio (SIR)
95% Confidence
Interval
Comparison to Predicted Number
of Infections
Catholic Medical Center 2 1.68 1.19 0.20 , 3.93 Similar
Concord Hospital 3 5.50 0.55 0.14 , 0.48 Lower
DHMC 3 5.05 0.59 0.15 , 1.62 Similar
Portsmouth Regional 5 7.76 0.64 0.24 , 1.43 Similar
State Total 13 19.99 0.65 0.36 , 1.08 Similar

State of New Hampshire Healthcare-Associated Infections 2016 Hospital Report
NH Department of Health and Human Services September 12, 2017 Division of Public Health Services
-60-
Table 19. Colon procedure-associated surgical site infections standardized infection ratios, Jan 1–Dec 31, 2016
† Data are not shown for hospitals with less than one predicted infection.
- Facility did not perform this procedure during 2016
Hospital Observed Infections
Predicted Infections
Standardized Infection Ratio
(SIR)
95% Confidence
Interval
Comparison to Predicted Number
of Infections
Alice Peck Day Memorial - - - - -
Androscoggin Valley † † † † †
Catholic Medical Center 6 6.10 0.98 0.40 , 2.05 Similar
Cheshire Medical Center 1 2.59 0.39 0.02 , 1.91 Similar
Concord Hospital 10 7.52 1.33 0.68 , 2.37 Similar
Cottage Hospital † † † † †
DHMC 18 24.09 0.75 0.46 , 1.16 Similar
Elliot Hospital 6 8.82 0.68 0.28 , 1.42 Similar
Exeter Hospital 5 5.50 0.91 0.33 , 2.01 Similar
Franklin Regional - - - - -
Frisbie Memorial 6 3.95 1.52 0.62 , 3.16 Similar
Huggins Hospital † † † † †
Lakes Region General 2 3.32 0.60 0.10 , 1.99 Similar
Littleton Regional † † † † †
Monadnock Community † † † † †
New London Hospital † † † † †
Parkland Medical Center 4 2.25 1.78 0.57 , 4.29 Similar
Portsmouth Regional 1 3.08 0.33 0.02 , 1.60 Similar
Southern NH Medical 3 4.97 0.60 0.15 , 1.64 Similar
Speare Memorial Hospital † † † † †
St. Joseph Hospital 2 2.46 0.81 0.14 , 2.69 Similar
The Memorial Hospital † † † † †
Upper Connecticut Valley † † † † †
Valley Regional Hospital - - - - -
Weeks Medical Center † † † † †
Wentworth-Douglass 5 4.22 1.19 0.44 , 2.63 Similar
State Total 78 83.90 0.93 0.74 , 1.15 Similar

State of New Hampshire Healthcare-Associated Infections 2016 Hospital Report
NH Department of Health and Human Services September 12, 2017 Division of Public Health Services
-61-
Figure 12. Colon procedure-associated surgical site infections standardized infection ratios, Jan 1–Dec 31, 2016
Note: Data are not shown for hospitals with less than one predicted infection.

State of New Hampshire Healthcare-Associated Infections 2016 Hospital Report
NH Department of Health and Human Services September 12, 2017 Division of Public Health Services
-62-
Table 20. Abdominal hysterectomy procedure-associated surgical site infections standardized infection ratios, Jan 1–Dec 31, 2016
† Data are not shown for hospitals with less than one predicted infection. - Facility did not perform this procedure during 2016
Hospital Observed Infections
Predicted Infections
Standardized Infection
Ratio (SIR)
95% Confidence
Interval
Comparison to Predicted Number
of Infections
Alice Peck Day Memorial † † † † †
Androscoggin Valley † † † † †
Catholic Medical Center 1 1.31 0.77 0.04 , 3.78 Similar
Cheshire Medical Center † † † † †
Concord Hospital 1 1.86 0.54 0.03 , 2.65 Similar
Cottage Hospital - - - - -
DHMC 6 9.20 0.65 0.26 , 1.36 Similar
Elliot Hospital 1 2.46 0.41 0.02 , 2.00 Similar
Exeter Hospital † † † † †
Franklin Regional - - - - -
Frisbie Memorial 2 1.34 1.50 0.25 , 4.94 Similar
Huggins Hospital † † † † †
Lakes Region General † † † † †
Littleton Regional † † † † †
Monadnock Community † † † † †
New London Hospital † † † † †
Parkland Medical Center † † † † †
Portsmouth Regional † † † † †
Southern NH Medical 1 1.67 0.60 0.03 , 2.96 Similar
Speare Memorial Hospital † † † † †
St. Joseph Hospital † † † † †
The Memorial Hospital † † † † †
Upper Connecticut Valley - - - - -
Valley Regional Hospital - - - - -
Weeks Medical Center - - - - -
Wentworth-Douglass 0 2.26 0.00 - , 1.33 Similar
State Total 12 24.97 0.48 0.26 , 0.82 Lower

State of New Hampshire Healthcare-Associated Infections 2016 Hospital Report
NH Department of Health and Human Services September 12, 2017 Division of Public Health Services
-63-
Figure 13. Abdominal hysterectomy procedure-associated surgical site infections standardized infection ratios, Jan 1–Dec 31, 2016
Note: Data are not shown for hospitals with less than one predicted infection

State of New Hampshire Healthcare-Associated Infections 2016 Hospital Report
NH Department of Health and Human Services September 12, 2017 Division of Public Health Services
-64-
Table 21. Knee arthroplasty procedure-associated surgical site infections standardized infection ratios, Jan 1–Dec 31, 2016
† Data are not shown for hospitals with less than one predicted infection - Facility did not perform this procedure during 2016
Hospital Observed Infections
Predicted Infections
Standardized Infection
Ratio (SIR)
95% Confidence
Interval
Comparison to Predicted Number
of Infections
Alice Peck Day Memorial 0 1.61 0.00 - , 1.86 Similar
Androscoggin Valley † † † † †
Catholic Medical Center 0 2.11 0.00 - , 1.42 Similar
Cheshire Medical Center 0 1.05 0.00 - , 2.85 Similar
Concord Hospital 1 8.58 0.12 0.01, 0.58 Lower
Cottage Hospital † † † † †
DHMC 4 5.63 0.71 0.23, 1.72 Similar
Elliot Hospital 2 3.50 0.57 0.10 , 1.89 Similar
Exeter Hospital 0 1.74 0.00 - , 1.73 Similar
Franklin Regional - - - - -
Frisbie Memorial 3 1.34 2.24 0.57 , 6.09 Similar
Huggins Hospital † † † † †
Lakes Region General 2 2.49 0.80 0.14 , 2.65 Similar
Littleton Regional 1 1.32 0.76 0.04 , 3.73 Similar
Monadnock Community † † † † †
New London Hospital † † † † †
Parkland Medical Center † † † † †
Portsmouth Regional 3 4.19 0.72 0.18 , 1.95 Similar
Southern NH Medical 0 1.38 0.00 - , 2.17 Similar
Speare Memorial Hospital † † † † †
St. Joseph Hospital 2 2.50 0.80 0.13 , 2.64 Similar
The Memorial Hospital † † † † †
Upper Connecticut Valley - - - - -
Valley Regional Hospital - - - - -
Weeks Medical Center † † † † †
Wentworth-Douglass 2 2.19 0.92 0.15 , 3.02 Similar
State Total 21 42.77 0.49 0.31 , 0.74 Lower

State of New Hampshire Healthcare-Associated Infections 2016 Hospital Report
NH Department of Health and Human Services September 12, 2017 Division of Public Health Services
-65-
Figure 14. Knee arthroplasty procedure-associated surgical site infections standardized infection ratios, Jan 1–Dec 31, 2016
Note: Data are not shown for hospitals with less than one predicted infection
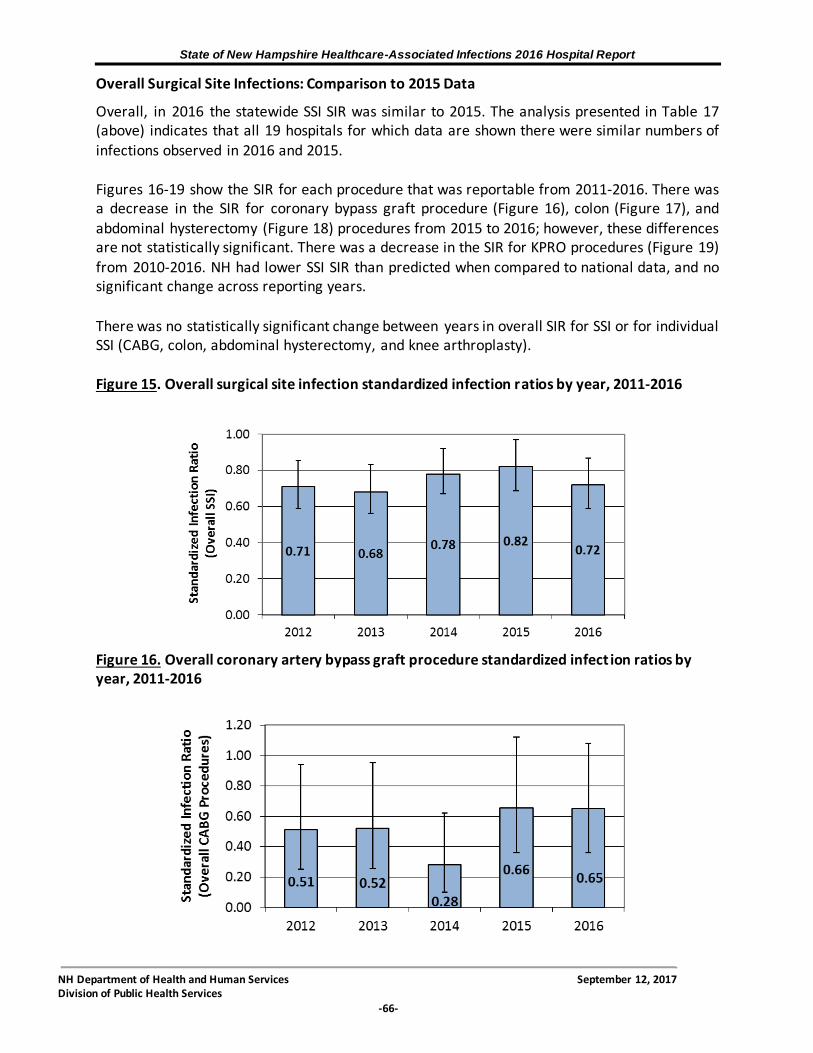
State of New Hampshire Healthcare-Associated Infections 2016 Hospital Report
NH Department of Health and Human Services September 12, 2017 Division of Public Health Services
-66-
Overall Surgical Site Infections: Comparison to 2015 Data
Overall, in 2016 the statewide SSI SIR was similar to 2015. The analysis presented in Table 17 (above) indicates that all 19 hospitals for which data are shown there were similar numbers of infections observed in 2016 and 2015.
Figures 16-19 show the SIR for each procedure that was reportable from 2011-2016. There was a decrease in the SIR for coronary bypass graft procedure (Figure 16), colon (Figure 17), and
abdominal hysterectomy (Figure 18) procedures from 2015 to 2016; however, these differences are not statistically significant. There was a decrease in the SIR for KPRO procedures (Figure 19)
from 2010-2016. NH had lower SSI SIR than predicted when compared to national data, and no significant change across reporting years.
There was no statistically significant change between years in overall SIR for SSI or for individual SSI (CABG, colon, abdominal hysterectomy, and knee arthroplasty).
Figure 15. Overall surgical site infection standardized infection ratios by year, 2011-2016
Figure 16. Overall coronary artery bypass graft procedure standardized infect ion ratios by year, 2011-2016
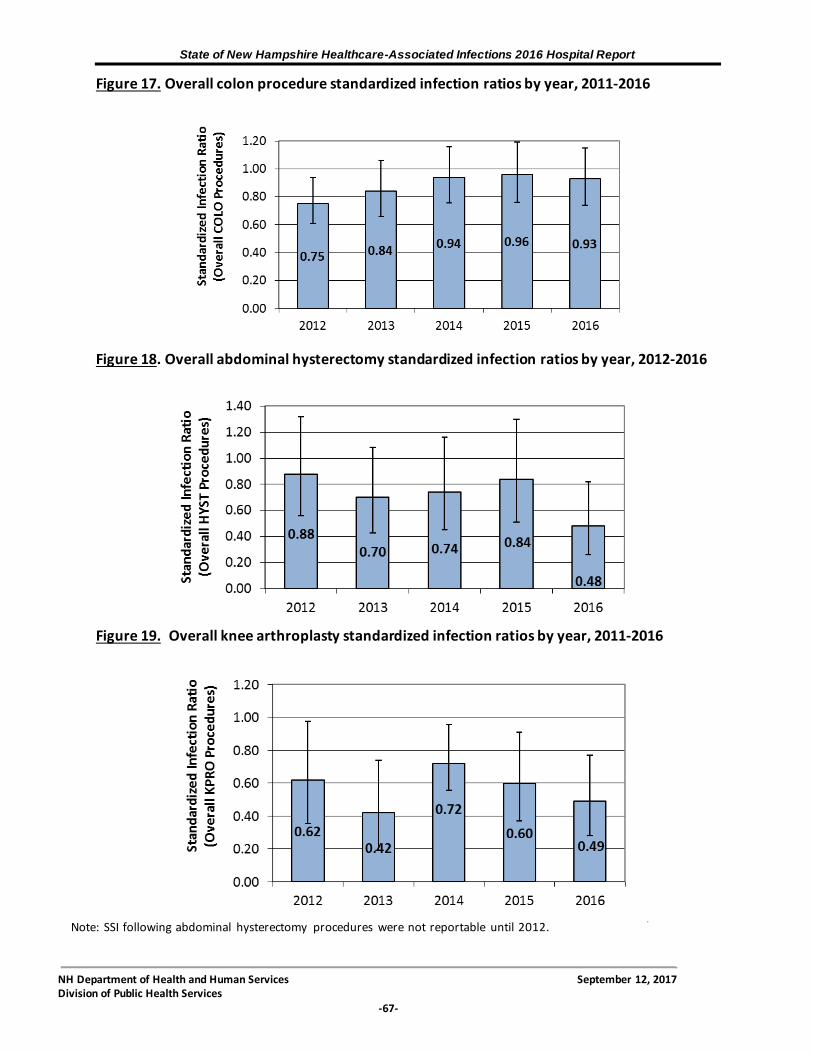
State of New Hampshire Healthcare-Associated Infections 2016 Hospital Report
NH Department of Health and Human Services September 12, 2017 Division of Public Health Services
-67-
Figure 17. Overall colon procedure standardized infection ratios by year, 2011-2016
Figure 18. Overall abdominal hysterectomy standardized infection ratios by year, 2012-2016
Figure 19. Overall knee arthroplasty standardized infection ratios by year, 2011-2016
Note: SSI following abdominal hysterectomy procedures were not reportable until 2012.

State of New Hampshire Healthcare-Associated Infections 2016 Hospital Report
NH Department of Health and Human Services September 12, 2017 Division of Public Health Services
-68-
Table 22. Post-discharge surveillance methods and percentage of SSI detected post-discharge in New Hampshire hospitals, 2015-2016
Hospital Post-Discharge Surveillance Methods % SSIs Identified Post-Discharge Compared to State
Alice Peck Day Memorial Surgeon Letters, Readmission Reports, Culture Reports, RL Solutions 100.0 Similar
Androscoggin Valley Surgeon Letters, Culture Reports, Outpatient Clinic 25.0 Similar
Catholic Medical Center Surgeon Letters, Culture Reports 25.0 Similar
Cheshire Medical Center Culture Reports, Outpatient Clinic 100.0 Similar
Concord Hospital Culture Reports 16.7 Similar
Cottage Hospital Surgeon Letters, Culture Reports, Outpatient Clinic, other* 0.0 Similar
DHMC Surgeon Letters, Culture Reports, Outpatient Clinic 3.1 Similar
Elliot Hospital Surgeon Letters, Culture Reports 27.3 Similar
Exeter Hospital Surgeon Letters 0.0 Lower
Franklin Regional Surgeon Letters, Culture Reports † †
Frisbie Memorial Surgeon Letters, Outpatient Clinic 83.3 Similar
Huggins Hospital Surgeon Letters, Culture Reports, Patient/Family 50.0 Similar
Lakes Region General Surgeon Letters, Culture Reports 16.7 Similar
Littleton Regional Surgeon Letters, Culture Reports, Outpatient Clinic 33.3 Similar
Monadnock Community Surgeon Letters, Culture Reports † †
New London Hospital Surgeon Letters, Culture Reports, Outpatient Clinic 0.0 Lower
Parkland Medical Center Surgeon Letters, Culture Reports 25.0 Similar
Portsmouth Regional Surgeon Letters 0.0 Lower
Southern NH Medical Surgeon Letters, Culture Reports 9.1 Similar
Speare Memorial Hospital Surgeon Letters 0.0 Lower
St. Joseph Hospital Surgeon Letters, Culture Reports, Outpatient Clinic 80.0 Similar
The Memorial Hospital Surgeon Letters, Culture Reports, Other** 75.0 Similar
Upper Connecticut Valley Surgeon Letters, Culture Reports, Patient/Family † †
Valley Regional Hospital Surgeon Letters, Culture Reports, Outpatient Clinic † †
Weeks Medical Center Surgeon Letters, Culture Reports, Outpatient Clinic † †
Wentworth-Douglass Surgeon Letters, Culture Reports 14.3 Similar
†No SSIs reported or predicted number of infections is less than one during this time period. Note: Post-discharge surveillance methods may have changed since
originally reported. These data are for 2015-2016 and are not directly comparable to the rest of the data in this report. These data are shown to assess the effectiveness of the post-discharge surveillance system implemented at each facility. Two years of data are used since the number of reported infections at many facilities is small.

State of New Hampshire Healthcare-Associated Infections 2016 Hospital Report
NH Department of Health and Human Services September 12, 2017 Division of Public Health Services
-69-
G. Surgical Antimicrobial Prophylaxis Administration
SCIP 2016 data reported to CMS was unavailable and the HAI Program was unable to conduct further analysis of this measure as routinely included in this report. In 2013, NH hospitals performed surgical antimicrobial prophylaxis correctly more often or similar to the national adherence percentage. For SCIP measure 1, 98.6% of patients received prophylactic antibiotic within one hour prior to surgery compared with 98.5% nationally. For SCIP measure 2, 99.3% of patients received the appropriate prophylactic antibiotic compared with 98.9% nationally. For SCIP measure 3, 98.0% of patients had his or her prophylactic antibiotic discontinued within 24 hours after surgery compared with 97.6% nationally. See methods section for additional information on how this information is collected.
Data for 2013 and earlier years is available in prior HAI Program reports and can be accessed
here: http://www.dhhs.nh.gov/dphs/cdcs/hai/publications.htm.
H. Influenza Vaccination Percentages
Figure 20 shows the gradual increase in HCP vaccination percentages in NH hospitals since 2008; 2008-09 to 2013-14 represents a statistically significant increase from the year prior. Table 23 and Figure 21 show the total number of HCP and the number of HCP vaccinated
against seasonal influenza at each hospital during the 2016–17 influenza season. Vaccination percentages by hospital ranged from 62.4% to 100%, and the overall State vaccination
percentage was 94.2%. The analysis presented in Table 23 shows that ten hospitals had vaccination percentages similar to the overall State vaccination percentage, thirteen hospitals
reported vaccination percentages that were significantly higher than the overall State vaccination percentage, and eleven hospitals reported vaccination percentages that were
significantly lower than the overall State vaccination percentage.
Figure 20. Statewide influenza vaccination percentages for hospital HCP by influenza season
Note: Influenza season represents data for HCP between October 1st and March 31st the following calendar year, with the exception of 2008-09, which data were collected for October 1st through April 30th.

State of New Hampshire Healthcare-Associated Infections 2016 Hospital Report
NH Department of Health and Human Services September 12, 2017 Division of Public Health Services
-70-
Table 23. Influenza vaccination percentages for hospital HCP by hospital, 2015–16 influenza season, Oct 1, 2016–Mar 31, 2017
Hospital HCP Vaccinated
Total HCP
% HCP Vaccinated
95% Confidence
Interval
Hospital % Compared to
State %
Alice Peck Day Memorial Hospital 737 770 95.7 94.1 , 97.0 Similar
Androscoggin Valley Hospital 475 507 93.7 91.3 , 95.6 Similar
Catholic Medical Center 4,037 4,102 98.4 98.0 , 98.8 Higher
Cheshire Medical Center 1,562 1,687 92.6 91.3 , 93.8 Lower
Concord Hospital 2,560 3,153 81.2 79.8 , 82.5 Lower
Cottage Hospital 325 349 93.1 90.1 , 95.4 Similar
DHMC 14,427 14,767 97.7 97.5 , 97.9 Higher
Elliot Hospital 5,934 6,022 98.5 98.2 , 98.8 Higher
Exeter Hospital 1,978 2,092 94.6 93.5 , 95.5 Similar
Franklin Regional Hospital 216 240 90.0 85.7 , 93.4 Lower
Frisbie Memorial Hospital 1,289 1,405 91.7 90.2 , 93.1 Lower
Huggins Hospital 595 644 92.4 90.2 , 94.3 Similar
Lakes Region General Hospital 1,450 1,527 95.0 93.8 , 96.0 Similar
Littleton Regional Hospital 698 726 96.1 94.6 , 97.4 Higher
Monadnock Community Hospital 691 737 93.8 91.8 , 95.3 Similar
New London Hospital 1,003 1,020 98.3 97.4 , 99.0 Higher
Parkland Medical Center 877 1,406 62.4 59.8 , 64.9 Lower
Portsmouth Regional Hospital 1,700 1,883 90.3 88.9 , 91.6 Lower
Southern N.H. Medical Center 1,978 2,028 97.5 96.8 , 98.2 Higher
Speare Memorial Hospital 596 655 91.0 88.6 , 93.0 Lower
St. Joseph Hospital 2,526 2,580 97.9 97.3 , 98.4 Higher
The Memorial Hospital 546 636 85.8 83.0 , 88.4 Lower
Upper Connecticut Valley Hospital 142 164 86.6 80.7 , 91.2 Lower
Valley Regional Hospital 461 462 99.8 98.9 , - Higher
Weeks Medical Center 400 409 97.7 96.0 , 98.9 Higher
Wentworth-Douglass Hospital 2,820 2,864 98.5 98.0 , 98.9 Higher
Crotched Mountain 115 121 95.0 90.0 , 98.0 Similar
Hampstead Hospital 178 244 73.0 67.1 , 78.2 Lower
HealthSouth Rehabilitation Hospital 202 220 91.8 87.6 , 94.9 Similar
New Hampshire Hospital 705 1,004 70.2 67.3 , 73.0 Lower
NE Rehab. Hospital, The Elliot 106 106 100.0 97.2 , - Higher
NE Rehab. Hospital, Pease 268 269 99.6 98.2 , - Higher
NE Rehab Hospital, SNHMC 126 130 96.9 92.8 , 99.0 Similar
NE Rehab. Hospital, Salem 671 678 99.0 98.0 , 99.6 Higher
State Total 52,394 55,607 94.2 94.0 , 94.4

State of New Hampshire Healthcare-Associated Infections 2016 Hospital Report
NH Department of Health and Human Services September 12, 2017 Division of Public Health Services
-71-
Figure 21. Influenza vaccination percentages for hospital HCP by hospital, 2016-17 influenza season, Oct 1, 2016–Mar 31, 2017

State of New Hampshire Healthcare-Associated Infections 2016 Hospital Report
NH Department of Health and Human Services September 12, 2017 Division of Public Health Services
-72-
Influenza Vaccination Percentages: Comparison to 2016-17 Data The overall statewide hospital HCP vaccination percentage increased significantly from 2008–09 to 2009–10, which may have been explained by overall increased interest in influenza vaccination as a result of the 2009 H1N1 pandemic. However, the influenza vaccination percentage continued to increase between the 2009-10 and 2015-16 seasons, suggesting other influences such as the public reporting of influenza vaccination coverage and mandatory vaccination policies. The analysis presented in Table 24 shows that overall, three hospitals increased HCP influenza vaccination in 2016-17 compared to 2015-16, 26 hospitals had similar
vaccination percentages, and five hospitals decreased influenza vaccination percentages.

State of New Hampshire Healthcare-Associated Infections 2016 Hospital Report
NH Department of Health and Human Services September 12, 2017 Division of Public Health Services
-73-
Figure 22. Influenza vaccination percentages for hospital healthcare personnel by hospital, 2015-16 and 2016-17 influenza seasons
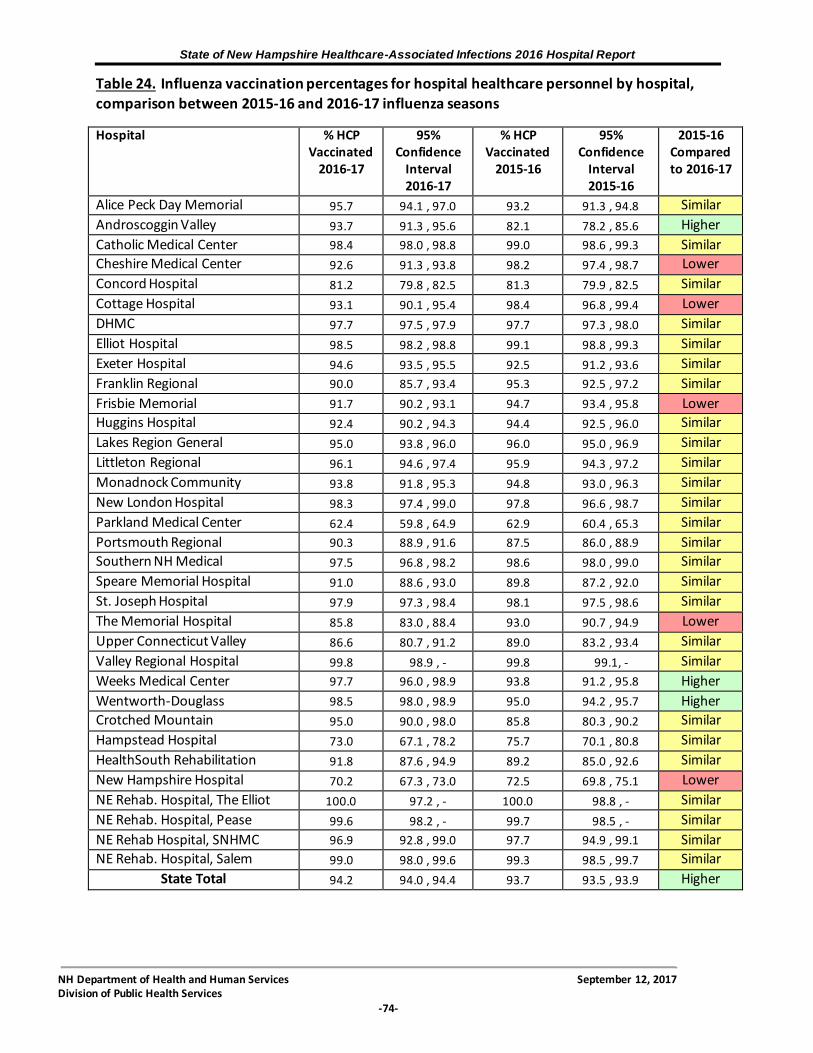
State of New Hampshire Healthcare-Associated Infections 2016 Hospital Report
NH Department of Health and Human Services September 12, 2017 Division of Public Health Services
-74-
Table 24. Influenza vaccination percentages for hospital healthcare personnel by hospital, comparison between 2015-16 and 2016-17 influenza seasons
Hospital % HCP Vaccinated
2016-17
95% Confidence
Interval 2016-17
% HCP Vaccinated
2015-16
95% Confidence
Interval 2015-16
2015-16 Compared to 2016-17
Alice Peck Day Memorial 95.7 94.1 , 97.0 93.2 91.3 , 94.8 Similar
Androscoggin Valley 93.7 91.3 , 95.6 82.1 78.2 , 85.6 Higher
Catholic Medical Center 98.4 98.0 , 98.8 99.0 98.6 , 99.3 Similar
Cheshire Medical Center 92.6 91.3 , 93.8 98.2 97.4 , 98.7 Lower
Concord Hospital 81.2 79.8 , 82.5 81.3 79.9 , 82.5 Similar
Cottage Hospital 93.1 90.1 , 95.4 98.4 96.8 , 99.4 Lower
DHMC 97.7 97.5 , 97.9 97.7 97.3 , 98.0 Similar
Elliot Hospital 98.5 98.2 , 98.8 99.1 98.8 , 99.3 Similar
Exeter Hospital 94.6 93.5 , 95.5 92.5 91.2 , 93.6 Similar
Franklin Regional 90.0 85.7 , 93.4 95.3 92.5 , 97.2 Similar
Frisbie Memorial 91.7 90.2 , 93.1 94.7 93.4 , 95.8 Lower
Huggins Hospital 92.4 90.2 , 94.3 94.4 92.5 , 96.0 Similar
Lakes Region General 95.0 93.8 , 96.0 96.0 95.0 , 96.9 Similar
Littleton Regional 96.1 94.6 , 97.4 95.9 94.3 , 97.2 Similar
Monadnock Community 93.8 91.8 , 95.3 94.8 93.0 , 96.3 Similar
New London Hospital 98.3 97.4 , 99.0 97.8 96.6 , 98.7 Similar
Parkland Medical Center 62.4 59.8 , 64.9 62.9 60.4 , 65.3 Similar
Portsmouth Regional 90.3 88.9 , 91.6 87.5 86.0 , 88.9 Similar
Southern NH Medical 97.5 96.8 , 98.2 98.6 98.0 , 99.0 Similar
Speare Memorial Hospital 91.0 88.6 , 93.0 89.8 87.2 , 92.0 Similar
St. Joseph Hospital 97.9 97.3 , 98.4 98.1 97.5 , 98.6 Similar
The Memorial Hospital 85.8 83.0 , 88.4 93.0 90.7 , 94.9 Lower
Upper Connecticut Valley 86.6 80.7 , 91.2 89.0 83.2 , 93.4 Similar
Valley Regional Hospital 99.8 98.9 , - 99.8 99.1, - Similar
Weeks Medical Center 97.7 96.0 , 98.9 93.8 91.2 , 95.8 Higher
Wentworth-Douglass 98.5 98.0 , 98.9 95.0 94.2 , 95.7 Higher
Crotched Mountain 95.0 90.0 , 98.0 85.8 80.3 , 90.2 Similar
Hampstead Hospital 73.0 67.1 , 78.2 75.7 70.1 , 80.8 Similar
HealthSouth Rehabilitation 91.8 87.6 , 94.9 89.2 85.0 , 92.6 Similar
New Hampshire Hospital 70.2 67.3 , 73.0 72.5 69.8 , 75.1 Lower
NE Rehab. Hospital, The Elliot 100.0 97.2 , - 100.0 98.8 , - Similar
NE Rehab. Hospital, Pease 99.6 98.2 , - 99.7 98.5 , - Similar
NE Rehab Hospital, SNHMC 96.9 92.8 , 99.0 97.7 94.9 , 99.1 Similar
NE Rehab. Hospital, Salem 99.0 98.0 , 99.6 99.3 98.5 , 99.7 Similar
State Total 94.2 94.0 , 94.4 93.7 93.5 , 93.9 Higher
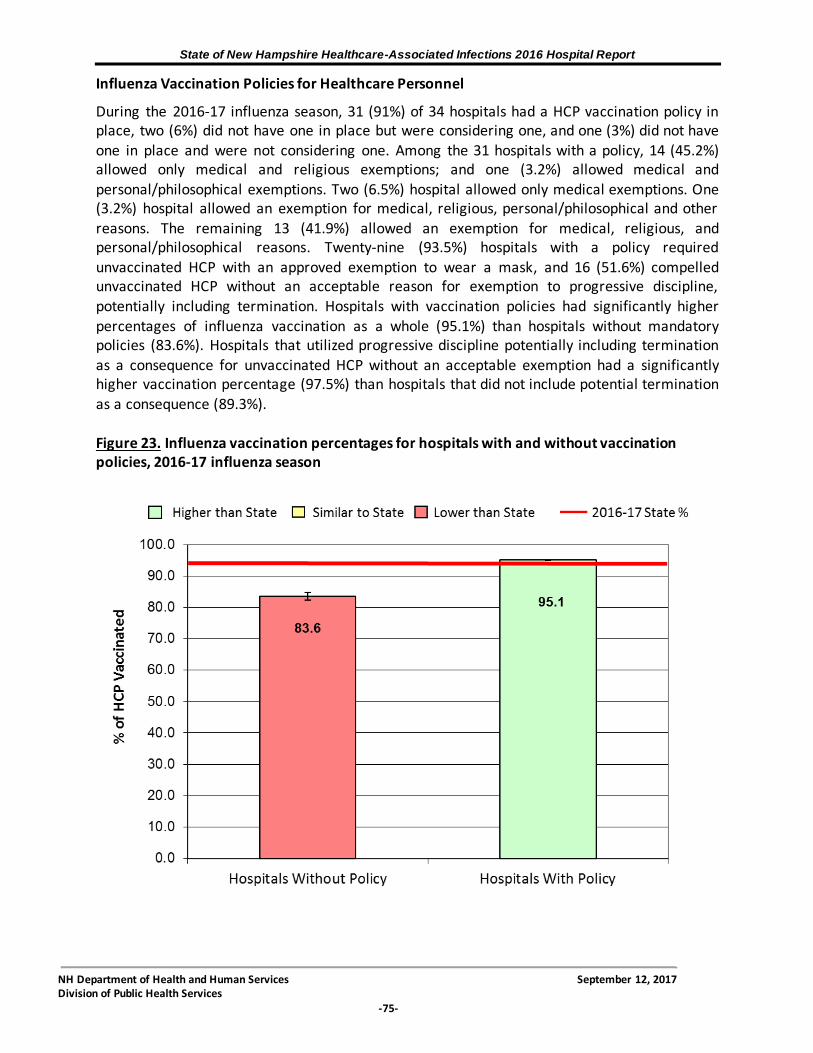
State of New Hampshire Healthcare-Associated Infections 2016 Hospital Report
NH Department of Health and Human Services September 12, 2017 Division of Public Health Services
-75-
Influenza Vaccination Policies for Healthcare Personnel
During the 2016-17 influenza season, 31 (91%) of 34 hospitals had a HCP vaccination policy in place, two (6%) did not have one in place but were considering one, and one (3%) did not have one in place and were not considering one. Among the 31 hospitals with a policy, 14 (45.2%) allowed only medical and religious exemptions; and one (3.2%) allowed medical and
personal/philosophical exemptions. Two (6.5%) hospital allowed only medical exemptions. One (3.2%) hospital allowed an exemption for medical, religious, personal/philosophical and other
reasons. The remaining 13 (41.9%) allowed an exemption for medical, religious, and personal/philosophical reasons. Twenty-nine (93.5%) hospitals with a policy required
unvaccinated HCP with an approved exemption to wear a mask, and 16 (51.6%) compelled unvaccinated HCP without an acceptable reason for exemption to progressive discipline,
potentially including termination. Hospitals with vaccination policies had significantly higher percentages of influenza vaccination as a whole (95.1%) than hospitals without mandatory policies (83.6%). Hospitals that utilized progressive discipline potentially including termination
as a consequence for unvaccinated HCP without an acceptable exemption had a significantly higher vaccination percentage (97.5%) than hospitals that did not include potential termination
as a consequence (89.3%).
Figure 23. Influenza vaccination percentages for hospitals with and without vaccination policies, 2016-17 influenza season

State of New Hampshire Healthcare-Associated Infections 2016 Hospital Report
NH Department of Health and Human Services September 12, 2017 Division of Public Health Services
-76-
Table 25. Influenza vaccination policies and consequences for healthcare personnel by hospital, 2016-17 influenza season
Hospital Exemptions Allowed in Policy* Requirements for Unvaccinated HCP
with Accepted Exemption Consequences for Unvaccinated HCP
without Accepted Exemption
Alice Peck Day Memorial Hospital Medical, Religious Wear a mask Progressive discipline, potentially
including termination
Androscoggin Valley Hospital Medical, Religious,
Personal/philosophical Wear a mask
Wear a mask, Receive verbal and/or written education
Catholic Medical Center Medical, Religious Wear a mask Progressive discipline, potentially
including termination
Cheshire Medical Center Medical, Religious Wear a mask Wear a mask, Progressive discipline,
potentially including termination
Cottage Hospital Medical, Religious,
Personal/philosophical, Other Wear a mask Wear a mask
DHMC Medical, Religious Wear a mask Progressive discipline, potentially
including termination
Elliot Hospital Medical, Religious Wear a mask Progressive discipline, potentially
including termination
Exeter Hospital Medical, Religious,
Personal/philosophical Wear a mask, Receive verbal and/or
written education Wear a mask
Franklin Regional Hospital Medical, Religious,
Personal/philosophical Wear a mask, Receive verbal and/or
written education Wear a mask, Receive verbal and/or
written education
Frisbie Memorial Hospital Medical, Religious,
Personal/philosophical Wear a mask Receive verbal and/or written education
Hampstead Hospital Medical, Religious,
Personal/philosophical Receive verbal and/or written education Receive verbal and/or written education
Lakes Region General Hospital Medical, Religious,
Personal/philosophical Wear a mask, Receive verbal and/or
written education Wear a mask, Receive verbal and/or
written education
Littleton Regional Hospital Medical, Religious Wear a mask Wear a mask, Progressive discipline,
potentially including termination, Receive
verbal and/or written education
Monadnock Community Hospital Medical, Religious Wear a mask
Wear a mask, Progressive discipline,
potentially including termination, Receive verbal and/or written education
New Hampshire Hospital Medical, Religious,
Personal/philosophical Wear a mask, Receive verbal and/or
written education Wear a mask during outbreaks, Receive
verbal and/or written education
*Exemptions include Medical, Religious, Personal/philosophical, and Other.
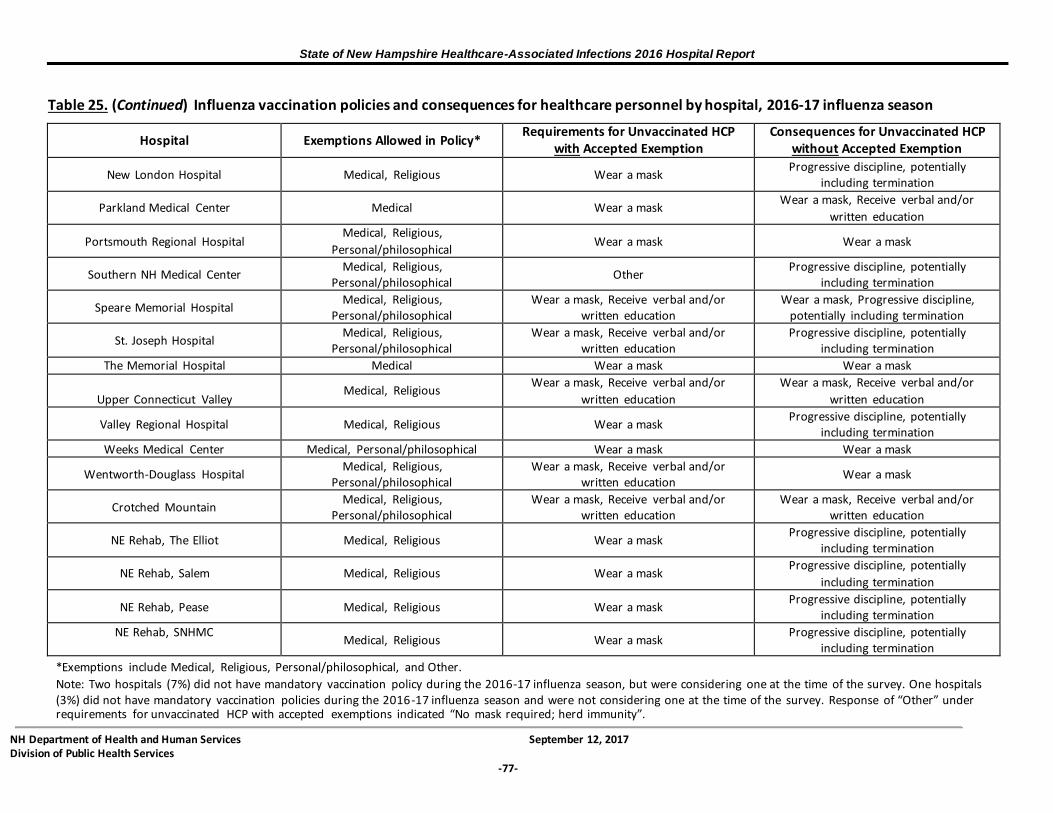
State of New Hampshire Healthcare-Associated Infections 2016 Hospital Report
NH Department of Health and Human Services September 12, 2017 Division of Public Health Services
-77-
Table 25. (Continued) Influenza vaccination policies and consequences for healthcare personnel by hospital, 2016-17 influenza season
Hospital Exemptions Allowed in Policy* Requirements for Unvaccinated HCP
with Accepted Exemption Consequences for Unvaccinated HCP
without Accepted Exemption
New London Hospital Medical, Religious Wear a mask Progressive discipline, potentially
including termination
Parkland Medical Center Medical Wear a mask Wear a mask, Receive verbal and/or
written education
Portsmouth Regional Hospital Medical, Religious,
Personal/philosophical Wear a mask Wear a mask
Southern NH Medical Center Medical, Religious,
Personal/philosophical Other
Progressive discipline, potentially including termination
Speare Memorial Hospital Medical, Religious,
Personal/philosophical Wear a mask, Receive verbal and/or
written education Wear a mask, Progressive discipline,
potentially including termination
St. Joseph Hospital Medical, Religious,
Personal/philosophical Wear a mask, Receive verbal and/or
written education Progressive discipline, potentially
including termination
The Memorial Hospital Medical Wear a mask Wear a mask
Upper Connecticut Valley Medical, Religious
Wear a mask, Receive verbal and/or
written education
Wear a mask, Receive verbal and/or
written education
Valley Regional Hospital Medical, Religious Wear a mask Progressive discipline, potentially
including termination
Weeks Medical Center Medical, Personal/philosophical Wear a mask Wear a mask
Wentworth-Douglass Hospital Medical, Religious,
Personal/philosophical Wear a mask, Receive verbal and/or
written education Wear a mask
Crotched Mountain Medical, Religious,
Personal/philosophical Wear a mask, Receive verbal and/or
written education Wear a mask, Receive verbal and/or
written education
NE Rehab, The Elliot Medical, Religious Wear a mask Progressive discipline, potentially
including termination
NE Rehab, Salem Medical, Religious Wear a mask Progressive discipline, potentially
including termination
NE Rehab, Pease Medical, Religious Wear a mask Progressive discipline, potentially
including termination
NE Rehab, SNHMC Medical, Religious Wear a mask
Progressive discipline, potentially including termination
*Exemptions include Medical, Religious, Personal/philosophical, and Other.
Note: Two hospitals (7%) did not have mandatory vaccination policy during the 2016-17 influenza season, but were considering one at the time of the survey. One hospitals (3%) did not have mandatory vaccination policies during the 2016-17 influenza season and were not considering one at the time of the survey. Response of “Other” under requirements for unvaccinated HCP with accepted exemptions indicated “No mask required; herd immunity”.

State of New Hampshire Healthcare-Associated Infections 2016 Hospital Report
NH Department of Health and Human Services September 12, 2017 Division of Public Health Services
-78-
IV. CONCLUSIONS This eighth report on hospital HAI surveillance data displays continued progress toward the goal of eliminating HAI in NH. This report provides a picture of selected HAI data that can be used by healthcare facilities to identify areas for improvement and prevention, as well as healthcare consumers to make informed healthcare decisions. Key findings described in this report include the following:
All 34 individually licensed hospitals in NH complied with the HAI mandatory reporting law
in 2016. NH hospitals reported fewer HAI associated with central lines, urinary catheters, and knee
replacement than predicted based on national data; this difference was statistically significant. Hospitals also reported fewer HAI associated with coronary artery bypass,
colon, and abdominal hysterectomy procedures; this was not statistically significant. The majority of hospitals have fewer or similar number of infections than predicted based
on national data. There was an increase for overall HAI between the first year of data presented in this report, 2011, and the most recent reporting period, 2016. However, this
was not statistically significant and the pattern was not seen between each individual year from 2011 to 2016. Many factors may have contributed an increase in overall HAI, including the addition of new and expanded reporting requirements in 2012.
A few NH hospitals have more infections following certain procedures, which may warrant changes to current infection prevention practices in order to reduce infections.
Statewide adherence to all four infection prevention practices during central line insertions was 98.2%, which is similar to 2014 (98.4%). Hospitals have made improvements since HAI reporting began, and should continue to work toward the goal of 100% adherence.
Surgical antimicrobial prophylaxis data for 2014-2016 was not available and consequently not included in this report. However, in 2013, NH hospitals performed surgical
antimicrobial prophylaxis correctly more often or similar to the national average. Vaccination coverage by hospitals during the 2016-17 influenza season ranged from 62.4%
to 100%. The overall State percentage was 94.2%, which represents a slight increase from the 2015-16 influenza season when the statewide vaccination percentage was 93.5% (in
2008-2009, when this reporting first began, the vaccination percentage was 59.9%). This was not statistically significant and that is to be expected as vaccination coverage
approaches 100%.
Thirty-one (91%) NH hospitals had an HCP vaccination policy in place during the 2016-17 season. This was similar to the 2015-16 season. Overall, hospitals with vaccination policies had significantly higher percentages of influenza vaccination as a whole (95.1%) than hospitals without mandatory policies (83.6%).
While this report only includes information on a subset of HAI, the information provided can be used as an important indicator of healthcare quality and infection prevention efforts in NH
hospitals. Although data in this report have not been independently validated to assess reporting
State of New Hampshire Healthcare-Associated Infections 2016 Hospital Report
NH Department of Health and Human Services September 12, 2017 Division of Public Health Services
-79-
accuracy, this process is ongoing; a validation study is underway and will be the subject of a future report. Healthcare consumers can discuss the information provided in this report with their healthcare provider and should review Appendix 4 for information on what individual patients can
do to prevent HAI.
V. ACUTE CARE HOSPITAL REPORTS Because data must be broken down into categories for risk adjustment and because rates must be suppressed if data are too sparse, data that can be presented for NH facilities may be limited. Due to restrictions on presenting data, there are several hospitals for which facility-specific infections data for specific measures cannot be presented. See technical notes for additional information on data restriction and presentation.

NH DHHS/Division of Public Health Services Healthcare-Associated Infections 2016 Hospital Report, September 1, 2017 Page 80
ALICE PECK DAY MEMORIAL Lebanon, NH Not-for-profit, Critical Access # of Admissions: 1,638 # of Beds: 25 # of ICU Beds: 0 # of Patient-days: 5,655
Measure Observed Infections
Predicted Infections
Standardized Infection Ratio (SIR)
95% Confidence Interval
Comparison to Predicted
Overall HAI 0 1.71 0.00 - , 1.75 Similar
CLABSI No ICU to monitor infections
CAUTI No ICU to monitor infections
SSI 0 1.71 0.00 - , 1.75 Similar
CABG
COLO - - - - -
HYST † † † † †
KPRO 0 1.61 0.00 - , 1.86 Similar
Facility does not perform this procedure
STANDARDIZED INFECTION RATIOS (SIR)
Type of Unit Number of Infections
Number of Central Line Days
Rate per 1,000 Central Line Days
National Rate
Comparison to National Rate
No ICU No ICU to monitor infections
CENTRAL LINE-ASSOCIATED BLOODSTREAM INFECTION RATES
HAI: Healthcare-associated infection CLABSI: Central line-associated bloodstream infection CAUTI: Catheter-associated urinary tract infection SSI: Surgical site infection COLO: Colon procedure HYST: Abdominal hysterectomy CABG: Coronary artery bypass graft KPRO: Knee arthroplasty
2016 HAI DATA REPORT
Type of Unit Number of Infections
Number of Catheter Days
Rate per 1,000 Catheter Days
National Rate
Comparison to National Rate
No ICU No ICU to monitor infections
CATHETER-ASSOCIATED URINARY TRACT INFECTION RATES
CENTRAL LINE-ASSOCIATED BLOODSTREAM INFECTION RATES BY BIRTHWEIGHT IN NEONATAL INTENSIVE CARE UNITS
Birthweight Category Number of Infections
Number of Central Line Days
Rate per 1,000 Central Line Days
National Rate
Comparison to National Rate
BW Category A
BW Category B
BW Category C
BW Category D
BW Category E
No Neonatal ICU to monitor infections
BW Category A: Equal or less than 750 grams BW Category B: Equal and between 751 and 1,000 grams BW Category C: Equal and between 1,001 and 1,500 grams BW Category D: Equal and between 1,501 and 2,500 grams BW Category E: More than 2,500 grams

NH DHHS/Division of Public Health Services Healthcare-Associated Infections 2016 Hospital Report, September 1, 2017 Page 81
Measure Percent Adherence
State Coverage
Comparison to State Coverage
CLIP 98.4
SCIP-1
SCIP-2
SCIP-3
Measure Percent Vaccinated
State Coverage
Comparison to State Coverage
HCP Influenza Vaccination 95.7 94.2 Similar
Note: 2016 SCIP data were not available at time of publication and as a result are excluded from this report.
PROCESS MEASURES
ALICE PECK DAY MEMORIAL 2016 DATA REPORT
98.5 98.598.9 98.6
91.9
70
80
90
100
2012 2013
% A
dh
ere
nce
SCIP-1
National State Hospital
SCIP: Surgical care improvement project CLIP: Central line insertion practices
The 2016 central line-associated blood stream infections (CLABSI), surgical site infections (SSI) and catheter-associated urinary tract infections (CAUTI) data presented in this report have not been validated and must be interpreted with the understanding that in general there are both under- and over-reporting of infections.
In New Hampshire in 2016, CLABSI were monitored in all intensive care units (including pediatric and neonatal units) and not in other inpatient locations. CAUTI were monitored in all intensive care units (including pediatric units and excluding neonatal ICU) and not in other inpatient locations.
Hospitals do not use a standard method of post-discharge surveillance to identify infections once a patient has been discharged. This poses a challenge for data interpretation, because a higher SSI rate (for example) at a given hospital may represent either poor infection prevention practices or, conversely, a better system for identifying infections.
SSI reporting requires not only reporting of infections but also detailed information on every patient who underwent the procedure being monitored. As such, DHHS has elected to monitor a subset of procedures based on national recommendations since it would not be feasible for hospitals to report information on every patient receiving a surgical procedure due to the burden of reporting.
As of July 1, 2015, SCIP 2014– 2016 data reported to CMS was unavailable and the HAI Program was unable to con-duct further analysis of this measure as routinely included in this report.
Policy Exemptions Allowed in Policy
Requirements for Unvaccinated HCP With Accepted Exemption
Consequences for Unvaccinated HCP Without Accepted Exemption
YES Medical, Religious Wear a mask Progressive discipline, potentially including termination
INFLUENZA VACCINATION POLICIES, 2016-2017 INFLUENZA SEASON
DATA NOTES:
2014-2016 SCIP data are not available.

NH DHHS/Division of Public Health Services Healthcare-Associated Infections 2016 Hospital Report, September 1, 2017 Page 82
ANDROSCOGGIN VALLEY Berlin, NH Not-for-profit, Critical Access # of Admissions: 1,454 # of Beds: 25 # of ICU Beds: 5 # of Patient-days: 5,950
Measure Observed Infections
Predicted Infections
Standardized Infection Ratio (SIR)
95% Confidence Interval
Comparison to Predicted
Overall HAI 3 1.95 1.54 0.39 , 4.19 Similar
CLABSI † † † † †
CAUTI † † † † †
SSI 2 1.34 1.49 0.25 , 4.94 Similar
CABG
COLO † † † † †
HYST † † † † †
KPRO † † † † †
Facility does not perform this procedure
STANDARDIZED INFECTION RATIOS (SIR)
Type of Unit Number of Infections
Number of Central Line Days
Rate per 1,000 Central Line Days
Comparison to National Rate
Medical ICU (CAH) † † †
National Rate
0.4
CENTRAL LINE-ASSOCIATED BLOODSTREAM INFECTION RATES
HAI: Healthcare-associated infection CLABSI: Central line-associated bloodstream infection CAUTI: Catheter-associated urinary tract infection SSI: Surgical site infection COLO: Colon procedure HYST: Abdominal hysterectomy CABG: Coronary artery bypass graft KPRO: Knee arthroplasty
2016 HAI DATA REPORT
Type of Unit Number of Infections
Number of Catheter Days
Rate per 1,000 Catheter Days
Comparison to National Rate
Medical ICU (CAH) 1 262 3.8 Similar
National Rate
0.5
CATHETER-ASSOCIATED URINARY TRACT INFECTION RATES
CENTRAL LINE-ASSOCIATED BLOODSTREAM INFECTION RATES BY BIRTHWEIGHT IN NEONATAL INTENSIVE CARE UNITS
BW Category A: Equal or less than 750 grams BW Category B: Equal and between 751 and 1,000 grams BW Category C: Equal and between 1,001 and 1,500 grams BW Category D: Equal and between 1,501 and 2,500 grams BW Category E: More than 2,500 grams
Birthweight Category Number of Infections
Number of Central Line Days
Rate per 1,000 Central Line Days
National Rate
Comparison to National Rate
BW Category A
BW Category B
BW Category C
BW Category D
BW Category E
No Neonatal ICU to monitor infections

NH DHHS/Division of Public Health Services Healthcare-Associated Infections 2016 Hospital Report, September 1, 2017 Page 83
Measure Percent Adherence
State Coverage
Comparison to State Coverage
CLIP † 98.4 †
SCIP-1
SCIP-2
SCIP-3
Measure Percent Vaccinated
State Coverage
Comparison to State Coverage
HCP Influenza Vaccination 93.7 94.2 Similar
Note: 2016 SCIP data were not available at time of publication and as a result are excluded from this report.
PROCESS MEASURES
ANDROSCOGGIN VALLEY 2016 DATA REPORT
SCIP-1
98.5 98.598.9 98.6100.0 100.0
70
80
90
100
2012 2013
% A
dh
eren
ce
National State Hospital
SCIP: Surgical care improvement project CLIP: Central line insertion practices
The 2016 central line-associated blood stream infections (CLABSI), surgical site infections (SSI) and catheter-associated urinary tract infections (CAUTI) data presented in this report have not been validated and must be interpreted with the understanding that in general there are both under- and over-reporting of infections.
In New Hampshire in 2016, CLABSI were monitored in all intensive care units (including pediatric and neonatal units) and not in other inpatient locations. CAUTI were monitored in all intensive care units (including pediatric units and excluding neonatal ICU) and not in other inpatient locations.
Hospitals do not use a standard method of post-discharge surveillance to identify infections once a patient has been discharged. This poses a challenge for data interpretation, because a higher SSI rate (for example) at a given hospital may represent either poor infection prevention practices or, conversely, a better system for identifying infections.
SSI reporting requires not only reporting of infections but also detailed information on every patient who underwent the procedure being monitored. As such, DHHS has elected to monitor a subset of procedures based on national recommendations since it would not be feasible for hospitals to report information on every patient receiving a surgical procedure due to the burden of reporting.
As of July 1, 2015, SCIP 2014– 2016 data reported to CMS was unavailable and the HAI Program was unable to con-duct further analysis of this measure as routinely included in this report.
Policy Exemptions Allowed in Policy
Requirements for Unvaccinated HCP With Accepted Exemption
Consequences for Unvaccinated HCP Without Accepted Exemption
YES Medical, Religious,
Personal/philosophical Wear a mask Wear a mask, Receive verbal and/or written education
DATA NOTES:
2014-2016 SCIP data are not available.
INFLUENZA VACCINATION POLICIES, 2016-2017 INFLUENZA SEASON
† Hospital data are not shown when fewer than 20 in-sertions were per-formed.

NH DHHS/Division of Public Health Services Healthcare-Associated Infections 2016 Hospital Report, September 1, 2017 Page 84
CATHOLIC MEDICAL CENTER Manchester, NH Not-for-profit, Acute Care # of Admissions: 24,947 # of Beds: 254 # of ICU Beds: 28 # of Patient-days: 66,703
Measure Observed Infections
Predicted Infections
Standardized Infection Ratio (SIR)
Comparison to Predicted
CLABSI 1 4.93 0.20 Similar
SSI 1 3.98 0.25 Similar
CABG 2 1.68 1.19 Similar
COLO 6 6.10 0.98 Similar
KPRO 0 2.11 0.00 Similar
Overall HAI 6 12.90 0.47 Lower
95% Confidence Interval
0.19 , 0.97
0.01 , 1.00
0.01 , 1.24
0.20 , 3.93
0.40 , 2.05
-, 1.42
CAUTI 4 4.00 1.00 0.32 , 2.41 Similar
HYST 0 1.31 0.77 0.04 , 3.78 Similar
STANDARDIZED INFECTION RATIOS (SIR)
Type of Unit Number of Infections
Number of Central Line Days
Rate per 1,000 Central Line Days
Comparison to National Rate
Medical/Surgical ICU 1 3,285 0.3 Similar
National Rate
0.8
CENTRAL LINE-ASSOCIATED BLOODSTREAM INFECTION RATES
HAI: Healthcare-associated infection CLABSI: Central line-associated bloodstream infection CAUTI: Catheter-associated urinary tract infection SSI: Surgical site infection COLO: Colon procedure HYST: Abdominal hysterectomy CABG: Coronary artery bypass graft KPRO: Knee arthroplasty
2016 HAI DATA REPORT
Type of Unit Number of Infections
Number of Catheter Days
Rate per 1,000 Catheter Days
Comparison to National Rate
Medical/Surgical ICU 4 3,331 1.2 Similar
National Rate
1.7
CATHETER-ASSOCIATED URINARY TRACT INFECTION RATES
CENTRAL LINE-ASSOCIATED BLOODSTREAM INFECTION RATES BY BIRTHWEIGHT IN NEONATAL INTENSIVE CARE UNITS
BW Category A: Equal or less than 750 grams BW Category B: Equal and between 751 and 1,000 grams BW Category C: Equal and between 1,001 and 1,500 grams BW Category D: Equal and between 1,501 and 2,500 grams BW Category E: More than 2,500 grams
Birthweight Category Number of Infections
Number of Central Line Days
Rate per 1,000 Central Line Days
National Rate
Comparison to National Rate
BW Category A
BW Category B
BW Category C
BW Category D
BW Category E
No Neonatal ICU to monitor infections

NH DHHS/Division of Public Health Services Healthcare-Associated Infections 2016 Hospital Report, September 1, 2017 Page 85
Measure Percent Adherence
State Coverage
Comparison to State Coverage
CLIP † 98.4 †
SCIP-1
SCIP-2
SCIP-3
Measure Percent Vaccinated
State Coverage
Comparison to State Coverage
HCP Influenza Vaccination 98.4 94.2 Higher
Note: SCIP data were not available at time of publication and as a result are excluded from this report.
PROCESS MEASURES
CATHOLIC MEDICAL CENTER 2016 DATA REPORT
SCIP-1
98.5 98.598.9 98.699.498.5
70
80
90
100
2012 2013
% A
dh
eren
ce
National State Hospital
SCIP: Surgical care improvement project CLIP: Central line insertion practices
The 2016 central line-associated blood stream infections (CLABSI), surgical site infections (SSI) and catheter-associated urinary tract infections (CAUTI) data presented in this report have not been validated and must be interpreted with the understanding that in general there are both under- and over-reporting of infections.
In New Hampshire in 2016, CLABSI were monitored in all intensive care units (including pediatric and neonatal units) and not in other inpatient locations. CAUTI were monitored in all intensive care units (including pediatric units and excluding neonatal ICU) and not in other inpatient locations.
Hospitals do not use a standard method of post-discharge surveillance to identify infections once a patient has been discharged. This poses a challenge for data interpretation, because a higher SSI rate (for example) at a given hospital may represent either poor infection prevention practices or, conversely, a better system for identifying infections.
SSI reporting requires not only reporting of infections but also detailed information on every patient who underwent the procedure being monitored. As such, DHHS has elected to monitor a subset of procedures based on national recommendations since it would not be feasible for hospitals to report information on every patient receiving a surgical procedure due to the burden of reporting.
As of July 1, 2015, SCIP 2014– 2016 data reported to CMS was unavailable and the HAI Program was unable to con-duct further analysis of this measure as routinely included in this report.
Policy Exemptions Allowed in Policy
Requirements for Unvaccinated HCP With Accepted Exemption
Consequences for Unvaccinated HCP Without Accepted Exemption
YES Medical, Religious Wear a mask Progressive discipline, potentially
including termination
DATA NOTES:
2014-2016 SCIP data are not available.
INFLUENZA VACCINATION POLICIES, 2016-2017 INFLUENZA SEASON

NH DHHS/Division of Public Health Services Healthcare-Associated Infections 2016 Hospital Report, September 1, 2017 Page 86
CHESHIRE MEDICAL CENTER Keene, NH Not-for-profit, Acute Care # of Admissions: 4,422 # of Beds: 102 # of ICU Beds: 10 # of Patient-days: 22,068
Measure Observed Infections
Predicted Infections
Standardized Infection Ratio (SIR)
95% Confidence Interval
Comparison to Predicted
Overall HAI 12 19.12 0.63 0.34 , 1.07 Similar
CLABSI † † † † †
CAUTI 0 1.42 0.00 - , 2.10 Similar
SSI 12 17.28 0.70 0.38 , 1.18 Similar
CABG
COLO 1 2.59 0.39 0.02 , 1.91 Similar
HYST † † † † †
KPRO 0 1.05 0.00 - , 2.85 Similar
Facility does not perform this procedure
STANDARDIZED INFECTION RATIOS (SIR)
Type of Unit Number of Infections
Number of Central Line Days
Rate per 1,000 Central Line Days
Comparison to National Rate
Medical ICU 0 221 0.0 Similar
National Rate
0.9
CENTRAL LINE-ASSOCIATED BLOODSTREAM INFECTION RATES
HAI: Healthcare-associated infection CLABSI: Central line-associated bloodstream infection CAUTI: Catheter-associated urinary tract infection SSI: Surgical site infection COLO: Colon procedure HYST: Abdominal hysterectomy CABG: Coronary artery bypass graft KPRO: Knee arthroplasty
2016 HAI DATA REPORT
Type of Unit Number of Infections
Number of Catheter Days
Rate per 1,000 Catheter Days
Comparison to National Rate
Medical ICU 0 712 0.0 Similar
National Rate
2.0
CATHETER-ASSOCIATED URINARY TRACT INFECTION RATES
CENTRAL LINE-ASSOCIATED BLOODSTREAM INFECTION RATES BY BIRTHWEIGHT IN NEONATAL INTENSIVE CARE UNITS
BW Category A: Equal or less than 750 grams BW Category B: Equal and between 751 and 1,000 grams BW Category C: Equal and between 1,001 and 1,500 grams BW Category D: Equal and between 1,501 and 2,500 grams BW Category E: More than 2,500 grams
Birthweight Category Number of Infections
Number of Central Line Days
Rate per 1,000 Central Line Days
National Rate
Comparison to National Rate
BW Category A
BW Category B
BW Category C
BW Category D
BW Category E
No Neonatal ICU to monitor infections

NH DHHS/Division of Public Health Services Healthcare-Associated Infections 2016 Hospital Report, September 1, 2017 Page 87
Measure Percent Adherence
State Coverage
Comparison to State Coverage
CLIP 100.0 98.4 Similar
SCIP-1
SCIP-2
SCIP-3
Measure Percent Vaccinated
State Coverage
Comparison to State Coverage
HCP Influenza Vaccination 92.6 94.2 Lower
Note: SCIP data were not available at time of publication and as a result are excluded from this report.
PROCESS MEASURES
CHESHIRE MEDICAL CENTER 2016 DATA REPORT
SCIP-1
98.5 98.598.9 98.6100.0 98.9
70
80
90
100
2012 2013
% A
dh
eren
ce
National State Hospital
SCIP: Surgical care improvement project CLIP: Central line insertion practices
The 2016 central line-associated blood stream infections (CLABSI), surgical site infections (SSI) and catheter-associated urinary tract infections (CAUTI) data presented in this report have not been validated and must be interpreted with the understanding that in general there are both under- and over-reporting of infections.
In New Hampshire in 2016, CLABSI were monitored in all intensive care units (including pediatric and neonatal units) and not in other inpatient locations. CAUTI were monitored in all intensive care units (including pediatric units and excluding neonatal ICU) and not in other inpatient locations.
Hospitals do not use a standard method of post-discharge surveillance to identify infections once a patient has been discharged. This poses a challenge for data interpretation, because a higher SSI rate (for example) at a given hospital may represent either poor infection prevention practices or, conversely, a better system for identifying infections.
SSI reporting requires not only reporting of infections but also detailed information on every patient who underwent the procedure being monitored. As such, DHHS has elected to monitor a subset of procedures based on national recommendations since it would not be feasible for hospitals to report information on every patient receiving a surgical procedure due to the burden of reporting.
As of July 1, 2015, SCIP 2014– 2016 data reported to CMS was unavailable and the HAI Program was unable to con-duct further analysis of this measure as routinely included in this report.
Policy Exemptions Allowed in Policy
Requirements for Unvaccinated HCP With Accepted Exemption
Consequences for Unvaccinated HCP Without Accepted Exemption
YES Medical, Religious Wear a mask, Receive verbal and/or
written education Wear a mask, Progressive discipline,
potentially including termination
DATA NOTES:
2014-2016 SCIP data are not available.
INFLUENZA VACCINATION POLICIES, 2016-2017 INFLUENZA SEASON
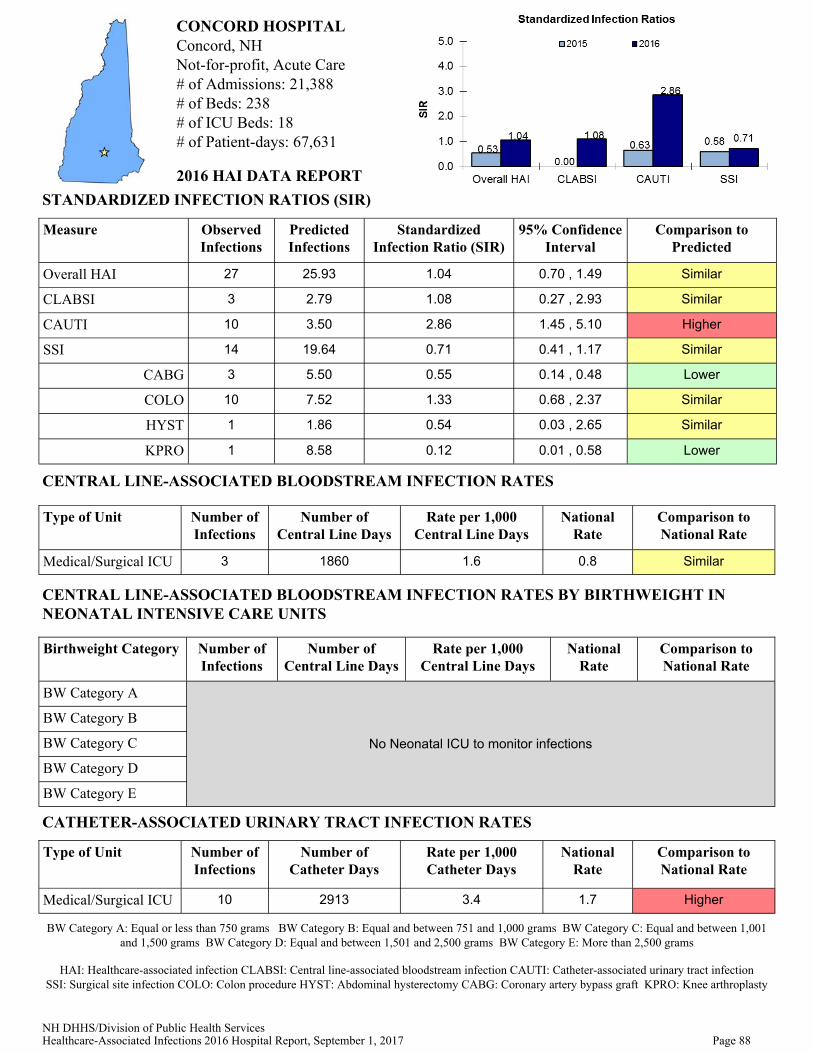
NH DHHS/Division of Public Health Services Healthcare-Associated Infections 2016 Hospital Report, September 1, 2017 Page 88
CONCORD HOSPITAL Concord, NH Not-for-profit, Acute Care # of Admissions: 21,388 # of Beds: 238 # of ICU Beds: 18 # of Patient-days: 67,631
Measure Observed Infections
Predicted Infections
Standardized Infection Ratio (SIR)
Comparison to Predicted
CLABSI 3 2.79 1.08 Similar
SSI 14 19.64 0.71 Similar
CABG 3 5.50 0.55 Lower
COLO 10 7.52 1.33 Similar
KPRO 1 8.58 0.12 Lower
Overall HAI 27 25.93 1.04 Similar
95% Confidence Interval
0.70 , 1.49
0.27 , 2.93
0.41 , 1.17
0.14 , 0.48
0.68 , 2.37
0.01 , 0.58
CAUTI 10 3.50 2.86 1.45 , 5.10 Higher
HYST 1 1.86 0.54 0.03 , 2.65 Similar
STANDARDIZED INFECTION RATIOS (SIR)
Type of Unit Number of Infections
Number of Central Line Days
Rate per 1,000 Central Line Days
Comparison to National Rate
Medical/Surgical ICU 3 1860 1.6 Similar
National Rate
0.8
CENTRAL LINE-ASSOCIATED BLOODSTREAM INFECTION RATES
HAI: Healthcare-associated infection CLABSI: Central line-associated bloodstream infection CAUTI: Catheter-associated urinary tract infection SSI: Surgical site infection COLO: Colon procedure HYST: Abdominal hysterectomy CABG: Coronary artery bypass graft KPRO: Knee arthroplasty
2016 HAI DATA REPORT
Type of Unit Number of Infections
Number of Catheter Days
Rate per 1,000 Catheter Days
Comparison to National Rate
Medical/Surgical ICU 10 2913 3.4 Higher
National Rate
1.7
CATHETER-ASSOCIATED URINARY TRACT INFECTION RATES
CENTRAL LINE-ASSOCIATED BLOODSTREAM INFECTION RATES BY BIRTHWEIGHT IN NEONATAL INTENSIVE CARE UNITS
BW Category A: Equal or less than 750 grams BW Category B: Equal and between 751 and 1,000 grams BW Category C: Equal and between 1,001 and 1,500 grams BW Category D: Equal and between 1,501 and 2,500 grams BW Category E: More than 2,500 grams
Birthweight Category Number of Infections
Number of Central Line Days
Rate per 1,000 Central Line Days
National Rate
Comparison to National Rate
BW Category A
BW Category B
BW Category C
BW Category D
BW Category E
No Neonatal ICU to monitor infections

NH DHHS/Division of Public Health Services Healthcare-Associated Infections 2016 Hospital Report, September 1, 2017 Page 89
Measure Percent Adherence
State Coverage
Comparison to State Coverage
CLIP 98.9 98.4 Similar
SCIP-1
SCIP-2
SCIP-3
Measure Percent Vaccinated
State Coverage
Comparison to State Coverage
HCP Influenza Vaccination 81.2 94.2 Lower
Note: SCIP data were not available at time of publication and as a result are excluded from this report.
PROCESS MEASURES
CONCORD HOSPITAL 2016 DATA REPORT
SCIP-1
98.5 98.598.9 98.699.4 99.7
70
80
90
100
2012 2013
% A
dh
eren
ce
National State Hospital
SCIP: Surgical care improvement project CLIP: Central line insertion practices
The 2016 central line-associated blood stream infections (CLABSI), surgical site infections (SSI) and catheter-associated urinary tract infections (CAUTI) data presented in this report have not been validated and must be interpreted with the understanding that in general there are both under- and over-reporting of infections.
In New Hampshire in 2016, CLABSI were monitored in all intensive care units (including pediatric and neonatal units) and not in other inpatient locations. CAUTI were monitored in all intensive care units (including pediatric units and excluding neonatal ICU) and not in other inpatient locations.
Hospitals do not use a standard method of post-discharge surveillance to identify infections once a patient has been discharged. This poses a challenge for data interpretation, because a higher SSI rate (for example) at a given hospital may represent either poor infection prevention practices or, conversely, a better system for identifying infections.
SSI reporting requires not only reporting of infections but also detailed information on every patient who underwent the procedure being monitored. As such, DHHS has elected to monitor a subset of procedures based on national recommendations since it would not be feasible for hospitals to report information on every patient receiving a surgical procedure due to the burden of reporting.
As of July 1, 2015, SCIP 2014– 2016 data reported to CMS was unavailable and the HAI Program was unable to con-duct further analysis of this measure as routinely included in this report.
Policy Exemptions Allowed in Policy
Requirements for Unvaccinated HCP With Accepted Exemption
Consequences for Unvaccinated HCP Without Accepted Exemption
None
DATA NOTES:
2014-2016 SCIP data are not available.
INFLUENZA VACCINATION POLICIES, 2016-2017 INFLUENZA SEASON

NH DHHS/Division of Public Health Services Healthcare-Associated Infections 2016 Hospital Report, September 1, 2017 Page 90
COTTAGE HOSPITAL Woodsville, NH Not-for-profit, Critical Access # of Admissions: 1,001 # of Beds: 25 # of ICU Beds: 3 # of Patient-days: 5,173
Measure Observed Infections
Predicted Infections
Standardized Infection Ratio (SIR)
95% Confidence Interval
Comparison to Predicted
Overall HAI † † † † †
CLABSI † † † † †
CAUTI † † † † †
SSI † † † † †
CABG Facility does not perform this procedure
COLO † † † † †
HYST
KPRO † † † † †
Facility did not perform this procedure in 2016
STANDARDIZED INFECTION RATIOS (SIR)
Type of Unit Number of Infections
Number of Central Line Days
Rate per 1,000 Central Line Days
Comparison to National Rate
Medical/Surgical ICU 0.00 65 0.00 Similar
National Rate
0.40
CENTRAL LINE-ASSOCIATED BLOODSTREAM INFECTION RATES
HAI: Healthcare-associated infection CLABSI: Central line-associated bloodstream infection CAUTI: Catheter-associated urinary tract infection SSI: Surgical site infection COLO: Colon procedure HYST: Abdominal hysterectomy CABG: Coronary artery bypass graft KPRO: Knee arthroplasty
2016 HAI DATA REPORT
Type of Unit Number of Infections
Number of Catheter Days
Rate per 1,000 Catheter Days
Comparison to National Rate
Medical/Surgical ICU 0 130 0.0 Similar
National Rate
0.5
CATHETER-ASSOCIATED URINARY TRACT INFECTION RATES
CENTRAL LINE-ASSOCIATED BLOODSTREAM INFECTION RATES BY BIRTHWEIGHT IN NEONATAL INTENSIVE CARE UNITS
BW Category A: Equal or less than 750 grams BW Category B: Equal and between 751 and 1,000 grams BW Category C: Equal and between 1,001 and 1,500 grams BW Category D: Equal and between 1,501 and 2,500 grams BW Category E: More than 2,500 grams
Birthweight Category Number of Infections
Number of Central Line Days
Rate per 1,000 Central Line Days
National Rate
Comparison to National Rate
BW Category A
BW Category B
BW Category C
BW Category D
BW Category E
No Neonatal ICU to monitor infections

NH DHHS/Division of Public Health Services Healthcare-Associated Infections 2016 Hospital Report, September 1, 2017 Page 91
Measure Percent Adherence
State Coverage
Comparison to State Coverage
CLIP † 98.4 †
SCIP-1
SCIP-2
SCIP-3
Measure Percent Vaccinated
State Coverage
Comparison to State Coverage
HCP Influenza Vaccination 93.1 94.2 Similar
Note: SCIP data were not available at time of publication and as a result are excluded from this report.
PROCESS MEASURES
COTTAGE HOSPITAL 2016 DATA REPORT
SCIP-1
98.5 98.598.9 98.6
92.088.9
70
80
90
100
2012 2013
% A
dh
eren
ce
National State Hospital
SCIP: Surgical care improvement project CLIP: Central line insertion practices
The 2016 central line-associated blood stream infections (CLABSI), surgical site infections (SSI) and catheter-associated urinary tract infections (CAUTI) data presented in this report have not been validated and must be interpreted with the understanding that in general there are both under- and over-reporting of infections.
In New Hampshire in 2016, CLABSI were monitored in all intensive care units (including pediatric and neonatal units) and not in other inpatient locations. CAUTI were monitored in all intensive care units (including pediatric units and excluding neonatal ICU) and not in other inpatient locations.
Hospitals do not use a standard method of post-discharge surveillance to identify infections once a patient has been discharged. This poses a challenge for data interpretation, because a higher SSI rate (for example) at a given hospital may represent either poor infection prevention practices or, conversely, a better system for identifying infections.
SSI reporting requires not only reporting of infections but also detailed information on every patient who underwent the procedure being monitored. As such, DHHS has elected to monitor a subset of procedures based on national recommendations since it would not be feasible for hospitals to report information on every patient receiving a surgical procedure due to the burden of reporting.
As of July 1, 2015, SCIP 2014– 2016 data reported to CMS was unavailable and the HAI Program was unable to con-duct further analysis of this measure as routinely included in this report.
Policy Exemptions Allowed in Policy
Requirements for Unvaccinated HCP With Accepted Exemption
Consequences for Unvaccinated HCP Without Accepted Exemption
YES Medical, Religious,
Personal/philosophical, Other
Wear a mask Wear a mask
DATA NOTES:
2014-2016 SCIP data are not available.
INFLUENZA VACCINATION POLICIES, 2016-2017 INFLUENZA SEASON

NH DHHS/Division of Public Health Services Healthcare-Associated Infections 2016 Hospital Report, September 1, 2017 Page 92
2016 HAI DATA REPORT
DHMC Lebanon, NH Not-for-profit, Acute Care # of Admissions: 26,260 # of Beds: 426 # of ICU Beds: 88 # of Patient-days: 125,153
Measure Observed Infections
Predicted Infections
Standardized Infection Ratio (SIR)
Comparison to Predicted
CLABSI 7 22.96 0.31 Lower
SSI 31 44.41 0.70 Lower
CABG 3 5.05 0.59 Similar
COLO 18 24.09 0.75 Similar
KPRO 4 5.63 0.71 Similar
Overall HAI 63 96.38 0.65 Lower
95% Confidence Interval
0.51 , 0.83
0.13 , 0.60
0.48 , 0.98
0.15 , 1.62
0.46 , 1.16
0.23 , 1.72
CAUTI 25 29.01 0.86 0.57 , 1.25 Similar
HYST 6 9.20 0.65 0.26 , 1.36 Similar
STANDARDIZED INFECTION RATIOS (SIR)
Type of Unit Number of Infections
Number of Central Line Days
Rate per 1,000 Central Line Days
Comparison to National Rate
Cardiac ICU 1 2475 0.4 Similar
National Rate
0.9
Med/Surg ICU 1 0 603 0.0 1.0 Similar
Med/Surg ICU 2 0 734 0.0 1.0 Similar
Med/Surg ICU 3 0 177 0.0 1.0 Similar
Ped Med/Surg ICU 0 395 0.0 1.2 Similar
Medical ICU 1 2 1969 1.0 1.2 Similar
Surgical ICU 3 2143 1.4 1.1 Similar
Medical ICU 2 1 570 1.8 1.2 Similar
CENTRAL LINE-ASSOCIATED BLOODSTREAM INFECTION RATES
CENTRAL LINE-ASSOCIATED BLOODSTREAM INFECTION RATES BY BIRTHWEIGHT IN NEONATAL INTENSIVE CARE UNITS
Birthweight Category Number of Infections
Number of Central Line Days
Rate per 1,000 Central Line Days
National Rate
Comparison to National Rate
BW Category A 0 186 0.0 2.6 Similar
BW Category B 0 168 0.0 1.4 Similar
BW Category C 0 193 0.0 0.9 Similar
BW Category D 0 181 0.0 0.5 Similar
BW Category E 0 212 0.0 0.4 Similar
Dartmouth Hitchcock changed the categoriza on of its Med/Surg ICU halfway through 2016.
DATA NOTES ON PAGE 94
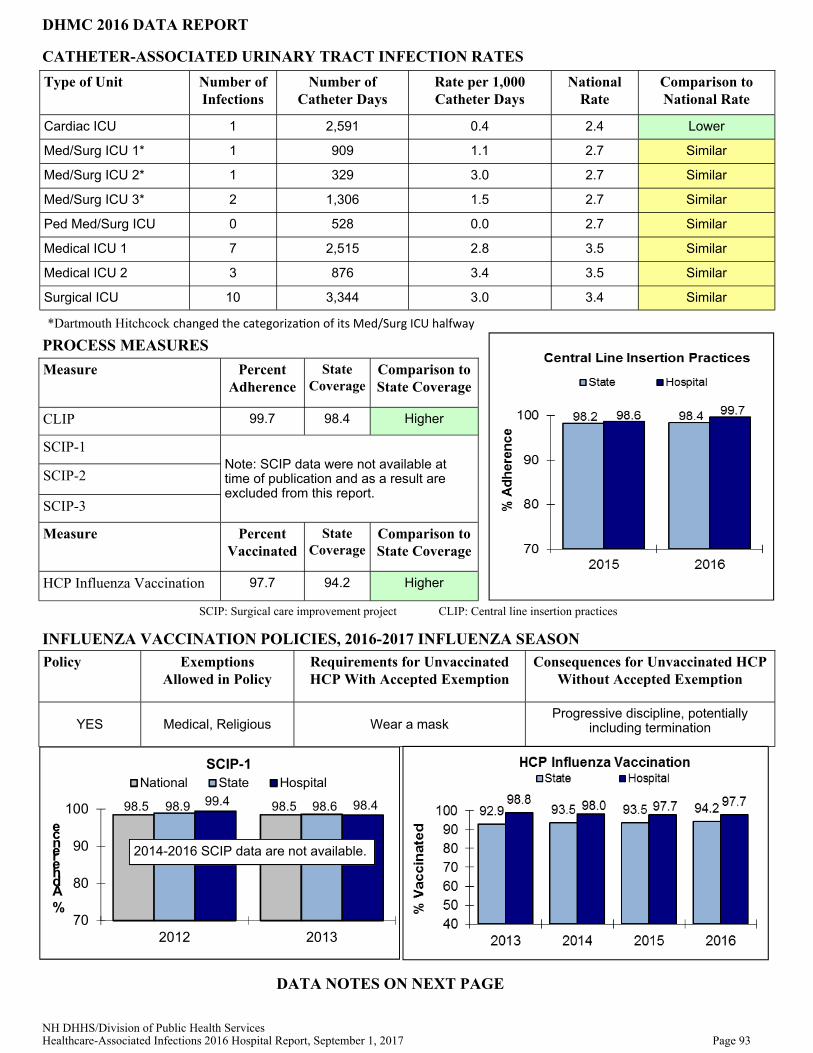
NH DHHS/Division of Public Health Services Healthcare-Associated Infections 2016 Hospital Report, September 1, 2017 Page 93
Measure Percent Adherence
State Coverage
Comparison to State Coverage
CLIP 99.7 98.4 Higher
SCIP-1
SCIP-2
SCIP-3
Measure Percent Vaccinated
State Coverage
Comparison to State Coverage
HCP Influenza Vaccination 97.7 94.2 Higher
Note: SCIP data were not available at time of publication and as a result are excluded from this report.
PROCESS MEASURES
DHMC 2016 DATA REPORT
Policy Exemptions Allowed in Policy
Requirements for Unvaccinated HCP With Accepted Exemption
Consequences for Unvaccinated HCP Without Accepted Exemption
YES Medical, Religious Wear a mask Progressive discipline, potentially
including termination
INFLUENZA VACCINATION POLICIES, 2016-2017 INFLUENZA SEASON
Type of Unit Number of Infections
Number of Catheter Days
Rate per 1,000 Catheter Days
Comparison to National Rate
Cardiac ICU 1 2,591 0.4 Lower
National Rate
2.4
Med/Surg ICU 1* 1 909 1.1 2.7 Similar
Med/Surg ICU 2* 1 329 3.0 2.7 Similar
Med/Surg ICU 3* 2 1,306 1.5 2.7 Similar
Ped Med/Surg ICU 0 528 0.0 2.7 Similar
Medical ICU 1 7 2,515 2.8 3.5 Similar
Medical ICU 2 3 876 3.4 3.5 Similar
Surgical ICU 10 3,344 3.0 3.4 Similar
CATHETER-ASSOCIATED URINARY TRACT INFECTION RATES
SCIP: Surgical care improvement project CLIP: Central line insertion practices
*Dartmouth Hitchcock changed the categoriza on of its Med/Surg ICU halfway
98.5 98.598.9 98.699.4 98.4
70
80
90
100
2012 2013
% Adherence
SCIP-1National State Hospital
DATA NOTES ON NEXT PAGE
2014-2016 SCIP data are not available.

NH DHHS/Division of Public Health Services Healthcare-Associated Infections 2016 Hospital Report, September 1, 2017 Page 94
DHMC 2016 DATA REPORT
The 2016 central line-associated blood stream infections (CLABSI), surgical site infections (SSI) and catheter-associated urinary tract infections (CAUTI) data presented in this report have not been validated and must be interpreted with the understanding that in general there are both under- and over-reporting of infections.
In New Hampshire in 2016, CLABSI were monitored in all intensive care units (including pediatric and neonatal units) and not in other inpatient locations. CAUTI were monitored in all intensive care units (including pediatric units and excluding neonatal ICU) and not in other inpatient locations.
Hospitals do not use a standard method of post-discharge surveillance to identify infections once a patient has been discharged. This poses a challenge for data interpretation, because a higher SSI rate (for example) at a given hospital may represent either poor infection prevention practices or, conversely, a better system for identifying infections.
SSI reporting requires not only reporting of infections but also detailed information on every patient who underwent the procedure being monitored. As such, DHHS has elected to monitor a subset of procedures based on national recommendations since it would not be feasible for hospitals to report information on every patient receiving a surgical procedure due to the burden of reporting.
As of July 1, 2015, SCIP 2014– 2016 data reported to CMS was unavailable and the HAI Program was unable to con-duct further analysis of this measure as routinely included in this report.
DATA NOTES: BW Category A: Equal or less than 750 grams BW Category B: Equal and between 751 and 1,000 grams BW Category C: Equal and between 1,001
and 1,500 grams BW Category D: Equal and between 1,501 and 2,500 grams BW Category E: More than 2,500 grams
HAI: Healthcare-associated infection CLABSI: Central line-associated bloodstream infection CAUTI: Catheter-associated urinary tract infection SSI: Surgical site infection COLO: Colon procedure HYST: Abdominal hysterectomy CABG: Coronary artery bypass graft KPRO: Knee arthroplasty

NH DHHS/Division of Public Health Services Healthcare-Associated Infections 2016 Hospital Report, September 1, 2017 Page 95
ELLIOT HOSPITAL Manchester, NH Not-for-profit, Acute Care # of Admissions: 14,653 # of Beds: 278 # of ICU Beds: 50 # of Patient-days: 70,508
Measure Observed Infections
Predicted Infections
Standardized Infection Ratio (SIR)
95% Confidence Interval
Comparison to Predicted
Overall HAI 20 21.33 0.94 0.59 , 1.42 Similar
CLABSI 4 4.36 0.92 0.29 , 2.21 Similar
CAUTI 7 2.19 3.19 1.40 , 6.31 Higher
SSI 9 14.77 0.61 0.30 , 1.12 Similar
CABG
COLO 6 8.82 0.68 0.28 , 1.42 Similar
HYST 1 2.46 0.41 0.02 , 2.00 Similar
KPRO 2 3.50 0.57 0.10 , 1.89 Similar
Facility does not perform this procedure
STANDARDIZED INFECTION RATIOS (SIR)
Type of Unit Number of Infections
Number of Central Line Days
Rate per 1,000 Central Line Days
Comparison to National Rate
Medical/Surgical ICU 1 1372 0.7 Similar
National Rate
0.8
Pediatric Medical ICU † † † † †
CENTRAL LINE-ASSOCIATED BLOODSTREAM INFECTION RATES
HAI: Healthcare-associated infection CLABSI: Central line-associated bloodstream infection CAUTI: Catheter-associated urinary tract infection SSI: Surgical site infection COLO: Colon procedure HYST: Abdominal hysterectomy CABG: Coronary artery bypass graft KPRO: Knee arthroplasty
2016 HAI DATA REPORT
Type of Unit Number of Infections
Number of Catheter Days
Rate per 1,000 Catheter Days
Comparison to National Rate
Medical/Surgical ICU 7 1810 3.9 Higher
National Rate
1.7
Pediatric Medical ICU † † † † †
CATHETER-ASSOCIATED URINARY TRACT INFECTION RATES
CENTRAL LINE-ASSOCIATED BLOODSTREAM INFECTION RATES BY BIRTHWEIGHT IN NEONATAL INTENSIVE CARE UNITS
Birthweight Category Number of Infections
Number of Central Line Days
Rate per 1,000 Central Line Days
National Rate
Comparison to National Rate
BW Category A 0 139 0.0 2.6 Similar
BW Category B 1 194 5.2 1.4 Similar
BW Category C 0 151 0.0 0.9 Similar
BW Category D 2 471 4.2 0.5 Higher
BW Category E 0 169 0.0 0.4 Similar
BW Category A: Equal or less than 750 grams BW Category B: Equal and between 751 and 1,000 grams BW Category C: Equal and between 1,001 and 1,500 grams BW Category D: Equal and between 1,501 and 2,500 grams BW Category E: More than 2,500 grams

NH DHHS/Division of Public Health Services Healthcare-Associated Infections 2016 Hospital Report, September 1, 2017 Page 96
Measure Percent Adherence
State Coverage
Comparison to State Coverage
CLIP 95.9 98.4 Lower
SCIP-1
SCIP-2
SCIP-3
Measure Percent Vaccinated
State Coverage
Comparison to State Coverage
HCP Influenza Vaccination 98.5 94.2 Higher
Note: SCIP data were not available at time of publication and as a result are excluded from this report.
PROCESS MEASURES
ELLIOT HOSPITAL 2016 DATA REPORT
SCIP-1
98.5 98.598.9 98.698.1 98.8
70
80
90
100
2012 2013
% A
dh
eren
ce
National State Hospital
SCIP: Surgical care improvement project CLIP: Central line insertion practices
The 2016 central line-associated blood stream infections (CLABSI), surgical site infections (SSI) and catheter-associated urinary tract infections (CAUTI) data presented in this report have not been validated and must be interpreted with the understanding that in general there are both under- and over-reporting of infections.
In New Hampshire in 2016, CLABSI were monitored in all intensive care units (including pediatric and neonatal units) and not in other inpatient locations. CAUTI were monitored in all intensive care units (including pediatric units and excluding neonatal ICU) and not in other inpatient locations.
Hospitals do not use a standard method of post-discharge surveillance to identify infections once a patient has been discharged. This poses a challenge for data interpretation, because a higher SSI rate (for example) at a given hospital may represent either poor infection prevention practices or, conversely, a better system for identifying infections.
SSI reporting requires not only reporting of infections but also detailed information on every patient who underwent the procedure being monitored. As such, DHHS has elected to monitor a subset of procedures based on national recommendations since it would not be feasible for hospitals to report information on every patient receiving a surgical procedure due to the burden of reporting.
As of July 1, 2015, SCIP 2014– 2016 data reported to CMS was unavailable and the HAI Program was unable to con-duct further analysis of this measure as routinely included in this report.
Policy Exemptions Allowed in Policy
Requirements for Unvaccinated HCP With Accepted Exemption
Consequences for Unvaccinated HCP Without Accepted Exemption
YES Medical, Religious Wear a mask Progressive discipline, potentially
including termination
DATA NOTES:
2014-2016 SCIP data are not available.
INFLUENZA VACCINATION POLICIES, 2016-2017 INFLUENZA SEASON

NH DHHS/Division of Public Health Services Healthcare-Associated Infections 2016 Hospital Report, September 1, 2017 Page 97
EXETER HOSPITAL Exeter, NH Not-for-profit, Acute Care # of Admissions: 5,271 # of Beds: 100 # of ICU Beds: 10 # of Patient-days: 20,966
Measure Observed Infections
Predicted Infections
Standardized Infection Ratio (SIR)
95% Confidence Interval
Comparison to Predicted
Overall HAI 10 10.87 0.92 0.47 , 1.64 Similar
CLABSI 2 1.65 1.21 0.20 , 4.00 Similar
CAUTI 3 1.53 1.96 0.50 , 5.35 Similar
SSI 5 7.69 0.65 0.24 , 1.44 Similar
CABG
COLO 5 5.50 0.91 0.33 , 2.01 Similar
HYST † † † † †
KPRO 0 1.74 0.00 - , 1.73 Similar
Facility does not perform this procedure
STANDARDIZED INFECTION RATIOS (SIR)
Type of Unit Number of Infections
Number of Central Line Days
Rate per 1,000 Central Line Days
Comparison to National Rate
Medical/Surgical ICU 2 1101 1.8 Similar
National Rate
0.7
CENTRAL LINE-ASSOCIATED BLOODSTREAM INFECTION RATES
HAI: Healthcare-associated infection CLABSI: Central line-associated bloodstream infection CAUTI: Catheter-associated urinary tract infection SSI: Surgical site infection COLO: Colon procedure HYST: Abdominal hysterectomy CABG: Coronary artery bypass graft KPRO: Knee arthroplasty
2016 HAI DATA REPORT
Type of Unit Number of Infections
Number of Catheter Days
Rate per 1,000 Catheter Days
Comparison to National Rate
Medical/Surgical ICU 3 1175 2.6 Similar
National Rate
1.3
CATHETER-ASSOCIATED URINARY TRACT INFECTION RATES
CENTRAL LINE-ASSOCIATED BLOODSTREAM INFECTION RATES BY BIRTHWEIGHT IN NEONATAL INTENSIVE CARE UNITS
BW Category A: Equal or less than 750 grams BW Category B: Equal and between 751 and 1,000 grams BW Category C: Equal and between 1,001 and 1,500 grams BW Category D: Equal and between 1,501 and 2,500 grams BW Category E: More than 2,500 grams
Birthweight Category Number of Infections
Number of Central Line Days
Rate per 1,000 Central Line Days
National Rate
Comparison to National Rate
BW Category A
BW Category B
BW Category C
BW Category D
BW Category E
No Neonatal ICU to monitor infections
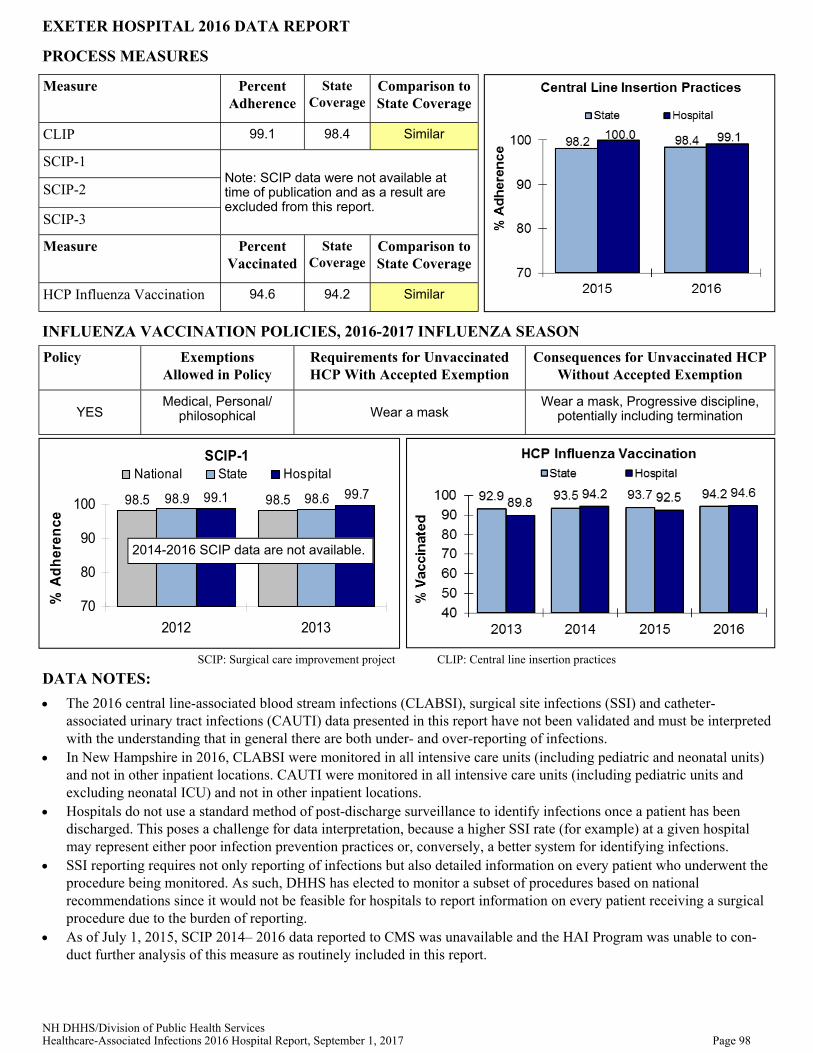
NH DHHS/Division of Public Health Services Healthcare-Associated Infections 2016 Hospital Report, September 1, 2017 Page 98
Measure Percent Adherence
State Coverage
Comparison to State Coverage
CLIP 99.1 98.4 Similar
SCIP-1
SCIP-2
SCIP-3
Measure Percent Vaccinated
State Coverage
Comparison to State Coverage
HCP Influenza Vaccination 94.6 94.2 Similar
Note: SCIP data were not available at time of publication and as a result are excluded from this report.
PROCESS MEASURES
EXETER HOSPITAL 2016 DATA REPORT
SCIP-1
98.5 98.598.9 98.699.1 99.7
70
80
90
100
2012 2013
% A
dh
eren
ce
National State Hospital
SCIP: Surgical care improvement project CLIP: Central line insertion practices
The 2016 central line-associated blood stream infections (CLABSI), surgical site infections (SSI) and catheter-associated urinary tract infections (CAUTI) data presented in this report have not been validated and must be interpreted with the understanding that in general there are both under- and over-reporting of infections.
In New Hampshire in 2016, CLABSI were monitored in all intensive care units (including pediatric and neonatal units) and not in other inpatient locations. CAUTI were monitored in all intensive care units (including pediatric units and excluding neonatal ICU) and not in other inpatient locations.
Hospitals do not use a standard method of post-discharge surveillance to identify infections once a patient has been discharged. This poses a challenge for data interpretation, because a higher SSI rate (for example) at a given hospital may represent either poor infection prevention practices or, conversely, a better system for identifying infections.
SSI reporting requires not only reporting of infections but also detailed information on every patient who underwent the procedure being monitored. As such, DHHS has elected to monitor a subset of procedures based on national recommendations since it would not be feasible for hospitals to report information on every patient receiving a surgical procedure due to the burden of reporting.
As of July 1, 2015, SCIP 2014– 2016 data reported to CMS was unavailable and the HAI Program was unable to con-duct further analysis of this measure as routinely included in this report.
Policy Exemptions Allowed in Policy
Requirements for Unvaccinated HCP With Accepted Exemption
Consequences for Unvaccinated HCP Without Accepted Exemption
YES Medical, Personal/
philosophical Wear a mask Wear a mask, Progressive discipline,
potentially including termination
DATA NOTES:
2014-2016 SCIP data are not available.
INFLUENZA VACCINATION POLICIES, 2016-2017 INFLUENZA SEASON

NH DHHS/Division of Public Health Services Healthcare-Associated Infections 2016 Hospital Report, September 1, 2017 Page 99
FRANKLIN REGIONAL Franklin, NH Not-for-profit, Critical Access # of Admissions: 588 # of Beds: 35 # of ICU Beds: 0 # of Patient-days: 43,048
Measure Observed Infections
Predicted Infections
Standardized Infection Ratio (SIR)
95% Confidence Interval
Comparison to Predicted
Overall HAI † † † † †
CLABSI † † † † †
CAUTI † † † † †
SSI
CABG
COLO
HYST
KPRO
No procedures of these types performed in 2016
STANDARDIZED INFECTION RATIOS (SIR)
Type of Unit Number of Infections
Number of Central Line Days
Rate per 1,000 Central Line Days
Comparison to National Rate
Medical/Surgical ICU † † † †
National Rate
†
CENTRAL LINE-ASSOCIATED BLOODSTREAM INFECTION RATES
HAI: Healthcare-associated infection CLABSI: Central line-associated bloodstream infection CAUTI: Catheter-associated urinary tract infection SSI: Surgical site infection COLO: Colon procedure HYST: Abdominal hysterectomy CABG: Coronary artery bypass graft KPRO: Knee arthroplasty
2016 HAI DATA REPORT
Type of Unit Number of Infections
Number of Catheter Days
Rate per 1,000 Catheter Days
Comparison to National Rate
Medical/Surgical ICU † † † †
National Rate
†
CATHETER-ASSOCIATED URINARY TRACT INFECTION RATES
CENTRAL LINE-ASSOCIATED BLOODSTREAM INFECTION RATES BY BIRTHWEIGHT IN NEONATAL INTENSIVE CARE UNITS
BW Category A: Equal or less than 750 grams BW Category B: Equal and between 751 and 1,000 grams BW Category C: Equal and between 1,001 and 1,500 grams BW Category D: Equal and between 1,501 and 2,500 grams BW Category E: More than 2,500 grams
Birthweight Category Number of Infections
Number of Central Line Days
Rate per 1,000 Central Line Days
National Rate
Comparison to National Rate
BW Category A
BW Category B
BW Category C
BW Category D
BW Category E
No Neonatal ICU to monitor infections
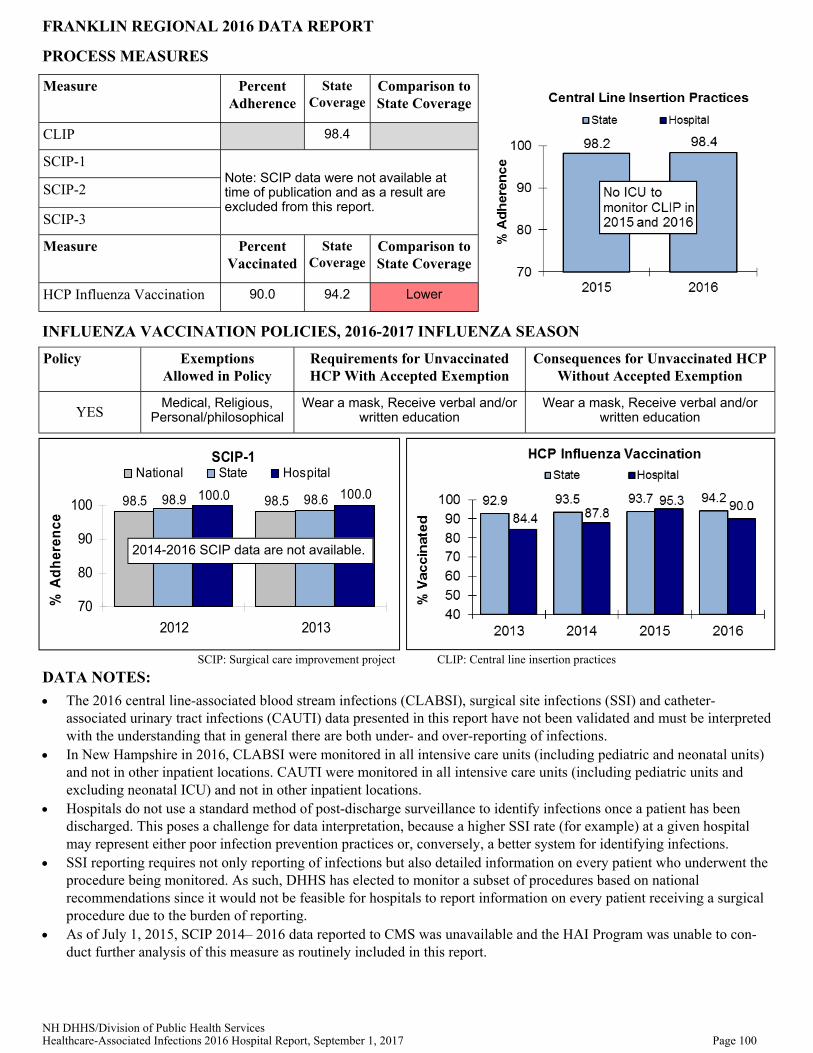
NH DHHS/Division of Public Health Services Healthcare-Associated Infections 2016 Hospital Report, September 1, 2017 Page 100
Measure Percent Adherence
State Coverage
Comparison to State Coverage
CLIP 98.4
SCIP-1
SCIP-2
SCIP-3
Measure Percent Vaccinated
State Coverage
Comparison to State Coverage
HCP Influenza Vaccination 90.0 94.2 Lower
Note: SCIP data were not available at time of publication and as a result are excluded from this report.
PROCESS MEASURES
FRANKLIN REGIONAL 2016 DATA REPORT
SCIP-1
98.5 98.598.9 98.6100.0 100.0
70
80
90
100
2012 2013
% A
dh
eren
ce
National State Hospital
SCIP: Surgical care improvement project CLIP: Central line insertion practices
The 2016 central line-associated blood stream infections (CLABSI), surgical site infections (SSI) and catheter-associated urinary tract infections (CAUTI) data presented in this report have not been validated and must be interpreted with the understanding that in general there are both under- and over-reporting of infections.
In New Hampshire in 2016, CLABSI were monitored in all intensive care units (including pediatric and neonatal units) and not in other inpatient locations. CAUTI were monitored in all intensive care units (including pediatric units and excluding neonatal ICU) and not in other inpatient locations.
Hospitals do not use a standard method of post-discharge surveillance to identify infections once a patient has been discharged. This poses a challenge for data interpretation, because a higher SSI rate (for example) at a given hospital may represent either poor infection prevention practices or, conversely, a better system for identifying infections.
SSI reporting requires not only reporting of infections but also detailed information on every patient who underwent the procedure being monitored. As such, DHHS has elected to monitor a subset of procedures based on national recommendations since it would not be feasible for hospitals to report information on every patient receiving a surgical procedure due to the burden of reporting.
As of July 1, 2015, SCIP 2014– 2016 data reported to CMS was unavailable and the HAI Program was unable to con-duct further analysis of this measure as routinely included in this report.
Policy Exemptions Allowed in Policy
Requirements for Unvaccinated HCP With Accepted Exemption
Consequences for Unvaccinated HCP Without Accepted Exemption
YES Medical, Religious,
Personal/philosophical Wear a mask, Receive verbal and/or
written education Wear a mask, Receive verbal and/or
written education
DATA NOTES:
2014-2016 SCIP data are not available.
INFLUENZA VACCINATION POLICIES, 2016-2017 INFLUENZA SEASON
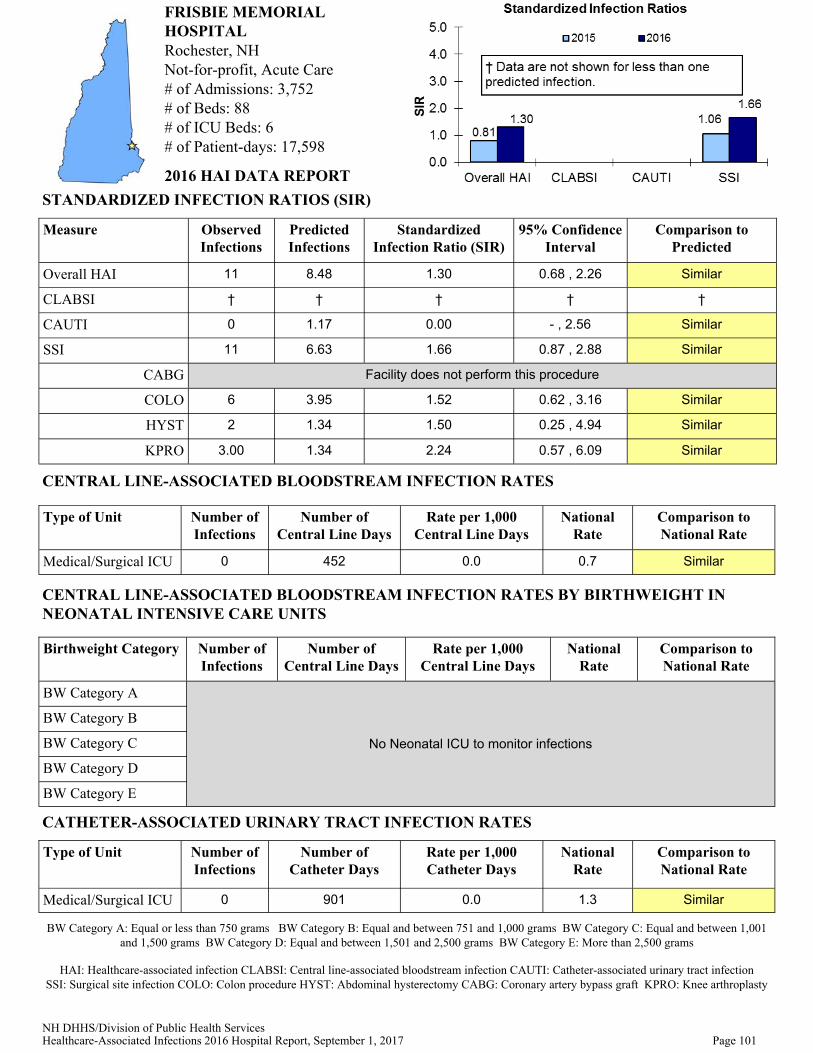
NH DHHS/Division of Public Health Services Healthcare-Associated Infections 2016 Hospital Report, September 1, 2017 Page 101
FRISBIE MEMORIAL HOSPITAL Rochester, NH Not-for-profit, Acute Care # of Admissions: 3,752 # of Beds: 88 # of ICU Beds: 6 # of Patient-days: 17,598
Measure Observed Infections
Predicted Infections
Standardized Infection Ratio (SIR)
95% Confidence Interval
Comparison to Predicted
Overall HAI 11 8.48 1.30 0.68 , 2.26 Similar
CLABSI † † † † †
CAUTI 0 1.17 0.00 - , 2.56 Similar
SSI 11 6.63 1.66 0.87 , 2.88 Similar
CABG
COLO 6 3.95 1.52 0.62 , 3.16 Similar
HYST 2 1.34 1.50 0.25 , 4.94 Similar
KPRO 3.00 1.34 2.24 0.57 , 6.09 Similar
Facility does not perform this procedure
STANDARDIZED INFECTION RATIOS (SIR)
Type of Unit Number of Infections
Number of Central Line Days
Rate per 1,000 Central Line Days
Comparison to National Rate
Medical/Surgical ICU 0 452 0.0 Similar
National Rate
0.7
CENTRAL LINE-ASSOCIATED BLOODSTREAM INFECTION RATES
HAI: Healthcare-associated infection CLABSI: Central line-associated bloodstream infection CAUTI: Catheter-associated urinary tract infection SSI: Surgical site infection COLO: Colon procedure HYST: Abdominal hysterectomy CABG: Coronary artery bypass graft KPRO: Knee arthroplasty
2016 HAI DATA REPORT
Type of Unit Number of Infections
Number of Catheter Days
Rate per 1,000 Catheter Days
Comparison to National Rate
Medical/Surgical ICU 0 901 0.0 Similar
National Rate
1.3
CATHETER-ASSOCIATED URINARY TRACT INFECTION RATES
CENTRAL LINE-ASSOCIATED BLOODSTREAM INFECTION RATES BY BIRTHWEIGHT IN NEONATAL INTENSIVE CARE UNITS
BW Category A: Equal or less than 750 grams BW Category B: Equal and between 751 and 1,000 grams BW Category C: Equal and between 1,001 and 1,500 grams BW Category D: Equal and between 1,501 and 2,500 grams BW Category E: More than 2,500 grams
Birthweight Category Number of Infections
Number of Central Line Days
Rate per 1,000 Central Line Days
National Rate
Comparison to National Rate
BW Category A
BW Category B
BW Category C
BW Category D
BW Category E
No Neonatal ICU to monitor infections

NH DHHS/Division of Public Health Services Healthcare-Associated Infections 2016 Hospital Report, September 1, 2017 Page 102
Measure Percent Adherence
State Coverage
Comparison to State Coverage
CLIP † 98.4 †
SCIP-1
SCIP-2
SCIP-3
Measure Percent Vaccinated
State Coverage
Comparison to State Coverage
HCP Influenza Vaccination 91.7 94.2 Lower
Note: SCIP data were not available at time of publication and as a result are excluded from this report.
PROCESS MEASURES
FRISBIE MEMORIAL HOSPITAL 2016 DATA REPORT
SCIP-1
98.5 98.598.9 98.696.5 98.3
70
80
90
100
2012 2013
% A
dh
eren
ce
National State Hospital
SCIP: Surgical care improvement project CLIP: Central line insertion practices
The 2016 central line-associated blood stream infections (CLABSI), surgical site infections (SSI) and catheter-associated urinary tract infections (CAUTI) data presented in this report have not been validated and must be interpreted with the understanding that in general there are both under- and over-reporting of infections.
In New Hampshire in 2016, CLABSI were monitored in all intensive care units (including pediatric and neonatal units) and not in other inpatient locations. CAUTI were monitored in all intensive care units (including pediatric units and excluding neonatal ICU) and not in other inpatient locations.
Hospitals do not use a standard method of post-discharge surveillance to identify infections once a patient has been discharged. This poses a challenge for data interpretation, because a higher SSI rate (for example) at a given hospital may represent either poor infection prevention practices or, conversely, a better system for identifying infections.
SSI reporting requires not only reporting of infections but also detailed information on every patient who underwent the procedure being monitored. As such, DHHS has elected to monitor a subset of procedures based on national recommendations since it would not be feasible for hospitals to report information on every patient receiving a surgical procedure due to the burden of reporting.
As of July 1, 2015, SCIP 2014– 2016 data reported to CMS was unavailable and the HAI Program was unable to con-duct further analysis of this measure as routinely included in this report.
Policy Exemptions Allowed in Policy
Requirements for Unvaccinated HCP With Accepted Exemption
Consequences for Unvaccinated HCP Without Accepted Exemption
YES Medical, Religious,
Personal/philosophical Wear a mask Receive verbal and/or written education
DATA NOTES:
2014-2016 SCIP data are not available.
INFLUENZA VACCINATION POLICIES, 2015-2016 INFLUENZA SEASON
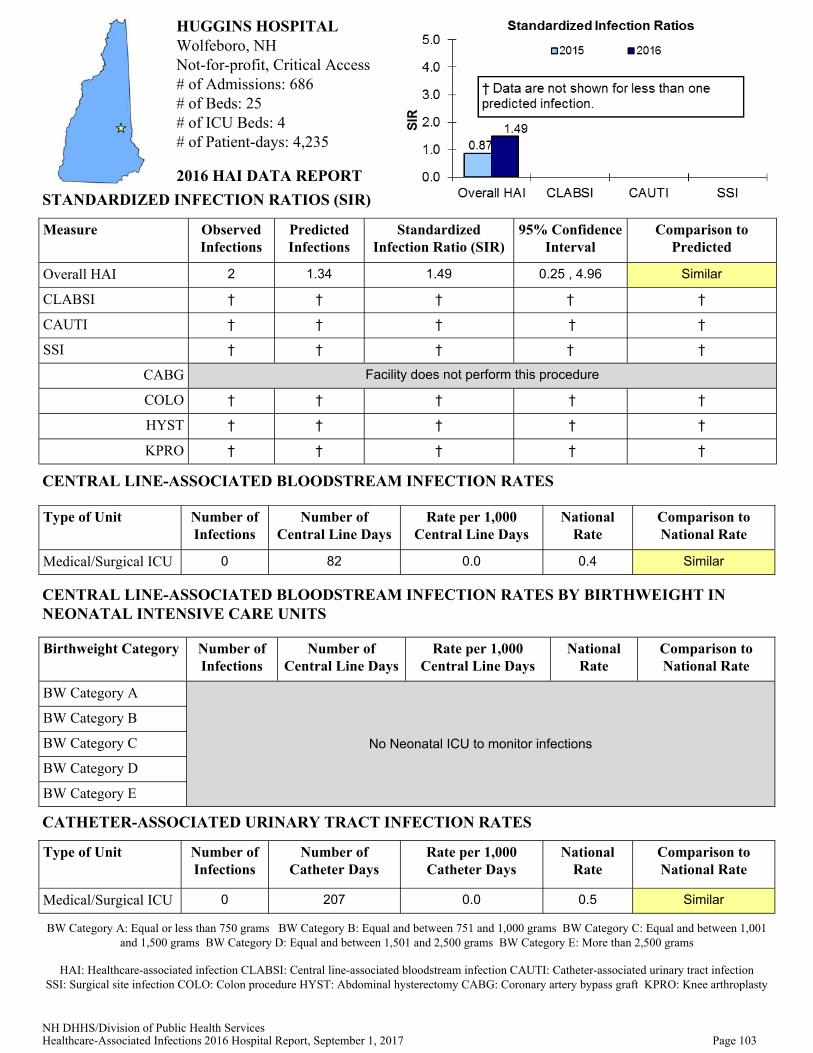
NH DHHS/Division of Public Health Services Healthcare-Associated Infections 2016 Hospital Report, September 1, 2017 Page 103
HUGGINS HOSPITAL Wolfeboro, NH Not-for-profit, Critical Access # of Admissions: 686 # of Beds: 25 # of ICU Beds: 4 # of Patient-days: 4,235
Measure Observed Infections
Predicted Infections
Standardized Infection Ratio (SIR)
95% Confidence Interval
Comparison to Predicted
Overall HAI 2 1.34 1.49 0.25 , 4.96 Similar
CLABSI † † † † †
CAUTI † † † † †
SSI † † † † †
CABG
COLO † † † † †
HYST † † † † †
KPRO † † † † †
Facility does not perform this procedure
STANDARDIZED INFECTION RATIOS (SIR)
Type of Unit Number of Infections
Number of Central Line Days
Rate per 1,000 Central Line Days
Comparison to National Rate
Medical/Surgical ICU 0 82 0.0 Similar
National Rate
0.4
CENTRAL LINE-ASSOCIATED BLOODSTREAM INFECTION RATES
HAI: Healthcare-associated infection CLABSI: Central line-associated bloodstream infection CAUTI: Catheter-associated urinary tract infection SSI: Surgical site infection COLO: Colon procedure HYST: Abdominal hysterectomy CABG: Coronary artery bypass graft KPRO: Knee arthroplasty
2016 HAI DATA REPORT
Type of Unit Number of Infections
Number of Catheter Days
Rate per 1,000 Catheter Days
Comparison to National Rate
Medical/Surgical ICU 0 207 0.0 Similar
National Rate
0.5
CATHETER-ASSOCIATED URINARY TRACT INFECTION RATES
CENTRAL LINE-ASSOCIATED BLOODSTREAM INFECTION RATES BY BIRTHWEIGHT IN NEONATAL INTENSIVE CARE UNITS
BW Category A: Equal or less than 750 grams BW Category B: Equal and between 751 and 1,000 grams BW Category C: Equal and between 1,001 and 1,500 grams BW Category D: Equal and between 1,501 and 2,500 grams BW Category E: More than 2,500 grams
Birthweight Category Number of Infections
Number of Central Line Days
Rate per 1,000 Central Line Days
National Rate
Comparison to National Rate
BW Category A
BW Category B
BW Category C
BW Category D
BW Category E
No Neonatal ICU to monitor infections

NH DHHS/Division of Public Health Services Healthcare-Associated Infections 2016 Hospital Report, September 1, 2017 Page 104
Measure Percent Adherence
State Coverage
Comparison to State Coverage
CLIP † 98.4 †
SCIP-1
SCIP-2
SCIP-3
Measure Percent Vaccinated
State Coverage
Comparison to State Coverage
HCP Influenza Vaccination 92.4 94.2 Similar
Note: SCIP data were not available at time of publication and as a result are excluded from this report.
PROCESS MEASURES
HUGGINS HOSPITAL 2016 DATA REPORT
SCIP-1
98.5 98.598.9 98.6100.0 96.4
70
80
90
100
2012 2013
% A
dh
eren
ce
National State Hospital
SCIP: Surgical care improvement project CLIP: Central line insertion practices
The 2016 central line-associated blood stream infections (CLABSI), surgical site infections (SSI) and catheter-associated urinary tract infections (CAUTI) data presented in this report have not been validated and must be interpreted with the understanding that in general there are both under- and over-reporting of infections.
In New Hampshire in 2016, CLABSI were monitored in all intensive care units (including pediatric and neonatal units) and not in other inpatient locations. CAUTI were monitored in all intensive care units (including pediatric units and excluding neonatal ICU) and not in other inpatient locations.
Hospitals do not use a standard method of post-discharge surveillance to identify infections once a patient has been discharged. This poses a challenge for data interpretation, because a higher SSI rate (for example) at a given hospital may represent either poor infection prevention practices or, conversely, a better system for identifying infections.
SSI reporting requires not only reporting of infections but also detailed information on every patient who underwent the procedure being monitored. As such, DHHS has elected to monitor a subset of procedures based on national recommendations since it would not be feasible for hospitals to report information on every patient receiving a surgical procedure due to the burden of reporting.
As of July 1, 2015, SCIP 2014– 2016 data reported to CMS was unavailable and the HAI Program was unable to con-duct further analysis of this measure as routinely included in this report.
Policy Exemptions Allowed in Policy
Requirements for Unvaccinated HCP With Accepted Exemption
Consequences for Unvaccinated HCP Without Accepted Exemption
YES Medical, Religious,
Personal/philosophical Wear a mask Wear a mask, Receive verbal and/or
written education
DATA NOTES:
2014-2016 SCIP data are not available.
INFLUENZA VACCINATION POLICIES, 2016-2017 INFLUENZA SEASON

NH DHHS/Division of Public Health Services Healthcare-Associated Infections 2016 Hospital Report, September 1, 2017 Page 105
LAKES REGION GENERAL Laconia, NH Not-for-profit, Acute Care # of Admissions: 4,845 # of Beds: 88 # of ICU Beds: 10 # of Patient-days: 18,793
Measure Observed Infections
Predicted Infections
Standardized Infection Ratio (SIR)
95% Confidence Interval
Comparison to Predicted
Overall HAI 4 8.53 0.47 0.15 , 1.13 Similar
CLABSI † † † † †
CAUTI 0 1.50 0.00 - , 2.00 Similar
SSI 4 6.63 0.60 0.19 , 1.46 Similar
CABG
COLO 2 3.32 0.60 0.10 , 1.99 Similar
HYST † † † † †
KPRO 2 2.49 0.80 0.14 , 2.65 Similar
Facility does not perform this procedure
STANDARDIZED INFECTION RATIOS (SIR)
Type of Unit Number of Infections
Number of Central Line Days
Rate per 1,000 Central Line Days
Comparison to National Rate
Medical/Surgical ICU 0 264 0.0 Similar
National Rate
0.7
CENTRAL LINE-ASSOCIATED BLOODSTREAM INFECTION RATES
HAI: Healthcare-associated infection CLABSI: Central line-associated bloodstream infection CAUTI: Catheter-associated urinary tract infection SSI: Surgical site infection COLO: Colon procedure HYST: Abdominal hysterectomy CABG: Coronary artery bypass graft KPRO: Knee arthroplasty
2016 HAI DATA REPORT
Type of Unit Number of Infections
Number of Catheter Days
Rate per 1,000 Catheter Days
Comparison to National Rate
Medical/Surgical ICU 0 1,153 0.0 Similar
National Rate
1.3
CATHETER-ASSOCIATED URINARY TRACT INFECTION RATES
CENTRAL LINE-ASSOCIATED BLOODSTREAM INFECTION RATES BY BIRTHWEIGHT IN NEONATAL INTENSIVE CARE UNITS
BW Category A: Equal or less than 750 grams BW Category B: Equal and between 751 and 1,000 grams BW Category C: Equal and between 1,001 and 1,500 grams BW Category D: Equal and between 1,501 and 2,500 grams BW Category E: More than 2,500 grams
Birthweight Category Number of Infections
Number of Central Line Days
Rate per 1,000 Central Line Days
National Rate
Comparison to National Rate
BW Category A
BW Category B
BW Category C
BW Category D
BW Category E
No Neonatal ICU to monitor infections
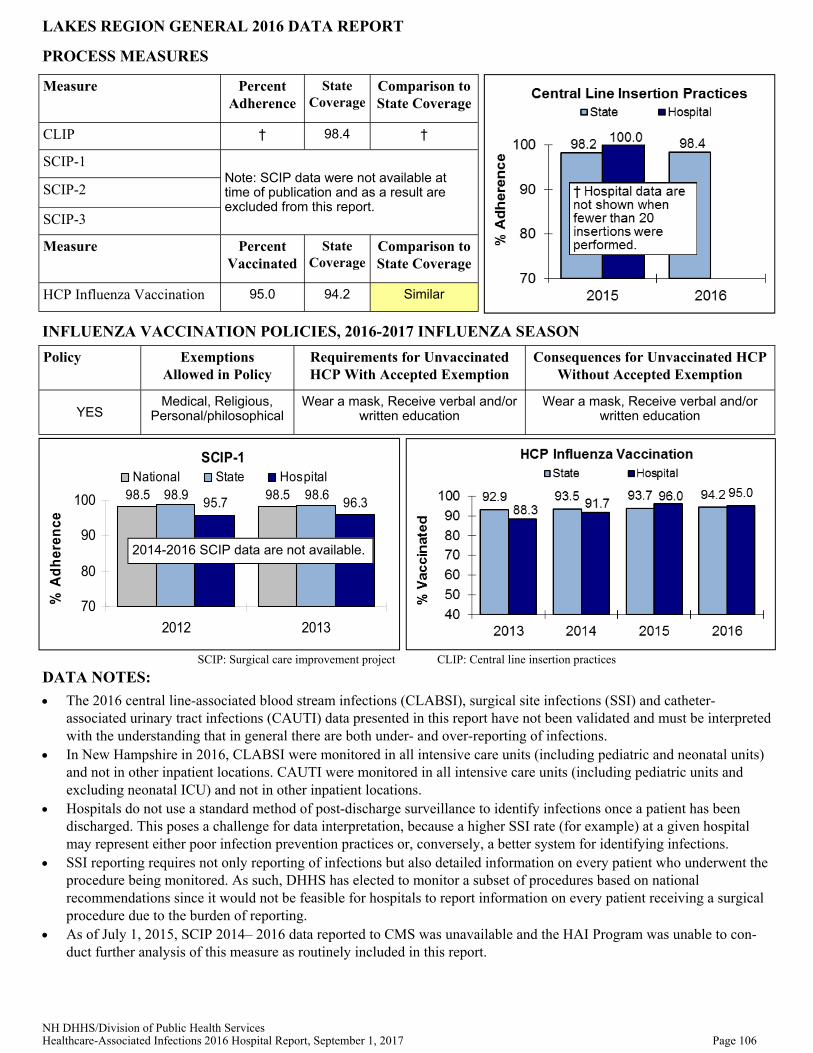
NH DHHS/Division of Public Health Services Healthcare-Associated Infections 2016 Hospital Report, September 1, 2017 Page 106
Measure Percent Adherence
State Coverage
Comparison to State Coverage
CLIP † 98.4 †
SCIP-1
SCIP-2
SCIP-3
Measure Percent Vaccinated
State Coverage
Comparison to State Coverage
HCP Influenza Vaccination 95.0 94.2 Similar
Note: SCIP data were not available at time of publication and as a result are excluded from this report.
PROCESS MEASURES
LAKES REGION GENERAL 2016 DATA REPORT
SCIP-1
98.5 98.598.9 98.695.7 96.3
70
80
90
100
2012 2013
% A
dh
eren
ce
National State Hospital
SCIP: Surgical care improvement project CLIP: Central line insertion practices
The 2016 central line-associated blood stream infections (CLABSI), surgical site infections (SSI) and catheter-associated urinary tract infections (CAUTI) data presented in this report have not been validated and must be interpreted with the understanding that in general there are both under- and over-reporting of infections.
In New Hampshire in 2016, CLABSI were monitored in all intensive care units (including pediatric and neonatal units) and not in other inpatient locations. CAUTI were monitored in all intensive care units (including pediatric units and excluding neonatal ICU) and not in other inpatient locations.
Hospitals do not use a standard method of post-discharge surveillance to identify infections once a patient has been discharged. This poses a challenge for data interpretation, because a higher SSI rate (for example) at a given hospital may represent either poor infection prevention practices or, conversely, a better system for identifying infections.
SSI reporting requires not only reporting of infections but also detailed information on every patient who underwent the procedure being monitored. As such, DHHS has elected to monitor a subset of procedures based on national recommendations since it would not be feasible for hospitals to report information on every patient receiving a surgical procedure due to the burden of reporting.
As of July 1, 2015, SCIP 2014– 2016 data reported to CMS was unavailable and the HAI Program was unable to con-duct further analysis of this measure as routinely included in this report.
Policy Exemptions Allowed in Policy
Requirements for Unvaccinated HCP With Accepted Exemption
Consequences for Unvaccinated HCP Without Accepted Exemption
YES Medical, Religious,
Personal/philosophical Wear a mask, Receive verbal and/or
written education Wear a mask, Receive verbal and/or
written education
DATA NOTES:
2014-2016 SCIP data are not available.
INFLUENZA VACCINATION POLICIES, 2016-2017 INFLUENZA SEASON

NH DHHS/Division of Public Health Services Healthcare-Associated Infections 2016 Hospital Report, September 1, 2017 Page 107
LITTLETON REGIONAL Littleton, NH Not-for-profit, Critical Access # of Admissions: 1,866 # of Beds: 29 # of ICU Beds: 4 # of Patient-days: 5,223
Measure Observed Infections
Predicted Infections
Standardized Infection Ratio (SIR)
95% Confidence Interval
Comparison to Predicted
Overall HAI 2 2.96 0.67 0.11 , 2.23 Similar
CLABSI † † † † †
CAUTI † † † † †
SSI 2 2.42 0.83 0.14 , 2.73 Similar
CABG
COLO † † † † †
HYST † † † † †
KPRO 1 1.32 0.76 0.04 , 3.73 Similar
Facility does not perform this procedure
STANDARDIZED INFECTION RATIOS (SIR)
Type of Unit Number of Infections
Number of Central Line Days
Rate per 1,000 Central Line Days
Comparison to National Rate
Medical/Surgical ICU 0 149 0.0 Similar
National Rate
0.4
CENTRAL LINE-ASSOCIATED BLOODSTREAM INFECTION RATES
HAI: Healthcare-associated infection CLABSI: Central line-associated bloodstream infection CAUTI: Catheter-associated urinary tract infection SSI: Surgical site infection COLO: Colon procedure HYST: Abdominal hysterectomy CABG: Coronary artery bypass graft KPRO: Knee arthroplasty
2016 HAI DATA REPORT
Type of Unit Number of Infections
Number of Catheter Days
Rate per 1,000 Catheter Days
Comparison to National Rate
Medical/Surgical ICU 0 249 0.0 Similar
National Rate
0.5
CATHETER-ASSOCIATED URINARY TRACT INFECTION RATES
CENTRAL LINE-ASSOCIATED BLOODSTREAM INFECTION RATES BY BIRTHWEIGHT IN NEONATAL INTENSIVE CARE UNITS
BW Category A: Equal or less than 750 grams BW Category B: Equal and between 751 and 1,000 grams BW Category C: Equal and between 1,001 and 1,500 grams BW Category D: Equal and between 1,501 and 2,500 grams BW Category E: More than 2,500 grams
Birthweight Category Number of Infections
Number of Central Line Days
Rate per 1,000 Central Line Days
National Rate
Comparison to National Rate
BW Category A
BW Category B
BW Category C
BW Category D
BW Category E
No Neonatal ICU to monitor infections

NH DHHS/Division of Public Health Services Healthcare-Associated Infections 2016 Hospital Report, September 1, 2017 Page 108
Measure Percent Adherence
State Coverage
Comparison to State Coverage
CLIP 100.0 98.4 Similar
SCIP-1
SCIP-2
SCIP-3
Measure Percent Vaccinated
State Coverage
Comparison to State Coverage
HCP Influenza Vaccination 96.1 94.2 Higher
Note: SCIP data were not available at time of publication and as a result are excluded from this report.
PROCESS MEASURES
LITTLETON REGIONAL 2016 DATA REPORT
SCIP-1
98.5 98.598.9 98.699.4 97.5
70
80
90
100
2012 2013
% A
dh
eren
ce
National State Hospital
SCIP: Surgical care improvement project CLIP: Central line insertion practices
The 2016 central line-associated blood stream infections (CLABSI), surgical site infections (SSI) and catheter-associated urinary tract infections (CAUTI) data presented in this report have not been validated and must be interpreted with the understanding that in general there are both under- and over-reporting of infections.
In New Hampshire in 2016, CLABSI were monitored in all intensive care units (including pediatric and neonatal units) and not in other inpatient locations. CAUTI were monitored in all intensive care units (including pediatric units and excluding neonatal ICU) and not in other inpatient locations.
Hospitals do not use a standard method of post-discharge surveillance to identify infections once a patient has been discharged. This poses a challenge for data interpretation, because a higher SSI rate (for example) at a given hospital may represent either poor infection prevention practices or, conversely, a better system for identifying infections.
SSI reporting requires not only reporting of infections but also detailed information on every patient who underwent the procedure being monitored. As such, DHHS has elected to monitor a subset of procedures based on national recommendations since it would not be feasible for hospitals to report information on every patient receiving a surgical procedure due to the burden of reporting.
As of July 1, 2015, SCIP 2014– 2016 data reported to CMS was unavailable and the HAI Program was unable to con-duct further analysis of this measure as routinely included in this report.
Policy Exemptions Allowed in Policy
Requirements for Unvaccinated HCP With Accepted Exemption
Consequences for Unvaccinated HCP Without Accepted Exemption
YES Medical, Religious Wear a mask Wear a mask, Progressive discipline,
potentially including termination, Receive verbal and/or written education
DATA NOTES:
2014-2016 SCIP data are not available.
INFLUENZA VACCINATION POLICIES, 2016-2017 INFLUENZA SEASON
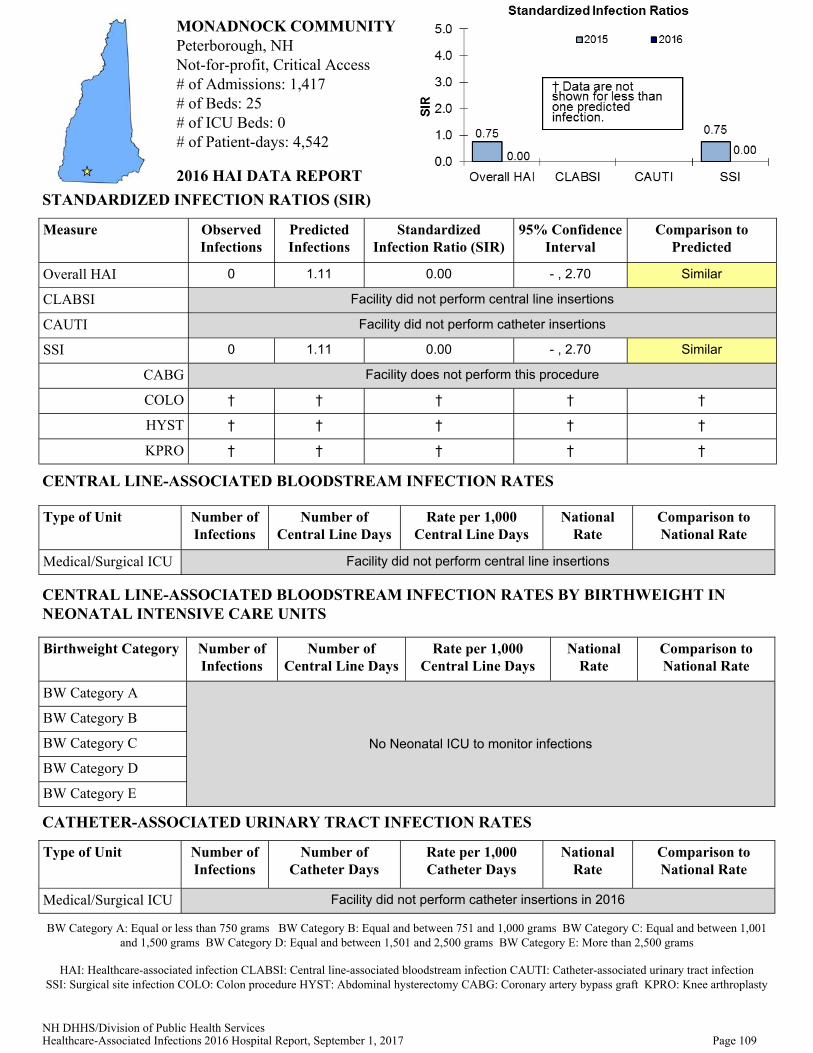
NH DHHS/Division of Public Health Services Healthcare-Associated Infections 2016 Hospital Report, September 1, 2017 Page 109
MONADNOCK COMMUNITY Peterborough, NH Not-for-profit, Critical Access # of Admissions: 1,417 # of Beds: 25 # of ICU Beds: 0 # of Patient-days: 4,542
Measure Observed Infections
Predicted Infections
Standardized Infection Ratio (SIR)
95% Confidence Interval
Comparison to Predicted
Overall HAI 0 1.11 0.00 - , 2.70 Similar
CLABSI Facility did not perform central line insertions
CAUTI
SSI 0 1.11 0.00 - , 2.70 Similar
CABG Facility does not perform this procedure
COLO † † † † †
HYST † † † † †
KPRO † † † † †
Facility did not perform catheter insertions
STANDARDIZED INFECTION RATIOS (SIR)
Type of Unit Number of Infections
Number of Central Line Days
Rate per 1,000 Central Line Days
National Rate
Comparison to National Rate
Medical/Surgical ICU Facility did not perform central line insertions
CENTRAL LINE-ASSOCIATED BLOODSTREAM INFECTION RATES
HAI: Healthcare-associated infection CLABSI: Central line-associated bloodstream infection CAUTI: Catheter-associated urinary tract infection SSI: Surgical site infection COLO: Colon procedure HYST: Abdominal hysterectomy CABG: Coronary artery bypass graft KPRO: Knee arthroplasty
2016 HAI DATA REPORT
Type of Unit Number of Infections
Number of Catheter Days
Rate per 1,000 Catheter Days
National Rate
Comparison to National Rate
Medical/Surgical ICU Facility did not perform catheter insertions in 2016
CATHETER-ASSOCIATED URINARY TRACT INFECTION RATES
CENTRAL LINE-ASSOCIATED BLOODSTREAM INFECTION RATES BY BIRTHWEIGHT IN NEONATAL INTENSIVE CARE UNITS
BW Category A: Equal or less than 750 grams BW Category B: Equal and between 751 and 1,000 grams BW Category C: Equal and between 1,001 and 1,500 grams BW Category D: Equal and between 1,501 and 2,500 grams BW Category E: More than 2,500 grams
Birthweight Category Number of Infections
Number of Central Line Days
Rate per 1,000 Central Line Days
National Rate
Comparison to National Rate
BW Category A
BW Category B
BW Category C
BW Category D
BW Category E
No Neonatal ICU to monitor infections

NH DHHS/Division of Public Health Services Healthcare-Associated Infections 2016 Hospital Report, September 1, 2017 Page 110
Measure Percent Adherence
State Coverage
Comparison to State Coverage
CLIP 98.4
SCIP-1
SCIP-2
SCIP-3
Measure Percent Vaccinated
State Coverage
Comparison to State Coverage
HCP Influenza Vaccination 93.8 94.2 Similar
Note: SCIP data were not available at time of publication and as a result are excluded from this report.
PROCESS MEASURES
MONADNOCK COMMUNITY 2016 DATA REPORT
SCIP-1
98.5 98.598.9 98.6100.0 100.0
70
80
90
100
2012 2013
% A
dh
eren
ce
National State Hospital
SCIP: Surgical care improvement project CLIP: Central line insertion practices
The 2016 central line-associated blood stream infections (CLABSI), surgical site infections (SSI) and catheter-associated urinary tract infections (CAUTI) data presented in this report have not been validated and must be interpreted with the understanding that in general there are both under- and over-reporting of infections.
In New Hampshire in 2016, CLABSI were monitored in all intensive care units (including pediatric and neonatal units) and not in other inpatient locations. CAUTI were monitored in all intensive care units (including pediatric units and excluding neonatal ICU) and not in other inpatient locations.
Hospitals do not use a standard method of post-discharge surveillance to identify infections once a patient has been discharged. This poses a challenge for data interpretation, because a higher SSI rate (for example) at a given hospital may represent either poor infection prevention practices or, conversely, a better system for identifying infections.
SSI reporting requires not only reporting of infections but also detailed information on every patient who underwent the procedure being monitored. As such, DHHS has elected to monitor a subset of procedures based on national recommendations since it would not be feasible for hospitals to report information on every patient receiving a surgical procedure due to the burden of reporting.
As of July 1, 2015, SCIP 2014– 2017 data reported to CMS was unavailable and the HAI Program was unable to con-duct further analysis of this measure as routinely included in this report.
Policy Exemptions Allowed in Policy
Requirements for Unvaccinated HCP With Accepted Exemption
Consequences for Unvaccinated HCP Without Accepted Exemption
YES Medical, Religious Wear a mask Wear a mask, Progressive discipline,
potentially including termination, Receive verbal and/or written education
DATA NOTES:
2014-2016 SCIP data are not available.
INFLUENZA VACCINATION POLICIES, 2016-2017 INFLUENZA SEASON

NH DHHS/Division of Public Health Services Healthcare-Associated Infections 2016 Hospital Report, September 1, 2017 Page 111
NEW LONDON HOSPITAL New London, NH Not For-profit, Critical Access # of Admissions: 1,406 # of Beds: 25 # of ICU Beds: 0 # of Patient-days: 5,870
Measure Observed Infections
Predicted Infections
Standardized Infection Ratio (SIR)
95% Confidence Interval
Comparison to Predicted
Overall HAI 1 1.24 0.81 - , 2.42 Similar
CLABSI No ICU to monitor infections
CAUTI
SSI 1 1.24 0.81 0.04 , 3.98 Similar
CABG Facility does not perform this procedure
COLO † † † † †
HYST † † † † †
KPRO † † † † †
No ICU to monitor infections
STANDARDIZED INFECTION RATIOS (SIR)
Type of Unit Number of Infections
Number of Central Line Days
Rate per 1,000 Central Line Days
National Rate
Comparison to National Rate
No ICU No ICU to monitor infections
CENTRAL LINE-ASSOCIATED BLOODSTREAM INFECTION RATES
HAI: Healthcare-associated infection CLABSI: Central line-associated bloodstream infection CAUTI: Catheter-associated urinary tract infection SSI: Surgical site infection COLO: Colon procedure HYST: Abdominal hysterectomy CABG: Coronary artery bypass graft KPRO: Knee arthroplasty
2016 HAI DATA REPORT
Type of Unit Number of Infections
Number of Catheter Days
Rate per 1,000 Catheter Days
National Rate
Comparison to National Rate
No ICU No ICU to monitor infections
CATHETER-ASSOCIATED URINARY TRACT INFECTION RATES
CENTRAL LINE-ASSOCIATED BLOODSTREAM INFECTION RATES BY BIRTHWEIGHT IN NEONATAL INTENSIVE CARE UNITS
BW Category A: Equal or less than 750 grams BW Category B: Equal and between 751 and 1,000 grams BW Category C: Equal and between 1,001 and 1,500 grams BW Category D: Equal and between 1,501 and 2,500 grams BW Category E: More than 2,500 grams
Birthweight Category Number of Infections
Number of Central Line Days
Rate per 1,000 Central Line Days
National Rate
Comparison to National Rate
BW Category A
BW Category B
BW Category C
BW Category D
BW Category E
No Neonatal ICU to monitor infections

NH DHHS/Division of Public Health Services Healthcare-Associated Infections 2016 Hospital Report, September 1, 2017 Page 112
Measure Percent Adherence
State Coverage
Comparison to State Coverage
CLIP 98.4
SCIP-1
SCIP-2
SCIP-3
Measure Percent Vaccinated
State Coverage
Comparison to State Coverage
HCP Influenza Vaccination 98.3 94.2 Higher
Note: SCIP data were not available at time of publication and as a result are excluded from this report.
PROCESS MEASURES
NEW LONDON HOSPITAL 2016 DATA REPORT
SCIP-1
98.5 98.598.9 98.6100.0 96.6
70
80
90
100
2012 2013
% A
dh
eren
ce
National State Hospital
SCIP: Surgical care improvement project CLIP: Central line insertion practices
The 2016 central line-associated blood stream infections (CLABSI), surgical site infections (SSI) and catheter-associated urinary tract infections (CAUTI) data presented in this report have not been validated and must be interpreted with the understanding that in general there are both under- and over-reporting of infections.
In New Hampshire in 2016, CLABSI were monitored in all intensive care units (including pediatric and neonatal units) and not in other inpatient locations. CAUTI were monitored in all intensive care units (including pediatric units and excluding neonatal ICU) and not in other inpatient locations.
Hospitals do not use a standard method of post-discharge surveillance to identify infections once a patient has been discharged. This poses a challenge for data interpretation, because a higher SSI rate (for example) at a given hospital may represent either poor infection prevention practices or, conversely, a better system for identifying infections.
SSI reporting requires not only reporting of infections but also detailed information on every patient who underwent the procedure being monitored. As such, DHHS has elected to monitor a subset of procedures based on national recommendations since it would not be feasible for hospitals to report information on every patient receiving a surgical procedure due to the burden of reporting.
As of July 1, 2015, SCIP 2014– 2016 data reported to CMS was unavailable and the HAI Program was unable to con-duct further analysis of this measure as routinely included in this report.
Policy Exemptions Allowed in Policy
Requirements for Unvaccinated HCP With Accepted Exemption
Consequences for Unvaccinated HCP Without Accepted Exemption
YES Medical, Religious Wear a mask Progressive discipline, potentially
including termination
DATA NOTES:
2014-2016 SCIP data are not available.
INFLUENZA VACCINATION POLICIES, 2016-2017 INFLUENZA SEASON

NH DHHS/Division of Public Health Services Healthcare-Associated Infections 2016 Hospital Report, September 1, 2017 Page 113
PARKLAND MEDICAL CENTER Derry, NH For-profit, Acute Care # of Admissions: 3,780 # of Beds: 86 # of ICU Beds: 8 # of Patient-days: 14,052
Measure Observed Infections
Predicted Infections
Standardized Infection Ratio (SIR)
95% Confidence Interval
Comparison to Predicted
Overall HAI 4 6.92 0.58 0.18 , 1.39 Similar
CLABSI 0 1.79 0.00 - , 1.68 Similar
CAUTI 0 1.82 0.00 - , 1.65 Similar
SSI 4 3.32 1.21 0.38 , 2.91 Similar
CABG
COLO 4 2.25 1.78 0.57 , 4.29 Similar
HYST † † † † †
KPRO † † † † †
Facility does not perform this procedure
STANDARDIZED INFECTION RATIOS (SIR)
Type of Unit Number of Infections
Number of Central Line Days
Rate per 1,000 Central Line Days
National Rate
Comparison to National Rate
Medical ICU 0 941 0.0 0.9 Similar
CENTRAL LINE-ASSOCIATED BLOODSTREAM INFECTION RATES
HAI: Healthcare-associated infection CLABSI: Central line-associated bloodstream infection CAUTI: Catheter-associated urinary tract infection SSI: Surgical site infection COLO: Colon procedure HYST: Abdominal hysterectomy CABG: Coronary artery bypass graft KPRO: Knee arthroplasty
2016 HAI DATA REPORT
Type of Unit Number of Infections
Number of Catheter Days
Rate per 1,000 Catheter Days
National Rate
Comparison to National Rate
Medical ICU 0 908 0.0 2.0 Similar
CATHETER-ASSOCIATED URINARY TRACT INFECTION RATES
CENTRAL LINE-ASSOCIATED BLOODSTREAM INFECTION RATES BY BIRTHWEIGHT IN NEONATAL INTENSIVE CARE UNITS
BW Category A: Equal or less than 750 grams BW Category B: Equal and between 751 and 1,000 grams BW Category C: Equal and between 1,001 and 1,500 grams BW Category D: Equal and between 1,501 and 2,500 grams BW Category E: More than 2,500 grams
Birthweight Category Number of Infections
Number of Central Line Days
Rate per 1,000 Central Line Days
National Rate
Comparison to National Rate
BW Category A
BW Category B
BW Category C
BW Category D
BW Category E
No Neonatal ICU to monitor infections

NH DHHS/Division of Public Health Services Healthcare-Associated Infections 2016 Hospital Report, September 1, 2017 Page 114
Measure Percent Adherence
State Coverage
Comparison to State Coverage
CLIP 93.8 98.4 Lower
SCIP-1
SCIP-2
SCIP-3
Measure Percent Vaccinated
State Coverage
Comparison to State Coverage
HCP Influenza Vaccination 62.4 94.2 Lower
Note: SCIP data were not available at time of publication and as a result are excluded from this report.
PROCESS MEASURES
PARKLAND MEDICAL CENTER 2016 DATA REPORT
SCIP-1
98.5 98.598.9 98.699.796.7
70
80
90
100
2012 2013
% A
dh
eren
ce
National State Hospital
SCIP: Surgical care improvement project CLIP: Central line insertion practices
The 2016 central line-associated blood stream infections (CLABSI), surgical site infections (SSI) and catheter-associated urinary tract infections (CAUTI) data presented in this report have not been validated and must be interpreted with the understanding that in general there are both under- and over-reporting of infections.
In New Hampshire in 2016, CLABSI were monitored in all intensive care units (including pediatric and neonatal units) and not in other inpatient locations. CAUTI were monitored in all intensive care units (including pediatric units and excluding neonatal ICU) and not in other inpatient locations.
Hospitals do not use a standard method of post-discharge surveillance to identify infections once a patient has been discharged. This poses a challenge for data interpretation, because a higher SSI rate (for example) at a given hospital may represent either poor infection prevention practices or, conversely, a better system for identifying infections.
SSI reporting requires not only reporting of infections but also detailed information on every patient who underwent the procedure being monitored. As such, DHHS has elected to monitor a subset of procedures based on national recommendations since it would not be feasible for hospitals to report information on every patient receiving a surgical procedure due to the burden of reporting.
As of July 1, 2015, SCIP 2014– 2016 data reported to CMS was unavailable and the HAI Program was unable to con-duct further analysis of this measure as routinely included in this report.
Policy Exemptions Allowed in Policy
Requirements for Unvaccinated HCP With Accepted Exemption
Consequences for Unvaccinated HCP Without Accepted Exemption
YES Medical Wear a mask Wear a mask, Receive verbal and/or
written education
DATA NOTES:
2014-2016 SCIP data are not available.
INFLUENZA VACCINATION POLICIES, 2016-2017 INFLUENZA SEASON

NH DHHS/Division of Public Health Services Healthcare-Associated Infections 2016 Hospital Report, September 1, 2017 Page 115
PORTSMOUTH REGIONAL Portsmouth, NH For-profit, Acute Care # of Admissions: 8,960 # of Beds: 240 # of ICU Beds: 14 # of Patient-days: 42,707
Measure Observed Infections
Predicted Infections
Standardized Infection Ratio (SIR)
Comparison to Predicted
CLABSI 1 4.34 0.23 Similar
SSI 7 12.66 0.55 Similar
CABG 5 7.76 0.64 Similar
COLO 1 3.08 0.33 Similar
KPRO 3 4.19 0.72 Similar
Overall HAI 12 21.45 0.56 Lower
95% Confidence Interval
0.30 , 0.95
0.01 , 1.14
0.24 , 1.09
0.24 , 1.43
0.02 , 1.60
0.18 , 1.95
CAUTI 4 4.46 0.90 0.29 , 2.16 Similar
HYST † † † † †
STANDARDIZED INFECTION RATIOS (SIR)
CENTRAL LINE-ASSOCIATED BLOODSTREAM INFECTION RATES
HAI: Healthcare-associated infection CLABSI: Central line-associated bloodstream infection CAUTI: Catheter-associated urinary tract infection SSI: Surgical site infection COLO: Colon procedure HYST: Abdominal hysterectomy CABG: Coronary artery bypass graft KPRO: Knee arthroplasty
2016 HAI DATA REPORT
CATHETER-ASSOCIATED URINARY TRACT INFECTION RATES
CENTRAL LINE-ASSOCIATED BLOODSTREAM INFECTION RATES BY BIRTHWEIGHT IN NEONATAL INTENSIVE CARE UNITS
BW Category A: Equal or less than 750 grams BW Category B: Equal and between 751 and 1,000 grams BW Category C: Equal and between 1,001 and 1,500 grams BW Category D: Equal and between 1,501 and 2,500 grams BW Category E: More than 2,500 grams
Type of Unit Number of Infections
Number of Central Line Days
Rate per 1,000 Central Line Days
National Rate
Comparison to National Rate
Medical/Surgical ICU 1 2,892 0.3 0.7 Similar
Type of Unit Number of Infections
Number of Catheter Days
Rate per 1,000 Catheter Days
National Rate
Comparison to National Rate
Medical/Surgical ICU 4 3,429 1.2 1.3 Similar
Birthweight Category Number of Infections
Number of Central Line Days
Rate per 1,000 Central Line Days
National Rate
Comparison to National Rate
BW Category A
BW Category B
BW Category C
BW Category D
BW Category E
No Neonatal ICU to monitor infections
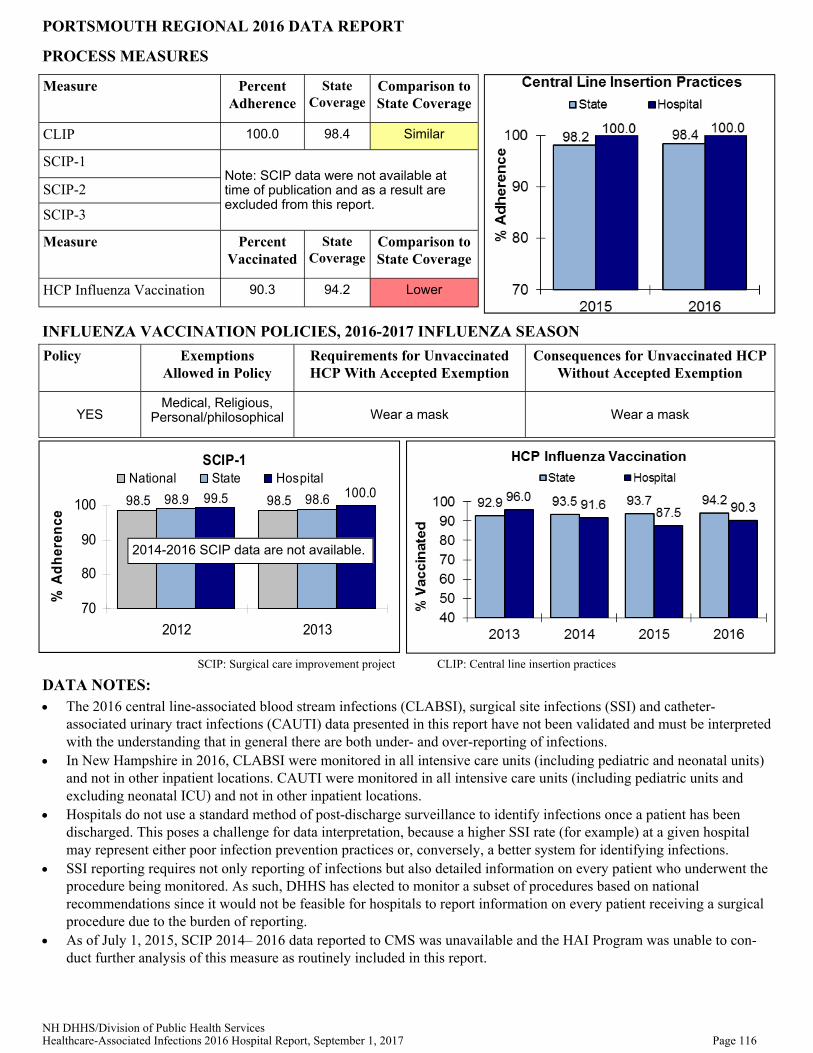
NH DHHS/Division of Public Health Services Healthcare-Associated Infections 2016 Hospital Report, September 1, 2017 Page 116
Measure Percent Adherence
State Coverage
Comparison to State Coverage
CLIP 100.0 98.4 Similar
SCIP-1
SCIP-2
SCIP-3
Measure Percent Vaccinated
State Coverage
Comparison to State Coverage
HCP Influenza Vaccination 90.3 94.2 Lower
Note: SCIP data were not available at time of publication and as a result are excluded from this report.
PROCESS MEASURES
PORTSMOUTH REGIONAL 2016 DATA REPORT
SCIP-1
98.5 98.598.9 98.699.5 100.0
70
80
90
100
2012 2013
% A
dh
eren
ce
National State Hospital
SCIP: Surgical care improvement project CLIP: Central line insertion practices
The 2016 central line-associated blood stream infections (CLABSI), surgical site infections (SSI) and catheter-associated urinary tract infections (CAUTI) data presented in this report have not been validated and must be interpreted with the understanding that in general there are both under- and over-reporting of infections.
In New Hampshire in 2016, CLABSI were monitored in all intensive care units (including pediatric and neonatal units) and not in other inpatient locations. CAUTI were monitored in all intensive care units (including pediatric units and excluding neonatal ICU) and not in other inpatient locations.
Hospitals do not use a standard method of post-discharge surveillance to identify infections once a patient has been discharged. This poses a challenge for data interpretation, because a higher SSI rate (for example) at a given hospital may represent either poor infection prevention practices or, conversely, a better system for identifying infections.
SSI reporting requires not only reporting of infections but also detailed information on every patient who underwent the procedure being monitored. As such, DHHS has elected to monitor a subset of procedures based on national recommendations since it would not be feasible for hospitals to report information on every patient receiving a surgical procedure due to the burden of reporting.
As of July 1, 2015, SCIP 2014– 2016 data reported to CMS was unavailable and the HAI Program was unable to con-duct further analysis of this measure as routinely included in this report.
Policy Exemptions Allowed in Policy
Requirements for Unvaccinated HCP With Accepted Exemption
Consequences for Unvaccinated HCP Without Accepted Exemption
YES Medical, Religious,
Personal/philosophical Wear a mask Wear a mask
DATA NOTES:
2014-2016 SCIP data are not available.
INFLUENZA VACCINATION POLICIES, 2016-2017 INFLUENZA SEASON

NH DHHS/Division of Public Health Services Healthcare-Associated Infections 2016 Hospital Report, September 1, 2017 Page 117
SOUTHERN NH MEDICAL Nashua, NH Not-for-profit, Acute Care # of Admissions: 9,884 # of Beds: 153 # of ICU Beds: 17 # of Patient-days: 33,301
Measure Observed Infections
Predicted Infections
Standardized Infection Ratio (SIR)
95% Confidence Interval
Comparison to Predicted
Overall HAI 8 11.24 0.71 0.33 , 1.35 Similar
CLABSI 0 1.20 0.00 - , 2.49 Similar
CAUTI 4 2.03 1.98 0.63 , 4.76 Similar
SSI 4 8.02 0.50 0.16 , 1.20 Similar
CABG
COLO 3 4.97 0.60 0.15 , 1.64 Similar
HYST 1 1.67 0.60 0.03 , 2.96 Similar
KPRO 0 1.38 0.00 - , 2.17 Similar
Facility does not perform this procedure
STANDARDIZED INFECTION RATIOS (SIR)
Type of Unit Number of Infections
Number of Central Line Days
Rate per 1,000 Central Line Days
Comparison to National Rate
Medical/Surgical ICU 0 770 0.0 Similar
National Rate
0.7
CENTRAL LINE-ASSOCIATED BLOODSTREAM INFECTION RATES
HAI: Healthcare-associated infection CLABSI: Central line-associated bloodstream infection CAUTI: Catheter-associated urinary tract infection SSI: Surgical site infection COLO: Colon procedure HYST: Abdominal hysterectomy CABG: Coronary artery bypass graft KPRO: Knee arthroplasty
2016 HAI DATA REPORT
Type of Unit Number of Infections
Number of Catheter Days
Rate per 1,000 Catheter Days
Comparison to National Rate
Medical/Surgical ICU 4 1,558 2.6 Similar
National Rate
1.3
CATHETER-ASSOCIATED URINARY TRACT INFECTION RATES
CENTRAL LINE-ASSOCIATED BLOODSTREAM INFECTION RATES BY BIRTHWEIGHT IN NEONATAL INTENSIVE CARE UNITS
Birthweight Category Number of Infections
Number of Central Line Days
Rate per 1,000 Central Line Days
National Rate
Comparison to National Rate
BW Category A † † † † †
BW Category B † † † † †
BW Category C † † † † †
BW Category D † † † † †
BW Category E † † † † †
BW Category A: Equal or less than 750 grams BW Category B: Equal and between 751 and 1,000 grams BW Category C: Equal and between 1,001 and 1,500 grams BW Category D: Equal and between 1,501 and 2,500 grams BW Category E: More than 2,500 grams

NH DHHS/Division of Public Health Services Healthcare-Associated Infections 2016 Hospital Report, September 1, 2017 Page 118
Measure Percent Adherence
State Coverage
Comparison to State Coverage
CLIP 99.3 98.4 Similar
SCIP-1
SCIP-2
SCIP-3
Measure Percent Vaccinated
State Coverage
Comparison to State Coverage
HCP Influenza Vaccination 97.5 94.2 Higher
Note: SCIP data were not available at time of publication and as a result are excluded from this report.
PROCESS MEASURES
SOUTHERN NH MEDICAL 2016 DATA REPORT
SCIP-1
98.5 98.598.9 98.699.3 99.7
70
80
90
100
2012 2013
% A
dh
eren
ce
National State Hospital
SCIP: Surgical care improvement project CLIP: Central line insertion practices
The 2016 central line-associated blood stream infections (CLABSI), surgical site infections (SSI) and catheter-associated urinary tract infections (CAUTI) data presented in this report have not been validated and must be interpreted with the understanding that in general there are both under- and over-reporting of infections.
In New Hampshire in 2016, CLABSI were monitored in all intensive care units (including pediatric and neonatal units) and not in other inpatient locations. CAUTI were monitored in all intensive care units (including pediatric units and excluding neonatal ICU) and not in other inpatient locations.
Hospitals do not use a standard method of post-discharge surveillance to identify infections once a patient has been discharged. This poses a challenge for data interpretation, because a higher SSI rate (for example) at a given hospital may represent either poor infection prevention practices or, conversely, a better system for identifying infections.
SSI reporting requires not only reporting of infections but also detailed information on every patient who underwent the procedure being monitored. As such, DHHS has elected to monitor a subset of procedures based on national recommendations since it would not be feasible for hospitals to report information on every patient receiving a surgical procedure due to the burden of reporting.
As of July 1, 2015, SCIP 2014– 2016 data reported to CMS was unavailable and the HAI Program was unable to con-duct further analysis of this measure as routinely included in this report.
Policy Exemptions Allowed in Policy
Requirements for Unvaccinated HCP With Accepted Exemption
Consequences for Unvaccinated HCP Without Accepted Exemption
YES Medical, Religious, Personal/philosophical No Requirements
Progressive discipline, potentially including termination
DATA NOTES:
2014-2016 SCIP data are not available.
INFLUENZA VACCINATION POLICIES, 2016-2017 INFLUENZA SEASON

NH DHHS/Division of Public Health Services Healthcare-Associated Infections 2016 Hospital Report, September 1, 2017 Page 119
SPEARE MEMORIAL HOSPITAL Plymouth, NH Not-for-profit, Critical Access # of Admissions: 1,634 # of Beds: 25 # of ICU Beds: 4 # of Patient-days: 5,167
Measure Observed Infections
Predicted Infections
Standardized Infection Ratio (SIR)
95% Confidence Interval
Comparison to Predicted
Overall HAI 1 1.00 1.00 0.05 , 4.93 Similar
CLABSI † † † † †
CAUTI † † † † †
SSI † † † † †
CABG
COLO † † † † †
HYST † † † † †
KPRO † † † † †
Facility does not perform this procedure
STANDARDIZED INFECTION RATIOS (SIR)
Type of Unit Number of Infections
Number of Central Line Days
Rate per 1,000 Central Line Days
Comparison to National Rate
Medical/Surgical ICU † † † †
National Rate
†
CENTRAL LINE-ASSOCIATED BLOODSTREAM INFECTION RATES
HAI: Healthcare-associated infection CLABSI: Central line-associated bloodstream infection CAUTI: Catheter-associated urinary tract infection SSI: Surgical site infection COLO: Colon procedure HYST: Abdominal hysterectomy CABG: Coronary artery bypass graft KPRO: Knee arthroplasty
2016 HAI DATA REPORT
Type of Unit Number of Infections
Number of Catheter Days
Rate per 1,000 Catheter Days
Comparison to National Rate
Medical/Surgical ICU 0 162 0.0 Similar
National Rate
0.5
CATHETER-ASSOCIATED URINARY TRACT INFECTION RATES
CENTRAL LINE-ASSOCIATED BLOODSTREAM INFECTION RATES BY BIRTHWEIGHT IN NEONATAL INTENSIVE CARE UNITS
BW Category A: Equal or less than 750 grams BW Category B: Equal and between 751 and 1,000 grams BW Category C: Equal and between 1,001 and 1,500 grams BW Category D: Equal and between 1,501 and 2,500 grams BW Category E: More than 2,500 grams
Birthweight Category Number of Infections
Number of Central Line Days
Rate per 1,000 Central Line Days
National Rate
Comparison to National Rate
BW Category A
BW Category B
BW Category C
BW Category D
BW Category E
No Neonatal ICU to monitor infections

NH DHHS/Division of Public Health Services Healthcare-Associated Infections 2016 Hospital Report, September 1, 2017 Page 120
Measure Percent Adherence
State Coverage
Comparison to State Coverage
CLIP † 98.4 †
SCIP-1
SCIP-2
SCIP-3
Measure Percent Vaccinated
State Coverage
Comparison to State Coverage
HCP Influenza Vaccination 91.0 94.2 Lower
Note: SCIP data were not available at time of publication and as a result are excluded from this report.
PROCESS MEASURES
SPEARE MEMORIAL HOSPITAL 2016 DATA REPORT
SCIP-1
98.5 98.598.9 98.6100.0 100.0
70
80
90
100
2012 2013
% A
dh
eren
ce
National State Hospital
SCIP: Surgical care improvement project CLIP: Central line insertion practices
The 2016 central line-associated blood stream infections (CLABSI), surgical site infections (SSI) and catheter-associated urinary tract infections (CAUTI) data presented in this report have not been validated and must be interpreted with the understanding that in general there are both under- and over-reporting of infections.
In New Hampshire in 2016, CLABSI were monitored in all intensive care units (including pediatric and neonatal units) and not in other inpatient locations. CAUTI were monitored in all intensive care units (including pediatric units and excluding neonatal ICU) and not in other inpatient locations.
Hospitals do not use a standard method of post-discharge surveillance to identify infections once a patient has been discharged. This poses a challenge for data interpretation, because a higher SSI rate (for example) at a given hospital may represent either poor infection prevention practices or, conversely, a better system for identifying infections.
SSI reporting requires not only reporting of infections but also detailed information on every patient who underwent the procedure being monitored. As such, DHHS has elected to monitor a subset of procedures based on national recommendations since it would not be feasible for hospitals to report information on every patient receiving a surgical procedure due to the burden of reporting.
As of July 1, 2015, SCIP 2014–2016 data reported to CMS was unavailable and the HAI Program was unable to con-duct further analysis of this measure as routinely included in this report.
Policy Exemptions Allowed in Policy
Requirements for Unvaccinated HCP With Accepted Exemption
Consequences for Unvaccinated HCP Without Accepted Exemption
YES Medical, Religious, Personal/Philosophical
Wear a mask, Receive verbal and/or written education
Wear a mask, Progressive discipline, potentially including termination
DATA NOTES:
2014-2016 SCIP data are not available.
INFLUENZA VACCINATION POLICIES, 2016-2017 INFLUENZA SEASON

NH DHHS/Division of Public Health Services Healthcare-Associated Infections 2016 Hospital Report, September 1, 2017 Page 121
ST JOSEPH HOSPITAL Nashua, NH Not-for-profit, Acute Care # of Admissions: 5,929 # of Beds: 208 # of ICU Beds: 11 # of Patient-days: 29,940
Measure Observed Infections
Predicted Infections
Standardized Infection Ratio (SIR)
95% Confidence Interval
Comparison to Predicted
Overall HAI 5 8.30 0.60 0.22 , 1.34 Similar
CLABSI 1 1.02 0.98 0.05 , 4.81 Similar
CAUTI 0 1.32 0.00 - , 2.26 Similar
SSI 4 5.95 0.67 0.21 , 1.62 Similar
CABG
COLO 2 2.46 0.81 0.14 , 2.69 Similar
HYST † † † † †
KPRO 2 2.50 0.80 0.13 , 2.64 Similar
Facility does not perform this procedure
STANDARDIZED INFECTION RATIOS (SIR)
Type of Unit Number of Infections
Number of Central Line Days
Rate per 1,000 Central Line Days
Comparison to National Rate
Medical/Surgical ICU 1 683 1.5 Similar
National Rate
0.7
CENTRAL LINE-ASSOCIATED BLOODSTREAM INFECTION RATES
HAI: Healthcare-associated infection CLABSI: Central line-associated bloodstream infection CAUTI: Catheter-associated urinary tract infection SSI: Surgical site infection COLO: Colon procedure HYST: Abdominal hysterectomy CABG: Coronary artery bypass graft KPRO: Knee arthroplasty
2016 HAI DATA REPORT
Type of Unit Number of Infections
Number of Catheter Days
Rate per 1,000 Catheter Days
Comparison to National Rate
Medical/Surgical ICU 0 1018 0.0 Similar
National Rate
1.3
CATHETER-ASSOCIATED URINARY TRACT INFECTION RATES
CENTRAL LINE-ASSOCIATED BLOODSTREAM INFECTION RATES BY BIRTHWEIGHT IN NEONATAL INTENSIVE CARE UNITS
BW Category A: Equal or less than 750 grams BW Category B: Equal and between 751 and 1,000 grams BW Category C: Equal and between 1,001 and 1,500 grams BW Category D: Equal and between 1,501 and 2,500 grams BW Category E: More than 2,500 grams
Birthweight Category Number of Infections
Number of Central Line Days
Rate per 1,000 Central Line Days
National Rate
Comparison to National Rate
BW Category A
BW Category B
BW Category C
BW Category D
BW Category E
No Neonatal ICU to monitor infections

NH DHHS/Division of Public Health Services Healthcare-Associated Infections 2016 Hospital Report, September 1, 2017 Page 122
Measure Percent Adherence
State Coverage
Comparison to State Coverage
CLIP 93.1 98.4 Lower
SCIP-1
SCIP-2
SCIP-3
Measure Percent Vaccinated
State Coverage
Comparison to State Coverage
HCP Influenza Vaccination 97.9 94.2 Higher
Note: SCIP data were not available at time of publication and as a result are excluded from this report.
PROCESS MEASURES
ST JOSEPH HOSPITAL 2016 DATA REPORT
SCIP-1
98.598.5 98.698.9 99.599.0
70
80
90
100
2012 2013
% A
dh
eren
ce
National State Hospital
SCIP: Surgical care improvement project CLIP: Central line insertion practices
The 2016 central line-associated blood stream infections (CLABSI), surgical site infections (SSI) and catheter-associated urinary tract infections (CAUTI) data presented in this report have not been validated and must be interpreted with the understanding that in general there are both under- and over-reporting of infections.
In New Hampshire in 2016, CLABSI were monitored in all intensive care units (including pediatric and neonatal units) and not in other inpatient locations. CAUTI were monitored in all intensive care units (including pediatric units and excluding neonatal ICU) and not in other inpatient locations.
Hospitals do not use a standard method of post-discharge surveillance to identify infections once a patient has been discharged. This poses a challenge for data interpretation, because a higher SSI rate (for example) at a given hospital may represent either poor infection prevention practices or, conversely, a better system for identifying infections.
SSI reporting requires not only reporting of infections but also detailed information on every patient who underwent the procedure being monitored. As such, DHHS has elected to monitor a subset of procedures based on national recommendations since it would not be feasible for hospitals to report information on every patient receiving a surgical procedure due to the burden of reporting.
As of July 1, 2015, SCIP 2014– 2016 data reported to CMS was unavailable and the HAI Program was unable to con-duct further analysis of this measure as routinely included in this report.
Policy Exemptions Allowed in Policy
Requirements for Unvaccinated HCP With Accepted Exemption
Consequences for Unvaccinated HCP Without Accepted Exemption
YES Medical, Religious, Personal/Philosophical
Wear a mask, Receive verbal and/or written education
Progressive discipline, potentially including termination
DATA NOTES:
2014-2016 SCIP data are not available.
INFLUENZA VACCINATION POLICIES, 2016-2017 INFLUENZA SEASON

NH DHHS/Division of Public Health Services Healthcare-Associated Infections 2016 Hospital Report, September 1, 2017 Page 123
THE MEMORIAL HOSPITAL North Conway, NH Not-for-profit, Critical Access # of Admissions: 1,763 # of Beds: 25 # of ICU Beds: 3 # of Patient-days: 6,071
Measure Observed Infections
Predicted Infections
Standardized Infection Ratio (SIR)
95% Confidence Interval
Comparison to Predicted
Overall HAI 2 1.64 1.22 0.20 , 4.03 Similar
CLABSI † † † † †
CAUTI † † † † †
SSI 2 1.16 1.72 0.29 , 5.69 Similar
CABG
COLO † † † † †
HYST † † † † †
KPRO † † † † †
Facility does not perform this procedure
STANDARDIZED INFECTION RATIOS (SIR)
Type of Unit Number of Infections
Number of Central Line Days
Rate per 1,000 Central Line Days
Comparison to National Rate
Medical ICU † † † †
National Rate
†
CENTRAL LINE-ASSOCIATED BLOODSTREAM INFECTION RATES
HAI: Healthcare-associated infection CLABSI: Central line-associated bloodstream infection CAUTI: Catheter-associated urinary tract infection SSI: Surgical site infection COLO: Colon procedure HYST: Abdominal hysterectomy CABG: Coronary artery bypass graft KPRO: Knee arthroplasty
2016 HAI DATA REPORT
Type of Unit Number of Infections
Number of Catheter Days
Rate per 1,000 Catheter Days
Comparison to National Rate
Medical ICU 0 199 0.00 Similar
National Rate
0.5
CATHETER-ASSOCIATED URINARY TRACT INFECTION RATES
CENTRAL LINE-ASSOCIATED BLOODSTREAM INFECTION RATES BY BIRTHWEIGHT IN NEONATAL INTENSIVE CARE UNITS
BW Category A: Equal or less than 750 grams BW Category B: Equal and between 751 and 1,000 grams BW Category C: Equal and between 1,001 and 1,500 grams BW Category D: Equal and between 1,501 and 2,500 grams BW Category E: More than 2,500 grams
Birthweight Category Number of Infections
Number of Central Line Days
Rate per 1,000 Central Line Days
National Rate
Comparison to National Rate
BW Category A
BW Category B
BW Category C
BW Category D
BW Category E
No Neonatal ICU to monitor infections

NH DHHS/Division of Public Health Services Healthcare-Associated Infections 2016 Hospital Report, September 1, 2017 Page 124
Measure Percent Adherence
State Coverage
Comparison to State Coverage
CLIP † 98.4 †
SCIP-1
SCIP-2
SCIP-3
Measure Percent Vaccinated
State Coverage
Comparison to State Coverage
HCP Influenza Vaccination 85.8 94.2 Lower
Note: SCIP data were not available at time of publication and as a result are excluded from this report.
PROCESS MEASURES
THE MEMORIAL HOSPITAL 2016 DATA REPORT
SCIP-1
98.5 98.598.9 98.697.0 98.2
70
80
90
100
2012 2013
% A
dh
eren
ce
National State Hospital
SCIP: Surgical care improvement project CLIP: Central line insertion practices
The 2016 central line-associated blood stream infections (CLABSI), surgical site infections (SSI) and catheter-associated urinary tract infections (CAUTI) data presented in this report have not been validated and must be interpreted with the understanding that in general there are both under- and over-reporting of infections.
In New Hampshire in 2016, CLABSI were monitored in all intensive care units (including pediatric and neonatal units) and not in other inpatient locations. CAUTI were monitored in all intensive care units (including pediatric units and excluding neonatal ICU) and not in other inpatient locations.
Hospitals do not use a standard method of post-discharge surveillance to identify infections once a patient has been discharged. This poses a challenge for data interpretation, because a higher SSI rate (for example) at a given hospital may represent either poor infection prevention practices or, conversely, a better system for identifying infections.
SSI reporting requires not only reporting of infections but also detailed information on every patient who underwent the procedure being monitored. As such, DHHS has elected to monitor a subset of procedures based on national recommendations since it would not be feasible for hospitals to report information on every patient receiving a surgical procedure due to the burden of reporting.
As of July 1, 2015, SCIP 2014– 2016 data reported to CMS was unavailable and the HAI Program was unable to con-duct further analysis of this measure as routinely included in this report.
Policy Exemptions Allowed in Policy
Requirements for Unvaccinated HCP With Accepted Exemption
Consequences for Unvaccinated HCP Without Accepted Exemption
YES Medical Wear a mask Wear a mask
DATA NOTES:
2014-2016 SCIP data are not available.
INFLUENZA VACCINATION POLICIES, 2016-2017 INFLUENZA SEASON

NH DHHS/Division of Public Health Services Healthcare-Associated Infections 2016 Hospital Report, September 1, 2017 Page 125
UPPER CONNECTICUT VALLEY Colebrook, NH Not-for-profit, Critical Access # of Admissions: 392 # of Beds: 16 # of ICU Beds: 0 # of Patient-days: 1,659
Measure Observed Infections
Predicted Infections
Standardized Infection Ratio (SIR)
95% Confidence Interval
Comparison to Predicted
Overall HAI
CLABSI
CAUTI
SSI
CABG
COLO
HYST
KPRO
Facility did not report any data contributing to a SIR during this time period.
No central lines to monitor in the ICU in 2016
No urinary catheters to monitor in the ICU in 2016
No procedures of these types performed in 2016
STANDARDIZED INFECTION RATIOS (SIR)
Type of Unit Number of Infections
Number of Central Line Days
Rate per 1,000 Central Line Days
Comparison to National Rate
Medical/Surgical ICU - - - -
National Rate
-
CENTRAL LINE-ASSOCIATED BLOODSTREAM INFECTION RATES
HAI: Healthcare-associated infection CLABSI: Central line-associated bloodstream infection CAUTI: Catheter-associated urinary tract infection SSI: Surgical site infection COLO: Colon procedure HYST: Abdominal hysterectomy CABG: Coronary artery bypass graft KPRO: Knee arthroplasty
2016 HAI DATA REPORT
Type of Unit Number of Infections
Number of Catheter Days
Rate per 1,000 Catheter Days
Comparison to National Rate
Medical/Surgical ICU - - - -
National Rate
-
CATHETER-ASSOCIATED URINARY TRACT INFECTION RATES
CENTRAL LINE-ASSOCIATED BLOODSTREAM INFECTION RATES BY BIRTHWEIGHT IN NEONATAL INTENSIVE CARE UNITS
BW Category A: Equal or less than 750 grams BW Category B: Equal and between 751 and 1,000 grams BW Category C: Equal and between 1,001 and 1,500 grams BW Category D: Equal and between 1,501 and 2,500 grams BW Category E: More than 2,500 grams
Birthweight Category Number of Infections
Number of Central Line Days
Rate per 1,000 Central Line Days
National Rate
Comparison to National Rate
BW Category A
BW Category B
BW Category C
BW Category D
BW Category E
No Neonatal ICU to monitor infections

NH DHHS/Division of Public Health Services Healthcare-Associated Infections 2016 Hospital Report, September 1, 2017 Page 126
Measure Percent Adherence
State Coverage
Comparison to State Coverage
CLIP 98.4
SCIP-1
SCIP-2
SCIP-3
Measure Percent Vaccinated
State Coverage
Comparison to State Coverage
HCP Influenza Vaccination 86.6 94.2 Lower
Note: SCIP data were not available at time of publication and as a result are excluded from this report.
PROCESS MEASURES
UPPER CONNECTICUT VALLEY 2016 DATA REPORT
SCIP: Surgical care improvement project CLIP: Central line insertion practices
The 2015 central line-associated blood stream infections (CLABSI), surgical site infections (SSI) and catheter-associated urinary tract infections (CAUTI) data presented in this report have not been validated and must be interpreted with the understanding that in general there are both under- and over-reporting of infections.
In New Hampshire in 2015, CLABSI were monitored in all intensive care units (including pediatric and neonatal units) and not in other inpatient locations. CAUTI were monitored in all intensive care units (including pediatric units and excluding neonatal ICU) and not in other inpatient locations.
Hospitals do not use a standard method of post-discharge surveillance to identify infections once a patient has been discharged. This poses a challenge for data interpretation, because a higher SSI rate (for example) at a given hospital may represent either poor infection prevention practices or, conversely, a better system for identifying infections.
SSI reporting requires not only reporting of infections but also detailed information on every patient who underwent the procedure being monitored. As such, DHHS has elected to monitor a subset of procedures based on national recommendations since it would not be feasible for hospitals to report information on every patient receiving a surgical procedure due to the burden of reporting.
As of July 1, 2015, SCIP 2014– 2015 data reported to CMS was unavailable and the HAI Program was unable to con-duct further analysis of this measure as routinely included in this report.
Policy Exemptions Allowed in Policy
Requirements for Unvaccinated HCP With Accepted Exemption
Consequences for Unvaccinated HCP Without Accepted Exemption
NO
DATA NOTES:
98.5 98.598.9 98.6
70
80
90
100
2012 2013
% A
dh
ere
nce
SCIP-1
National State Hospital
Hospital did not have any SCIP data to report in 2012 or 2013.
2014-2016 SCIP data are not available.
INFLUENZA VACCINATION POLICIES, 2016-2017 INFLUENZA SEASON
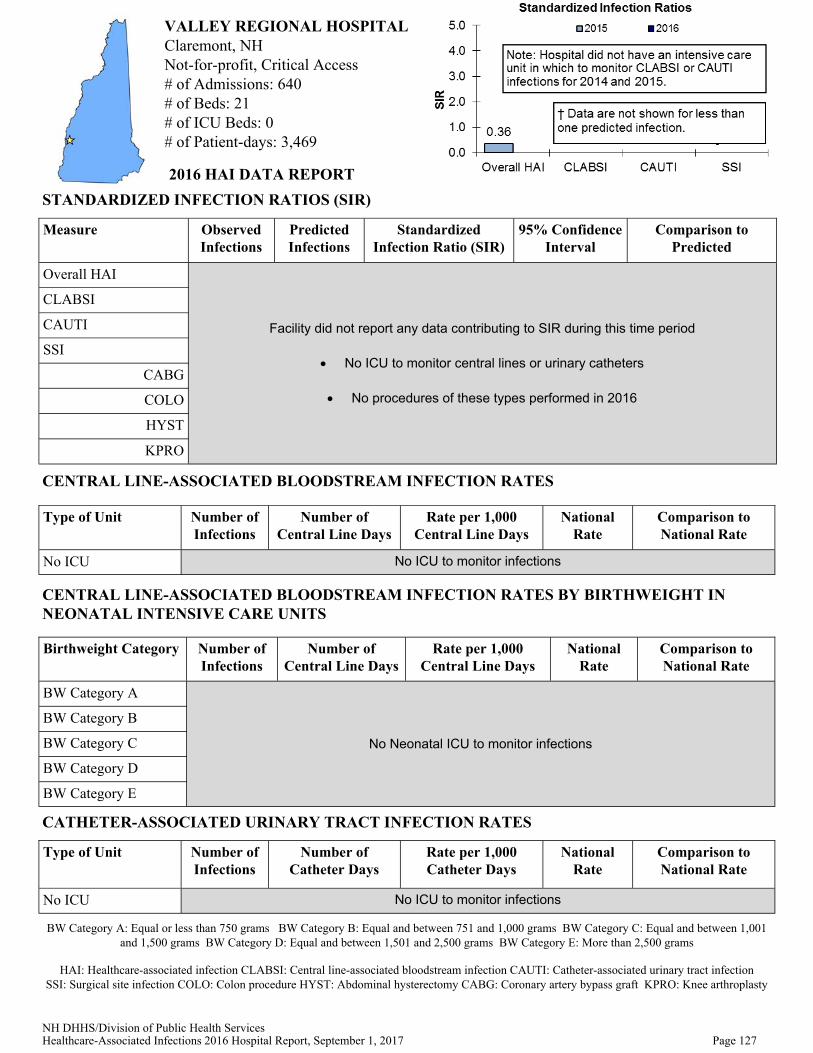
NH DHHS/Division of Public Health Services Healthcare-Associated Infections 2016 Hospital Report, September 1, 2017 Page 127
VALLEY REGIONAL HOSPITAL Claremont, NH Not-for-profit, Critical Access # of Admissions: 640 # of Beds: 21 # of ICU Beds: 0 # of Patient-days: 3,469
Measure Observed Infections
Predicted Infections
Standardized Infection Ratio (SIR)
95% Confidence Interval
Comparison to Predicted
Overall HAI
CLABSI
CAUTI
SSI
CABG
COLO
HYST
KPRO
Facility did not report any data contributing to SIR during this time period
No ICU to monitor central lines or urinary catheters
No procedures of these types performed in 2016
STANDARDIZED INFECTION RATIOS (SIR)
Type of Unit Number of Infections
Number of Central Line Days
Rate per 1,000 Central Line Days
National Rate
Comparison to National Rate
No ICU No ICU to monitor infections
CENTRAL LINE-ASSOCIATED BLOODSTREAM INFECTION RATES
HAI: Healthcare-associated infection CLABSI: Central line-associated bloodstream infection CAUTI: Catheter-associated urinary tract infection SSI: Surgical site infection COLO: Colon procedure HYST: Abdominal hysterectomy CABG: Coronary artery bypass graft KPRO: Knee arthroplasty
2016 HAI DATA REPORT
Type of Unit Number of Infections
Number of Catheter Days
Rate per 1,000 Catheter Days
National Rate
Comparison to National Rate
No ICU No ICU to monitor infections
CATHETER-ASSOCIATED URINARY TRACT INFECTION RATES
CENTRAL LINE-ASSOCIATED BLOODSTREAM INFECTION RATES BY BIRTHWEIGHT IN NEONATAL INTENSIVE CARE UNITS
BW Category A: Equal or less than 750 grams BW Category B: Equal and between 751 and 1,000 grams BW Category C: Equal and between 1,001 and 1,500 grams BW Category D: Equal and between 1,501 and 2,500 grams BW Category E: More than 2,500 grams
Birthweight Category Number of Infections
Number of Central Line Days
Rate per 1,000 Central Line Days
National Rate
Comparison to National Rate
BW Category A
BW Category B
BW Category C
BW Category D
BW Category E
No Neonatal ICU to monitor infections

NH DHHS/Division of Public Health Services Healthcare-Associated Infections 2016 Hospital Report, September 1, 2017 Page 128
98.5 98.598.9 98.6100.0
70
80
90
100
2012 2013
% A
dh
ere
nce
SCIP-1
National State Hospital
Measure Percent Adherence
State Coverage
Comparison to State Coverage
CLIP 98.4
SCIP-1
SCIP-2
SCIP-3
Measure Percent Vaccinated
State Coverage
Comparison to State Coverage
HCP Influenza Vaccination 99.8 94.2 Higher
Note: SCIP data were not available at time of publication and as a result are excluded from this report.
PROCESS MEASURES
VALLEY REGIONAL HOSPITAL 2016 DATA REPORT
SCIP: Surgical care improvement project CLIP: Central line insertion practices
The 2016 central line-associated blood stream infections (CLABSI), surgical site infections (SSI) and catheter-associated urinary tract infections (CAUTI) data presented in this report have not been validated and must be interpreted with the understanding that in general there are both under- and over-reporting of infections.
In New Hampshire in 2016, CLABSI were monitored in all intensive care units (including pediatric and neonatal units) and not in other inpatient locations. CAUTI were monitored in all intensive care units (including pediatric units and excluding neonatal ICU) and not in other inpatient locations.
Hospitals do not use a standard method of post-discharge surveillance to identify infections once a patient has been discharged. This poses a challenge for data interpretation, because a higher SSI rate (for example) at a given hospital may represent either poor infection prevention practices or, conversely, a better system for identifying infections.
SSI reporting requires not only reporting of infections but also detailed information on every patient who underwent the procedure being monitored. As such, DHHS has elected to monitor a subset of procedures based on national recommendations since it would not be feasible for hospitals to report information on every patient receiving a surgical procedure due to the burden of reporting.
As of July 1, 2015, SCIP 2014– 2016 data reported to CMS was unavailable and the HAI Program was unable to con-duct further analysis of this measure as routinely included in this report.
Policy Exemptions Allowed in Policy
Requirements for Unvaccinated HCP With Accepted Exemption
Consequences for Unvaccinated HCP Without Accepted Exemption
YES Medical, Religious,
Wear a mask Progressive discipline, potentially including termination
DATA NOTES:
Hospital did not have any SCIP data to report in 2013.
2014-2016 SCIP data are not available.
INFLUENZA VACCINATION POLICIES, 2016-2017 INFLUENZA SEASON

NH DHHS/Division of Public Health Services Healthcare-Associated Infections 2016 Hospital Report, September 1, 2017 Page 129
WEEKS MEDICAL CENTER Lancaster, NH Not-for-profit, Critical Access # of Admissions: 1,224 # of Beds: 25 # of ICU Beds: 3 # of Patient-days: 3,812
Measure Observed Infections
Predicted Infections
Standardized Infection Ratio (SIR)
95% Confidence Interval
Comparison to Predicted
Overall HAI 0 1.02 0.00 - , 2.94 Similar
CLABSI † † † † †
CAUTI † † † † †
SSI † † † † †
CABG Facility does not perform this procedure
COLO † † † † †
HYST
KPRO † † † † †
Facility did not perform this procedure
STANDARDIZED INFECTION RATIOS (SIR)
Type of Unit Number of Infections
Number of Central Line Days
Rate per 1,000 Central Line Days
Comparison to National Rate
Medical/Surgical ICU † † † †
National Rate
†
CENTRAL LINE-ASSOCIATED BLOODSTREAM INFECTION RATES
HAI: Healthcare-associated infection CLABSI: Central line-associated bloodstream infection CAUTI: Catheter-associated urinary tract infection SSI: Surgical site infection COLO: Colon procedure HYST: Abdominal hysterectomy CABG: Coronary artery bypass graft KPRO: Knee arthroplasty
Type of Unit Number of Infections
Number of Catheter Days
Rate per 1,000 Catheter Days
Comparison to National Rate
Medical/Surgical ICU 0 112 0.0 Similar
National Rate
0.5
CATHETER-ASSOCIATED URINARY TRACT INFECTION RATES
CENTRAL LINE-ASSOCIATED BLOODSTREAM INFECTION RATES BY BIRTHWEIGHT IN NEONATAL INTENSIVE CARE UNITS
BW Category A: Equal or less than 750 grams BW Category B: Equal and between 751 and 1,000 grams BW Category C: Equal and between 1,001 and 1,500 grams BW Category D: Equal and between 1,501 and 2,500 grams BW Category E: More than 2,500 grams
2016 HAI DATA REPORT
Birthweight Category Number of Infections
Number of Central Line Days
Rate per 1,000 Central Line Days
National Rate
Comparison to National Rate
BW Category A
BW Category B
BW Category C
BW Category D
BW Category E
No Neonatal ICU to monitor infections
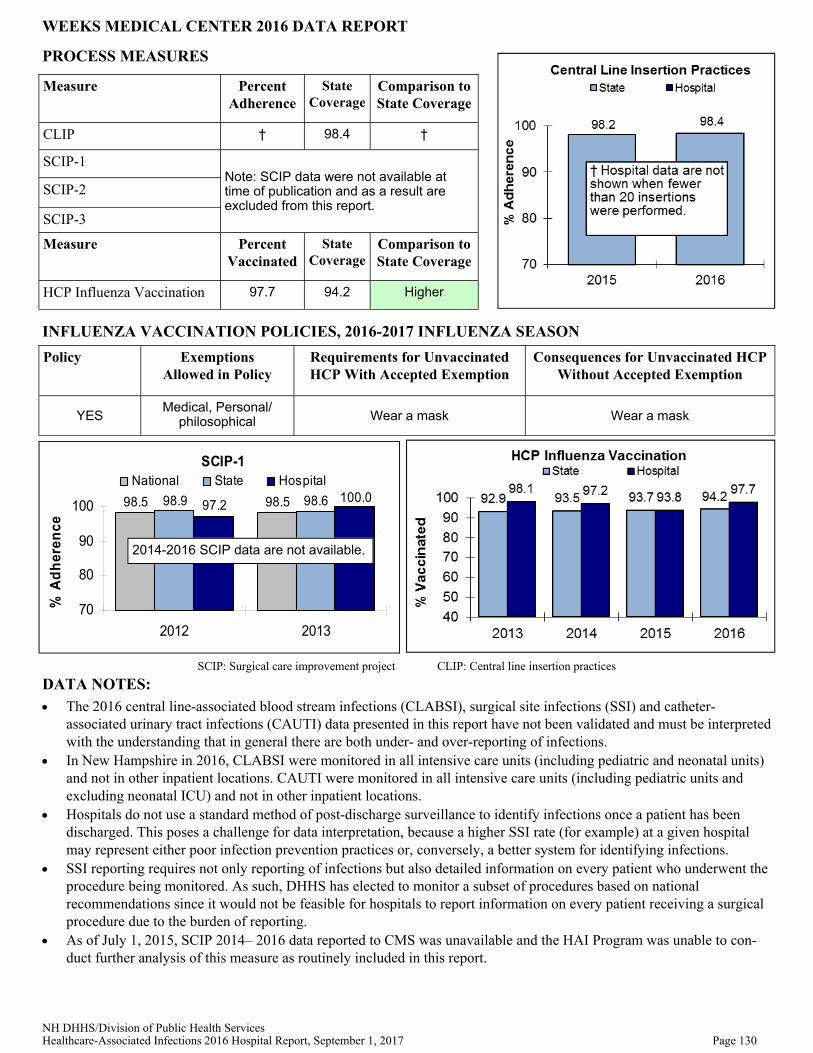
NH DHHS/Division of Public Health Services Healthcare-Associated Infections 2016 Hospital Report, September 1, 2017 Page 130
Measure Percent Adherence
State Coverage
Comparison to State Coverage
CLIP † 98.4 †
SCIP-1
SCIP-2
SCIP-3
Measure Percent Vaccinated
State Coverage
Comparison to State Coverage
HCP Influenza Vaccination 97.7 94.2 Higher
Note: SCIP data were not available at time of publication and as a result are excluded from this report.
PROCESS MEASURES
WEEKS MEDICAL CENTER 2016 DATA REPORT
SCIP-1
98.5 98.598.9 98.697.2100.0
70
80
90
100
2012 2013
% A
dh
eren
ce
National State Hospital
SCIP: Surgical care improvement project CLIP: Central line insertion practices
The 2016 central line-associated blood stream infections (CLABSI), surgical site infections (SSI) and catheter-associated urinary tract infections (CAUTI) data presented in this report have not been validated and must be interpreted with the understanding that in general there are both under- and over-reporting of infections.
In New Hampshire in 2016, CLABSI were monitored in all intensive care units (including pediatric and neonatal units) and not in other inpatient locations. CAUTI were monitored in all intensive care units (including pediatric units and excluding neonatal ICU) and not in other inpatient locations.
Hospitals do not use a standard method of post-discharge surveillance to identify infections once a patient has been discharged. This poses a challenge for data interpretation, because a higher SSI rate (for example) at a given hospital may represent either poor infection prevention practices or, conversely, a better system for identifying infections.
SSI reporting requires not only reporting of infections but also detailed information on every patient who underwent the procedure being monitored. As such, DHHS has elected to monitor a subset of procedures based on national recommendations since it would not be feasible for hospitals to report information on every patient receiving a surgical procedure due to the burden of reporting.
As of July 1, 2015, SCIP 2014– 2016 data reported to CMS was unavailable and the HAI Program was unable to con-duct further analysis of this measure as routinely included in this report.
Policy Exemptions Allowed in Policy
Requirements for Unvaccinated HCP With Accepted Exemption
Consequences for Unvaccinated HCP Without Accepted Exemption
YES Medical, Personal/
philosophical Wear a mask Wear a mask
DATA NOTES:
2014-2016 SCIP data are not available.
INFLUENZA VACCINATION POLICIES, 2016-2017 INFLUENZA SEASON

NH DHHS/Division of Public Health Services Healthcare-Associated Infections 2016 Hospital Report, September 1, 2017 Page 131
WENTWORTH-DOUGLASS Dover, NH Not-for-profit, Acute Care # of Admissions: 8,169 # of Beds: 142 # of ICU Beds: 11 # of Patient-days: 36,621
Measure Observed Infections
Predicted Infections
Standardized Infection Ratio (SIR)
95% Confidence Interval
Comparison to Predicted
Overall HAI 8 13.21 0.61 0.28 , 1.15 Similar
CLABSI 0 2.14 0.00 - , 1.40 Similar
CAUTI 1 2.41 0.42 0.02 , 2.05 Similar
SSI 7 8.66 0.81 0.35 , 1.60 Similar
CABG
COLO 5 4.22 1.19 0.44 , 2.63 Similar
HYST 0 2.26 0.00 - , 1.33 Similar
KPRO 2 2.19 0.92 0.15 , 3.02 Similar
Facility does not perform this procedure
STANDARDIZED INFECTION RATIOS (SIR)
Type of Unit Number of Infections
Number of Central Line Days
Rate per 1,000 Central Line Days
Comparison to National Rate
Medical/Surgical ICU 0 1,429 0.0 Similar
National Rate
0.7
CENTRAL LINE-ASSOCIATED BLOODSTREAM INFECTION RATES
HAI: Healthcare-associated infection CLABSI: Central line-associated bloodstream infection CAUTI: Catheter-associated urinary tract infection SSI: Surgical site infection COLO: Colon procedure HYST: Abdominal hysterectomy CABG: Coronary artery bypass graft KPRO: Knee arthroplasty
2016 HAI DATA REPORT
Type of Unit Number of Infections
Number of Catheter Days
Rate per 1,000 Catheter Days
Comparison to National Rate
Medical/Surgical ICU 1 1,850 0.5 Similar
National Rate
1.3
CATHETER-ASSOCIATED URINARY TRACT INFECTION RATES
CENTRAL LINE-ASSOCIATED BLOODSTREAM INFECTION RATES BY BIRTHWEIGHT IN NEONATAL INTENSIVE CARE UNITS
BW Category A: Equal or less than 750 grams BW Category B: Equal and between 751 and 1,000 grams BW Category C: Equal and between 1,001 and 1,500 grams BW Category D: Equal and between 1,501 and 2,500 grams BW Category E: More than 2,500 grams
Birthweight Category Number of Infections
Number of Central Line Days
Rate per 1,000 Central Line Days
National Rate
Comparison to National Rate
BW Category A
BW Category B
BW Category C
BW Category D
BW Category E
No Neonatal ICU to monitor infections

NH DHHS/Division of Public Health Services Healthcare-Associated Infections 2016 Hospital Report, September 1, 2017 Page 132
Measure Percent Adherence
State Coverage
Comparison to State Coverage
CLIP 97.4 98.4 Similar
SCIP-1
SCIP-2
SCIP-3
Measure Percent Vaccinated
State Coverage
Comparison to State Coverage
HCP Influenza Vaccination 98.5 94.2 Higher
Note: SCIP data were not available at time of publication and as a result are excluded from this report.
PROCESS MEASURES
WENTWORTH-DOUGLASS 2016 DATA REPORT
SCIP-1
98.5 98.598.9 98.699.6 97.5
70
80
90
100
2012 2013
% A
dh
eren
ce
National State Hospital
SCIP: Surgical care improvement project CLIP: Central line insertion practices
The 2016 central line-associated blood stream infections (CLABSI), surgical site infections (SSI) and catheter-associated urinary tract infections (CAUTI) data presented in this report have not been validated and must be interpreted with the understanding that in general there are both under- and over-reporting of infections.
In New Hampshire in 2016, CLABSI were monitored in all intensive care units (including pediatric and neonatal units) and not in other inpatient locations. CAUTI were monitored in all intensive care units (including pediatric units and excluding neonatal ICU) and not in other inpatient locations.
Hospitals do not use a standard method of post-discharge surveillance to identify infections once a patient has been discharged. This poses a challenge for data interpretation, because a higher SSI rate (for example) at a given hospital may represent either poor infection prevention practices or, conversely, a better system for identifying infections.
SSI reporting requires not only reporting of infections but also detailed information on every patient who underwent the procedure being monitored. As such, DHHS has elected to monitor a subset of procedures based on national recommendations since it would not be feasible for hospitals to report information on every patient receiving a surgical procedure due to the burden of reporting.
As of July 1, 2015, SCIP 2014– 2016 data reported to CMS was unavailable and the HAI Program was unable to con-duct further analysis of this measure as routinely included in this report.
Policy Exemptions Allowed in Policy
Requirements for Unvaccinated HCP With Accepted Exemption
Consequences for Unvaccinated HCP Without Accepted Exemption
YES Medical, Religious,
Personal/philosophical Wear a mask, Receive verbal and/or
written education Wear a mask
DATA NOTES:
2014-2016 SCIP data are not available.
INFLUENZA VACCINATION POLICIES, 2016-2017 INFLUENZA SEASON

NH DHHS/Division of Public Health Services Healthcare-Associated Infections 2016 Hospital Report, September 1, 2017 Page 133
CROTCHED MOUNTAIN SPECIALTY HOSPITAL Greenfield, NH Not-for-profit # of Admissions: 78 # of Beds: 26
PROCESS MEASURES
HAI: Healthcare-associated infection CLABSI: Central line-associated bloodstream infection CAUTI: Catheter-associated urinary tract infection SSI: Surgical site infection COLO: Colon procedure HYST: Abdominal hysterectomy CABG: Coronary artery bypass graft KPRO: Knee arthroplasty
SCIP: Surgical care improvement project CLIP: Central line insertion practices
Measure Percent Vaccinated
State Coverage
Comparison to State Coverage
HCP Influenza Vaccination 95.0 94.2 Similar
INFLUENZA VACCINATION POLICIES, 2015-2016 INFLUENZA SEASON
Policy Exemptions Allowed in Policy*
Requirements for Unvaccinated HCP With Accepted Exemption
Consequences for Unvaccinated HCP Without Accepted Exemption
YES Medical, Religious,
Personal/philosophical Wear a mask, Receive verbal and/or
written education Wear a mask, Receive verbal and/or
written education
DATA NOTES:
Specialty hospitals (rehabilitation and psychiatric hospitals) are not required to report CLABSI, CAUTI, or CLIP, be-cause they do not have ICU, nor SSI and surgical antimicrobial prophylaxis administration data, because they do not perform surgeries.
New Hampshire’s five rehabilitation and two psychiatric hospitals are only required to report influenza vaccination rates for patients and staff.
2015 HAI DATA REPORT

NH DHHS/Division of Public Health Services Healthcare-Associated Infections 2016 Hospital Report, September 1, 2017 Page 134
HAMPSTEAD HOSPITAL Hampstead, NH Private # of Admissions: 1,924 # of Beds: 111
PROCESS MEASURES
HAI: Healthcare-associated infection CLABSI: Central line-associated bloodstream infection CAUTI: Catheter-associated urinary tract infection SSI: Surgical site infection COLO: Colon procedure HYST: Abdominal hysterectomy CABG: Coronary artery bypass graft KPRO: Knee arthroplasty
SCIP: Surgical care improvement project CLIP: Central line insertion practices
Measure Percent Vaccinated
State Coverage
Comparison to State Coverage
HCP Influenza Vaccination 73.0 94.2 Lower
Policy Exemptions Allowed in Policy*
Requirements for Unvaccinated HCP With Accepted Exemption
Consequences for Unvaccinated HCP Without Accepted Exemption
YES Medical, Religious, Personal/philosophical
Receive verbal and/or wri en educa on Receive verbal and/or wri en educa on
DATA NOTES:
Specialty hospitals (rehabilitation and psychiatric hospitals) are not required to report CLABSI, CAUTI, or CLIP, be-cause they do not have ICU, nor SSI and surgical antimicrobial prophylaxis administration data, because they do not perform surgeries.
New Hampshire’s five rehabilitation and two psychiatric hospitals are only required to report influenza vaccination rates for patients and staff.
2016 HAI DATA REPORT
INFLUENZA VACCINATION POLICIES, 2016-2017 INFLUENZA SEASON

NH DHHS/Division of Public Health Services Healthcare-Associated Infections 2016 Hospital Report, September 1, 2017 Page 135
HEALTHSOUTH REHABILITATION HOSPITAL Concord, NH Corporate # of Admissions: 907 # of Beds: 50
PROCESS MEASURES
HAI: Healthcare-associated infection CLABSI: Central line-associated bloodstream infection CAUTI: Catheter-associated urinary tract infection SSI: Surgical site infection COLO: Colon procedure HYST: Abdominal hysterectomy CABG: Coronary artery bypass graft KPRO: Knee arthroplasty
SCIP: Surgical care improvement project CLIP: Central line insertion practices
Measure Percent Vaccinated
State Coverage
Comparison to State Coverage
HCP Influenza Vaccination 91.8 94.2 Similar
Policy Exemptions Allowed in Policy*
Requirements for Unvaccinated HCP With Accepted Exemption
Consequences for Unvaccinated HCP Without Accepted Exemption
CONSIDERING
DATA NOTES:
Specialty hospitals (rehabilitation and psychiatric hospitals) are not required to report CLABSI, CAUTI, or CLIP, be-cause they do not have ICU, nor SSI and surgical antimicrobial prophylaxis administration data, because they do not perform surgeries.
New Hampshire’s five rehabilitation and two psychiatric hospitals are only required to report influenza vaccination rates for patients and staff.
2016 HAI DATA REPORT
INFLUENZA VACCINATION POLICIES, 2016-2017 INFLUENZA SEASON
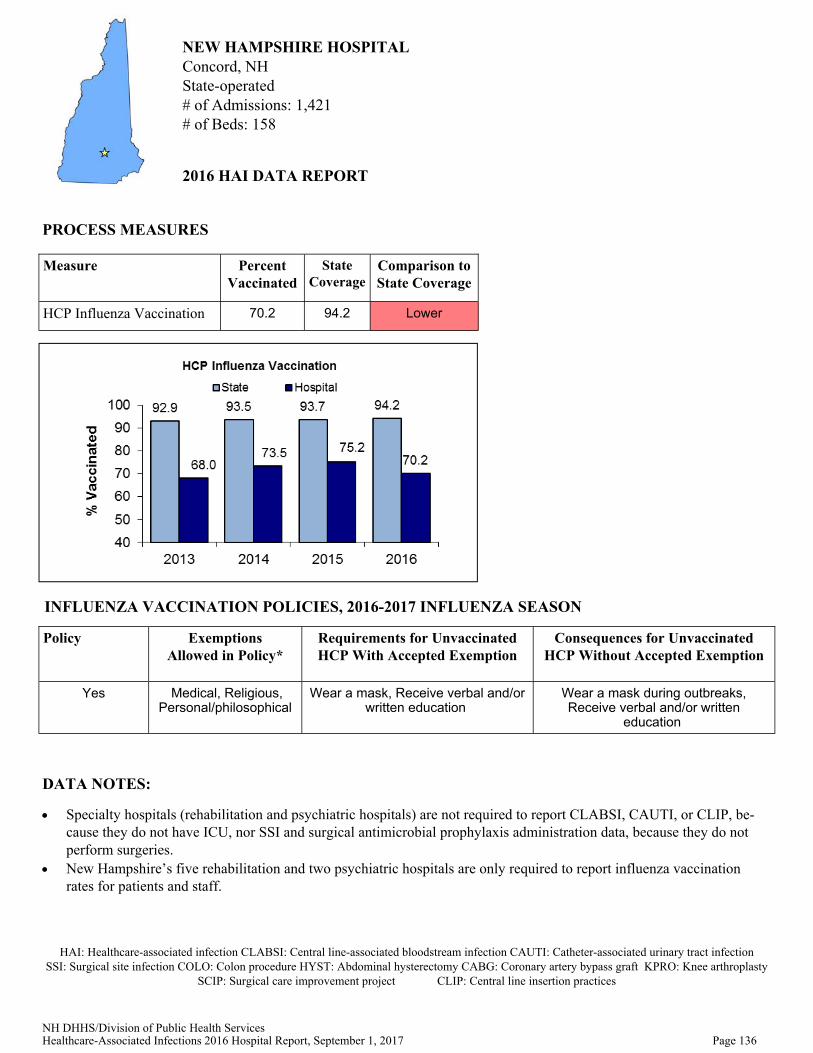
NH DHHS/Division of Public Health Services Healthcare-Associated Infections 2016 Hospital Report, September 1, 2017 Page 136
NEW HAMPSHIRE HOSPITAL Concord, NH State-operated # of Admissions: 1,421 # of Beds: 158
PROCESS MEASURES
HAI: Healthcare-associated infection CLABSI: Central line-associated bloodstream infection CAUTI: Catheter-associated urinary tract infection SSI: Surgical site infection COLO: Colon procedure HYST: Abdominal hysterectomy CABG: Coronary artery bypass graft KPRO: Knee arthroplasty
SCIP: Surgical care improvement project CLIP: Central line insertion practices
Measure Percent Vaccinated
State Coverage
Comparison to State Coverage
HCP Influenza Vaccination 70.2 94.2 Lower
Policy Exemptions Allowed in Policy*
Requirements for Unvaccinated HCP With Accepted Exemption
Consequences for Unvaccinated HCP Without Accepted Exemption
Yes Medical, Religious, Personal/philosophical
Wear a mask, Receive verbal and/or written education
Wear a mask during outbreaks, Receive verbal and/or written
education
DATA NOTES:
Specialty hospitals (rehabilitation and psychiatric hospitals) are not required to report CLABSI, CAUTI, or CLIP, be-cause they do not have ICU, nor SSI and surgical antimicrobial prophylaxis administration data, because they do not perform surgeries.
New Hampshire’s five rehabilitation and two psychiatric hospitals are only required to report influenza vaccination rates for patients and staff.
2016 HAI DATA REPORT
INFLUENZA VACCINATION POLICIES, 2016-2017 INFLUENZA SEASON
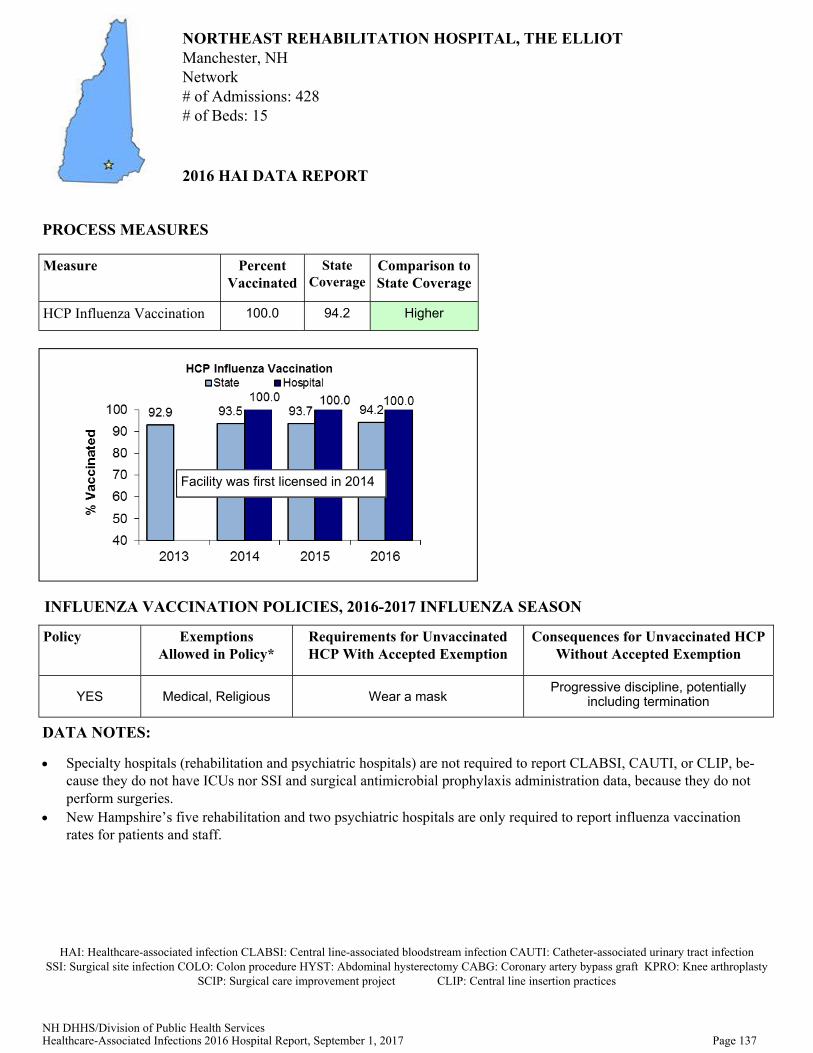
NH DHHS/Division of Public Health Services Healthcare-Associated Infections 2016 Hospital Report, September 1, 2017 Page 137
NORTHEAST REHABILITATION HOSPITAL, THE ELLIOT Manchester, NH Network # of Admissions: 428 # of Beds: 15
PROCESS MEASURES
HAI: Healthcare-associated infection CLABSI: Central line-associated bloodstream infection CAUTI: Catheter-associated urinary tract infection SSI: Surgical site infection COLO: Colon procedure HYST: Abdominal hysterectomy CABG: Coronary artery bypass graft KPRO: Knee arthroplasty
SCIP: Surgical care improvement project CLIP: Central line insertion practices
Measure Percent Vaccinated
State Coverage
Comparison to State Coverage
HCP Influenza Vaccination 100.0 94.2 Higher
Policy Exemptions Allowed in Policy*
Requirements for Unvaccinated HCP With Accepted Exemption
Consequences for Unvaccinated HCP Without Accepted Exemption
YES Medical, Religious Wear a mask Progressive discipline, potentially
including termination
DATA NOTES:
Specialty hospitals (rehabilitation and psychiatric hospitals) are not required to report CLABSI, CAUTI, or CLIP, be-cause they do not have ICUs nor SSI and surgical antimicrobial prophylaxis administration data, because they do not perform surgeries.
New Hampshire’s five rehabilitation and two psychiatric hospitals are only required to report influenza vaccination rates for patients and staff.
Facility was first licensed in 2014
2016 HAI DATA REPORT
INFLUENZA VACCINATION POLICIES, 2016-2017 INFLUENZA SEASON

NH DHHS/Division of Public Health Services Healthcare-Associated Infections 2016 Hospital Report, September 1, 2017 Page 138
NORTHEAST REHABILITATION HOSPITAL, PEASE Portsmouth, NH Network # of Admissions: 1,024 # of Beds: 33
PROCESS MEASURES
HAI: Healthcare-associated infection CLABSI: Central line-associated bloodstream infection CAUTI: Catheter-associated urinary tract infection SSI: Surgical site infection COLO: Colon procedure HYST: Abdominal hysterectomy CABG: Coronary artery bypass graft KPRO: Knee arthroplasty
SCIP: Surgical care improvement project CLIP: Central line insertion practices
Measure Percent Vaccinated
State Coverage
Comparison to State Coverage
HCP Influenza Vaccination 99.6 94.2 Higher
Policy Exemptions Allowed in Policy*
Requirements for Unvaccinated HCP With Accepted Exemption
Consequences for Unvaccinated HCP Without Accepted Exemption
YES Medical, Religious Wear a mask Progressive discipline, potentially
including termination
DATA NOTES:
Specialty hospitals (rehabilitation and psychiatric hospitals) are not required to report CLABSI, CAUTI, or CLIP, be-cause they do not have ICU, nor SSI and surgical antimicrobial prophylaxis administration data, because they do not perform surgeries.
New Hampshire’s five rehabilitation and two psychiatric hospitals are only required to report influenza vaccination rates for patients and staff.
2016 HAI DATA REPORT
INFLUENZA VACCINATION POLICIES, 2016-2017 INFLUENZA SEASON

NH DHHS/Division of Public Health Services Healthcare-Associated Infections 2016 Hospital Report, September 1, 2017 Page 139
NORTHEAST REHABILITATION HOSPITAL, SALEM Salem, NH Network # of Admissions: 1,812 # of Beds: 67
PROCESS MEASURES
HAI: Healthcare-associated infection CLABSI: Central line-associated bloodstream infection CAUTI: Catheter-associated urinary tract infection SSI: Surgical site infection COLO: Colon procedure HYST: Abdominal hysterectomy CABG: Coronary artery bypass graft KPRO: Knee arthroplasty
SCIP: Surgical care improvement project CLIP: Central line insertion practices
Measure Percent Vaccinated
State Coverage
Comparison to State Coverage
HCP Influenza Vaccination 99.0 94.2 Higher
Policy Exemptions Allowed in Policy*
Requirements for Unvaccinated HCP With Accepted Exemption
Consequences for Unvaccinated HCP Without Accepted Exemption
YES Medical, Religious Wear a mask Progressive discipline, potentially
including termination
DATA NOTES:
Specialty hospitals (rehabilitation and psychiatric hospitals) are not required to report CLABSI, CAUTI, or CLIP, be-cause they do not have ICU, nor SSI and surgical antimicrobial prophylaxis administration data, because they do not perform surgeries.
New Hampshire’s five rehabilitation and two psychiatric hospitals are only required to report influenza vaccination rates for patients and staff.
2016 HAI DATA REPORT
INFLUENZA VACCINATION POLICIES, 2016-2017 INFLUENZA SEASON
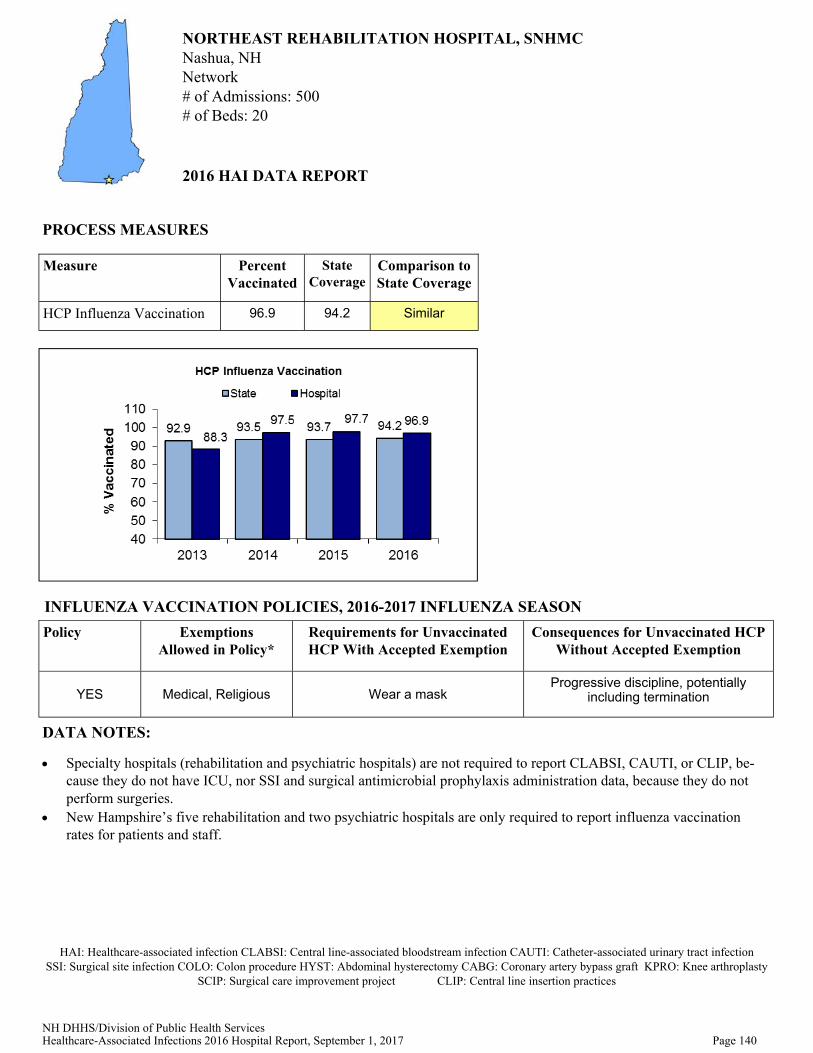
NH DHHS/Division of Public Health Services Healthcare-Associated Infections 2016 Hospital Report, September 1, 2017 Page 140
NORTHEAST REHABILITATION HOSPITAL, SNHMC Nashua, NH Network # of Admissions: 500 # of Beds: 20
PROCESS MEASURES
HAI: Healthcare-associated infection CLABSI: Central line-associated bloodstream infection CAUTI: Catheter-associated urinary tract infection SSI: Surgical site infection COLO: Colon procedure HYST: Abdominal hysterectomy CABG: Coronary artery bypass graft KPRO: Knee arthroplasty
SCIP: Surgical care improvement project CLIP: Central line insertion practices
2016 HAI DATA REPORT
Measure Percent Vaccinated
State Coverage
Comparison to State Coverage
HCP Influenza Vaccination 96.9 94.2 Similar
Policy Exemptions Allowed in Policy*
Requirements for Unvaccinated HCP With Accepted Exemption
Consequences for Unvaccinated HCP Without Accepted Exemption
YES Medical, Religious Wear a mask Progressive discipline, potentially
including termination
DATA NOTES:
Specialty hospitals (rehabilitation and psychiatric hospitals) are not required to report CLABSI, CAUTI, or CLIP, be-cause they do not have ICU, nor SSI and surgical antimicrobial prophylaxis administration data, because they do not perform surgeries.
New Hampshire’s five rehabilitation and two psychiatric hospitals are only required to report influenza vaccination rates for patients and staff.
INFLUENZA VACCINATION POLICIES, 2016-2017 INFLUENZA SEASON
State of New Hampshire Healthcare-Associated Infections 2016 Hospital Report
NH Department of Health and Human Services September 12, 2017 Division of Public Health Services
-141-
APPENDIX 1: Technical Notes
1. The majority of data in this report were extracted from NHSN on 6/1/2017; additional influenza vaccination data were extracted from other data sources on the same date. Changes or new infections reported by hospitals after this date are not reflected in this report.
2. The SSI, CLABSI, and CAUTI national comparison data used in this report came from the 2009 NHSN and 2014 NHSN reports, respectively. The 2009 NHSN report summarizes data reported to NHSN from 2006-2008. The 2014 NHSN report summarizes device-associated data reported
to NHSN January-December 2013. These reports are available at: http://www.cdc.gov/nhsn/datastat/index.html.
3. Rate data were appropriately risk-adjusted according to standard NHSN recommendations. Rates were only presented if appropriately risk-adjusted as follows:
a. CLABSI: rate data must be broken down and aggregated only by the same type of unit. b. CAUTI: rate data must be broken down and aggregated only by the same type of unit c. CLIP: currently there are no CDC recommendations for risk-adjusting CLIP data. d. SSI: In accordance with CDC recommendations and changes to NHSN methodology
beginning in 2010, rates are no longer presented.
4. Rates for any grouping were not presented if data were insufficient to generate a stable rate.
a. CLABSI: there must be at least 50 central line days in the denominator to present a rate.
b. CAUTI: there must be at least 50 catheter days in the denominator to present a rate. c. CLIP: there must be at least 20 insertions in the denominator to present a rate.
d. SSI: in accordance with CDC recommendations and changes to NHSN methodology beginning in 2010, rates are no longer presented.
5. SIR for any grouping were not presented if less than one infection was predicted.
6. All confidence intervals presented in this report are 95% confidence intervals. A confidence interval is a measure of certainty (usually with 95% confidence) of an estimate (such as a percentage). Because we can never obtain a hospital’s true “population” data (e.g., all patients for all time), we use statistical procedures to “estimate” various measurements using “sample” data. Since estimates have “variability” we use 95% confidence limits to describe the variability
around the estimate. The confidence interval gives us the range within which the TRUE value will fall 95% of the time, assuming that the sample data are reflective of the true population. If
the confidence intervals for the two rates overlap, then it is reasonably possible that the REAL rates are not different from one another.
7. Statistical significance is affected by sample size. If a value is almost or just barely significant,
just a few additional observations can push significance one way or the other.

State of New Hampshire Healthcare-Associated Infections 2016 Hospital Report
NH Department of Health and Human Services September 12, 2017 Division of Public Health Services
-142-
Standardized Infection Ratios
8. Calculating a SIR: The SIR is the number of observed infections divided by the number of predicted infections based on most recent national data. In order to calculate an SIR, it is
recommended that there be at least one predicted infection. See Appendix 3 for more information on the SIR.
9. Interpreting a SIR: The resulting SIR is a comparison between the number of observed
infections and the number predicted.
a. An SIR of 1.0 means that exactly the same number of infections was observed as was
predicted. b. An SIR of less than one means that fewer infections were observed than was predicted
(for example, SIR = 0.70 would be interpreted as 30% fewer infections observed than predicted).
c. An SIR of more than one means that fewer infections were observed than were predicted (for example, SIR = 1.30 would be interpreted as 30% more infections observed than predicted).
10. Calculating a corresponding confidence interval for a SIR: All hospital-specific SIR and
corresponding confidence intervals in this report were generated directly by NHSN using statistical methods similar to those described in Liddell FD. Simple exact analysis of the
standardized mortality ratio. Journal of Epidemiology and Community Health, 1984; 38:85-88.xi
11. Interpreting a SIR confidence interval: A confidence interval is a measure of certainty (usually
with 95% confidence) of an estimate (such as a SIR). Confidence intervals can be used to assess
whether differences in the number of observed and predicted infections is statistically significant (different or similar).
a. For confidence intervals that contain the value 1.0, the observed number of infections will be considered “Similar” to the predicted number of infections based on national
data (e.g., 0.27–1.49). b. For confidence intervals that are lower than and do not contain the value 1.0, the
observed number of infections will be considered "Lower" than the predicted number of infections based on national data (e.g., 0.13–0.74).
c. For confidence intervals that are higher than and do not contain the value 1.0, the observed number of infections will be considered "Higher" than the predicted number of infections based on national data (e.g., 1.09–2.63).
Infection Rates
12. Calculating a CLABSI rate: CLABSI rates are presented as the number of infections per 1,000
central line days.
CLABSI rate = (number of infections / number of central line days) x 1,000
13. Calculating a CAUTI rate: CAUTI rates are presented as the number of infections per 1,000 catheter days.

State of New Hampshire Healthcare-Associated Infections 2016 Hospital Report
NH Department of Health and Human Services September 12, 2017 Division of Public Health Services
-143-
CAUTI rate = (number of infections / number of catheter days) x 1,000
14. Interpreting a p-value: All hospital-specific rates and corresponding p-values in this report were generated directly by NHSN using Poisson statistical methods. State-level rates and
corresponding p-values were calculated by DHHS using exact methods. A p-value provides a statistical comparison of two values in order to determine whether those values are statistically different or similar. In this report, p-values are used to assess whether hospital infection rates are similar or different to national infection rates. A p-value of <0.05 would indicate the hospital rate is significantly different than the national rate.
a. If the p-value is ≥0.05, then the hospital rate would be considered statistically “Similar” to the national rate.
b. If the hospital rate is lower than the national rate and the p-value is <0.05, then the hospital rate would be considered significantly “Lower” than the national rate.
c. If the hospital rate is higher than the national rate and the p-value is <0.05, then the hospital rate would be considered significantly “Higher” than the national rate.
Process Measure Percentages
15. Calculating a CLIP adherence percentage: CLIP adherence percentages are presented as the number of insertions that met the adherence criteria divided by the total number of insertions
expressed as a percent.
CLIP adherence (%) = (number of insertions that met adherence criteria / total number of
insertions) x 100
16. Calculating an influenza vaccination percentage: Influenza vaccination percentages are
presented as the number of HCP vaccinated divided by the total number of HCP expressed as a percent.
Influenza vaccination (%) = (number of HCP vaccinated / total number of HCP) x 100
17. Calculating a surgical antimicrobial prophylaxis adherence percentage: Surgical antimicrobial prophylaxis adherence percentages are presented as the number of orders for which administration adhered to the measure (SCIP-1, SCIP-2, or SCIP-3) divided by the total number of orders expressed as a percent.
Surgical antimicrobial prophylaxis adherence (%) = (number of orders administered on time /
total number of orders) x 100
18. Calculating a corresponding confidence interval for a CLIP adherence percentage: Confidence intervals calculated for CLIP data presented in this report are mid-p exact 95% confidence intervals, which were calculated using a statistical software program.
19. Calculating a corresponding confidence interval for an influenza vaccination percentage:
Confidence intervals calculated for influenza vaccination data presented in this report are mid-p exact 95% confidence intervals, which were calculated using a statistical software program. In prior reports, confidence intervals for influenza vaccination data were Wald normal

State of New Hampshire Healthcare-Associated Infections 2016 Hospital Report
NH Department of Health and Human Services September 12, 2017 Division of Public Health Services
-144-
approximation 95% confidence intervals, however the method of calculating these confidence intervals were changed due to the addition of several hospitals with small numbers of HCP.
20. Calculating a corresponding confidence interval for a surgical antimicrobial prophylaxis
adherence percentage: Confidence intervals calculated for SCIP data presented in this report are Wald normal approximation 95% confidence intervals for national and State data, and mid-p exact 95% confidence intervals for hospital data, which were calculated using a statistical software program.
21. Interpreting a proportion confidence interval for central line insertion and vaccination data: A confidence interval is a measure of certainty (usually with 95% confidence) of an estimate
(such as a percentage). Confidence intervals can be used to assess whether differences in the percentages observed for each group (for example, hospital versus State) is statistically
significant. a. Confidence intervals that overlap the State confidence interval are considered "Similar"
to the overall State percentage. b. Confidence intervals that are lower than and do not overlap the State confidence
interval are considered "Lower" than the overall State percentage. c. Confidence intervals that are higher than and do not overlap the State confidence
interval are considered "Higher" than the overall State percentage.

State of New Hampshire Healthcare-Associated Infections 2016 Hospital Report
NH Department of Health and Human Services September 12, 2017 Division of Public Health Services
-145-
APPENDIX 2: Influenza Vaccination Survey Questions, 2016-2017 Season
1. Background information (facility and survey respondent)
2. How many patients were admitted to your hospital between October 1, 2016 and March
31, 2017? Include all patients that were admitted to your facility during this period, even if
they were admitted or moved during the influenza season.
2a. Total number of patient admissions
2b. Total number of patient admissions excluding readmissions
3. How many of the patients admitted to your facility between October 1, 2016 and March
31, 2017 received a seasonal influenza vaccination (at your facility or elsewhere) for the
2016-17 season? Influenza vaccine for a given influenza season may be available as early as
July or August. Include all immunized patients that received the 2016-17 vaccine product,
even if administered prior to October 1, 2016.
3a. Total number of patients immunized against influenza for the 2016-17 season
3b. Total number of patients not immunized against influenza for the 2016-17 season
4. How many of the patients admitted to your facility between October 1, 2016 and March
31, 2017 had ever received a pneumococcal disease vaccination (at your facility or
elsewhere)?
5. How many HCP worked or volunteered in your facility for at least one working day between
October 1, 2016 and March 31, 2017?
6. How many HCP received a seasonal influenza vaccination (at your facility or elsewhere) for
the 2016-17 season? Influenza vaccine for a given influenza season may be available as
early as July or August. Include all immunized HCP that received the 2016-17 vaccine
product, even if administered prior to October 1, 2016.
6a. Total number of HCP immunized against influenza for the 2016-17 season
6b. Total number of HCP not immunized against influenza for the 2016-17 season
7. Of the HCP not immunized against influenza for the 2016-17 influenza season, how many
HCP did not receive the seasonal influenza vaccine for each of the following reasons:
medical contraindication, religious, other (e.g., personal/philosophical), unknown?
8. Does your facility have a seasonal influenza vaccination policy? Such a policy means that
the facility requires all or some portion of HCPs working at that facility to receive a
seasonal influenza vaccine. If NO, skip to item 13.
8a. Yes, there is a policy currently in place
8b. No, but we are considering a policy 8c. No, and we are not considering a policy
8d. Other
9. If your facility has a seasonal influenza vaccination policy, what reasons for exemption are
acceptable (medical, religious, personal/philosophical, other)? Check all that apply.

State of New Hampshire Healthcare-Associated Infections 2016 Hospital Report
NH Department of Health and Human Services September 12, 2017 Division of Public Health Services
-146-
10. If your facility has a seasonal influenza vaccination policy, what do you require of
unvaccinated HCP with an acceptable reason for exemption (wear a mask, receive verbal
and/or written education, other)? Check all that apply.
11. If your facility has a seasonal influenza vaccination policy, what are the potential
consequences for unvaccinated HCP without an acceptable reason for exemption (wear a
mask, progressive discipline potentially including termination, receive verbal and/or
written education, other)? Check all that apply.
12. If your facility has a seasonal influenza vaccination policy, how many people were
terminated, suspended, resigned, or dismissed as a result of noncompliance with the policy
during the 2016-17 influenza season (terminated, temporarily suspended, resigned,
dismissed permanently)?
13. Does your facility offer the high-dose influenza vaccine?
14. Please enter any comments you would like to share.

State of New Hampshire Healthcare-Associated Infections 2016 Hospital Report
NH Department of Health and Human Services September 12, 2017
Division of Public Health Services -147-
APPENDIX 3: Understanding the Relationship between Healthcare-Associated Infection Rates and Standardized Infection Ratio Comparison Metrics HAI Elimination Metrics are very useful for performing evaluations.xii Several metrics are based on the science employed in NHSN. While national aggregate CLABSI data are published in the annual NHSN reports, these rates must be stratified by types of locations to be risk-adjusted. This scientifically sound risk-adjustment strategy creates a practical challenge to summarizing this information nationally, regionally, or even for an individual healthcare facility. For instance, when comparing CLABSI rates, there may be quite a number of different types of locations for which a CLABSI rate could be reported. This raises the need for a way to combine CLABSI rate data across locations.
A SIR can be used as an indirect standardization method for summarizing HAI experience across any number of stratified groups of data. To illustrate the method for using an SIR as an HAI comparison metric, the following example data are displayed below:
Risk Group Stratifier
Observed CLABSI Rates NHSN CLABSI Rates for 2016 (Standard Population)
Location Type #CLABSI #Central line-days CLABSI rate* #CLABSI #Central line-days CLABSI rate*
ICU 170 100,000 1.7 1200 600,000 2.0
WARD 58 58,000 1.0 600 400,000 1.5
SIR = 79.0287
228
87200
228
1000
5.1000,58
1000
2100000
58170
expected
observed
95% CI = (0.628 , 0.989)
*Defined as the number of CLABSI per 1000 central line days
In the table above, there are two strata to illustrate risk-adjustment by location type for which national data exist from NHSN. The SIR calculation is based on dividing the total number of observed CLABSI events by a “predicted” number using the CLABSI rates from the standard population. This “predicted” number is calculated by multiplying the national CLABSI rate from the standard population by the observed number of central line days for each stratum, which can also be understood as a prediction or projection. If the observed data represented a follow-up period, such as 2016, one would state that an SIR of 0.79 indicates that there was a 21% reduction in CLABSI overall for the nation, region, or facility.
The SIR concept and calculation is completely based on the underlying CLABSI rate data that exist across a potentially large group of strata. Thus, the SIR provides a single metric for performing comparisons rather than attempting to perform multiple comparisons across many strata which makes the task cumbersome.
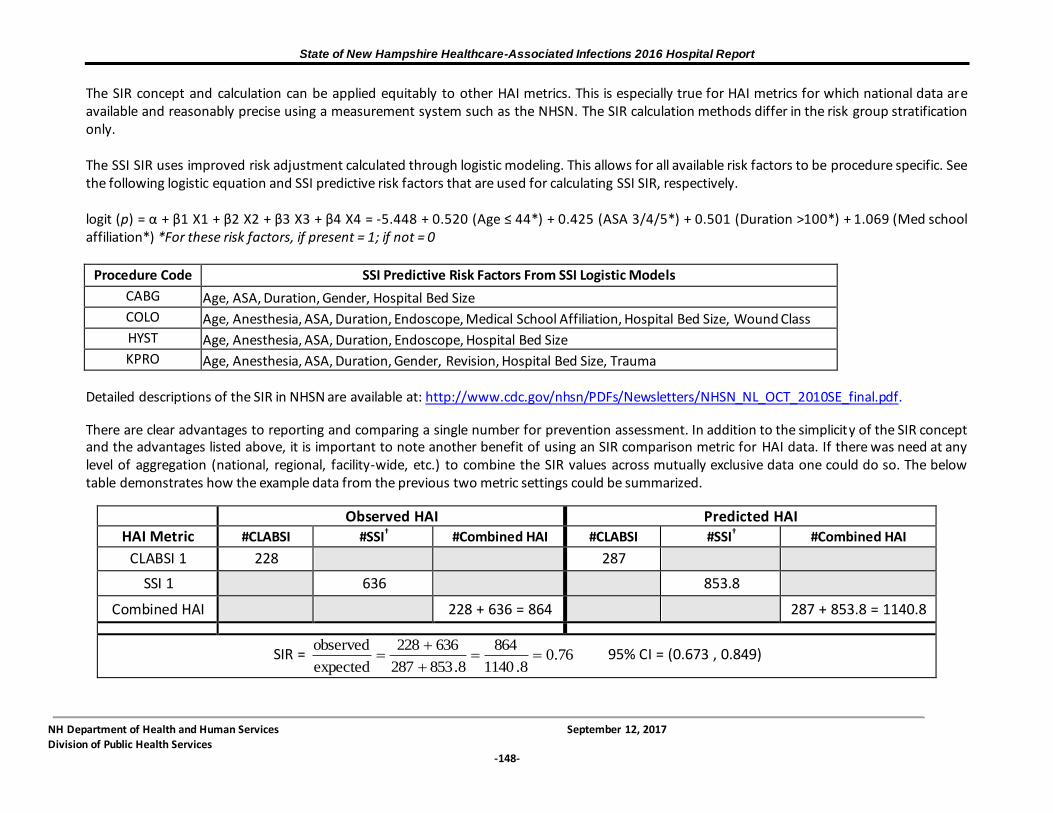
State of New Hampshire Healthcare-Associated Infections 2016 Hospital Report
NH Department of Health and Human Services September 12, 2017
Division of Public Health Services -148-
The SIR concept and calculation can be applied equitably to other HAI metrics. This is especially true for HAI metrics for which national data are available and reasonably precise using a measurement system such as the NHSN. The SIR calculation methods differ in the risk group stratification only. The SSI SIR uses improved risk adjustment calculated through logistic modeling. This allows for all available risk factors to be procedure specific. See the following logistic equation and SSI predictive risk factors that are used for calculating SSI SIR, respectively. logit (p) = α + β1 X1 + β2 X2 + β3 X3 + β4 X4 = -5.448 + 0.520 (Age ≤ 44*) + 0.425 (ASA 3/4/5*) + 0.501 (Duration >100*) + 1.069 (Med school affiliation*) *For these risk factors, if present = 1; if not = 0
Procedure Code SSI Predictive Risk Factors From SSI Logistic Models
CABG Age, ASA, Duration, Gender, Hospital Bed Size
COLO Age, Anesthesia, ASA, Duration, Endoscope, Medical School Affiliation, Hospital Bed Size, Wound Class
HYST Age, Anesthesia, ASA, Duration, Endoscope, Hospital Bed Size
KPRO Age, Anesthesia, ASA, Duration, Gender, Revision, Hospital Bed Size, Trauma Detailed descriptions of the SIR in NHSN are available at: http://www.cdc.gov/nhsn/PDFs/Newsletters/NHSN_NL_OCT_2010SE_final.pdf.
There are clear advantages to reporting and comparing a single number for prevention assessment. In addition to the simplicity of the SIR concept and the advantages listed above, it is important to note another benefit of using an SIR comparison metric for HAI data. If there was need at any level of aggregation (national, regional, facility-wide, etc.) to combine the SIR values across mutually exclusive data one could do so. The below table demonstrates how the example data from the previous two metric settings could be summarized.
Observed HAI Predicted HAI HAI Metric #CLABSI #SSI† #Combined HAI #CLABSI #SSI† #Combined HAI
CLABSI 1 228 287
SSI 1 636 853.8
Combined HAI 228 + 636 = 864 287 + 853.8 = 1140.8
SIR = 76.08.1140
864
8.853287
636228
expected
observed
95% CI = (0.673 , 0.849)

State of New Hampshire Healthcare-Associated Infections 2016 Hospital Report
NH Department of Health and Human Services September 12, 2017 Division of Public Health Services
-149-
APPENDIX 4: Preventing Healthcare-Associated Infections What You Can Do to Prevent Healthcare-Associated Infections There are several prevention tips you can follow all the time to reduce your chance of getting
an infection or spreading your infection to others. 1. Clean your hands.
Use soap and warm water. Rub your hands for at least 16 seconds. Rub your palms, fingernails, in between your fingers, and the backs of your hands.
If your hands do not look dirty, you can clean them with alcohol-based hand rub. Rub
the gel all over your hands, especially under your nails and between your fingers, until your hands are dry.
Clean your hands before touching or eating food. Clean them after you use the bathroom, take out the trash, change a diaper, visit someone who is ill, or play with a
pet.
2. Make sure healthcare providers clean their hands first, even if they wear gloves, before touching you or performinga procedure.
Doctors, nurses, dentists, and other healthcare providers come into contact with many bacteria and viruses. If you do not see your healthcare provider wash their hands or use an alcohol-based hand rub before they treat you, ask them if they have cleaned their hands.
Healthcare providers should wear clean gloves when they perform tasks such as taking
throat cultures, pulling teeth, taking blood, touching wounds or body fluids, while suctioning tubes, and examining your mouth or genetalia. Don’t be afraid to ask if they
should wear gloves.
3. Cover your mouth and nose.
Many diseases are spread through sneezes and coughs. When you sneeze or cough, the germs can travel three feet or more. Cover your mouth and nose to prevent the spread of infection to others.
Use a tissue. Keep tissues handy at home, at work, and in your pocket. Be sure to throw away used tissues and clean your hands after coughing or sneezing.
If you don’t have a tissue, cover your mouth and nose with the bend of your elbow or hands. If you use your hands, clean them right away.
4. If you are sick, avoid close contact with others.
If you are sick, stay away from other people or stay home. Don’t shake hands or touch others.
When you go for medical treatment, call ahead and ask if there is anything you can do to avoid infecting people in the waiting room.
5. Get shots to avoid disease and fight the spread of infection.
Make sure that your vaccinations are current—even for adults. Check with your doctor about shots you may need.
6. If you are prescribed an antibiotic for an illness, take them exactly as directed by your
doctor.

State of New Hampshire Healthcare-Associated Infections 2016 Hospital Report
NH Department of Health and Human Services September 12, 2017 Division of Public Health Services
-150-
Don’t take half-doses or stop before you complete your prescribed course even if you feel better. Not taking them as directed can lead to infections that become resistant to antibiotics, making them more difficult to treat.
What You Can Do to Help Prevent a Catheter-Associated Bloodstream Infection
Ask your doctors and nurses to explain why you need the catheter and how long you will have it.
Ask your doctors and nurses what infection prevention methods they will use during the catheter insertion.
Make sure that all doctors and nurses caring for you clean their hands with soap and
water or an alcohol-based hand rub before and after caring for you. If you do not see your providers clean their hands, please ask them to do so.
If the bandage comes off or becomes wet or dirty, tell your nurse or doctor immediately.
Inform your nurse or doctor if the area around your catheter is sore or red.
Do not let family and friends who visit touch the catheter or the tubing.
Make sure family and friends clean their hands with soap and water or an alcohol -based hand rub before and after visiting you.
Some patients are sent home from the hospital with a catheter in order to continue their treatment. If you go home with a catheter, your doctors and nurses will explain everything you need to know about taking care of your catheter.
o Make sure you understand how to care for the catheter before leaving the hospital. For example, ask for instructions on showering or bathing with the
catheter and how to change the catheter dressing.
o Make sure you know who to contact if you have questions after you get home.
o Make sure you wash your hands with soap and water or an alcohol-based hand
rub before handling your catheter.
o Watch for the signs and symptoms of catheter-associated bloodstream infection,
such as soreness or redness at the catheter site or fever, and call your healthcare provider immediately if any occur.
What Hospitals Do to Prevent Catheter-Associated Bloodstream Infections To prevent catheter-associated bloodstream infections, doctors and nurses will:
Choose a vein where the catheter can be safely inserted and where risk for infection is
small.
Clean hands with soap and water or alcohol-based hand rub before putting in the
catheter.
Wear a mask, cap, sterile gown, and sterile gloves when putting in the catheter to keep it sterile. The patient will be covered with a sterile sheet.
Clean the patient’s skin with an antiseptic cleanser before putting in the catheter.

State of New Hampshire Healthcare-Associated Infections 2016 Hospital Report
NH Department of Health and Human Services September 12, 2017 Division of Public Health Services
-151-
Clean hands, wear gloves, and clean the catheter opening with an antiseptic solution before using the catheter to draw blood or give medications. Healthcare providers also clean their hands and wear gloves when changing the bandage that covers the area where the catheter enters the skin.
Decide every day if the patient still needs to have the catheter. The catheter will be removed as soon as it is no longer needed.
What You Can Do to Help Prevent Catheter-Associated Urinary Tract Infections
Ask doctors to explain why you need the catheter and how long you will have it.
Make sure that your doctors and nurses caring for you clean their hands and use sterile
gloves for catheter insertion.
Make sure the tubing or bag is not on the floor. If it drops or is on the floor, ask for new
tubing or bag.
Ask doctors and nurses what infection prevention methods they will use during the catheter insertion.
Ask your doctors and nurses if you still need the catheter each day.
Always clean your hands before and after doing catheter care.
Always keep your urine bag below the level of your bladder.
Do not tug or pull on the tubing.
What Hospitals Do to Prevent Catheter-Associated Urinary Tract Infections
To prevent catheter-associated urinary tract infections, doctors and nurses will:
Put in catheters only when necessary and are removed as soon as possible.
Clean hands with soap and water or alcohol-based hand rub and put on sterile gloves before putting in the catheter.
Clean the skin where the catheter will be inserted.
Clean their hands before and after touching your catheter. If you do not see your providers clean their hands, please ask them to do so.
Avoid disconnecting the catheter and drain tube.
The catheter is secured to the leg to prevent pulling on the catheter.
Avoid twisting or kinking the catheter.
Keep the bag lower than the bladder.
Empty the bag regularly.
What You Can Do to Help Prevent Surgical Site Infections
Tell your doctor about other medical problems you may have. Health problems such as allergies, diabetes, and obesity could affect your surgery and your treatment.

State of New Hampshire Healthcare-Associated Infections 2016 Hospital Report
NH Department of Health and Human Services September 12, 2017 Division of Public Health Services
-152-
Quit smoking. Patients who smoke get more infections. Talk to your doctor about how you can quit before your surgery.
Do not shave near where you will have surgery. Shaving with a razor can irritate your skin and make it easier to develop an infection.
You may have some of your hair removed immediately before your surgery using electric clippers if the hair is in the same area where the procedure will occur, however you should not be shaved with a razor. Speak up if someone tries to shave you with a razor before surgery. Ask why you need to be shaved and talk with your surgeon if you have any concerns.
Ask if you will get antibiotics before surgery.
After your surgery, make sure that your healthcare providers clean their hands before examining you, either with soap and water or an alcohol-based hand rub. If you do not
see your providers clean their hands, please ask them to do so.
Family and friends who visit you should not touch the surgical wound or dressings and
prevent pets from coming into contact with your wound.
Family and friends should clean their hands with soap and water or an alcohol -based hand rub before and after visiting you. If you do not see them clean their hands, ask them to do so.
Before you go home, your doctor or nurse should explain everything you need to know about taking care of your wound. Make sure you understand how to care for your
wound before you leave the hospital. If you do develop an infection at the hospital, be sure to ask what type of infection you have, whether you need antibiotics for it, what
steps you should take to prevent it from spreading, and make plans for follow up care for the infection.
Always clean your hands before and after caring for your wound.
Before you go home, make sure you know who to contact if you have questions or problems after you get home.
If you have any symptoms of an infection, such as redness and pain at the surgery site, drainage, or fever, call your doctor immediately.
What Hospitals Do to Prevent Surgical Site Infections To prevent surgical site infections, doctors, nurses, and other healthcare providers:
Clean their hands and arms up to their elbows with an antiseptic agent before the surgery.
Clean their hands with soap and water or an alcohol-based hand rub before and after
caring for each patient.
May remove some of your hair immediately before your surgery using electric clippers if
the hair is in the same area where the procedure will occur. They should not shave you with a razor.
Wear special hair covers, masks, gowns, and gloves during surgery to keep the surgery area clean.

State of New Hampshire Healthcare-Associated Infections 2016 Hospital Report
NH Department of Health and Human Services September 12, 2017 Division of Public Health Services
-153-
Give you antibiotics before your surgery starts. In most cases, you should get antibiotics within 60 minutes before the surgery starts and the antibiotics should be stopped within 24 hours after surgery.
Clean the skin at the site of your surgery with a special soap that kills germs.
This information was adapted from materials developed by the Centers for Disease Control and
Prevention (CDC), the Association for Professionals in Infection Control and Epidemiology (APIC), the Joint Commission, and Society of Healthcare Epidemiology of America (SHEA).
Other useful resources
Access the New Hampshire Healthcare-Associated Infections (HAI) Program website for public reports, guidelines, and other materials at: http://www.dhhs.nh.gov/dphs/cdcs/hai/index.htm. For more information about HAI nationally and patient safety, visit the Centers for Disease Control and Prevention (CDC) website at: http://www.cdc.gov/HAI/ and http://www.cdc.gov/HAI/patientSafety/patient-safety.html. The Agency for Healthcare Quality and Research (AHRQ) has information for patients including care planning, diagnosis and treatment, and patient engagement. Visit their website at:
http://www.ahrq.gov/patients-consumers/index.html. The Society for Healthcare Epidemiology of America (SHEA) has several patient resources and guides. Visit their website at: http://www.shea-online.org/Patients.aspx. The Association of Professionals in Infection Control and Epidemiology (APIC) have infographics, eCards, and a quiz about HAI. Visit their website to learn more: http://consumers.site.apic.org/. To learn more about accreditation, certification and standards, visit the Joint Commission Website at: http://www.jointcommission.org/.

State of New Hampshire Healthcare-Associated Infections 2016 Hospital Report
NH Department of Health and Human Services September 12, 2017 Division of Public Health Services
-154-
APPENDIX 5: Map of New Hampshire Hospitals, 2017

State of New Hampshire Healthcare-Associated Infections 2016 Hospital Report
NH Department of Health and Human Services September 12, 2017 Division of Public Health Services
-155-
REFERENCES i The Centers for Disease Control and Prevention (CDC). Healthcare-Associated Infections Progress Report. March 33, 2015. Accessed online from: http://www.cdc.gov/HAI/progress-report/index.html.
ii Magill SS, Edwards JR, Bamberg W, et al. Multistate Point-Prevalence Survey of Health Care–Associated Infections. New England Journal of Medicine. 2014; 370: 1198-208.
iii Klevens, RM, Edwards RJ, Richards CL, Jr, et al. Estimating health care-associated infections and deaths in U.S. Hospitals, 2002. Public Health Reports. 2007; 122(2):160-166. Accessed online from: http://www.cdc.gov/ncidod/dhqp/pdf/hicpac/infections_deaths.pdf
iv Humphreys, H, Newcombe RG, Enstone J et al. Four Country Healthcare Associated Infection Prevalence Survey 2006: Risk Factor Analysis. Journal of Hospital Infection 2008; 69(3) 249-257.
v Scott R, Douglas. The Direct Medical Costs of hHealthcare-Associated Infections in US hospitals and the Benefits of Prevention. March 2009. Accessed online from: http://www.cdc.gov/ncidod/dhqp/pdf/Scott_CostPaper.pdf
vi Linda McKibben, MD,a Teresa Horan, MPH,b Jerome I. Tokars. Guidance on Public Reporting of
Healthcare-Associated Infections: Recommendations of the Healthcare Infection Control Practices Advisory Committee. American Journal of Infection Control. 2005;33:217-26. Accessed
online from: http://www.cdc.gov/ncidod/dhqp/pdf/hicpac/PublicReportingGuide.pdf vii The Healthcare-Associated Infection Working Group of the Joint Public Policy Committee.
Essentials of Public Reporting of Healthcare-Associated Infections: A Tool Kit. Accessed online from: http://www.cdc.gov/ncidod/dhqp/pdf/ar/06_107498_Essentials_Tool_Kit.pdf
viii Edwards JR, Peterson KD, Mu Y, et al. National Healthcare Safety Network (NHSN) report: Data summary for 2006 through 2008, issued December 2009. American Journal of Infection Control. 2009; 37:783-805. Accessed online from:
http://www.cdc.gov/nhsn/PDFs/dataStat/2009NHSNReport.pdf
ix Dudeck MA, Horan TC, Peterson KD, et al. National Healthcare Safety Network (NHSN) report: Data summary for 2011, issued April 2013. Accessed online from: http://www.cdc.gov/nhsn/PDFs/dataStat/NHSN-Report-2011-Data-Summary.pdf
x CDC. CDC. Pooled proportion of healthcare personnel reported as vaccinated in acute care hospital reporting to NHSN, by personnel group and state, 2015-2016 influenza season.
Accessed online from: https://www.cdc.gov/nhsn/pdfs/datastat/hcp-flu-vax-data-tables-hospitals-2016.pdf xi Liddell FD. Simple exact analysis of the standardised mortality ratio. Journal of Epidemiology and Community Health, 1984; 38:85-88.
xii CDC. Template for State Healthcare Associated Infections Plans. Accessed online from: http://www.cdc.gov/HAI/pdfs/stateplans/del.pdf
Note: referenced according to citation order of appearance within the report.