State of New Hampshire HEALTHCARE-ASSOCIATED ... DHHS/ Division of Public Health Services 1...
80
NH DHHS/ Division of Public Health Services 1 Healthcare-Associated Infections ASC 2013 Report August 2014 State of New Hampshire HEALTHCARE-ASSOCIATED INFECTIONS Ambulatory Surgery Center 2013 REPORT Prepared by New Hampshire Department of Health and Human Services Division of Public Health Services Infectious Disease Surveillance Section August 1, 2014
Transcript of State of New Hampshire HEALTHCARE-ASSOCIATED ... DHHS/ Division of Public Health Services 1...
NH DHHS/ Division of Public Health Services 1 Healthcare-Associated Infections ASC 2013 Report August 2014
State of New Hampshire
HEALTHCARE-ASSOCIATED INFECTIONS
Ambulatory Surgery Center
2013 REPORT
Prepared by
New Hampshire Department of Health and Human Services
Division of Public Health Services
Infectious Disease Surveillance Section
August 1, 2014

NH DHHS/ Division of Public Health Services 2 Healthcare-Associated Infections ASC 2013 Report August 2014
TABLE OF CONTENTS
LIST OF DATA TABLES AND FIGURES 3
ABBREVIATIONS USED 5
CONTRIBUTORS AND ACKNOWLEDGEMENTS 6
EXECUTIVE SUMMARY 7
INTRODUCTION 9
Background on Healthcare-Associated Infections 9
Healthcare-Associated Infections in Outpatient Settings 9
New Hampshire Healthcare-Associated Infections Program 9
State of New Hampshire Healthcare-Associated Infections Plan 10
Overview of Healthcare-Associated Infections Prevention Efforts 10
Healthcare-Associated Infections Technical Advisory Workgroup 11
SURVEILLANCE METHODS 13
Healthcare-Associated Infections Reporting Requirements 13
Selection of Reporting Requirements 13
Accuracy of Reported Healthcare-Associated Infections Surveillance Data 14 National Healthcare Safety Network 15
Comparisons with National Data 15
Surgical Site Infections Surveillance 15
Surgical IV Antimicrobial Prophylaxis Administration Monitoring 17
Influenza Vaccination Rate Monitoring 18
STATEWIDE DATA 20
Statewide Standardized Infection Ratios 20
Surgical Site Infections 26
Surgical IV Antimicrobial Prophylaxis Administration 31
Influenza Vaccination Rates 36
Mandatory Vaccination Policies for Healthcare Personnel 41
CONCLUSIONS 43
INDIVIDUAL AMBULATORY SURGERY CENTER REPORTS 44
APPENDIX 1: Technical Notes 72
APPENDIX 2: Understanding the Healthcare-Associated Infection Rate and Standardized Infection Ratio Comparison Metrics
75
APPENDIX 3: Prevention of Healthcare-Associated Infections 77
APPENDIX 4: Map of New Hampshire Ambulatory Surgical Centers (ASCs) 80
NH DHHS/ Division of Public Health Services Healthcare-Associated Infections ASC 2013 Report August 2014
3
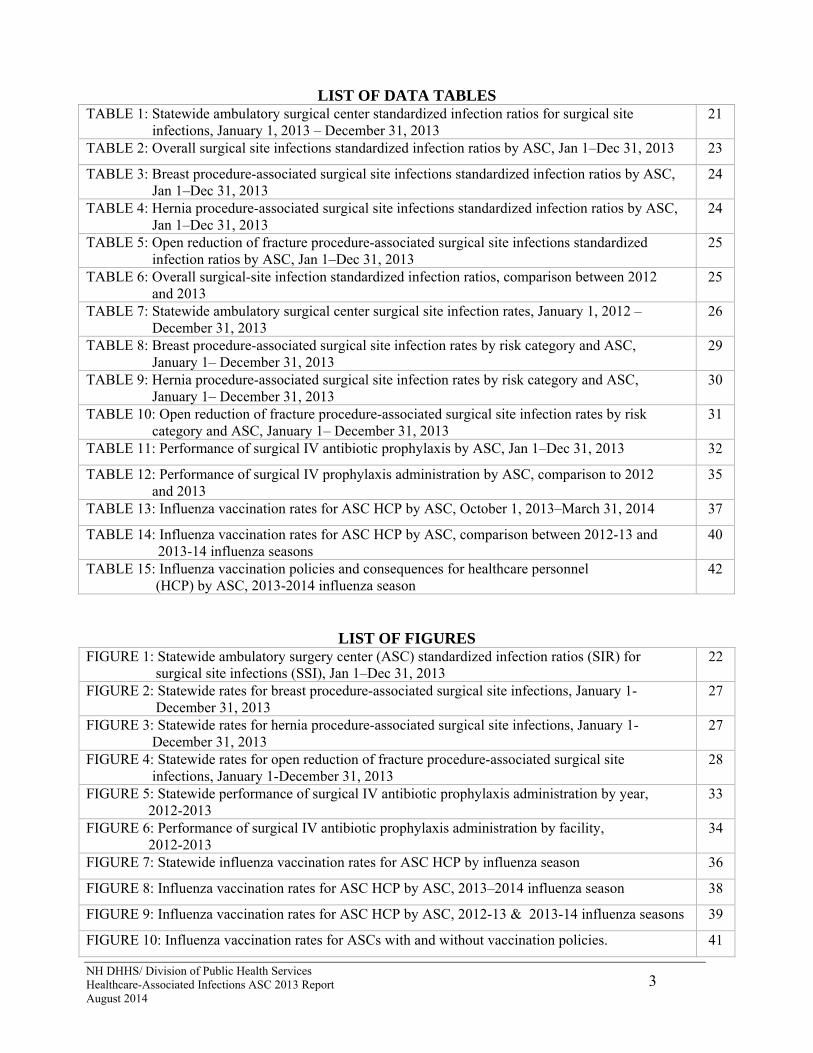
LIST OF DATA TABLES TABLE 1: Statewide ambulatory surgical center standardized infection ratios for surgical site infections, January 1, 2013 – December 31, 2013
21
TABLE 2: Overall surgical site infections standardized infection ratios by ASC, Jan 1–Dec 31, 2013 23
TABLE 3: Breast procedure-associated surgical site infections standardized infection ratios by ASC, Jan 1–Dec 31, 2013
24
TABLE 4: Hernia procedure-associated surgical site infections standardized infection ratios by ASC, Jan 1–Dec 31, 2013
24
TABLE 5: Open reduction of fracture procedure-associated surgical site infections standardized infection ratios by ASC, Jan 1–Dec 31, 2013
25
TABLE 6: Overall surgical-site infection standardized infection ratios, comparison between 2012 and 2013
25
TABLE 7: Statewide ambulatory surgical center surgical site infection rates, January 1, 2012 – December 31, 2013
26
TABLE 8: Breast procedure-associated surgical site infection rates by risk category and ASC, January 1– December 31, 2013
29
TABLE 9: Hernia procedure-associated surgical site infection rates by risk category and ASC, January 1– December 31, 2013
30
TABLE 10: Open reduction of fracture procedure-associated surgical site infection rates by risk category and ASC, January 1– December 31, 2013
31
TABLE 11: Performance of surgical IV antibiotic prophylaxis by ASC, Jan 1–Dec 31, 2013 32
TABLE 12: Performance of surgical IV prophylaxis administration by ASC, comparison to 2012 and 2013
35
TABLE 13: Influenza vaccination rates for ASC HCP by ASC, October 1, 2013–March 31, 2014 37
TABLE 14: Influenza vaccination rates for ASC HCP by ASC, comparison between 2012-13 and 2013-14 influenza seasons
40
TABLE 15: Influenza vaccination policies and consequences for healthcare personnel (HCP) by ASC, 2013-2014 influenza season
42
LIST OF FIGURES FIGURE 1: Statewide ambulatory surgery center (ASC) standardized infection ratios (SIR) for surgical site infections (SSI), Jan 1–Dec 31, 2013
22
FIGURE 2: Statewide rates for breast procedure-associated surgical site infections, January 1- December 31, 2013
27
FIGURE 3: Statewide rates for hernia procedure-associated surgical site infections, January 1- December 31, 2013
27
FIGURE 4: Statewide rates for open reduction of fracture procedure-associated surgical site infections, January 1-December 31, 2013
28
FIGURE 5: Statewide performance of surgical IV antibiotic prophylaxis administration by year, 2012-2013
33
FIGURE 6: Performance of surgical IV antibiotic prophylaxis administration by facility, 2012-2013
34
FIGURE 7: Statewide influenza vaccination rates for ASC HCP by influenza season 36
FIGURE 8: Influenza vaccination rates for ASC HCP by ASC, 2013–2014 influenza season 38
FIGURE 9: Influenza vaccination rates for ASC HCP by ASC, 2012-13 & 2013-14 influenza seasons 39
FIGURE 10: Influenza vaccination rates for ASCs with and without vaccination policies. 41
NH DHHS/ Division of Public Health Services Healthcare-Associated Infections ASC 2013 Report August 2014
4
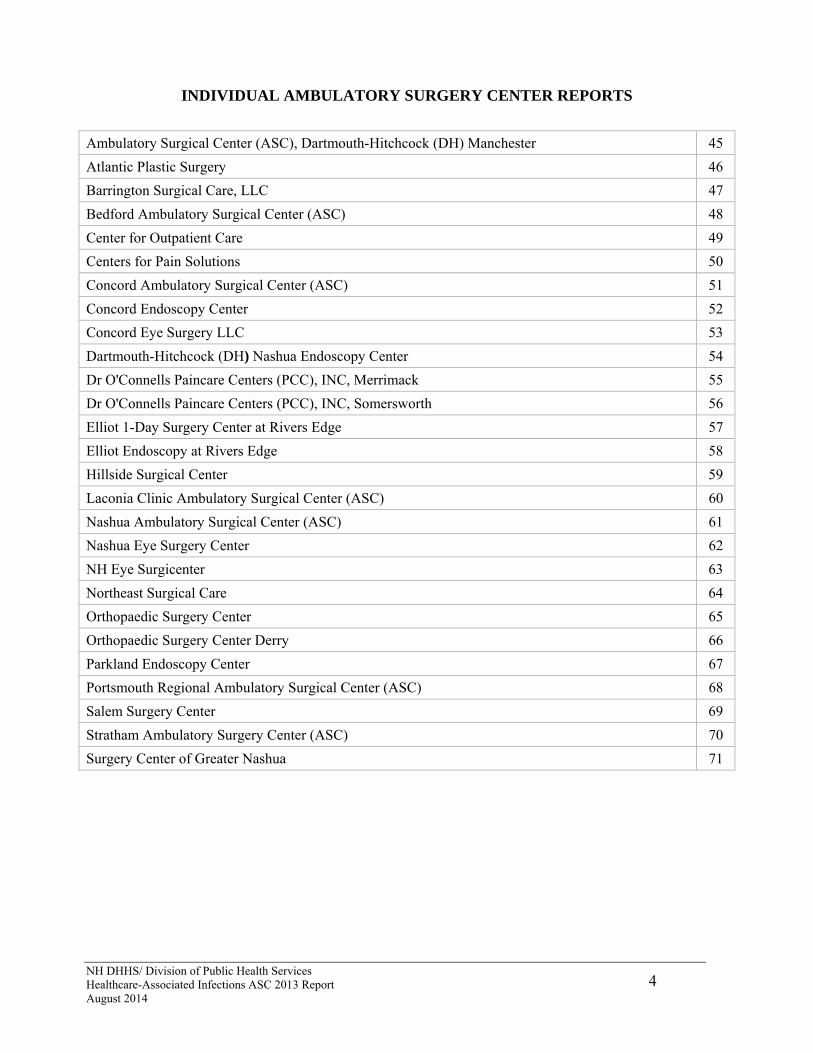
INDIVIDUAL AMBULATORY SURGERY CENTER REPORTS
Ambulatory Surgical Center (ASC), Dartmouth-Hitchcock (DH) Manchester 45
Atlantic Plastic Surgery 46
Barrington Surgical Care, LLC 47
Bedford Ambulatory Surgical Center (ASC) 48
Center for Outpatient Care 49
Centers for Pain Solutions 50
Concord Ambulatory Surgical Center (ASC) 51
Concord Endoscopy Center 52
Concord Eye Surgery LLC 53
Dartmouth-Hitchcock (DH) Nashua Endoscopy Center 54
Dr O'Connells Paincare Centers (PCC), INC, Merrimack 55
Dr O'Connells Paincare Centers (PCC), INC, Somersworth 56
Elliot 1-Day Surgery Center at Rivers Edge 57
Elliot Endoscopy at Rivers Edge 58
Hillside Surgical Center 59
Laconia Clinic Ambulatory Surgical Center (ASC) 60
Nashua Ambulatory Surgical Center (ASC) 61
Nashua Eye Surgery Center 62
NH Eye Surgicenter 63
Northeast Surgical Care 64
Orthopaedic Surgery Center 65
Orthopaedic Surgery Center Derry 66
Parkland Endoscopy Center 67
Portsmouth Regional Ambulatory Surgical Center (ASC) 68
Salem Surgery Center 69
Stratham Ambulatory Surgery Center (ASC) 70
Surgery Center of Greater Nashua 71
NH DHHS/ Division of Public Health Services Healthcare-Associated Infections ASC 2013 Report August 2014
5
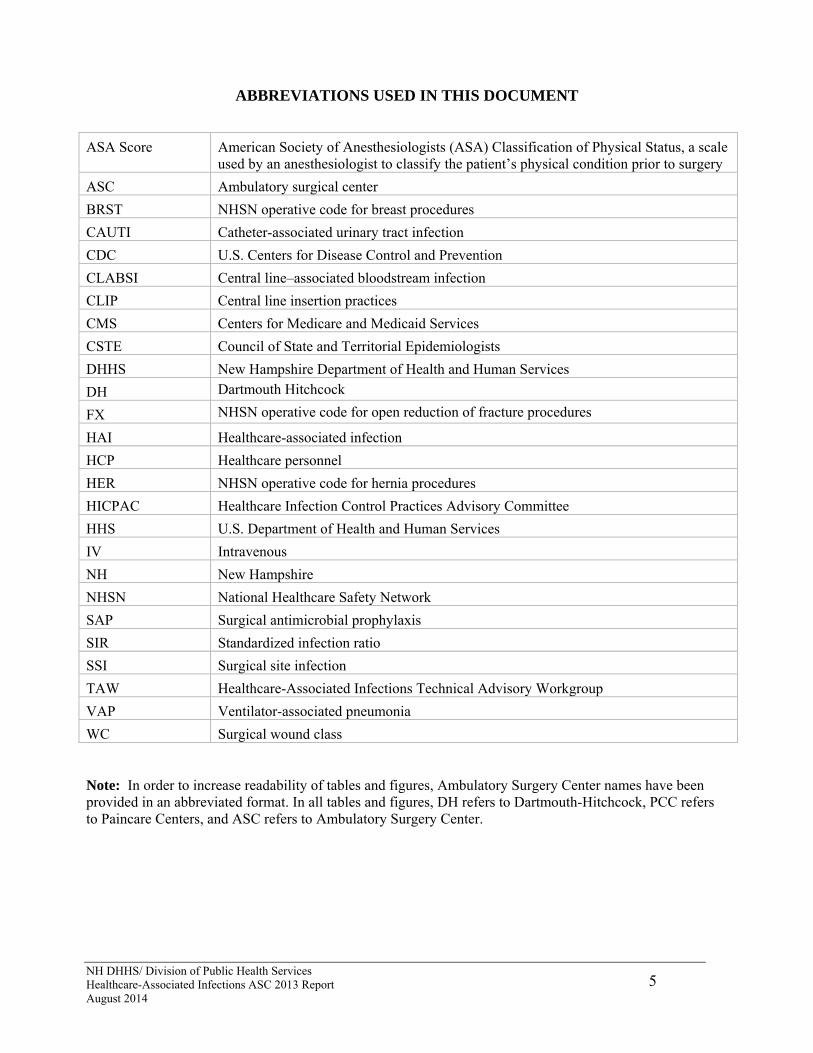
ABBREVIATIONS USED IN THIS DOCUMENT
Note: In order to increase readability of tables and figures, Ambulatory Surgery Center names have been provided in an abbreviated format. In all tables and figures, DH refers to Dartmouth-Hitchcock, PCC refers to Paincare Centers, and ASC refers to Ambulatory Surgery Center.
ASA Score American Society of Anesthesiologists (ASA) Classification of Physical Status, a scale used by an anesthesiologist to classify the patient’s physical condition prior to surgery
ASC Ambulatory surgical center
BRST NHSN operative code for breast procedures
CAUTI Catheter-associated urinary tract infection
CDC U.S. Centers for Disease Control and Prevention
CLABSI Central line–associated bloodstream infection
CLIP Central line insertion practices
CMS Centers for Medicare and Medicaid Services
CSTE Council of State and Territorial Epidemiologists
DHHS New Hampshire Department of Health and Human Services
DH Dartmouth Hitchcock
FX NHSN operative code for open reduction of fracture procedures
HAI Healthcare-associated infection
HCP Healthcare personnel
HER NHSN operative code for hernia procedures
HICPAC Healthcare Infection Control Practices Advisory Committee
HHS U.S. Department of Health and Human Services
IV Intravenous
NH New Hampshire
NHSN National Healthcare Safety Network
SAP Surgical antimicrobial prophylaxis
SIR Standardized infection ratio
SSI Surgical site infection
TAW Healthcare-Associated Infections Technical Advisory Workgroup
VAP Ventilator-associated pneumonia
WC Surgical wound class
NH DHHS/ Division of Public Health Services Healthcare-Associated Infections ASC 2013 Report August 2014
6
CONTRIBUTORS AND ACKNOWLEDGEMENTS
The following individuals contributed to analysis of data and other content provided in this report:
Christine Adamski, MS, Chief, Bureau of Infectious Disease Control
Steffany J. Cavallo, MPH, CPH, Infectious Disease Epidemiologist
Elizabeth R. Daly, MPH, Chief, Infectious Disease Surveillance Section
Katrina E. Hansen, MPH, Healthcare-Associated Infections Program Manager
Erin Metcalf, MPH, HIV/AIDS Surveillance Coordinator
Elizabeth A. Talbot, MD, Deputy State Epidemiologist
Roza Tammer, MPH, Healthcare-Associated Infections Surveillance Coordinator
Tylor Young, GIS Analyst, Infectious Disease Surveillance Section
The HAI Program would also like to thank the Infection Prevention, Quality, and Information Technology staff at New Hampshire ambulatory surgery centers for collaborating to provide the data presented in this report. Finally, the HAI Program acknowledges the review, comments, input, and other program contributions provided by the members of the HAI Technical Advisory Workgroup as listed on page 12.
For questions about this report, please contact:
NH Healthcare-Associated Infections Program
Infectious Disease Surveillance Section
Division of Public Health Services
NH Department of Health and Human Services
29 Hazen Drive, Concord, NH 03301-6504
Phone: (603) 271-4496
Email: [email protected]
Website: http://www.dhhs.nh.gov/dphs/cdcs/hai/index.htm
NH DHHS/ Division of Public Health Services Healthcare-Associated Infections ASC 2013 Report August 2014
7
EXECUTIVE SUMMARY
A healthcare-associated infection (HAI) is an infection that a patient acquires during the course of receiving treatment for another condition within a healthcare setting. In 2011, HAIs caused an estimated 722,000 HAIs and 75,000 deaths in U.S. acute care hospitals. During the 2011 legislative season, the New Hampshire Legislature passed a bill amending NH RSA 151:32-35, to require ambulatory surgery centers to identify, track, and report selected HAIs to the NH Department of Health and Human Services (DHHS). All licensed ambulatory surgery centers (ASC) began reporting data to DHHS on one infection and two process measures in July 2011. This report represents the second summary of HAI-related data reported by ASCs in NH. Healthcare-Associated Infections in NH Ambulatory Surgery Centers Overall, statewide infection rates were lower than predicted based on national data. A total of six surgical site infections (SSIs) were reported by the 16 ASCs that were licensed for the entire 2013 calendar year and were required to report these data. The overall observed number of SSI in NH ASCs was 25% fewer than predicted based on national data. Only three ASCs had robust enough data to present ASC-specific standardized infection ratios (SIR) in this report for selected procedures. Of these three facilities, all observed a similar number of infections as predicted based on national data. However, 13 ASCs had sufficiently robust data to present procedure-specific rate data. All ASCs had a similar rate to national data for all procedure categories presented. Surgical Site Infections Sixteen ASCs reported SSI data for three surgical procedures.
Breast Procedures (BRST): Ten ASCs performed breast procedures. Four surgical site infections following breast procedures were reported, a number considered similar to the predicted number of infections based on national data.
Hernia Procedures (HER): Eight ASCs performed hernia procedures though none had sufficiently robust data to present a standardized infection ratio. No surgical site infections following hernia procedures were reported. Overall, surgical site infection rates were similar to national data.
Open Reduction of Fracture Procedures (FX): Ten ASCs performed open reduction of fracture procedures though none had sufficiently robust data to present a standardized infection ratio. Two surgical site infections following open reduction were reported, a number considered similar to the predicted number of infections based on national data.
Surgical Antimicrobial Prophylaxis Administration Twenty-five ASCs that administer intravenous (IV) surgical antimicrobial prophylaxis were licensed for the entire 2013 calendar year and were required to report IV surgical antimicrobial prophylaxis administration data. Overall, ASCs provided IV surgical antimicrobial prophylaxis within the appropriate timeframe prior to the procedure for 98.3% of procedures. Only 18 ASCs had robust enough data to present ASC-specific IV surgical antimicrobial prophylaxis administration data. Of these 18 facilities, three ASCs observed lower adherence, three ASCs observed higher adherence, and 12 observed similar adherence compared to the state adherence percentage.

NH DHHS/ Division of Public Health Services Healthcare-Associated Infections ASC 2013 Report August 2014
8
Influenza Vaccination Rates in ASC Healthcare Personnel (HCP) Twenty-seven ASCs were licensed at any point during the 2013-14 influenza season and were required to report HCP influenza vaccination rates. Vaccination rates by ASC ranged from 50.0% to 100.0%, and the overall State rate in ASCs was 88.7%. Fourteen ASCs had vaccination rates similar to the overall State ASC vaccination rate, six ASCs reported vaccination rates that were significantly higher than the overall State ASC vaccination rate, and seven ASCs reported vaccination rates that were significantly lower than the overall State ASC vaccination rate. This second report of ASC HAI data is an important part of continuing progress toward the goal of eliminating HAIs in NH. This report provides a picture of selected HAI data, which can be used by healthcare facilities in the State to identify areas for improvement and prevention as well as healthcare consumers to make informed healthcare decisions.

NH DHHS/ Division of Public Health Services Healthcare-Associated Infections ASC 2013 Report August 2014
9
INTRODUCTION Background on Healthcare-Associated Infections
A healthcare-associated infection (HAI) is an infection that a patient acquires during the course of receiving treatment for another condition within a healthcare setting. HAIs caused an estimated 722,000 HAIs and 75,000 deaths in U.S. acute care hospitals in 20111. Previous studies depict higher numbers of HAIs; 1.7 million infections and 99,000 deaths each year2. By these estimates, HAIs are among the top 10 leading causes of death in the United States, and 5–10% of all hospital admissions are complicated by HAI.3 The economic burden of HAIs is substantial and increasing. The total cost of HAIs has been estimated at $33 billion per year in US hospitals4. The most common HAIs are pneumonia, gastrointestinal illness, primary bloodstream infections (BS), surgical site infection (SSI), and other types of infections1. Surgical site infections (SSIs) are estimated to cause 244,385 infections and cost 3.45 to 10.07 billion dollars annually.1,3 Healthcare-Associated Infections in Outpatient Settings
Ambulatory surgery centers (ASC) are a growing and important healthcare setting. In recent decades, healthcare delivery has shifted from acute care hospitals to a variety of outpatient and ambulatory settings. More than three quarters of all operations in the U.S. are performed on an outpatient basis5. ASCs provide approximately 40% of all Medicare outpatient surgeries and perform more than 25 million procedures a year. There are more than 5,300 Medicare-certified ASCs in the US and they most commonly perform cataract surgery, gastrointestinal endoscopies and pain management.6 Medical care in outpatient settings has increased in recent years, but past outbreak investigations by CDC and other states have identified poor infection control prevention practices including problems with injection safety, reprocessing, sterilization, and disinfection6. Furthermore, ASCs often have limited numbers of dedicated infection preventionists with specialized training, no standard method for identifying infections within 30 or 90 days following a procedure, and varying degree of electronic medical records and information technology support. With ASCs playing such an important role in the current healthcare delivery system, it is critical that they follow guidelines and take measures to minimize the risk of HAI. New Hampshire Healthcare-Associated Infections Program
The NH Department of Health and Human Services (DHHS) has been actively engaged in developing NH Legislature passed a bill creating NH RSA 151:32-35, which requires hospitals to identify, track, and report HAIs to DHHS. The passage of the 2006 bill did not include funding to carry out these activities, and therefore, mandatory reporting was not fully implemented until
1 Magill SS, Edwards JR, Bamberg W, et al. Multistate Point-Prevalence Survey of Health Care–Associated Infections. N Engl J Med 2014;370:1198-208. 2 Klevens, RM, Edwards RJ, Richards CL, Jr, et al. Estimating health care-associated infections and deaths in U.S. Hospitals, 2002. Public Health Rep 2007:122(2):160-166. http://www.cdc.gov/ncidod/dhqp/pdf/hicpac/infections_deaths.pdf 3 Humphreys, H, Newcombe RG, Enstone J et al. Four country healthcare associated infection prevalence survey 2006: risk factor analysis. J Hosp Infect 2008; 69(3) 249-257. 4 Scott R, Douglas. The direct medical costs of healthcare-associated infections in US hospitals and the benefits of prevention. March 2009. http://www.cdc.gov/ncidod/dhqp/pdf/Scott_CostPaper.pdf 5 Guide to Infection Prevention for Outpatient Settings: Minimum Expectations for Safet Care. Prepared by the Centers for Disease Control and Prevention (CDC). http://www.cdc.gov/HAI/settings/outpatient/outpatient-care-guidelines.html 6 Ambulatory Surgery Center Association. http://www.ascassociation.org/ASCA/AboutUs/WhatisanASC
NH DHHS/ Division of Public Health Services Healthcare-Associated Infections ASC 2013 Report August 2014
10
January 2009. The intent of the law is to provide HAI data by hospital or ASC in a publicly accessible forum for facility comparison.
During the 2010 legislative season, the NH Legislature passed HB 1548 (2010) amending RSA 151:32-35 to require all licensed ambulatory surgical centers ASCs to report HAI to DHHS. In 2010, DHHS notified the 26 ASCs in NH that they would be required to report the mandated HAI data beginning July 1, 2011. DHHS, with consideration of the law, required that ASCs report the following measures:
Surgical site infections following breast, hernia, and open reduction of fracture procedures (via NHSN).
Surgical IV antimicrobial prophylaxis administration (via DHHS template)
Influenza vaccination in staff (via DHHS web survey)
Only those ASCs that performed the selected surgical procedures are required to enroll and report data to the National Healthcare Safety Network (NHSN). Only those ASCs that administered IV surgical antimicrobial prophylaxis are required to report administration data. All ASCs are required to report influenza vaccination in staff. All ASCs required to report SSI successfully enrolled in NHSN and began reporting the required data in July 2011. Other ASCs (endoscopy, opthalmology, and pain centers) did not enroll in NHSN because they did not perform any of the required procedures and were selected to report IV antibiotic administration and influenza vaccination rates as applicable.
State of New Hampshire Healthcare-Associated Infections Plan
In response to increasing concerns about the public health impact of HAIs, the US Department of Health and Human Services (HHS) developed an Action Plan to Prevent Healthcare-Associated Infections (HHS Action Plan) in 2009. The HHS Action Plan includes recommendations for surveillance, research, communication, and metrics for measuring progress toward national goals. In a concurrent development, the 2009 Omnibus bill required states receiving Preventive Health and Health Services Block Grant funds to certify that they would submit a plan to reduce HAIs to the Secretary of Health and Human Services not later than January 1, 2010. In order to assist states in responding within the short timeline required by that language and to facilitate coordination with national HAI prevention efforts, the CDC provided a template to assist state planning efforts in the prevention of HAI. The template targeted four areas: 1) Development or Enhancement of HAI Program Infrastructure, 2) Surveillance, Detection, Reporting, and Response, 3) Prevention, and 4) Evaluation, Oversight, and Communication. In 2009, DHHS drafted a State HAI plan and submitted it to HHS. New Hampshire’s State HAI Plan is available on the DHHS HAI website at: http://www.dhhs.nh.gov/dphs/cdcs/hai/index.htm. Overview of Healthcare-Associated Infections Prevention Efforts
DHHS participates in statewide prevention activities through the New Hampshire Health Care Quality Assurance Commission (NHHCQAC), on which the DHHS State Epidemiologist serves. Currently there are no specific prevention activities being coordinated directly by DHHS, however, DHHS remains an active partner in various projects coordinated by the NHHCQAC and the Northeast Health Care Quality Foundation. Major statewide initiatives through these organizations have included hand hygiene campaigns, patient safety checklists, and programs to prevent
NH DHHS/ Division of Public Health Services Healthcare-Associated Infections ASC 2013 Report August 2014
11
bloodstream infections, antimicrobial resistance, and Clostridium difficile infections. Additionally, the Foundation for Healthy Communities received a large grant through the Partnership for Patients program to conduct additional large, statewide prevention initiatives. For additional information on these various efforts, the following websites may be helpful: New Hampshire Health Care Quality Assurance Commission http://www.healthynh.com/fhc-initiatives/nh-health-care-quality-assurance-commission.html Foundation for Healthy Communities Partnership for Patients http://www.healthynh.com/partnership-for-patients.html Northeast Health Care Quality Foundation http://www.nhcqf.org/ In addition to supporting and engaging in prevention activities with patient safety groups, the state HAI program provides many educational opportunities to healthcare facilities across the state in order to share best practices for infection prevention and ultimately reduce HAI. The program is involved in many infection prevention initiatives and continues to work with partners to improve healthcare quality across the continuum of care. Healthcare-Associated Infections Technical Advisory Workgroup
In the spring of 2009, DHHS formed an HAI Technical Advisory Workgroup (TAW). The purpose of the TAW is to provide scientific and infection prevention expertise to the DHHS HAI Program. The TAW meets quarterly, and is not an oversight group, but instead a forum for stakeholder participation in decision-making around NH HAI Program activities. The TAW is currently a 20-member group that includes representation from stakeholders across NH and includes representatives from various sizes and types of hospitals and ASCs, infection control associations, a consumer advocate, the New Hampshire Hospital Association, the New Hampshire Healthcare Quality Assurance Commission, the New Hampshire Ambulatory Surgery Association, and the Northeast Health Care Quality Foundation (see page 12 for a list of TAW members during the 2013 reporting year).

NH DHHS/ Division of Public Health Services 12 Healthcare-Associated Infections ASC 2013 Report August 2014
New Hampshire Healthcare-Associated Infections Technical Advisory Workgroup, 2013
Members Organization Representation
Beth Daly, MPH DHHS, Infectious Disease Surveillance Section Chief
Sharon Alroy-Preis, MD, MPH* DHHS, State Epidemiologist
Katrina Hansen, MPH DHHS, HAI Program Coordinator
Michael Fleming DHHS, Health Facilities Administration
Joe Conley, COO Concord Hospital (New Hampshire Hospital Association)
Anne Nolan, RN, BSN, CIC Cheshire Hospital (New Hampshire Hospital Association)
Anne Diefendorf, MS,RD, LD New Hampshire Health Care Quality Assurance Commission
Lynda Caine, RN, MPH, CIC Concord Hospital (New Hampshire Infection Control and Epidemiology Professionals)
Kathy Kirkland, MD Dartmouth-Hitchcock Medical Center (Society for Healthcare Epidemiology of America)
Jan Larmouth, MS, CIC Southern New Hampshire Medical Center (Acute Care)
Elissa Malcolm, MS Dartmouth-Hitchcock Medical Center (Acute Care)
Darlene Burrows, RN, BSN, CIC Franklin Regional Hospital (Critical Access)
Charlie White, COO Upper Connecticut Valley Hospital (Critical Access)
Cathy Martin, CPRN Northeast Rehabilitation (Rehabilitation)
Terri Kangas-Feller, BS, RN, CIC
New Hampshire Hospital (Psychiatric)
Tanya Lord, MPH, PHD Consumer Representative
Donna Quinn, RN, BSN, MBA Orthopaedic Surgery Center (Ambulatory Surgical Center)
Robin Sheppard, RN Bedford Ambulatory Surgical Center (Ambulatory Surgical Center)
Beverly Primeau, RN, MBA Concord ASC (New Hampshire Ambulatory Surgery Association)
Margaret Crowley, RN, PHD Northeast Health Care Quality Foundation (QIO)
* Served on the HAI TAW for part of 2013.

NH DHHS/ Division of Public Health Services 13 Healthcare-Associated Infections ASC 2013 Report August 2014
SURVEILLANCE METHODS 2013 Healthcare-Associated Infections Reporting Requirements
Reporting requirements are governed by RSA 151:33 with authority given to DHHS to develop administrative rules to provide specific reporting instructions and methodology. Administrative rules, He-P 309 Healthcare Associated Infections, were drafted in 2010 with stakeholder input and approved January 14, 2011 by the Joint Legislative Committee on Administrative Rules. Reporting requirements for 2012-2013 included the following required measures for ASCs:
Surgical site infections following breast, hernia, and open reduction of fracture procedures.
Surgical IV antimicrobial prophylaxis administration
Influenza vaccination in staff
While all licensed ASCs are required to report the selected measures under RSA 151:33, some ASCs (endoscopy, ophthalmology, and pain centers), that do not perform the selected surgeries or provide IV antibiotic prophylaxis do not report SSI or antibiotic prophylaxis measures. Two ASCs in NH (ophthalmology) are only required to report influenza vaccination rates for healthcare workers. Selection of Reporting Requirements
RSA 151:33 broadly requires reporting of all SSI in ASCs; however, it is not feasible to perform surveillance for all of these infections using NHSN. In order to generate infection rates for ASCs and compare them with national data, infection reporting needed to be limited to the capabilities of NHSN and were selected in accordance with national recommendations for HAI surveillance in the context of public reporting. In 2005, the CDC released a report titled “Guidance on Public Reporting of Healthcare-Associated Infections: Recommendations of the Healthcare Infection Control Practices Advisory Committee” (HICPAC).7 The group recommended selecting outcome measures for reporting based on the frequency, severity, and preventability of the outcomes and the likelihood that they can be detected and reported accurately. Applicable to ASCs, the group recommended monitoring the following:
Surgical site infections following selected operations
Surgical antimicrobial prophylaxis
Influenza vaccination of healthcare personnel In 2008, the Healthcare-Associated Infection Working Group of the Joint Public Policy Committee released “Essentials of Public Reporting of Healthcare-Associated Infections: A Tool Kit.”8 The Healthcare-Associated Infection Working Group of the Joint Public Policy Committee is a multi-organizational group represented by the Association for Professionals in Infection Control and 7 Linda McKibben, MD,a Teresa Horan, MPH,b Jerome I. Tokars. Guidance on Public Reporting of Healthcare-Associated Infections: Recommendations of the Healthcare Infection Control Practices Advisory Committee (Am J Infect Control 2005;33:217-26.) http://www.cdc.gov/ncidod/dhqp/pdf/hicpac/PublicReportingGuide.pdf 8 Essentials of Public Reporting of Healthcare-Associated Infections: A Tool Kit. Prepared by the Healthcare-Associated Infection Working Group of the Joint Public Policy Committee http://www.cdc.gov/ncidod/dhqp/pdf/ar/06_107498_Essentials_Tool_Kit.pdf

NH DHHS/ Division of Public Health Services Healthcare-Associated Infections ASC 2013 Report August 2014
14
Epidemiology, CDC, Council of State and Territorial Epidemiologists, and Society for Healthcare Epidemiology of America. The toolkit recommends monitoring the following measures applicable to ASCs:
Surgical site infections that are performed with adequate frequency to permit meaningful comparisons among institutions.
The working group agreed with most of CDC/HICPAC document, “Guidance on Public Reporting of Healthcare-Associated Infections” (referenced above).
Healthcare worker influenza vaccination rates.
Within the context of RSA 151:33, NH DHHS surveyed ASCs and reviewed national guidelines, including National Quality Forum (NQF) endorsed measures, and capabilities of NHSN in selecting outcome and process measures. It is expected that these reporting requirements may change in the future as we learn from public reporting, as HAI epidemiology changes, and as new surveillance methods and reporting technologies become available. Accuracy of Reported Healthcare-Associated Infections Surveillance Data NH DHHS conducted a validation study of 2009-2010 hospital data to assess the degree of under- and over-reporting and to provide additional training to address any common or systematic errors in reporting processes. DHHS has not been able to validate ASC data due to limited resources, including lack of a nationally-developed plan to validate outpatient surgery data. The 2013 data presented in this report have not been validated and must be interpreted with the understanding that, in general, there are both under- and over-reporting of HAI. Several processes are used to ensure that these 2013 data are as accurate as possible within the current resources and reporting processes available. First, DHHS selected NHSN for mandatory reporting, which requires the use of standardized infection definitions and reporting methodologies. Second, DHHS analyzed and reviewed all data reported for 2013 from each ASC. This review identified any obvious reporting errors or internal inconsistencies that suggested errors. Third, DHHS provided preliminary data reports to each ASC with the request to confirm accuracy. This reconciliation process was iterative until all ASCs made corrections and agreed to the reported data. Despite the above measures, there are several limitations to the reporting methods that may limit comparison of data across ASCs. Definitions for classifying an infection as healthcare-associated are standardized through the use of NHSN; however, methods to identify the infection in each ASC are not. Identifying patients who develop SSI after discharge from the ASC can be difficult, and each ASC may use a different method of post-discharge surveillance (e.g., letters to surgeons, conducting chart reviews for surgical patients, post-operative office visits, etc.). These different approaches may result in different capacities for detection of SSI at each facility. This poses a challenge for data interpretation, because a higher SSI rate at a given ASC may represent either poor infection prevention practices or, conversely, a better system for identifying infections after the patient is discharged.

NH DHHS/ Division of Public Health Services Healthcare-Associated Infections ASC 2013 Report August 2014
15
National Healthcare Safety Network
NHSN is a voluntary, secure, internet-based surveillance system for healthcare facilities to monitor patient safety and infection prevention measures. Enrollment is open to all types of healthcare facilities in the United States. DHHS has selected the use of NHSN as the method for NH hospitals and ASCs to report HAI surveillance data. NHSN was selected because it is widely used across the entire United States, it offers already-developed and accepted surveillance definitions and methods, it provides national comparison data, and there is no cost to use or join the system. More information about NHSN is available at: http://www.cdc.gov/nhsn/index.html Comparisons with National Data
All SSI comparisons with national data use 2006–2008 NHSN data published in the “National Healthcare Safety Network (NHSN) report: Data summary for 2006 through 2008, issued December 2009.”9 This report is available at:
http://www.cdc.gov/nhsn/PDFs/dataStat/2009NHSNReport.PDF Surgical Site Infections Surveillance
A SSI is an infection that develops at the site of a surgical procedure. There are different ways to classify an SSI, such as whether they develop superficially, in deep tissue, or in the organ/space. The infection must develop within 30 days of the procedure; however, monitoring for an SSI must occur for 90 days following some designated procedures (e.g., breast augmentation or hernia procedures requiring mesh). In 2013, ASCs were required to monitor and report SSI for three procedures:
Breast Surgery (excision of lesion or tissue of breast including radical, modified, or quadrant resection, lumpectomy, incisional biopsy, or mammoplasty)
o NHSN Operative Procedure BRST (CPT codes: 19101, 19112, 19120, 19125, 19126, 19300-19307, 19316, 19318, 19324, 19325, 19328, 19330, 19340, 19342, 19350, 19355, 19357, 19361, 19364, 19366-19371, 19380)
Hernia Surgery (repair of inguinal, femoral, umbilical, or anterior abdominal wall hernia; does not include repair of diaphragmatic or hiatal hernia or hernias at other body sites)
o NHSN Operative Procedure HER (CPT codes: 49491, 49492, 49495, 49496, 49500, 49501, 49505, 49507, 49520, 49521, 49525, 49550, 49553, 49555, 49557, 49560, 49561, 49565, 49566, 49568, 49570, 49572, 49580, 49582, 49585, 49587, 49590, 49650-49657, 49659, 55540)
Open Reduction of Fracture (Open reduction of fracture or dislocation of long bones that requires internal or external fixation; does not include placement of joint prosthesis)
o NHSN Operative Procedure FX (CPT codes: 23615,23616, 23630, 23670, 23680, 24515, 24516, 24538, 24545, 24546, 24575, 24579, 24586, 24587, 24635, 24665, 24666, 24685, 25337, 25515, 25525, 25526, 25545, 25574, 25575, 25607, 25608, 25609, 25652, 27236, 27244, 27245, 27248, 27254, 27269, 27283, 27506, 27507, 27511, 27513, 27514, 27535, 27536, 27540, 27758, 27759, 27766, 27769, 27784, 27792, 27814, 27822, 27826, 27827, 27828)
9 Edwards JR, Peterson KD, Mu Y, et al. National Healthcare Safety Network (NHSN) report: Data summary for 2006 through 2008, issued December 2009. Am J Infect Control 2009; 37:783-805. http://www.cdc.gov/nhsn/PDFs/dataStat/2009NHSNReport.pdf

NH DHHS/ Division of Public Health Services Healthcare-Associated Infections ASC 2013 Report August 2014
16
SSI monitoring includes total counts as well as patient-level information for all patients undergoing the same procedure. This allows for appropriate risk adjustment, because risk for developing an SSI can be influenced by patient- and procedure-specific factors. The functionality for DHHS to calculate the SIR in NSHN for ASCs was not available, which would allow for more robust risk factor adjustment. Instead, more limited risk categories (SSI risk index) were used to manually calculate SSI standardized infection ratios by ASC. The basic SSI risk index assigns surgical patients into categories based on the presence of three major risk factors:
a. Operation lasting more than the duration of cut point hours
b. Contaminated (Class III) or Dirty/infected (Class IV) wound class
c. ASA classification of 3, 4, or 5 (see below)
The wound class is a way of determining how clean or dirty the operation body site was at the time of the operation. Operation body sites are divided into four classes:
Clean: An uninfected operation body site is encountered and the respiratory, digestive, genital, or uninfected urinary tracts are not entered.
Clean-Contaminated: Operation body sites in which the respiratory, digestive, genital, or urinary tracts are entered under controlled conditions and without unusual contamination.
Contaminated: Operation body sites that have recently undergone trauma, operations with major breaks in sterile technique (e.g., open cardiac massage), or gross spillage from the gastrointestinal tract.
Dirty or Infected: Includes old traumatic wounds with retained dead tissue and those that involve existing infection or perforated intestines.
The ASA classification is the American Society of Anesthesiologists (ASA) Classification of Physical Status, a scale used by the anesthesiologist to classify the patient’s physical condition prior to surgery. It is one of the factors that help determine a patient’s risk of possibly developing an SSI. The ASA scale is:
1. Normally healthy patient
2. Patient with mild systemic disease
3. Patient with severe systemic disease
4. Patient with an incapacitating systemic disease that is a constant threat to life
5. A patient who is not predicted to survive with or without the operation All SSI metrics are monitored following NHSN protocols and definitions and reported in NHSN. The NHSN SSI protocols are available at: http://www.cdc.gov/nhsn/PDFs/pscManual/9pscSSIcurrent.pdf
Limitations for SSI surveillance:
ASCs do not use a standard method of post-discharge surveillance to identify infections. This poses a challenge for data interpretation, as a higher SSI rate at a given ASC could
NH DHHS/ Division of Public Health Services Healthcare-Associated Infections ASC 2013 Report August 2014
17
represent poor infection prevention practices or, conversely, a more comprehensive system for identifying infections.
SSI reporting is only on a subset of procedures. Reporting in NHSN requires detailed information on every patient who underwent the procedure being monitored. This allows for risk adjustment. As such, DHHS has elected to monitor a subset of procedures based on national recommendations since it would not be feasible for ASCs to report information on every patient receiving a surgical procedure due to the burden of reporting.
Some procedures required monitoring for SSI for 90 days after the procedure (in NH, this includes breast, hernia, and open reduction of fracture procedures). This is difficult in the outpatient setting when ASCs rely on post-discharge surveillance. Most infections, however, occur within 30 days of the procedure.
The SSI data presented in this report include all types of infections, including superficial surgical site infections, which can occur as a result of care in the ASC but also as a result of the patient’s care of the surgical site once discharged.
DHHS was not able to calculate the SIR in NHSN due to system limitations. The SIR calculated in NHSN would use more robustSSI probabilities estimated from multivariate logistic regression models developed by NHSN. Unfortunately, this functionality is not currently available in NHSN for ASC data. The SIRs manually calculated by NH DHHS doesn’t adjust for as many patient or procedure risk factors and instead, only accounts for the presence of three major risk factors (SSI risk index).
The SSI data presented in this report have not been validated and must be interpreted with the understanding that in general there are both under- and over-reporting of infections. For example, bilateral procedures (e.g., BRST, FX) should be reported as two separate procedures, however it is likely that some facilities under-reported procedures by reporting bilateral procedures as only one procedure. This could potentially increase the rate and/or SIR.
Surgical Antimicrobial Prophylactic Administration
New Hampshire ASCs reported surgical IV antimicrobial prophylaxis data following NQF endorsed protocols to DHHS, specifically:
Procedure type, date and time of procedure, time of antibiotic administration, and antibiotic administered for all patients undergoing any procedure for which intravenous antibiotics were ordered for the prevention of surgical site infections.
An antibiotic is considered administered on time when antibiotic infusion is initiated within one hour prior to the time of the initial surgical incision or the beginning of a procedure, or two hours prior if vancomycin or selected flouroquinolones are administered.
This process measure shows an ASCs adherence rate to best practices designed to reduce surgical infections. ASCs follow the National Quality Forum specification manual located at: http://ascquality.org/documents/ASCQualityCollaborationImplementationGuide.1.7.pdf.

NH DHHS/ Division of Public Health Services Healthcare-Associated Infections ASC 2013 Report August 2014
18
Limitations for antimicrobial prophylactic administration:
Data collection and documentation techniques at ASCs vary, which may affect how necessary data elements are reported (example: antibiotic administration or procedure start time) and ultimately impact the facilities overall adherence percentage.
Administrations of surgical antimicrobial prophylaxis recorded as having an interval of 00:00 or 1:00 between administration and procedure start were excluded from the analysis.
Influenza Vaccination Rate Monitoring All ASCs are required to report HCP vaccination rates directly to DHHS via an online survey that is provided to facilities prior to the influenza season. Data for the 2013–14 influenza season were reported by 24 (89%) ASCs on or before April 30, 2014; the remaining three (11%) ASCs reported at a later date. Submission of these data meets the requirements of both the HAI law (RSA 151:32-35) and the healthcare immunization law (RSA 151:9-b). The 2013-14 survey asked the following nine questions regarding influenza vaccination:
1. Background information (facility and survey respondent) 2. How many HCP worked or volunteered in your facility for at least one working day between
October 1, 2013 and March 31, 2014? 3. How many HCP received a seasonal influenza vaccination (at your facility or elsewhere) for
the 2013/14 season? Influenza vaccine for a given influenza season may be available as early as July or August. Include all immunized HCP that received the 2013/14 vaccine product, even if administered prior to October 1, 2013. 3a. Total number of HCP immunized against influenza for the 2013/14 season: 3b. Total number of HCP not immunized against influenza for the 2013/14 season:
4. Of the HCP not immunized against influenza for the 2013/14 influenza season, how many HCP did not receive the seasonal influenza vaccine for each of the following reasons: medical contraindication, religious exemption, other (e.g., personal/philosophical), unknown?
5. Does your facility have a seasonal influenza vaccination policy? Such a policy means that the facility requires all or some portion of HCPs working at that facility to receive a seasonal influenza vaccine. If NO, skip to item 9. 5a. Yes, there is a policy currently in place 5b. No, but we are considering a policy 5c. No, and we are not considering a policy 5d. Other (please specify)
6. If your facility has a seasonal influenza vaccination policy, what reasons for exemption are acceptable (medical, religious, personal/philosophical, any reason, other)? Check all that apply.
7. If your facility has a seasonal influenza vaccination policy, what do you require of unvaccinated HCP with an acceptable reason for exemption (wear a mask, receive verbal and/or written education, other)? Check all that apply.
NH DHHS/ Division of Public Health Services Healthcare-Associated Infections ASC 2013 Report August 2014
19
8. If your facility has a seasonal influenza vaccination policy, what are the potential consequences for unvaccinated HCP without an acceptable reason for exemption (wear a mask, progressive discipline, potentially including termination, other)? Check all that apply.
9. Please enter any comments you would like to share.
HCP influenza vaccination rates were calculated by dividing the total number of HCP that worked or volunteered in each facility for at least one working day between October 1, 2013 and March 31, 2014 by the total number of HCP immunized against influenza for the 2013-14 influenza season at that facility.
Limitations for influenza vaccination monitoring:
The survey asks for the total number of HCP vaccinated. This may not reflect the number of HCP to whom the vaccine was offered. ASCs may vary in the refusal rate for vaccination among HCP and the reasons for such refusal. Additionally, some HCP may not be eligible to receive the vaccine. The survey attempted to assess why unvaccinated HCP did not receive the vaccine, however, not all ASCs were able to report this information.
Because the survey did not include options for facilities to report unknown vaccination status, patients and HCP with unknown vaccination status were analyzed as though they were not vaccinated. This results in a conservative estimate of vaccination status (e.g., lower than in reality).
Vaccination status is not available by location where the vaccination was received (e.g., at the reporting facility or elsewhere).
Data collection techniques at ASCs may vary from year to year, potentially affecting comparison of data year to year. DHHS continues to work towards improving the validity and utility of this measure in order to eliminate issues that pose problems for such comparison.
Some ASCs have very few HCP and may never be able to achieve a vaccination rate significantly higher than the state average due to sparse data.
NH DHHS/ Division of Public Health Services Healthcare-Associated Infections ASC 2013 Report August 2014
20
STATEWIDE DATA
HAI data are presented throughout this report as both standardized infection ratios and rates as appropriate. Presenting data as a standardized infection ratio (SIR) allows for aggregating data across risk group, procedures, and healthcare facility to gain a better understanding of the incidence of HAI while still adjusting for underlying patient or healthcare facility factors that may affect the occurrence of infections. The SIR does not give the infection rate, but rather a comparison between how many infections actually occurred and how many were predicted to occur based on national data. Specific rate information is also provided where possible, which represents the annual number of infections that occurred taking into account the number of procedures that were performed. Rate data are limited by the requirement to only calculate rates that are broken down by certain factors. See technical notes for additional information on rates and the SIR. Because an SIR is a comparison of the number of actual observed infections to the number predicted based on national data, an SIR of 1.0 means that exactly the same number of infections was observed as was predicted. An SIR of less than one means that fewer infections were observed than were predicted (for example, SIR = 0.70 would be interpreted as 30% fewer infections observed than predicted). An SIR of more than one means that more infections were observed than were predicted (for example, SIR = 1.30 would be interpreted as 30% more infections observed than predicted). A confidence interval is calculated to determine whether the difference between observed and predicted infections is statistically significant. If the difference is not statistically significant, the observed and predicted numbers of infections are considered similar. See technical notes for additional information on confidence intervals.
This report provides comparisons with national and state data where appropriate. Comparisons are color coded consistently throughout. For infections, yellow represents infection rates that are similar to national data, red represents infection rates that are significantly higher than national rates, and green represents infection rates that are significantly lower than national rates.
For process measures, yellow represents rates that are similar to the state average, red represents rates that are significantly lower than the state average, and green represents rates that are significantly higher than the state average.
Statistical significance is affected by sample size. If a value is almost or just barely significant, just a few additional observations can push significance one way or the other (i.e., not significant or significant). Statewide Surgical Site Infections Standardized Infection Ratios
A SSI is an infection that develops at the site of a surgical procedure. The tables below show the number of SSI following the three monitored procedures reported by each ASC in NH. In 2013, there were six surgical site infections (SSI) reported by the 16 ASCs in NH licensed for the entire 2013 calendar year and required to report these data. These six infections represent SSI following breast, hernia, and open reduction of fracture procedures. Based on national data, 8.02 infections were predicted. The overall observed number of SSI was 25% fewer than predicted based on national data. Looking individually at the specific procedures, there were 20% fewer breast
NH DHHS/ Division of Public Health Services Healthcare-Associated Infections ASC 2013 Report August 2014
21
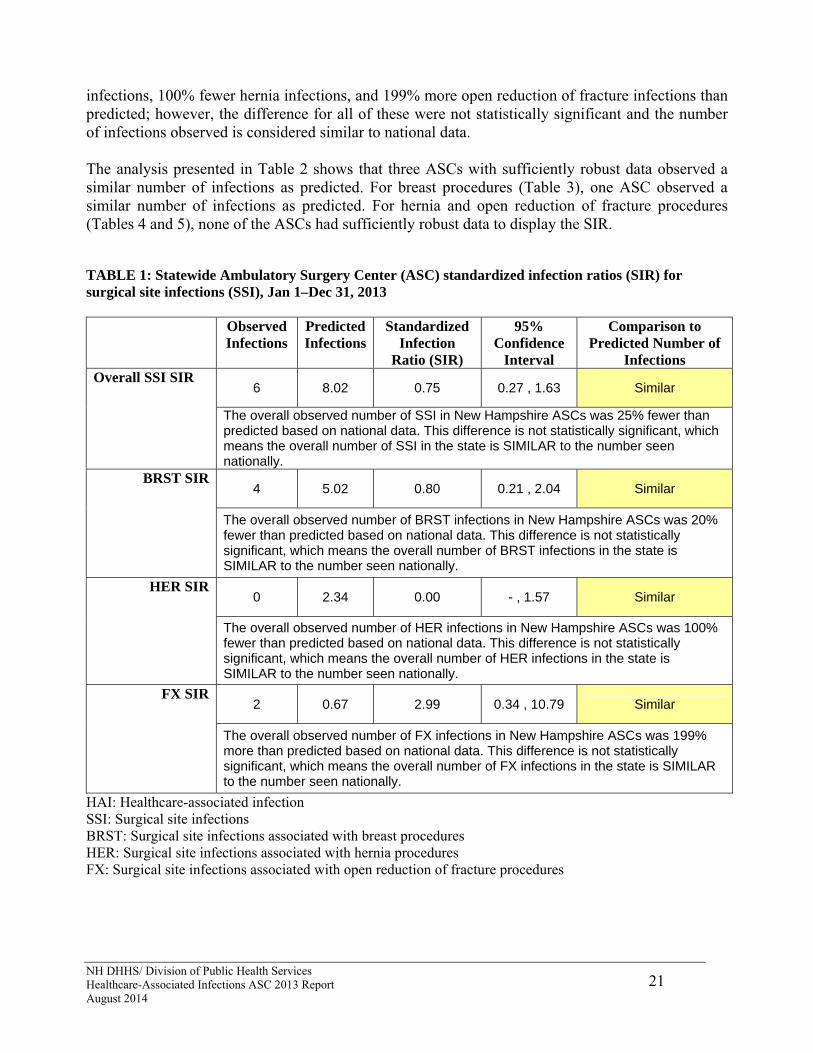
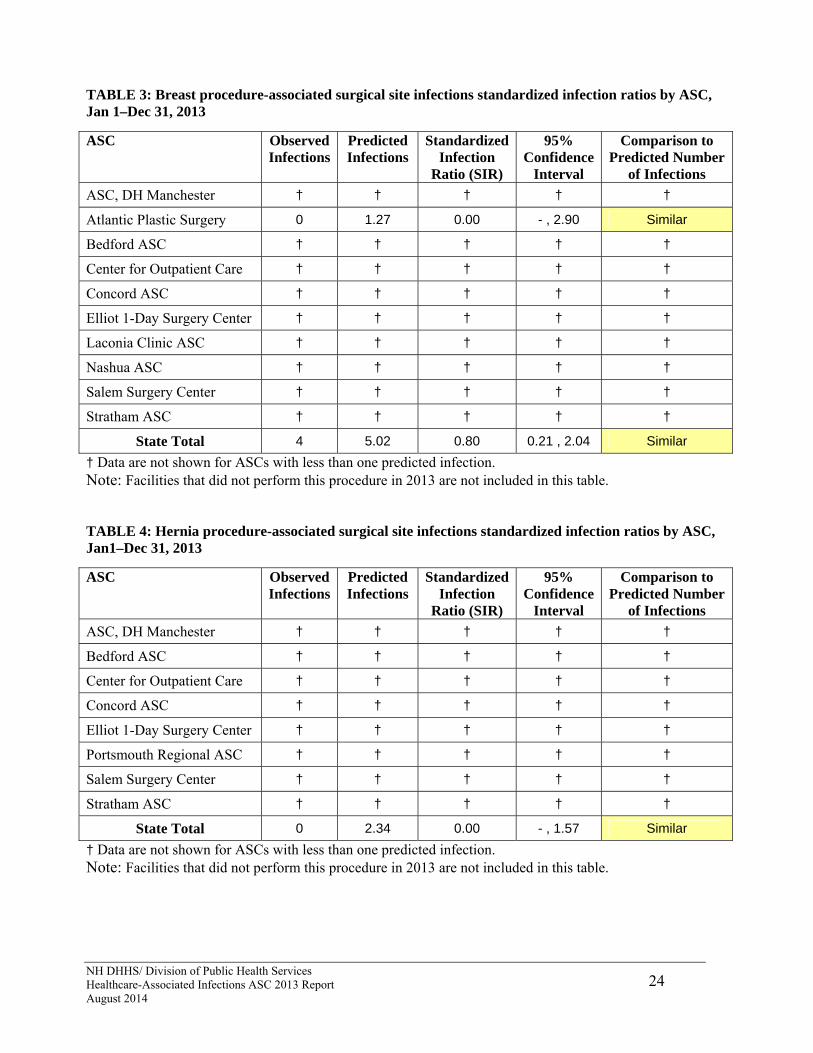
infections, 100% fewer hernia infections, and 199% more open reduction of fracture infections than predicted; however, the difference for all of these were not statistically significant and the number of infections observed is considered similar to national data. The analysis presented in Table 2 shows that three ASCs with sufficiently robust data observed a similar number of infections as predicted. For breast procedures (Table 3), one ASC observed a similar number of infections as predicted. For hernia and open reduction of fracture procedures (Tables 4 and 5), none of the ASCs had sufficiently robust data to display the SIR. TABLE 1: Statewide Ambulatory Surgery Center (ASC) standardized infection ratios (SIR) for surgical site infections (SSI), Jan 1–Dec 31, 2013 Observed
Infections Predicted Infections
Standardized Infection
Ratio (SIR)
95% Confidence
Interval
Comparison to Predicted Number of
Infections
6 8.02 0.75 0.27 , 1.63 Similar Overall SSI SIR
The overall observed number of SSI in New Hampshire ASCs was 25% fewer than predicted based on national data. This difference is not statistically significant, which means the overall number of SSI in the state is SIMILAR to the number seen nationally.
4 5.02 0.80 0.21 , 2.04 Similar BRST SIR
The overall observed number of BRST infections in New Hampshire ASCs was 20% fewer than predicted based on national data. This difference is not statistically significant, which means the overall number of BRST infections in the state is SIMILAR to the number seen nationally.
0 2.34 0.00 - , 1.57 Similar HER SIR
The overall observed number of HER infections in New Hampshire ASCs was 100% fewer than predicted based on national data. This difference is not statistically significant, which means the overall number of HER infections in the state is SIMILAR to the number seen nationally.
2 0.67 2.99 0.34 , 10.79 Similar FX SIR
The overall observed number of FX infections in New Hampshire ASCs was 199% more than predicted based on national data. This difference is not statistically significant, which means the overall number of FX infections in the state is SIMILAR to the number seen nationally.
HAI: Healthcare-associated infection SSI: Surgical site infections BRST: Surgical site infections associated with breast procedures HER: Surgical site infections associated with hernia procedures FX: Surgical site infections associated with open reduction of fracture procedures

NH DHHS/ Division of Public Health Services Healthcare-Associated Infections ASC 2013 Report August 2014
22
FIGURE 1: Statewide Ambulatory Surgery Center (ASC) standardized infection ratios (SIR) for surgical site infections (SSI), Jan 1–Dec 31, 2013
SSI: Surgical Site Infections BRST: Surgical site infections associated with breast procedures HER: Surgical site infections associated with hernia procedures FX: Surgical site infections associated with open reduction of fracture procedures
TABLE 2: Overall surgical site infections standardized infection ratios by ASC, Jan 1–Dec 31, 2013

NH DHHS/ Division of Public Health Services Healthcare-Associated Infections ASC 2013 Report August 2014
23
† Data are not shown for ASCs with less than one predicted infection. Note: Facilities that did not perform breast, hernia or open reduction of fracture procedures in 2013 are not included in this table. The Surgery Center of Greater Nashua was newly licensed in 2013 and did not have a full year of data to report.
ASC Observed Infections
Predicted Infections
Standardized Infection
Ratio (SIR)
95% Confidence
Interval
Comparison to Predicted Number
of Infections
ASC, DH Manchester † † † † †
Atlantic Plastic Surgery 0 1.27 0.00 - , 2.90 Similar
Bedford ASC † † † † †
Center for Outpatient Care 1 1.51 0.66 0.01 , 3.68 Similar
Concord ASC † † † † †
Elliot 1-Day Surgery Center 2 1.50 1.34 0.15 , 4.82 Similar
Hillside Surgical Center † † † † †
Laconia Clinic ASC † † † † †
Nashua ASC † † † † †
Northeast Surgical Care † † † † †
Orthopaedic Surgery Center † † † † †
Orthopaedic Surgery Center, Derry
† † † † †
Portsmouth Regional ASC † † † † †
Salem Surgery Center † † † † †
Stratham ASC † † † † †
State Total 6 8.02 0.75 0.27 , 1.63 Similar
NH DHHS/ Division of Public Health Services Healthcare-Associated Infections ASC 2013 Report August 2014
24
TABLE 3: Breast procedure-associated surgical site infections standardized infection ratios by ASC, Jan 1–Dec 31, 2013
† Data are not shown for ASCs with less than one predicted infection. Note: Facilities that did not perform this procedure in 2013 are not included in this table. TABLE 4: Hernia procedure-associated surgical site infections standardized infection ratios by ASC, Jan1–Dec 31, 2013
† Data are not shown for ASCs with less than one predicted infection. Note: Facilities that did not perform this procedure in 2013 are not included in this table.
ASC Observed Infections
Predicted Infections
Standardized Infection
Ratio (SIR)
95% Confidence
Interval
Comparison to Predicted Number
of Infections
ASC, DH Manchester † † † † †
Atlantic Plastic Surgery 0 1.27 0.00 - , 2.90 Similar
Bedford ASC † † † † †
Center for Outpatient Care † † † † †
Concord ASC † † † † †
Elliot 1-Day Surgery Center † † † † †
Laconia Clinic ASC † † † † †
Nashua ASC † † † † †
Salem Surgery Center † † † † †
Stratham ASC † † † † †
State Total 4 5.02 0.80 0.21 , 2.04 Similar
ASC Observed Infections
Predicted Infections
Standardized Infection
Ratio (SIR)
95% Confidence
Interval
Comparison to Predicted Number
of Infections
ASC, DH Manchester † † † † †
Bedford ASC † † † † †
Center for Outpatient Care † † † † †
Concord ASC † † † † †
Elliot 1-Day Surgery Center † † † † †
Portsmouth Regional ASC † † † † †
Salem Surgery Center † † † † †
Stratham ASC † † † † †
State Total 0 2.34 0.00 - , 1.57 Similar
NH DHHS/ Division of Public Health Services Healthcare-Associated Infections ASC 2013 Report August 2014
25
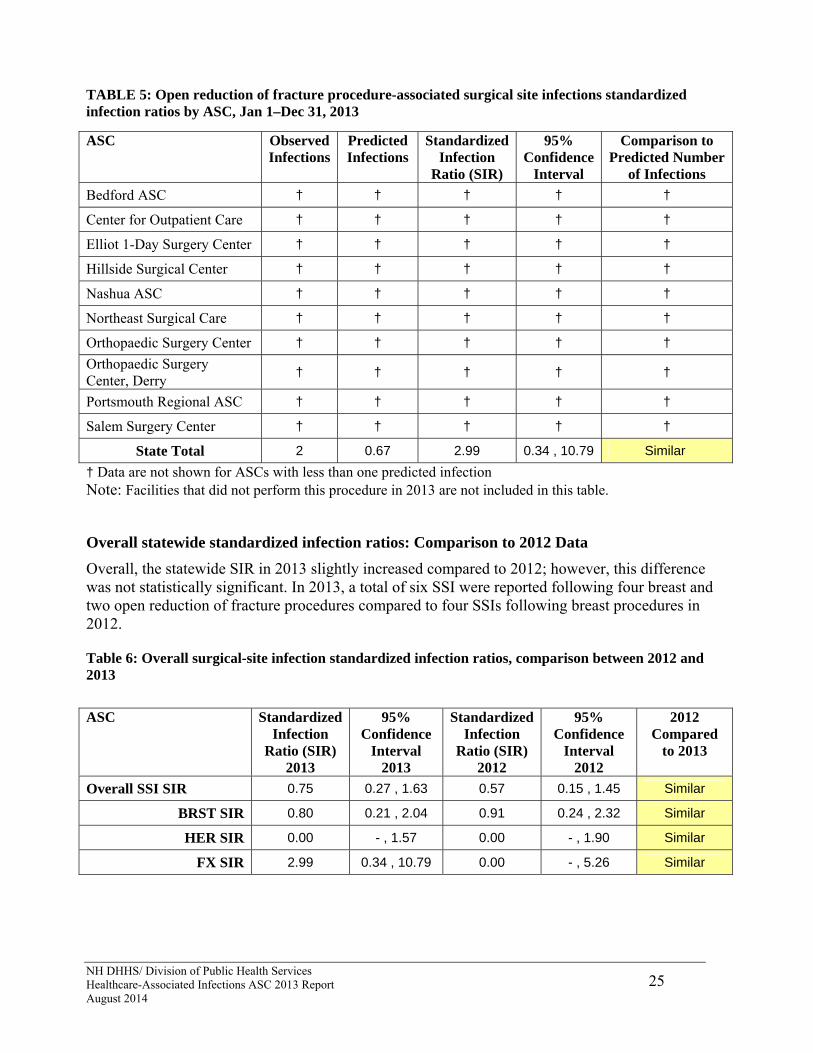
TABLE 5: Open reduction of fracture procedure-associated surgical site infections standardized infection ratios by ASC, Jan 1–Dec 31, 2013
† Data are not shown for ASCs with less than one predicted infection Note: Facilities that did not perform this procedure in 2013 are not included in this table.
Overall statewide standardized infection ratios: Comparison to 2012 Data
Overall, the statewide SIR in 2013 slightly increased compared to 2012; however, this difference was not statistically significant. In 2013, a total of six SSI were reported following four breast and two open reduction of fracture procedures compared to four SSIs following breast procedures in 2012. Table 6: Overall surgical-site infection standardized infection ratios, comparison between 2012 and 2013
ASC Observed Infections
Predicted Infections
Standardized Infection
Ratio (SIR)
95% Confidence
Interval
Comparison to Predicted Number
of Infections
Bedford ASC † † † † †
Center for Outpatient Care † † † † †
Elliot 1-Day Surgery Center † † † † †
Hillside Surgical Center † † † † †
Nashua ASC † † † † †
Northeast Surgical Care † † † † †
Orthopaedic Surgery Center † † † † †
Orthopaedic Surgery Center, Derry
† † † † †
Portsmouth Regional ASC † † † † †
Salem Surgery Center † † † † †
State Total 2 0.67 2.99 0.34 , 10.79 Similar
ASC Standardized Infection
Ratio (SIR) 2013
95% Confidence
Interval 2013
Standardized Infection
Ratio (SIR) 2012
95% Confidence
Interval 2012
2012 Compared
to 2013
Overall SSI SIR 0.75 0.27 , 1.63 0.57 0.15 , 1.45 Similar
BRST SIR 0.80 0.21 , 2.04 0.91 0.24 , 2.32 Similar
HER SIR 0.00 - , 1.57 0.00 - , 1.90 Similar
FX SIR 2.99 0.34 , 10.79 0.00 - , 5.26 Similar
NH DHHS/ Division of Public Health Services Healthcare-Associated Infections ASC 2013 Report August 2014
26
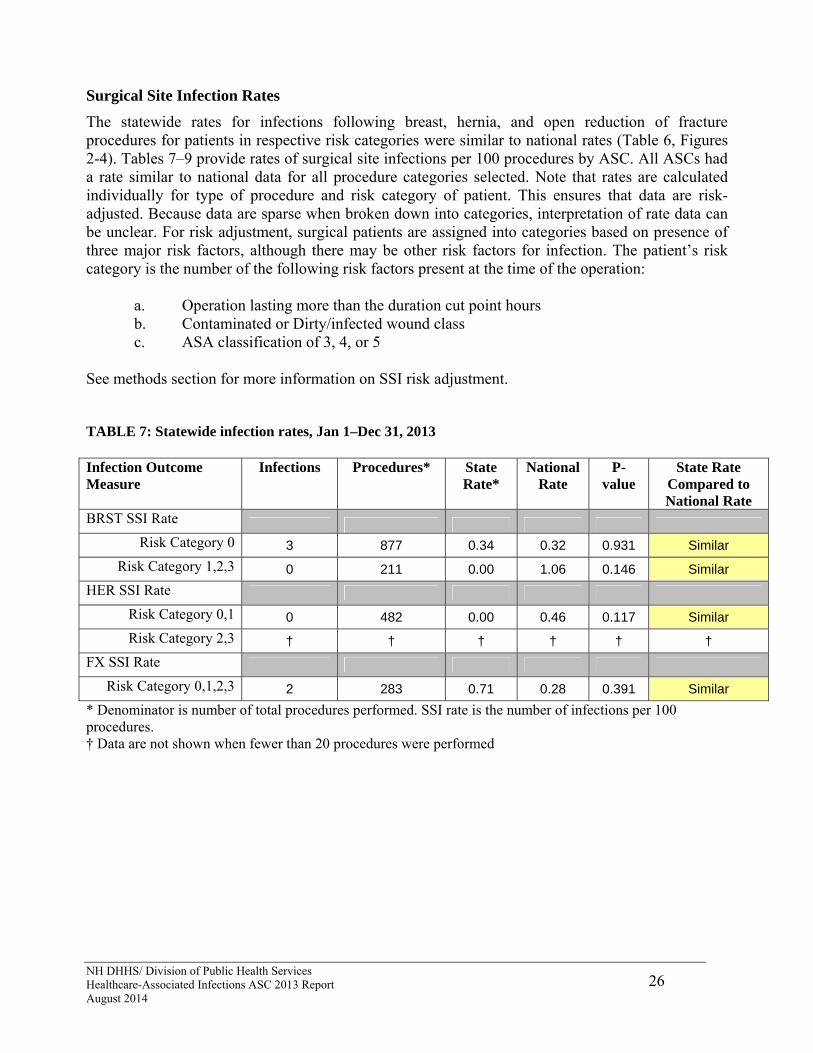
Surgical Site Infection Rates
The statewide rates for infections following breast, hernia, and open reduction of fracture procedures for patients in respective risk categories were similar to national rates (Table 6, Figures 2-4). Tables 7–9 provide rates of surgical site infections per 100 procedures by ASC. All ASCs had a rate similar to national data for all procedure categories selected. Note that rates are calculated individually for type of procedure and risk category of patient. This ensures that data are risk-adjusted. Because data are sparse when broken down into categories, interpretation of rate data can be unclear. For risk adjustment, surgical patients are assigned into categories based on presence of three major risk factors, although there may be other risk factors for infection. The patient’s risk category is the number of the following risk factors present at the time of the operation:
a. Operation lasting more than the duration cut point hours b. Contaminated or Dirty/infected wound class c. ASA classification of 3, 4, or 5
See methods section for more information on SSI risk adjustment. TABLE 7: Statewide infection rates, Jan 1–Dec 31, 2013 Infection Outcome Measure
Infections Procedures* State Rate*
National Rate
P-value
State Rate Compared to National Rate
BRST SSI Rate Risk Category 0 3 877 0.34 0.32 0.931 Similar
Risk Category 1,2,3 0 211 0.00 1.06 0.146 Similar
HER SSI Rate
Risk Category 0,1 0 482 0.00 0.46 0.117 Similar
Risk Category 2,3 † † † † † †
FX SSI Rate
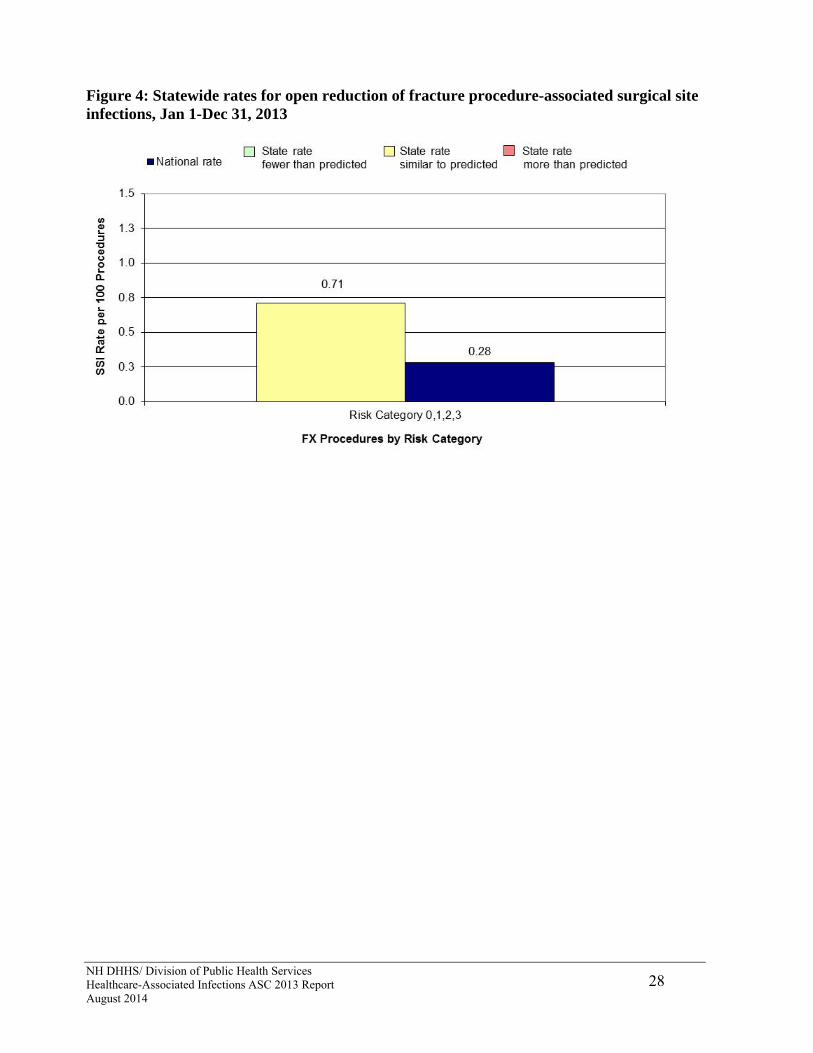
Risk Category 0,1,2,3 2 283 0.71 0.28 0.391 Similar
* Denominator is number of total procedures performed. SSI rate is the number of infections per 100 procedures. † Data are not shown when fewer than 20 procedures were performed

NH DHHS/ Division of Public Health Services Healthcare-Associated Infections ASC 2013 Report August 2014
27
Figure 2: Statewide rates for breast procedure-associated surgical site infections, Jan 1-Dec 31, 2013.
Figure 3: Statewide rates for hernia procedure-associated surgical site infections, Jan 1-Dec 31, 2013
† Data are not shown when fewer than 20 procedures were performed
NH DHHS/ Division of Public Health Services Healthcare-Associated Infections ASC 2013 Report August 2014
28
Figure 4: Statewide rates for open reduction of fracture procedure-associated surgical site infections, Jan 1-Dec 31, 2013

NH DHHS/ Division of Public Health Services 29 Healthcare-Associated Infections ASC 2013 Report August 2014
TABLE 8: Breast procedure-associated surgical site infection rates by risk category and ASC, Jan 1– Dec 31, 2013
ASC Infections Procedures Facility Rate
National Rate
p-value ASC rate Compared to National Rate
Risk Category 0
ASC, DH Manchester 0 46 0.00 0.32 0.867 Similar
Atlantic Plastic Surgery 0 207 0.00 0.32 0.552 Similar
Bedford ASC 0 51 0.00 0.32 0.854 Similar
Center for Outpatient Care
1 86 1.16 0.32 0.334 Similar
Concord ASC 0 100 0.00 0.32 0.740 Similar
Elliot 1-Day Surgery Center
2 200 1.00 0.32 0.255 Similar
Laconia Clinic ASC - - - - - -
Nashua ASC † † † † † †
Salem Surgery Center 0 122 0.00 0.32 0.695 Similar
Stratham ASC 0 64 0.00 0.32 0.822 Similar
State Total 3 877 0.34 0.32 0.931 Similar
Risk Category 1, 2, 3
ASC, DH Manchester † † † † † †
Atlantic Plastic Surgery 0 57 0.00 1.06 0.561 Similar
Bedford ASC † † † † † †
Center for Outpatient Care
0 47 0.00 1.06 0.619 Similar
Concord ASC 0 49 0.00 1.06 0.607 Similar
Elliot 1-Day Surgery Center
† † † † † †
Laconia Clinic ASC † † † † † †
Nashua ASC † † † † † †
Salem Surgery Center † † † † † †
Stratham ASC † † † † † †
State Total 0 211 0.00 1.06 0.146 Similar
† Data are not shown when fewer than 20 procedures were performed. - Facility did not perform procedures in this risk category.

NH DHHS/ Division of Public Health Services Healthcare-Associated Infections ASC 2013 Report August 2014
30
TABLE 9: Hernia procedure-associated surgical site infection rates by risk category and ASC, Jan 1– Dec 31, 2013
ASC Infections Procedures ASC Rate
National Rate
p-value ASC rate Compared to National Rate
Risk Category 0, 1
ASC, DH Manchester 0 110 0.00 0.46 0.608 Similar
Atlantic Plastic Surgery - - - - - -
Bedford ASC 0 37 0.00 0.46 0.845 Similar
Center for Outpatient Care
0 115 0.00 0.46 0.594 Similar
Concord ASC † † † † † †
Elliot 1-Day Surgery Center
0 137 0.00 0.46 0.538 Similar
Portsmouth ASC † † † † † †
Salem Surgery Center 0 54 0.00 0.46 0.783 Similar
Stratham ASC † † † † † †
State Total 0 482 0.00 0.46 0.117 Similar
Risk Category 2, 3
ASC, DH Manchester - - - - - -
Atlantic Plastic Surgery - - - - - -
Bedford ASC - - - - - -
Center for Outpatient Care
† † † † † †
Concord ASC † † † † † †
Elliot 1-Day Surgery Center
- - - - - -
Portsmouth ASC - - - - - -
Salem Surgery Center - - - - - -
Stratham ASC - - - - - -
State Total † † † † † †
† Data are not shown when fewer than 20 procedures were performed. - Facility did not perform procedures in this risk category.
NH DHHS/ Division of Public Health Services Healthcare-Associated Infections ASC 2013 Report August 2014
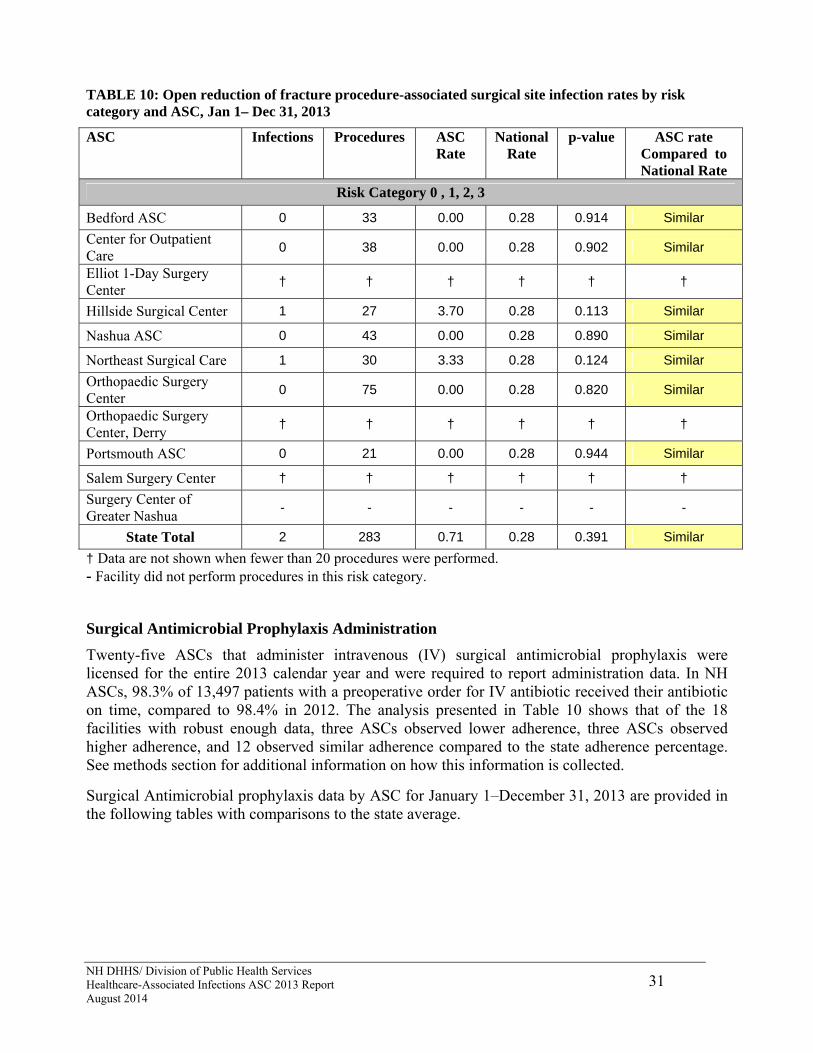
31
TABLE 10: Open reduction of fracture procedure-associated surgical site infection rates by risk category and ASC, Jan 1– Dec 31, 2013
ASC Infections Procedures ASC Rate
National Rate
p-value ASC rate Compared to National Rate
Risk Category 0 , 1, 2, 3
Bedford ASC 0 33 0.00 0.28 0.914 Similar
Center for Outpatient Care
0 38 0.00 0.28 0.902 Similar
Elliot 1-Day Surgery Center
† † † † † †
Hillside Surgical Center 1 27 3.70 0.28 0.113 Similar
Nashua ASC 0 43 0.00 0.28 0.890 Similar
Northeast Surgical Care 1 30 3.33 0.28 0.124 Similar
Orthopaedic Surgery Center
0 75 0.00 0.28 0.820 Similar
Orthopaedic Surgery Center, Derry
† † † † † †
Portsmouth ASC 0 21 0.00 0.28 0.944 Similar
Salem Surgery Center † † † † † †
Surgery Center of Greater Nashua
- - - - - -
State Total 2 283 0.71 0.28 0.391 Similar
† Data are not shown when fewer than 20 procedures were performed. - Facility did not perform procedures in this risk category.
Surgical Antimicrobial Prophylaxis Administration
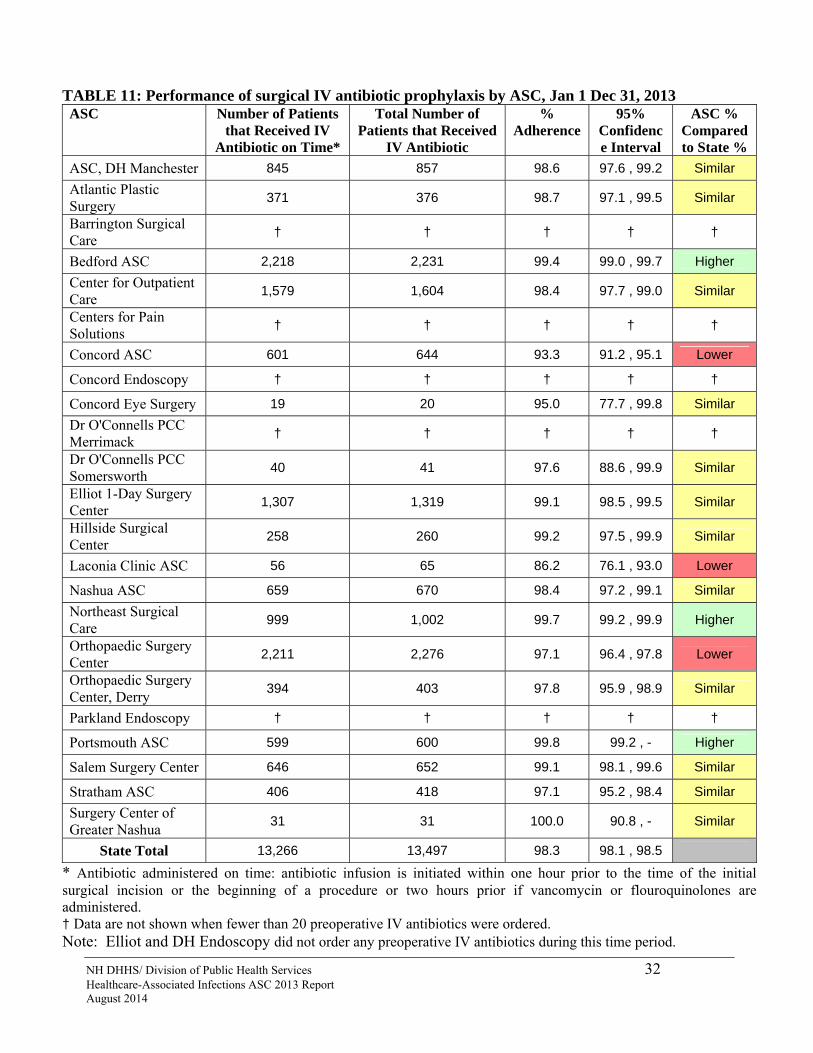
Twenty-five ASCs that administer intravenous (IV) surgical antimicrobial prophylaxis were licensed for the entire 2013 calendar year and were required to report administration data. In NH ASCs, 98.3% of 13,497 patients with a preoperative order for IV antibiotic received their antibiotic on time, compared to 98.4% in 2012. The analysis presented in Table 10 shows that of the 18 facilities with robust enough data, three ASCs observed lower adherence, three ASCs observed higher adherence, and 12 observed similar adherence compared to the state adherence percentage. See methods section for additional information on how this information is collected.
Surgical Antimicrobial prophylaxis data by ASC for January 1–December 31, 2013 are provided in the following tables with comparisons to the state average.
NH DHHS/ Division of Public Health Services 32 Healthcare-Associated Infections ASC 2013 Report August 2014
TABLE 11: Performance of surgical IV antibiotic prophylaxis by ASC, Jan 1 Dec 31, 2013 ASC Number of Patients
that Received IV Antibiotic on Time*
Total Number of Patients that Received
IV Antibiotic
% Adherence
95% Confidence Interval
ASC % Compared to State %
ASC, DH Manchester 845 857 98.6 97.6 , 99.2 Similar
Atlantic Plastic Surgery
371 376 98.7 97.1 , 99.5 Similar
Barrington Surgical Care
† † † † †
Bedford ASC 2,218 2,231 99.4 99.0 , 99.7 Higher
Center for Outpatient Care
1,579 1,604 98.4 97.7 , 99.0 Similar
Centers for Pain Solutions
† † † † †
Concord ASC 601 644 93.3 91.2 , 95.1 Lower
Concord Endoscopy † † † † †
Concord Eye Surgery 19 20 95.0 77.7 , 99.8 Similar
Dr O'Connells PCC Merrimack
† † † † †
Dr O'Connells PCC Somersworth
40 41 97.6 88.6 , 99.9 Similar
Elliot 1-Day Surgery Center
1,307 1,319 99.1 98.5 , 99.5 Similar
Hillside Surgical Center
258 260 99.2 97.5 , 99.9 Similar
Laconia Clinic ASC 56 65 86.2 76.1 , 93.0 Lower
Nashua ASC 659 670 98.4 97.2 , 99.1 Similar
Northeast Surgical Care
999 1,002 99.7 99.2 , 99.9 Higher
Orthopaedic Surgery Center
2,211 2,276 97.1 96.4 , 97.8 Lower
Orthopaedic Surgery Center, Derry
394 403 97.8 95.9 , 98.9 Similar
Parkland Endoscopy † † † † †
Portsmouth ASC 599 600 99.8 99.2 , - Higher
Salem Surgery Center 646 652 99.1 98.1 , 99.6 Similar
Stratham ASC 406 418 97.1 95.2 , 98.4 Similar
Surgery Center of Greater Nashua
31 31 100.0 90.8 , - Similar
State Total 13,266 13,497 98.3 98.1 , 98.5 * Antibiotic administered on time: antibiotic infusion is initiated within one hour prior to the time of the initial surgical incision or the beginning of a procedure or two hours prior if vancomycin or flouroquinolones are administered. † Data are not shown when fewer than 20 preoperative IV antibiotics were ordered. Note: Elliot and DH Endoscopy did not order any preoperative IV antibiotics during this time period.

NH DHHS/ Division of Public Health Services Healthcare-Associated Infections ASC 2013 Report August 2014
33
Surgical Antimicrobial Prophylaxis Administration: Comparison to 2012 Data
Overall, in 2013 the statewide adherence to surgical antimicrobial prophylaxis administration was similar when compared to 2012. Further analysis showed that nine ASCs had similar adherence, two had higher adherence, and two had lower adherence in 2013 when compared to 2012. Figure 5: Statewide performance of surgical IV antibiotic prophylaxis administration by year, 2012-2013

NH DHHS/ Division of Public Health Services 34 Healthcare-Associated Infections ASC 2013 Report August 2014
Figure 6: Performance of surgical IV antibiotic prophylaxis administration by facility, 2012-2013

NH DHHS/ Division of Public Health Services 35 Healthcare-Associated Infections ASC 2013 Report August 2014
Table 12: Performance of surgical IV prophylaxis administration by ASC, comparison to 2012 data ASC %
Adherence2013
95% Confidence
Interval 2013
% Adherence
2012
95% Confidence
Interval 2012
2013 Compared
to 2012
ASC, DH Manchester 98.6 97.6 , 99.2 97.0 95.6 , 98.0 Similar
Atlantic Plastic Surgery 98.7 97.1 , 99.5 99.7 98.6 , - Similar
Barrington Surgical Care † † † † †
Bedford ASC 99.4 99.0 , 99.7 99.6 99.2 , 99.8 Similar
Center for Outpatient Care 98.4 97.7 , 99.0 96.8 96.0, 97.6 Higher
Centers for Pain Solutions † † † † †
Concord ASC 93.3 91.2 , 95.1 97.0 95.8 , 98.0 Lower
Concord Endoscopy † † - - N/A
Concord Eye Surgery 95.0 77.7 , 88.8 - - N/A
Dr O'Connells PCC Merrimack † † 90.9 73.1 , 98.5 N/A
Dr O'Connells PCC Somersworth 97.6 88.6 , 99.9 100.0 96.5 , - Similar
Elliot 1-Day Surgery Center 99.1 98.5 , 99.5 99.4 98.8 , 99.7 Similar
Hillside Surgical Center 99.2 97.5 , 99.9 99.3 97.6 , 99.9 Similar
Laconia Clinic ASC 86.2 76.1 , 93.0 † † N/A
Nashua ASC 98.4 97.2 , 99.1 - - N/A
Northeast Surgical Care 99.7 99.2 , 99.9 99.9 99.5 , - Similar
Orthopaedic Surgery Center 97.1 96.4 , 97.8 98.8 98.3 , 99.2 Lower
Orthopaedic Surgery Center, Derry 97.8 95.9 , 98.9 - - N/A
Parkland Endoscopy † † - - N/A
Portsmouth ASC 99.8 99.2 , 100.0 96.5 94.8 , 97.8 Higher
Salem Surgery Center 99.1 98.1 , 99.6 99.2 98.2 , 99.7 Similar
Stratham ASC 97.1 95.2 , 98.4 96.8 94.8 , 98.2 Similar
Surgery Center of Greater Nashua 100.0 90.8 , 100.0 - - N/A
State Total 98.3 98.1 , 98.5 98.4 98.2 , 98.6 Similar
† Data are not shown when fewer than 20 preoperative IV antibiotics were ordered. Note: Elliot and DH Endoscopy did not order any preoperative IV antibiotics during this time period. Concord Endoscopy, Concord Eye, and Parkland Endoscopy did not have any IV antibiotics to report in 2012. Nashua ASC, Orthopaedic Surgery Center (Derry), and The Surgery Center of Greater Nashua were not licensed in 2013.
NH DHHS/ Division of Public Health Services Healthcare-Associated Infections ASC 2013 Report August 2014
36
Influenza Vaccination Percentages
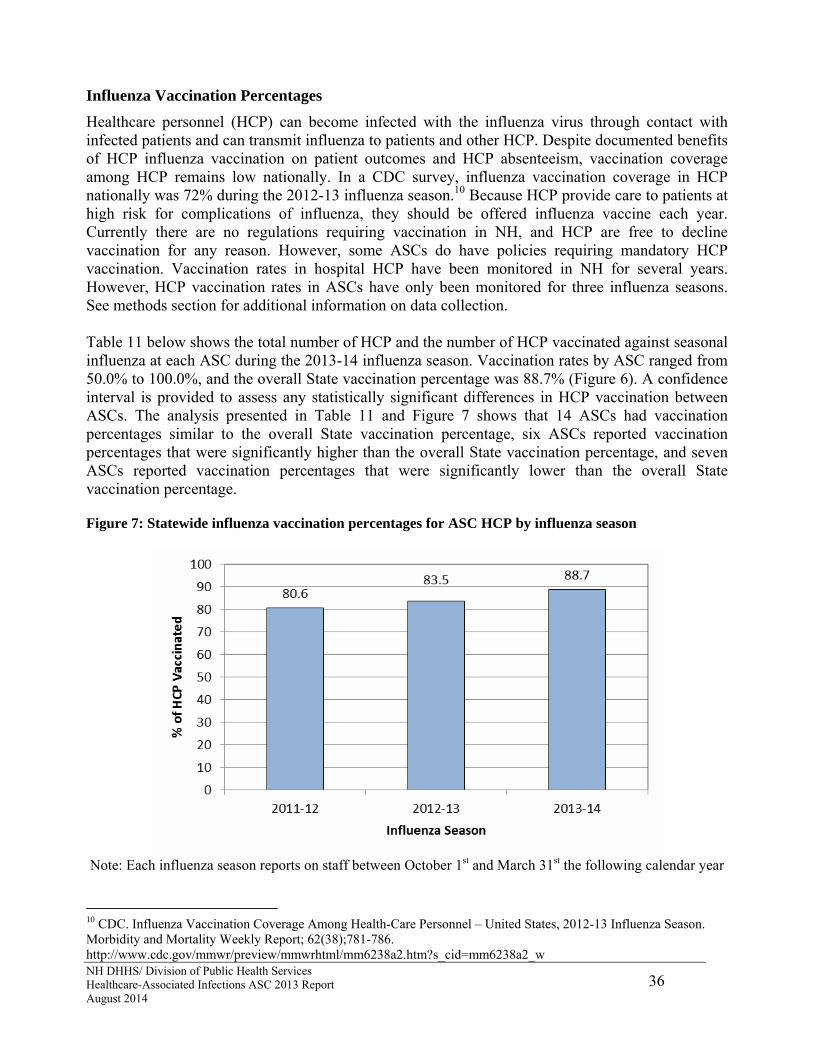
Healthcare personnel (HCP) can become infected with the influenza virus through contact with infected patients and can transmit influenza to patients and other HCP. Despite documented benefits of HCP influenza vaccination on patient outcomes and HCP absenteeism, vaccination coverage among HCP remains low nationally. In a CDC survey, influenza vaccination coverage in HCP nationally was 72% during the 2012-13 influenza season.10 Because HCP provide care to patients at high risk for complications of influenza, they should be offered influenza vaccine each year. Currently there are no regulations requiring vaccination in NH, and HCP are free to decline vaccination for any reason. However, some ASCs do have policies requiring mandatory HCP vaccination. Vaccination rates in hospital HCP have been monitored in NH for several years. However, HCP vaccination rates in ASCs have only been monitored for three influenza seasons. See methods section for additional information on data collection. Table 11 below shows the total number of HCP and the number of HCP vaccinated against seasonal influenza at each ASC during the 2013-14 influenza season. Vaccination rates by ASC ranged from 50.0% to 100.0%, and the overall State vaccination percentage was 88.7% (Figure 6). A confidence interval is provided to assess any statistically significant differences in HCP vaccination between ASCs. The analysis presented in Table 11 and Figure 7 shows that 14 ASCs had vaccination percentages similar to the overall State vaccination percentage, six ASCs reported vaccination percentages that were significantly higher than the overall State vaccination percentage, and seven ASCs reported vaccination percentages that were significantly lower than the overall State vaccination percentage. Figure 7: Statewide influenza vaccination percentages for ASC HCP by influenza season
Note: Each influenza season reports on staff between October 1st and March 31st the following calendar year
10 CDC. Influenza Vaccination Coverage Among Health-Care Personnel – United States, 2012-13 Influenza Season. Morbidity and Mortality Weekly Report; 62(38);781-786. http://www.cdc.gov/mmwr/preview/mmwrhtml/mm6238a2.htm?s_cid=mm6238a2_w

NH DHHS/ Division of Public Health Services Healthcare-Associated Infections ASC 2013 Report August 2014
37
TABLE 13: Influenza vaccination percentages for ASC HCP by ASC, 2013-14 influenza season, October 1, 2013–March 31, 2014 ASC HCP
Vaccinated Total HCP
% HCP Vaccinated
95% Confidence
Interval
ASC % Compared to
State %
ASC, DH Manchester 52 52 100.0 94.4 , - Higher
Atlantic Plastic Surgery 17 27 63.0 43.9 , 79.4 Lower
Barrington Surgical Care, LLC 18 24 75.0 55.1 , 89.2 Similar
Bedford ASC 101 119 84.9 77.6 , 90.5 Similar
Center for Outpatient Care 29 31 93.5 80.3 , 98.9 Similar
Centers for Pain Solutions 12 12 100.0 77.9 , - Similar
Concord ASC 69 83 83.1 73.9 , 90.1 Similar
Concord Endoscopy Center 21 29 72.4 54.3 , 86.3 Lower
Concord Eye Surgery LLC 16 25 64.0 44.1 , 80.8 Lower
DH Nashua Endoscopy Center 33 33 100.0 91.3 , - Higher
Dr O'Connells PCC, Merrimack 10 15 66.7 40.8 , 86.6 Lower
Dr O'Connells PCC, Somersworth 10 20 50.0 28.9 , 71.1 Lower
Elliot 1-Day Surgery Center 180 182 98.9 96.4 , 99.8 Higher
Elliot Endoscopy 18 18 100.0 84.7 , - Similar
Hillside Surgical Center 49 49 100.0 94.1 , - Higher
Laconia Clinic ASC 34 34 100.0 91.6 , - Higher
Nashua ASC 52 56 92.9 83.7 , 97.7 Similar
Nashua Eye Surgery Center 30 35 85.7 71.1 , 94.6 Similar
NH Eye Surgicenter 19 21 90.5 72.0 , 98.4 Similar
Northeast Surgical Care 22 24 91.7 75.1 , 98.6 Similar
Orthopaedic Surgery Center 68 92 73.9 64.2 , 82.1 Lower
Orthopaedic Surgery Center, Derry 32 43 74.4 59.9 , 85.8 Lower
Parkland Endoscopy Center 12 12 100.0 77.9 , - Similar
Portsmouth Regional ASC 57 60 95.0 87.0 , 98.7 Similar
Salem Surgery Center 104 105 99.0 95.4 , - Higher
Stratham ASC 39 45 86.7 74.3 , 94.4 Similar
Surgery Center of Greater Nashua 14 15 93.3 71.3 , 99.7 Similar
State Total 1,118 1,261 88.7 86.8 , 90.3

NH DHHS/ Division of Public Health Services Healthcare-Associated Infections ASC 2013 Report August 2014
38
FIGURE 8: Influenza vaccination percentages for ASC HCP by ASC, 2013-14 influenza season (October 1, 2013—March 31, 2014)
Influenza vaccination percentages: Comparison to 2012-13 Data
The overall statewide ASC HCP vaccination percentage increased significantly between the 2012-13 and 2013-14 influenza season. The analysis presented in Table 12 shows that, overall, one ASC increased HCP influenza vaccination in 2013-14 compared to 2012-13, 25 ASCs had similar vaccination percentages, and none decreased influenza vaccination percentages.

NH DHHS/ Division of Public Health Services 39 Healthcare-Associated Infections ASC 2013 Report August 2014
Figure 9: Influenza vaccination percentages for ASC HCP by ASC, 2012-13 and 2013-14 influenza seasons

NH DHHS/ Division of Public Health Services 40 Healthcare-Associated Infections ASC 2013 Report August 2014
Table 14: Influenza vaccination percentages for ASC HCP by ASC, comparison between 2012-13 and 2013-14 influenza seasons ASC % HCP
Vaccinated 2013-14
95% Confidence
Interval 2013-14
% HCP Vaccinated
2012-13
95% Confidence
Interval 2012-13
2013-14 Compared to 2012-13
ASC, DH Manchester 100.0 94.4 , - 100.0 91.8 , - Similar
Atlantic Plastic Surgery 63.0 43.9 , 79.4 53.8 34.8 , 72.1 Similar
Barrington Surgical Care, LLC 75.0 55.1 , 89.2 81.8 61.8 , 93.9 Similar
Bedford ASC 84.9 77.6 , 90.5 50.9 51.5 , 60.3 Higher
Carroll County Endoscopy - - 100.0 68.8 , - N/A
Center for Outpatient Care 93.5 80.3 , 98.9 91.7 79.0 , 97.8 Similar
Centers for Pain Solutions 100.0 77.9 , - 100.0 82.9 , - Similar
Concord ASC 83.1 73.9 , 90.1 83.1 73.5 , 90.3 Similar
Concord Endoscopy Center 72.4 54.3 , 86.3 81.5 63.6 , 92.9 Similar
Concord Eye Surgery LLC 64.0 44.1 , 80.8 48.1 30.0 , 66.7 Similar
DH Nashua Endoscopy Center 100.0 91.3 , - 100 91.3 , - Similar
Dr O'Connells PCC, Merrimack 66.7 40.8 , 86.6 64.3 37.6 , 85.6 Similar
Dr O'Connells PCC, Somersworth 50.0 28.9 , 71.1 63.6 42.4 , 81.5 Similar
Elliot 1-Day Surgery Center 98.9 96.4 , 99.8 96.2 88.1 , 99.4 Similar
Elliot Endoscopy 100.0 84.7 , - 100.0 82.9 , - Similar
Hillside Surgical Center 100.0 94.1 , - 100.0 94.4 , - Similar
Laconia Clinic ASC 100.0 91.6 , - 100.0 88.3 , - Similar
Nashua ASC 92.9 83.7 , 97.7 75.7 60.0 , 87.4 Similar
Nashua Eye Surgery Center 85.7 71.1 , 94.6 89.7 74.4 , 97.3 Similar
NH Eye Surgicenter 90.5 72.0 , 98.4 82.4 59.1 , 95.3 Similar
Northeast Surgical Care 91.7 75.1 , 98.6 80.5 66.3 , 90.5 Similar
Orthopaedic Surgery Center 73.9 64.2 , 82.1 81.5 72.6 , 88.5 Similar
Orthopaedic Surgery Center, Derry 74.4 59.9 , 85.8 89.5 76.5 , 96.6 Similar
Parkland Endoscopy Center 100.0 77.9 , - 93.3 64.5 , 94.5 Similar
Portsmouth Regional ASC 95.0 87.0 , 98.7 93.8 86.9 , 97.7 Similar
Salem Surgery Center 99.0 95.4 , - 98.1 90.9 , 99.9 Similar
Stratham ASC 86.7 74.3 , 94.4 100 93.1 , - Similar
Surgery Center of Greater Nashua 93.3 71.3 , 99.7 - - N/A
State Total 88.7 86.8 , 90.3 83.5 81.2 , 85.7 Higher
Note: Carroll County Endoscopy closed prior to the 2013-14 influenza season. The Surgery Center of Greater Nashua was newly licensed and did not need to report data during the 2012-13 season.

NH DHHS/ Division of Public Health Services Healthcare-Associated Infections ASC 2013 Report August 2014
41
Mandatory Influenza Vaccination Policies for Healthcare Personnel
During the 2013-14 influenza season, 11 (41%) of 27 ASCs had a HCP vaccination policy in place, two (7%) did not have one in place but were considering one, and 14 (52%) did not have one in place and were not considering one. Among the 11 ASCs with a policy, one (9%) allowed for only medical exemptions, three (27%) allowed for only medical and religious exemptions, one (9%) allowed for medical, religious, and personal/philosophical exemptions, and one (9%) evaluated exemptions on a case-by-case basis. The remaining five (46%) allowed an exemption for any reason. All 11 (100%) ASCs required unvaccinated HCP with an approved exemption to wear a mask, and five (46%) stated that unvaccinated HCP without an acceptable reason for exemption would be subject to progressive discipline, potentially including termination. ASCs with vaccination policies had significantly higher percentages of influenza vaccination as a whole (98.5%) than ASCs without policies (80.0%). ASCs that utilized progressive discipline, potentially including termination, as a consequence for their unvaccinated HCP without an acceptable reason for exemption had a higher vaccination percentage (99.3%) than ASCs that did not (97.6%), however this difference was not statistically significant. FIGURE 10: Influenza vaccination percentages for ASCs with and without vaccination policies, 2013-14 influenza season
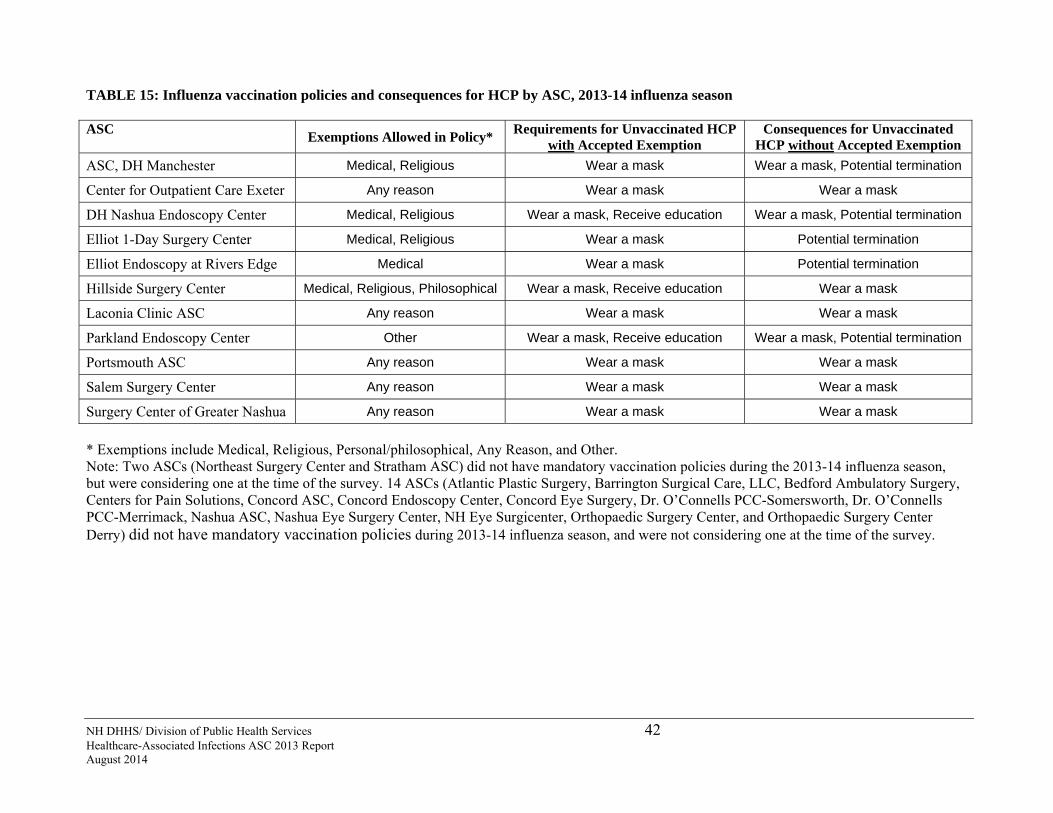
NH DHHS/ Division of Public Health Services 42 Healthcare-Associated Infections ASC 2013 Report August 2014
TABLE 15: Influenza vaccination policies and consequences for HCP by ASC, 2013-14 influenza season ASC
Exemptions Allowed in Policy* Requirements for Unvaccinated HCP
with Accepted Exemption Consequences for Unvaccinated
HCP without Accepted Exemption
ASC, DH Manchester Medical, Religious Wear a mask Wear a mask, Potential termination
Center for Outpatient Care Exeter Any reason Wear a mask Wear a mask
DH Nashua Endoscopy Center Medical, Religious Wear a mask, Receive education Wear a mask, Potential termination
Elliot 1-Day Surgery Center Medical, Religious Wear a mask Potential termination
Elliot Endoscopy at Rivers Edge Medical Wear a mask Potential termination
Hillside Surgery Center Medical, Religious, Philosophical Wear a mask, Receive education Wear a mask
Laconia Clinic ASC Any reason Wear a mask Wear a mask
Parkland Endoscopy Center Other Wear a mask, Receive education Wear a mask, Potential termination
Portsmouth ASC Any reason Wear a mask Wear a mask
Salem Surgery Center Any reason Wear a mask Wear a mask
Surgery Center of Greater Nashua Any reason Wear a mask Wear a mask
* Exemptions include Medical, Religious, Personal/philosophical, Any Reason, and Other. Note: Two ASCs (Northeast Surgery Center and Stratham ASC) did not have mandatory vaccination policies during the 2013-14 influenza season, but were considering one at the time of the survey. 14 ASCs (Atlantic Plastic Surgery, Barrington Surgical Care, LLC, Bedford Ambulatory Surgery, Centers for Pain Solutions, Concord ASC, Concord Endoscopy Center, Concord Eye Surgery, Dr. O’Connells PCC-Somersworth, Dr. O’Connells PCC-Merrimack, Nashua ASC, Nashua Eye Surgery Center, NH Eye Surgicenter, Orthopaedic Surgery Center, and Orthopaedic Surgery Center Derry) did not have mandatory vaccination policies during 2013-14 influenza season, and were not considering one at the time of the survey.

NH DHHS/ Division of Public Health Services 43 Healthcare-Associated Infections ASC 2013 Report August 2014
CONCLUSIONS
This second report of ASC HAI data is an important part of continuing progress toward the goal of eliminating HAIs in New Hampshire. This report provides a picture of selected HAI data, which can be used by healthcare facilities in the State to identify areas for improvement and prevention as well as healthcare consumers to make informed healthcare decisions. Key findings described in this report include the following:
All licensed ASCs in NH complied with the number HAI mandatory reporting law in 2013.
Overall, NH ASCs reported similar infection rates following selected surgeries (breast, hernia, and open reduction of fracture procedures) than predicted based on national data.
All of the 16 ASCs reporting surgical site infections have rates that are similar to national data. Even though the rates are similar, ASCs can work towards to the goal of zero infections.
The percentage of patients who received IV antibiotic prophylaxis within the appropriate timeframe prior to surgery was 98.3%. Three ASCs had a significantly higher adherence rate for this measure, with rates ranging from 99.0% to 100%.
Vaccination rates by ASC during the 2013-14 influenza season ranged from 50.0% to 100.0%. The overall State rate was 88.7%, which represents a significant increase from the 2012-13 influenza season when the statewide vaccination rate was 83.5%.
Eleven NH ASCs had mandatory influenza vaccination policies for HCP during the 2013-14 season. Overall, ASCs with vaccination policies had significantly higher rates of influenza vaccination as a whole (98.5%) than ASCs without mandatory policies (80.0%).
While this report only includes information on a subset of HAIs, the information provided can be used as an important indicator of healthcare quality and infection prevention efforts in NH ambulatory surgery centers. Although data in this report have not been independently validated to assess reporting accuracy, the data will be externally validated in the future. Healthcare consumers can discuss the information provided in this report with their healthcare provider and should review Appendix 3 for information on what individual patients can do to prevent healthcare-associated infections.

NH DHHS/ Division of Public Health Services 44 Healthcare-Associated Infections ASC 2013 Report August 2014
AMBULATORY SURGERY CENTER INDIVIDUAL REPORTS
Because data must be broken down into categories for risk adjustment and because rates must be suppressed if data are too sparse, data that can be presented for New Hampshire facilities may be limited. Due to restrictions on presenting data if not enough procedures were performed, there are several ASCs for which facility-specific infections data cannot be presented. See technical notes for additional information on data restriction and presentation.

NH DHHS/Division of Public Health Services
Healthcare-Associated Infections ASC 2013 Report August 1st, 2014 Page 45
ASC, DH MANCHESTER
Manchester, NH
Not-for-profit
Free standing
# of Procedures: 5,174
Measure Observed
Infections
Expected
Infections
Standardized
Infection Ratio (SIR)
95% Confidence
Interval
Comparison to
Expected
Overall SSI † † † † †
STANDARDIZED INFECTION RATIOS (SIR)
PROCESS MEASURES
Measure Percent Adherence % State Percentage % Comparison to State Percentage
IV Antibiotic Prophylactic Timing 98.6 98.3 Similar
Percent Vaccinated % State Percentage % Comparison to State Percentage
Staff Influenza Vaccination 100.0 88.7 Higher
2013 HAI ASC DATA REPORT
PROCEDURE SPECIFIC RATES BY RISK CATEGORY
Risk Category Infections Procedures ASC Rate National
Rate P-Value
ASC rate Compared to
National Rate
Breast Procedures (BRST)
Risk Category 0 0 46 0.00 0.32 0.867 Similar
Risk Category 1, 2, 3 † † † † † †
Hernia Procedures (HER)
Risk Category 0, 1 0 110 0.00 0.46 0.608 Similar
Risk Category 1, 2 - - - - - -
Open Reduction of Fracture Procedures (FX)
Risk Category 0, 1, 2, 3 - - - - - -
98.3 98.698.4 97.0
70
80
90
100
2012 2013
Surgical IV Antibiotic Prophlaxis Timing
% A
dh
ere
nce
State ASC
Staff Influenza Vaccination
83.588.7
100.0100.0
40
60
80
100
2012-13 2013-14
% V
accin
ate
d
State ASC
Standardized Infection Ratios
0.570.75
0.0
0.3
0.5
0.8
1.0
1.3
1.5
2012 2013
SIR
STATE SSI SIR ASC SSI SIR
† Data not shown
for <1 predicted
infection
†Data are not shown when fewer than 20 procedures were performed - Facility did not perform any procedures in this category in 2013
†Data are not shown when fewer than 20 patients received IV prophylactic in 2013 - Facility did not provide IV prophylactic in 2013
ASC: Ambulatory Surgery Center ICPs: Infection Control Practitioners SSI: Surgical site infection
BRST: Breast procedures HER: Hernia procedures FX: Open Reduction of Fracture Procedures IV: Intravenous

NH DHHS/Division of Public Health Services
Healthcare-Associated Infections ASC 2013 Report August 1st, 2014 Page 46
ATLANTIC PLASTIC SURGERY
Portsmouth, NH
For-profit
Free standing
# of Procedures: 271
Measure Observed
Infections
Expected
Infections
Standardized
Infection Ratio (SIR)
95% Confidence
Interval
Comparison to
Expected
Overall SSI 0 1.27 0.00 - , 2.90 Similar
STANDARDIZED INFECTION RATIOS (SIR)
PROCESS MEASURES
Measure Percent Adherence % State Percentage % Comparison to State Percentage
IV Antibiotic Prophylactic Timing 98.7 98.3 Similar
Percent Vaccinated % State Percentage % Comparison to State Percentage
Staff Influenza Vaccination 63.0 88.7 Lower
ASC: Ambulatory Surgery Center ICPs: Infection Control Practitioners SSI: Surgical site infection
BRST: Breast procedures HER: Hernia procedures FX: Open Reduction of Fracture Procedures IV: Intravenous
2013 HAI ASC DATA REPORT
PROCEDURE SPECIFIC RATES BY RISK CATEGORY
Risk Category Infections Procedures ASC Rate National
Rate P-Value
ASC rate Compared to
National Rate
Breast Procedures (BRST)
Risk Category 0 0 207 0.00 0.32 0.552 Similar
Risk Category 1, 2, 3 0 57 0.00 1.06 0.561 Similar
Hernia Procedures (HER)
Risk Category 0, 1 - - - - - -
Risk Category 1, 2 - - - - - -
Open Reduction of Fracture Procedures (FX)
Risk Category 0, 1, 2, 3 - - - - - -
98.3 98.798.4 99.7
70
80
90
100
2012 2013
Surgical IV Antibiotic Prophlaxis Timing
% A
dh
ere
nce
State ASC
Staff Influenza Vaccination
83.588.7
53.8
63.0
40
60
80
100
2012-13 2013-14
% V
accin
ate
d
State ASC
Standardized Infection Ratios
0.570.75
0.00
1.00
0.0
0.3
0.5
0.8
1.0
1.3
1.5
2012 2013
SIR
STATE SSI SIR ASC SSI SIR
†Data are not shown when fewer than 20 procedures were performed - Facility did not perform any procedures in this category in 2013
†Data are not shown when fewer than 20 patients received IV prophylactic in 2013 - Facility did not provide IV prophylactic in 2013
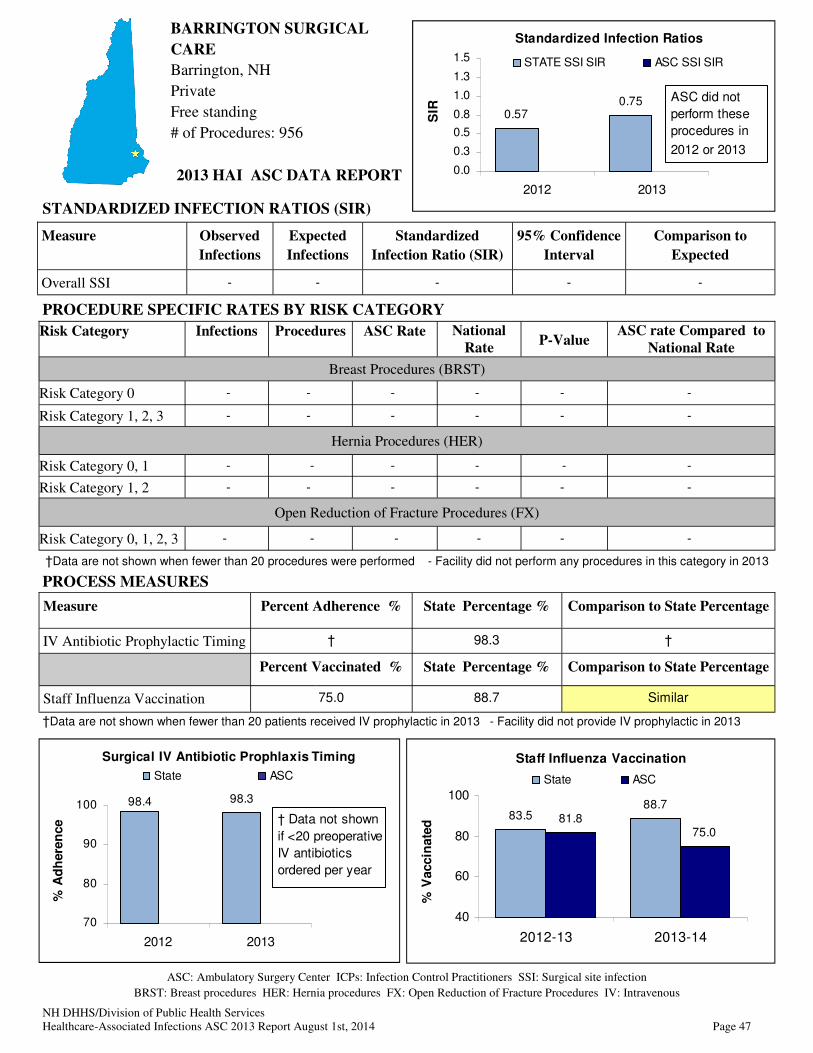
NH DHHS/Division of Public Health Services
Healthcare-Associated Infections ASC 2013 Report August 1st, 2014 Page 47
Measure Observed
Infections
Expected
Infections
Standardized
Infection Ratio (SIR)
95% Confidence
Interval
Comparison to
Expected
Overall SSI - - - - -
STANDARDIZED INFECTION RATIOS (SIR)
PROCESS MEASURES
Measure Percent Adherence % State Percentage % Comparison to State Percentage
IV Antibiotic Prophylactic Timing † 98.3 †
Percent Vaccinated % State Percentage % Comparison to State Percentage
Staff Influenza Vaccination 75.0 88.7 Similar
ASC: Ambulatory Surgery Center ICPs: Infection Control Practitioners SSI: Surgical site infection
BRST: Breast procedures HER: Hernia procedures FX: Open Reduction of Fracture Procedures IV: Intravenous
2013 HAI ASC DATA REPORT
PROCEDURE SPECIFIC RATES BY RISK CATEGORY
Risk Category Infections Procedures ASC Rate National
Rate P-Value
ASC rate Compared to
National Rate
Breast Procedures (BRST)
Risk Category 0 - - - - - -
Risk Category 1, 2, 3 - - - - - -
Hernia Procedures (HER)
Risk Category 0, 1 - - - - - -
Risk Category 1, 2 - - - - - -
Open Reduction of Fracture Procedures (FX)
Risk Category 0, 1, 2, 3 - - - - - -
98.398.4
70
80
90
100
2012 2013
Surgical IV Antibiotic Prophlaxis Timing
% A
dh
ere
nce
State ASC
† Data not shown
if <20 preoperative
IV antibiotics
ordered per year
Staff Influenza Vaccination
83.588.7
81.875.0
40
60
80
100
2012-13 2013-14
% V
accin
ate
d
State ASC
BARRINGTON SURGICAL
CARE
Barrington, NH
Private
Free standing
# of Procedures: 956
Standardized Infection Ratios
0.570.75
0.0
0.3
0.5
0.8
1.0
1.3
1.5
2012 2013
SIR
STATE SSI SIR ASC SSI SIR
ASC did not
perform these
procedures in
2012 or 2013
†Data are not shown when fewer than 20 procedures were performed - Facility did not perform any procedures in this category in 2013
†Data are not shown when fewer than 20 patients received IV prophylactic in 2013 - Facility did not provide IV prophylactic in 2013

NH DHHS/Division of Public Health Services
Healthcare-Associated Infections ASC 2013 Report August 1st, 2014 Page 48
BEDFORD ASC
Bedford, NH
Physician-owned
Free standing
# of Procedures: 6429
Measure Observed
Infections
Expected
Infections
Standardized
Infection Ratio (SIR)
95% Confidence
Interval
Comparison to
Expected
Overall SSI † † † † †
STANDARDIZED INFECTION RATIOS (SIR)
PROCESS MEASURES
Measure Percent Adherence % State Percentage % Comparison to State Percentage
IV Antibiotic Prophylactic Timing 99.4 98.3 Higher
Percent Vaccinated % State Percentage % Comparison to State Percentage
Staff Influenza Vaccination 84.9 88.7 Similar
ASC: Ambulatory Surgery Center ICPs: Infection Control Practitioners SSI: Surgical site infection
BRST: Breast procedures HER: Hernia procedures FX: Open Reduction of Fracture Procedures IV: Intravenous
2013 HAI ASC DATA REPORT
PROCEDURE SPECIFIC RATES BY RISK CATEGORY
Risk Category Infections Procedures ASC Rate National
Rate P-Value
ASC rate Compared to
National Rate
Breast Procedures (BRST)
Risk Category 0 0 51 0.00 0.32 0.854 Similar
Risk Category 1, 2, 3 † † † † † †
Hernia Procedures (HER)
Risk Category 0, 1 0 37 0.00 0.46 0.845 Similar
Risk Category 1, 2 - - - - - -
Open Reduction of Fracture Procedures (FX)
Risk Category 0, 1, 2, 3 0 33 0.00 0.28 0.914 Similar
98.3 99.498.4
99.6
70
80
90
100
2012 2013
Surgical IV Antibiotic Prophlaxis Timing
% A
dh
ere
nce
State ASC
Staff Influenza Vaccination
83.588.7
50.9
84.9
40
60
80
100
2012-13 2013-14
% V
accin
ate
d
State ASC
Standardized Infection Ratios
0.570.75
0.0
0.3
0.5
0.8
1.0
1.3
1.5
2012 2013
SIR
STATE SSI SIR ASC SSI SIR
† Data not shown
for <1 predicted
infection
†Data are not shown when fewer than 20 procedures were performed - Facility did not perform any procedures in this category in 2013
†Data are not shown when fewer than 20 patients received IV prophylactic in 2013 - Facility did not provide IV prophylactic in 2013

NH DHHS/Division of Public Health Services
Healthcare-Associated Infections ASC 2013 Report August 1st, 2014 Page 49
CENTER FOR OUTPATIENT
CARE
Exeter, NH
Not-for-profit
Within a hospital
# of Procedures: 7623
Measure Observed
Infections
Expected
Infections
Standardized
Infection Ratio (SIR)
95% Confidence
Interval
Comparison to
Expected
Overall SSI 1 1.51 0.66 0.01, 3.68 Similar
STANDARDIZED INFECTION RATIOS (SIR)
PROCESS MEASURES
Measure Percent Adherence % State Percentage % Comparison to State Percentage
IV Antibiotic Prophylactic Timing 98.4 98.3 Similar
Percent Vaccinated % State Percentage % Comparison to State Percentage
Staff Influenza Vaccination 93.5 88.7 Similar
ASC: Ambulatory Surgery Center ICPs: Infection Control Practitioners SSI: Surgical site infection
BRST: Breast procedures HER: Hernia procedures FX: Open Reduction of Fracture Procedures IV: Intravenous
2013 HAI ASC DATA REPORT
PROCEDURE SPECIFIC RATES BY RISK CATEGORY
Risk Category Infections Procedures ASC Rate National
Rate P-Value
ASC rate Compared to
National Rate
Breast Procedures (BRST)
Risk Category 0 1 86 1.16 0.32 0.334 Similar
Risk Category 1, 2, 3 0 47 0.00 1.06 0.619 Similar
Hernia Procedures (HER)
Risk Category 0, 1 0 115 0.00 0.46 0.594 Similar
Risk Category 1, 2 † † † † † †
Open Reduction of Fracture Procedures (FX)
Risk Category 0, 1, 2, 3 0 38 0.00 0.28 0.902 Similar
98.3 98.498.496.8
70
80
90
100
2012 2013
Surgical IV Antibiotic Prophlaxis Timing
% A
dh
ere
nce
State ASC
Staff Influenza Vaccination
83.588.7
91.7 93.5
40
60
80
100
2012-13 2013-14
% V
accin
ate
d
State ASC
Standardized Infection Ratios
0.570.75
0.00
0.66
0.0
0.3
0.5
0.8
1.0
1.3
1.5
2012 2013
SIR
STATE SSI SIR ASC SSI SIR
†Data are not shown when fewer than 20 procedures were performed - Facility did not perform any procedures in this category in 2013
†Data are not shown when fewer than 20 patients received IV prophylactic in 2013 - Facility did not provide IV prophylactic in 2013
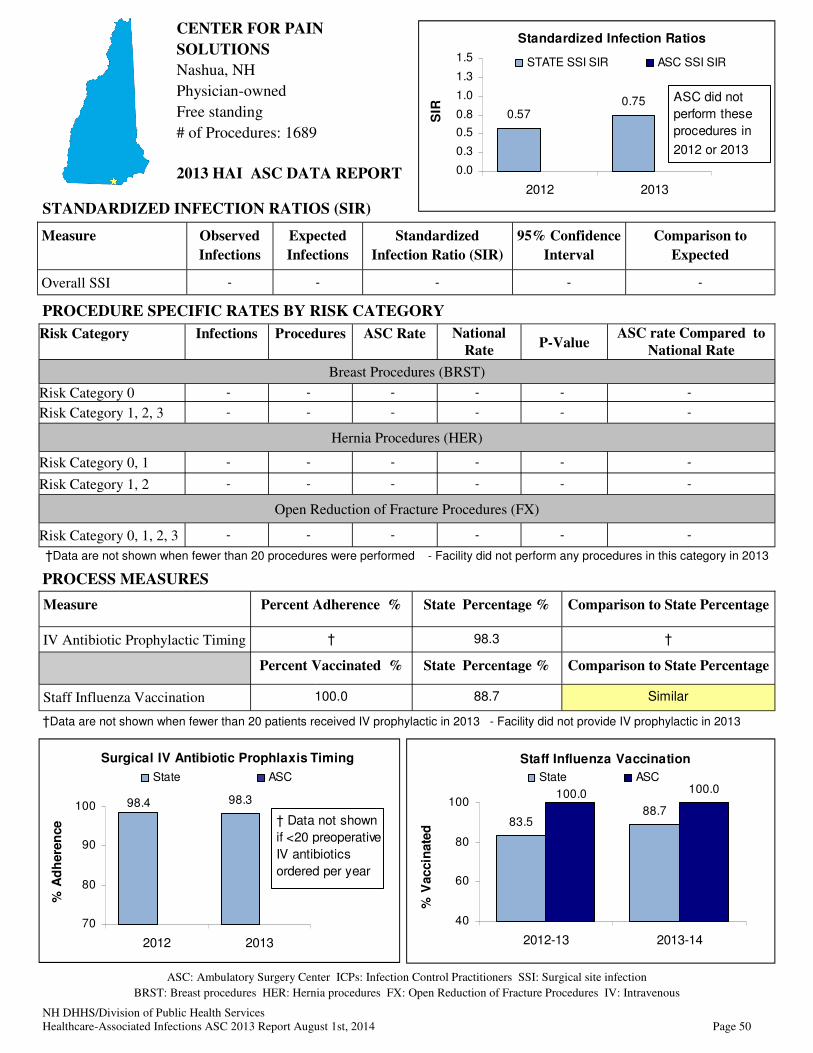
NH DHHS/Division of Public Health Services
Healthcare-Associated Infections ASC 2013 Report August 1st, 2014 Page 50
CENTER FOR PAIN
SOLUTIONS
Nashua, NH
Physician-owned
Free standing
# of Procedures: 1689
Measure Observed
Infections
Expected
Infections
Standardized
Infection Ratio (SIR)
95% Confidence
Interval
Comparison to
Expected
Overall SSI - - - - -
STANDARDIZED INFECTION RATIOS (SIR)
PROCESS MEASURES
Measure Percent Adherence % State Percentage % Comparison to State Percentage
IV Antibiotic Prophylactic Timing † 98.3 †
Percent Vaccinated % State Percentage % Comparison to State Percentage
Staff Influenza Vaccination 100.0 88.7 Similar
ASC: Ambulatory Surgery Center ICPs: Infection Control Practitioners SSI: Surgical site infection
BRST: Breast procedures HER: Hernia procedures FX: Open Reduction of Fracture Procedures IV: Intravenous
2013 HAI ASC DATA REPORT
PROCEDURE SPECIFIC RATES BY RISK CATEGORY
Risk Category Infections Procedures ASC Rate National
Rate P-Value
ASC rate Compared to
National Rate
Breast Procedures (BRST)
Risk Category 0 - - - - - -
Risk Category 1, 2, 3 - - - - - -
Hernia Procedures (HER)
Risk Category 0, 1 - - - - - -
Risk Category 1, 2 - - - - - -
Open Reduction of Fracture Procedures (FX)
Risk Category 0, 1, 2, 3 - - - - - -
Staff Influenza Vaccination
83.588.7
100.0100.0
40
60
80
100
2012-13 2013-14
% V
accin
ate
d
State ASC
98.398.4
70
80
90
100
2012 2013
Surgical IV Antibiotic Prophlaxis Timing
% A
dh
ere
nce
State ASC
† Data not shown
if <20 preoperative
IV antibiotics
ordered per year
Standardized Infection Ratios
0.570.75
0.0
0.3
0.5
0.8
1.0
1.3
1.5
2012 2013
SIR
STATE SSI SIR ASC SSI SIR
ASC did not
perform these
procedures in
2012 or 2013
†Data are not shown when fewer than 20 procedures were performed - Facility did not perform any procedures in this category in 2013
†Data are not shown when fewer than 20 patients received IV prophylactic in 2013 - Facility did not provide IV prophylactic in 2013

NH DHHS/Division of Public Health Services
Healthcare-Associated Infections ASC 2013 Report August 1st, 2014 Page 51
CONCORD ASC
Concord, NH
Not-for-profit
Free standing
# of Procedures: 2281
Measure Observed
Infections
Expected
Infections
Standardized
Infection Ratio (SIR)
95% Confidence
Interval
Comparison to
Expected
Overall SSI † † † † †
STANDARDIZED INFECTION RATIOS (SIR)
PROCESS MEASURES
Measure Percent Adherence % State Percentage % Comparison to State Percentage
IV Antibiotic Prophylactic Timing 93.3 98.3 Lower
Percent Vaccinated % State Percentage % Comparison to State Percentage
Staff Influenza Vaccination 83.1 88.7 Similar
ASC: Ambulatory Surgery Center ICPs: Infection Control Practitioners SSI: Surgical site infection
BRST: Breast procedures HER: Hernia procedures FX: Open Reduction of Fracture Procedures IV: Intravenous
2013 HAI ASC DATA REPORT
PROCEDURE SPECIFIC RATES BY RISK CATEGORY
Risk Category Infections Procedures ASC Rate National
Rate P-Value
ASC rate Compared to
National Rate
Breast Procedures (BRST)
Risk Category 0 0 100 0.00 0.32 0.740 Similar
Risk Category 1, 2, 3 0 49 0.00 1.06 0.607 Similar
Hernia Procedures (HER)
Risk Category 0, 1 † † † † † †
Risk Category 1, 2 † † † † † †
Open Reduction of Fracture Procedures (FX)
Risk Category 0, 1, 2, 3 - - - - - -
98.397.0
93.3
98.4
70
80
90
100
2012 2013
Surgical IV Antibiotic Prophlaxis Timing
% A
dh
ere
nce
State ASC
Staff Influenza Vaccination
83.588.7
83.1 83.1
40
60
80
100
2012-13 2013-14
% V
accin
ate
d
State ASC
Standardized Infection Ratios
0.57
0.0
0.3
0.5
0.8
1.0
1.3
1.5
2012
SIR
STATE SSI SIR ASC SSI SIR
† Data are not shown
for less than one
expected infection.
†Data are not shown when fewer than 20 procedures were performed - Facility did not perform any procedures in this category in 2013
†Data are not shown when fewer than 20 patients received IV prophylactic in 2013 - Facility did not provide IV prophylactic in 2013
Standardized Infection Ratios
0.570.75
0.0
0.3
0.5
0.8
1.0
1.3
1.5
2012 2013
SIR
STATE SSI SIR ASC SSI SIR
† Data not shown
for <1 predicted
infection

NH DHHS/Division of Public Health Services
Healthcare-Associated Infections ASC 2013 Report August 1st, 2014 Page 52
98.398.4
70
80
90
100
2012 2013
Surgical IV Antibiotic Prophlaxis Timing
% A
dh
ere
nce
State ASC
† Data not shown
if <20 preoperative
IV antibiotics
ordered per year
CONCORD ENDOSCOPY
Concord, NH
Joint venture
Free standing
# of Procedures: 5862
Measure Observed
Infections
Expected
Infections
Standardized
Infection Ratio (SIR)
95% Confidence
Interval
Comparison to
Expected
Overall SSI - - - - -
STANDARDIZED INFECTION RATIOS (SIR)
PROCESS MEASURES
Measure Percent Adherence % State Percentage % Comparison to State Percentage
IV Antibiotic Prophylactic Timing - 98.3 -
Percent Vaccinated % State Percentage % Comparison to State Percentage
Staff Influenza Vaccination 72.4 88.7 Lower
ASC: Ambulatory Surgery Center ICPs: Infection Control Practitioners SSI: Surgical site infection
BRST: Breast procedures HER: Hernia procedures FX: Open Reduction of Fracture Procedures IV: Intravenous
2013 HAI ASC DATA REPORT
PROCEDURE SPECIFIC RATES BY RISK CATEGORY
Risk Category Infections Procedures ASC Rate National
Rate P-Value
ASC rate Compared to
National Rate
Breast Procedures (BRST)
Risk Category 0 - - - - - -
Risk Category 1, 2, 3 - - - - - -
Hernia Procedures (HER)
Risk Category 0, 1 - - - - - -
Risk Category 1, 2 - - - - - -
Open Reduction of Fracture Procedures (FX)
Risk Category 0, 1, 2, 3 - - - - - -
Staff Influenza Vaccination
83.588.7
81.5
72.4
40
60
80
100
2012-13 2013-14
% V
accin
ate
d
State ASC
Standardized Infection Ratios
0.570.75
0.0
0.3
0.5
0.8
1.0
1.3
1.5
2012 2013
SIR
STATE SSI SIR ASC SSI SIR
ASC did not
perform these
procedures in
2012 or 2013
†Data are not shown when fewer than 20 procedures were performed - Facility did not perform any procedures in this category in 2013
†Data are not shown when fewer than 20 patients received IV prophylactic in 2013 - Facility did not provide IV prophylactic in 2013
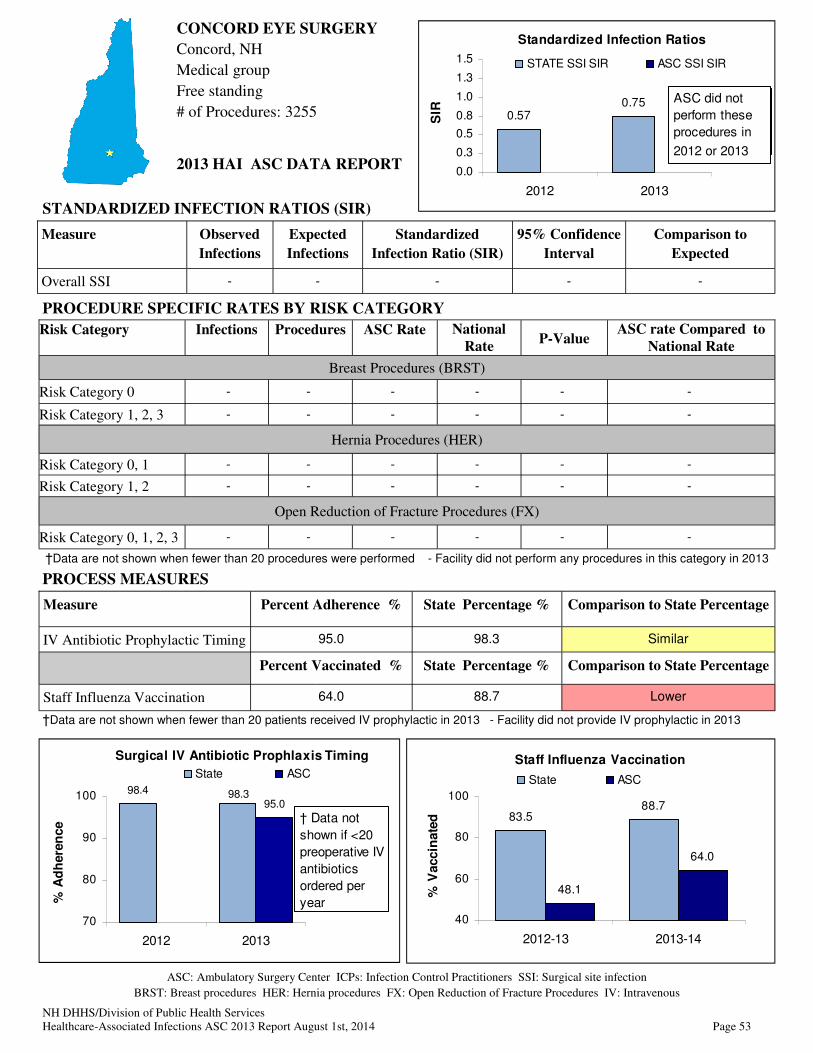
NH DHHS/Division of Public Health Services
Healthcare-Associated Infections ASC 2013 Report August 1st, 2014 Page 53
CONCORD EYE SURGERY
Concord, NH
Medical group
Free standing
# of Procedures: 3255
Measure Observed
Infections
Expected
Infections
Standardized
Infection Ratio (SIR)
95% Confidence
Interval
Comparison to
Expected
Overall SSI - - - - -
STANDARDIZED INFECTION RATIOS (SIR)
PROCESS MEASURES
Measure Percent Adherence % State Percentage % Comparison to State Percentage
IV Antibiotic Prophylactic Timing 95.0 98.3 Similar
Percent Vaccinated % State Percentage % Comparison to State Percentage
Staff Influenza Vaccination 64.0 88.7 Lower
ASC: Ambulatory Surgery Center ICPs: Infection Control Practitioners SSI: Surgical site infection
BRST: Breast procedures HER: Hernia procedures FX: Open Reduction of Fracture Procedures IV: Intravenous
2013 HAI ASC DATA REPORT
PROCEDURE SPECIFIC RATES BY RISK CATEGORY
Risk Category Infections Procedures ASC Rate National
Rate P-Value
ASC rate Compared to
National Rate
Breast Procedures (BRST)
Risk Category 0 - - - - - -
Risk Category 1, 2, 3 - - - - - -
Hernia Procedures (HER)
Risk Category 0, 1 - - - - - -
Risk Category 1, 2 - - - - - -
Open Reduction of Fracture Procedures (FX)
Risk Category 0, 1, 2, 3 - - - - - -
Staff Influenza Vaccination
83.588.7
48.1
64.0
40
60
80
100
2012-13 2013-14
% V
accin
ate
d
State ASC
Standardized Infection Ratios
0.57
0.0
0.3
0.5
0.8
1.0
1.3
1.5
2012
SIR
STATE SSI SIR ASC SSI SIR
- ASC did not perform
these procedures in
2012
98.4
95.098.3
70
80
90
100
2012 2013
Surgical IV Antibiotic Prophlaxis Timing
% A
dh
ere
nce
State ASC
† Data not
shown if <20
preoperative IV
antibiotics
ordered per
year
†Data are not shown when fewer than 20 procedures were performed - Facility did not perform any procedures in this category in 2013
†Data are not shown when fewer than 20 patients received IV prophylactic in 2013 - Facility did not provide IV prophylactic in 2013
Standardized Infection Ratios
0.570.75
0.0
0.3
0.5
0.8
1.0
1.3
1.5
2012 2013
SIR
STATE SSI SIR ASC SSI SIR
ASC did not
perform these
procedures in
2012 or 2013

NH DHHS/Division of Public Health Services
Healthcare-Associated Infections ASC 2013 Report August 1st, 2014 Page 54
98.398.4
70
80
90
100
2012 2013
Surgical IV Antibiotic Prophlaxis Timing
% A
dh
ere
nce
State ASC
† Data not shown
if <20 preoperative
IV antibiotics
ordered per year
DH, NASHUA ENDOSCOPY
Nashua, NH
Not-for-profit
Free standing
# of Procedures: 4385
Measure Observed
Infections
Expected
Infections
Standardized
Infection Ratio (SIR)
95% Confidence
Interval
Comparison to
Expected
Overall SSI - - - - -
STANDARDIZED INFECTION RATIOS (SIR)
PROCESS MEASURES
Measure Percent Adherence % State Percentage % Comparison to State Percentage
IV Antibiotic Prophylactic Timing - 98.3 -
Percent Vaccinated % State Percentage % Comparison to State Percentage
Staff Influenza Vaccination 100.0 88.7 Higher
ASC: Ambulatory Surgery Center ICPs: Infection Control Practitioners SSI: Surgical site infection
BRST: Breast procedures HER: Hernia procedures FX: Open Reduction of Fracture Procedures IV: Intravenous
2013 HAI ASC DATA REPORT
PROCEDURE SPECIFIC RATES BY RISK CATEGORY
Risk Category Infections Procedures ASC Rate National
Rate P-Value
ASC rate Compared to
National Rate
Breast Procedures (BRST)
Risk Category 0 - - - - - -
Risk Category 1, 2, 3 - - - - - -
Hernia Procedures (HER)
Risk Category 0, 1 - - - - - -
Risk Category 1, 2 - - - - - -
Open Reduction of Fracture Procedures (FX)
Risk Category 0, 1, 2, 3 - - - - - -
Staff Influenza Vaccination
83.588.7
100.0100.0
40
60
80
100
2012-13 2013-14
% V
accin
ate
d
State ASC
Standardized Infection Ratios
0.57
0.0
0.3
0.5
0.8
1.0
1.3
1.5
2012
SIR
STATE SSI SIR ASC SSI SIR
- ASC did not perform
these procedures in
2012
†Data are not shown when fewer than 20 procedures were performed - Facility did not perform any procedures in this category for 2013
†Data are not shown when fewer than 20 patients received IV prophylactic in 2013 - Facility did not provide IV prophylactic in 2013
Standardized Infection Ratios
0.570.75
0.0
0.3
0.5
0.8
1.0
1.3
1.5
2012 2013
SIR
STATE SSI SIR ASC SSI SIR
ASC did not
perform these
procedures in
2012 or 2013

NH DHHS/Division of Public Health Services
Healthcare-Associated Infections ASC 2013 Report August 1st, 2014 Page 55
DR. O’CONNELLS PAINCARE
CENTERS, MERRIMACK
Merrimack, NH
For-profit
Free standing
# of Procedures: 2063
Measure Observed
Infections
Expected
Infections
Standardized
Infection Ratio (SIR)
95% Confidence
Interval
Comparison to
Expected
Overall SSI - - - - -
STANDARDIZED INFECTION RATIOS (SIR)
PROCESS MEASURES
Measure Percent Adherence % State Percentage % Comparison to State Percentage
IV Antibiotic Prophylactic Timing † 98.3 †
Percent Vaccinated % State Percentage % Comparison to State Percentage
Staff Influenza Vaccination 66.7 88.7 Lower
ASC: Ambulatory Surgery Center ICPs: Infection Control Practitioners SSI: Surgical site infection
BRST: Breast procedures HER: Hernia procedures FX: Open Reduction of Fracture Procedures IV: Intravenous
2013 HAI ASC DATA REPORT
PROCEDURE SPECIFIC RATES BY RISK CATEGORY
Risk Category Infections Procedures ASC Rate National
Rate P-Value
ASC rate Compared to
National Rate
Breast Procedures (BRST)
Risk Category 0 - - - - - -
Risk Category 1, 2, 3 - - - - - -
Hernia Procedures (HER)
Risk Category 0, 1 - - - - - -
Risk Category 1, 2 - - - - - -
Open Reduction of Fracture Procedures (FX)
Risk Category 0, 1, 2, 3 - - - - - -
98.398.4
90.9
70
80
90
100
2012 2013
Surgical IV Antibiotic Prophlaxis Timing
% A
dh
ere
nce
State ASC
† Data not shown if
<20 preoperative IV
antibiotics ordered
per year
Staff Influenza Vaccination
83.588.7
64.3 66.7
40
60
80
100
2012-13 2013-14
% V
accin
ate
d
State ASC
Standardized Infection Ratios
0.57
0.0
0.3
0.5
0.8
1.0
1.3
1.5
2012
SIR
STATE SSI SIR ASC SSI SIR
- ASC did not perform
these procedures in
2012
†Data are not shown when fewer than 20 procedures were performed - Facility did not perform any procedures in this category in 2013
†Data are not shown when fewer than 20 patients received IV prophylactic in 2013 - Facility did not provide IV prophylactic in 2013
Standardized Infection Ratios
0.570.75
0.0
0.3
0.5
0.8
1.0
1.3
1.5
2012 2013
SIR
STATE SSI SIR ASC SSI SIR
ASC did not
perform these
procedures in
2012 or 2013

NH DHHS/Division of Public Health Services
Healthcare-Associated Infections ASC 2013 Report August 1st, 2014 Page 56
DR. O’CONNELLS PAINCARE
CENTERS, SOMERSWORTH
Somersworth, NH
For profit
Free standing
# of Procedures: 3659
Measure Observed
Infections
Expected
Infections
Standardized
Infection Ratio (SIR)
95% Confidence
Interval
Comparison to
Expected
Overall SSI - - - - -
STANDARDIZED INFECTION RATIOS (SIR)
PROCESS MEASURES
Measure Percent Adherence % State Percentage % Comparison to State Percentage
IV Antibiotic Prophylactic Timing 97.6 98.3 Similar
Percent Vaccinated % State Percentage % Comparison to State Percentage
Staff Influenza Vaccination 50.0 88.7 Lower
ASC: Ambulatory Surgery Center ICPs: Infection Control Practitioners SSI: Surgical site infection
BRST: Breast procedures HER: Hernia procedures FX: Open Reduction of Fracture Procedures IV: Intravenous
2013 HAI ASC DATA REPORT
PROCEDURE SPECIFIC RATES BY RISK CATEGORY
Risk Category Infections Procedures ASC Rate National
Rate P-Value
ASC rate Compared to
National Rate
Breast Procedures (BRST)
Risk Category 0 - - - - - -
Risk Category 1, 2, 3 - - - - - -
Hernia Procedures (HER)
Risk Category 0, 1 - - - - - -
Risk Category 1, 2 - - - - - -
Open Reduction of Fracture Procedures (FX)
Risk Category 0, 1, 2, 3 - - - - - -
98.4 98.3 97.6100.0
70
80
90
100
2012 2013
Surgical IV Antibiotic Prophlaxis Timing
% A
dh
ere
nce
State ASC
Staff Influenza Vaccination
83.588.7
63.6
50.0
40
60
80
100
2012-13 2013-14
% V
accin
ate
d
State ASC
Standardized Infection Ratios
0.57
0.0
0.3
0.5
0.8
1.0
1.3
1.5
2012
SIR
STATE SSI SIR ASC SSI SIR
- ASC did not perform
these procedures in
2012
†Data are not shown when fewer than 20 procedures were performed - Facility did not perform any procedures in this category in 2013
†Data are not shown when fewer than 20 patients received IV prophylactic in 2013 - Facility did not provide IV prophylactic in 2013
Standardized Infection Ratios
0.570.75
0.0
0.3
0.5
0.8
1.0
1.3
1.5
2012 2013
SIR
STATE SSI SIR ASC SSI SIR
ASC did not
perform these
procedures in
2012 or 2013

NH DHHS/Division of Public Health Services
Healthcare-Associated Infections ASC 2013 Report August 1st, 2014 Page 57
ELLIOT 1-DAY SURGERY
CENTER, RIVERS EDGE
Manchester, NH
For-profit
Free standing
# of Procedures: 4802
Measure Observed
Infections
Expected
Infections
Standardized
Infection Ratio (SIR)
95% Confidence
Interval
Comparison to
Expected
Overall SSI 2 1.50 1.34 0.15 , 4.82 Similar
STANDARDIZED INFECTION RATIOS (SIR)
PROCESS MEASURES
Measure Percent Adherence % State Percentage % Comparison to State Percentage
IV Antibiotic Prophylactic Timing 99.1 98.3 Similar
Percent Vaccinated % State Percentage % Comparison to State Percentage
Staff Influenza Vaccination 98.9 88.7 Higher
ASC: Ambulatory Surgery Center ICPs: Infection Control Practitioners SSI: Surgical site infection
BRST: Breast procedures HER: Hernia procedures FX: Open Reduction of Fracture Procedures IV: Intravenous
2013 HAI ASC DATA REPORT
PROCEDURE SPECIFIC RATES BY RISK CATEGORY
Risk Category Infections Procedures ASC Rate National
Rate P-Value
ASC rate Compared to
National Rate
Breast Procedures (BRST)
Risk Category 0 2 200 1.00 0.32 0.255 Similar
Risk Category 1, 2, 3 † † † † † †
Hernia Procedures (HER)
Risk Category 0, 1 0 137 0.00 0.46 0.538 Similar
Risk Category 1, 2 - - - - - -
Open Reduction of Fracture Procedures (FX)
Risk Category 0, 1, 2, 3 † † † † † †
98.3 99.198.4 99.4
70
80
90
100
2012 2013
Surgical IV Antibiotic Prophlaxis Timing
% A
dh
ere
nce
State ASC
Staff Influenza Vaccination
88.7
98.9
83.5
96.2
40
60
80
100
2012-13 2013-14
% V
accin
ate
d
State ASC
Standardized Infection Ratios
0.570.75
1.34
0.0
0.3
0.5
0.8
1.0
1.3
1.5
2012 2013
SIR
STATE SSI SIR ASC SSI SIR
† Data not
shown for
<1predicted
infection
†Data are not shown when fewer than 20 procedures were performed - Facility did not perform any procedures in this category in 2013
†Data are not shown when fewer than 20 patients received IV prophylactic in 2013 - Facility did not provide IV prophylactic in 2013

NH DHHS/Division of Public Health Services
Healthcare-Associated Infections ASC 2013 Report August 1st, 2014 Page 58
98.4 98.3
70
80
90
100
2012 2013
Surgical IV Antibiotic Prophlaxis Timing
% A
dh
ere
nce
State ASC
† Data not shown
if <20 preoperative
IV antibiotics
ordered per year
ELLIOT ENDOSCOPY,
RIVERS EDGE
Manchester, NH
For profit
Free standing
# of Procedures: 4026
Measure Observed
Infections
Expected
Infections
Standardized
Infection Ratio (SIR)
95% Confidence
Interval
Comparison to
Expected
Overall SSI - - - - -
STANDARDIZED INFECTION RATIOS (SIR)
PROCESS MEASURES
Measure Percent Adherence % State Percentage % Comparison to State Percentage
IV Antibiotic Prophylactic Timing - 98.3 -
Percent Vaccinated % State Percentage % Comparison to State Percentage
Staff Influenza Vaccination 100.0 88.7 Similar
ASC: Ambulatory Surgery Center ICPs: Infection Control Practitioners SSI: Surgical site infection
BRST: Breast procedures HER: Hernia procedures FX: Open Reduction of Fracture Procedures IV: Intravenous
2013 HAI ASC DATA REPORT
PROCEDURE SPECIFIC RATES BY RISK CATEGORY
Risk Category Infections Procedures ASC Rate National
Rate P-Value
ASC rate Compared to
National Rate
Breast Procedures (BRST)
Risk Category 0 - - - - - -
Risk Category 1, 2, 3 - - - - - -
Hernia Procedures (HER)
Risk Category 0, 1 - - - - - -
Risk Category 1, 2 - - - - - -
Open Reduction of Fracture Procedures (FX)
Risk Category 0, 1, 2, 3 - - - - - -
Staff Influenza Vaccination
83.588.7
100.0100.0
40
60
80
100
2012-13 2013-14
% V
accin
ate
d
State ASC
Standardized Infection Ratios
0.57
0.0
0.3
0.5
0.8
1.0
1.3
1.5
2012
SIR
STATE SSI SIR ASC SSI SIR
- ASC did not perform
these procedures in
2012
†Data are not shown when fewer than 20 procedures were performed - Facility did not perform any procedures in this category for 2013
†Data are not shown when fewer than 20 patients received IV prophylactic in 2013 - Facility did not provide IV prophylactic in 2013
Standardized Infection Ratios
0.570.75
0.0
0.3
0.5
0.8
1.0
1.3
1.5
2012 2013
SIR
STATE SSI SIR ASC SSI SIR
ASC did not
perform these
procedures in
2012 or 2013
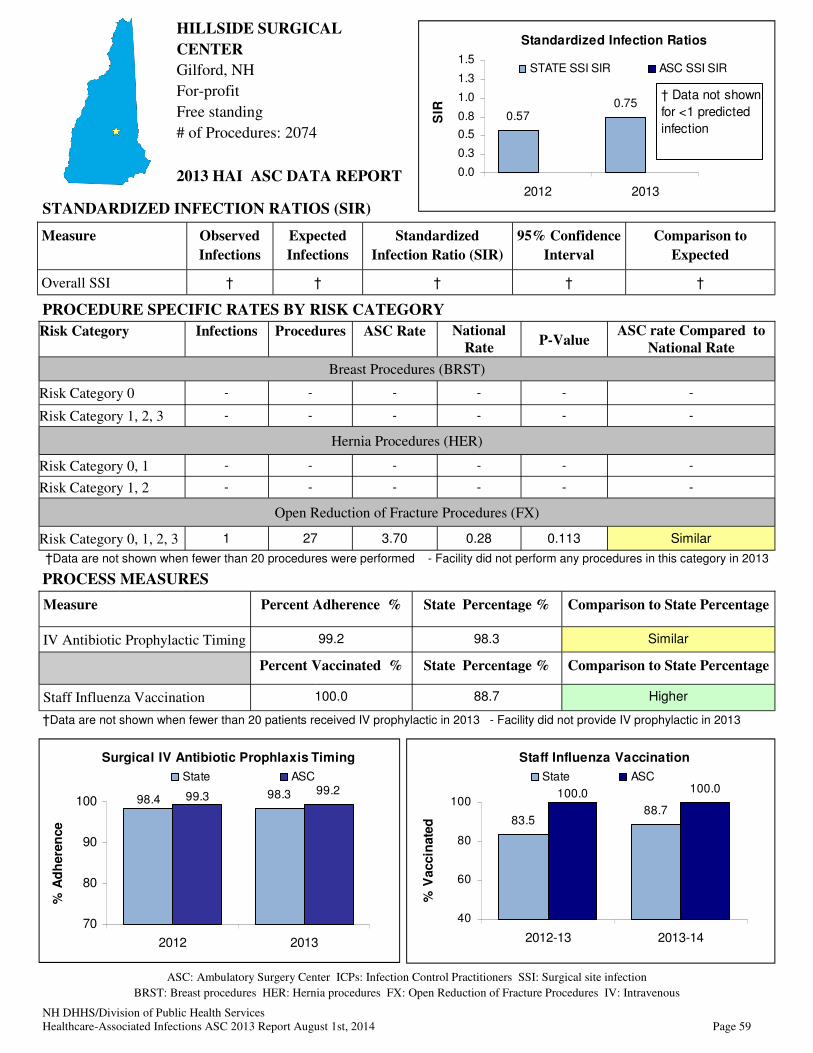
NH DHHS/Division of Public Health Services
Healthcare-Associated Infections ASC 2013 Report August 1st, 2014 Page 59
HILLSIDE SURGICAL
CENTER
Gilford, NH
For-profit
Free standing
# of Procedures: 2074
Measure Observed
Infections
Expected
Infections
Standardized
Infection Ratio (SIR)
95% Confidence
Interval
Comparison to
Expected
Overall SSI † † † † †
STANDARDIZED INFECTION RATIOS (SIR)
PROCESS MEASURES
Measure Percent Adherence % State Percentage % Comparison to State Percentage
IV Antibiotic Prophylactic Timing 99.2 98.3 Similar
Percent Vaccinated % State Percentage % Comparison to State Percentage
Staff Influenza Vaccination 100.0 88.7 Higher
ASC: Ambulatory Surgery Center ICPs: Infection Control Practitioners SSI: Surgical site infection
BRST: Breast procedures HER: Hernia procedures FX: Open Reduction of Fracture Procedures IV: Intravenous
2013 HAI ASC DATA REPORT
PROCEDURE SPECIFIC RATES BY RISK CATEGORY
Risk Category Infections Procedures ASC Rate National
Rate P-Value
ASC rate Compared to
National Rate
Breast Procedures (BRST)
Risk Category 0 - - - - - -
Risk Category 1, 2, 3 - - - - - -
Hernia Procedures (HER)
Risk Category 0, 1 - - - - - -
Risk Category 1, 2 - - - - - -
Open Reduction of Fracture Procedures (FX)
Risk Category 0, 1, 2, 3 1 27 3.70 0.28 0.113 Similar
98.3 99.298.4 99.3
70
80
90
100
2012 2013
Surgical IV Antibiotic Prophlaxis Timing
% A
dh
ere
nce
State ASC
Staff Influenza Vaccination
83.588.7
100.0100.0
40
60
80
100
2012-13 2013-14
% V
accin
ate
d
State ASC
Standardized Infection Ratios
0.57
0.0
0.3
0.5
0.8
1.0
1.3
1.5
2012
SIR
STATE SSI SIR ASC SSI SIR
† Data are not shown
for less than one
expected infection.
†Data are not shown when fewer than 20 procedures were performed - Facility did not perform any procedures in this category in 2013
†Data are not shown when fewer than 20 patients received IV prophylactic in 2013 - Facility did not provide IV prophylactic in 2013
Standardized Infection Ratios
0.570.75
0.0
0.3
0.5
0.8
1.0
1.3
1.5
2012 2013
SIR
STATE SSI SIR ASC SSI SIR
† Data not shown
for <1 predicted
infection

NH DHHS/Division of Public Health Services
Healthcare-Associated Infections ASC 2013 Report August 1st, 2014 Page 60
LACONIA CLINIC, ASC
Laconia, NH
Not-for-profit
Free standing
# of Procedures: 1628
Measure Observed
Infections
Expected
Infections
Standardized
Infection Ratio (SIR)
95% Confidence
Interval
Comparison to
Expected
Overall SSI † † † † †
STANDARDIZED INFECTION RATIOS (SIR)
PROCESS MEASURES
Measure Percent Adherence % State Percentage % Comparison to State Percentage
IV Antibiotic Prophylactic Timing 86.2 98.3 Lower
Percent Vaccinated % State Percentage % Comparison to State Percentage
Staff Influenza Vaccination 100.0 88.7 Higher
ASC: Ambulatory Surgery Center ICPs: Infection Control Practitioners SSI: Surgical site infection
BRST: Breast procedures HER: Hernia procedures FX: Open Reduction of Fracture Procedures IV: Intravenous
2013 HAI ASC DATA REPORT
PROCEDURE SPECIFIC RATES BY RISK CATEGORY
Risk Category Infections Procedures ASC Rate National
Rate P-Value
ASC rate Compared to
National Rate
Breast Procedures (BRST)
Risk Category 0 † † † † † †
Risk Category 1, 2, 3 † † † † † †
Hernia Procedures (HER)
Risk Category 0, 1 - - - - - -
Risk Category 1, 2 - - - - - -
Open Reduction of Fracture Procedures (FX)
Risk Category 0, 1, 2, 3 - - - - - -
98.4
86.2
98.3
0.00
70
80
90
100
2012 2013
Surgical IV Antibiotic Prophlaxis Timing
% A
dh
ere
nce
State ASC
† Data not
shown if <20
preoperative
IV antibiotics
ordered per
year
Staff Influenza Vaccination
83.588.7
100.0100.0
40
60
80
100
2012-13 2013-14
% V
accin
ate
d
State ASC
Standardized Infection Ratios
0.570.75
0.0
0.3
0.5
0.8
1.0
1.3
1.5
2012 2013
SIR
STATE SSI SIR ASC SSI SIR
-ASC did not perform
these procedures in
2012
† Data not shown for
<1 predicted infection
†Data are not shown when fewer than 20 procedures were performed - Facility did not perform any procedures in this category in 2013
†Data are not shown when fewer than 20 patients received IV prophylactic in 2013 - Facility did not provide IV prophylactic in 2013
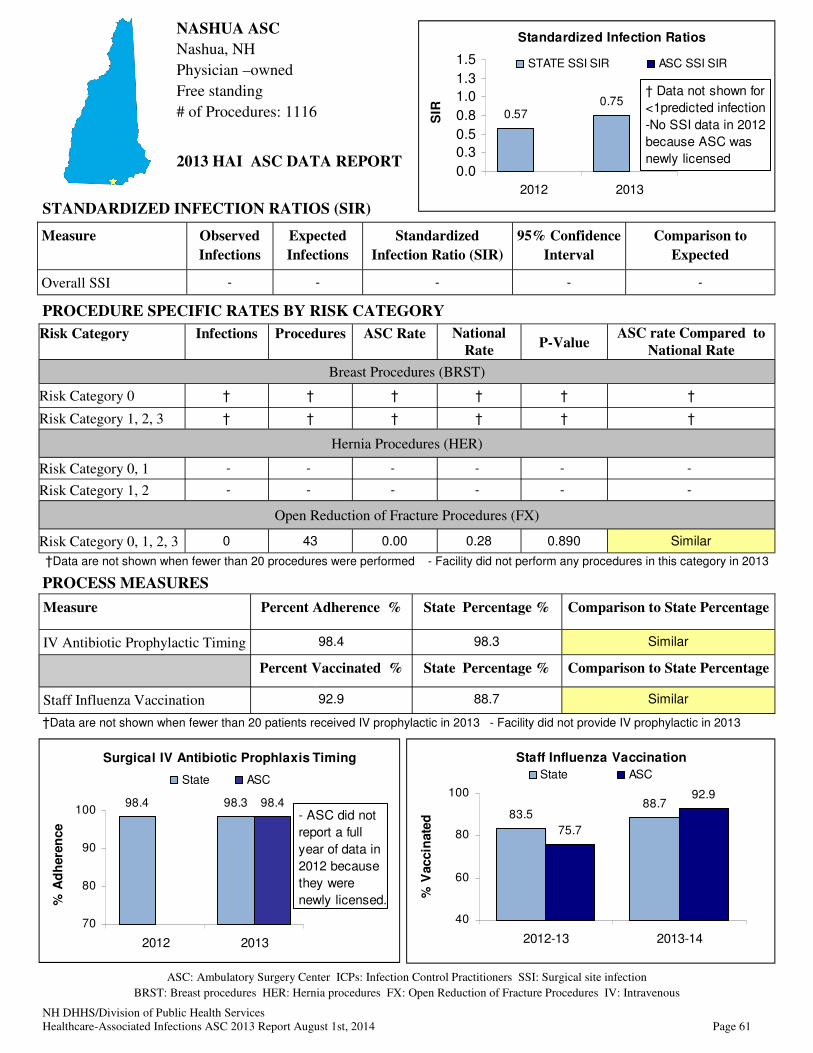
NH DHHS/Division of Public Health Services
Healthcare-Associated Infections ASC 2013 Report August 1st, 2014 Page 61
NASHUA ASC
Nashua, NH
Physician –owned
Free standing
# of Procedures: 1116
Measure Observed
Infections
Expected
Infections
Standardized
Infection Ratio (SIR)
95% Confidence
Interval
Comparison to
Expected
Overall SSI - - - - -
STANDARDIZED INFECTION RATIOS (SIR)
PROCESS MEASURES
Measure Percent Adherence % State Percentage % Comparison to State Percentage
IV Antibiotic Prophylactic Timing 98.4 98.3 Similar
Percent Vaccinated % State Percentage % Comparison to State Percentage
Staff Influenza Vaccination 92.9 88.7 Similar
ASC: Ambulatory Surgery Center ICPs: Infection Control Practitioners SSI: Surgical site infection
BRST: Breast procedures HER: Hernia procedures FX: Open Reduction of Fracture Procedures IV: Intravenous
2013 HAI ASC DATA REPORT
PROCEDURE SPECIFIC RATES BY RISK CATEGORY
Risk Category Infections Procedures ASC Rate National
Rate P-Value
ASC rate Compared to
National Rate
Breast Procedures (BRST)
Risk Category 0 † † † † † †
Risk Category 1, 2, 3 † † † † † †
Hernia Procedures (HER)
Risk Category 0, 1 - - - - - -
Risk Category 1, 2 - - - - - -
Open Reduction of Fracture Procedures (FX)
Risk Category 0, 1, 2, 3 0 43 0.00 0.28 0.890 Similar
98.4 98.3 98.4
70
80
90
100
2012 2013
Surgical IV Antibiotic Prophlaxis Timing
% A
dh
ere
nce
State ASC
- ASC did not
report a full
year of data in
2012 because
they were
newly licensed.
Staff Influenza Vaccination
83.588.7
75.7
92.9
40
60
80
100
2012-13 2013-14
% V
accin
ate
d
State ASC
Standardized Infection Ratios
0.570.75
0.0
0.3
0.5
0.8
1.0
1.3
1.5
2012 2013
SIR
STATE SSI SIR ASC SSI SIR
† Data not shown for
<1predicted infection
-No SSI data in 2012
because ASC was
newly licensed
†Data are not shown when fewer than 20 procedures were performed - Facility did not perform any procedures in this category in 2013
†Data are not shown when fewer than 20 patients received IV prophylactic in 2013 - Facility did not provide IV prophylactic in 2013

NH DHHS/Division of Public Health Services
Healthcare-Associated Infections ASC 2013 Report August 1st, 2014 Page 62
NASHUA EYE SURGERY
CENTER / NOVAMED
Nashua, NH
Corporate/Physician-owned
Free standing
# of Procedures: 1978
Measure Observed
Infections
Expected
Infections
Standardized
Infection Ratio (SIR)
95% Confidence
Interval
Comparison to
Expected
Overall SSI - - - - -
STANDARDIZED INFECTION RATIOS (SIR)
PROCESS MEASURES
Measure Percent Adherence % State Percentage % Comparison to State Percentage
IV Antibiotic Prophylactic Timing - 98.3 -
Percent Vaccinated % State Percentage % Comparison to State Percentage
Staff Influenza Vaccination 85.7 88.7 Similar
ASC: Ambulatory Surgery Center ICPs: Infection Control Practitioners SSI: Surgical site infection
BRST: Breast procedures HER: Hernia procedures FX: Open Reduction of Fracture Procedures IV: Intravenous
2013 HAI ASC DATA REPORT
PROCEDURE SPECIFIC RATES BY RISK CATEGORY
Risk Category Infections Procedures ASC Rate National
Rate P-Value
ASC rate Compared to
National Rate
Breast Procedures (BRST)
Risk Category 0 - - - - - -
Risk Category 1, 2, 3 - - - - - -
Hernia Procedures (HER)
Risk Category 0, 1 - - - - - -
Risk Category 1, 2 - - - - - -
Open Reduction of Fracture Procedures (FX)
Risk Category 0, 1, 2, 3 - - - - - -
98.4 98.3
70
80
90
100
2012 2013
Surgical IV Antibiotic Prophlaxis Timing
% A
dh
ere
nce
State ASC
† Data not shown
if <20 preoperative
IV antibiotics
ordered per year
Staff Influenza Vaccination
83.588.789.7
85.7
40
60
80
100
2012-13 2013-14
% V
accin
ate
d
State ASC
Standardized Infection Ratios
0.57
0.0
0.3
0.5
0.8
1.0
1.3
1.5
2012
SIR
STATE SSI SIR ASC SSI SIR
- ASC did not perform
these procedures in
2012
†Data are not shown when fewer than 20 procedures were performed - Facility did not perform any procedures in this category in 2013
†Data are not shown when fewer than 20 patients received IV prophylactic in 2013 - Facility did not provide IV prophylactic in 2013
Standardized Infection Ratios
0.570.75
0.0
0.3
0.5
0.8
1.0
1.3
1.5
2012 2013
SIR
STATE SSI SIR ASC SSI SIR
ASC did not
perform these
procedures in
2012 or 2013
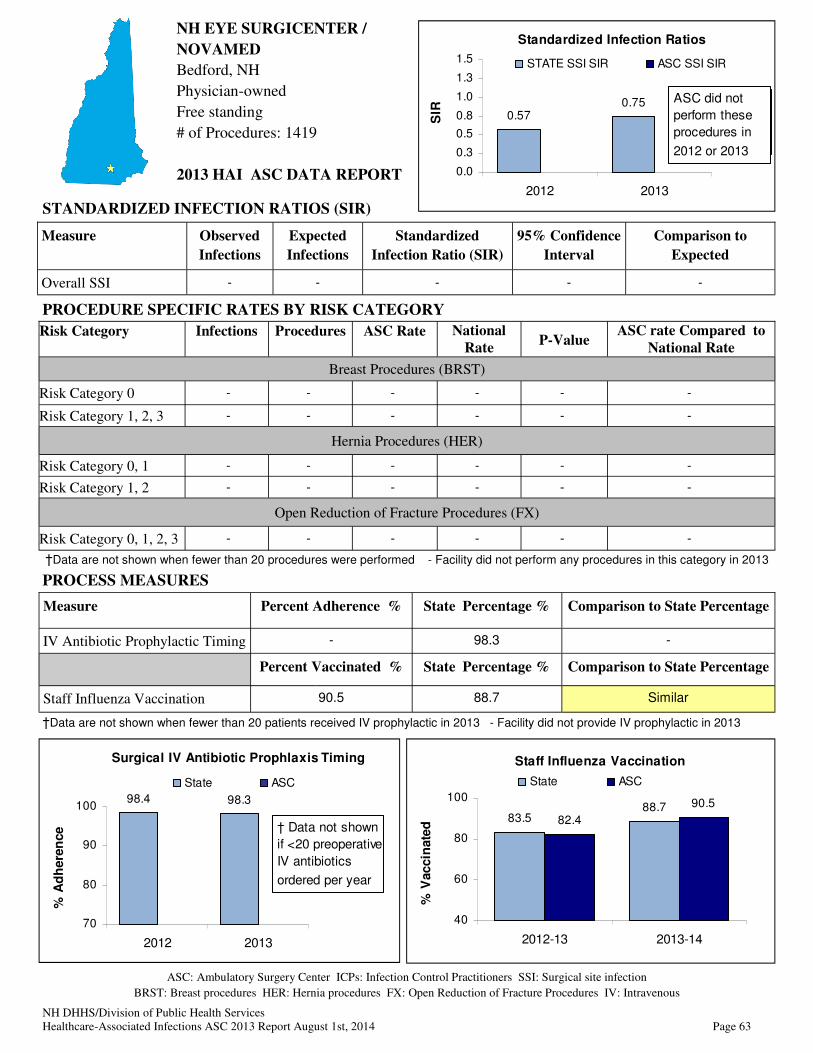
NH DHHS/Division of Public Health Services
Healthcare-Associated Infections ASC 2013 Report August 1st, 2014 Page 63
NH EYE SURGICENTER /
NOVAMED
Bedford, NH
Physician-owned
Free standing
# of Procedures: 1419
Measure Observed
Infections
Expected
Infections
Standardized
Infection Ratio (SIR)
95% Confidence
Interval
Comparison to
Expected
Overall SSI - - - - -
STANDARDIZED INFECTION RATIOS (SIR)
PROCESS MEASURES
Measure Percent Adherence % State Percentage % Comparison to State Percentage
IV Antibiotic Prophylactic Timing - 98.3 -
Percent Vaccinated % State Percentage % Comparison to State Percentage
Staff Influenza Vaccination 90.5 88.7 Similar
ASC: Ambulatory Surgery Center ICPs: Infection Control Practitioners SSI: Surgical site infection
BRST: Breast procedures HER: Hernia procedures FX: Open Reduction of Fracture Procedures IV: Intravenous
2013 HAI ASC DATA REPORT
PROCEDURE SPECIFIC RATES BY RISK CATEGORY
Risk Category Infections Procedures ASC Rate National
Rate P-Value
ASC rate Compared to
National Rate
Breast Procedures (BRST)
Risk Category 0 - - - - - -
Risk Category 1, 2, 3 - - - - - -
Hernia Procedures (HER)
Risk Category 0, 1 - - - - - -
Risk Category 1, 2 - - - - - -
Open Reduction of Fracture Procedures (FX)
Risk Category 0, 1, 2, 3 - - - - - -
Staff Influenza Vaccination
83.588.7
82.4
90.5
40
60
80
100
2012-13 2013-14
% V
accin
ate
d
State ASC
Standardized Infection Ratios
0.57
0.0
0.3
0.5
0.8
1.0
1.3
1.5
2012
SIR
STATE SSI SIR ASC SSI SIR
- ASC did not perform
these procedures in
2012
98.4 98.3
70
80
90
100
2012 2013
Surgical IV Antibiotic Prophlaxis Timing
% A
dh
ere
nce
State ASC
† Data not shown
if <20 preoperative
IV antibiotics
ordered per year
†Data are not shown when fewer than 20 procedures were performed - Facility did not perform any procedures in this category in 2013
†Data are not shown when fewer than 20 patients received IV prophylactic in 2013 - Facility did not provide IV prophylactic in 2013
Standardized Infection Ratios
0.570.75
0.0
0.3
0.5
0.8
1.0
1.3
1.5
2012 2013
SIR
STATE SSI SIR ASC SSI SIR
ASC did not
perform these
procedures in
2012 or 2013
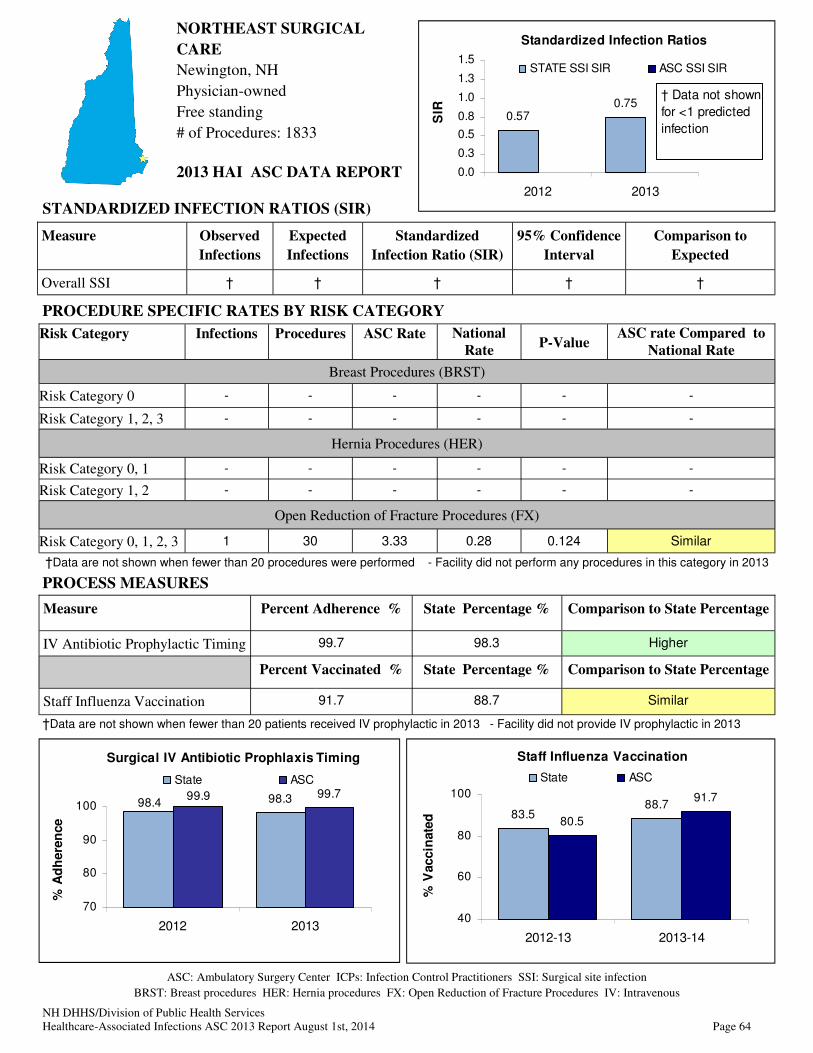
NH DHHS/Division of Public Health Services
Healthcare-Associated Infections ASC 2013 Report August 1st, 2014 Page 64
NORTHEAST SURGICAL
CARE
Newington, NH
Physician-owned
Free standing
# of Procedures: 1833
Measure Observed
Infections
Expected
Infections
Standardized
Infection Ratio (SIR)
95% Confidence
Interval
Comparison to
Expected
Overall SSI † † † † †
STANDARDIZED INFECTION RATIOS (SIR)
PROCESS MEASURES
Measure Percent Adherence % State Percentage % Comparison to State Percentage
IV Antibiotic Prophylactic Timing 99.7 98.3 Higher
Percent Vaccinated % State Percentage % Comparison to State Percentage
Staff Influenza Vaccination 91.7 88.7 Similar
ASC: Ambulatory Surgery Center ICPs: Infection Control Practitioners SSI: Surgical site infection
BRST: Breast procedures HER: Hernia procedures FX: Open Reduction of Fracture Procedures IV: Intravenous
2013 HAI ASC DATA REPORT
PROCEDURE SPECIFIC RATES BY RISK CATEGORY
Risk Category Infections Procedures ASC Rate National
Rate P-Value
ASC rate Compared to
National Rate
Breast Procedures (BRST)
Risk Category 0 - - - - - -
Risk Category 1, 2, 3 - - - - - -
Hernia Procedures (HER)
Risk Category 0, 1 - - - - - -
Risk Category 1, 2 - - - - - -
Open Reduction of Fracture Procedures (FX)
Risk Category 0, 1, 2, 3 1 30 3.33 0.28 0.124 Similar
98.3 99.798.4
99.9
70
80
90
100
2012 2013
Surgical IV Antibiotic Prophlaxis Timing
% A
dh
ere
nce
State ASC
Staff Influenza Vaccination
83.588.7
80.5
91.7
40
60
80
100
2012-13 2013-14
% V
accin
ate
d
State ASC
Standardized Infection Ratios
0.57
0.0
0.3
0.5
0.8
1.0
1.3
1.5
2012
SIR
STATE SSI SIR ASC SSI SIR
† Data are not shown
for less than one
expected infection.
†Data are not shown when fewer than 20 procedures were performed - Facility did not perform any procedures in this category in 2013
†Data are not shown when fewer than 20 patients received IV prophylactic in 2013 - Facility did not provide IV prophylactic in 2013
Standardized Infection Ratios
0.570.75
0.0
0.3
0.5
0.8
1.0
1.3
1.5
2012 2013
SIR
STATE SSI SIR ASC SSI SIR
† Data not shown
for <1 predicted
infection

NH DHHS/Division of Public Health Services
Healthcare-Associated Infections ASC 2013 Report August 1st, 2014 Page 65
ORTHOPAEDIC SURGERY
CENTER
Concord, NH
Not-for-profit
Free standing
# of Procedures: 5205
Measure Observed
Infections
Expected
Infections
Standardized
Infection Ratio (SIR)
95% Confidence
Interval
Comparison to
Expected
Overall SSI † † † † †
STANDARDIZED INFECTION RATIOS (SIR)
PROCESS MEASURES
Measure Percent Adherence % State Percentage % Comparison to State Percentage
IV Antibiotic Prophylactic Timing 97.1 98.3 Lower
Percent Vaccinated % State Percentage % Comparison to State Percentage
Staff Influenza Vaccination 73.9 88.7 Lower
ASC: Ambulatory Surgery Center ICPs: Infection Control Practitioners SSI: Surgical site infection
BRST: Breast procedures HER: Hernia procedures FX: Open Reduction of Fracture Procedures IV: Intravenous
2013 HAI ASC DATA REPORT
PROCEDURE SPECIFIC RATES BY RISK CATEGORY
Risk Category Infections Procedures ASC Rate National
Rate P-Value
ASC rate Compared to
National Rate
Breast Procedures (BRST)
Risk Category 0 - - - - - -
Risk Category 1, 2, 3 - - - - - -
Hernia Procedures (HER)
Risk Category 0, 1 - - - - - -
Risk Category 1, 2 - - - - - -
Open Reduction of Fracture Procedures (FX)
Risk Category 0, 1, 2, 3 0 75 0.00 0.28 0.820 Similar
98.3 97.198.4 98.8
70
80
90
100
2012 2013
Surgical IV Antibiotic Prophlaxis Timing
% A
dh
ere
nce
State ASC
Staff Influenza Vaccination
83.588.7
81.5
73.9
40
60
80
100
2012-13 2013-14
% V
accin
ate
d
State ASC
Standardized Infection Ratios
0.57
0.0
0.3
0.5
0.8
1.0
1.3
1.5
2012
SIR
STATE SSI SIR ASC SSI SIR
† Data are not shown
for less than one
expected infection.
†Data are not shown when fewer than 20 procedures were performed - Facility did not perform any procedures in this category in 2013
†Data are not shown when fewer than 20 patients received IV prophylactic in 2013 - Facility did not provide IV prophylactic in 2013
Standardized Infection Ratios
0.570.75
0.0
0.3
0.5
0.8
1.0
1.3
1.5
2012 2013
SIR
STATE SSI SIR ASC SSI SIR
† Data not shown
for <1 predicted
infection
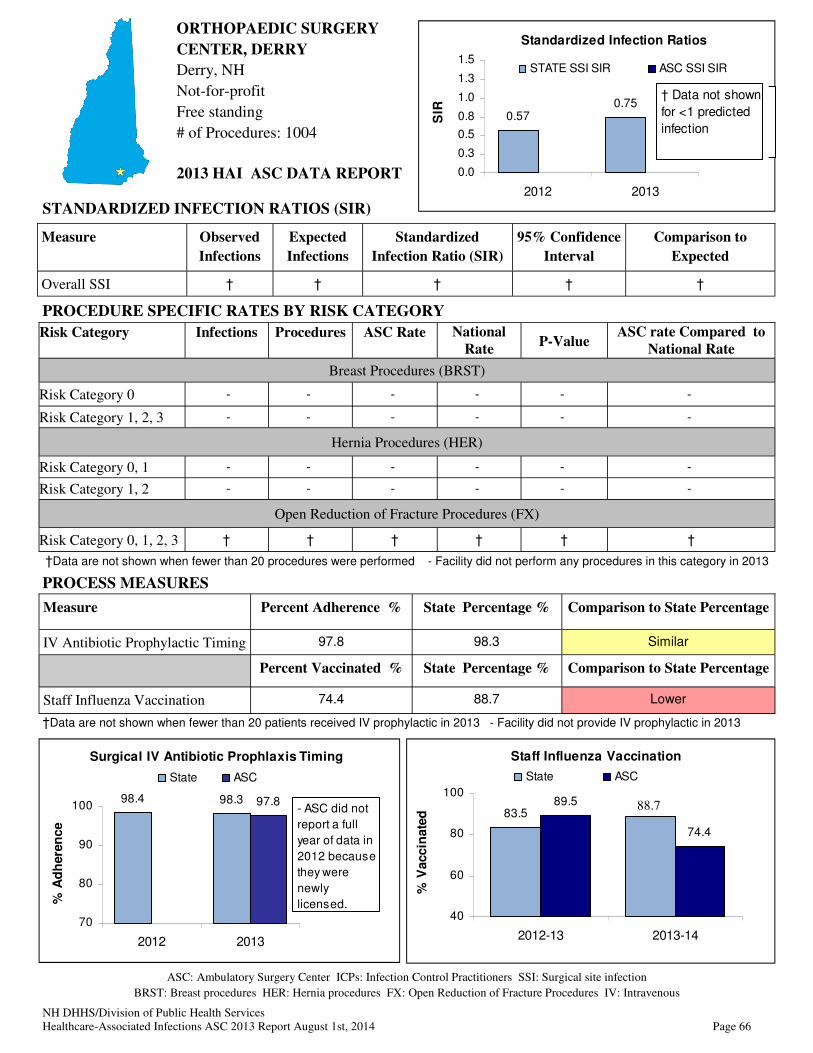
NH DHHS/Division of Public Health Services
Healthcare-Associated Infections ASC 2013 Report August 1st, 2014 Page 66
ORTHOPAEDIC SURGERY
CENTER, DERRY
Derry, NH
Not-for-profit
Free standing
# of Procedures: 1004
Measure Observed
Infections
Expected
Infections
Standardized
Infection Ratio (SIR)
95% Confidence
Interval
Comparison to
Expected
Overall SSI † † † † †
STANDARDIZED INFECTION RATIOS (SIR)
PROCESS MEASURES
Measure Percent Adherence % State Percentage % Comparison to State Percentage
IV Antibiotic Prophylactic Timing 97.8 98.3 Similar
Percent Vaccinated % State Percentage % Comparison to State Percentage
Staff Influenza Vaccination 74.4 88.7 Lower
ASC: Ambulatory Surgery Center ICPs: Infection Control Practitioners SSI: Surgical site infection
BRST: Breast procedures HER: Hernia procedures FX: Open Reduction of Fracture Procedures IV: Intravenous
2013 HAI ASC DATA REPORT
PROCEDURE SPECIFIC RATES BY RISK CATEGORY
Risk Category Infections Procedures ASC Rate National
Rate P-Value
ASC rate Compared to
National Rate
Breast Procedures (BRST)
Risk Category 0 - - - - - -
Risk Category 1, 2, 3 - - - - - -
Hernia Procedures (HER)
Risk Category 0, 1 - - - - - -
Risk Category 1, 2 - - - - - -
Open Reduction of Fracture Procedures (FX)
Risk Category 0, 1, 2, 3 † † † † † †
Staff Influenza Vaccination
89.5
74.4
83.5
40
60
80
100
2012-13 2013-14
% V
accin
ate
d
State ASC
Standardized Infection Ratios
0.57
0.0
0.3
0.5
0.8
1.0
1.3
1.5
2012
SIR
STATE SSI SIR ASC SSI SIR
- ASC did not perform
these procedures in
2012
98.4 98.3 97.8
70
80
90
100
2012 2013
Surgical IV Antibiotic Prophlaxis Timing
% A
dh
ere
nce
State ASC
- ASC did not
report a full
year of data in
2012 because
they were
newly
licensed.
- Did not report SSI
data because ASC was
newly licensed in 2012
†Data are not shown when fewer than 20 procedures were performed - Facility did not perform any procedures in this category in 2013
†Data are not shown when fewer than 20 patients received IV prophylactic in 2013 - Facility did not provide IV prophylactic in 2013
Standardized Infection Ratios
0.570.75
0.0
0.3
0.5
0.8
1.0
1.3
1.5
2012 2013
SIR
STATE SSI SIR ASC SSI SIR
† Data not shown
for <1 predicted
infection
88.7

NH DHHS/Division of Public Health Services
Healthcare-Associated Infections ASC 2013 Report August 1st, 2014 Page 67
PARKLAND ENDOSCOPY
CENTER
Derry, NH
For-profit
Free-standing
# of Procedures: 2555
Measure Observed
Infections
Expected
Infections
Standardized
Infection Ratio (SIR)
95% Confidence
Interval
Comparison to
Expected
Overall SSI - - - - -
STANDARDIZED INFECTION RATIOS (SIR)
PROCESS MEASURES
Measure Percent Adherence % State Percentage % Comparison to State Percentage
IV Antibiotic Prophylactic Timing † 98.3 †
Percent Vaccinated % State Percentage % Comparison to State Percentage
Staff Influenza Vaccination 100.0 88.7 Similar
ASC: Ambulatory Surgery Center ICPs: Infection Control Practitioners SSI: Surgical site infection
BRST: Breast procedures HER: Hernia procedures FX: Open Reduction of Fracture Procedures IV: Intravenous
2013 HAI ASC DATA REPORT
PROCEDURE SPECIFIC RATES BY RISK CATEGORY
Risk Category Infections Procedures ASC Rate National
Rate P-Value
ASC rate Compared to
National Rate
Breast Procedures (BRST)
Risk Category 0 - - - - - -
Risk Category 1, 2, 3 - - - - - -
Hernia Procedures (HER)
Risk Category 0, 1 - - - - - -
Risk Category 1, 2 - - - - - -
Open Reduction of Fracture Procedures (FX)
Risk Category 0, 1, 2, 3 - - - - - -
98.4 98.3
70
80
90
100
2012 2013
Surgical IV Antibiotic Prophlaxis Timing
% A
dh
ere
nce
State ASC
† Data not shown
if <20 preoperative
IV antibiotics
ordered per year
Staff Influenza Vaccination
83.588.7
93.3100.0
40
60
80
100
2012-13 2013-14
% V
accin
ate
d
State ASC
Standardized Infection Ratios
0.57
0.0
0.3
0.5
0.8
1.0
1.3
1.5
2012
SIR
STATE SSI SIR ASC SSI SIR
- ASC did not perform
these procedures in
2012
†Data are not shown when fewer than 20 procedures were performed - Facility did not perform any procedures in this category in 2013
†Data are not shown when fewer than 20 patients received IV prophylactic in 2013 - Facility did not provide IV prophylactic in 2013
Standardized Infection Ratios
0.570.75
0.0
0.3
0.5
0.8
1.0
1.3
1.5
2012 2013
SIR
STATE SSI SIR ASC SSI SIR
ASC did not
perform these
procedures in
2012 or 2013

NH DHHS/Division of Public Health Services
Healthcare-Associated Infections ASC 2013 Report August 1st, 2014 Page 68
PORTSMOUTH REGIONAL
ASC
Portsmouth, NH
Physician-owned
Free standing
# of Procedures: 2702
Measure Observed
Infections
Expected
Infections
Standardized
Infection Ratio (SIR)
95% Confidence
Interval
Comparison to
Expected
Overall SSI † † † † †
STANDARDIZED INFECTION RATIOS (SIR)
PROCESS MEASURES
Measure Percent Adherence % State Percentage % Comparison to State Percentage
IV Antibiotic Prophylactic Timing 99.8 98.3 Higher
Percent Vaccinated % State Percentage % Comparison to State Percentage
Staff Influenza Vaccination 95.0 88.7 Similar
ASC: Ambulatory Surgery Center ICPs: Infection Control Practitioners SSI: Surgical site infection
BRST: Breast procedures HER: Hernia procedures FX: Open Reduction of Fracture Procedures IV: Intravenous
2013 HAI ASC DATA REPORT
PROCEDURE SPECIFIC RATES BY RISK CATEGORY
Risk Category Infections Procedures ASC Rate National
Rate P-Value
ASC rate Compared to
National Rate
Breast Procedures (BRST)
Risk Category 0 - - - - - -
Risk Category 1, 2, 3 - - - - - -
Hernia Procedures (HER)
Risk Category 0, 1 - - - - - -
Risk Category 1, 2 - - - - - -
Open Reduction of Fracture Procedures (FX)
Risk Category 0, 1, 2, 3 0 21 0.00 0.28 0.944 Similar
Surgical IV Antibiotic Prophylaxis Timing
98.4 98.396.5
99.8
70
80
90
100
2012 2013
% A
dh
ere
nc
e
State ASC
Staff Influenza Vaccination
83.588.7
93.8 95.0
40.0
50.0
60.0
70.0
80.0
90.0
100.0
2012-13 2013-14
%V
accin
ate
d
State ASC
Standardized Infection Ratios
0.57
0.0
0.3
0.5
0.8
1.0
1.3
1.5
2012
SIR
STATE SSI SIR ASC SSI SIR
† Data are not shown
for less than one
expected infection.
†Data are not shown when fewer than 20 procedures were performed - Facility did not perform any procedures in this category in 2013
†Data are not shown when fewer than 20 patients received IV prophylactic in 2013 - Facility did not provide IV prophylactic in 2013
Standardized Infection Ratios
0.570.75
0.0
0.3
0.5
0.8
1.0
1.3
1.5
2012 2013
SIR
STATE SSI SIR ASC SSI SIR
† Data not shown
for <1 predicted
infection

NH DHHS/Division of Public Health Services
Healthcare-Associated Infections ASC 2013 Report August 1st, 2014 Page 69
SALEM SURGERY CENTER
Salem, NH
For-profit
Free standing
# of Procedures: 3974
Measure Observed
Infections
Expected
Infections
Standardized
Infection Ratio (SIR)
95% Confidence
Interval
Comparison to
Expected
Overall SSI † † † † †
STANDARDIZED INFECTION RATIOS (SIR)
PROCESS MEASURES
Measure Percent Adherence % State Percentage % Comparison to State Percentage
IV Antibiotic Prophylactic Timing 99.1 98.3 Similar
Percent Vaccinated % State Percentage % Comparison to State Percentage
Staff Influenza Vaccination 99.0 88.7 Higher
ASC: Ambulatory Surgery Center ICPs: Infection Control Practitioners SSI: Surgical site infection
BRST: Breast procedures HER: Hernia procedures FX: Open Reduction of Fracture Procedures IV: Intravenous
2013 HAI ASC DATA REPORT
PROCEDURE SPECIFIC RATES BY RISK CATEGORY
Risk Category Infections Procedures ASC Rate National
Rate P-Value
ASC rate Compared to
National Rate
Breast Procedures (BRST)
Risk Category 0 0 122 0.00 0.32 0.695 Similar
Risk Category 1, 2, 3 † † † † † †
Hernia Procedures (HER)
Risk Category 0, 1 0 54 0.00 0.46 0.783 Similar
Risk Category 1, 2 - - - - - -
Open Reduction of Fracture Procedures (FX)
Risk Category 0, 1, 2, 3 † † † † † †
Surgical IV Antibiotic Prophylaxis Timing
98.4 98.399.2 99.1
70
80
90
100
2012 2013
% A
dh
ere
nce
State ASC
Staff Influenza Vaccination
83.588.7
98.1 99.0
40
60
80
100
2012-13 2013-14
% V
accin
ate
d
State ASC
Standardized Infection Ratios
0.57
0.0
0.3
0.5
0.8
1.0
1.3
1.5
2012
SIR
STATE SSI SIR ASC SSI SIR
† Data are not shown
for less than one
expected infection.
†Data are not shown when fewer than 20 procedures were performed - Facility did not perform any procedures in this category in 2013
†Data are not shown when fewer than 20 patients received IV prophylactic in 2013 - Facility did not provide IV prophylactic in 2013
Standardized Infection Ratios
0.570.75
0.0
0.3
0.5
0.8
1.0
1.3
1.5
2012 2013
SIR
STATE SSI SIR ASC SSI SIR
† Data not shown
for <1 predicted
infection

NH DHHS/Division of Public Health Services
Healthcare-Associated Infections ASC 2013 Report August 1st, 2014 Page 70
Surgical IV Antibiotic Prophylaxis Timing
98.4 98.396.8 97.1
70
80
90
100
2012 2013
% A
dh
ere
nce
State ASC
STRATHAM ASC
Stratham, NH
Physician-owned
Free standing
# of Procedures: 1820
Measure Observed
Infections
Expected
Infections
Standardized
Infection Ratio (SIR)
95% Confidence
Interval
Comparison to
Expected
Overall SSI † † † † †
STANDARDIZED INFECTION RATIOS (SIR)
PROCESS MEASURES
Measure Percent Adherence % State Percentage % Comparison to State Percentage
IV Antibiotic Prophylactic Timing 97.1 98.3 Similar
Percent Vaccinated % State Percentage % Comparison to State Percentage
Staff Influenza Vaccination 86.7 88.7 Similar
ASC: Ambulatory Surgery Center ICPs: Infection Control Practitioners SSI: Surgical site infection
BRST: Breast procedures HER: Hernia procedures FX: Open Reduction of Fracture Procedures IV: Intravenous
2013 HAI ASC DATA REPORT
PROCEDURE SPECIFIC RATES BY RISK CATEGORY
Risk Category Infections Procedures ASC Rate National
Rate P-Value
ASC rate Compared to
National Rate
Breast Procedures (BRST)
Risk Category 0 0 64 0.00 0.32 0.822 Similar
Risk Category 1, 2, 3 † † † † † †
Hernia Procedures (HER)
Risk Category 0, 1 † † † † † †
Risk Category 1, 2 - - - - - -
Open Reduction of Fracture Procedures (FX)
Risk Category 0, 1, 2, 3 - - - - - -
Staff Influenza Vaccination
83.588.7 86.7
100.0
40
60
80
100
2012-13 2013-14
% V
accin
ate
d
State ASC
Standardized Infection Ratios
0.57
0.0
0.3
0.5
0.8
1.0
1.3
1.5
2012
SIR
STATE SSI SIR ASC SSI SIR
† Data are not shown
for less than one
expected infection.
†Data are not shown when fewer than 20 procedures were performed - Facility did not perform any procedures in this category in 2013
†Data are not shown when fewer than 20 patients received IV prophylactic in 2013 - Facility did not provide IV prophylactic in 2013
Standardized Infection Ratios
0.570.75
0.0
0.3
0.5
0.8
1.0
1.3
1.5
2012 2013
SIR
STATE SSI SIR ASC SSI SIR
† Data not shown
for <1 predicted
infection

NH DHHS/Division of Public Health Services
Healthcare-Associated Infections ASC 2013 Report August 1st, 2014 Page 71
100.098.3
70
80
90
100
2013
Surgical IV Antibiotic Prophlaxis Timing
% A
dh
ere
nce
State ASC
Surgery Center of Greater
Nashua
Nashua, NH
Not-for-profit
Free standing
# of Procedures: 43
Measure Observed
Infections
Expected
Infections
Standardized
Infection Ratio (SIR)
95% Confidence
Interval
Comparison to
Expected
Overall SSI - - - - -
STANDARDIZED INFECTION RATIOS (SIR)
PROCESS MEASURES
Measure Percent Adherence % State Percentage % Comparison to State Percentage
IV Antibiotic Prophylactic Timing 100.0 98.3 Similar
Percent Vaccinated % State Percentage % Comparison to State Percentage
Staff Influenza Vaccination 93.3 88.7 Similar
ASC: Ambulatory Surgery Center ICPs: Infection Control Practitioners SSI: Surgical site infection
BRST: Breast procedures HER: Hernia procedures FX: Open Reduction of Fracture Procedures IV: Intravenous
2013 HAI ASC DATA REPORT
PROCEDURE SPECIFIC RATES BY RISK CATEGORY
Risk Category Infections Procedures ASC Rate National
Rate P-Value
ASC rate Compared to
National Rate
Breast Procedures (BRST)
Risk Category 0 - - - - - -
Risk Category 1, 2, 3 - - - - - -
Hernia Procedures (HER)
Risk Category 0, 1 - - - - - -
Risk Category 1, 2 - - - - - -
Open Reduction of Fracture Procedures (FX)
Risk Category 0, 1, 2, 3 - - - - - -
Staff Influenza Vaccination
88.7 93.3
40
60
80
100
2013-14
% V
accin
ate
d
State ASC
Standardized Infection Ratios
0.57
0.0
0.3
0.5
0.8
1.0
1.3
1.5
2012
SIR
STATE SSI SIR ASC SSI SIR
† Data are not shown
for less than one
expected infection.
†Data are not shown when fewer than 20 procedures were performed - Facility did not perform any procedures in this category in 2013
†Data are not shown when fewer than 20 patients received IV prophylactic in 2013 - Facility did not provide IV prophylactic in 2013
Standardized Infection Ratios
0.75
0.0
0.3
0.5
0.8
1.0
1.3
1.5
2013
SIR
STATE SSI SIR ASC SSI SIR
Did not report SSI
data because ASC
was newly licensed in
2013

NH DHHS/ Division of Public Health Services 72 Healthcare-Associated Infections ASC 2013 Report August 2014
APPENDIX 1: Technical Notes
1. Data in this report were extracted from NHSN on 07/15/2014. Changes or new infections reported by ASCs after this date are not reflected in this report.
2. The SSI national comparison data used in this report come from the 2009 NHSN Report. The 2009 NHSN report summarizes data reported to NHSN from 2006–2008. These reports are available at: http://www.cdc.gov/nhsn/PDFs/dataStat/2009NHSNReport.pdf
3. Rate data were risk-adjusted and were only presented if appropriately risk-adjusted as follows:
a. SSI: Rate data must be broken down by both type of procedure and risk category. Data can be aggregated only if the procedure and risk category are the same.
4. Rates for any grouping were not presented if data were insufficient to generate a stable rate.
a. SSI: There must be at least 20 procedures in the denominator to present a rate.
5. Standardized Infection Ratios for any grouping were not presented if less than one infection was predicted.
6. All confidence intervals presented in this report are 95% confidence intervals. A confidence interval is a measure of certainty (usually with 95% confidence) of an estimate (such as a percentage). Because we can never obtain a facility’s true “population” data (e.g., all patients for all time), we use statistical procedures to “estimate” various measurements using “sample” data. Since estimates have “variability” we use 95% confidence limits to describe the variability around the estimate. The confidence interval (CI) gives us the range within which the TRUE value will fall 95% of the time, assuming that the sample data are reflective of the true population. If the confidence intervals for the two rates overlap, then it is reasonably possible that the REAL rates are not different from one another.
7. Statistical significance is affected by sample size. If a value is almost or just barely significant, just a few additional observations can push significance one-way or the other (i.e., not significant or significant).
Standardized Infection Ratios
8. Calculating a standardized infection ratio (SIR): The standardized infection ratio is the number of observed infections divided by the number of predicted infections based on most recent national data. In order to calculate an SIR, it is recommended that there be at least one predicted number of infections. See Appendix 2 for more information on the SIR.
9. Interpreting a standardized infection ratio (SIR): The resulting SIR is a comparison between the number of observed infections and the number predicted.
a. An SIR of 1.0 means that exactly the same number of infections was observed as was predicted.
b. An SIR of less than one means that fewer infections were observed than was predicted (for example, SIR = 0.70 would be interpreted as 30% fewer infections observed than predicted).
c. An SIR of more than one means that fewer infections were observed than was predicted (for example, SIR = 1.30 would be interpreted as 30% more infections observed than predicted).
10. Calculating a corresponding confidence interval for a standardized infection ratio: The calculations for determining the 95% confidence interval for SIRs in this report are taken from:

NH DHHS/ Division of Public Health Services Healthcare-Associated Infections ASC 2013 Report August 2014
73
Liddell FD. Simple exact analysis of the standardised mortality ratio. Journal of Epidemiology and Community Health, 1984; 38:85-88. 11
11. Interpreting a standardized infection ratio confidence interval (CI): A confidence interval is a measure of certainty (usually with 95% confidence) of an estimate (such as a Standardized Infection Ratio). Confidence intervals can be used to assess whether differences in the number of observed and predicted infections is statistically significant (or significantly different).
a. For CIs that contain the value 1.0, the observed number of infections will be considered “Similar” to the predicted number of infections based on national data (e.g., 0.27–1.49).
b. For CIs that are lower than and do not contain the value 1.0, the observed number of infections will be considered "Lower" than the predicted number of infections based on national data (e.g., 0.13–0.74).
c. For CIs that are higher than and do not contain the value 1.0, the observed number of infections will be considered "Higher" than the predicted number of infections based on national data (e.g., 1.09–2.63).
Infection Rates
12. Calculating a surgical site infection rate and associated p-value: SSI rates are presented as the number of infections per 100 procedures.
SSI rate = (number of infections / number of procedures) x 100
13. Interpreting a p-value: All ASC-specific rates and corresponding p-values in this report were generated directly by NHSN using Poisson statistical methods. State level rates and corresponding p-values were calculated by DHHS using exact methods. A p-value provides a statistical comparison of two values in order to determine whether those values are statistically different or similar. In this report, p-values are used to assess whether ASC infection rates are similar or different to national infection rates. A p-value of <0.05 would indicate the ASC rate is significantly different than the national rate.
a. If the p-value is ≥0.05, then the ASC rate would be considered statistically “Similar” to the national rate.
b. If the ASC rate is lower than the national rate and the p-value is <0.05, then the ASC rate would be considered significantly “Lower” than the national rate.
c. If the ASC rate is higher than the national rate and the p-value is <0.05, then the ASC rate would be considered significantly “Higher” than the national rate.
Process Measure Percentages
14. Calculating an influenza vaccination percentage: Influenza vaccination percentages are presented as the number of persons vaccinated divided by the total number of persons expressed as a percent.
Influenza Vaccination (%) = (number of persons vaccinated / total number of persons) x 100
15. Calculating a surgical IV antimicrobial prophylaxis adherence percentage: Surgical IV antimicrobial prophylaxis adherence percentages are presented as the number of persons whose
11 Liddell FD. Simple exact analysis of the standardised mortality ratio. Journal of Epidemiology and Community Health, 1984; 38:85-88.
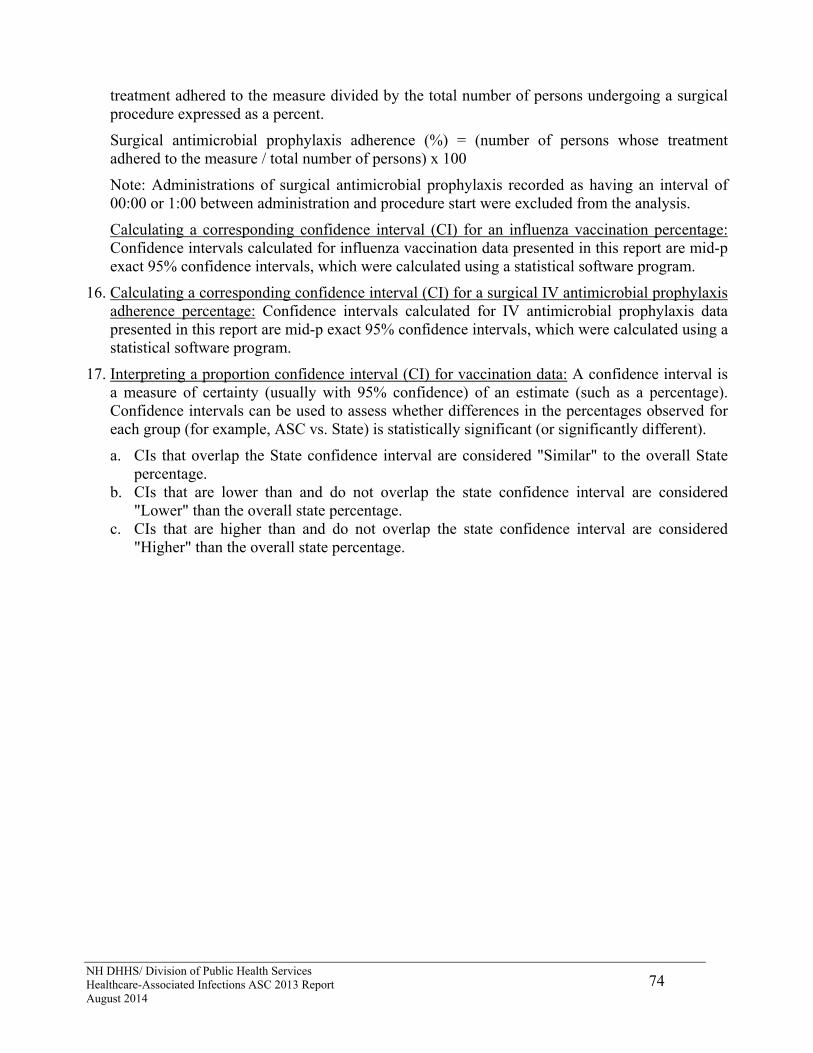
NH DHHS/ Division of Public Health Services Healthcare-Associated Infections ASC 2013 Report August 2014
74
treatment adhered to the measure divided by the total number of persons undergoing a surgical procedure expressed as a percent.
Surgical antimicrobial prophylaxis adherence (%) = (number of persons whose treatment adhered to the measure / total number of persons) x 100
Note: Administrations of surgical antimicrobial prophylaxis recorded as having an interval of 00:00 or 1:00 between administration and procedure start were excluded from the analysis.
Calculating a corresponding confidence interval (CI) for an influenza vaccination percentage: Confidence intervals calculated for influenza vaccination data presented in this report are mid-p exact 95% confidence intervals, which were calculated using a statistical software program.
16. Calculating a corresponding confidence interval (CI) for a surgical IV antimicrobial prophylaxis adherence percentage: Confidence intervals calculated for IV antimicrobial prophylaxis data presented in this report are mid-p exact 95% confidence intervals, which were calculated using a statistical software program.
17. Interpreting a proportion confidence interval (CI) for vaccination data: A confidence interval is a measure of certainty (usually with 95% confidence) of an estimate (such as a percentage). Confidence intervals can be used to assess whether differences in the percentages observed for each group (for example, ASC vs. State) is statistically significant (or significantly different).
a. CIs that overlap the State confidence interval are considered "Similar" to the overall State percentage.
b. CIs that are lower than and do not overlap the state confidence interval are considered "Lower" than the overall state percentage.
c. CIs that are higher than and do not overlap the state confidence interval are considered "Higher" than the overall state percentage.
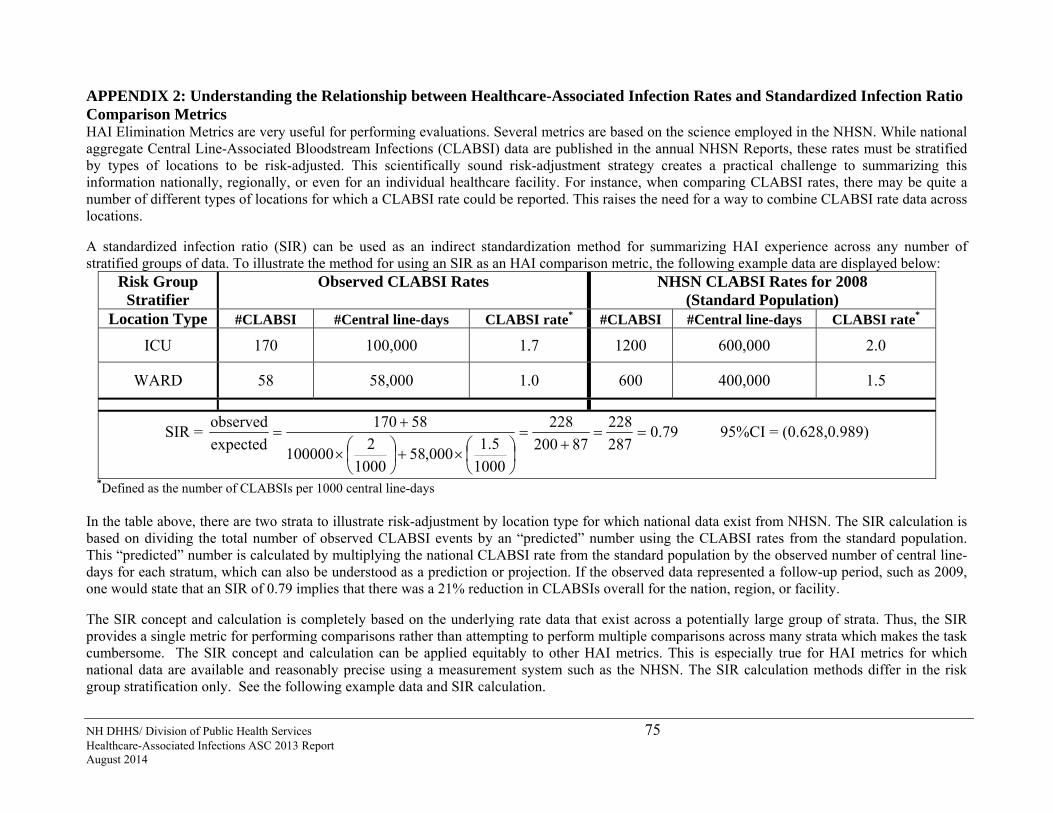
NH DHHS/ Division of Public Health Services 75 Healthcare-Associated Infections ASC 2013 Report August 2014
APPENDIX 2: Understanding the Relationship between Healthcare-Associated Infection Rates and Standardized Infection Ratio Comparison Metrics HAI Elimination Metrics are very useful for performing evaluations. Several metrics are based on the science employed in the NHSN. While national aggregate Central Line-Associated Bloodstream Infections (CLABSI) data are published in the annual NHSN Reports, these rates must be stratified by types of locations to be risk-adjusted. This scientifically sound risk-adjustment strategy creates a practical challenge to summarizing this information nationally, regionally, or even for an individual healthcare facility. For instance, when comparing CLABSI rates, there may be quite a number of different types of locations for which a CLABSI rate could be reported. This raises the need for a way to combine CLABSI rate data across locations. A standardized infection ratio (SIR) can be used as an indirect standardization method for summarizing HAI experience across any number of stratified groups of data. To illustrate the method for using an SIR as an HAI comparison metric, the following example data are displayed below:
Risk Group Stratifier
Observed CLABSI Rates NHSN CLABSI Rates for 2008 (Standard Population)
Location Type #CLABSI #Central line-days CLABSI rate* #CLABSI #Central line-days CLABSI rate*
ICU 170 100,000 1.7 1200 600,000 2.0
WARD 58 58,000 1.0 600 400,000 1.5
SIR = 79.0287
228
87200
228
1000
5.1000,58
1000
2100000
58170
expected
observed
95%CI = (0.628,0.989)
*Defined as the number of CLABSIs per 1000 central line-days In the table above, there are two strata to illustrate risk-adjustment by location type for which national data exist from NHSN. The SIR calculation is based on dividing the total number of observed CLABSI events by an “predicted” number using the CLABSI rates from the standard population. This “predicted” number is calculated by multiplying the national CLABSI rate from the standard population by the observed number of central line-days for each stratum, which can also be understood as a prediction or projection. If the observed data represented a follow-up period, such as 2009, one would state that an SIR of 0.79 implies that there was a 21% reduction in CLABSIs overall for the nation, region, or facility. The SIR concept and calculation is completely based on the underlying rate data that exist across a potentially large group of strata. Thus, the SIR provides a single metric for performing comparisons rather than attempting to perform multiple comparisons across many strata which makes the task cumbersome. The SIR concept and calculation can be applied equitably to other HAI metrics. This is especially true for HAI metrics for which national data are available and reasonably precise using a measurement system such as the NHSN. The SIR calculation methods differ in the risk group stratification only. See the following example data and SIR calculation.
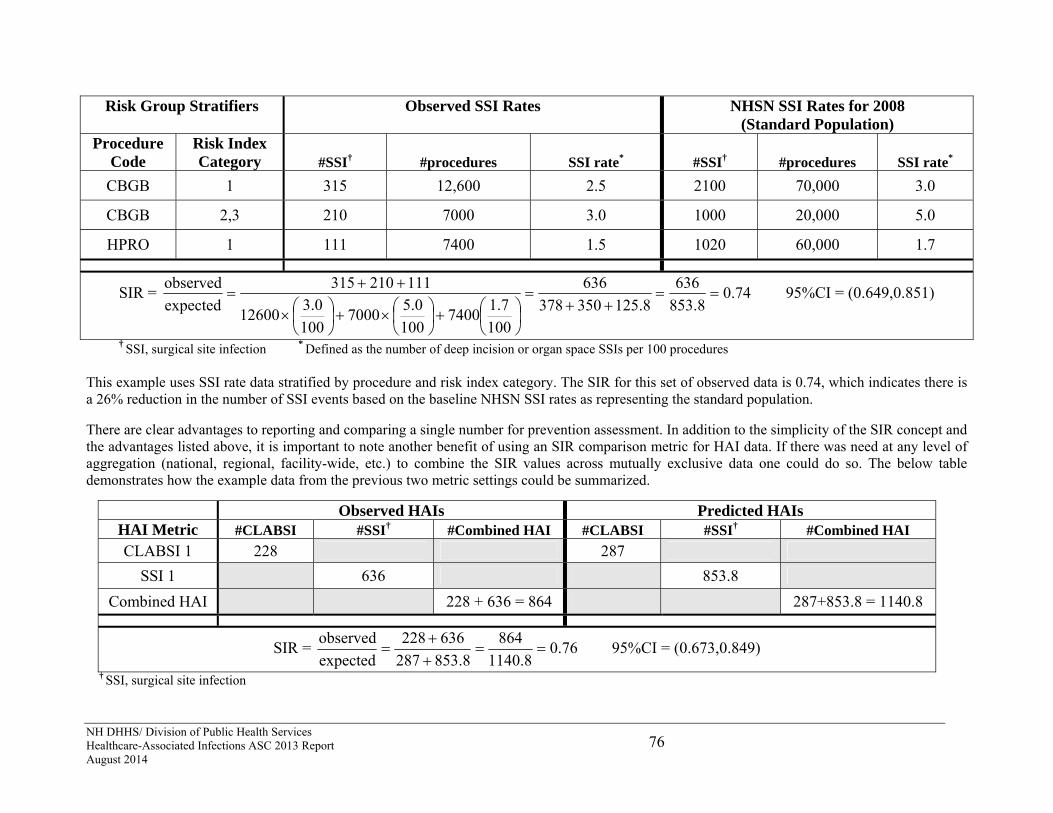
NH DHHS/ Division of Public Health Services Healthcare-Associated Infections ASC 2013 Report August 2014
76
† SSI, surgical site infection * Defined as the number of deep incision or organ space SSIs per 100 procedures This example uses SSI rate data stratified by procedure and risk index category. The SIR for this set of observed data is 0.74, which indicates there is a 26% reduction in the number of SSI events based on the baseline NHSN SSI rates as representing the standard population. There are clear advantages to reporting and comparing a single number for prevention assessment. In addition to the simplicity of the SIR concept and the advantages listed above, it is important to note another benefit of using an SIR comparison metric for HAI data. If there was need at any level of aggregation (national, regional, facility-wide, etc.) to combine the SIR values across mutually exclusive data one could do so. The below table demonstrates how the example data from the previous two metric settings could be summarized.
Observed HAIs Predicted HAIs HAI Metric #CLABSI #SSI† #Combined HAI #CLABSI #SSI† #Combined HAI
CLABSI 1 228 287
SSI 1 636 853.8
Combined HAI 228 + 636 = 864 287+853.8 = 1140.8
SIR = 76.08.1140
864
8.853287
636228
expected
observed
95%CI = (0.673,0.849)
† SSI, surgical site infection
Risk Group Stratifiers Observed SSI Rates NHSN SSI Rates for 2008 (Standard Population)
Procedure Code
Risk Index Category #SSI† #procedures SSI rate* #SSI† #procedures SSI rate*
CBGB 1 315 12,600 2.5 2100 70,000 3.0
CBGB 2,3 210 7000 3.0 1000 20,000 5.0
HPRO 1 111 7400 1.5 1020 60,000 1.7
SIR = 74.08.853
636
8.125350378
636
100
7.17400
100
0.57000
100
0.312600
111210315
expected
observed
95%CI = (0.649,0.851)
NH DHHS/ Division of Public Health Services Healthcare-Associated Infections ASC 2013 Report August 2014
77
APPENDIX 3: Preventing Healthcare-Associated Infections What You Can Do to Prevent Healthcare-Associated Infections There are several prevention tips you can follow all the time to reduce your chance of getting an infection or spreading your infection to others. 1. Clean your hands.
Use soap and warm water. Rub your hands really well for at least 15 seconds. Rub your palms, fingernails, in between your fingers, and the backs of your hands.
If your hands do not look dirty, you can clean them with alcohol-based hand sanitizers. Rub the sanitizer all over your hands, especially under your nails and between your fingers, until your hands are dry.
Clean your hands before touching or eating food. Clean them after you use the bathroom, take out the trash, change a diaper, visit someone who is ill, or play with a pet.
2. Make sure healthcare providers clean their hands first, even if they wear gloves for a procedure. Doctors, nurses, dentists, and other healthcare providers come into contact with many
bacteria and viruses. So if you do not see your healthcare provider wash their hands or use an alcohol-based hand sanitizer before they treat you, ask them if they have cleaned their hands.
Healthcare providers should wear clean gloves when they perform tasks such as taking throat cultures, pulling teeth, taking blood, touching wounds or body fluids, while suctioning tubes, and examining your mouth or private parts. Don’t be afraid to ask if they should wear gloves.
3. Cover your mouth and nose. Many diseases are spread through sneezes and coughs. When you sneeze or cough, the
germs can travel 3 feet or more. Cover your mouth and nose to prevent the spread of infection to others.
Use a tissue. Keep tissues handy at home, at work, and in your pocket. Be sure to throw away used tissues and clean your hands after coughing or sneezing.
If you don’t have a tissue, cover your mouth and nose with the bend of your elbow or hands. If you use your hands, clean them right away.
4. If you are sick, avoid close contact with others. If you are sick, stay away from other people or stay home. Don’t shake hands or touch
others. When you go for medical treatment, call ahead and ask if there is anything you can do to
avoid infecting people in the waiting room.
5. Get shots to avoid disease and fight the spread of infection. Make sure that your vaccinations are current—even for adults. Check with your doctor
about shots you may need.
6. If you are prescribed an antibiotic for an illness, take them exactly as directed by your doctor. Don’t take half-doses or stop before you complete your prescribed course even if you feel
better. Not taking them as directed can lead to infections that become resistant to antibiotics, making them more difficult to treat.

NH DHHS/ Division of Public Health Services Healthcare-Associated Infections ASC 2013 Report August 2014
78
What You Can Do to Help Prevent Surgical Site Infections
Tell your doctor about other medical problems you may have. Health problems such as allergies, diabetes, and obesity could affect your surgery and your treatment.
Quit smoking. Patients who smoke get more infections. Talk to your doctor about how you can quit before your surgery.
Do not shave near where you will have surgery. Shaving with a razor can irritate your skin and make it easier to develop an infection.
You may have some of your hair removed immediately before your surgery using electric clippers if the hair is in the same area where the procedure will occur, however you should not be shaved with a razor. Speak up if someone tries to shave you with a razor before surgery. Ask why you need to be shaved and talk with your surgeon if you have any concerns.
Ask if you will get antibiotics before surgery.
After your surgery, make sure that your healthcare providers clean their hands before examining you, either with soap and water or an alcohol-based hand rub. If you do not see your providers clean their hands, please ask them to do so.
Family and friends who visit you should not touch the surgical wound or dressings and prevent pets from coming into contact with your wound.
Family and friends should clean their hands with soap and water or an alcohol-based hand rub before and after visiting you. If you do not see them clean their hands, ask them to do so.
Before you go home, your doctor or nurse should explain everything you need to know about taking care of your wound. Make sure you understand how to care for your wound before you leave the healthcare facility. If you do develop an infection at the healthcare facility, be sure to ask what type of bacteria you have, whether you need antibiotics for it, what steps you should take to prevent it from spreading, and make plans for follow up care for the infection.
Always clean your hands before and after caring for your wound.
Before you go home, make sure you know who to contact if you have questions or problems after you get home.
If you have any symptoms of an infection, such as redness and pain at the surgery site, drainage, or fever, call your doctor immediately.
What Healthcare Facilities Can Do to Prevent Surgical Site Infections To prevent surgical site infections, doctors, nurses, and other healthcare providers:
Clean their hands and arms up to their elbows with an antiseptic agent before the surgery.
Clean their hands with soap and water or an alcohol-based hand rub before and after caring for each patient.
May remove some of your hair immediately before your surgery using electric clippers if the hair is in the same area where the procedure will occur. They should not shave you with a razor.
Wear special hair covers, masks, gowns, and gloves during surgery to keep the surgery area clean.

NH DHHS/ Division of Public Health Services Healthcare-Associated Infections ASC 2013 Report August 2014
79
Give you antibiotics before your surgery starts. In most cases, you should get antibiotics within 60 minutes before the surgery starts and the antibiotics should be stopped within 24 hours after surgery.
Clean the skin at the site of your surgery with a special soap that kills germs.
This prevention information was adapted from materials developed by the Centers for Disease Control and Prevention, the Association for Professionals in Infection Control and Epidemiology, the Joint Commission, and Society of Healthcare Epidemiology of America. This information can be accessed at the following websites: http://www.cdc.gov/ncidod/dhqp/HAI_shea_idsa.html http://www.jointcommission.org/PatientSafety/SpeakUp/speak_up_ic.htm http://www.apic.org/AM/Template.cfm?Section=Education_Resources&Template=/TaggedPage/TaggedPageDisplay.cfm&TPLID=91&ContentID=8738 http://www.shea-online.org/ForPatients.aspx Other useful resources: http://www.dhhs.nh.gov/dphs/cdcs/hai/index.htm http://www.nhqualitycare.org/index.php http://www.cdc.gov/HAI/ http://www.cdc.gov/HAI/patientSafety/patient-safety.html http://www.qualityforum.org/Home.aspx http://www.ahrq.gov/ http://www.shea-online.org/about/patientguides.cfm http://www.jointcommission.org/

NH DHHS/ Division of Public Health Services Healthcare-Associated Infections ASC 2013 Report August 2014
80
APPENDIX 4: Map of NH Ambulatory Surgical Centers (ASCs)
Note: The Sugery Center of Greater Nashua was newly licensed and not operational for all of 2013.