State of Nevada IT Benchmark Results -...
91
CONFIDENTIAL State of Nevada IT Benchmark Results The Hackett Group May 16, 2014 Redacted Version
Transcript of State of Nevada IT Benchmark Results -...
CONFIDENTIAL
State of Nevada
IT Benchmark Results
The Hackett Group
May 16, 2014
Redacted Version

IT Benchmark Results | 2 © 2014 The Hackett Group, Inc. All rights reserved. Reproduction of this document or any portion thereof without prior written consent is prohibited.
Confidential
Contents
Project Background
State of Nevada IT Function Baseline
Executive Summary
Recommendations
Performance Driver Analysis:
– Process
– People/Organization
– Technology/Other
Appendix

IT Benchmark Results | 3 © 2014 The Hackett Group, Inc. All rights reserved. Reproduction of this document or any portion thereof without prior written consent is prohibited.
Confidential
Project Background

IT Benchmark Results | 4 © 2014 The Hackett Group, Inc. All rights reserved. Reproduction of this document or any portion thereof without prior written consent is prohibited.
Confidential
State of Nevada's objectives in completing the benchmark
Establish a baseline of State of Nevada’s General and Administrative (G&A) organizations
– Identify staff mix and resource allocation
– Identify key cost drivers
Analyze State of Nevada’s G&A functions
– Gain insight to how leading functions are organized and staffed
– Identify ways to better leverage technology solutions
– Identify performance gaps in best practice usage as compared to our database
Provide a balanced, qualitative perspective through Executive Interviews and comprehensive Stakeholder Surveys
Develop improvement recommendations

IT Benchmark Results | 5 © 2014 The Hackett Group, Inc. All rights reserved. Reproduction of this document or any portion thereof without prior written consent is prohibited.
Confidential
Design Build Run Manage
IT Business Planning – Alignment
– Project Prioritization
– Communication
Enterprise Architecture Planning
– Governance
– Standards
Management
Emerging
Technologies – Technology Evaluation
Infrastructure Development
– Planning
– Construct
– Implement
Application Development and Implementation
– Planning
– Construct
– Implement
Quality Assurance
– Change Management
Infrastructure Management
– Operations
Management
– Security Management
– Disaster Recovery
Planning
End User Support – Help Desk
– End User Training
Application Maintenance
– Application Support
– Enhancement Delivery
– Upgrade Execution
Risk Management – Audit and Compliance
Function Management – Function Oversight
– Personnel
Management
– Policy and procedures
oversight
Process
Category
Process
Group
Process
As the intent of the benchmark is to provide a consistent methodology for collecting data and comparing results, FTEs and Costs to
support unique, large scale, focused technology / applications that are not common from organization to organization must be excluded.
Hackett IT process scope
IT Benchmark Results | 6 © 2014 The Hackett Group, Inc. All rights reserved. Reproduction of this document or any portion thereof without prior written consent is prohibited.
Confidential
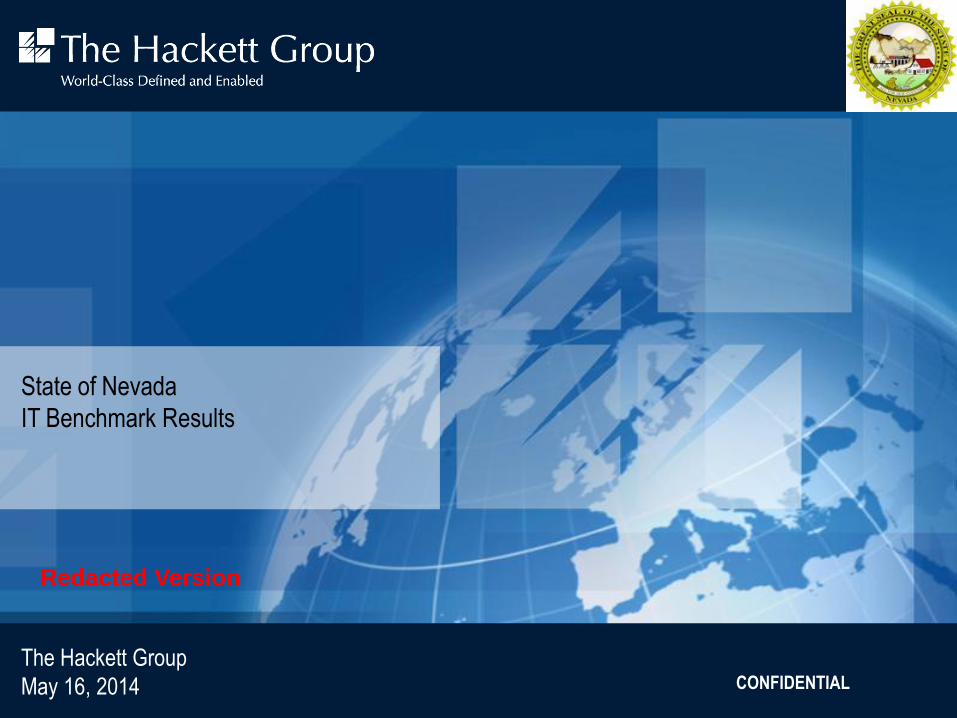
Departments/Agencies Within Scope
In-Scope Agencies (Finance, HR, IT, Procurement)
Department of Administration Department of Employment, Training &
Rehabilitation (DETR) Department of Public Safety
• Administrative Services Department of Health & Human
Services (DHHS) •Highway Patrol
• Buildings and Grounds • Welfare and Support Services •Parole and Probation
•Public Works Board •Aging and Disability Services Division •General Services Division
•Purchasing • Division of Child and Family Services
(DCFS) •Investigations Division
• Human Resource Management •Health Division •State Fire Marshall Division
• Enterprise IT Services •Division of Health Care Financing and
Policy •Capitol Police Division
• Budget Division • Mental Health and Developmental
Services •Training
State Department of Agriculture Department of Motor Vehicles (DMV)
•Office of Traffic Safety
Department of Business & Industry (B&I) State Gaming Control Board
•Division of Emergency
Management/Homeland Security
Department of Conservation & Natural
Resources
The Nevada Judiciary
Department of Taxation
Department of Corrections Nevada Department of Transportation (NDOT)
Office of the State Treasurer

IT Benchmark Results | 7 © 2014 The Hackett Group, Inc. All rights reserved. Reproduction of this document or any portion thereof without prior written consent is prohibited.
Confidential
There are three key inputs to the benchmark project
Benchmark Questionnaire
Executive Interviews
Stakeholder Survey
Web-based survey sent to 152 IT
stakeholders
Responses received from 76 IT
stakeholders (50%)
Completed by IT staff
13 in-scope departments
Gather management’s perspective on:
– Overall functional efficiency and
effectiveness
– The strategic connection between IT and
specific business objectives
– How recent, related initiatives affect
business objectives
– Opportunities for further improvement
concerning IT
– Expectations from the benchmark
process
Name of Presentation© 2006 The Hackett Group. All rights reserved. Reproduction of this document or any portion thereof without prior written consent is prohibited.
Page 27
0.50% 0.50% 0.50% 0.50% 0.50% 0.50%
0.00% 0.00%
0.24% 0.24% 0.24% 0.24% 0.24% 0.24%
0.00% 0.00%
0.14% 0.14% 0.14% 0.14% 0.14% 0.14%
0.00% 0.00%
0.27% 0.27% 0.27% 0.27% 0.27%
0.00% 0.00%
1.09% 1.09% 1.09% 1.09% 1.09% 1.09%
0.00% 0.00%
0.27% 0.27% 0.27% 0.27% 0.27% 0.27%
0.00% 0.00%
0.05% 0.05% 0.05% 0.05% 0.05% 0.05%
0.00% 0.00%
0.27%
TagName1 TagName2 TagName3 TagName4 TagName5 TagName6 0 0
Transaction Processing Control and Risk Management Planning and Strategy Function Management
Technology Other Allocation
Finance Cost As A % Of Revenue(With Allocations)
Organizational Unit Comparisons for Finance
*Sample Company - 2.51%
Peer - 1.21%
World-Class - 0.67%
Name of Presentation© 2006 The Hackett Group. All rights reserved. Reproduction of this document or any portion thereof without prior written consent is prohibited.
Page 49
Integration of fixed assets
applications with general
ledger applications
Integration of fixed assets
applications with
purchasing/accounts payable
applications
Extent policies and
procedures for General
Accounting and External
Reporting are standardized
across business units
*Sample Company Top Performers
General Accounting and External Reporting Best Practices
HighMediumLowNone
Name of Presentation© 2006 The Hackett Group. All rights reserved. Reproduction of this document or any portion thereof without prior written consent is prohibited.
Page 66
ABC Co. has a Low, Inconsistent Leverage of Data Management and Reporting Self-service Tools
Use of Data Management and Analysis
Tools (Data Warehousing/Data Marts)
Extent Internet Supports Online,
Self-service for Standard Reports
*Sample Company
Median
World-Class
None
Low
Med
High
*Sample Company
Median
World-Class
None
Low
Med
High
*Sample Company
Median
World-Class
None
Low
Med
High
Extent Internet Supports Online
Distribution of Standard Reports
15 of 19 locations - None9 of 16 locations - None 15 of 19 locations - None
Name of Presentation© 2006 The Hackett Group. All rights reserved. Reproduction of this document or any portion thereof without prior written consent is prohibited.
Page 26
Stakeholder Survey Results Indicate There is a Gap Between This Function’s Focus on Importance and Effectiveness
Importance & Effectiveness by Service Offering
Cash Disbursements
Revenue Cycle
Accounting and External Reporting
Treasury
Tax Management
Compliance Management
Planning
Business Performance Management
Business Analysis
Vital/Highly Important
ImportantNotimportant
Strong performance/Exceeds
expectations
Average, gets the job done
Falls short of expectations
Needs major improvementsEffectiveness
Importance
N/A
N/A
Noinvolvement
Benchmark Results

IT Benchmark Results | 8 © 2014 The Hackett Group, Inc. All rights reserved. Reproduction of this document or any portion thereof without prior written consent is prohibited.
Confidential
What this benchmark is . . . What this benchmark is not . . .
A starting point … the end answer
An assessment of where efforts should be focused …a detailed analysis of how to redesign processes
Best practice comparisons …a competitive analysis
Process based comparison …an exact match to organizational departments
One input to setting targets …the only input
A broad look at the IT function …going to cover all aspects of organization operations
Benchmark results should be evaluated through the of the specific requirements of State of Nevada’s operating parameters
VS.
Hackett’s IT Benchmark Focuses on the value of IT from a
business perspective
Other IT Benchmarks Focus on the mechanics of IT from an
internal IT perspective

IT Benchmark Results | 9 © 2014 The Hackett Group, Inc. All rights reserved. Reproduction of this document or any portion thereof without prior written consent is prohibited.
Confidential
State of Nevada IT Function Baseline

IT Benchmark Results | 10 © 2014 The Hackett Group, Inc. All rights reserved. Reproduction of this document or any portion thereof without prior written consent is prohibited.
Confidential
79%
3%18%
Manager
Professional
Clerical
60%
28%
5% 7%
Design
Build
Run
Manage
Labor cost –
Wages (full-time and part-time)
Overtime and bonuses
Taxes and fringe benefits
Outsourcing cost –
Outside services
Technology cost –
Hardware
Software
Voice & Data
Other cost –
Facilities & Overhead
Travel
Training
Other (Supplies, subscriptions, etc.)
Process Cost:
State of Nevada's baseline IT cost is $144.9 million with 694.3 FTEs supporting IT
41%27%
6%
26%
$144.9 Million
EUEs: 20,470
Staff Mix
FTE Allocation
FTEs = 694.3
$97.4 M
$59.4 M
$38 M
$39.6 M
$7.9 M

IT Benchmark Results | 11 © 2014 The Hackett Group, Inc. All rights reserved. Reproduction of this document or any portion thereof without prior written consent is prohibited.
Confidential
54%
17%
29%
Hardware and Software Voice & Data Communication
Depreciation
State of Nevada's technology and other costs
IT Other Cost Distribution Technology Cost Distribution
24%
14%
5%
57%
Facilities and Overhead Travel and Expense
Training Other
Technology Cost - $39,646,416 Other Cost - $7,870,406

IT Benchmark Results | 12 © 2014 The Hackett Group, Inc. All rights reserved. Reproduction of this document or any portion thereof without prior written consent is prohibited.
Confidential
Executive Summary

IT Benchmark Results | 13 © 2014 The Hackett Group, Inc. All rights reserved. Reproduction of this document or any portion thereof without prior written consent is prohibited.
Confidential
Key Observations - Information Technology
•State of Nevada’s overall IT performance is bottom quartile (25th percentile) in both efficiency and effectiveness.
•Technology enablement to support internal processes is lagging across the state.
•Lack of sufficient state funding coupled with a fragmented support structure results in varying performance by agency and disparate systems.
•Stakeholders feel that IT is resource constrained and complain about project delivery and sub-par customer service.
Overall Performance
•State of Nevada's reported IT cost per end user is on par. However, IT cost as a percentage of revenue is notably high due to Nevada’s modest revenue. There is not enough visibility into the true total IT cost due to the way costs are reported.
•Overall process cost (labor + outsourcing) per end user is high driven by more FTEs, more outsourcing spend and high cost for Application Development and End User Support.
Cost Profile
•Like many states, Nevada’s technology platform is built upon decentralized legacy systems and architecture.
•Nevada’s technology cost is low. The ERP (Advantage) is owned by the state, with no vendor support costs. Technology spending was hampered due to budget cuts and is naturally lower in the 2nd year of the biennium.
•Nevada has low levels of automation and self-service to support business process performance.
Technology
•Project delivery performance for infrastructure projects is low as there are not strong repeatable processes in place.
•Application project delivery is reported as favorable by IT with a keen focus on budget, but is likely overstated. Stakeholder sentiment suggests that much of the demand is not addressed and projects are often delayed.
•Benefits realization is high, but business case utilization and ROI tracking need to be improved.
•With a high number of help desk requests, Nevada struggles with first contact resolution (52%)
Delivery
•30% of the technology portfolio is considered as managed in shared services.
•Adherence to standards is lower than typical in all areas.
• Internal SLAs are not in place and no state-wide SLAs exist.
•There is minimal use of standard service methodologies
Governance
•Stakeholders acknowledge the budget pressures that IT has to contend with, but desire more / better communication and faster response times.
• IT’s most significant effectiveness gaps are in communication, flexibility and strategic thinking & analysis.
•Over 60% of Stakeholders view IT as having little or no involvement in daily operations of the organization
Stakeholder Feedback

IT Benchmark Results | 14 © 2014 The Hackett Group, Inc. All rights reserved. Reproduction of this document or any portion thereof without prior written consent is prohibited.
Confidential
State of Nevada’s IT function has opportunities to improve in both efficiency and effectiveness
Hackett Value Grid™
Note: The ranking of the drivers are a representation of gaps to World-Class and are not a direct indicator of where to focus/ launch initiatives. Specific action plans should not be
developed until after the benchmark results are assessed within the context of the functional and business strategies.
Metric is at or exceeds Median of World-Class
Metric is between Median of Peer Group and World-
Class
Metric is below Peer Group Median
Other
Organizations
State of Nevada
1Q
1Q
High
World-Class
Eff
ecti
ven
ess
High
Efficiency Low
* Partial or all data from Stakeholder Survey
PLAN EFFECTIVENESS
Emerging Technologies Knowledge
Role of IT*
BUILD EFFECTIVENESS
Application Project Delivery Effectiveness*
Infrastructure Project Delivery
Effectiveness*
Project Benefits Realization
BUS. ENABLEMENT EFFECTIVENESS
Project Return on Investment (ROI)
Business Process Automation
Self-service Enablement
SLA Performance – Internal
SLA Performance – External
Help Desk First Contact Resolution
BUILD EFFICIENCY
• Application Project Delivery – On Time*
• Application Project Delivery – On
Budget*
• Infrastructure Project Delivery – On
Time*
• Infrastructure Project Delivery – On
Budget*
RUN EFFICIENCY
Run process cost per EUE
Run Process Cost %
Hardware platform complexity
• Application Volume
• Number of Programming Languages
• Enterprise architecture compliance
• Volume of HW hosting facilities

IT Benchmark Results | 15 © 2014 The Hackett Group, Inc. All rights reserved. Reproduction of this document or any portion thereof without prior written consent is prohibited.
Confidential
19%
22%
33%
26%
Valued Business Partner IT Expert
Gatekeeper Administrator
12%20%17%
25%26%
14%
34%42%
35%38%
51%48%54%55%
48%49%
63%
25%
26%25%19%
20%15%
20%16%
17%18%
19%20%21%
17%15%10%
14%22%
14%14% 12%
20%12%
4%
20%27%
7%
Innovation in
Strategic Vision
Organizational
Alignment
Partnership
orientation
Customer Service
Orientation
CommunicationsOn Schedule
Delivery
Policy & Procedure
Effectiveness
Meet Project
Reqmts
Up TimeStaff CapabilitiesOn-budget delivery
Strong/Exceeds expectations Average Falls short of expectations Needs major improvement
Stakeholder Survey reveals opportunities for IT to improve in customer service, partnership and innovation
Representative
Stakeholder
Comments
“They are good people who want to do a good job. Unfortunately they are the victims of the state budget crisis just like the rest of the
agencies. The State gets what it pays for in terms of technical skill sets and equipment.”
“Serve the people that pay for their services in a timely manner. It takes too long to get simple day-to-day items fulfilled”
“Listen to the customers about their needs to improve program efficiency. Offer solutions and/or options to meet those needs.
Understand the regulations, policies and procedures associated with the program (internal customer). Provide adequate resources to
meet the needs of the customer”
[Start] Staying up on technology and utilizing current software and infrastructure technology.
[Start] Communicating better what they're doing, who to go to for what services, and improving project management.
Performance of the IT Organization Information Technology’s Role

IT Benchmark Results | 16 © 2014 The Hackett Group, Inc. All rights reserved. Reproduction of this document or any portion thereof without prior written consent is prohibited.
Confidential
Nevada's IT cost per EUE and cost as a percentage of revenue
2,901
1,859
1,937
384
7,081
State of Nevada
Labor Outsourcing Technology Other
IT Cost ($) per EUE
EUEs: 20,470
Pro
ce
ss c
ost
1.10%
1.65%
1.06%
0.22%
4.04%
State of Nevada
Labor Outsourcing Technology Other
IT Cost ($) as a % of Revenue
Revenue: $3.59 Billion

IT Benchmark Results | 17 © 2014 The Hackett Group, Inc. All rights reserved. Reproduction of this document or any portion thereof without prior written consent is prohibited.
Confidential
41%
6%
26%
27%
State of Nevada
Labor Cost Outsourcing Cost Technology Cost Other Cost
Nevada has a high allocation of outsourcing cost – particularly for the Build processes
IT Cost Distribution in %
100%
Process Cost per End User Equivalent in %
52%
48%
61%
39%
100%
State of Nevada
Pro
cess C
ost
Outsourcing Cost Labor Cost
Desig
n
Bu
ild
R
un
M
an
ag
e

IT Benchmark Results | 18 © 2014 The Hackett Group, Inc. All rights reserved. Reproduction of this document or any portion thereof without prior written consent is prohibited.
Confidential
70% of Nevada’s IT outsourcing cost supports Health Care Financing and Policy and DETR
Agency / Department Process Outsourcing Cost Total
Health Care Financing and Policy
Infrastructure Management $ 3,527,130
$ 16,874,039 End User Support $ 4,279,242
Application Maintenance $ 3,570,042
Application Development and Implementation $ 5,497,625
DETR
Infrastructure Management $ 10,161
$ 9,622,677 Application Maintenance $ 488,936
Application Development and Implementation $ 9,116,140
Quality Assurance $ 7,440
Welfare and Support Services Infrastructure Management $ 6,204,127 $ 6,204,127
DPBH
End User Support $ 1,095,266
$ 3,901,633 Application Maintenance $ 1,192,666
Application Development and Implementation $ 1,613,701
Aging and Disability Services
Infrastructure Management $ 335,962
$ 671,924 Application Maintenance $ 274,082
Application Development and Implementation $ 61,880
B&I
Infrastructure Management $ 134,531
$ 312,146 End User Support $ 40,000
Infrastructure Development $ 16,800
Application Maintenance $ 120,815
Public Safety Application Maintenance $ 300,000 $ 300,000
Conservation Application Development and Implementation $ 70,265 $ 70,265
Taxation Application Maintenance $ 50,000 $ 50,000
Controller Application Development and Implementation $ 42,200 $ 42,200

IT Benchmark Results | 19 © 2014 The Hackett Group, Inc. All rights reserved. Reproduction of this document or any portion thereof without prior written consent is prohibited.
Confidential
196.9
414.8
46.3
36.3694.3
State of Nevada
Design Build
Manage
18%
79%
3%
State of Nevada
Run
Number of FTEs
per State of Nevada's
EUEs
Staff Mix
distribution by
category
Manager
Clerical
Professional
Nevada carries a relatively high number of IT FTEs
Managers
are those that
have performance
management responsibilities

IT Benchmark Results | 20 © 2014 The Hackett Group, Inc. All rights reserved. Reproduction of this document or any portion thereof without prior written consent is prohibited.
Confidential
Nevada has the highest number of FTEs in Application Development and End User Support
IT FTEs per State of Nevada's EUEs
29.1
8.5 8.8
35.9
139.4
21.6
85.5
201.8
13.0
36.3
114.6
IT Business
Planning
Enterprise Arch
Planning
Emerging Tech Infrastructure Dev Application Dev Quality
Assurance
Infrastructure
Mgmt
End User Support Application Maint Risk Mgmt Function Mgmt
State of Nevada
Design Build Run Manage
4% 1%5%
20%
3%
30%
1%
17%
2%
12%
5% IT Business Planning
Enterprise Arch Planning
Emerging Tech
Infrastructure Dev
Application Dev
Quality Assurance
Infrastructure Mgmt
End User Support
Application Maint
Risk Mgmt
Function Mgmt
FTE Allocation by Process Group

IT Benchmark Results | 21 © 2014 The Hackett Group, Inc. All rights reserved. Reproduction of this document or any portion thereof without prior written consent is prohibited.
Confidential
86
51
83
102
Overall Clerical Professional Manager
State of Nevada
83,180
125,309
State of Nevada's average fully loaded labor costs
State of Nevada's Average Fully Loaded Labor Cost ($) per Internal and External
FTE
Average Fully Loaded Labor Cost ($000's) per FTE
38.8 FTEs655.5 FTEs
Overall Clerical Prof. Manager
FTEs 694.3 18.2 553.4 122.7
Internal External
State of Nevada

IT Benchmark Results | 22 © 2014 The Hackett Group, Inc. All rights reserved. Reproduction of this document or any portion thereof without prior written consent is prohibited.
Confidential
144
43 42
152
1,435
91
868
963
789
59
174
IT Business
Planning
Enterprise Arch
Planning
Emerging Tech Infrastructure Dev Application Dev Quality Assurance Infrastructure
Mgmt
End User Support Application Maint Risk Mgmt Function Mgmt
State of Nevada
Nevada's process costs per EUE for Application Development and End User Support are comparably high, driven by the staffing levels
Process Cost ($) per EUE
Design Build Run Manage
3%
30%
1%1%3%
2%20%
17%
1%
18%
4%IT Business Planning
Enterprise Arch Planning
Emerging Tech
Infrastructure Dev
Application Dev
Quality Assurance
Infrastructure Mgmt
End User Support
Application Maint
Risk Mgmt
Function Mgmt
Process Cost by Process Group

IT Benchmark Results | 23 © 2014 The Hackett Group, Inc. All rights reserved. Reproduction of this document or any portion thereof without prior written consent is prohibited.
Confidential
54%
17%
29%
State of Nevada
Hardware & Software Expenses Voice and Data Expenses Depreciation Expenses
Technology Cost - $39,646,416
Nevada's low technology costs are driven by lower funding in the 2nd year of the biennium and a "down" year in FY13
Technology Cost ($) per EUE
1,937
State of Nevada
867
700
370
Hardware
expense &
depreciation
Software
expense &
depreciation
Voice and data
expense &
depreciation
State of Nevada
Technology HW & SW Cost ($) per EUE
Technology Expense &
Depreciation Cost Comparison
Voice & Data Distribution
12%
16%
39%
33%
Voice usage charges
Wireless (data and
voice) usage charges
Data network and usage
charges (include VoIP)
Equipment cost (exclude
capitalized expenses)

IT Benchmark Results | 24 © 2014 The Hackett Group, Inc. All rights reserved. Reproduction of this document or any portion thereof without prior written consent is prohibited.
Confidential
State of Nevada
Supplier invoice inquiry performed via self-service 0%
Customer online bill presentment 19%
Customer account review performed via self-service 23%
Employee requisitioning performed via self-service 8%
Budget input via self-service - Ops or cost center mgrs 18%
State of Nevada
Business management reporting uses a data
warehouse as its primary 28%
Indirect purchasing transactions utilize electronic
catalogs 0%
Customers are covered in a CRM system 8%
14%
28%
8%
25%
35%
17% 17%14%15%
Customer
orders received
Customer
invoices sent
Customer
remittances
applied
Supplier
purchase
orders
Supplier
payments
made
Management
reports
distributed
Employee
expense
reports
submitted
Employee
benefit
enrollment
Employee
records
updated
State of
Nevada
Technology Enablement Self-Service Enablement
Overall, Nevada is lagging in transaction automation and technology enablement to facilitate efficiency across the administrative functions
Transactions Performed Electronically
Supply Chain Internal Demand Chain
Paper
based
IT Benchmark Results | 25 © 2014 The Hackett Group, Inc. All rights reserved. Reproduction of this document or any portion thereof without prior written consent is prohibited.
Confidential
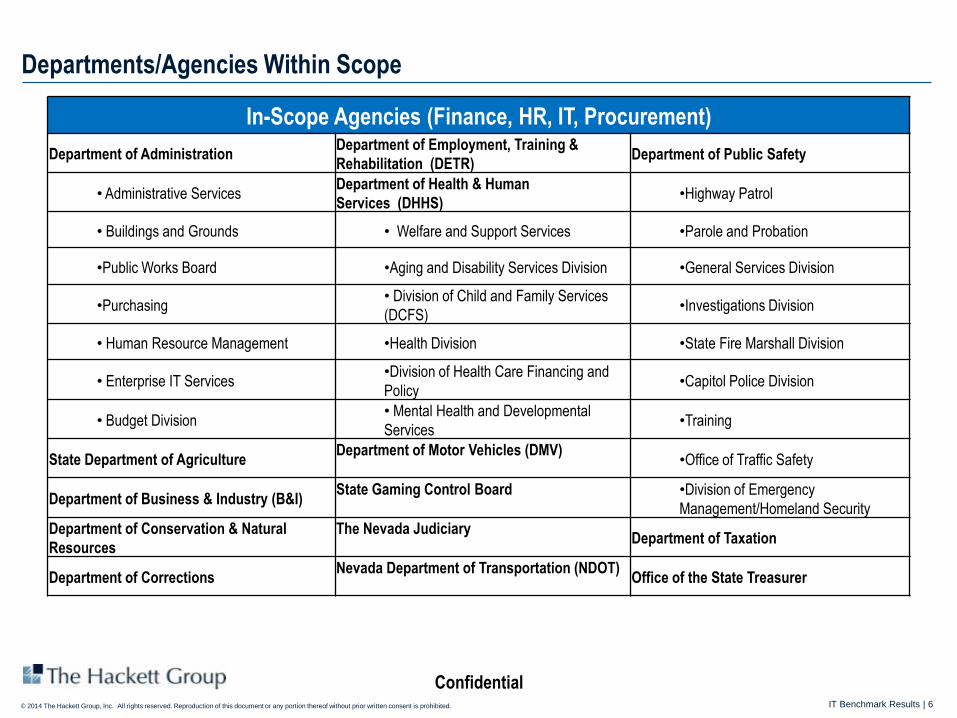
In FY 2013, Nevada spent a lower percentage of its total cost on Run processes as there was heavy application development work
71%
24%
2%
3%
State of Nevada
Design
Build
Run
Manage
Percent of Total IT Cost Devoted to Design, Build, Run, Manage
Design Build Run Manage
IT Business Planning Infrastructure Development Infrastructure Management Function Management
Enterprise Architecture
Planning
Application
Development & Implementation End User Support
Emerging Technologies Quality Assurance Application Maintenance
Risk Management
Technology Cost
(HW, SW, V&D)
Other Cost
(Facilities, T&E, Training, Misc.)

IT Benchmark Results | 26 © 2014 The Hackett Group, Inc. All rights reserved. Reproduction of this document or any portion thereof without prior written consent is prohibited.
Confidential
IT cost (in $ million) State of Nevada
IT Business Planning 2.9
Enterprise Architecture Planning 0.9
Emerging Technologies 0.9
Total DESIGN 4.7
Infrastructure Development 3.1
Application Development and Implementation 29.4
Quality Assurance 1.9
Total BUILD 34.3
Infrastructure Management 17.8
End User Support 19.7
Application Maintenance 16.1
Risk Management 1.2
Technology Cost 39.6
Other Cost 7.9
Total RUN 102.4
Function Management 3.6
Total MANAGE 3.6
Total IT Cost 144.9
State of Nevada has significant spending in Application Development, but seems to be underinvested in technology cost
EUEs: 20,470

IT Benchmark Results | 27 © 2014 The Hackett Group, Inc. All rights reserved. Reproduction of this document or any portion thereof without prior written consent is prohibited.
Confidential
Recommendations

IT Benchmark Results | 28 © 2014 The Hackett Group, Inc. All rights reserved. Reproduction of this document or any portion thereof without prior written consent is prohibited.
Confidential
Move forward with analysis about replacing Advantage with an ERP that will satisfy the needs of the state.
Increase automation and self-service capabilities for routine transactions and reporting needs to facilitate
efficiency in administrative functions. This may result in a higher cost in IT to drive lower admin costs
overall.
Take an accurate inventory of the application portfolio and establish a routine to monitor and manage it .
Ensure there is proper demand management and understanding of user requests to properly scope and plan
delivery efforts to truly meet user needs and reduce the proliferation of unnecessary complexity.
Bolster end user training to improve user understanding and acceptance of new technologies.
Focus on ensuring that user needs are clearly understood and met.
1. Enhance technology capabilities across the state
Technology cost per EUE Nevada Recommendations
Technology is antiquated, not user-friendly and not vendor supported.
Nevada has low levels of automation and needs to increase IT leverage to improve process performance across the administrative areas.
The total application count is underreported.
End user training is insufficient to ensure proper understanding and use of technology.
Nevada Observations
Transactions performed Electronically (%)
$1,937
State of Nevada
14%28%
8%25%
35%17% 17%14%15%
Customer orders
received
Customer invoices
sent
Customer
remittances
applied
Supplier purchase
orders
Supplier payments
made
Management
reports distributed
Employee
expense reports
submitted
Employee benefit
enrollment
Employee records
updated
State of
Nevada
Note: Percentages are not completely accurate due to lack of available data, but determined to be directionally correctly

IT Benchmark Results | 29 © 2014 The Hackett Group, Inc. All rights reserved. Reproduction of this document or any portion thereof without prior written consent is prohibited.
Confidential
Rationalize (reduce) the infrastructure portfolio to support the state in a more effective and efficient
manner. Determine where there are opportunities to consolidate across agencies and departments into
appropriate centers of execellence (where performance is strong) to reduce cost and improve performance.
Investigate what is driving up the outsourcing cost for Welfare and Support Services and Health Care
Financing and Policy. Determine if there may be a cost reduction opportunity from consolidating support.
Make more effective use of existing systems through interfaces and, as appropriate, provide uniform views
of information across departments. Focus on enterprise level business needs, not just by agency.
Analyze which agencies have the most immediate opportunity to move to shared services for Infrastructure.
Enforce compliance to standards across the organization. Ensure that a collaborative process and
governance structure exists and is used to establish and maintain the enterprise architecture plan.
2. Selectively increase consolidation and centralization of Infrastructure as applicable
Select Infrastructure Volumes Nevada Recommendations
The data reflects a down year so IT costs are typically higher than reported.
Nevada has elements of high infrastructure complexity and low disaster recovery documentation and testing.
Currently only 30% of the technology portfolio is considered as managed in shared services. The majority of the shared service is for the Service Desk, but performance is
sub-par.
Standards definition and adherence is low for hardware acquisition, hardware configuration and communication / network protocols.
Infrastructure Development project delivery performance needs improvement.
Nevada Observations
Infrastructure Mgmt FTE Allocation (Top 5 vs others) Percent of Organization Adhering to Standards Infrastructure Development Project Delivery
1759
264
Data Centers Server Farms Customer
Databases
Nev ada
88%79%
88%
Hardware
acquisition
Hardware
configuration &
deployment
Comm./network
protocol11%
8%
27%
25%
15%
14%
EITS - Statewide
Questions_IT
DETR_IT
NDOT_IT
Corrections_IT
Welfare and Support
Services_IT
Other Agencies
65%
75%82%
On Time On Budget To Specifications

IT Benchmark Results | 30 © 2014 The Hackett Group, Inc. All rights reserved. Reproduction of this document or any portion thereof without prior written consent is prohibited.
Confidential
Review the demand management process to ensure that IT addresses the requests that provide the most
benefit to the state. Establish a system for managing internal user demand; accurately categorize requests,
forecast time and effort involved in delivery, communicate timeline for addressing inquiries.
Working with Finance, develop a process to increase the utilization of business cases and ROI reviews post project
implementation.
Ensure that business relationship manager roles are in place, clearly communicated and effective to drive
business linkage and alignment. Increase communication and responsiveness to internal customers.
Routinely conduct a detailed analysis of trouble tickets (e.g. sources, types, frequencies, resolution times, final problem
resolution) to assess root causes and develop a plan to reduce / prevent tickets.
Identify/implement improvements (tools/training/process changes/incentives) to increase 1st contact resolution rate.
3. Improve project and service delivery and increase business value focus
Nevada Recommendations
Nevada’s Application Development process cost is high. Nevada has a large number of projects in flight, but only about a third are supported by a PMO.
Most projects don’t have a formal business case or ROI tracking.
Stakeholder comments indicate performance issues in demand management, project delivery, communication, and customer service / support.
First contact resolution for the help desk service is on 52% and Nevada has a high number of requests.
There are no internal SLAs or state-wide SLAs in place.
Nevada Observations
Project Delivery Tracking State of Nevada
% projects that have formal business case /
cost-benefit analysis 42%
% ROI Not Tracked 64%
% Meeting ROI 23%
% Missing ROI 1%
Help Desk Requests per Thousand EUEs % of First Contact Resolution Stakeholder Comments
10,483
State of Nevada
52%
State of Nevada
“Proactively interact with customers. Follow the customers'
lead, provide some leadership focused on customer needs, or
get out of the way”
“Adding staff in critical areas such as applications development
and project management. We have had to make due with
missed delivery deadlines, project delays, and work-arounds
because they don't have the staff to address all of our critical
projects in a timely manner.”
“Communicating better what they're doing, who to go to for
what services, and improving project management.”

IT Benchmark Results | 31 © 2014 The Hackett Group, Inc. All rights reserved. Reproduction of this document or any portion thereof without prior written consent is prohibited.
Confidential
Consolidate some non-core services to eliminate duplication of efforts and provide a more efficient staffing model.
Determine resource needs to support necessary on-going demand as well as the new support requirements for new
technologies.
Conduct a skills assessment to compare competencies needed to those resident in the current workforce. Assess the skills
of each resource against his / her role, band level, salary, etc. and determine if the resources are appropriately aligned.
Analyze the sourcing strategy to determine what skills and type of work are best accomplished by the internal FTEs vs. what
is better suited for contracted employees and outsourcers. Utilize sourcing options to take work and redundant cost out and
enable the staff to focus on more valued initiatives as well as meet demand and fill skill gaps. Ensure that outsourcers are
evaluated by effective SLAs to ensure value is delivered.
Work with HR to establish consistent training and workforce development for IT.
Create meaningful and agreed upon services and service level agreements for major applications and create accountability.
Organize staff in tiers and around specialty areas to meet stakeholder needs.
4. Effectively manage talent
Total IT FTEs Nevada Recommendations
Lack of enterprise resource leverage leads to the perception that IT is understaffed although Nevada has many IT FTEs. Nevada’s service delivery model is very
decentralized by agency.
Nevada’s outsourcing percentage is high at 26%.
Average fully loaded labor cost for internal IT staff is lower than typical.
Nevada spent less per IT FTE on training.
Nevada Observations
Process Cost Allocation Avg Fully Loaded Labor Cost ($) per Internal FTE Training Cost ($) per IT FTE
41%
26%
State of NevadaLabor Cost Outsourcing Cost
Design Build
Manage
Run
46.3
196.9
414.8
36.3 694.3
State of Nevada
83,180
Average fully loaded labor rate
547
State of Nevada

IT Benchmark Results | 32 © 2014 The Hackett Group, Inc. All rights reserved. Reproduction of this document or any portion thereof without prior written consent is prohibited.
Confidential
Performance Driver Analysis
FTEs and Costs
Design
Build
Run
Manage

IT Benchmark Results | 33 © 2014 The Hackett Group, Inc. All rights reserved. Reproduction of this document or any portion thereof without prior written consent is prohibited.
Confidential
7%
28%
60%
5%
State of Nevada
5%
35%
56%
4%
State of Nevada
State of Nevada staffing and process cost allocation
Design Build Run Manage
Total IT Process Cost Allocation Total IT Staffing Allocation

IT Benchmark Results | 34 © 2014 The Hackett Group, Inc. All rights reserved. Reproduction of this document or any portion thereof without prior written consent is prohibited.
Confidential
41%
26%
State of Nevada
Labor Cost Outsourcing Cost
Nevada has high build and run process costs per EUE
IT Process Cost Allocation ($) per EUE IT Process Cost Allocation per EUE
229
1,678
2,679
174
Design Build Run Manage
State of Nevada

IT Benchmark Results | 35 © 2014 The Hackett Group, Inc. All rights reserved. Reproduction of this document or any portion thereof without prior written consent is prohibited.
Confidential
Performance Driver Analysis
FTEs and Costs
Design
‒ IT Business Planning
‒ Enterprise Architecture Planning
‒ Emerging Technologies
Build
Run
Manage

IT Benchmark Results | 36 © 2014 The Hackett Group, Inc. All rights reserved. Reproduction of this document or any portion thereof without prior written consent is prohibited.
Confidential
27.5
1.629.1
State of Nevada - Internal State of Nevada - External
Practice Questions State of Nevada
To what extent is there an IT communications plan defining stakeholders, messages,
vehicles, frequency, accountabilities, etc.? Ad hoc & loose
How effective is the communication of the IT strategy and vision? Medium
Are there processes and centralized accountabilities for IT communications and
performance reporting? Ad hoc & loose
To what extent does an IT performance scorecard exist? Does not exist
To what degree does the scorecard provide a holistic view of IT performance? Low
IT Business Planning
IT Business Planning Process Cost ($) per EUE IT Business Planning FTEs at State of Nevada's
EUEs
144
State of Nevada
Labor Outsourcing

IT Benchmark Results | 37 © 2014 The Hackett Group, Inc. All rights reserved. Reproduction of this document or any portion thereof without prior written consent is prohibited.
Confidential
8.3
0.28.5
State of Nevada - Internal State of Nevada - External
Practice Questions State of Nevada
To what extent is the technology portfolio actively managed? Occasionally
Are architecture goals and metrics defined and monitored? Occasionally, Often
To what extent is there a process in place for managing IT standards? As needed
What percent of projects are compliant with architectural standards? 82%
Enterprise Architecture Planning Enterprise Architecture Planning Process Cost ($)
per EUE
Enterprise Architecture Planning FTEs at State of
Nevada's EUEs
43
State of Nevada
Labor Outsourcing

IT Benchmark Results | 38 © 2014 The Hackett Group, Inc. All rights reserved. Reproduction of this document or any portion thereof without prior written consent is prohibited.
Confidential
Nevada has lower levels of standards utilization and adherence across the board
Percent of Organizations Utilizing
Standard Definitions Percent of Organization Adhering to Standards
Best Practice - Standards are
defined and enforced 100%
88%
79%84%
78%
88%
Hardware
acquisition
Hardware
configuration &
deployment
Software
acquisition
Application
development
Comm./network
protocol
87%
76% 77%
68%
83%
Hardware
acquisition
Hardware
configuration &
deployment
Software
acquisition
Application
development
Comm./network
protocol
State of Nevada

IT Benchmark Results | 39 © 2014 The Hackett Group, Inc. All rights reserved. Reproduction of this document or any portion thereof without prior written consent is prohibited.
Confidential
8.7
0.18.8
State of Nevada - Internal State of Nevada - External
Practice Questions State of Nevada
To what degree is research and knowledge regarding emerging technologies shared
throughout the enterprise? Occasionally
How often is education provided for business executives on emerging technologies
and potential business applications? Occasionally
Emerging Technologies
Emerging Technologies Process Cost ($) per EUE Emerging Technologies FTEs at State of Nevada's
EUEs
42
State of Nevada
Labor Outsourcing

IT Benchmark Results | 40 © 2014 The Hackett Group, Inc. All rights reserved. Reproduction of this document or any portion thereof without prior written consent is prohibited.
Confidential
Performance Driver Analysis
FTEs and Costs
Design
Build
‒ Infrastructure Development
‒ Application Development &
Implementation
‒ Quality Assurance
Run
Manage

IT Benchmark Results | 41 © 2014 The Hackett Group, Inc. All rights reserved. Reproduction of this document or any portion thereof without prior written consent is prohibited.
Confidential
35.8
0.135.9
State of Nevada - Internal State of Nevada - External
Infrastructure Projects State of Nevada
Number of projects started in the last 6 months 36
Number of projects started in the last 12 months
(include projects started in the last 6 months) 87
Percent under the control of the PMO 12%
Percent of IT project activity type - Improving or
expanding infrastructure 24%
Infrastructure Development Process Cost ($) per
EUE
Nevada's IT organizations were engaged in a lot of large projects during FY2013, but without sufficient PMO support, delivery statistics suffered
Infrastructure Development FTEs at State of
Nevada's EUEs
Infrastructure Project Delivery Success
65%
75%82%
On Time On Budget To Specifications
Infrastructure Projects (large projects)
151
0.8
State of Nevada
Labor Outsourcing
State of Nevada

IT Benchmark Results | 42 © 2014 The Hackett Group, Inc. All rights reserved. Reproduction of this document or any portion thereof without prior written consent is prohibited.
Confidential
114.7
24.7
139.4
State of Nevada - Internal State of Nevada - External
Application Projects State of Nevada
Number of projects started in the last 6 months 45
Number of projects started in the last 12 months (include
projects started in the last 6 months) 77
Percent under the control of the PMO 36%
Percent of IT project activity type - Developing or
implementing new in-house applications 20%
Percent of IT project activity type - Implementing
(includes configuration) packaged software 7%
Nevada's project delivery for Application Development & Implementation projects is likely over estimated
Application Development Process Cost ($) per EUE Application Development FTEs at State of Nevada's
EUEs
Application Project Delivery Success
85%95% 92%
On Time On Budget To Specifications
Application Projects
633
801
State of Nevada
Labor Outsourcing
State of Nevada

IT Benchmark Results | 43 © 2014 The Hackett Group, Inc. All rights reserved. Reproduction of this document or any portion thereof without prior written consent is prohibited.
Confidential
Projects Adhering to Standard Methods
Best Practice - All large scale projects are controlled by a PMO
Projects Managed Through a PMO Formal Enterprise-wide PMO
None
Low
Medium
High
38%
Nevada's PMO utilization and adherence to standard methods
64%
State of Nevada

IT Benchmark Results | 44 © 2014 The Hackett Group, Inc. All rights reserved. Reproduction of this document or any portion thereof without prior written consent is prohibited.
Confidential
Project Delivery Practice Questions State of Nevada
When projects or programs are reviewed for benefit realization, which organization is
accountable for executing? IT, Business
To what degree is a centralized project repository is established, utilized and
maintained to capture and access all project related deliverables and work products
throughout the project life cycle?
Medium
To what extent are common project naming conventions established and utilized for all
project-related documents, work products, files, directories, and code structures? Medium
What best describes your approach to defining business requirements?
Technology organization develops and
documents requirements from interviews,
workshops etc involving the business
organization
How involved are ALL stakeholders in the testing process? Medium
Project delivery practices

IT Benchmark Results | 45 © 2014 The Hackett Group, Inc. All rights reserved. Reproduction of this document or any portion thereof without prior written consent is prohibited.
Confidential
Percentage allocation relative to ROI for the completed projects State of Nevada
Meeting ROI 23%
Missing ROI 1%
ROI Not Tracked 64%
Business Case and Benefit Realization State of Nevada
What percent of projects deliver anticipated benefits? 83%
What percent of development projects have
formal business cases/cost-benefit analyses? 42%
Upon completion, are projects/ programs reviewed to validate the original
business case (both costs and benefits) and lessons learned fed back to
improve methodologies and tools?
Low
State of Nevada Project Related Information
Project delivery results

IT Benchmark Results | 46 © 2014 The Hackett Group, Inc. All rights reserved. Reproduction of this document or any portion thereof without prior written consent is prohibited.
Confidential
21.0
0.621.6
State of Nevada - Internal State of Nevada - External
Practice Questions State of Nevada
To what extent are changes managed and tracked
within a formal Change Management system? Medium
How often do change review meetings occur? Ad hoc
To what extent are changes opened/approved/closed
online? Medium
Practice Questions State of Nevada
Is a QA organization established to manage and monitor
quality standards, procedures and integrated testing for all
systems changes eventually affecting the production
environment?
Low
To what extent is there a formal environment established
to support the Change Management process? Ad hoc & loose
To what degree does everyone follow the change control
process? Medium
Quality Assurance
Quality Assurance Process Cost ($) per EUE Quality Assurance FTEs at State of Nevada's EUEs
91
0.4
State of Nevada
Labor Outsourcing

IT Benchmark Results | 47 © 2014 The Hackett Group, Inc. All rights reserved. Reproduction of this document or any portion thereof without prior written consent is prohibited.
Confidential
Performance Driver Analysis
FTEs and Costs
Design
Build
Run
‒ Infrastructure Management
‒ End User Support
‒ Application Maintenance
‒ Risk Management
‒ Technology
‒ Other
Manage

IT Benchmark Results | 48 © 2014 The Hackett Group, Inc. All rights reserved. Reproduction of this document or any portion thereof without prior written consent is prohibited.
Confidential
Technology Infrastructure Practice Questions State of Nevada
To what degree is there a single point of accountability (process owner) for security
management? Medium
To what degree is role based security implemented throughout the enterprise? None
How many security breaches were detected for any unauthorized/improper access
during the benchmark period? Zero instances
What impact did security breaches have on the daily operations? None
To what extent is your Disaster Recovery plan formally documented? Low
When was the last time the Disaster Recovery plan was tested? Greater than 24 months
How successful was the most recent test of the Disaster Recovery plan? Several problems but testing was
completed
Do you have a backup site? Yes
Infrastructure Management practices

IT Benchmark Results | 49 © 2014 The Hackett Group, Inc. All rights reserved. Reproduction of this document or any portion thereof without prior written consent is prohibited.
Confidential
Level of Implementation State of Nevada
Service Level Management Yes
Capacity Management No
IT Service Continuity Management Yes
Availability Management No
Financial Management No
Service Desk No
Problem Management No
Configuration Management No
Change Management No
Release Management No
Security Management No
IT and Telecoms Infrastructure Management Yes
Application Management Yes
Business Continuity Management Yes
Surviving change No
Business transformation No
Partnership and outsourcing No
IT Services Management Methodology utilization

IT Benchmark Results | 50 © 2014 The Hackett Group, Inc. All rights reserved. Reproduction of this document or any portion thereof without prior written consent is prohibited.
Confidential
85.2
0.385.5
State of Nevada - Internal State of Nevada - External
4
264
297 1017
59
6 4
Data Centers Server Farms Database Platforms Database Platforms,
Core Biz Apps
Network Protocols Customer
Databases
Employee
Databases
Supplier Databases Product Databases
Similar to other states, Nevada's Infrastructure Management process is impacted by complexity as a result of the decentralized agency structure
Infrastructure Volumes at State of Nevada's EUEs
Infrastructure Management Process Cost ($) per
EUE
Infrastructure Management FTEs at State of
Nevada's EUEs
369
499
State of Nevada
Labor Outsourcing
State of Nevada

IT Benchmark Results | 51 © 2014 The Hackett Group, Inc. All rights reserved. Reproduction of this document or any portion thereof without prior written consent is prohibited.
Confidential
6
2
5
4
3
4 4
Application Servers Integration Brokers Portals Workflow Engines Document/Content
Management Tools
Business
Intelligence / Data
Warehousing
Platforms
Data Management
Tools
Other technology platform and hardware device volumes
Hardware Devices and Platforms at State of Nevada's EUEs
16
5
1
6
20
Personal Computers (in
1000's)
Other Computing
Devices (in 1000's)
Mainframe Platforms Midrange Platforms End User Computing
Platforms
Technology Platforms at State of Nevada's EUEs
State of Nevada

IT Benchmark Results | 52 © 2014 The Hackett Group, Inc. All rights reserved. Reproduction of this document or any portion thereof without prior written consent is prohibited.
Confidential
200.8
1.0201.8
State of Nevada - Internal State of Nevada - External
State of Nevada
How is your help desk organized De-centralized for the State
What is the help desk’s primary objective First contact
Target % for first call resolution 54%
Nevada's End User Support process costs are high as a result of fragmentation
End User Support Process Cost ($) per EUE End User Support FTEs at State of Nevada's EUEs
699
265
State of Nevada
Labor Outsourcing

IT Benchmark Results | 53 © 2014 The Hackett Group, Inc. All rights reserved. Reproduction of this document or any portion thereof without prior written consent is prohibited.
Confidential
Nevada supports a high volume of help desk requests with low first contact resolution rates
Help Desk Requests per Thousand EUEs
% of First Contact Resolution
10,483
State of Nevada
Regions Supported State of Nevada
North America Yes
Europe No
APAC No
Other No
Hours of Operation Other
52%
State of Nevada
Help Desk Request Distribution
11%
16%
9%
14%
13%
32%
5%
Password resets
Break / fix requests
Move / add / change /
setupHow-to questions
IT project / enhancement /
support requestsCommunication support
Other

IT Benchmark Results | 54 © 2014 The Hackett Group, Inc. All rights reserved. Reproduction of this document or any portion thereof without prior written consent is prohibited.
Confidential
State of Nevada - Internal State of Nevada - External
Application Maintenance and End User training
Application Maintenance Process Cost ($) per EUE Application Maintenance FTEs at State of Nevada's
EUEs
496
293
State of Nevada
Labor Outsourcing
104.9
9.7
114.6
End User Training
State of Nevada
End user training requirements Ad hoc and loose
How is training compliance monitored Not monitored
Extent a formal set of end user training offerings exists No formal set exists, Limited
# of training hours required annually per employee 1.50
How often are training requirements updated As needed
Who determines/defines training requirements IT partnering with the other
functional areas
Degree training requirements satisfied internally Medium
Extent training is being supported through self-service Medium
Extent training is supported with commercially developed products versus in-house
developed Low

IT Benchmark Results | 55 © 2014 The Hackett Group, Inc. All rights reserved. Reproduction of this document or any portion thereof without prior written consent is prohibited.
Confidential
4
26
Programming
Languages
Programming
Languages, 80%
of Biz Apps
State of Nevada
14
State of Nevada
30
192
7 6 2
Product Development Operations Supply ChainFinance HR ProcurementSales Marketing ServiceExecutive and Corp. Svc.
Application volumes Number of Applications
Supported per 1,000 EUEs
Application Breakdown by Function
(excluding BI Applications)
Applications Breakdown by Type
Programming Languages
State of Nevada
Primary business application suite vendor Other
Primary business application suite modules 24
Secondary business application vendor Not Applicable
Secondary business application modules 6
Productivity applications 22
Collaboration tools 4
Domain specific or Best of breed applications 23
Custom applications 184
BI applications 16
Total 279
Applications seem
understated

IT Benchmark Results | 56 © 2014 The Hackett Group, Inc. All rights reserved. Reproduction of this document or any portion thereof without prior written consent is prohibited.
Confidential
Application Management Practice Questions State of Nevada
Which organization maintains ownership of tier 1 business application support? Business
To what degree is a single centralized system used to track requests, provide status to business and
IT staff, and capture data on the demand management process? Low
To what extent are estimating tools and models used to understand, define and validate
assumptions for in-coming requests? Low
Do you have a global single license agreement for your primary business application suite?
Nevada owns Advantage – no maintenance agreement with AMS vendor No
What are the characteristics of your primary ERP suite - Number of versions 2
What is the maturity of your primary business application? Single ERP / Multiple instances
Are you currently on vendor maintenance or support for your primary business application suite? No
To what degree does your development organization use a formal application development
methodology and toolset? Medium
Application Maintenance practices

IT Benchmark Results | 57 © 2014 The Hackett Group, Inc. All rights reserved. Reproduction of this document or any portion thereof without prior written consent is prohibited.
Confidential
12.6
0.513.0
State of Nevada - Internal State of Nevada - External
Practice Questions State of Nevada
To what degree is there a single point of
accountability (process owner) for audit &
compliance management?
Medium
What percentage of the audits fail? Low
Practice Questions State of Nevada
Who is responsible for performing audit reviews? External Audit
With what frequency does Audit perform a periodic
review for security and information access risk? Annually
Do you have a Chief Security Officer ? Nevada has
ISO Yes
Risk Management
Risk Management Process Cost ($) per EUE Risk Management FTEs at State of Nevada's EUEs
59
State of Nevada
Labor Outsourcing

IT Benchmark Results | 58 © 2014 The Hackett Group, Inc. All rights reserved. Reproduction of this document or any portion thereof without prior written consent is prohibited.
Confidential
State of Nevada's IT technology investment
Technology Cost ($) per EUE
1,937
Development Platforms Being Supported
1
2
3
1
State of Nevada
J2EE/Java .NET 3 GLs 4 GLs OpenSource
State of Nevada
Primary database platform Oracle
% of business applications using primary database 50%
# databases supporting core business applications 4
State of Nevada

IT Benchmark Results | 59 © 2014 The Hackett Group, Inc. All rights reserved. Reproduction of this document or any portion thereof without prior written consent is prohibited.
Confidential
Technology cost allocation breakdown
Technology Cost Allocation by Expense Type
21%
33%
17%
24%
3%2%
Hardware expense Software expense Voice and data
expense
Hardware
depreciation
Software
depreciation
Voice and data
depreciation
State of Nevada

IT Benchmark Results | 60 © 2014 The Hackett Group, Inc. All rights reserved. Reproduction of this document or any portion thereof without prior written consent is prohibited.
Confidential
State of Nevada's Other Costs
IT Other Cost Distribution
24%
14%
5%
57%
Facilities and Overhead Travel and Expense Training Other
Other Cost ($) per EUE
384
State of Nevada
Other Cost - $7,870,406

IT Benchmark Results | 61 © 2014 The Hackett Group, Inc. All rights reserved. Reproduction of this document or any portion thereof without prior written consent is prohibited.
Confidential
State of Nevada's other cost components
Other Cost ($) per IT FTE by Expense Type
2,707
1,622
547
6,460
Facilities and Overhead Travel and Expense Training Other Cost
State of Nevada
Costs are high for
Corrections, NDOT
and Taxation
Low budget
for training

IT Benchmark Results | 62 © 2014 The Hackett Group, Inc. All rights reserved. Reproduction of this document or any portion thereof without prior written consent is prohibited.
Confidential
Performance Driver Analysis
FTEs and Costs
Design
Build
Run
Manage
‒ IT Management & Administration
IT Benchmark Results | 63 © 2014 The Hackett Group, Inc. All rights reserved. Reproduction of this document or any portion thereof without prior written consent is prohibited.
Confidential
State of Nevada - Internal State of Nevada - External
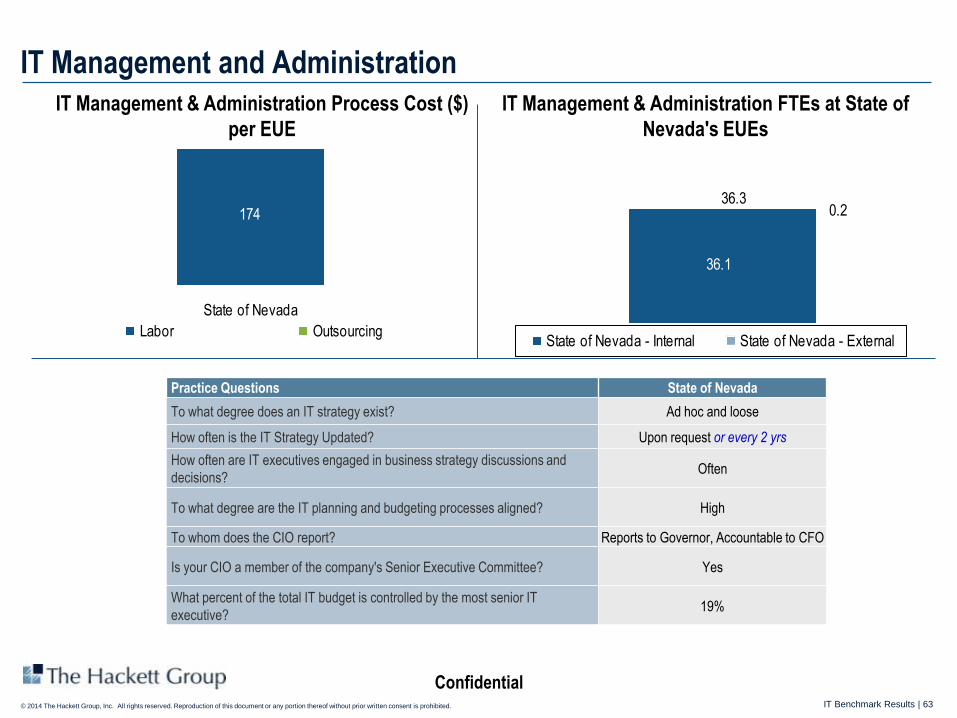
Practice Questions State of Nevada
To what degree does an IT strategy exist? Ad hoc and loose
How often is the IT Strategy Updated? Upon request or every 2 yrs
How often are IT executives engaged in business strategy discussions and
decisions? Often
To what degree are the IT planning and budgeting processes aligned? High
To whom does the CIO report? Reports to Governor, Accountable to CFO
Is your CIO a member of the company's Senior Executive Committee? Yes
What percent of the total IT budget is controlled by the most senior IT
executive? 19%
IT Management and Administration IT Management & Administration Process Cost ($)
per EUE
IT Management & Administration FTEs at State of
Nevada's EUEs
36.1
0.236.3
174
State of Nevada
Labor Outsourcing

IT Benchmark Results | 64 © 2014 The Hackett Group, Inc. All rights reserved. Reproduction of this document or any portion thereof without prior written consent is prohibited.
Confidential
Nevada has reported very few suppliers
Number of Suppliers per 1,000 EUEs
0.5
0.3
0.6
Hardware Contractor Serv ices Software
State of Nevada
11
4
State of Nevada
7
2
State of Nevada
13
3
State of Nevada
Software* Contractor Services* Hardware*
* Values are reconciled, not normalized calculations Number of Suppliers Suppliers representing 80% of Spend
State of Nevada
Degree of adherence to the preferred vendor list Often
What percent of the IT spend/purchase activities is
influenced/managed using a formal procurement organization 90%
To what extent are cost reductions and the utilization of gain sharing
agreements used with suppliers Never
Included in physical asset database – End user devices 95%
Included in physical asset database – Infrastructure devices 90%

IT Benchmark Results | 65 © 2014 The Hackett Group, Inc. All rights reserved. Reproduction of this document or any portion thereof without prior written consent is prohibited.
Confidential
None
Low
Medium
Existence of Formal SLAs
Service Level Agreements (SLAs) for Nevada are established by agency, there are no state-wide SLAs
Internal clients IT vendors / suppliers
High
Percent of SLAs Being Met
33%
92%
Internal clients IT vendors / suppliers
State of Nevada

IT Benchmark Results | 66 © 2014 The Hackett Group, Inc. All rights reserved. Reproduction of this document or any portion thereof without prior written consent is prohibited.
Confidential
People / Organization

IT Benchmark Results | 67 © 2014 The Hackett Group, Inc. All rights reserved. Reproduction of this document or any portion thereof without prior written consent is prohibited.
Confidential
Resource allocation and staff mix
18%
79%
3%
IT Resource Allocation
Staff Mix
7%
28%
60%
5%
State of Nevada
State of Nevada
Design
Build
Run
Manage
Managers
Professionals
Clericals

IT Benchmark Results | 68 © 2014 The Hackett Group, Inc. All rights reserved. Reproduction of this document or any portion thereof without prior written consent is prohibited.
Confidential
Staff mix per process - Design
44%35%
41%
55%65% 58%
1 %1%
State of Nevada State of Nevada State of Nevada
Manager Professional Clerical
IT Business Planning Enterprise Architecture
Planning
Emerging Technologies

IT Benchmark Results | 69 © 2014 The Hackett Group, Inc. All rights reserved. Reproduction of this document or any portion thereof without prior written consent is prohibited.
Confidential
Staff mix per process - Build
28%
11%
26%
72%
89%66%
8%
State of Nevada State of Nevada State of Nevada
Manager Professional Clerical
Infrastructure
Development
Application Development
and Implementation Quality
Assurance

IT Benchmark Results | 70 © 2014 The Hackett Group, Inc. All rights reserved. Reproduction of this document or any portion thereof without prior written consent is prohibited.
Confidential
Staff mix per process – Run and Manage
15%8% 9%
31%
76%
85%87%
91%59%
12%
5%10% 12%
State of Nevada State of Nevada State of Nevada State of Nevada State of Nevada
Manager Professional Clerical
Infrastructure
Management
End user
Support Application
Maintenance
Risk
Management
Function
Management
IT Benchmark Results | 71 © 2014 The Hackett Group, Inc. All rights reserved. Reproduction of this document or any portion thereof without prior written consent is prohibited.
Confidential
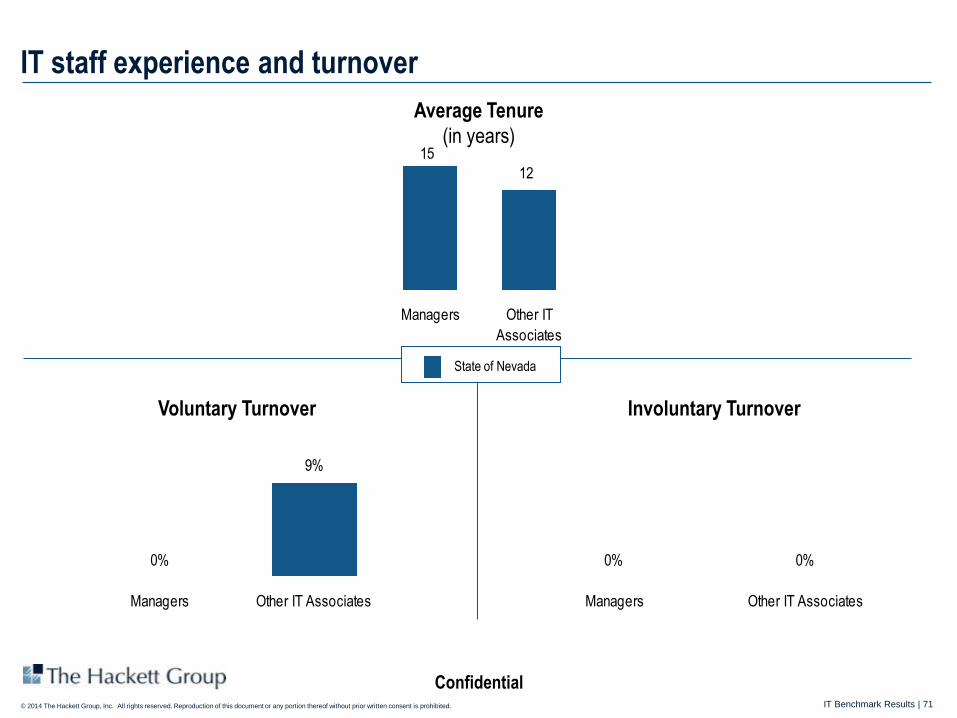
0% 0%
Managers Other IT Associates
0%
9%
Managers Other IT Associates
Voluntary Turnover
IT staff experience and turnover
Involuntary Turnover
Average Tenure
(in years)
15
12
Managers Other IT
Associates
State of Nevada

IT Benchmark Results | 72 © 2014 The Hackett Group, Inc. All rights reserved. Reproduction of this document or any portion thereof without prior written consent is prohibited.
Confidential
40%
50%
State of Nevada
Advanced Degrees College Degrees Certifications
Yes
12% 11%
State of Nevada
42%39%
State of Nevada
Education of the IT staff
Managers Other IT Staff

IT Benchmark Results | 73 © 2014 The Hackett Group, Inc. All rights reserved. Reproduction of this document or any portion thereof without prior written consent is prohibited.
Confidential
IT training hours
Annual Training Hours per IT FTE
(Internal + External Training)
34
32
State of NevadaInternal External

IT Benchmark Results | 74 © 2014 The Hackett Group, Inc. All rights reserved. Reproduction of this document or any portion thereof without prior written consent is prohibited.
Confidential
IT Personnel Management Practice Questions State of Nevada
To what extent does a formal training program exist for the IT staff -
Management staff None
To what extent does a formal training program exist for the IT staff -
Professional staff None
What percent of IT managers and professionals are routinely rotated through
business operations positions as part of a formal career development
program?
0%
IT personnel management practice questions

IT Benchmark Results | 75 © 2014 The Hackett Group, Inc. All rights reserved. Reproduction of this document or any portion thereof without prior written consent is prohibited.
Confidential
Appendix
Stakeholder Survey Results

Confidential IT Benchmark Results | 76 © 2014 The Hackett Group, Inc. All rights reserved. Reproduction of this document or any portion thereof without prior written consent is prohibited.
Stakeholder Survey Results
Participants’ Demographics
Baseline and Overall Findings
Additional Stakeholder Comments
Confidential IT Benchmark Results | 77 © 2014 The Hackett Group, Inc. All rights reserved. Reproduction of this document or any portion thereof without prior written consent is prohibited.
Participants’ Demographics

Confidential IT Benchmark Results | 78 © 2014 The Hackett Group, Inc. All rights reserved. Reproduction of this document or any portion thereof without prior written consent is prohibited.
39%
46%
15%
Executive / Senior Manager Mid Manager / Supervisor Other
Survey response demographics
The Stakeholder Survey was sent to 152 stakeholders
76 responses were received, representing a response rate of 50%
20%
7%
37%
26%
7%
3%
Finance HR IT Procurement General Government Program Operations
Respondents by Function Level of Responsibility

Confidential IT Benchmark Results | 79 © 2014 The Hackett Group, Inc. All rights reserved. Reproduction of this document or any portion thereof without prior written consent is prohibited.
Survey response demographics (con't.)
66%
26%
1%4%
3%
1 year or less >1 to 3 years >3 to 5 years
>5 to 10 years More than 10 years
Respondents by Tenure with State

Confidential IT Benchmark Results | 80 © 2014 The Hackett Group, Inc. All rights reserved. Reproduction of this document or any portion thereof without prior written consent is prohibited.
Baseline and Overall Findings

Confidential IT Benchmark Results | 81 © 2014 The Hackett Group, Inc. All rights reserved. Reproduction of this document or any portion thereof without prior written consent is prohibited.
Technology Infrastructure Controls and Risk Management Application Mgmt Planning and Strategy
Stakeholders perceive the largest performance opportunity gap in Technology Infrastructure
Importance & Effectiveness by Service Offering
No Involvement
Needs Major
Improvement
Vital/Highly Important Strong Performance,
Exceeds Expectations
Not Important Falls Short of
Expectations
Important
Average, Gets the
Job Done 3
2
1
Effectiveness Largest Opportunity Gap Importance
Confidential IT Benchmark Results | 82 © 2014 The Hackett Group, Inc. All rights reserved. Reproduction of this document or any portion thereof without prior written consent is prohibited.
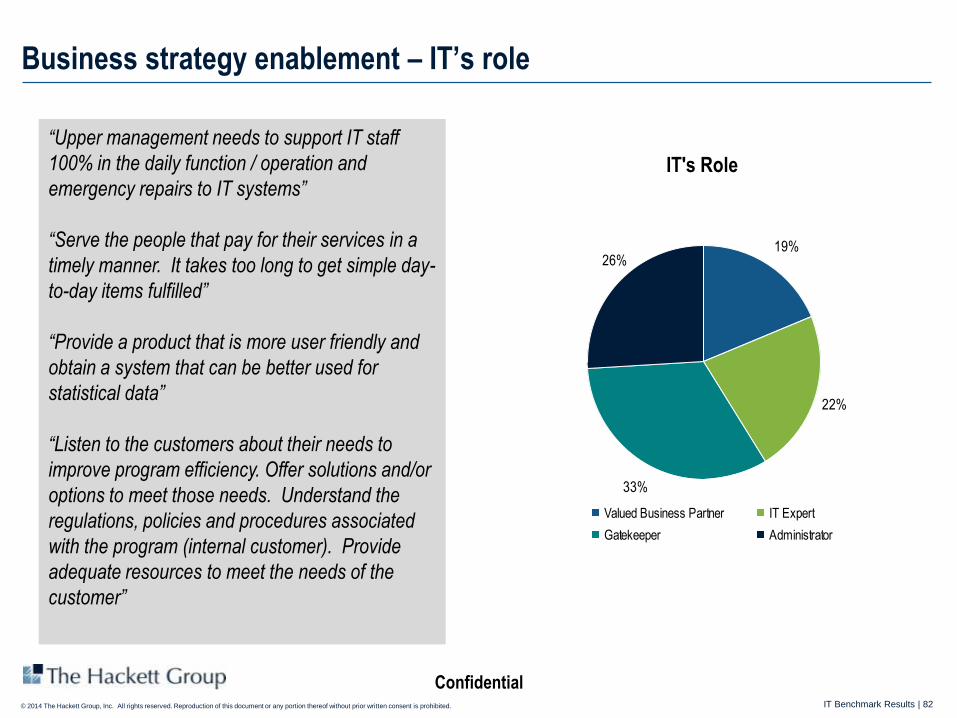
Business strategy enablement – IT’s role
“Upper management needs to support IT staff
100% in the daily function / operation and
emergency repairs to IT systems”
“Serve the people that pay for their services in a
timely manner. It takes too long to get simple day-
to-day items fulfilled”
“Provide a product that is more user friendly and
obtain a system that can be better used for
statistical data”
“Listen to the customers about their needs to
improve program efficiency. Offer solutions and/or
options to meet those needs. Understand the
regulations, policies and procedures associated
with the program (internal customer). Provide
adequate resources to meet the needs of the
customer”
19%
22%
33%
26%
Valued Business Partner IT Expert
Gatekeeper Administrator
IT's Role

Confidential IT Benchmark Results | 83 © 2014 The Hackett Group, Inc. All rights reserved. Reproduction of this document or any portion thereof without prior written consent is prohibited.
Business strategy enablement – IT’s involvement
“The IT organization should make it a priority to
know and understand each division's work
program and strategic needs”
“Become proactive in improving the IT
environment for DPS; don't wait for your
customers to bring forth the improvement ideas”
“Involve more stakeholders in the decision-making
process. While the stakeholders may not have all
of the technical expertise of the IT staff, they may
be able to offer suggestions and/or critiques of
IT's proposed solution”
“Proactively interact with customers. Follow the
customers' lead, provide some leadership focused
on customer needs, or get out of the way”
13%
25%
35%
27%
Proactive Reactive Limited No Involvement
IT's Involvement

Confidential IT Benchmark Results | 84 © 2014 The Hackett Group, Inc. All rights reserved. Reproduction of this document or any portion thereof without prior written consent is prohibited.
IT involvement in the business Nature of IT’s Involvement in Key Activities
14%
12%
17%
11%
24%
28%
27%
30%
30%
26%
34%
37%
34%
40%
41%
53%
28%
23%
25%
18%12%
14%
10%
12%
Mergers, Acquisitions, Divestiture
Cost Reduction Efforts
Balance of Controls and Efficiency
Improvement of Organizational
Processes
T imely and Accurate Management
Information
Planning and Budgeting
Proactive Reactive Limited Not involved

Confidential IT Benchmark Results | 85 © 2014 The Hackett Group, Inc. All rights reserved. Reproduction of this document or any portion thereof without prior written consent is prohibited.
Performance of Overall IT Organization Performance of the IT Organization
20%17%25%26%
14%
34%42%35%
38%51%
48%54%55%
48%49%
63%
25%
26%25%19%
20%15%
20%16%17%
18%19%
21%15%
10%
12%12%14% 14%22%
14%
20%27%
20%17%
7%4%12%
20%
Innovation in
Strategic Vision
Organizational
Alignment
Partnership
orientation
Customer
Serv ice
Orientation
CommunicationsOn Schedule
Delivery
Policy &
Procedure
Effectiveness
Meet Project
Reqmts
Up TimeStaff CapabilitiesOn-budget
delivery
Strong/Exceeds expectations Average Falls short of expectations Needs major improvement

Confidential IT Benchmark Results | 86 © 2014 The Hackett Group, Inc. All rights reserved. Reproduction of this document or any portion thereof without prior written consent is prohibited.
Comm
unicatio
n
Inte
rnal C
usto
mer
Flexibilit
y
Strate
gic Thin
king
and
Analys
is
IT F
uncti
onal A
cum
en
Analyt
ical/P
roble
m S
olving
Leade
rship
Contro
l/Com
plianc
e Stra
tegie
s
Cross
-Func
tional
Team
ing
IT S
trate
gies
Risk M
anage
men
t Stra
tegie
s
Gen
eral A
cum
en
Negotia
tion
Importance
Effectiveness
Skills - Importance & effectiveness
Importance & Effectiveness of IT Skills and Knowledge
No Involvement Needs Major Improvement
Vital/Highly Important Strong Performance/
Exceeds Expectations
Not Important Falls Short of Expectations
Important Average/Gets Job
Done
Largest
Opportunity
Gap
1 2 3

Confidential IT Benchmark Results | 87 © 2014 The Hackett Group, Inc. All rights reserved. Reproduction of this document or any portion thereof without prior written consent is prohibited.
Additional Stakeholder Comments

Confidential IT Benchmark Results | 88 © 2014 The Hackett Group, Inc. All rights reserved. Reproduction of this document or any portion thereof without prior written consent is prohibited.
Stakeholder suggestions/comments
Adding staff in critical areas such as applications development and project management. We have had to make
due with missed delivery deadlines, project delays, and work-arounds because they don't have the staff to address
all of our critical projects in a timely manner.
Providing better estimates of time for implementation of new programs.
Working on more user friendly systems.
Responding to requests vs ignoring them. Communicating with staff and managers vs no interaction. Being
proactive rather than reactive. Understanding the needs of the customer vs talking about the needs of IT.
Programming that interfaces with local governments; applications knowledge and training for staff; strategic
planning to help organization keep up; following through with budget
Providing better customer service, more forward thinking, better planning and better leadership.
Staying up on technology and utilizing current software and infrastructure technology.
Communicating better what they're doing, who to go to for what services, and improving project management.
Building their capacity to have more in house developers for new projects and enhancements. The state would be
well served with much more custom apps, and there is little to no emphasis on cultivating and growing their own
coding talent.
Demonstrating that they are capable of delivering timely and effective enterprise solutions and offer these services
at a competitive rate.
To add value, Stakeholders believe IT should start:
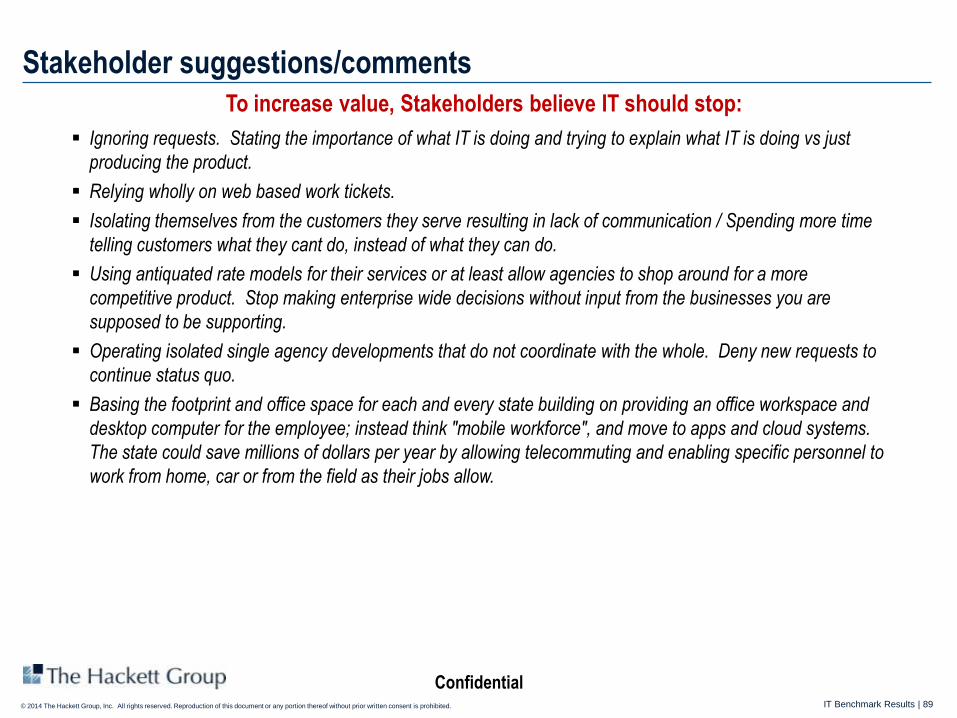
Confidential IT Benchmark Results | 89 © 2014 The Hackett Group, Inc. All rights reserved. Reproduction of this document or any portion thereof without prior written consent is prohibited.
Ignoring requests. Stating the importance of what IT is doing and trying to explain what IT is doing vs just
producing the product.
Relying wholly on web based work tickets.
Isolating themselves from the customers they serve resulting in lack of communication / Spending more time
telling customers what they cant do, instead of what they can do.
Using antiquated rate models for their services or at least allow agencies to shop around for a more
competitive product. Stop making enterprise wide decisions without input from the businesses you are
supposed to be supporting.
Operating isolated single agency developments that do not coordinate with the whole. Deny new requests to
continue status quo.
Basing the footprint and office space for each and every state building on providing an office workspace and
desktop computer for the employee; instead think "mobile workforce", and move to apps and cloud systems.
The state could save millions of dollars per year by allowing telecommuting and enabling specific personnel to
work from home, car or from the field as their jobs allow.
Stakeholder suggestions/comments
To increase value, Stakeholders believe IT should stop:

Confidential IT Benchmark Results | 90 © 2014 The Hackett Group, Inc. All rights reserved. Reproduction of this document or any portion thereof without prior written consent is prohibited.
They are good people who want to do a good job. Unfortunately they are the victims of the state budget crisis
just like the rest of the agencies. The State gets what it pays for in terms of technical skill sets and equipment.
You need to utilize your resources at the division level to assist you with day-to-day tickets, like installing
programs, setting up a new printer, giving people access to folders and calendars. Also you need to put all of
the databases that are highly restrictive in their own server space made for only those users that use it and put
everyone else in a less restrictive server set-up so we can operate like a normal business.
The appearance is that either IT staff are either undertrained, or the department is understaffed, or IT is not
interested in working with the customer. Basic communication (ie, here is what we can do and here is when it
can be done by) would be helpful vs no communication whatsoever. There does not seem to be any
management structure, leadership or direction in the IT Department. While individual IT staff are friendly and
try to be helpful, the system is so fragmented or staff do not have the basic knowledge of the IT structure to
actually provide assistance.
Ratings reflect Department IT services, not services provided by EITS. Department IT services are functioning
smoothly. We are opposed to plans by EITS to centralize IT staff/services since it would most likely increase
costs, reduce services and be extremely disruptive.
You are a customer service organization. If the customers are not happy, they will find ways to go elsewhere.
Additional Comments from Stakeholders
Stakeholder suggestions/comments
IT Benchmark Results | 91 © 2014 The Hackett Group, Inc. All rights reserved. Reproduction of this document or any portion thereof without prior written consent is prohibited.
Confidential
Contact Information
For other company information, please contact us under:
The Hackett Group
+1 866 442 2538
Email: [email protected]
www.thehackettgroup.com
The Hackett Group: Atlanta Office
1000 Abernathy Road NW, Suite 1400, Atlanta, GA 30328,
+1 866 442 2538
+1 770 225 3600
The Hackett Group: Frankfurt Office
Torhaus Westhafen
Speicherstraße 59
60327 Frankfurt am Main
+49 69 900 217 0
The Hackett Group: London Office
Martin House
5 Martin Lane
London EC4R 0DP
Phone: +44 20 7398 9100
For information on this material, please contact:
Patty Miller
Project Manager
724 263 2658
Melondy Mina
IT Advisor
770 225 3649
John Curia
Benchmark Advisor
317 752 9999
Statement of Confidentiality and Usage Restrictions
This document contains trade secrets and other information that is company sensitive,
proprietary, and confidential, the disclosure of which would provide a competitive
advantage to others. As a result, the reproduction, copying, or redistribution of this
document or the contents contained herein, in whole or in part, for any purpose is strictly
prohibited without the prior written consent of The Hackett Group.
Copyright © 2014 The Hackett Group, Inc. All rights reserved. World-Class Defined and
Enabled.