STATE of NEPAL'S FORESTS - Department of Forest ...dfrs.gov.np/downloadfile/State of Nepals Forests...
73
STATE of NEPAL'S FORESTS Government of Nepal Ministry of Forests and Soil Conservation Department of Forest Research and Survey Forest Resource Assessment Nepal December 2015
Transcript of STATE of NEPAL'S FORESTS - Department of Forest ...dfrs.gov.np/downloadfile/State of Nepals Forests...
STATE of NEPAL'S FORESTS
Government of Nepal
Ministry of Forests and Soil Conservation
Department of Forest Research and Survey Forest Resource Assessment Nepal
December 2015
STATE OF NEPAL'S FORESTS
GOVERNMENT OF NEPAL
MINISTRY OF FORESTS AND SOIL CONSERVATION
DEPARTMENT OF FOREST RESEARCH AND SURVEY
FOREST RESOURCE ASSESSMENT NEPAL
Publication No. 5 December 2015

© Department of Forest Research and Survey, 2015
Any reproduction of this publication in full or in part should mention the title and credit DFRS/FRA.
Citation
DFRS, 2015. State of Nepal's Forests. Forest Resource Assessment (FRA) Nepal, Department of Forest Research and Survey (DFRS). Kathmandu, Nepal.
ISBN: 978‐9937‐8896‐3‐6
Published by
Department of Forest Research and Survey
P.O. Box: 3339, Babarmahal, Kathmandu, Nepal
Tel: 977 1 4220482, Fax: 977 1 4220159
Email: [email protected], Web: www.dfrs.gov.np
Cover Photographs
Front cover: Terai Sal forests of Rautahat District, Nepal
Back cover: High altitude forests of Kalikot District, Nepal

MESSAGE
The contribution of forests to the well‐being of humankind is enormous and wide‐ranging. Forests
play an important role in ensuring food security, combating rural poverty and providing decent
livelihoods to the people. Forests also offer green growth opportunities and provide vital
environmental services such as cleaning air and water, conserving biodiversity and watersheds
and addressing climate change impacts. By providing essential goods and services, sustainably
managed forests ultimately contribute to sustainable development. Therefore, forests and their
role have also been recognised in the United Nation's sustainable development goals.
Reliable and up‐to‐date information on the state of forest resources is crucial for supporting
policy formulation, strategic planning, financial investment and sustainable forest management.
The current forest policy of Nepal also recognises the need for updating the information of the
country's forest resources. Forest Resource Assessment (FRA) Nepal project was a bilateral
cooperation between the Governments of Nepal and Finland. The project aimed to conduct the
national level forest assessment for updating information on forest resources of Nepal.
While this report summarises the results of the FRA project, greater details are provided in
physiographic region‐wise reports. I believe that the implementation of national FRA and
production of all these reports are the major steps forward in the forestry sector of Nepal.
On behalf of the Government of Nepal, I am thankful to the Government of Finland for providing
financial and technical support to implement the FRA Nepal project. I would also like to
acknowledge the efforts of the Department of Forest Research and Survey in implementing the
project and all the stakeholders contributing for the successful completion of the project.
Finally, I would like to assure that the Ministry of Forests and Soil Conservation is committed to
institutionalise periodic FRA system and utilise the updated forest resource information for
forestry sector policy‐making, planning and sustainable forest management. I hope the
information disseminated by this report will be beneficial in full extent to all decision makers,
planners, academicians, students and other professionals working in the field of natural resource
management.
Thank you.
Agni Prasad Sapkota Minister Ministry of Forests and Soil Conservation

State of Nepal’s Forests ii |
FOREWORD
National level forest resource information is important for policy‐making, strategic level planning,
and international reporting by government. To generate this information, the Government of
Nepal implemented the Forest Resource Assessment Nepal (FRA Nepal) project from 2010 to
2014 with support from the Government of Finland.
This national report presents the results of the forest resource assessment of the entire country.
It provides a wide range of information including forest cover, growing stock, biomass, and forest
carbon. In addition, there are separate physiographic region‐wise detailed reports for Terai,
Churia, and Middle Mountains, and a combined report for High Mountains and High Himal
physiographic regions.
I would like to acknowledge the efforts of the Department of Forest Research and Survey for
executing the Forest Resource Assessment project. I appreciate the hard work of all those
involved in planning, field inventory, data analysis, mapping, report writing and other supportive
work related to the implementation of FRA Nepal project.
I would also like to take this opportunity to express my sincere gratitude to the Government of
Finland for providing technical and financial support to accomplish this important work.
I am confident that the capacity enhancement of our institutions and personnel during the FRA
Nepal project would be useful for undertaking forest resource assessments in future.
I believe that the results of this study will be useful not only in policy‐making, strategic planning
and international reporting but will also serve as baseline information for future forest resource
assessments of the country.
Uday Chandra Thakur
Secretary
Ministry of Forests and Soil Conservation
State of Nepal’s Forests iii |
ACKNOWLEDGEMENTS
Like any major undertaking, the Forest Resource Assessment Nepal project was the collective effort of
many. In particular, I appreciate the efforts of the following people who, in their various capacities,
contributed in the implementation of the project. Some names are repeated to recognise the person's
role in various capacities.
Project Steering Committee: Yuvaraj Bhusal, Chhabi R. Pant, Keshab P. Bhattarai, Naveen K. Ghimire, Krishna C. Paudel, Ganesh R. Joshi, Sharad C. Poudel, Madhav P. Acharya, Gopal K. Shrestha, Harihar Sigdel, Annapurna N. Das, Sahas M. Shrestha, Biswo N. Oli, Braj K. Yadav, Gopal K. Upadhyaya, Megh B. Pandey, Krishna P. Acharya, Bharat P. Pudasaini, Yam B. Thapa, Tika R. Adhikari, Pem N. Kandel, Mukunda P. Ghimire, Kiran R. Sharma, Ramesh Shakya, Hasta B. Thapa, Deepak K. Kharal, Yam P. Pokharel, Kailash Pokharel, Abhoy K. Das, Chudamani Joshi, Kari Leppanen, Pekka Seppala, Tuomo A. Kotimaki, Micheal D. Hawkes.
Project Management Committee: Sahas M. Shrestha, Ramesh Shakya, Hasta B. Thapa, Deepak K.
Kharal, Yam P. Pokharel, Pem N Kandel, Tuomo A. Kotimaki, Michael D. Hawkes, Shree K. Gautam,
Keshab R. Goutam, Buddi S. Poudel, Sharad K. Baral, Rajesh Malla, Sabitri Aryal.
Validation Committee: Krishna P. Acharya, Gopal P. Bhattarai, Jisnu M. Bhattarai, Kamal Ghimire,
Rabindra Maharjan, Ramesh Basnet, Shree K. Gautam, Yam P. Pokharel.
Technical Team: Kalpana Shrestha, Shiva Khanal, Bimal K. Acharya, Raj K. Giri, Gayatri Joshi , Junu
Shrestha, Anu Rajbhandari, Sangeeta Shakya, Bishwo B. Pudasaini, Tika R. Pokharel, Padmira Dangol,
Ashok Chaudhary, Manju Ghimire, Milan Dhungana, Ananda Khadka, Amul K. Acharya, Shova Paudel,
Ian Thomas, Ulrike Nocker, Bhuwan K. Sharma, Ajay Pandey, Anish Joshi, Ashwin Dhakal, Hari Pokharel,
Jukka Alm, Heikki Parikka, Kari Korhonen, Kiran Timalsina, Basanta Gautam, Pramod Shrama, Saurav
Shrestha, Ajay Mishra, Tanya Laitila, Tuija Suihkonen, Sajana Maharjan, Saroj Koirala, Sushil
Lamichhane, Puspa Pandey, Tej B. Basnet, Anil Shrestha, Bijaya R. Poudel, Sita Aryal.
Field Crew Team:
Shree K. Gautam, Keshab R. Goutam, Buddi S. Poudel, Sharad K. Baral, Rajesh Malla, Sabitri Aryal,
Gopal P. Gautam, Shiva Khanal, Devendra L. K. Karna, Rajan Regmi, Basanta Sharma, Rajendra
Basukala, Naresh K. Karna, Bimal K. Acharya, Raj K. Giri, Milan Dhungana, Manju Ghimire, Thakur
Subedi, Kamal R. Aryal, Rajeev K. Jha, Amul K. Acharya, Khem Bishwokarma, Bishnu P. Dhakal, Kajiman
Tamang, Ram K. Bhandari‐Chhetri, Dayanidhi Aryal, Khila N. Dahal, Ram A. Yadav, Jagadish Regmi,
Prem Sapkota, Mahadeep Pokharel, Bhuwaneshwor Chaudhary, Sujit K. Jha, Amardev P. Yadav,
Govinda P. Poudel, Surendra Shrestha, Babu R. Aryal, Sailendra K. Misra, Narendra P. Guragain,
Mahinarayan Chaudhary, Subhas Sharma, Mukunda Adhikari, Nabin Chalise, Achal Dhungana,
Rambalak Yadav, Bechu Yadav, Ramesh K. Giri, Mun B. Raut, Niraj Dangi, Jaya Tripathi, Govinda Thapa,
Bindu Subedi, Mijan Regmi, Ashis Tiwari, Kamal Ghimire, Deepak Aryal, Sunil Dhungana, Bijaya K.

State of Nepal’s Forests iv |
Yadav, Birendra K. Yadav, Deepak Lamichhane, Lajmina Joshi, Kabita Sharma, Manisha Pandey, Babita
Maharjan, Bhawani Shrestha, Ganga D. Bhatta, Md. Sajjad Alam, Dambar B. Karki, Shekhar C. Bhatt,
Ramesh Gautam, Santosh Labh, Binita Sahi, Khum B. Thapa Magar, Salik R. Sigdel, Suman Dhakal, Usha
Adhikari, Binod K. Basnet, Shree H. Bhattarai, Yam K. Basnet, Rupa Subedi, Bina Wagle, Madhabes
Pathak, Rajan P. Paudyal, Rabin Suwal, Injun Acharya, Ajit Tumbahamphe, Umesh Khanal, Jivan Paudel,
Raj Tiwari, Renu Napit, Niraj Thapa, Nabin Bhattarai, Suprem Prajapati, Yub R. Khadka, Debendra
Bhandari, Anil Shah, Kashi Yadav, Kashi N. Chaudhary, Bijaya K. Yadav, Krishna K. C., Bishnu K. C.,
Bhojraj Pathak, Salina Kadal, Milan Sapkota, Dipak Aryal, Kalpana Gyawali, Lalit K. Yadav, Sudeep
Khadka, Bhuban Timalsina, Rajaram Aryal, Naval K. Yadav, Bed P. Bhandari, Bhim B. Thapa, Ram B.
Khadka, Shivram Dhungana, Muna Neupane, Sundar Rai, Birendra K. Yadav, Nabraj Giri, Laxman
Chaudhary, Dharma C. Shakya, Krishna B. K. C., Mijan Regmi, Nabina Sapkota, Anita Gautam, Madur
Dahal, Sunil Dhungana, Manju Badu.
Administration, Accounts and Planning Team: Badri K. Sankhdev, Gopal Gautam, Jagdishwor Sedhain,
Mukunda R. Joshi, Keshab Prasai, Bikash Basnet, Bishnu P. Dhakal, Gopikrishna Gnawali, Renuka
Shrestha, Kalpana Raut, Laxman P. Aryal, Chudamani Bhandari, Mohan K. Khadka, Ramkumar
Pudasaini, Bijay Sharma, Devendra Acharya, Sabitra Ghimire.
Support Staff: Shyam Sangachhe, Purna B. Karki, Krishna B. Tamang, Om Timilsina, Hari Pokharel,
Padam Tamang, Ramesh Khadgi, Arun Karki, Kumar Gurung, Ram Lama, Mohan Shrestha, Prabhuram
Thapa Magar, Rameshwor Ranabhat, Nar B. Rai, Dhan B. Thing, Nanda B. Rai, Talak B. Mahat, Shree K.
Khadka, Govinda Suwal, Jeetlal Suwal, Uday B. Shrestha, Laxmi Nepal, Bishal Thapa, Rekha Thapa,
Premkumari Ranabhat, Tunakumari Giri, Ram G. Maharjan, Yuvraj Thapa, Laxman Kandel.
I am thankful to MFSC task force team—Man B. Khadka, Yam P. Pokharel, Sagar Rimal, Mohan Poudel,
and Bijaya R. Subedi—for their validation checks during the report approval process. I acknowledge
the hardwork of Deepak K. Kharal, Yam P. Pokharel, Keshab R. Goutam, Buddi S. Poudel, Shiva Khanal,
and Amul K. Acharya in finalising this report.
I am thankful to Indufor Oy, the Finnish Forest Research Institute (Metla), Arbonaut, and Genesis
Consultancy for their support to the department in implementing the project.
I am grateful to the Ministry of Forests and Soil Conservation; Department of Forests; Department of
Soil Conservation and Watershed Management; Department of National Parks and Wildlife
Conservation; Department of Plant Resources; Regional Forest Directorates; District Forest Offices;
District Soil Conservation Offices; District Plant Resource Offices; Offices of National Parks, Wildlife
Reserves, and Conservation Area; Nepal Foresters' Association; office bearers and members of
Community Forest User Groups, Leasehold Forest User Groups, Collaborative Forest and Buffer Zone
Community Forest User Groups, and others for their contributions.
Prakash Mathema
Director General
Department of Forest Research and Survey

State of Nepal’s Forests v |
ACRONYMS AND ABBREVIATIONS
BRDF Bidirectional Reflectance Distribution Function
CBS Central Bureau of Statistics
CCSP Concentric Circular Sample Plot
CDR Central Development Region
cm Centimetre
DBH Diameter at Breast Height (1.3 m)
DEM Digital Elevation Model
DFRSd
Department of Forest Research and Survey
DHM Department of Hydrology and Meteorology
DoF Department of Forests
DoS Department of Survey
EDR Eastern Development Region
FAO Food and Agriculture Organization of the United Nations
FRA Forest Resource Assessment
FWDR Far‐Western Development Region
GIS Geographic Information System
GOFC‐GOLD Global Observation of Forest and Land Cover Dynamics
ha Hectare
HH High Himal
HM High Mountains
IPCC Intergovernmental Panel on Climate Change
LMH Lower Mixed Hardwood
LRMP Land Resources Mapping Project
m3/ha Cubic metre per hectare
MFSC Ministry of Forests and Soil Conservation
mm Millimetre
MM Middle Mountains
MPFS Master Plan for the Forestry Sector
MSS Multi‐Spectral Scanner
MWDR Mid‐Western Development Region
NFI National Forest Inventory
NTFP Non‐Timber Forest Product
OC Organic Carbon
OL Other Land
OWL Other Wooded Land
PA Protected Area
PSP Permanent Sample Plot
RMSE Root Mean Square Error

State of Nepal’s Forests vi |
RS Remote Sensing
SD Standard Deviation
SOC Soil Organic Carbon
t/ha tonne per hectare
TMH Terai Mixed Hardwood
UMH Upper Mixed Hardwood
USAID United States Agency for International Development
WDR Western Development Region
State of Nepal’s Forests vii |
GLOSSARY
Above‐ground biomass It refers to the biomass of trees (≥10 cm DBH) above the soil; it includes dead wood but not stumps.
Below‐ground biomass It refers to the biomass of trees (≥10 cm DBH) contained within live roots and stumps.
Biomass The biological material derived from living or recently living organisms. It includes both the above‐ and below‐ground biomass of trees and saplings.
Bulk density Soil mass per unit volume, expressed in g/cm3.
Carbon stock Carbon content in above‐ground and below‐ground biomass, and soil.
Cull tree A malformed tree that does not meet, and cannot be expected to meet regional merchantability standards.
Debris Fallen dead trees and the remains of large branches (<10 cm diameter) on the forest floor.
Forest An area of land at least 0.5 ha and a minimum width/length of 20 m with a tree crown cover of more than 10% and tree heights of 5 m at maturity.
Forest type The species which has more than 60% basal area is defined as that forest type.
Growing stock The sum of all trees by number or volume or biomass growing in a unit area.
High‐quality sound tree A live tree which will yield at least a 6 m long saw log.
Land cover The bio‐physical material covering the surface of the earth.
Litter Dead plant materials such as leaves, bark, needles, and twigs that have fallen to the ground.
Lower Mixed Hardwood (LMH)
Mixed hardwood forests generally found between 1,000–2,000 m altitude.
Non‐reachability A plot is regarded as non‐reachable if the slope within the plot is more than 45 degrees (100 %).
Other Land All land that is not classified as Forest or Other Wooded Land.
Other Wooded Land (OWL) The land not classified as forest spanning more than 0.5 ha, having at least 20 m width and a tree canopy cover of trees between 5% and 10%.
or
The canopy cover of trees less than 5% but the combined cover of shrubs, bushes and trees more than 10%; includes area of shrubs and bushes where no trees are present.
State of Nepal’s Forests viii |
Shrub An area occupied by woody perennial plants, generally 0.5–5.0 m height at maturity, and often without definite stems or crowns.
Sound tree A live tree not qualified as class 1 but able to produce at least one 3 m saw log or two 1.8 m saw logs.
Terai Mixed Hardwood (TMH)
A low‐altitude, broadleaved forest in which no species constitutes 60% of the total basal area.
Upper Mixed Hardwood (UMH)
Mixed hardwood forests generally found above 2,000 m.
Wall‐to‐wall mapping Mapping that covers an entire area.
State of Nepal’s Forests ix |
MAIN RESULTS
Forest Cover
1. Forest occupies a total of 5.96 million ha which is 40.36% of the total area of the country. Other Wooded Land (OWL) covers 0.65 million ha (4.38%). Forest and OWL together represent 44.74% of the total area of the country.
2. Out of the total area of Forest, 82.68% (4.93 million ha) lies outside Protected Areas and 17.32% (1.03 million ha) inside Protected Areas. Within the Protected Areas, Core Areas and Buffer Zone contain 0.79 and 0.24 million ha of Forest, respectively.
3. Out of the total area of Forest, 37.80% lies in Middle Mountains physiographic region, 32.25% in High Mountains and High Himal, 23.04% in Churia and 6.90% in Terai. In case of OWL, Terai, Churia, Middle Mountains, and High Mountains and High Himal physiographic regions share 1.47%, 3.50%, 9.61% and 85.42%, respectively.
Growing Stock
4. The total number of stems with Diameter at Breast Height (DBH) ≥10 cm estimated in the Forest of Nepal is 2,563.27 million (429.93/ha). The estimated total stem volume is 982.33 million m3 (164.76 m3/ha).
5. High Mountains and High Himal physiographic regions together has the highest stem volume per hectare (225.24 m3/ha) whereas Middle Mountains has the lowest stem volume per hectare (124.26 m3/ha). Terai and Churia regions have 161.66 m3/ha and 147.49 m3/ha, respectively.
6. The total above‐ground air‐dried biomass in the Forest of Nepal is 1,159.65 million tonnes (194.51 t/ha).
Carbon Stock
7. The total carbon stock in Nepal’s Forest has been estimated as 1,054.97 million tonnes (176.95 t/ha). Out of this total, tree component (live, dead standing, dead wood and below‐ground biomass), forest soils, and litter and debris constitute 61.53%, 37.80 %, and 0.67%, respectively.
Biodiversity
8. A total of 443 tree species belonging to 239 genera and 99 families were identified in the sample plots. The number of tree species identified in the sample plots of Middle Mountains, Churia, High Mountains along with High Himal and Terai regions were 326, 281, 275 and 164, respectively.
Forest Disturbance
9. Among all physiographic regions, Churia was observed to have the highest occurrence of forest disturbance particularly grazing, forest fire, landslide and bush cutting.
State of Nepal’s Forests x |
k|d'v glthfx? jg If]q
!= g]kfndf jgn] %( nfv ^@ xhf/ x]S6/ e"–efu cf]u6]sf] 5, h'g g]kfnsf] s'n If]qkmnsf] $)=#^Ü x'g cfpF5 . cGo sfi7 tyf a'6\ofgIf]q (Other Wooded Land) ^ nfv $* xhf/ x]S6/ -$=#*Ü_ /x]sf] 5 . g]kfnsf] s'n If]qkmndWo] jgIf]q / cGo sfi7 tyf a'6\ofgIf]q b'a}n] u/L $$=&$Ü e"–efu cf]u6]sf] 5 .
@= s'n jg If]qkmndWo] :f+/lIftIf]q eGbf aflx/sf] efudf $( nfv @( xhf/ x]S6/ -*@=^* Ü_ / :f+/lIft If]qdf !) nfv ## xhf/ x]S6/ -!&=#@Ü_ jg /x]sf] kfOPsf] 5 . :f+/lIft If]qsf] leqL efu -Core Area_ df & nfv (# xhf/ x]S6/ / dWojtL{ If]qdf @ nfv $) xhf/ x]S6/ jg /x]sf] kfOPsf] 5 .
#= s'n jg If]qkmnsf] #&=*)Ü dWokxf8L ef}uf]lns If]qdf, #@=@%Ü pRrkxf8L tyf pRrlxdfnL If]qdf, @#=)$Ü r'/] If]qdf / ^=()Ü t/fO{ If]qdf cjl:yt 5 . o;}u/L cGo sfi7 tyf a'6\ofgIf]q dWo] t/fO{, r'/], dWokxf8L / pRrkxf8L tyf pRrlxdfnL ef}uf]lns If]qx?df qmdzM !=$&Ü, #=%)Ü, (=^!Ü, / *%=$@Ü /x]sf] 5 .
?vsf] df}Hbft $= g]kfnsf] jg If]qdf !) ;]=ld= eGbf al9 Jof; ePsf ?vsf] ;+Vof @ ca{ %^ s/f]8 ## nfv -
$@(=(# k|lt x]S6/_ / s'n sf08 cfotg (* s/f]8 @# nfv #@ xhf/ 3g ld6/ -!^$=&^ 3g ld6/ k|lt x]S6/_ cg'dfg ul/Psf] 5 .
%= sf08sf] cf};t cfotg (mean stem volume) ;a}eGbf al9 -@@%=@$ 3g ld6/ k|lt x]S6/_ pRrkxf8L tyf pRrlxdfnL ef}uf]lns If]qdf kfOPsf] 5 eg] dWokxf8L If]qdf ;a}eGbf sd -!@$=@^ 3g ld6/ k|lt x]S6/_ kfOPsf] 5 . t/fO{ / r'/] ef}uf]lns If]qx?df qmdzM !^!=^^ / !$&=$( 3g ld6/ k|lt x]S6/ sf08 cfotg /x]sf] kfOof] .
^= g]kfnsf] jgIf]qdf ?vsf] s'n h}ljs lk08 -air‐dried biomass_ ! ca{ !% s/f]8 (& nfv 6g -!($=%! 6g k|lt x]S6/_ /x]sf] 5 .
sfj{gsf] ;+lrlt &= g]kfnsf] jgIf]qdf s'n sfa{g ;+lrlt ! ca{ % s/f]8 %) nfv 6g -!&^=(% 6g k|lt x]S6/_ /x]sf]
cg'dfg ul/Psf] 5 h:fdWo] ^!=%#Ü efu ?vdf -hLljt, ;'v8 v8f, 9nfk8f / ;tx d'lgsf] efu ;d]t_, #&=*)Ü df6f]df / )=^&Ü kftklt+u/ (litter and debris) df /x]sf] kfOof] .
h}ljs ljljwtf *= dfkg ul/Psf jgIf]qdf (( kl/jf/ -families_ cGtu{t @#( hflt -genera_ sf s'n $$# Jf6f
?v k|hflt -species_ klxrfg ul/Psf 5g\ . dWokxf8L, r'/], pRrkxf8L tyf pRrlxdfnL / t/fO{ ef}uf]lns If]qx?df qmdzM #@^, @*!, @&% / !^$ j6f ?v k|hfltx? gd'gf Kn6df e]l6Psf lyP .
k|lts"n k|efjx?
(= cGo ef}uf]lns If]qx?sf] t'ngfdf r'/] ef}uf]lns If]qsf] jgdf ;a}eGbf al9 k|lts"n k|efjx? ePsf] kfOof] h;dWo] rl/r/g, jg 89]nf], klx/f] / emf8L s6fgL k|d'v x'g\ .
State of Nepal’s Forests xi |
EXECUTIVE SUMMARY
The Department of Forest Research and Survey (DFRS) implemented Forest Resource Assessment
(FRA) Nepal Project (2010–2014) with financial and technical assistance from the Government of
Finland. The project was designed to carry out national‐level forest resource assessment, with an
overall objective of providing comprehensive and up‐to‐date national‐level forest resource
information to support forest policy formulation, forestry sector decision‐making and
international reporting. The report presents information primarily on forest cover, growing stock,
biomass, carbon stock, biodiversity and forest disturbances.
Forest cover maps were prepared and classified as Forest, Other Wooded Land (OWL) and Other
Land (non‐forest) using RapidEye MSS satellite imagery, secondary images (Google Earth images,
Landsat), ancillary maps (LRMP and topographical maps) and the FRA Nepal field inventory data.
Images were classified by applying an automated method of object‐based image analysis method
on segmented images using eCognition software. In order to conduct the forest inventory, a two‐
phased stratified systematic cluster sampling design was adopted. Five physiographic regions—
Terai, Churia, Middle Mountains, High Mountains and High Himal—were considered as strata. At
the first phase, a total of 9,230 clusters (55,358 plots) were laid out systematically at the nodes of
4 km × 4 km square grids placed across the country. These plots were interpreted by using high‐
resolution RapidEye imagery and Google Earth. At the second phase, a total of 2,544 sample plots
(Forest: 1,553; OWL: 105; OL: 886) were measured in the field. Each sample plot consisted of four
concentric circular sample plots (CCSP) of different radii, four vegetation sub‐plots, four shrubs
and seedlings sub‐plots, and four soil pits.
As per this assessment, Forest covers 5.96 million ha (40.36%), Other Wooded Land covers 0.65
million ha (4.38%) and Other Land covers 8.16 million ha (55.26%). Forest and OWL together
comprise 44.74% of the total area of the country. Out of the total forest area of Nepal, 37.80% lies
in Middle Mountains region, 32.25% in High Mountains and High Himal, 23.04% in Churia and 6.90
in the Terai. The Mid‐Western Development Region has the highest (26.68 %) forest cover of
Nepal, whereas Far‐Western Development Region has the lowest (16.94 %) of the total forest
area. Out of the total forest area of the country, 4.93 million ha (82.68%) lies outside Protected
Areas and 1.03 million ha (17.32%) inside Protected Areas.
The estimated total number of stems with Diameter at Breast Height (DBH) ≥10 cm is 3,112.28
million, of which 2,563.27 million (429.93/ha) is in Forest. The total estimated stem volume with
DBH ≥10 cm is 1,063.56 million m3 out of which 982.33 million m3 (164.76 m3/ha) is in Forest, 4.58
million m3 (7.91 m3/ha) in OWL and 76.65 million m3 (14.49 m3/ha) in Other Land. High Mountains
and High Himal physiographic regions together has the highest stem volume per hectare (225.24
m3/ha) whereas Middle Mountains has the lowest (124.26 m3/ha) in Forest. Terai and Churia
State of Nepal’s Forests xii |
regions have 161.66 m3/ha and 147.49 m3/ha, respectively. Of the total stem volume in Forest,
Shorea robusta has the highest stem volume (31.76 m3/ha) followed by Quercus spp. (24.39
m3/ha) and Pinus roxburghii (11.62 m3/ha). The average above‐ground air‐dried biomass in Forest
is 194.51 t/ha. The assessment showed an increase in the number of stems from 408/ha in NFI
1987–98 to 430/ha in FRA 2010–2014. However, the mean stem volume per hectare was found to
be less in FRA 2010–2014 (164.76 m3/ha) than in NFI 1987–98 (178 m3/ha).
The total carbon stock in Nepal is estimated to be 1,157.37 million tonnes, out of which Forest,
OWL and OL constitute 1,054.97 million tonnes (176.95 t/ha), 60.92 million tonnes (105.24 t/ha)
and 41.48 million tonnes (7.84 t/ha), respectively. Out of the total forest carbon stock, tree, soil
and litter/debris components contribute 61.53%, 37.80 %, and 0.67% of carbon, respectively.
Altogether, 443 tree species belonging to 239 genera and 99 families were recorded in the sample
plots. The highest number of taxa was found in Middle Mountains region (326 species) and the
lowest in Terai region (164 species). Nearly two‐thirds of the total forest area in the country was
affected by grazing. Tree cutting, bush cutting, lathra cutting, lopping and forest fire were also
common.
The results reported here provide an important insight into the forests of Nepal which will help
the Government and concerned stakeholders in decision‐making towards sustainable forest
management. Sample plots selected for this assessment were permanently established for regular
monitoring. This, together with the institutional capacity strengthened during the project, will
help to conduct periodic forest resource assessment in the future.

State of Nepal’s Forests xiii |
;f/f+z
jg cg';Gwfg tyf ;j]{If0f ljefun] ;+rfng u/]sf] jg ;|f]t ;j]{If0f cfof]hgf g]kfn ;/sf/ /
lkmgNof08 ;/sf/sf] låkIfLo ;xof]udf ;+rflnt cfof]hgf xf] . of] cfof]hgfsf] d'Vo p2]Zo /fli6«o
:t/df g]kfnsf] jg ;|f]tsf] ;j]{If0f u/L pko'St gLlt /0fgLlt th'{df ug{ ;xof]u k'¥ofpg'sf] ;fy} jg
;DaGwL lj:t[t / cfjlws tYof+s tyf ;"rgfx? k|bfg ug'{ /x]sf] lyof] . o; /fli6«o k|ltj]bgdf
d'Votof jg If]q, jgsf] df}Hbft, h}ljslk08, sfa{g ;+lrtL, h}ljs ljljwtf / jgdf x'g] k|lts"n
k|efjx? ;DaGwL glthfx? k|:t't ul/Psf] 5 .
g]kfnsf] ;Dk"0f{ e"-efunfO{ e"-pku|x lrqx?sf] ;fy} cGo gSzfx? cWoog u/L lkmN8 sfo{ ;d]tsf]
cfwf/df jg (Forest), a'6\ofg (Other Wooded Land) / cGo If]q (Other Land) u/L tLg efudf
jlu{s/0f u/L gS;f+sg ul/Psf] lyof] . jg;|f]t ;j{]If0fsf] nflu klxnf] r/0fdf kfFr j6} ef}uf]lns
If]qx?df rf/ ls= ld= sf] juf{sf/ lu|8 agfO{ (,@#) 7fpFdf hDDff %%,#%* Kn6x? /fvL cWoog
ul/Psf] lyof] eg] bf];|f] r/0fdf jgdf !,%%#, a'6\ofgdf !)% / cGo If]qdf **^ u/L hDdf @,%$$
gd'gf Kn6x? lkmN8df uO{ gfFkhfFr ul/Psf] lyof] . k|To]s gd'gf Kn6df rf/ j[QLo 3]/fx? agfO{ ?vsf]
;fO{h cg';f/ dfkg ul/Psf] lyof] . ;f]lx Kn6leq c? ;fgf] ;fOhsf ;a–Kn6x? agfO{ 3fF;÷emf/,
a'6\ofg÷la?jf÷nfy|fsf] tYof+s ;+sng ul/Psf] lyof] . o;sf] cltl/Qm df6f]df /x]sf] sfa{g cf+sng
ug{ Kn6sf] aflx/kl§ rf/j6f s'gfaf6 df6f]sf] gd'gf ;+sng ;d]t ul/Psf] lyof] .
g]kfndf jgn] sl/a %( nfv ^@ xhf/ x]S6/ e"–efu cf]u6]sf] 5 h'g g]kfnsf] s'n If]qkmnsf] $)=#^Ü
x'g cfpF5 . a'6\ofg If]q ^ nfv $* xhf/ x]S6/ -$=#*Ü_ /x]sf] 5 . o;/L g]kfnsf] s'n If]qkmn dWo]
jg tyf a'6\ofg If]qn]] u/L hDdf $$=&$Ü e"–efu cf]u6]sf] 5 . s'n jg If]qsf] #&=*)Ü dWokxf8L
ef}uf]lns If]qdf, #@=@%Ü pRrkxf8L tyf pRrlxdfnL If]qdf, @#=)$Ü r'/] If]qdf / ^=()Ü t/fO{
If]qdf cjl:yt 5 . s'n jg If]q dWo] :f+/lIft If]qdf !) nfv ## xhf/ x]S6/ -!&=#@Ü_ / :f+/lIft If]q
eGbf aflx/ $( nfv @( xhf/ x]S6/ -*@=^*Ü_ jg /x]sf] 5 .
g]kfndf !) ;]=ld= eGbf al9 Jof; ePsf ?vx?sf] s'n ;+Vof # ca{ !! s/f]8 @# nfv 5 h;dWo]
jgIf]qdf @ ca{ %^ s/f]8 ## nfv -$@(=(# k|lt x]S6/_ 5g\ . g]kfndf sf08sf] s'n cfotg sl/a !
ca{ ^ s/f]8 #^ nfv 3g ld6/ /x]sf] 5 h;dWo] sl/a (* s/f]8 @# nfv 3g ld6/ -!^$=&^ 3g
ld6/ k|lt x]S6/_ jgIf]qdf kfOof] . pRrkxf8L tyf pRrlxdfnL ef}uf]lns If]qsf] jgdf ;a}eGbf al9
cfotg -@@%=@$ 3g ld6/ k|lt x]S6/_ / dWokxf8L If]qdf ;a}eGbf sd -!@$=@^ 3g ld6/ k|lt
x]S6/_ kfOPsf] 5 . t/fO{ / r'/] If]qdf qmdzM !^!=^^ / !$&=$( 3g ld6/ k|lt x]S6/ cfotg kfOof] .
?v k|hfltsf] cfwf/df x]bf{ jgIf]qsf] cf};t cfotg dWo] ;fn k|hfltsf] ;a}eGbf al9 -#!=&^ 3g ld6/
k|lt x]S6/_ kfOPsf] 5 eg] To;kl5 qmdzM v;|' -@$=#( 3g ld6/ k|lt x]S6/_ / vf]6] ;Nnf -!!=^@ 3g
ld6/ k|lt x]S6/_ k|hfltsf] /x]sf] kfOof] . jgIf]qdf ?vsf] hldg dflysf] cf};t h}ljslk08 !($=%!
6g k|lt x]S6/ /x]sf] kfOof] . sl/a aL; jif{ cufl8 ul/Psf] /fli6«o jg ;j]{If0fsf] t'ngfdf xfn k|lt
State of Nepal’s Forests xiv |
x]S6/ ?vsf] ;+Vofdf s]lx j[l4 ePsf] -$)* af6 $#)_ / sf08sf] cfotg df}Hbftdf s]lx lu/fj6 -
!&* af6 !^% 3g ld6/_ cfPsf] kfOPsf] 5 .
g]kfndf s'n sfa{g ;+lrlt sl/a ! ca{ !% s/f]8 &$ nfv 6g ePsf] cg'dfg ul/Psf] 5 h;dWo]
jgdf sl/a ! ca{ % s/f]8 %) nfv -cf};tM !&^=(% 6g k|lt x]S6/_, a'6\ofgdf sl/a ^ s/f]8 ( nfv
-cf};tM !)%=@$ 6g k|lt x]S6/_ / cGo If]qdf sl/a $ s/f]8 !% nfv 6g -cf};tM &=*$ 6g k|lt
x]S6/_ /x]sf] kfOof] . jg If]qsf] s'n sfa{g ;+lrlt dWo] ^!=%#Ü ?vdf, #&=*)Ü df6f]df / )=^&Ü
kftklt+u/ -litter and debris_ df /x]sf] kfOof] .
o; ;j{]If0fsf] qmddf dfkg ul/Psf gd'gf Kn6x?df s'n $$# k|sf/sf] ?vsf] k|hfltx? -@#( hflt /
(( Kfl/jf/_ kfOPsf] 5 . ;a}eGbf al9 ?vsf k|hfltx? dWokxf8L If]qdf -#@^ k|hflt_ / ;a}eGbf sd
-!^$ k|hflt_ t/fO If]qdf kfOPsf 5g\ . g]kfnsf] sl/a b'O{–ltxfO jg If]qdf rl/r/gsf] k|efj /x]sf]
kfOof] . To;}u/L cGo k|efjx?df ?v, nfy|f / la?jf s6fgL tyf jg 89]nf] pNn]Vo dfqfdf kfOof] .
o; ;j]{If0faf6 g]kfnsf] jg If]qsf] ljljw ljifox?df hfgsf/L k|fKt ePsf] / o;/L k|fKt glthfx?
g]kfn ;/sf/ / cGo ;/f]sf/jfnfx?nfO{ jg ;|f]tsf] lbuf] Joj:yfkgdf cfjZos lg0f{o lng ;xof]u
k'Ug] ck]Iff ul/Psf] 5 . ;j]{If0fsf] qmddf dfkg ul/Psf Kn6x?nfO{ :yfoL gd'gf Kn6sf] ?kdf :yfkgf
ul/Psf] 5 . o;sf ;fy} jg ;|f]t ;j]{If0fsf] nflu cfjZos ;+:yfut Ifdtfdf ;d]t clej[l4 ePsf] 5,
o;af6 eljiodf jg ;|f]t ;j]{If0f sfo{nfO{ cfjlws ?kdf ;+rfng u/L jg tyf sfa{g ;DaGwL ;"rgf
tyf tYof+sx? cWofjlws ug{df ;xof]u k'Ug] ljZjf; lnOPsf] 5 .
State of Nepal’s Forests xv |
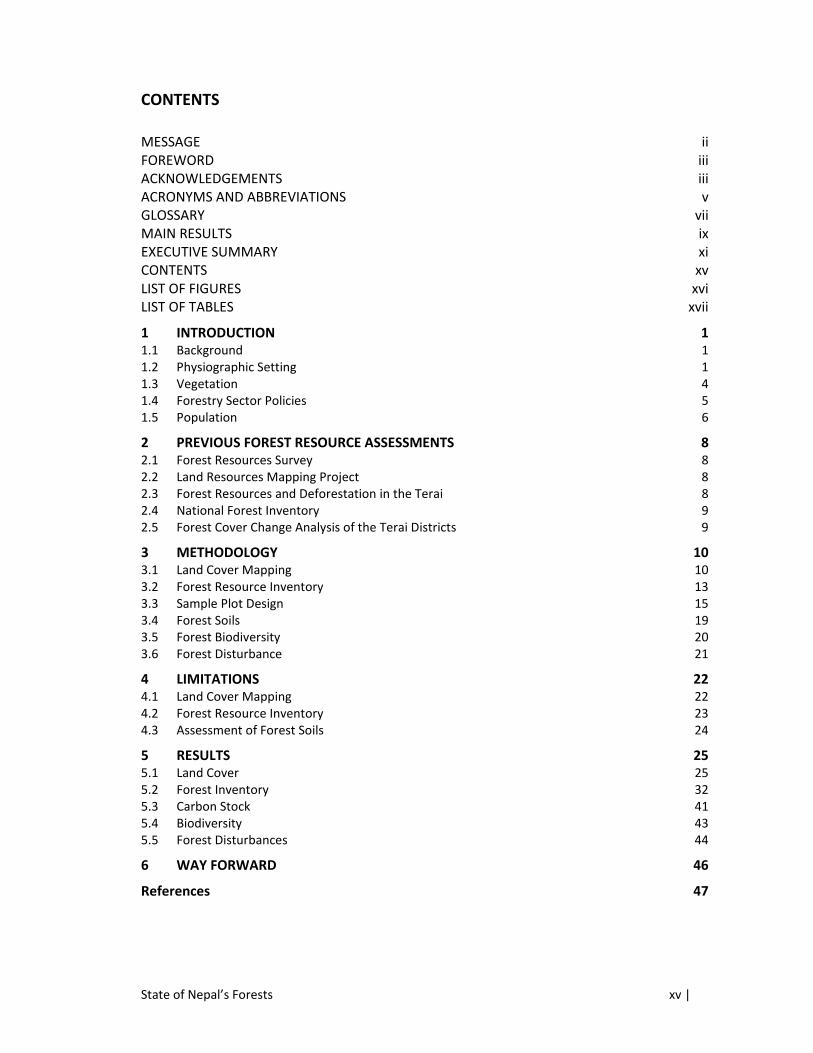
CONTENTS
MESSAGE ii FOREWORD iii ACKNOWLEDGEMENTS iii ACRONYMS AND ABBREVIATIONS v GLOSSARY vii MAIN RESULTS ix EXECUTIVE SUMMARY xi CONTENTS xv LIST OF FIGURES xvi LIST OF TABLES xvii
1 INTRODUCTION 1 1.1 Background 1 1.2 Physiographic Setting 1 1.3 Vegetation 4 1.4 Forestry Sector Policies 5 1.5 Population 6
2 PREVIOUS FOREST RESOURCE ASSESSMENTS 8 2.1 Forest Resources Survey 8 2.2 Land Resources Mapping Project 8 2.3 Forest Resources and Deforestation in the Terai 8 2.4 National Forest Inventory 9 2.5 Forest Cover Change Analysis of the Terai Districts 9
3 METHODOLOGY 10 3.1 Land Cover Mapping 10 3.2 Forest Resource Inventory 13 3.3 Sample Plot Design 15 3.4 Forest Soils 19 3.5 Forest Biodiversity 20 3.6 Forest Disturbance 21
4 LIMITATIONS 22 4.1 Land Cover Mapping 22 4.2 Forest Resource Inventory 23 4.3 Assessment of Forest Soils 24
5 RESULTS 25 5.1 Land Cover 25 5.2 Forest Inventory 32 5.3 Carbon Stock 41 5.4 Biodiversity 43 5.5 Forest Disturbances 44
6 WAY FORWARD 46
References 47
State of Nepal’s Forests xvi |
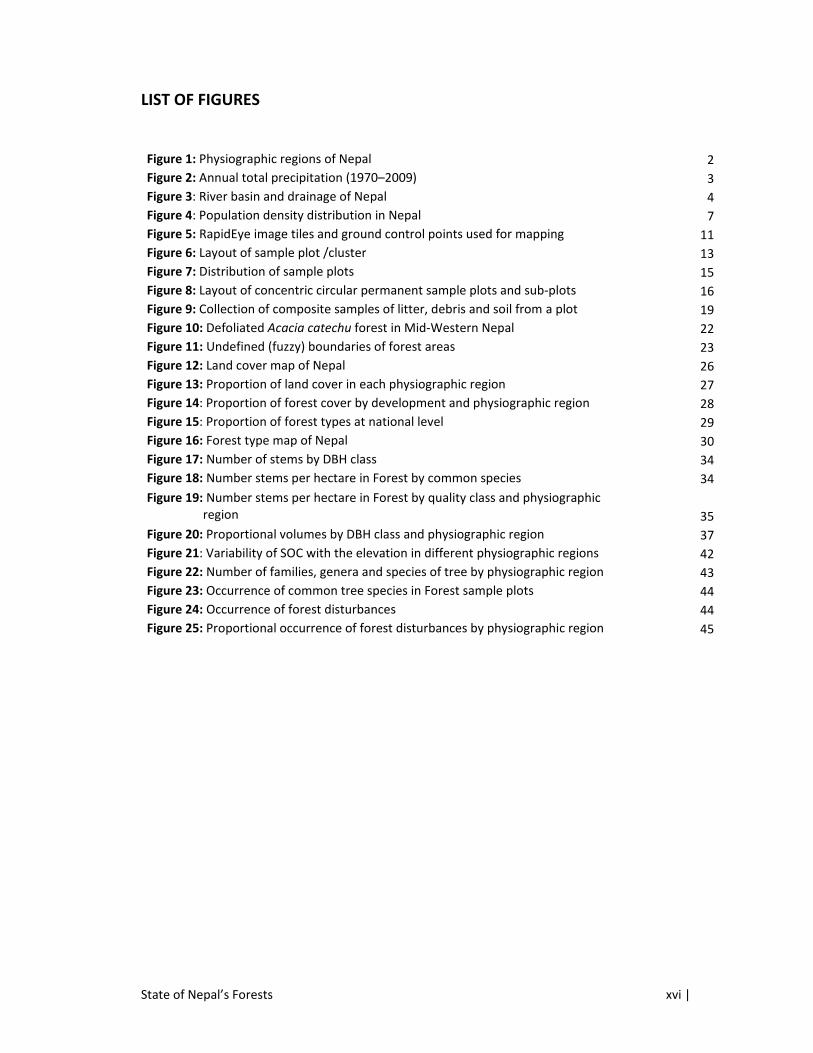
LIST OF FIGURES
Figure 1: Physiographic regions of Nepal 2
Figure 2: Annual total precipitation (1970–2009) 3
Figure 3: River basin and drainage of Nepal 4
Figure 4: Population density distribution in Nepal 7
Figure 5: RapidEye image tiles and ground control points used for mapping 11
Figure 6: Layout of sample plot /cluster 13
Figure 7: Distribution of sample plots 15
Figure 8: Layout of concentric circular permanent sample plots and sub‐plots 16
Figure 9: Collection of composite samples of litter, debris and soil from a plot 19
Figure 10: Defoliated Acacia catechu forest in Mid‐Western Nepal 22
Figure 11: Undefined (fuzzy) boundaries of forest areas 23
Figure 12: Land cover map of Nepal 26
Figure 13: Proportion of land cover in each physiographic region 27
Figure 14: Proportion of forest cover by development and physiographic region 28
Figure 15: Proportion of forest types at national level 29
Figure 16: Forest type map of Nepal 30
Figure 17: Number of stems by DBH class 34
Figure 18: Number stems per hectare in Forest by common species 34
Figure 19: Number stems per hectare in Forest by quality class and physiographic region 35
Figure 20: Proportional volumes by DBH class and physiographic region 37
Figure 21: Variability of SOC with the elevation in different physiographic regions 42
Figure 22: Number of families, genera and species of tree by physiographic region 43
Figure 23: Occurrence of common tree species in Forest sample plots 44
Figure 24: Occurrence of forest disturbances 44
Figure 25: Proportional occurrence of forest disturbances by physiographic region 45
State of Nepal’s Forests xvii |
LIST OF TABLES
Table 1: Vegetation types and eco‐regions in Nepal 5
Table 2: Distribution of ecosystems by physiographic region 5
Table 3: Population characteristics of Nepal by physiographic region 6
Table 4: Distribution of the first phase sample plots by physiographic region 14
Table 5: Distribution of permanent sample plots and clusters 15
Table 6: Size and area of CCSP of different radii with DBH limits 15
Table 7: Land cover area by physiographic region 25
Table 8: Land cover by Development Region 27
Table 9: Forest cover by physiographic and Development Region 28
Table 10: Forest cover inside and outside Protected Areas by physiographic region 29
Table 11: Error matrix of land cover map using independent ground verification samples 31
Table 12: Forest cover found by different assessments 31
Table 13: Forest cover by Development Region 32
Table 14: Number of seedlings and saplings per ha in Forest by physiographic region 32
Table 15: Number of stems (≥10 cm DBH) by land cover class 33
Table 16: Number of stems/ha in Forest by DBH class and physiographic region 33
Table 17: Stem distribution by quality class in Forest (million) 35
Table 18: Basal area by land cover class 36
Table 19: Basal area (m2/ha) by DBH class 36
Table 20: Total stem volume per ha (≥10 cm DBH) by land cover class 36
Table 21: Stem volume (m3/ha) in Forest by DBH class 37
Table 22: Stem volume in Forest by species 38
Table 23: Stem volume (m3/ha) in Forest by quality class and physiographic region 38
Table 24: Stem volume in Forest by quality class and physiographic region 38
Table 25: Tree component‐wise total biomass by land cover class 39
Table 26: Above‐ground air‐ and oven‐dried biomass of tree component 39
Table 27: Above‐ground air‐dried biomass of tree component by DBH class 39
Table 28: Total above‐ground air‐dried biomass in Forest by species 40
Table 29: Standard errors and confidence limits in Forest for physiographic region 40
Table 30: Number of stems per hectare by DBH class in two inventories 41
Table 31: Proportion of stem volume available in two inventories by common species 41
Table 32: Carbon stock (t/ha) in Nepal 41
Table 33: Soil organic carbon, litter and debris and tree component carbon stock in Forest by physiographic region 42

State of Nepal’s Forests 1 |
1 INTRODUCTION
1.1 Background
Department of Forest Research and Survey (DFRS) under the Ministry of Forests and Soil Conservation (MFSC) executed Forest Resource Assessment (FRA) Nepal Project (2010–2014), under the bilateral agreement between the Government of Nepal and the Government of Finland. The project was designed to carry out national level forest resource assessment for providing comprehensive and up‐to‐date national‐level forest resource information to support forest policy formulation, national‐level forestry sector decision‐making and international reporting.
This report presents the findings of FRA 2010–2014. It summarises the results of the forest resource assessment of physiographic regions of Nepal presented in the region‐specific reports
viz. “Terai Forests of Nepal”, “Churia Forests of Nepal”, “Middle Mountains Forests of Nepal”, and “High Mountains and High Himal Forests of Nepal”. This report presents information primarily on land cover, forest cover, growing stock, structural composition of tree species, biomass, carbon stock and forest disturbance. It attempts to address the demand for forest resource information at national and international levels.
The forest resource assessment made use of high‐resolution satellite imagery, precise measurement devices, advanced computer systems, and trained human resources to obtain reliable output.
1.2 Physiographic Setting
1.2.1 Geography
Nepal is located between 260 20’ 53” N to 300 26’ 51” N latitude and 800 03’ 30” E to 880 12’ 05” E longitude. There are five physiographic regions in Nepal (Figure 1) based on geology and geomorphology (LRMP, 1986).
Terai physiographic region of Nepal occupies 13.7% of the total land area of the country. In terms of geomorphology, it consists of gently sloping recent and post‐Pleistocene alluvial deposits, which form a piedmont plain south of the Himalayas. Its elevation varies from 63 m to 330 m above mean sea level (LRMP, 1986).
Churia region is the youngest mountain range in the Himalayas. Just north of the Terai, it runs the entire length of southern Nepal, from east to west, skirting the southern flanks of the Himalayas. The region occupies about 12.8 % of the total land area of the country, and covers parts of 36 districts of Nepal (DoS, 2001). The elevation of Churia varies from 93 to 1,955 m above mean sea level.
Middle Mountains region lies north of Churia along the southern flanks of the Himalayas. The region occupies 29.2% of the total land area of the country and covers parts of 55 districts. The elevation of Middle Mountains region varies from 110 m in the lower river valleys to 3,300 m above mean sea level.
High Mountains region occupies 20.4% of the total land area of the country and covers parts of 40 districts. The elevation of High Mountains region varies from 543 m in the river valley floors to 4,951 m above mean sea level. The region is characterised by the rugged landscape and very steep slopes.

State of Nepal’s Forests 2 |
High Himal region which includes the highest Himalayan massifs occupies about 23.9% of the total land area of the country, and covers parts of 25 districts. The region's elevation ranges from 1,960 m to 8,848 m above mean sea level.
Figure 1: Physiographic regions of Nepal
1.2.2 Soils
Terai region consists of recent and post Pleistocene alluvial deposits that form a piedmont plain (Carson et al., 1986). The lower Churia is largely composed of very fine‐grained sediments such as variegated mudstone, siltstone and shale with smaller amounts of fine‐grained sandstone (Upreti, 1999). The middle Churia has thick beds of multi‐storied sandstones alternating with subordinate beds of mudstone. The upper Churia is characterised by very coarse sediments such as loose boulder conglomerates. Dominant soil texture found in Middle Mountains region ranges from fragmented sandy to loamly/boulderly, loamy, loamy skeletal as per the diverse land forms. High Mountains soils are rocky mostly derived from phyllite, schist, gneiss and quartzite of different ages. High Himal physiographic region is characterised by rocky soils originated from gneiss, schist, limestone and shale of different ages (Pariyar, 2008).
1.2.3 Climate
The climate of Nepal greatly varies from north to south and east to west. In general, climatic zones in Nepal are categorised by temperature regimes based on altitudinal ranges. These climatic zones are sub‐tropical (<1,000 m elevation), warm‐temperate (1,000–2,000 m elevation), cool‐temperate (2,000–3,000 m elevation), alpine (3,000–4,000 m elevation) and arctic (>4,500 m elevation).
State of Nepal’s Forests 3 |
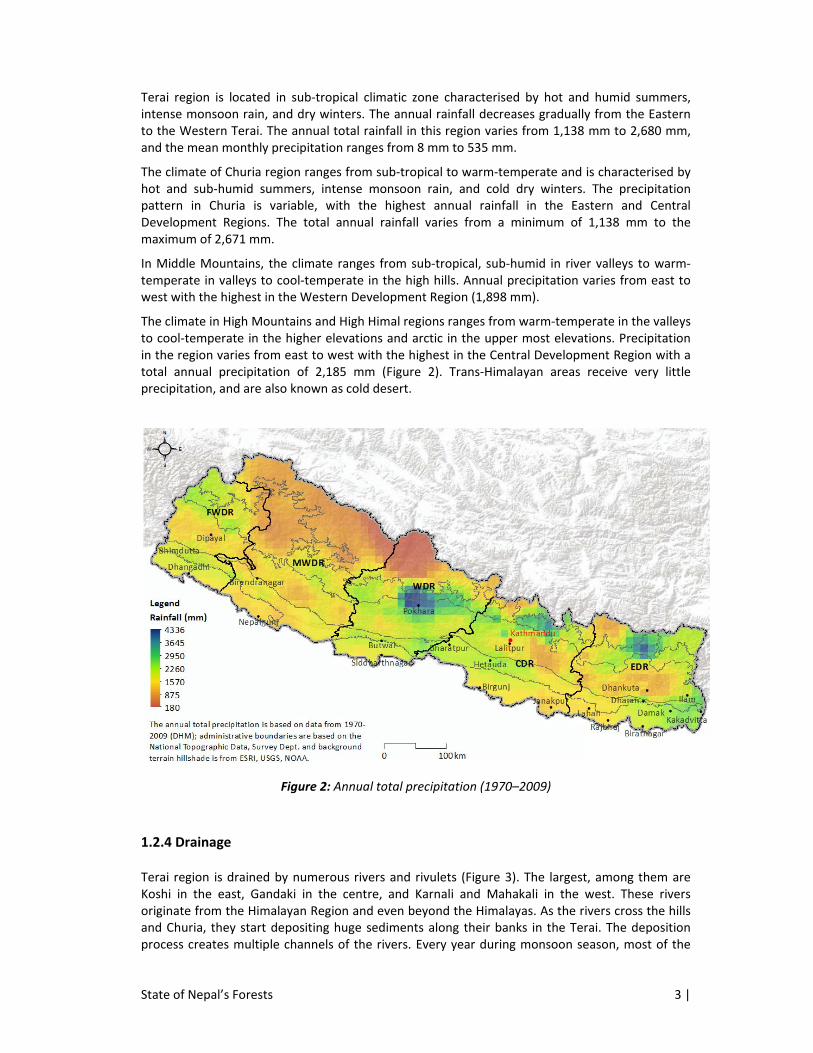
Terai region is located in sub‐tropical climatic zone characterised by hot and humid summers, intense monsoon rain, and dry winters. The annual rainfall decreases gradually from the Eastern to the Western Terai. The annual total rainfall in this region varies from 1,138 mm to 2,680 mm, and the mean monthly precipitation ranges from 8 mm to 535 mm.
The climate of Churia region ranges from sub‐tropical to warm‐temperate and is characterised by hot and sub‐humid summers, intense monsoon rain, and cold dry winters. The precipitation pattern in Churia is variable, with the highest annual rainfall in the Eastern and Central Development Regions. The total annual rainfall varies from a minimum of 1,138 mm to the maximum of 2,671 mm.
In Middle Mountains, the climate ranges from sub‐tropical, sub‐humid in river valleys to warm‐temperate in valleys to cool‐temperate in the high hills. Annual precipitation varies from east to west with the highest in the Western Development Region (1,898 mm).
The climate in High Mountains and High Himal regions ranges from warm‐temperate in the valleys to cool‐temperate in the higher elevations and arctic in the upper most elevations. Precipitation in the region varies from east to west with the highest in the Central Development Region with a total annual precipitation of 2,185 mm (Figure 2). Trans‐Himalayan areas receive very little precipitation, and are also known as cold desert.
Figure 2: Annual total precipitation (1970–2009)
1.2.4 Drainage
Terai region is drained by numerous rivers and rivulets (Figure 3). The largest, among them are Koshi in the east, Gandaki in the centre, and Karnali and Mahakali in the west. These rivers originate from the Himalayan Region and even beyond the Himalayas. As the rivers cross the hills and Churia, they start depositing huge sediments along their banks in the Terai. The deposition process creates multiple channels of the rivers. Every year during monsoon season, most of the

State of Nepal’s Forests 4 |
rivers are swollen up and cause flash floods in the Terai due to their shallow beds. One of the biggest concerns is the tendency of minor and major rivers to change their courses due to flooding events (Carson et al., 1986).
Figure 3: River basin and drainage of Nepal
Several large rivers originating in High Himal region cut the east‐west Churia chain, while smaller, ephemeral rivers flow only during the monsoon season. Water in the small rivers may dry up totally outside the monsoon season, probably because the soil in the river beds is highly permeable (Shrestha et al., 2008). Churia region is the origin of the third‐grade rivers of Nepal. These rivers are characterised by their smaller sizes and low to almost no flow during the dry season.
In Middle Mountains region, rivers originating in the Lesser Himalaya and the Mahabharat Range are called the second‐grade rivers. They are fed by precipitation as well as ground water recharge (WECS, 2011). These rivers are perennial and are commonly characterised by wide seasonal fluctuation in discharge. The major river systems in this region are Babai, West Rapti, Tinau, Bagmati, Kamala, Kankai, and Mechi.
High Mountains and High Himal regions are the origin of first‐grade rivers of Nepal. These rivers are snow‐fed rivers, originate from the Himalayas, and flow across all the physiographic regions. The first‐grade rivers that originate from the Himalayas are Mahakali, Karnali, Gandaki and Koshi.
1.3 Vegetation
Nepal occupies about 0.1 percent of the global area but harbours over three percent of the world's known flora. A total of 284 flowering plants are endemic to Nepal. The number of known species in Nepal is: 6,073 angiosperms; 26 gymnosperms; 534 pteridophytes; 1,150 bryophytes; 365 lichens; 1,822 fungi and 1,001 algae (GoN, 2014).

State of Nepal’s Forests 5 |
Phyto‐geographically, Nepal is located in the Oriental Region (Polunin, 1964). According to the Conservation Science Programme WWF‐US (1998), Nepal includes 12 eco‐regions (TISC, 2002) as given in Table 1.
Table 1: Vegetation types and eco‐regions in Nepal
Vegetation type Eco‐region Altitude
Montane grasslands and shrub lands
Trans‐Himalayan alpine shrub/meadow
West Himalayan alpine shrub/meadow 3,700–4,400 m
East Himalayan alpine shrub/meadow 4,000–4,500 m
North‐west Himalayan alpine shrub/meadow Above 4,000 mSub‐alpine conifer forest Trans‐Himalayan sub‐alpine conifer forest
West Himalayan sub‐alpine conifer forest 3,000–4,000 m
East Himalayan sub‐alpine conifer forest 3,000–4,000 m
Temperate broadleaved forest
West Himalayan broadleaved forest 1,500–3,000 m
East Himalayan broadleaved forest 1,500–3,000 m
Tropical forests/sub‐tropical conifer forest
Himalayan sub‐tropical pine forest 1,000–2,000 m
Sub‐tropical broadleaved forest
Himalayan sub‐tropical broadleaved forest 500–1,000 m
Grasslands, savannahs and shrub lands
Tarai‐Duar savannahs and grassland Below 500 m
Source: TISC (2002)
According to TISC (2002), Stainton (1972) identified 35 forest types in Nepal, largely based on Champion (1936). These 35 types are often categorised into 10 major groups (GoN, 2014): (i) tropical, (ii) sub‐tropical broadleaved, (iii) sub‐tropical conifer, (iv) lower temperate broadleaved, (v) lower temperate mixed broadleaved, (vi) upper temperate broadleaved, (vii) upper temperate mixed broadleaved, (viii) temperate coniferous, (ix) sub‐alpine and (x) alpine scrub. Similarly, Biodiversity Profile Project (BPP) identified a total of 118 ecosystems in Nepal (BPP, 1995). Table 2 presents distribution of ecosystems in different physiographic regions.
Table 2: Distribution of ecosystems by physiographic region
Physiographic region Ecosystems
Number % Types
Terai 12 10.2 10 'forest' and two 'cultivated'
Churia 14 11.9 13 'forest' and one cultivated 'Dun'
Middle Mountains 53 44.9 52 'forest', and one 'cultivated'
High Himal and High Mountains
38 32.2 37 'forest' and one 'glacier/snow/rock'
Others 1 0.8 'Water bodies; found in all zones, except the Siwalik
Total 118 100
Source: BPP (1995)
1.4 Forestry Sector Policies
Nepal has well‐defined policies and legal framework in the forestry sector. Some key policies and legal instruments are: Nationalisation of Private Forest Act, 1957; National Parks and Wildlife Conservation Act, 1972; National Forest Plan, 1976; Master Plan for the Forestry Sector, 1989; Forest Act, 1993; Revised Forestry Sector Policy, 2000; Leasehold Forestry Policy, 2002; Herbs and NTFP Development Policy, 2004; Terai Arc Landscape Strategy, 2004–2014; Gender and Social Inclusion Strategy in the Forestry Sector, 2004‐19; Sacred Himalayan Landscape Strategy, 2006‐

State of Nepal’s Forests 6 |
16; National Wetland Policy, 2012; National Biodiversity Strategy and Action Plan, 2014 and Forest Policy, 2015.
Forestry sector development in Nepal has been guided by periodic national plans and, until recently, by the Master Plan for Forestry Sector (MPFS, 1989; NPC, 2013). At present, Forest Policy, 2015 is the main policy document which guides sub‐sectoral programmes relating to forests, plant resources, wildlife, biodiversity, medicinal plants, and soil and watershed conservation. Periodic assessment and updating of information on forest resources of the country is also included in the forest policy (GoN, 2015).
1.5 Population
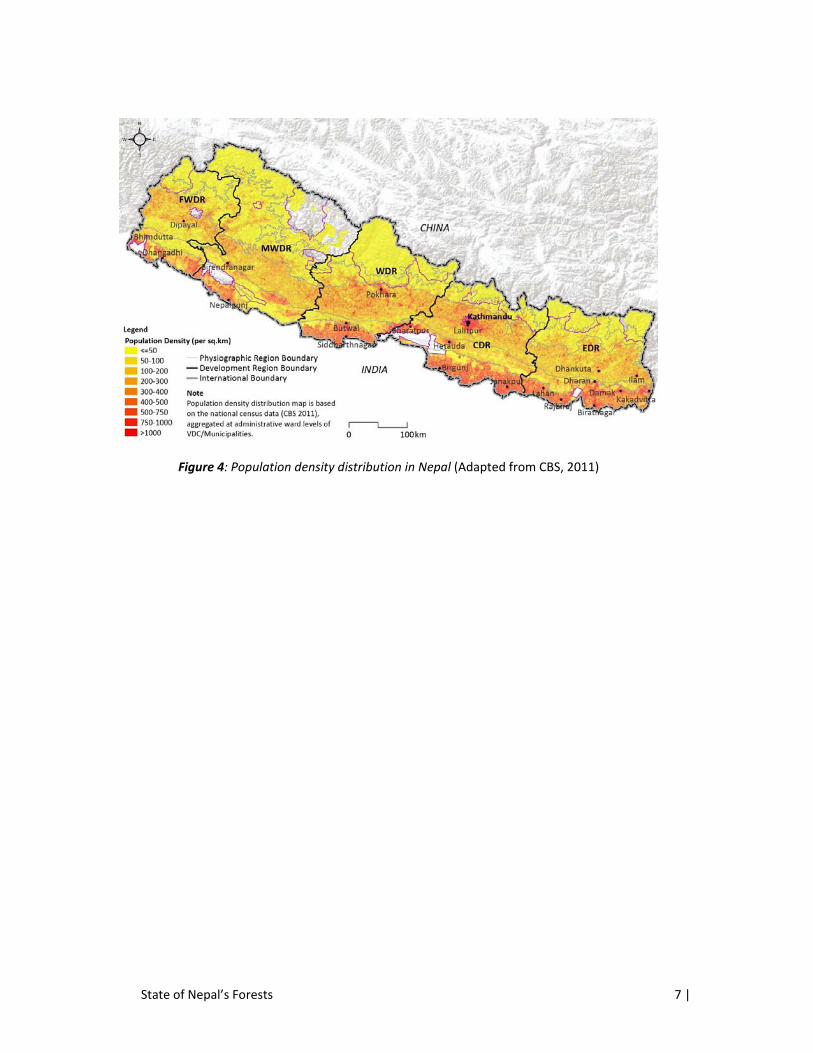
Distribution of population varies among the physiographic regions of Nepal and between rural and urban regions of the country (CBS, 2011; CBS, 2012). Terai region is populated by 41.48% of the nation’s population with a population density of 583.46 persons/km2. Population in the Churia is 12.78% of the total population with a density of 191.56 persons/km2. In the Middle Mountains region, the proportion of population is 38.17% with a density of 251.99 persons/km2. Both the High Mountains and High Himal regions are sparsely populated with average population densities of about 65.54 and 4.98 persons/km2, respectively. High Mountains region has about 6.94% of the total population of the country and High Himal has about 0.62% (Table 3 and Figure 4).
Table 3: Population characteristics of Nepal by physiographic region
Physiographic
region Male Female
Total
population % Household
Population
density/ km2
Terai 5,795,762 5,995,930 11,791,691 41.48 2,210,625 583.46
Churia 1,719,994 1,913,707 3,633,701 12.78 783,752 191.56
Middle Mountains
5,128,216 5,722,844 10,851,070 38.17 2,450,369 251.99
High Mountains 946,610 1,025,637 1,972,247 6.94 399,008 65.54
High Himal 86,985 89,004 175,989 0.62 37,571 4.98
Total 13,677,567 14,747,122 28,424,698 5,881,325 192.48
Adapted from CBS (2011)
State of Nepal’s Forests 7 |
Figure 4: Population density distribution in Nepal (Adapted from CBS, 2011)
State of Nepal’s Forests 8 |
2 PREVIOUS FOREST RESOURCE ASSESSMENTS
Forests play a vital role in Nepal’s socio‐economic development. In order to maximise forests’ contribution to sustainable development, the forestry sector needs detailed and up‐to‐date information on the status of the resource and information management systems. This information is obtained by carrying out forest inventories periodically with the goal of recording the current state and changes in the forests.
The first national‐level forest inventory was carried out in the 1960s. Since then, several forest resource assessments have been carried out, each different in terms of its purpose, scale, scope, design and technology used. The second national‐forest inventory was carried out in the 1990s. FRA Nepal (2010–2014) is the third and most comprehensive national‐level forest resource inventory.
2.1 Forest Resources Survey
The first national‐level forest inventory was conducted between 1963 and 1967 with support from USAID (FRS, 1967). It covered the Terai, Inner Terai, and Churia Hills, as well as the southern faces of the Mahabharat Range, but excluded most of the then Chitwan Division, which was inventoried separately. The survey classified forests as either commercial or non‐commercial, and focused on collecting data from commercial forests, primarily on timber estimates of stock and domestic consumption of wood products. Methodologically, it used visual interpretation of aerial photographs taken in 1953–1958 and 1963–1964, mapping, and field inventory. The inventory provided the first comprehensive assessment of commercial forests in Terai region as well as those in the adjoining areas of the hilly region.
2.2 Land Resources Mapping Project
The Land Resources Mapping Project (LRMP) used a variety of methods for country‐wide assessment. It used aerial photographs taken between 1977 and 1979 with ground verification. It focused on mapping of land use; producing forest cover maps; and assessing the type, size and crown cover of forests. Both the high‐ and low‐altitude forests were mapped according to crown cover (0–10%, 10–40%, 40–70%, and 70–100%), and scrubland (degraded forest) was mapped separately. Each forest was defined on the basis of dominant species and its forest type (coniferous, hardwood, or mixed). Land utilisation maps at the scale of 1:50,000 were produced by interpreting aerial photographs of the scale of 1:12,000.
2.3 Forest Resources and Deforestation in the Terai
The then Forest Survey and Statistics Division, a division directly under MFSC, with support from the Government of Finland, assessed forest resources and deforestation in the Terai from 1978/79 to 1990/91 by using 1991 Landsat TM (28.5 m spatial resolution) satellite imagery. It covered all 20 districts in the Terai (3.4 million ha) excluding protected areas (PAs).
State of Nepal’s Forests 9 |
2.4 National Forest Inventory
The second National Forest Inventory (NFI) was conducted by DFRS with support from the Government of Finland from 1987 to 1998. Using 1991 Landsat TM satellite images of the Terai and aerial photographs of the hills taken in 1989–1992 (DFRS, 1999), it updated data on forest cover and change, and produced forest statistics for all accessible forests, excluding those in protected areas. The NFI categorised Middle Mountains region as Hilly Area. Three types of inventories were carried out: using Landsat TM satellite imagery for 14 districts, a district‐wise forest inventory for 10 districts, and aerial photo interpretation for 51 districts. District‐wise forest inventory data was used to estimate the forest and shrub cover in Middle Mountains region. In the hills, photo‐point sampling was used to estimate forest area as well as to carry out forest inventory in the field.
2.5 Forest Cover Change Analysis of the Terai Districts
In 2005, Department of Forests (DoF) conducted a study of forest cover change in the 20 Terai districts by using Landsat 1990/91 and Landsat 2000/01 satellite images and classifying land into six main categories (forest, degraded forest, grass land, barren land, water bodies, and other land). Ground verification was conducted between September and November 2004. Although this report focused mainly on Terai forests, it also included certain parts of Churia and Middle Mountains forests.
State of Nepal’s Forests 10 |
3 METHODOLOGY
FRA Nepal implemented multi‐source forest resources inventory by using high‐resolution satellite imagery, field inventory as well as other existing data sources such as digital elevation model and national topographic maps. Categorisation of land cover followed in FRA Nepal is based on current international practices of FAO which is also adopted by IPCC for GHG emission estimation and reporting. The inventory design was largely based on the principle adopted for NFI (1999) developed by Kleinn (1994). The design was tested in the field and subsequently revised to improve its functionality. Two‐phase systematic cluster sampling was adopted for field measurement.
3.1 Land Cover Mapping
Land cover maps were prepared by using RapidEye MSS satellite imagery (Level 1b, 48 scenes acquired in February–April 2010/11), secondary images (Google Earth images, Landsat, etc.), ancillary maps (LRMP and topographical maps) and the FRA Nepal field inventory data. The imageries were processed for geometric and atmospheric corrections prior to forest cover analysis and mapping.
Area by land cover classes—Forest, Other Wooded Land (OWL), and Other Land (OL)—was estimated by using the forest cover maps. Also, the results on area by protection category, area by districts, and forest patches were estimated by using the forest cover maps.
Geometric Correction
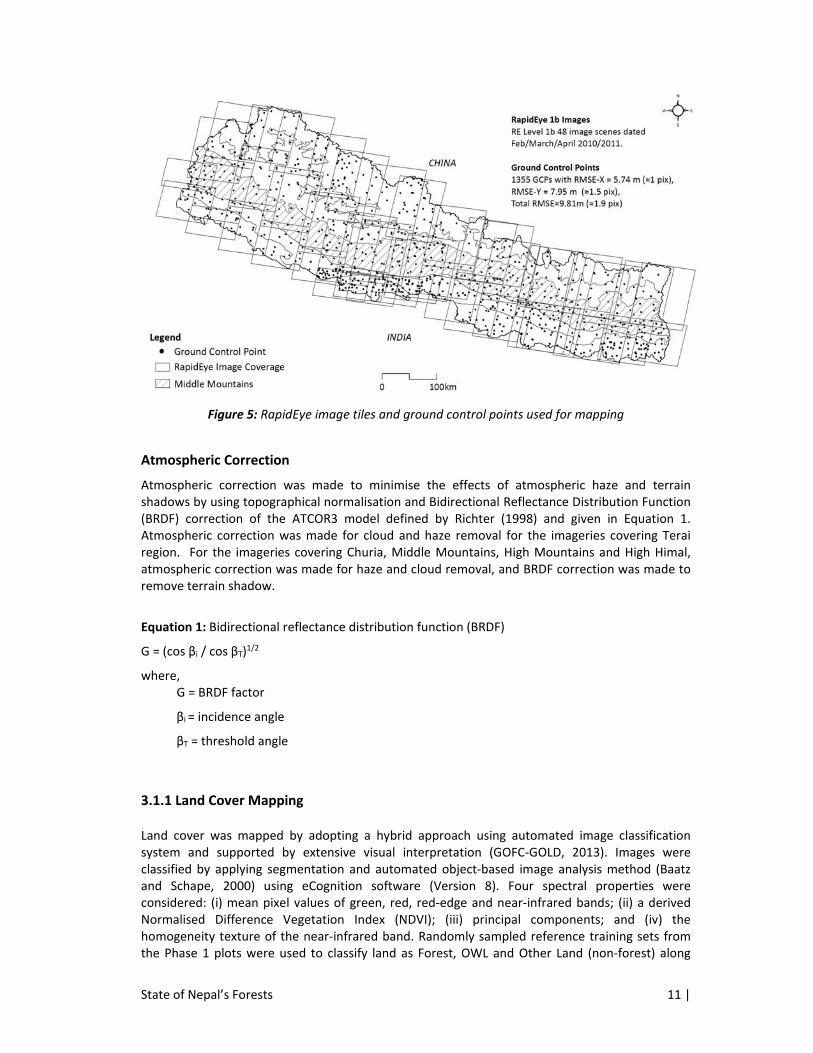
The RapidEye Level 1b imagery was ortho‐rectified by using Toutin’s Model (Toutin, 2004), with ground control points and digital elevation model. The ground control points were identified by using road and river features from the National Topographical Map Data. The digital elevation model was also generated from the National Topographical Map Data by using contours and spot levels. Independent check points were fixed to assess the level of accuracy (Figure 5). The planimetric accuracy of the ortho‐rectified images was 9.81 m (≈1.96 pixels RMSE) for the 1,355 ground‐control points for 48 RapidEye scenes covering the entire country.
State of Nepal’s Forests 11 |
Figure 5: RapidEye image tiles and ground control points used for mapping
Atmospheric Correction
Atmospheric correction was made to minimise the effects of atmospheric haze and terrain shadows by using topographical normalisation and Bidirectional Reflectance Distribution Function (BRDF) correction of the ATCOR3 model defined by Richter (1998) and given in Equation 1. Atmospheric correction was made for cloud and haze removal for the imageries covering Terai region. For the imageries covering Churia, Middle Mountains, High Mountains and High Himal, atmospheric correction was made for haze and cloud removal, and BRDF correction was made to remove terrain shadow.
Equation 1: Bidirectional reflectance distribution function (BRDF)
G = (cos βi / cos βT)1/2
where, G = BRDF factor
βi = incidence angle
βT = threshold angle
3.1.1 Land Cover Mapping
Land cover was mapped by adopting a hybrid approach using automated image classification system and supported by extensive visual interpretation (GOFC‐GOLD, 2013). Images were classified by applying segmentation and automated object‐based image analysis method (Baatz and Schape, 2000) using eCognition software (Version 8). Four spectral properties were considered: (i) mean pixel values of green, red, red‐edge and near‐infrared bands; (ii) a derived Normalised Difference Vegetation Index (NDVI); (iii) principal components; and (iv) the homogeneity texture of the near‐infrared band. Randomly sampled reference training sets from the Phase 1 plots were used to classify land as Forest, OWL and Other Land (non‐forest) along
State of Nepal’s Forests 12 |
with additional field observation data for OWL and shrub classification. Forest, OWL and Other Land areas were classified by defining a ‘containment membership function’ for threshold values for all four properties. In order to improve classification accuracy, on‐screen post‐classification visual interpretation was carried out on the classified Forest, OWL (including shrub) and Other Land by using high‐resolution images in Google Earth. In addition, field verification surveys were undertaken throughout Terai, Churia and Middle Mountains regions, in order to delineate OWL (including shrub) as well as to rectify errors in forest cover classification.
3.1.2 Forest Fragmentation Mapping
Fragmentation of forest patches and the sizes of those patches were analysed and mapped over the classified forest cover for each physiographic region. Spatially contiguous forest patches that fulfilled the criteria for forest were categorised based on their sizes, which ranged from less than 2 ha to greater than 50,000 ha. The frequency of occurrence and total area covered in each size category were analysed to assess the distribution and area of forest fragments. The results of the assessment of forest patches are presented in the reports for physiographic regions.
3.1.3 Forest Type Mapping
An approach based on machine learning and classification was developed for national level wall‐to‐wall forest type classification and mapping. The approach used Classification and Regression Tree (CART) with threefold cross‐validation algorithm. In the CART process, Landsat 8 (acquired during October/November 2013) imagery variables (6 MSS bands, 8‐Grey Level Co‐occurrence Matrix) along with DEM parameters (elevation range, slope, aspect) were used as predictor variables. The machine learning CART process was trained by using FRA field inventoried forest type data from the PSPs (n = 907) selected randomly (80% intensity with forest types as strata) within individual Landsat 8 scene coverage area. The CART process uses binary regression algorithm to classify each image segment into designated forest types. The classified forest type was cross‐validated by using the remaining 20% PSP forest type plots (n = 597).
3.1.4 Accuracy Assessments of Mapping
Accuracy assessment for land/forest cover mapping at each physiographic region was done by comparing randomly sampled cover classes on the maps with independent ground truth data (n = 1,894) of which 1,522 were inventory plots (PSPs) and 372 purposively sampled observation plots for OWL (including shrubs). Additional purposively selected observation plots were used to supplement the limited number of OWL plots in the inventory.
For wall‐to‐wall forest type classification and mapping, cross validation was done by using the randomly selected inventory plots (n = 597). Error matrices were analysed to assess overall accuracy and kappa statistics were used to test the reliability and standard errors.
State of Nepal’s Forests 13 |
3.2 Forest Resource Inventory
3.2.1 Sampling Design
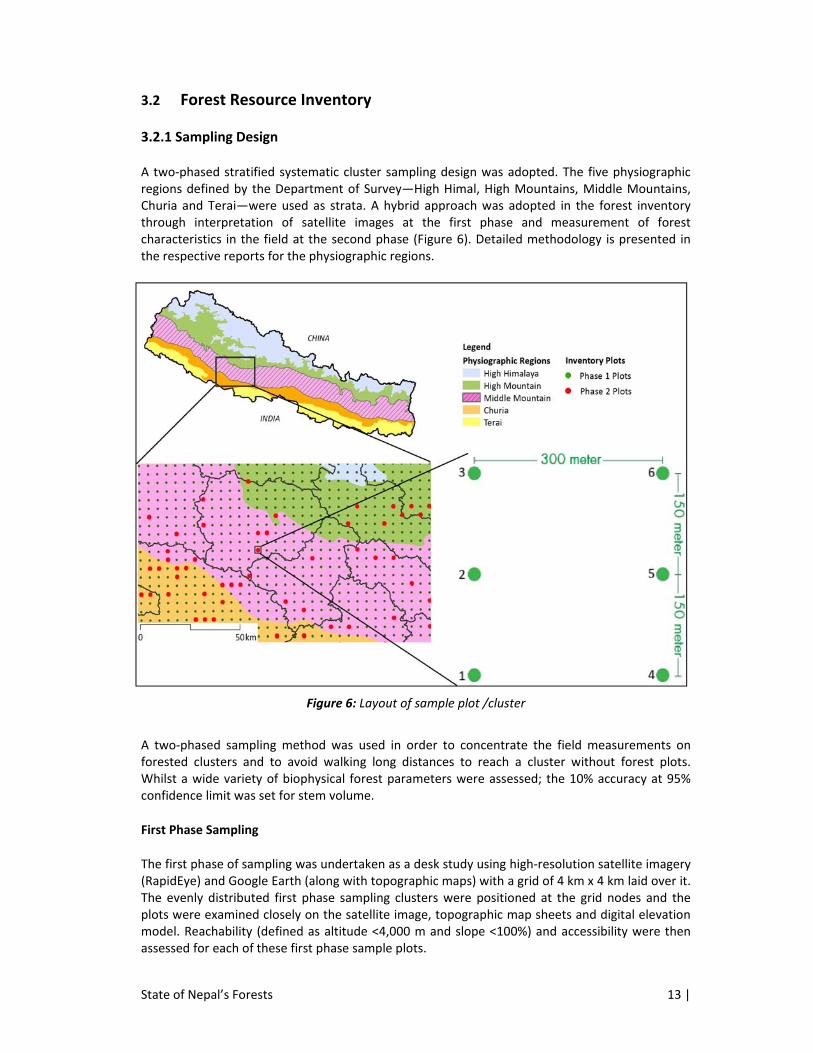
A two‐phased stratified systematic cluster sampling design was adopted. The five physiographic regions defined by the Department of Survey—High Himal, High Mountains, Middle Mountains, Churia and Terai—were used as strata. A hybrid approach was adopted in the forest inventory through interpretation of satellite images at the first phase and measurement of forest characteristics in the field at the second phase (Figure 6). Detailed methodology is presented in the respective reports for the physiographic regions.
Figure 6: Layout of sample plot /cluster
A two‐phased sampling method was used in order to concentrate the field measurements on forested clusters and to avoid walking long distances to reach a cluster without forest plots. Whilst a wide variety of biophysical forest parameters were assessed; the 10% accuracy at 95% confidence limit was set for stem volume.
First Phase Sampling
The first phase of sampling was undertaken as a desk study using high‐resolution satellite imagery (RapidEye) and Google Earth (along with topographic maps) with a grid of 4 km x 4 km laid over it. The evenly distributed first phase sampling clusters were positioned at the grid nodes and the plots were examined closely on the satellite image, topographic map sheets and digital elevation model. Reachability (defined as altitude <4,000 m and slope <100%) and accessibility were then assessed for each of these first phase sample plots.
State of Nepal’s Forests 14 |
The first of the six sample plots in each cluster was situated at a grid node and the two other plots were each mapped an additional 150 m northward of that plot. A parallel set of three plots was situated 300 m east of the first three (Figure 6).
Clusters were numbered by columns from west to east and by rows from south to north across the country. Altogether, 9,230 clusters were identified on the imagery. Within each cluster, plots were numbered from south to north, assigning plot numbers 1, 2 and 3 to the west and 4, 5, and 6 to the east. In some cases, where plots crossed international borders, fewer than six plots were identified. In this way, 55,358 viable plots inside Nepal were identified by column, row and plot number (Table 4).
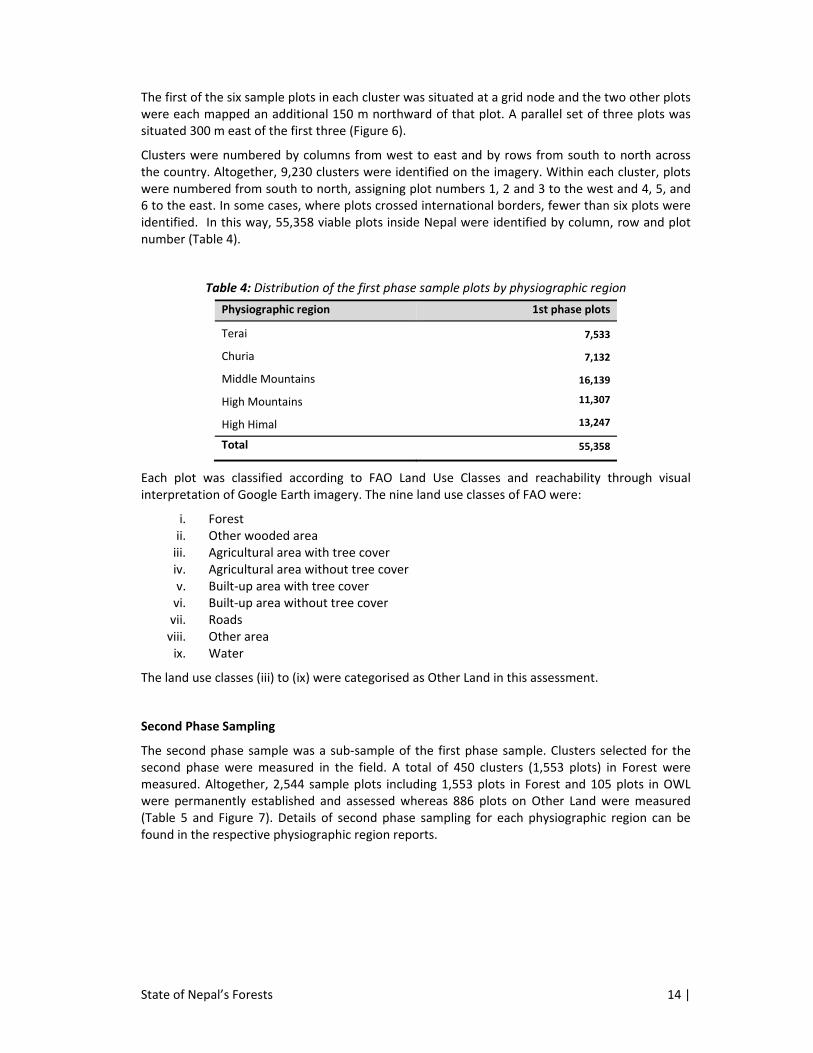
Table 4: Distribution of the first phase sample plots by physiographic region
Physiographic region 1st phase plots
Terai 7,533
Churia 7,132
Middle Mountains 16,139
High Mountains 11,307
High Himal 13,247
Total 55,358
Each plot was classified according to FAO Land Use Classes and reachability through visual interpretation of Google Earth imagery. The nine land use classes of FAO were:
i. Forest ii. Other wooded area iii. Agricultural area with tree cover iv. Agricultural area without tree cover v. Built‐up area with tree cover vi. Built‐up area without tree cover vii. Roads viii. Other area ix. Water
The land use classes (iii) to (ix) were categorised as Other Land in this assessment.
Second Phase Sampling
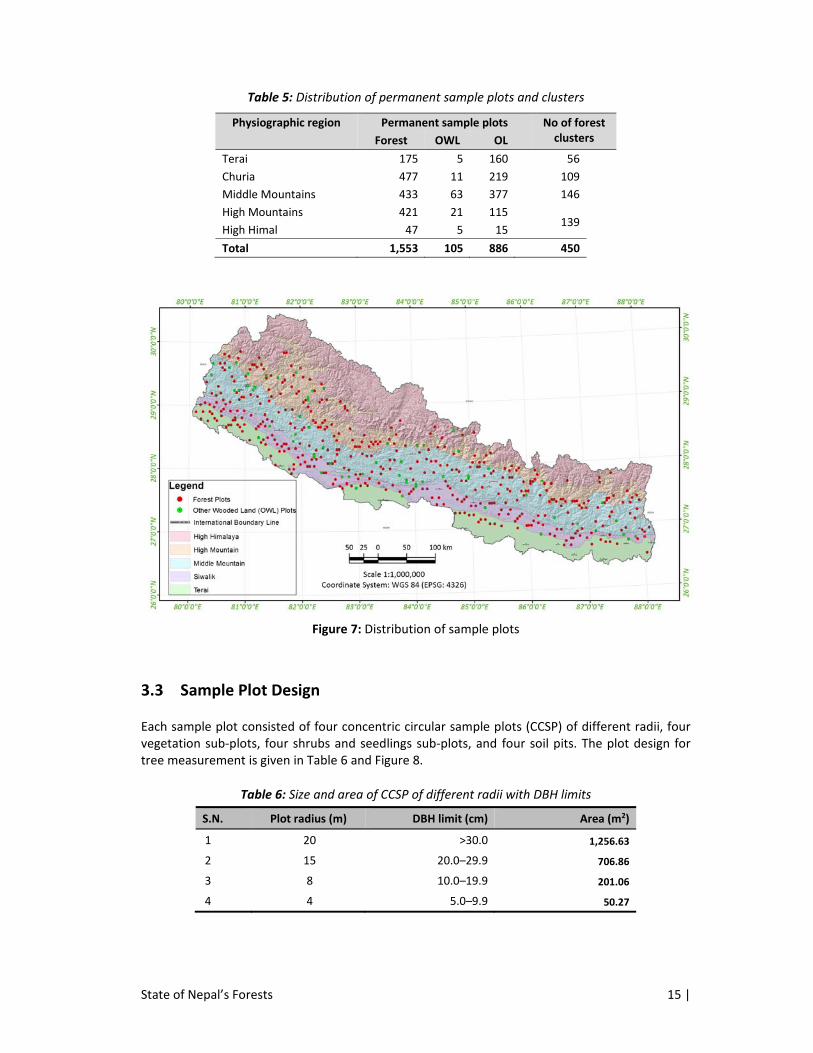
The second phase sample was a sub‐sample of the first phase sample. Clusters selected for the second phase were measured in the field. A total of 450 clusters (1,553 plots) in Forest were measured. Altogether, 2,544 sample plots including 1,553 plots in Forest and 105 plots in OWL were permanently established and assessed whereas 886 plots on Other Land were measured (Table 5 and Figure 7). Details of second phase sampling for each physiographic region can be found in the respective physiographic region reports.
State of Nepal’s Forests 15 |
Table 5: Distribution of permanent sample plots and clusters
Figure 7: Distribution of sample plots
3.3 Sample Plot Design
Each sample plot consisted of four concentric circular sample plots (CCSP) of different radii, four vegetation sub‐plots, four shrubs and seedlings sub‐plots, and four soil pits. The plot design for tree measurement is given in Table 6 and Figure 8.
Table 6: Size and area of CCSP of different radii with DBH limits
S.N. Plot radius (m) DBH limit (cm) Area (m2)
1 20 >30.0 1,256.63
2 15 20.0–29.9 706.86
3 8 10.0–19.9 201.06
4 4 5.0–9.9 50.27
Physiographic region Permanent sample plots No of forest clusters Forest OWL OL
Terai 175 5 160 56
Churia 477 11 219 109
Middle Mountains 433 63 377 146
High Mountains 421 21 115 139
High Himal 47 5 15
Total 1,553 105 886 450
State of Nepal’s Forests 16 |
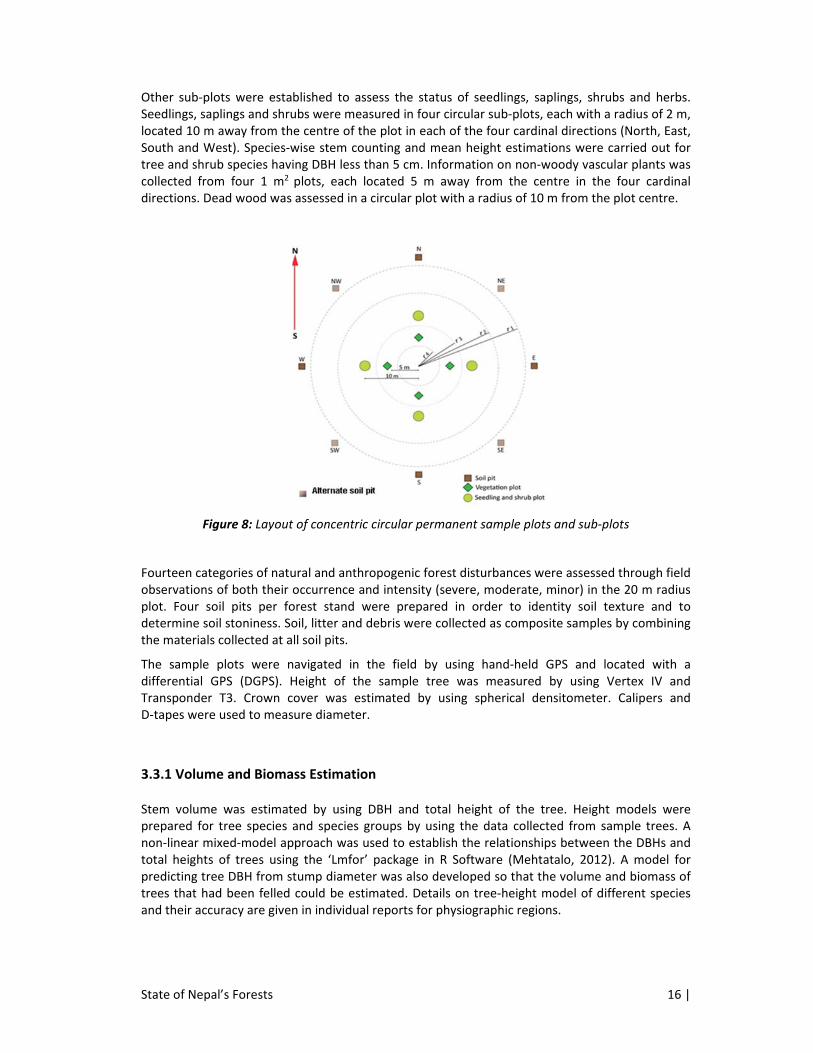
Other sub‐plots were established to assess the status of seedlings, saplings, shrubs and herbs. Seedlings, saplings and shrubs were measured in four circular sub‐plots, each with a radius of 2 m, located 10 m away from the centre of the plot in each of the four cardinal directions (North, East, South and West). Species‐wise stem counting and mean height estimations were carried out for tree and shrub species having DBH less than 5 cm. Information on non‐woody vascular plants was collected from four 1 m2 plots, each located 5 m away from the centre in the four cardinal directions. Dead wood was assessed in a circular plot with a radius of 10 m from the plot centre.
Figure 8: Layout of concentric circular permanent sample plots and sub‐plots
Fourteen categories of natural and anthropogenic forest disturbances were assessed through field observations of both their occurrence and intensity (severe, moderate, minor) in the 20 m radius plot. Four soil pits per forest stand were prepared in order to identity soil texture and to determine soil stoniness. Soil, litter and debris were collected as composite samples by combining the materials collected at all soil pits.
The sample plots were navigated in the field by using hand‐held GPS and located with a differential GPS (DGPS). Height of the sample tree was measured by using Vertex IV and Transponder T3. Crown cover was estimated by using spherical densitometer. Calipers and D‐tapes were used to measure diameter.
3.3.1 Volume and Biomass Estimation
Stem volume was estimated by using DBH and total height of the tree. Height models were prepared for tree species and species groups by using the data collected from sample trees. A non‐linear mixed‐model approach was used to establish the relationships between the DBHs and total heights of trees using the ‘Lmfor’ package in R Software (Mehtatalo, 2012). A model for predicting tree DBH from stump diameter was also developed so that the volume and biomass of trees that had been felled could be estimated. Details on tree‐height model of different species and their accuracy are given in individual reports for physiographic regions.
State of Nepal’s Forests 17 |
The volume equations developed by Sharma and Pukkala (1990) and the biomass models prescribed by the MPFS (1989) were used to estimate the volume and biomass of standing trees. The air‐dried biomass values obtained using these equations were then converted into oven‐dried biomass values using a conversion factor of 0.91 (Chaturvedi, 1982; Kharal and Fujiwara, 2012) and a carbon‐ratio factor of 0.47 (IPCC, 2006a, b). The volume and biomass of seedling and sapling having DBH less than 10 cm were not included.
Stem volume estimation
The following allometric equation (Equation 2) developed by Sharma and Pukkala (1990) was used to estimate stem volume over bark:
Equation 2: Stem volume
Ln(v) = a + b ln(d) + c ln(h)
where,
ln = Natural logarithm to the base 2.71828.
V = Volume (dm3) = exp [a + b×ln(DBH) + c×ln(h)]
d = DBH in cm
h = Total tree height in m
a, b and c are coefficients depending on species
Note: Values were divided by 1,000 to convert them to m3
The volumes of individual broken trees were estimated by using a taper curve equation developed by Heinonen et al. (1996).
Tree‐stem biomass estimation
Tree‐stem biomass was calculated by using Equation 3 and species‐specific wood‐density values (Sharma and Pukkala, 1990; MPFS, 1989).
Equation 3: Tree stems biomass
Stem biomass = Stem vol. × Density
where,
Stem vol. = Stem volume in m3
Density = Air‐dried wood density in kg/m3
Tree‐branch and foliage biomass estimation
The separate branch‐to‐stem and foliage‐to‐stem biomass ratios prescribed by MPFS (1989) were used to estimate branch and foliage biomass from stem biomass. Dead trees were not taken into account for the estimation of branch and foliage biomass.
The total biomass of individual trees was estimated by using Equation 4.
Equation 4: Total biomass of each individual tree
Total biomass = Stem biomass + Branch biomass + Foliage biomass
State of Nepal’s Forests 18 |
Below‐ground biomass estimation
This estimation was calculated by using default value as recommended by IPCC (2006). The ratio 0.25 was used by taking an average of the five different forest types (primary tropical/sub‐tropical moist forest = 0.24, primary tropical/sub‐tropical dry forest = 0.27, conifer forest having more than 150 t/ha above‐ground biomass = 0.23, other broadleaved forest having 75 t/ha to 150 t/ha above‐ground biomass = 0.26, and other broadleaved forest having more than 150 t/ha above‐ground biomass = 0.24). The biomass of seedlings and saplings having DBH less than 10 cm was not incorporated.
3.3.2 Reliability of Results
The mean value at national level was estimated by using weighted method considering area and mean value of the physiographic regions. Stem volume per hectare was considered as the main variable while assessing the reliability of the results. Reliability was estimated in terms of standard error of the mean stem volume. The desired accuracy was 10% at 95% confidence level. The variance of mean volume estimate in forest was estimated by using the variance estimator of a ratio estimator:
Equation 5: Variance of mean volume estimate (for individual physiographic region)
∑∙ ,
where,
np=number of clusters with at least one forest plot
mp,i=number of forest plots in cluster i
xi=sum of plot level volumes in cluster i, m3/ha
=mean volume in forest
p refers to physiographic region.
The variance of mean volume estimate in forest at national level was calculated with an estimator of stratified sampling (Cochran, 1977):
Equation 6: Variance of mean volume estimate (for national level)
where,
∑ = proportion of physiographic region‐wise forest area with respect to total
forest area of Nepal.
State of Nepal’s Forests 19 |
3.4 Forest Soils
3.4.1 Sampling of Soil
Soil samples were collected from four soil pits dug at each cardinal direction, 21 m away from the CCSP‐centre, soil pits were dug within 2 m x 2 m area so as to collect undisturbed soil samples. The samples were collected by using a 100 mm long, slightly conical cylinder corer with a lower diameter of 37 mm (at its cutting edge) and an upper diameter of 40 mm; the volume of each soil sub‐sample collected was 107.5 cm3.
Composite soil samples from three layers i.e., 0–10 cm, 10–20 cm and 20–30 cm depth were collected in separate plastic bags for each layer (Figure 7). The fresh mass of composite sample was determined with the accuracy of 1 g. The samples were brought to DFRS Soil Laboratory and kept separately in order to facilitate assessment of the within‐site variability of soil organic carbon (SOC). The relative volume occupied by stones in the soil was estimated occularly by observing the soil pit‐walls by using the FAO Guidelines (FAO, 2006).
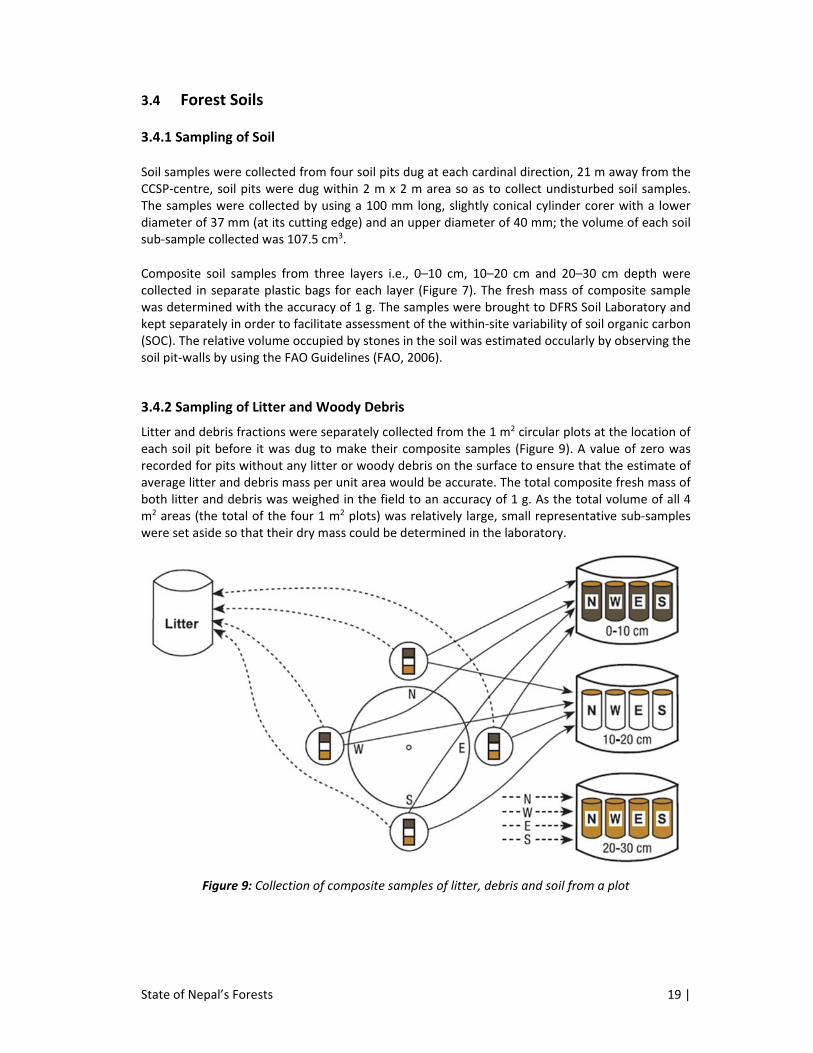
3.4.2 Sampling of Litter and Woody Debris
Litter and debris fractions were separately collected from the 1 m2 circular plots at the location of each soil pit before it was dug to make their composite samples (Figure 9). A value of zero was recorded for pits without any litter or woody debris on the surface to ensure that the estimate of average litter and debris mass per unit area would be accurate. The total composite fresh mass of both litter and debris was weighed in the field to an accuracy of 1 g. As the total volume of all 4 m2 areas (the total of the four 1 m2 plots) was relatively large, small representative sub‐samples were set aside so that their dry mass could be determined in the laboratory.
Figure 9: Collection of composite samples of litter, debris and soil from a plot
State of Nepal’s Forests 20 |
3.4.3 Analyses in the Laboratory
Analysis of soil physical parameters and proportion of Organic Carbon (OC)
For calculation of soil OC stock per volume and area, dry mass of undisturbed soil with known volume is needed. For that purpose, the composite soil samples were first air‐dried to stabilise decomposition of organic matter, and later oven‐dried to constant weight. The oven‐dried sample was immediately weighed for total bulk density and then sieved through a 2 mm sieve, thus the soil fine fraction (FF) was obtained. The volume of coarse fraction (not passing the sieve) was determined from water replacement method. The bulk density of the soil fine fraction was then calculated by eliminating the volume of the coarse fraction, because the stone particles are void of OC. The bulk‐density of the fine soil fraction for each soil layer was used to calculate the organic carbon stock in each of the 10 cm soil layers.
Soil organic carbon content was analysed by using the partial wet combustion method (Walkley and Black, 1934), with a correction factor of 1.33 to adjust for the total OC. Prior to analysis, the soil was passed through a 0.5 mm sieve for better homogenisation.
Estimation of soil organic carbon stock
The SOCFF stock was calculated by multiplying the dry soil bulk density (g/cm3) by the proportion of OC as analysed in the fine fraction (FF) of soil. The final SOCFF, adj value was obtained after adjusting the laboratory results with a consideration of the proportion (Stone%) of stoniness determined in the field:
SOCFF, adj = (100‐Stone%/100) * SOCFF.
This adjustment was needed because no organic carbon is found in stones and because laboratory analyses give the organic carbon content only for the fine soil fraction (SOCFF). After adjustment, the SOC stock results were extrapolated per hectare.
Analysis of organic carbon in litter and woody debris
Organic carbon stock in litter and woody debris fractions was obtained on the basis of the total fresh mass collected from a known area as measured in the field. First, the dry mass of litter and woody debris sub‐sample was obtained by oven‐drying it to constant weight. Second, the total oven‐dried weight of the litter and debris was estimated by multiplying the ratio of oven‐dried to fresh weight of the litter and debris sub‐samples. The total OC content of litter and woody debris fractions was then obtained by summing the respective dry mass estimates per m2, multiplied by 0.50, a carbon content constant suggested by Pribyl (2010).
3.5 Forest Biodiversity
The lists of flora species obtained from the field sample plots were verified by using various sources (Edwards, 1996; DPR, 2007; Press et al., 2000 and Bhuju et al., 2007). Frequency of tree species (the proportion of sampling units containing a given tree species) was calculated by using Equation 7.
State of Nepal’s Forests 21 |
Equation 7: Tree species frequency
100
where,
fi = Frequency of species i ni = Number of plots on which species i occurred N = Total number of plots studied
3.6 Forest Disturbance
A disturbance is defined as a temporary change in average environmental conditions that cause a pronounced change in an ecosystem. Intensity of each disturbance affecting the growth of vegetation in each sample plot were recorded and analysed at the national level. The types of disturbances were recorded by using the following categories:
No disturbance: No signs of significant disturbance observed
Landslide: Signs of landslide and/or flooding observed
Grazing: Presence of the hoofmarks and dung of animals, broken tops of seedlings and saplings, signs of trampling, disturbed forest litter
Lopping: Cutting of the side branches of trees for fodder
Leaf litter collection: Collection of dead leaves on the forest floor
Bush cutting: Sign of cutting of shrubs, bushes and seedlings
Forest fire: Sign of forest fire observed caused by natural and human activities
Encroachment: Encroachment in forest for cultivation and plantation
Resin tapping: Tapped trees, ordinarily pines, were identified by cuts made in the boles of trees to enable resin to ooze out
Lathra cutting: Cutting of saplings and poles up to 30 cm DBH
Tree cutting: Cutting of trees ≥30 cm DBH
Insect attack: Plant leaves with signs of insect attacks (e.g. holes, nests, etc.)
Plant parasites: Presence of parasitic plants in trees
Plant disease: Disease caused mainly by fungi (e.g. black rot) or bacteria (e.g. rotting). If a tree was rotting due to resin‐tapping, the disturbance was recorded as resign‐tapping, not as plant disease
Wind, storm, hail: Sign of trees broken and erosion on forest floor caused by wind, storm, hail
Other human‐induced disturbances: Disturbances by humans other than those described above (e.g. removing the bark from the base of a tree, snaring, foot trails, forest roads, etc.)
The intensity levels of the above‐mentioned disturbances were classified as below:
Intensity level 0: No significant disturbance Intensity level 1: Minor disturbance (little or no effect on trees and regeneration, less than
10% of trees and seedlings affected) Intensity level 2: Moderate disturbance (tangible effect on trees and regeneration, 10–25%
of trees and seedlings affected) Intensity level 3: Severe disturbance (significant effect on trees and regeneration, more
than 25% of trees and seedlings affected)
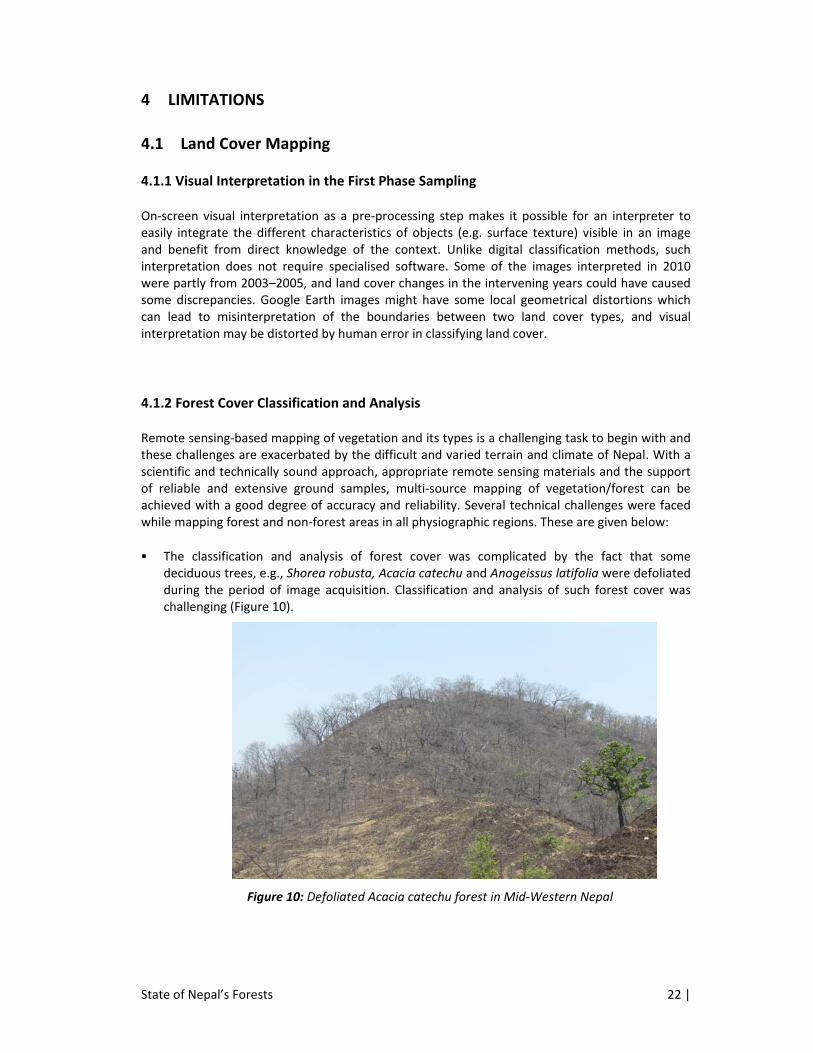
State of Nepal’s Forests 22 |
4 LIMITATIONS
4.1 Land Cover Mapping
4.1.1 Visual Interpretation in the First Phase Sampling
On‐screen visual interpretation as a pre‐processing step makes it possible for an interpreter to easily integrate the different characteristics of objects (e.g. surface texture) visible in an image and benefit from direct knowledge of the context. Unlike digital classification methods, such interpretation does not require specialised software. Some of the images interpreted in 2010 were partly from 2003–2005, and land cover changes in the intervening years could have caused some discrepancies. Google Earth images might have some local geometrical distortions which can lead to misinterpretation of the boundaries between two land cover types, and visual interpretation may be distorted by human error in classifying land cover.
4.1.2 Forest Cover Classification and Analysis
Remote sensing‐based mapping of vegetation and its types is a challenging task to begin with and these challenges are exacerbated by the difficult and varied terrain and climate of Nepal. With a scientific and technically sound approach, appropriate remote sensing materials and the support of reliable and extensive ground samples, multi‐source mapping of vegetation/forest can be achieved with a good degree of accuracy and reliability. Several technical challenges were faced while mapping forest and non‐forest areas in all physiographic regions. These are given below:
The classification and analysis of forest cover was complicated by the fact that some deciduous trees, e.g., Shorea robusta, Acacia catechu and Anogeissus latifolia were defoliated during the period of image acquisition. Classification and analysis of such forest cover was challenging (Figure 10).
Figure 10: Defoliated Acacia catechu forest in Mid‐Western Nepal
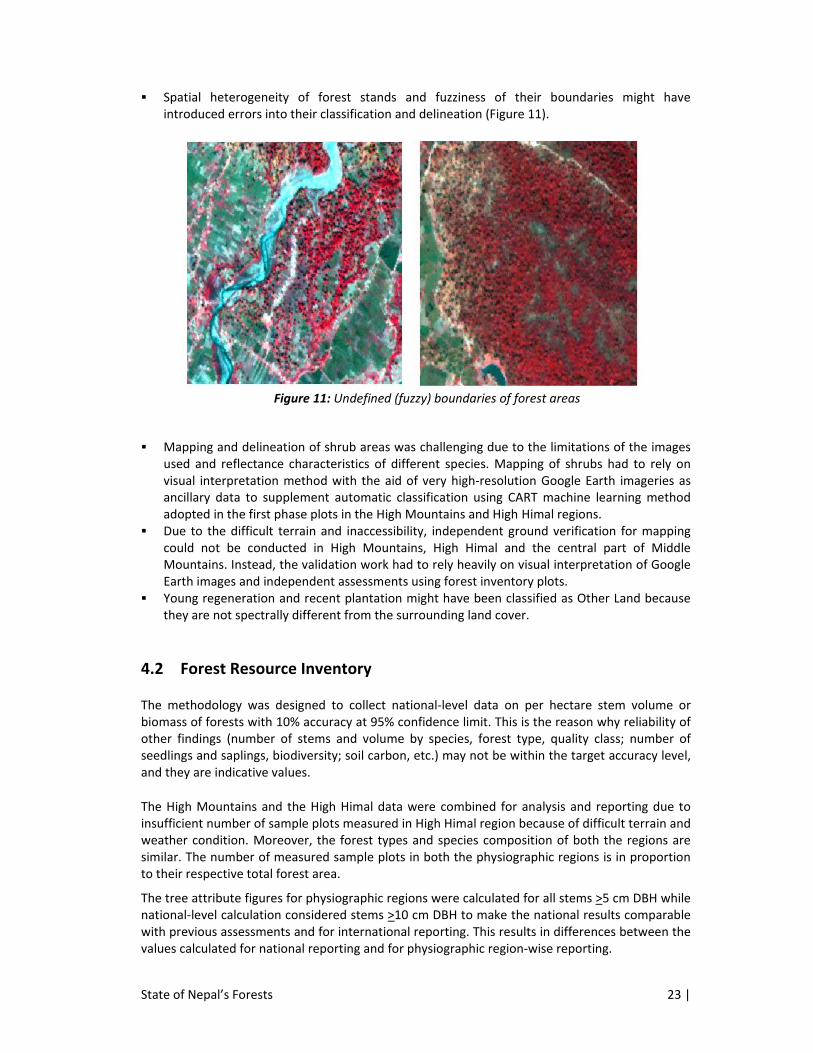
State of Nepal’s Forests 23 |
Spatial heterogeneity of forest stands and fuzziness of their boundaries might have introduced errors into their classification and delineation (Figure 11).
Figure 11: Undefined (fuzzy) boundaries of forest areas
Mapping and delineation of shrub areas was challenging due to the limitations of the images used and reflectance characteristics of different species. Mapping of shrubs had to rely on visual interpretation method with the aid of very high‐resolution Google Earth imageries as ancillary data to supplement automatic classification using CART machine learning method adopted in the first phase plots in the High Mountains and High Himal regions.
Due to the difficult terrain and inaccessibility, independent ground verification for mapping could not be conducted in High Mountains, High Himal and the central part of Middle Mountains. Instead, the validation work had to rely heavily on visual interpretation of Google Earth images and independent assessments using forest inventory plots.
Young regeneration and recent plantation might have been classified as Other Land because they are not spectrally different from the surrounding land cover.
4.2 Forest Resource Inventory
The methodology was designed to collect national‐level data on per hectare stem volume or biomass of forests with 10% accuracy at 95% confidence limit. This is the reason why reliability of other findings (number of stems and volume by species, forest type, quality class; number of seedlings and saplings, biodiversity; soil carbon, etc.) may not be within the target accuracy level, and they are indicative values.
The High Mountains and the High Himal data were combined for analysis and reporting due to insufficient number of sample plots measured in High Himal region because of difficult terrain and weather condition. Moreover, the forest types and species composition of both the regions are similar. The number of measured sample plots in both the physiographic regions is in proportion to their respective total forest area.
The tree attribute figures for physiographic regions were calculated for all stems >5 cm DBH while national‐level calculation considered stems >10 cm DBH to make the national results comparable with previous assessments and for international reporting. This results in differences between the values calculated for national reporting and for physiographic region‐wise reporting.
State of Nepal’s Forests 24 |
4.3 Assessment of Forest Soils
4.3.1 Soil Organic Carbon
Soil sampling was done only in the sample plots that were designed for national‐level forest inventory. Therefore, it might not have represented all the micro‐site variability for all physiographic regions. Seasonal variability in field work and soil sampling might also have affected soil organic carbon estimation. Some level of bias may have occurred when calculating SOC from few accessible plots especially in High Mountains and High Himal and averaging the value for the whole region.
4.3.2 Litter and Woody Debris
Estimation of the litter and debris stock may have been impacted by the time of assessment. The inventory was mostly conducted over the long dry period outside of the monsoon, and there could be seasonal differences in litter‐fall between visits to different areas and elevations.
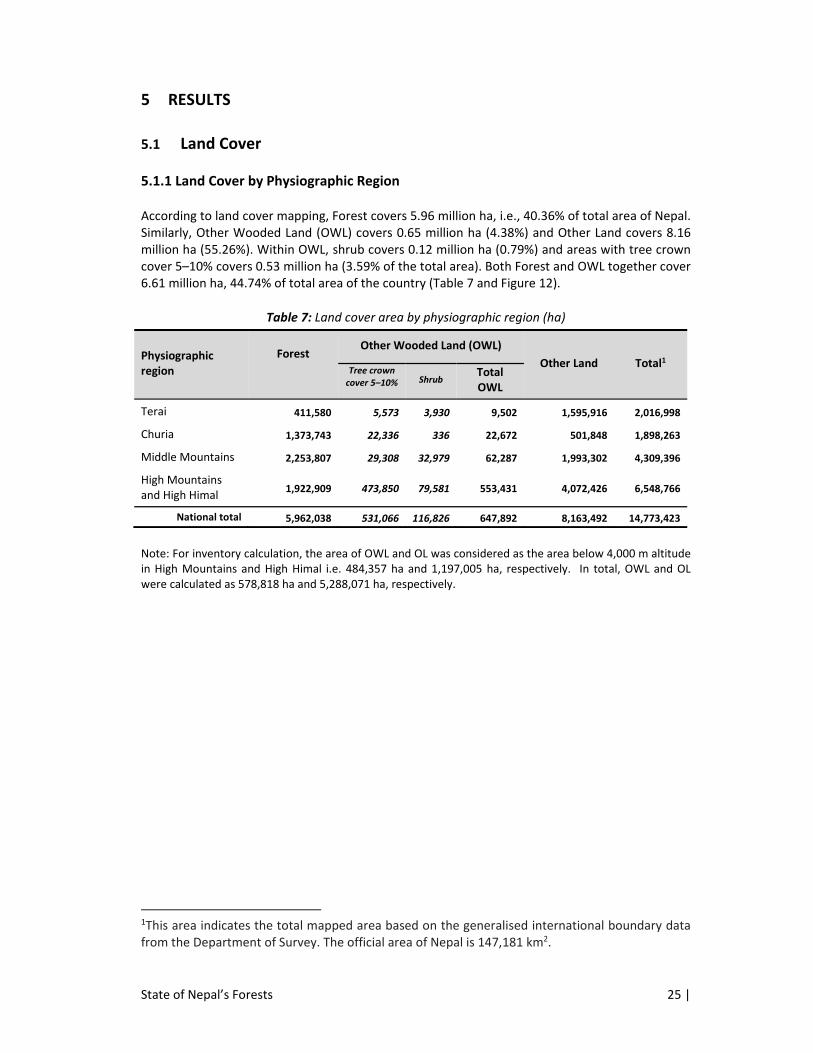
State of Nepal’s Forests 25 |
5 RESULTS
5.1 Land Cover
5.1.1 Land Cover by Physiographic Region
According to land cover mapping, Forest covers 5.96 million ha, i.e., 40.36% of total area of Nepal. Similarly, Other Wooded Land (OWL) covers 0.65 million ha (4.38%) and Other Land covers 8.16 million ha (55.26%). Within OWL, shrub covers 0.12 million ha (0.79%) and areas with tree crown cover 5–10% covers 0.53 million ha (3.59% of the total area). Both Forest and OWL together cover 6.61 million ha, 44.74% of total area of the country (Table 7 and Figure 12).
Table 7: Land cover area by physiographic region (ha)
Physiographic region
Forest
Other Wooded Land (OWL)
Other Land Total1 Tree crown cover 5–10% Shrub
Total OWL
Terai 411,580 5,573 3,930 9,502 1,595,916 2,016,998
Churia 1,373,743 22,336 336 22,672 501,848 1,898,263
Middle Mountains 2,253,807 29,308 32,979 62,287 1,993,302 4,309,396
High Mountains and High Himal
1,922,909 473,850 79,581 553,431 4,072,426 6,548,766
National total 5,962,038 531,066 116,826 647,892 8,163,492 14,773,423
Note: For inventory calculation, the area of OWL and OL was considered as the area below 4,000 m altitude in High Mountains and High Himal i.e. 484,357 ha and 1,197,005 ha, respectively. In total, OWL and OL were calculated as 578,818 ha and 5,288,071 ha, respectively.
1This area indicates the total mapped area based on the generalised international boundary data from the Department of Survey. The official area of Nepal is 147,181 km2.
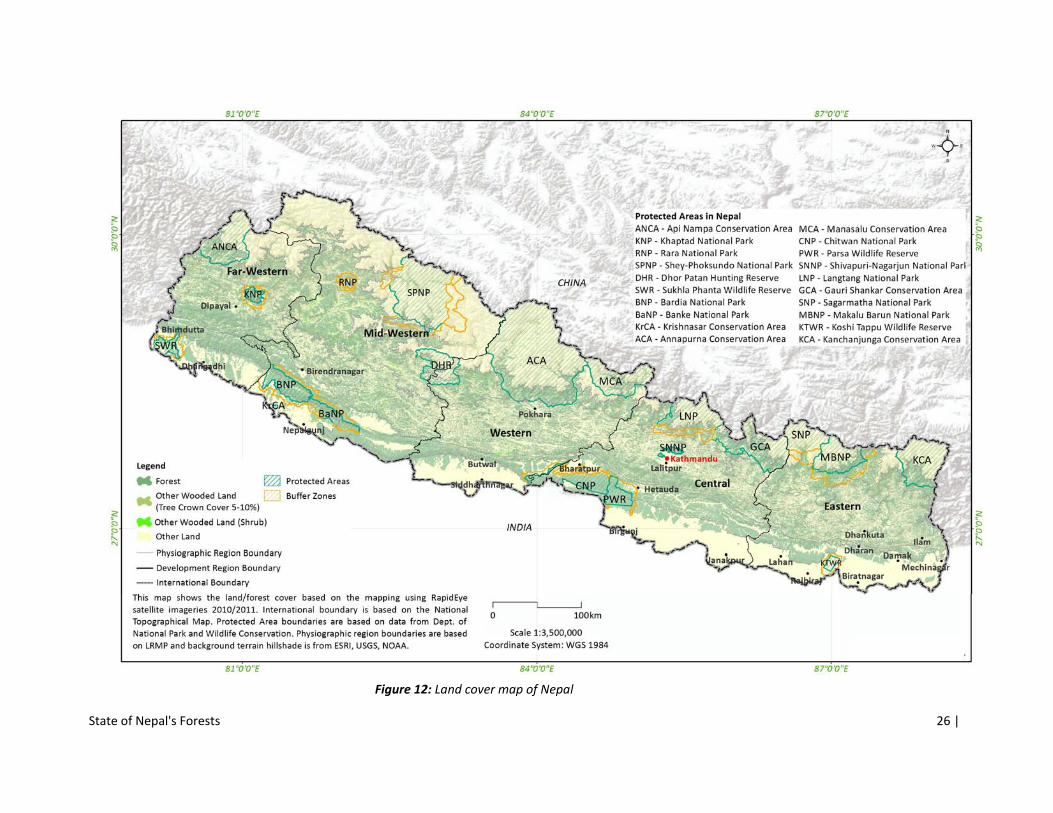
State of Nepal's Forests 26 |
Figure 12: Land cover map of Nepal
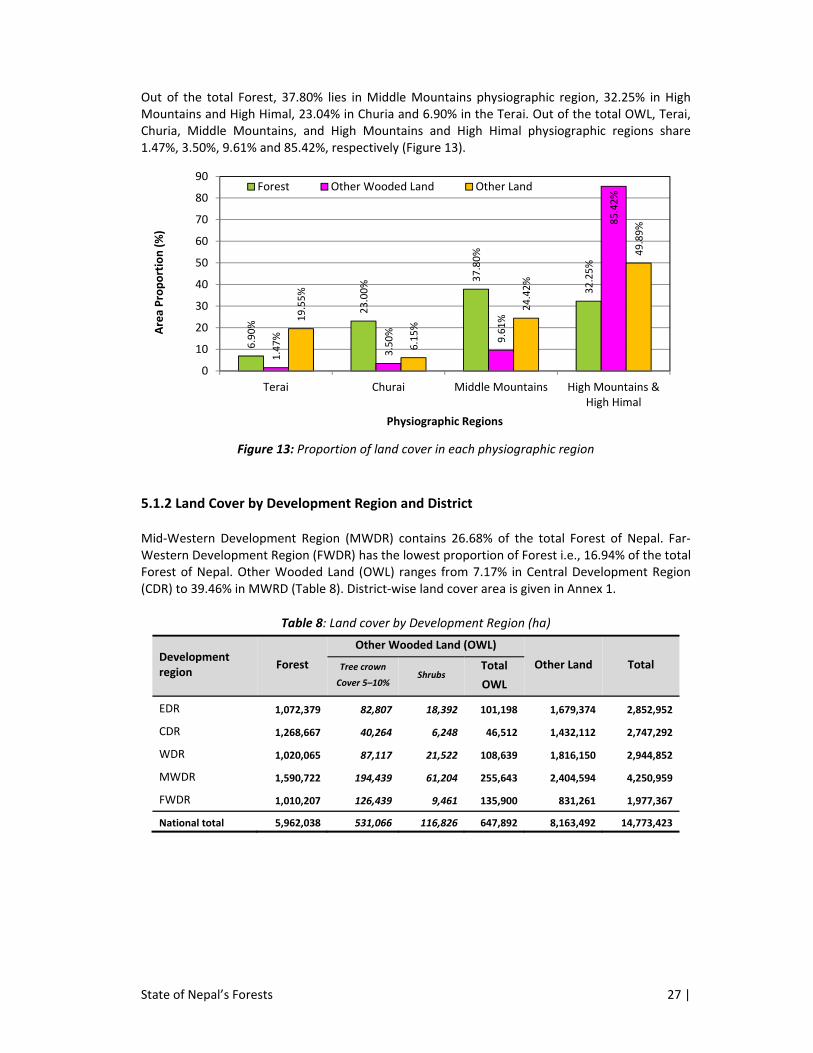
State of Nepal’s Forests 27 |
Out of the total Forest, 37.80% lies in Middle Mountains physiographic region, 32.25% in High Mountains and High Himal, 23.04% in Churia and 6.90% in the Terai. Out of the total OWL, Terai, Churia, Middle Mountains, and High Mountains and High Himal physiographic regions share 1.47%, 3.50%, 9.61% and 85.42%, respectively (Figure 13).
Figure 13: Proportion of land cover in each physiographic region
5.1.2 Land Cover by Development Region and District
Mid‐Western Development Region (MWDR) contains 26.68% of the total Forest of Nepal. Far‐Western Development Region (FWDR) has the lowest proportion of Forest i.e., 16.94% of the total Forest of Nepal. Other Wooded Land (OWL) ranges from 7.17% in Central Development Region (CDR) to 39.46% in MWRD (Table 8). District‐wise land cover area is given in Annex 1.
Table 8: Land cover by Development Region (ha)
Development region
Forest
Other Wooded Land (OWL)
Other Land Total Tree crown
Cover 5–10% Shrubs
Total
OWL
EDR 1,072,379 82,807 18,392 101,198 1,679,374 2,852,952
CDR 1,268,667 40,264 6,248 46,512 1,432,112 2,747,292
WDR 1,020,065 87,117 21,522 108,639 1,816,150 2,944,852
MWDR 1,590,722 194,439 61,204 255,643 2,404,594 4,250,959
FWDR 1,010,207 126,439 9,461 135,900 831,261 1,977,367
National total 5,962,038 531,066 116,826 647,892 8,163,492 14,773,423
6.90%
23.00%
37.80%
32.25%
1.47%
3.50%
9.61%
85.42%
19.55%
6.15%
24.42%
49.89%
0
10
20
30
40
50
60
70
80
90
Terai Churai Middle Mountains High Mountains &High Himal
Area Proportion (%)
Physiographic Regions
Forest Other Wooded Land Other Land
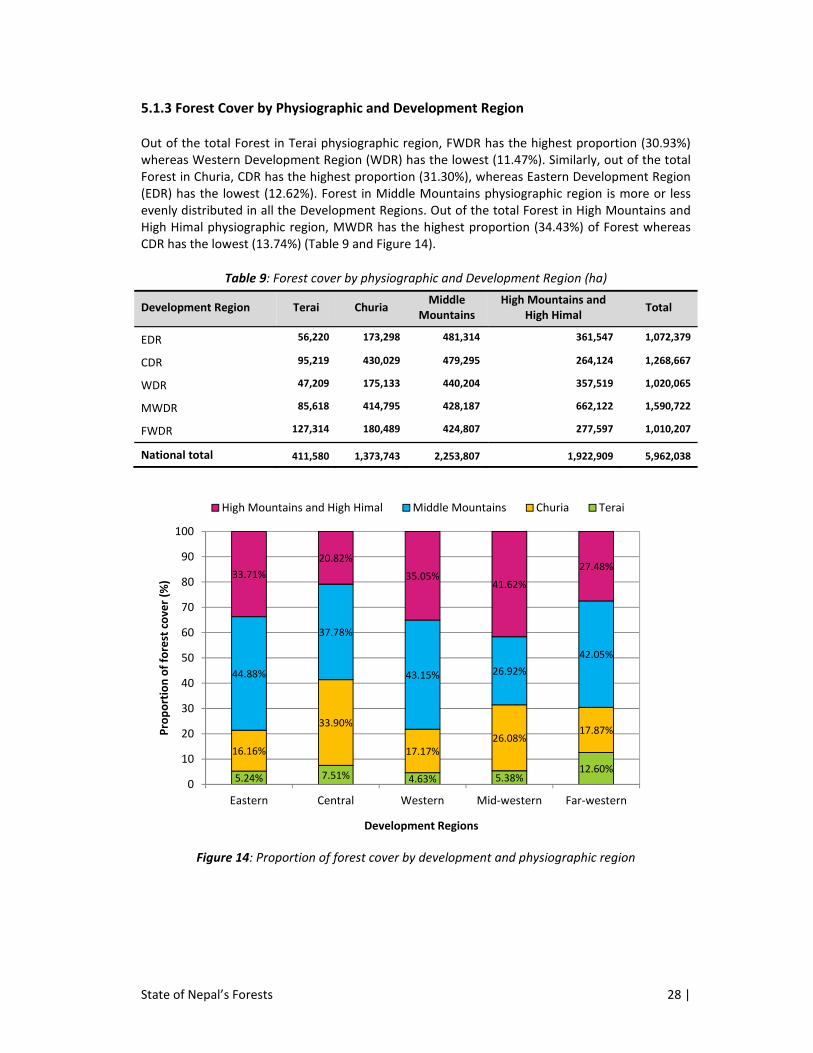
State of Nepal’s Forests 28 |
5.1.3 Forest Cover by Physiographic and Development Region
Out of the total Forest in Terai physiographic region, FWDR has the highest proportion (30.93%) whereas Western Development Region (WDR) has the lowest (11.47%). Similarly, out of the total Forest in Churia, CDR has the highest proportion (31.30%), whereas Eastern Development Region (EDR) has the lowest (12.62%). Forest in Middle Mountains physiographic region is more or less evenly distributed in all the Development Regions. Out of the total Forest in High Mountains and High Himal physiographic region, MWDR has the highest proportion (34.43%) of Forest whereas CDR has the lowest (13.74%) (Table 9 and Figure 14).
Table 9: Forest cover by physiographic and Development Region (ha)
Development Region Terai Churia Middle
Mountains High Mountains and
High Himal Total
EDR 56,220 173,298 481,314 361,547 1,072,379
CDR 95,219 430,029 479,295 264,124 1,268,667
WDR 47,209 175,133 440,204 357,519 1,020,065
MWDR 85,618 414,795 428,187 662,122 1,590,722
FWDR 127,314 180,489 424,807 277,597 1,010,207
National total 411,580 1,373,743 2,253,807 1,922,909 5,962,038
Figure 14: Proportion of forest cover by development and physiographic region
5.24% 7.51% 4.63% 5.38%12.60%
16.16%
33.90%
17.17%26.08%
17.87%
44.88%
37.78%
43.15% 26.92%
42.05%
33.71%
20.82%
35.05%41.62%
27.48%
0
10
20
30
40
50
60
70
80
90
100
Eastern Central Western Mid‐western Far‐western
Proportion of forest cove
r (%
)
Development Regions
High Mountains and High Himal Middle Mountains Churia Terai
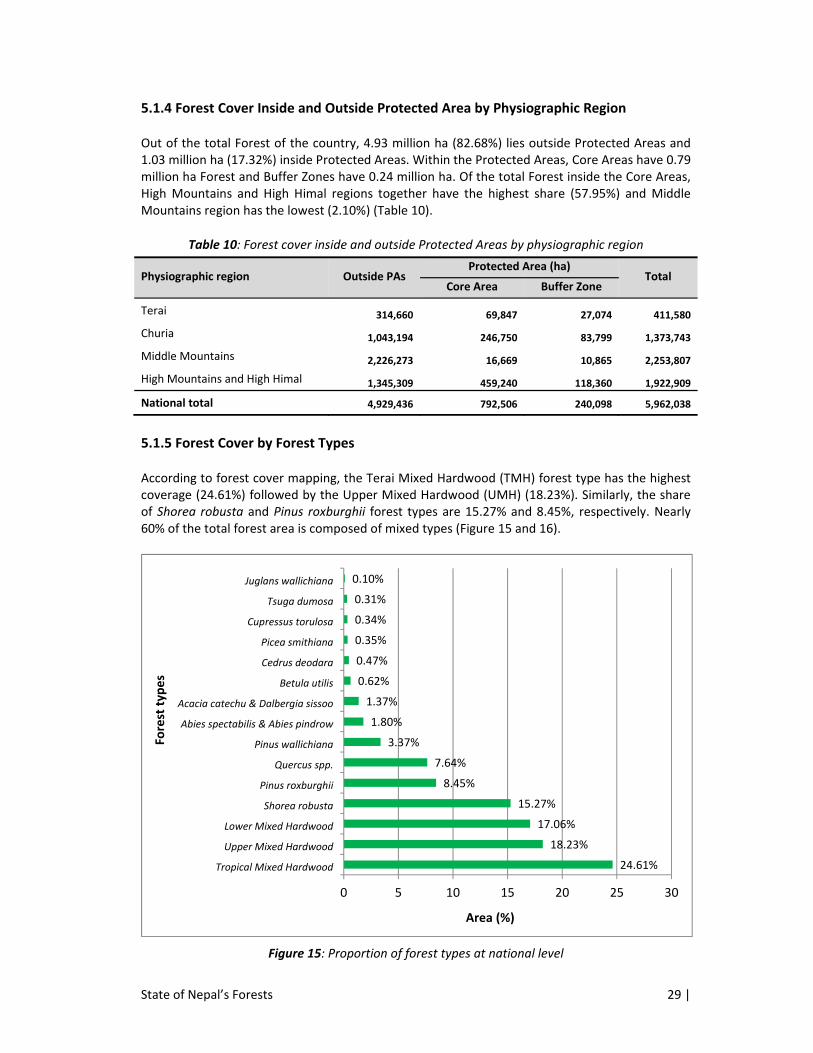
State of Nepal’s Forests 29 |
5.1.4 Forest Cover Inside and Outside Protected Area by Physiographic Region
Out of the total Forest of the country, 4.93 million ha (82.68%) lies outside Protected Areas and 1.03 million ha (17.32%) inside Protected Areas. Within the Protected Areas, Core Areas have 0.79 million ha Forest and Buffer Zones have 0.24 million ha. Of the total Forest inside the Core Areas, High Mountains and High Himal regions together have the highest share (57.95%) and Middle Mountains region has the lowest (2.10%) (Table 10).
Table 10: Forest cover inside and outside Protected Areas by physiographic region
Physiographic region Outside PAs Protected Area (ha)
Total Core Area Buffer Zone
Terai 314,660 69,847 27,074 411,580
Churia 1,043,194 246,750 83,799 1,373,743
Middle Mountains 2,226,273 16,669 10,865 2,253,807
High Mountains and High Himal 1,345,309 459,240 118,360 1,922,909
National total 4,929,436 792,506 240,098 5,962,038
5.1.5 Forest Cover by Forest Types
According to forest cover mapping, the Terai Mixed Hardwood (TMH) forest type has the highest coverage (24.61%) followed by the Upper Mixed Hardwood (UMH) (18.23%). Similarly, the share of Shorea robusta and Pinus roxburghii forest types are 15.27% and 8.45%, respectively. Nearly 60% of the total forest area is composed of mixed types (Figure 15 and 16).
Figure 15: Proportion of forest types at national level
24.61%
18.23%
17.06%
15.27%
8.45%
7.64%
3.37%
1.80%
1.37%
0.62%
0.47%
0.35%
0.34%
0.31%
0.10%
0 5 10 15 20 25 30
Tropical Mixed Hardwood
Upper Mixed Hardwood
Lower Mixed Hardwood
Shorea robusta
Pinus roxburghii
Quercus spp.
Pinus wallichiana
Abies spectabilis & Abies pindrow
Acacia catechu & Dalbergia sissoo
Betula utilis
Cedrus deodara
Picea smithiana
Cupressus torulosa
Tsuga dumosa
Juglans wallichiana
Area (%)
Forest typ
es
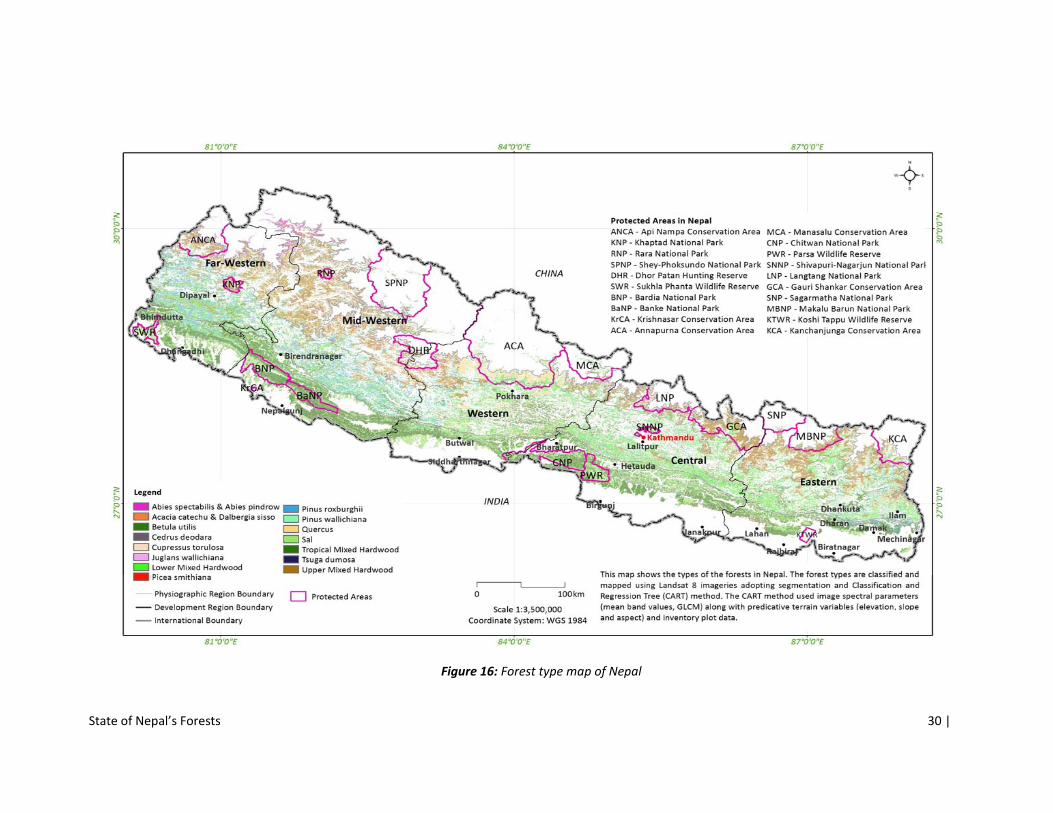
State of Nepal’s Forests 30 |
Figure 16: Forest type map of Nepal
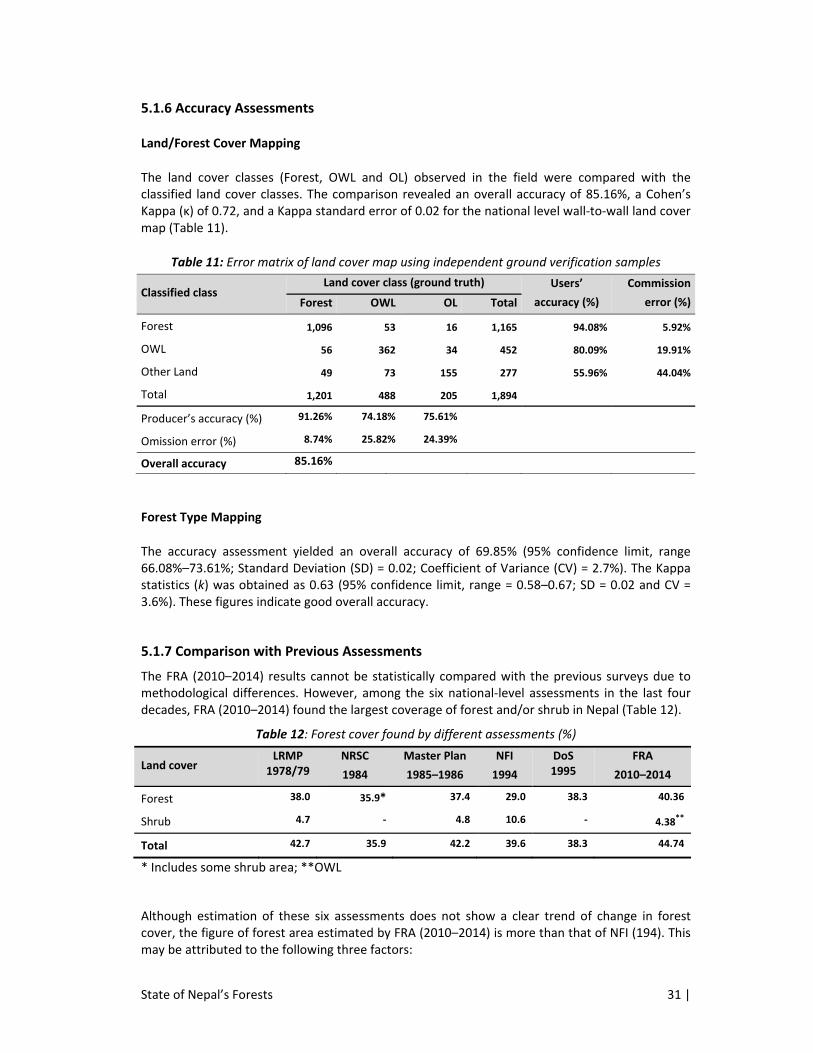
State of Nepal’s Forests 31 |
5.1.6 Accuracy Assessments
Land/Forest Cover Mapping
The land cover classes (Forest, OWL and OL) observed in the field were compared with the classified land cover classes. The comparison revealed an overall accuracy of 85.16%, a Cohen’s Kappa (κ) of 0.72, and a Kappa standard error of 0.02 for the national level wall‐to‐wall land cover map (Table 11).
Table 11: Error matrix of land cover map using independent ground verification samples
Classified class Land cover class (ground truth) Users’
accuracy (%)
Commission
error (%)Forest OWL OL Total
Forest 1,096 53 16 1,165 94.08% 5.92%
OWL 56 362 34 452 80.09% 19.91%
Other Land 49 73 155 277 55.96% 44.04%
Total 1,201 488 205 1,894
Producer’s accuracy (%) 91.26% 74.18% 75.61%
Omission error (%) 8.74% 25.82% 24.39%
Overall accuracy 85.16%
Forest Type Mapping
The accuracy assessment yielded an overall accuracy of 69.85% (95% confidence limit, range 66.08%–73.61%; Standard Deviation (SD) = 0.02; Coefficient of Variance (CV) = 2.7%). The Kappa statistics (k) was obtained as 0.63 (95% confidence limit, range = 0.58–0.67; SD = 0.02 and CV = 3.6%). These figures indicate good overall accuracy.
5.1.7 Comparison with Previous Assessments
The FRA (2010–2014) results cannot be statistically compared with the previous surveys due to methodological differences. However, among the six national‐level assessments in the last four decades, FRA (2010–2014) found the largest coverage of forest and/or shrub in Nepal (Table 12).
Table 12: Forest cover found by different assessments (%)
Land cover LRMP
1978/79 NRSC
1984
Master Plan
1985–1986
NFI
1994
DoS 1995
FRA
2010–2014
Forest 38.0 35.9* 37.4 29.0 38.3 40.36
Shrub 4.7 ‐ 4.8 10.6 ‐ 4.38**
Total 42.7 35.9 42.2 39.6 38.3 44.74
* Includes some shrub area; **OWL
Although estimation of these six assessments does not show a clear trend of change in forest cover, the figure of forest area estimated by FRA (2010–2014) is more than that of NFI (194). This may be attributed to the following three factors:
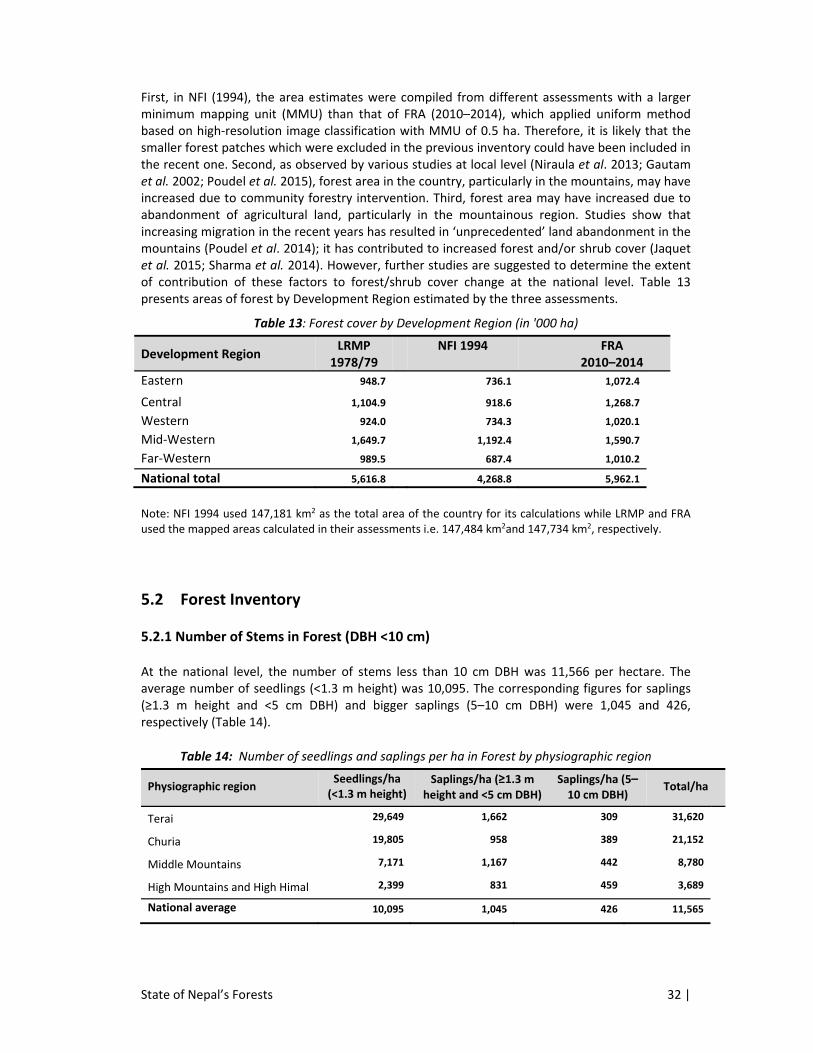
State of Nepal’s Forests 32 |
First, in NFI (1994), the area estimates were compiled from different assessments with a larger minimum mapping unit (MMU) than that of FRA (2010–2014), which applied uniform method based on high‐resolution image classification with MMU of 0.5 ha. Therefore, it is likely that the smaller forest patches which were excluded in the previous inventory could have been included in the recent one. Second, as observed by various studies at local level (Niraula et al. 2013; Gautam et al. 2002; Poudel et al. 2015), forest area in the country, particularly in the mountains, may have increased due to community forestry intervention. Third, forest area may have increased due to abandonment of agricultural land, particularly in the mountainous region. Studies show that increasing migration in the recent years has resulted in ‘unprecedented’ land abandonment in the mountains (Poudel et al. 2014); it has contributed to increased forest and/or shrub cover (Jaquet et al. 2015; Sharma et al. 2014). However, further studies are suggested to determine the extent of contribution of these factors to forest/shrub cover change at the national level. Table 13 presents areas of forest by Development Region estimated by the three assessments.
Table 13: Forest cover by Development Region (in '000 ha)
Development Region LRMP
1978/79NFI 1994 FRA
2010–2014
Eastern 948.7 736.1 1,072.4
Central 1,104.9 918.6 1,268.7
Western 924.0 734.3 1,020.1
Mid‐Western 1,649.7 1,192.4 1,590.7
Far‐Western 989.5 687.4 1,010.2
National total 5,616.8 4,268.8 5,962.1
Note: NFI 1994 used 147,181 km2 as the total area of the country for its calculations while LRMP and FRA used the mapped areas calculated in their assessments i.e. 147,484 km2and 147,734 km2, respectively.
5.2 Forest Inventory
5.2.1 Number of Stems in Forest (DBH <10 cm)
At the national level, the number of stems less than 10 cm DBH was 11,566 per hectare. The average number of seedlings (<1.3 m height) was 10,095. The corresponding figures for saplings (≥1.3 m height and <5 cm DBH) and bigger saplings (5–10 cm DBH) were 1,045 and 426, respectively (Table 14).
Table 14: Number of seedlings and saplings per ha in Forest by physiographic region
Physiographic region Seedlings/ha (<1.3 m height)
Saplings/ha (≥1.3 m height and <5 cm DBH)
Saplings/ha (5–10 cm DBH)
Total/ha
Terai 29,649 1,662 309 31,620
Churia 19,805 958 389 21,152
Middle Mountains 7,171 1,167 442 8,780
High Mountains and High Himal 2,399 831 459 3,689
National average 10,095 1,045 426 11,565
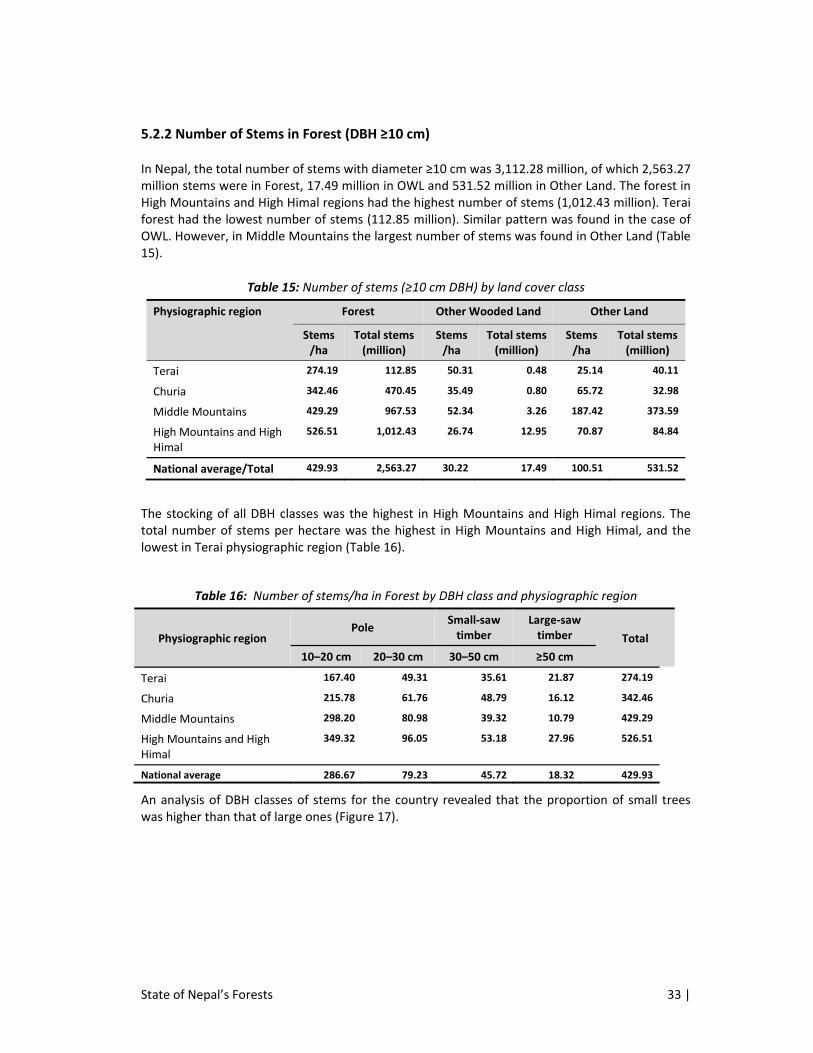
State of Nepal’s Forests 33 |
5.2.2 Number of Stems in Forest (DBH ≥10 cm)
In Nepal, the total number of stems with diameter ≥10 cm was 3,112.28 million, of which 2,563.27 million stems were in Forest, 17.49 million in OWL and 531.52 million in Other Land. The forest in High Mountains and High Himal regions had the highest number of stems (1,012.43 million). Terai forest had the lowest number of stems (112.85 million). Similar pattern was found in the case of OWL. However, in Middle Mountains the largest number of stems was found in Other Land (Table 15).
Table 15: Number of stems (≥10 cm DBH) by land cover class
Physiographic region Forest Other Wooded Land Other Land
Stems /ha
Total stems (million)
Stems /ha
Total stems (million)
Stems /ha
Total stems (million)
Terai 274.19 112.85 50.31 0.48 25.14 40.11
Churia 342.46 470.45 35.49 0.80 65.72 32.98
Middle Mountains 429.29 967.53 52.34 3.26 187.42 373.59
High Mountains and High Himal
526.51 1,012.43 26.74 12.95 70.87 84.84
National average/Total 429.93 2,563.27 30.22 17.49 100.51 531.52
The stocking of all DBH classes was the highest in High Mountains and High Himal regions. The total number of stems per hectare was the highest in High Mountains and High Himal, and the lowest in Terai physiographic region (Table 16).
Table 16: Number of stems/ha in Forest by DBH class and physiographic region
Physiographic region Pole
Small‐saw timber
Large‐saw timber Total
10–20 cm 20–30 cm 30–50 cm ≥50 cm
Terai 167.40 49.31 35.61 21.87 274.19
Churia 215.78 61.76 48.79 16.12 342.46
Middle Mountains 298.20 80.98 39.32 10.79 429.29
High Mountains and High Himal
349.32 96.05 53.18 27.96 526.51
National average 286.67 79.23 45.72 18.32 429.93
An analysis of DBH classes of stems for the country revealed that the proportion of small trees was higher than that of large ones (Figure 17).
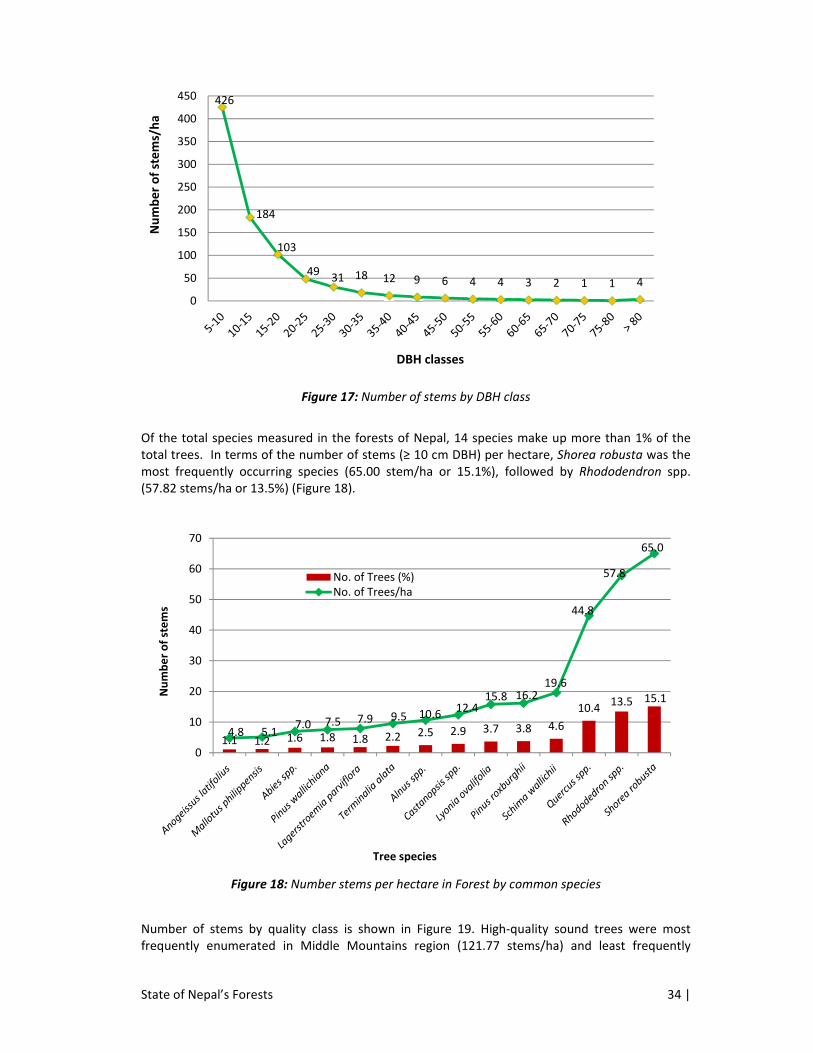
State of Nepal’s Forests 34 |
Figure 17: Number of stems by DBH class
Of the total species measured in the forests of Nepal, 14 species make up more than 1% of the total trees. In terms of the number of stems (≥ 10 cm DBH) per hectare, Shorea robusta was the most frequently occurring species (65.00 stem/ha or 15.1%), followed by Rhododendron spp. (57.82 stems/ha or 13.5%) (Figure 18).
Figure 18: Number stems per hectare in Forest by common species
Number of stems by quality class is shown in Figure 19. High‐quality sound trees were most frequently enumerated in Middle Mountains region (121.77 stems/ha) and least frequently
426
184
103
4931 18 12 9 6 4 4 3 2 1 1 4
0
50
100
150
200
250
300
350
400
450
Number of stems/ha
DBH classes
1.1 1.2 1.6 1.8 1.8 2.2 2.5 2.9 3.7 3.8 4.6
10.413.5 15.1
4.8 5.17.0 7.5 7.9 9.5 10.6
12.415.8 16.2
19.6
44.8
57.8
65.0
0
10
20
30
40
50
60
70
Number of stems
Tree species
No. of Trees (%)No. of Trees/ha
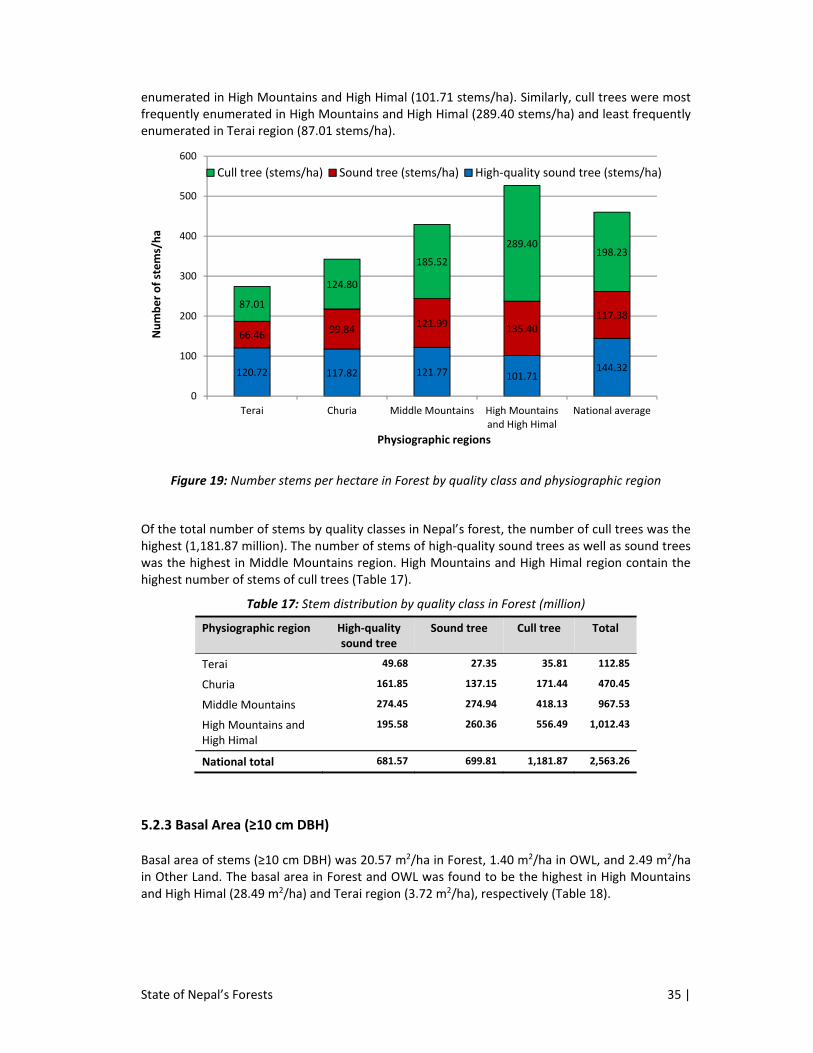
State of Nepal’s Forests 35 |
enumerated in High Mountains and High Himal (101.71 stems/ha). Similarly, cull trees were most frequently enumerated in High Mountains and High Himal (289.40 stems/ha) and least frequently enumerated in Terai region (87.01 stems/ha).
Figure 19: Number stems per hectare in Forest by quality class and physiographic region
Of the total number of stems by quality classes in Nepal’s forest, the number of cull trees was the highest (1,181.87 million). The number of stems of high‐quality sound trees as well as sound trees was the highest in Middle Mountains region. High Mountains and High Himal region contain the highest number of stems of cull trees (Table 17).
Table 17: Stem distribution by quality class in Forest (million)
Physiographic region High‐quality sound tree
Sound tree Cull tree Total
Terai 49.68 27.35 35.81 112.85
Churia 161.85 137.15 171.44 470.45
Middle Mountains 274.45 274.94 418.13 967.53
High Mountains and High Himal
195.58 260.36 556.49 1,012.43
National total 681.57 699.81 1,181.87 2,563.26
5.2.3 Basal Area (≥10 cm DBH)
Basal area of stems (≥10 cm DBH) was 20.57 m2/ha in Forest, 1.40 m2/ha in OWL, and 2.49 m2/ha in Other Land. The basal area in Forest and OWL was found to be the highest in High Mountains and High Himal (28.49 m2/ha) and Terai region (3.72 m2/ha), respectively (Table 18).
120.72 117.82 121.77 101.71144.32
66.46 99.84121.99 135.40
117.3887.01
124.80
185.52
289.40198.23
0
100
200
300
400
500
600
Terai Churia Middle Mountains High Mountainsand High Himal
National average
Number of stems/ha
Physiographic regions
Cull tree (stems/ha) Sound tree (stems/ha) High‐quality sound tree (stems/ha)
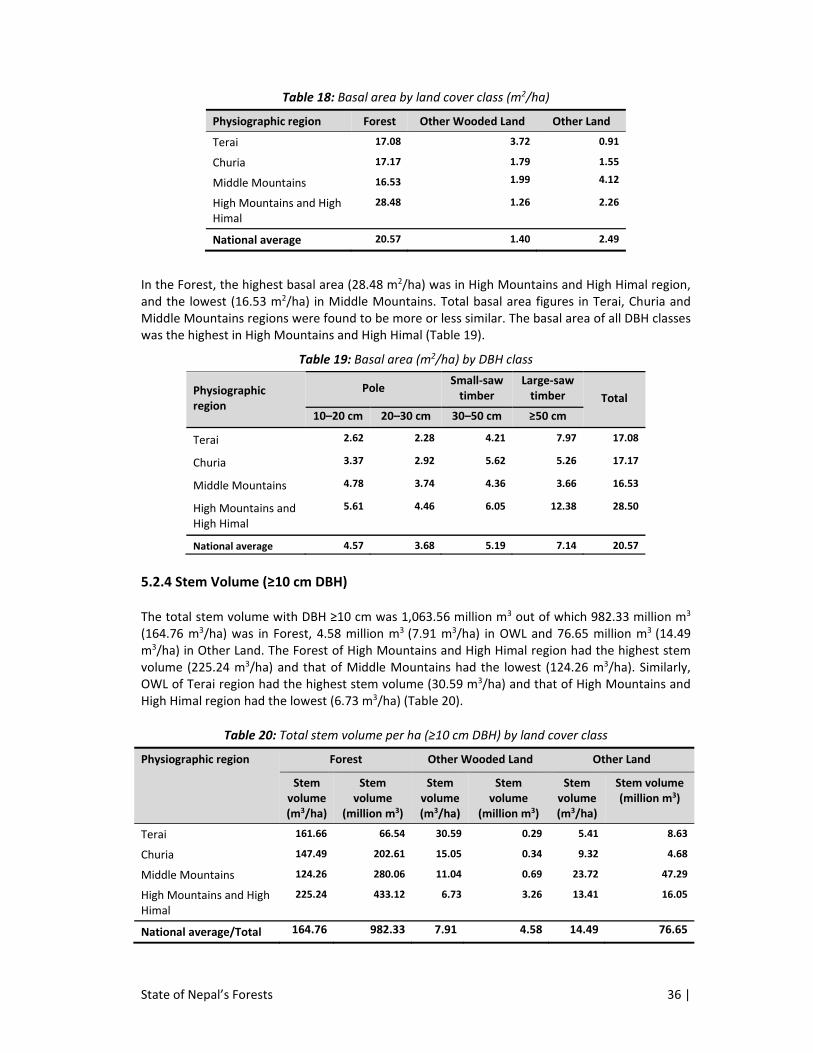
State of Nepal’s Forests 36 |
Table 18: Basal area by land cover class (m2/ha)
Physiographic region Forest Other Wooded Land Other Land
Terai 17.08 3.72 0.91
Churia 17.17 1.79 1.55
Middle Mountains 16.53 1.99 4.12
High Mountains and High Himal
28.48 1.26 2.26
National average 20.57 1.40 2.49
In the Forest, the highest basal area (28.48 m2/ha) was in High Mountains and High Himal region, and the lowest (16.53 m2/ha) in Middle Mountains. Total basal area figures in Terai, Churia and Middle Mountains regions were found to be more or less similar. The basal area of all DBH classes was the highest in High Mountains and High Himal (Table 19).
Table 19: Basal area (m2/ha) by DBH class
Physiographic region
Pole Small‐saw timber
Large‐saw timber Total
10–20 cm 20–30 cm 30–50 cm ≥50 cm
Terai 2.62 2.28 4.21 7.97 17.08
Churia 3.37 2.92 5.62 5.26 17.17
Middle Mountains 4.78 3.74 4.36 3.66 16.53
High Mountains and High Himal
5.61 4.46 6.05 12.38 28.50
National average 4.57 3.68 5.19 7.14 20.57
5.2.4 Stem Volume (≥10 cm DBH)
The total stem volume with DBH ≥10 cm was 1,063.56 million m3 out of which 982.33 million m3 (164.76 m3/ha) was in Forest, 4.58 million m3 (7.91 m3/ha) in OWL and 76.65 million m3 (14.49 m3/ha) in Other Land. The Forest of High Mountains and High Himal region had the highest stem volume (225.24 m3/ha) and that of Middle Mountains had the lowest (124.26 m3/ha). Similarly, OWL of Terai region had the highest stem volume (30.59 m3/ha) and that of High Mountains and High Himal region had the lowest (6.73 m3/ha) (Table 20).
Table 20: Total stem volume per ha (≥10 cm DBH) by land cover class
Physiographic region Forest Other Wooded Land Other Land
Stem volume (m3/ha)
Stem volume
(million m3)
Stem volume (m3/ha)
Stem volume
(million m3)
Stem volume (m3/ha)
Stem volume (million m3)
Terai 161.66 66.54 30.59 0.29 5.41 8.63
Churia 147.49 202.61 15.05 0.34 9.32 4.68
Middle Mountains 124.26 280.06 11.04 0.69 23.72 47.29
High Mountains and High Himal
225.24 433.12 6.73 3.26 13.41 16.05
National average/Total 164.76 982.33 7.91 4.58 14.49 76.65
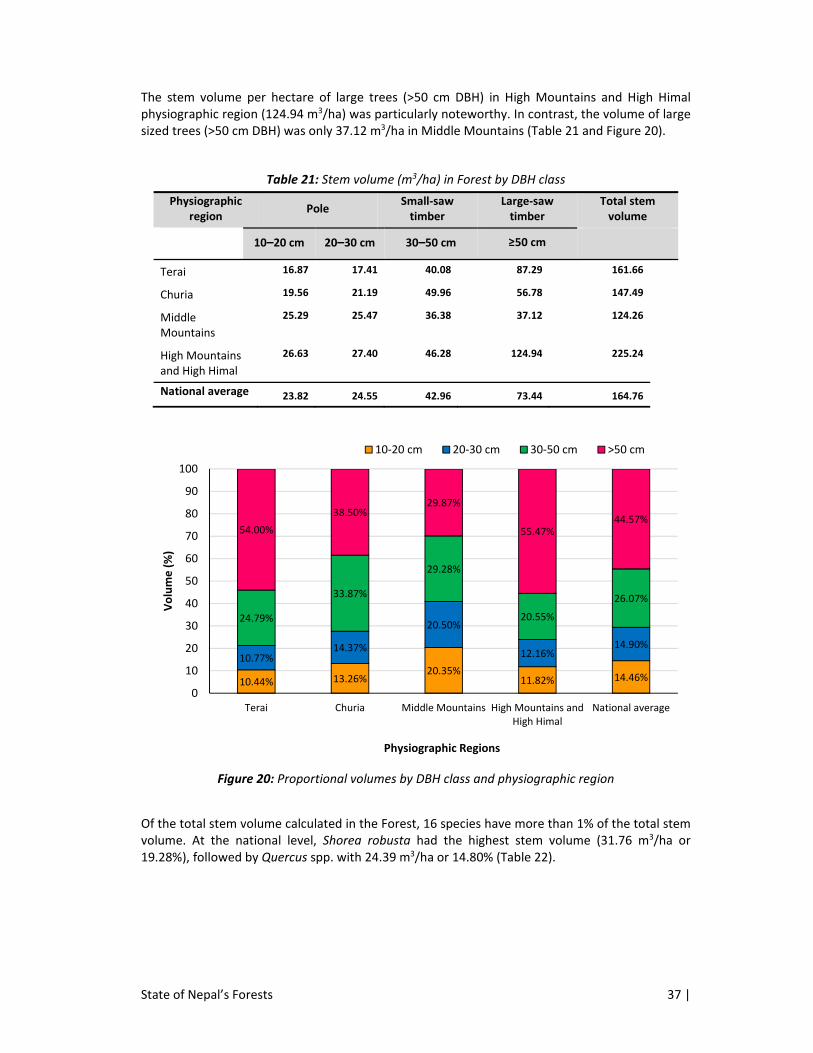
State of Nepal’s Forests 37 |
The stem volume per hectare of large trees (>50 cm DBH) in High Mountains and High Himal physiographic region (124.94 m3/ha) was particularly noteworthy. In contrast, the volume of large sized trees (>50 cm DBH) was only 37.12 m3/ha in Middle Mountains (Table 21 and Figure 20).
Table 21: Stem volume (m3/ha) in Forest by DBH class
Physiographic region
Pole Small‐saw timber
Large‐saw timber
Total stem volume
10–20 cm 20–30 cm 30–50 cm ≥50 cm
Terai 16.87 17.41 40.08 87.29 161.66
Churia 19.56 21.19 49.96 56.78 147.49
Middle Mountains
25.29 25.47 36.38 37.12 124.26
High Mountains and High Himal
26.63 27.40 46.28 124.94 225.24
National average 23.82 24.55 42.96 73.44 164.76
Figure 20: Proportional volumes by DBH class and physiographic region
Of the total stem volume calculated in the Forest, 16 species have more than 1% of the total stem volume. At the national level, Shorea robusta had the highest stem volume (31.76 m3/ha or 19.28%), followed by Quercus spp. with 24.39 m3/ha or 14.80% (Table 22).
10.44% 13.26%20.35%
11.82% 14.46%
10.77%14.37%
20.50%
12.16%14.90%
24.79%
33.87%
29.28%
20.55%
26.07%
54.00%
38.50%29.87%
55.47%44.57%
0
10
20
30
40
50
60
70
80
90
100
Terai Churia Middle Mountains High Mountains andHigh Himal
National average
Volume (%)
Physiographic Regions
10‐20 cm 20‐30 cm 30‐50 cm >50 cm
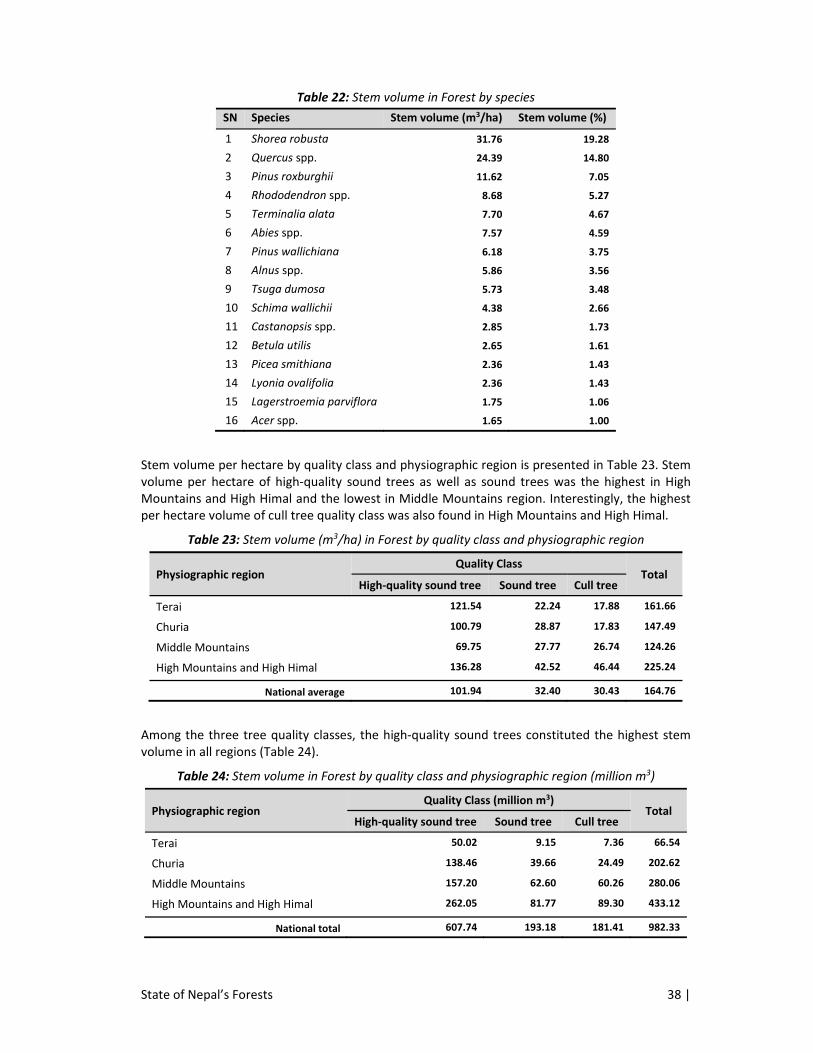
State of Nepal’s Forests 38 |
Table 22: Stem volume in Forest by species
SN Species Stem volume (m3/ha) Stem volume (%)
1 Shorea robusta 31.76 19.28
2 Quercus spp. 24.39 14.80
3 Pinus roxburghii 11.62 7.05
4 Rhododendron spp. 8.68 5.27
5 Terminalia alata 7.70 4.67
6 Abies spp. 7.57 4.59
7 Pinus wallichiana 6.18 3.75
8 Alnus spp. 5.86 3.56
9 Tsuga dumosa 5.73 3.48
10 Schima wallichii 4.38 2.66
11 Castanopsis spp. 2.85 1.73
12 Betula utilis 2.65 1.61
13 Picea smithiana 2.36 1.43
14 Lyonia ovalifolia 2.36 1.43
15 Lagerstroemia parviflora 1.75 1.06
16 Acer spp. 1.65 1.00
Stem volume per hectare by quality class and physiographic region is presented in Table 23. Stem volume per hectare of high‐quality sound trees as well as sound trees was the highest in High Mountains and High Himal and the lowest in Middle Mountains region. Interestingly, the highest per hectare volume of cull tree quality class was also found in High Mountains and High Himal.
Table 23: Stem volume (m3/ha) in Forest by quality class and physiographic region
Physiographic region Quality Class
Total High‐quality sound tree Sound tree Cull tree
Terai 121.54 22.24 17.88 161.66
Churia 100.79 28.87 17.83 147.49
Middle Mountains 69.75 27.77 26.74 124.26
High Mountains and High Himal 136.28 42.52 46.44 225.24
National average 101.94 32.40 30.43 164.76
Among the three tree quality classes, the high‐quality sound trees constituted the highest stem volume in all regions (Table 24).
Table 24: Stem volume in Forest by quality class and physiographic region (million m3)
Physiographic region Quality Class (million m3)
Total High‐quality sound tree Sound tree Cull tree
Terai 50.02 9.15 7.36 66.54
Churia 138.46 39.66 24.49 202.62
Middle Mountains 157.20 62.60 60.26 280.06
High Mountains and High Himal 262.05 81.77 89.30 433.12
National total 607.74 193.18 181.41 982.33
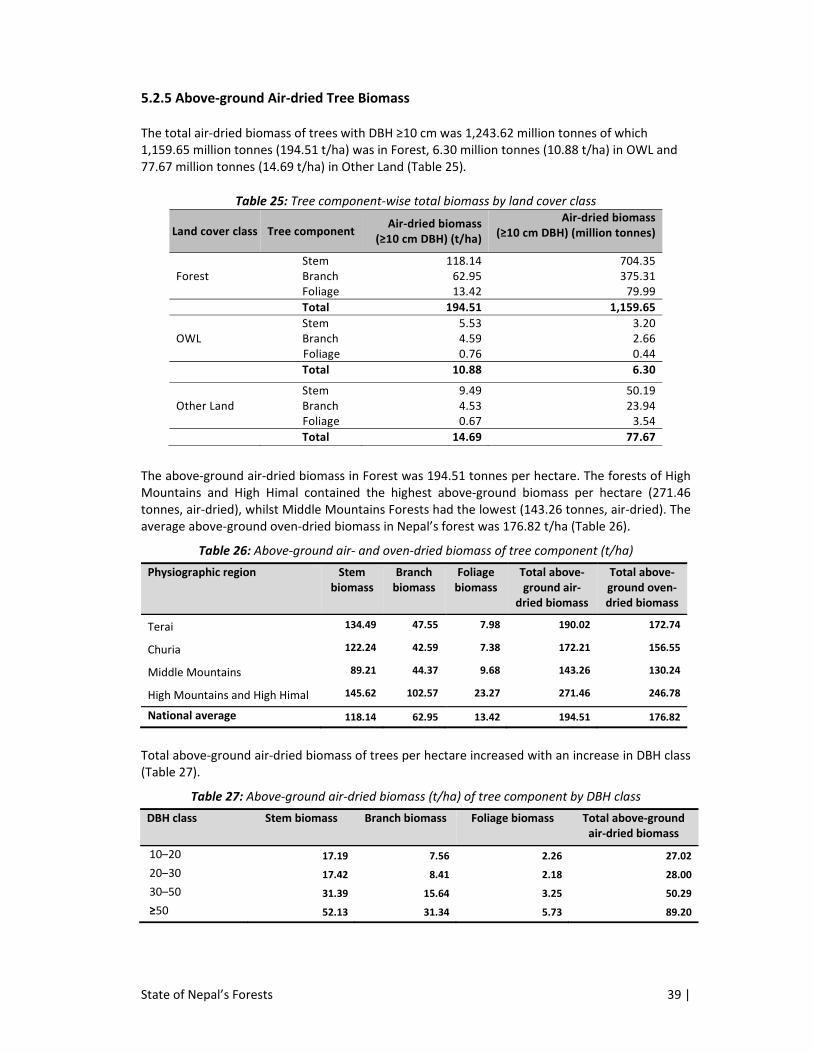
State of Nepal’s Forests 39 |
5.2.5 Above‐ground Air‐dried Tree Biomass
The total air‐dried biomass of trees with DBH ≥10 cm was 1,243.62 million tonnes of which 1,159.65 million tonnes (194.51 t/ha) was in Forest, 6.30 million tonnes (10.88 t/ha) in OWL and 77.67 million tonnes (14.69 t/ha) in Other Land (Table 25).
Table 25: Tree component‐wise total biomass by land cover class
Land cover class Tree component Air‐dried biomass
(≥10 cm DBH) (t/ha)
Air‐dried biomass(≥10 cm DBH) (million tonnes)
Forest StemBranch Foliage
118.1462.9513.42
704.35375.3179.99
Total 194.51 1,159.65
OWL StemBranch
Foliage
5.534.590.76
3.202.660.44
Total 10.88 6.30
Other Land StemBranch
Foliage
9.494.530.67
50.1923.943.54
Total 14.69 77.67
The above‐ground air‐dried biomass in Forest was 194.51 tonnes per hectare. The forests of High Mountains and High Himal contained the highest above‐ground biomass per hectare (271.46 tonnes, air‐dried), whilst Middle Mountains Forests had the lowest (143.26 tonnes, air‐dried). The average above‐ground oven‐dried biomass in Nepal’s forest was 176.82 t/ha (Table 26).
Table 26: Above‐ground air‐ and oven‐dried biomass of tree component (t/ha)
Physiographic region Stem biomass
Branch biomass
Foliage biomass
Total above‐ground air‐
dried biomass
Total above‐ground oven‐dried biomass
Terai 134.49 47.55 7.98 190.02 172.74
Churia 122.24 42.59 7.38 172.21 156.55
Middle Mountains 89.21 44.37 9.68 143.26 130.24
High Mountains and High Himal 145.62 102.57 23.27 271.46 246.78
National average 118.14 62.95 13.42 194.51 176.82
Total above‐ground air‐dried biomass of trees per hectare increased with an increase in DBH class (Table 27).
Table 27: Above‐ground air‐dried biomass (t/ha) of tree component by DBH class
DBH class Stem biomass Branch biomass Foliage biomass Total above‐ground air‐dried biomass
10–20 17.19 7.56 2.26 27.02
20–30 17.42 8.41 2.18 28.00
30–50 31.39 15.64 3.25 50.29
≥50 52.13 31.34 5.73 89.20
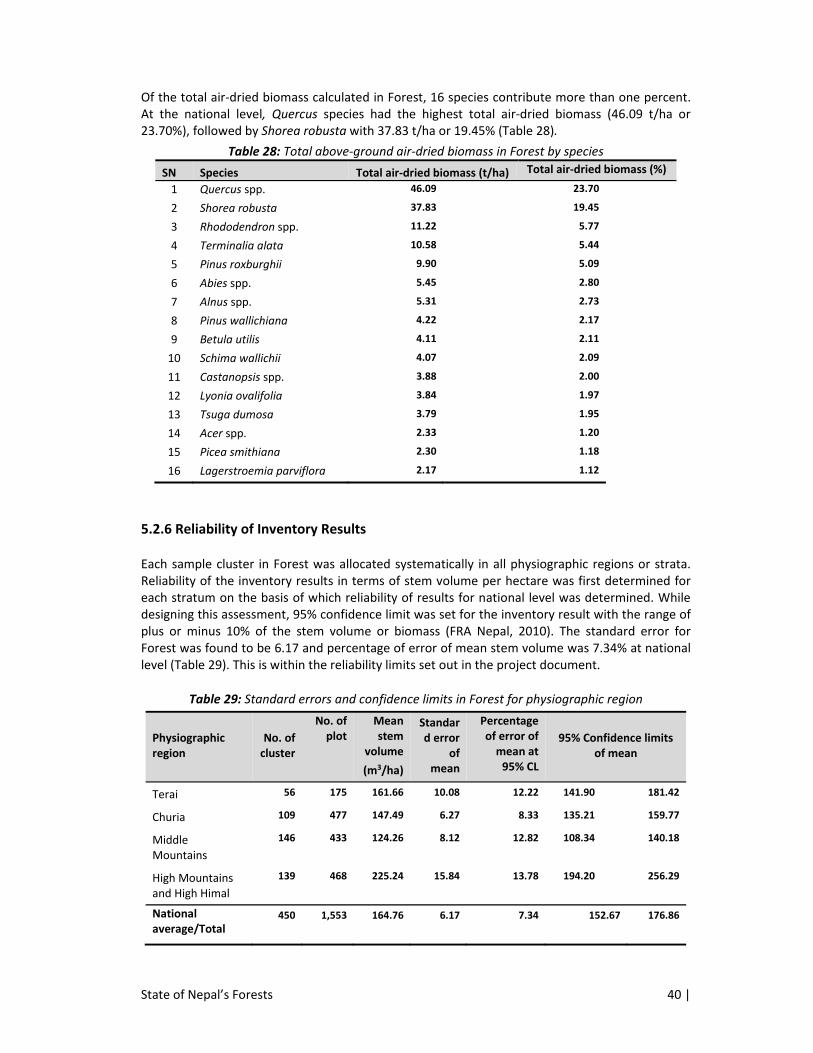
State of Nepal’s Forests 40 |
Of the total air‐dried biomass calculated in Forest, 16 species contribute more than one percent. At the national level, Quercus species had the highest total air‐dried biomass (46.09 t/ha or 23.70%), followed by Shorea robusta with 37.83 t/ha or 19.45% (Table 28).
Table 28: Total above‐ground air‐dried biomass in Forest by species
5.2.6 Reliability of Inventory Results
Each sample cluster in Forest was allocated systematically in all physiographic regions or strata. Reliability of the inventory results in terms of stem volume per hectare was first determined for each stratum on the basis of which reliability of results for national level was determined. While designing this assessment, 95% confidence limit was set for the inventory result with the range of plus or minus 10% of the stem volume or biomass (FRA Nepal, 2010). The standard error for Forest was found to be 6.17 and percentage of error of mean stem volume was 7.34% at national level (Table 29). This is within the reliability limits set out in the project document.
Table 29: Standard errors and confidence limits in Forest for physiographic region
Physiographic region
No. of cluster
No. of plot
Mean stem
volume
(m3/ha)
Standard error
of mean
Percentage of error of mean at 95% CL
95% Confidence limits of mean
Terai 56 175 161.66 10.08 12.22 141.90 181.42
Churia 109 477 147.49 6.27 8.33 135.21 159.77
Middle Mountains
146 433 124.26 8.12 12.82 108.34 140.18
High Mountains and High Himal
139 468 225.24 15.84 13.78 194.20 256.29
National average/Total
450 1,553 164.76 6.17 7.34 152.67 176.86
SN Species Total air‐dried biomass (t/ha) Total air‐dried biomass (%)
1 Quercus spp. 46.09 23.70
2 Shorea robusta 37.83 19.45
3 Rhododendron spp. 11.22 5.77
4 Terminalia alata 10.58 5.44
5 Pinus roxburghii 9.90 5.09
6 Abies spp. 5.45 2.80
7 Alnus spp. 5.31 2.73
8 Pinus wallichiana 4.22 2.17
9 Betula utilis 4.11 2.11
10 Schima wallichii 4.07 2.09
11 Castanopsis spp. 3.88 2.00
12 Lyonia ovalifolia 3.84 1.97
13 Tsuga dumosa 3.79 1.95
14 Acer spp. 2.33 1.20
15 Picea smithiana 2.30 1.18
16 Lagerstroemia parviflora 2.17 1.12
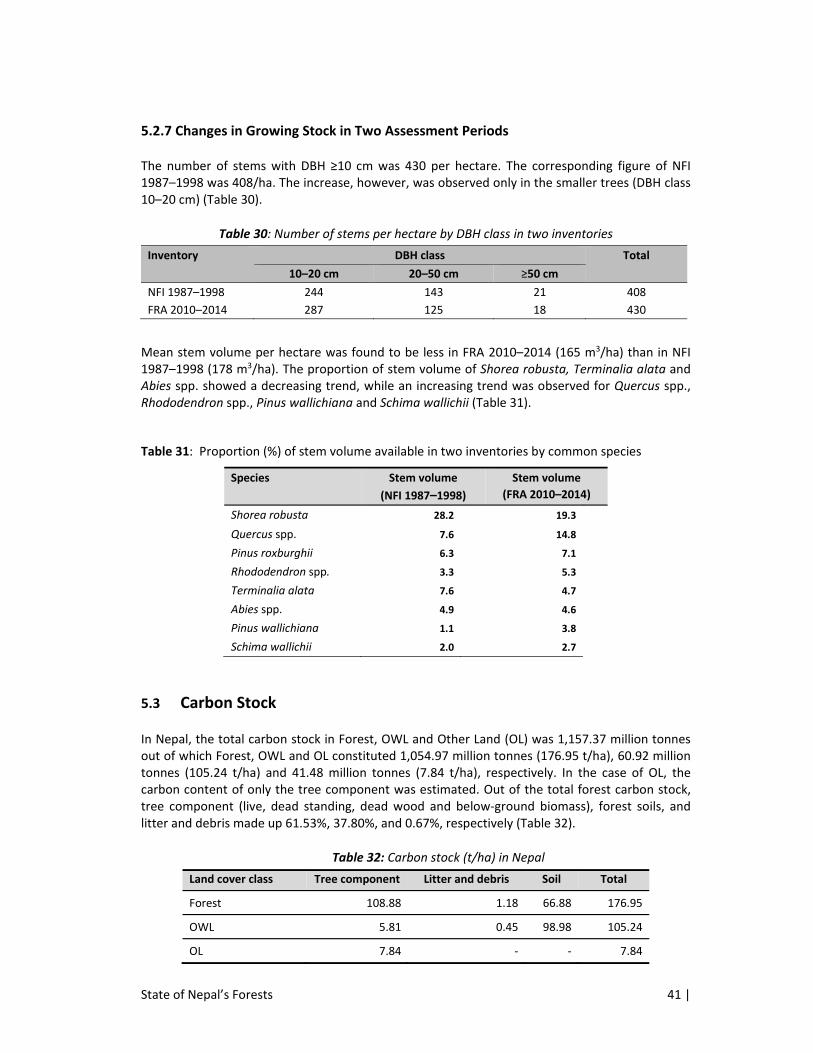
State of Nepal’s Forests 41 |
5.2.7 Changes in Growing Stock in Two Assessment Periods
The number of stems with DBH ≥10 cm was 430 per hectare. The corresponding figure of NFI 1987–1998 was 408/ha. The increase, however, was observed only in the smaller trees (DBH class 10–20 cm) (Table 30).
Table 30: Number of stems per hectare by DBH class in two inventories
Inventory DBH class Total
10–20 cm 20–50 cm ≥50 cm
NFI 1987–1998 244 143 21 408
FRA 2010–2014 287 125 18 430
Mean stem volume per hectare was found to be less in FRA 2010–2014 (165 m3/ha) than in NFI 1987–1998 (178 m3/ha). The proportion of stem volume of Shorea robusta, Terminalia alata and Abies spp. showed a decreasing trend, while an increasing trend was observed for Quercus spp., Rhododendron spp., Pinus wallichiana and Schima wallichii (Table 31).
Table 31: Proportion (%) of stem volume available in two inventories by common species
Species Stem volume
(NFI 1987–1998)
Stem volume
(FRA 2010–2014)
Shorea robusta 28.2 19.3
Quercus spp. 7.6 14.8
Pinus roxburghii 6.3 7.1
Rhododendron spp. 3.3 5.3
Terminalia alata 7.6 4.7
Abies spp. 4.9 4.6
Pinus wallichiana 1.1 3.8
Schima wallichii 2.0 2.7
5.3 Carbon Stock
In Nepal, the total carbon stock in Forest, OWL and Other Land (OL) was 1,157.37 million tonnes out of which Forest, OWL and OL constituted 1,054.97 million tonnes (176.95 t/ha), 60.92 million tonnes (105.24 t/ha) and 41.48 million tonnes (7.84 t/ha), respectively. In the case of OL, the carbon content of only the tree component was estimated. Out of the total forest carbon stock, tree component (live, dead standing, dead wood and below‐ground biomass), forest soils, and litter and debris made up 61.53%, 37.80%, and 0.67%, respectively (Table 32).
Table 32: Carbon stock (t/ha) in Nepal
Land cover class Tree component Litter and debris Soil Total
Forest 108.88 1.18 66.88 176.95
OWL 5.81 0.45 98.98 105.24
OL 7.84 ‐ ‐ 7.84
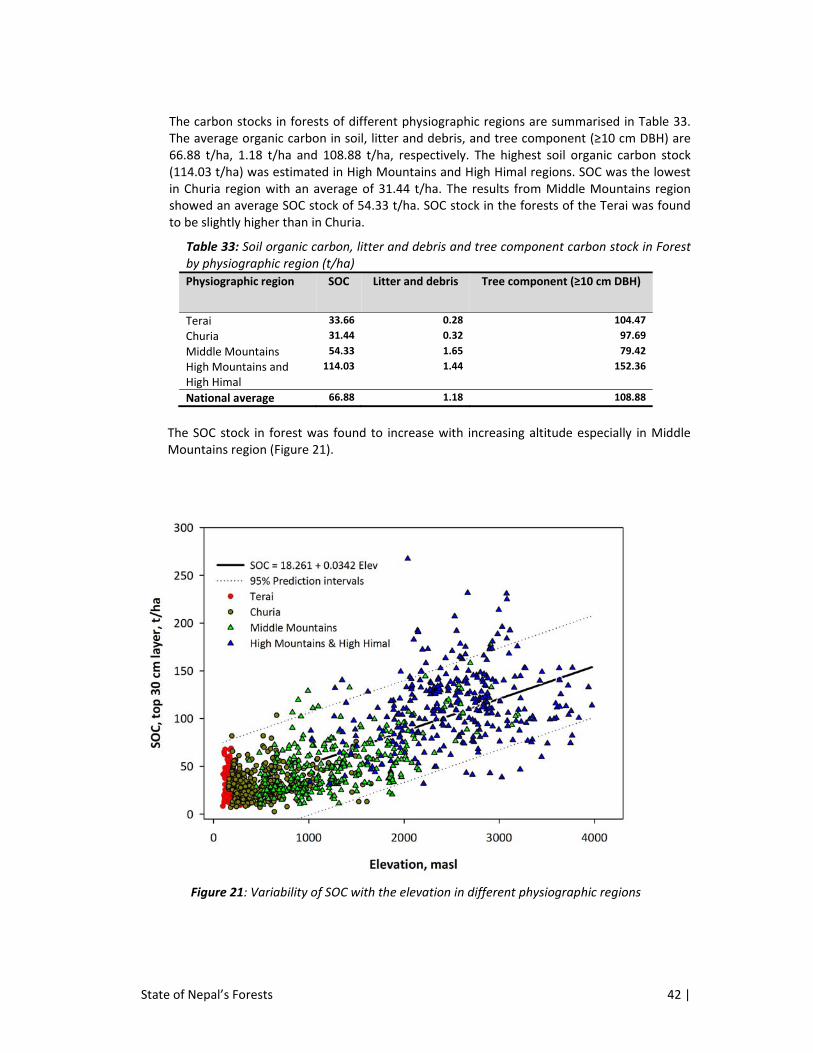
State of Nepal’s Forests 42 |
The carbon stocks in forests of different physiographic regions are summarised in Table 33. The average organic carbon in soil, litter and debris, and tree component (≥10 cm DBH) are 66.88 t/ha, 1.18 t/ha and 108.88 t/ha, respectively. The highest soil organic carbon stock (114.03 t/ha) was estimated in High Mountains and High Himal regions. SOC was the lowest in Churia region with an average of 31.44 t/ha. The results from Middle Mountains region showed an average SOC stock of 54.33 t/ha. SOC stock in the forests of the Terai was found to be slightly higher than in Churia.
Table 33: Soil organic carbon, litter and debris and tree component carbon stock in Forest by physiographic region (t/ha)
Physiographic region SOC Litter and debris Tree component (≥10 cm DBH)
Terai 33.66 0.28 104.47
Churia 31.44 0.32 97.69
Middle Mountains 54.33 1.65 79.42
High Mountains and High Himal
114.03 1.44 152.36
National average 66.88 1.18 108.88
The SOC stock in forest was found to increase with increasing altitude especially in Middle Mountains region (Figure 21).
Figure 21: Variability of SOC with the elevation in different physiographic regions
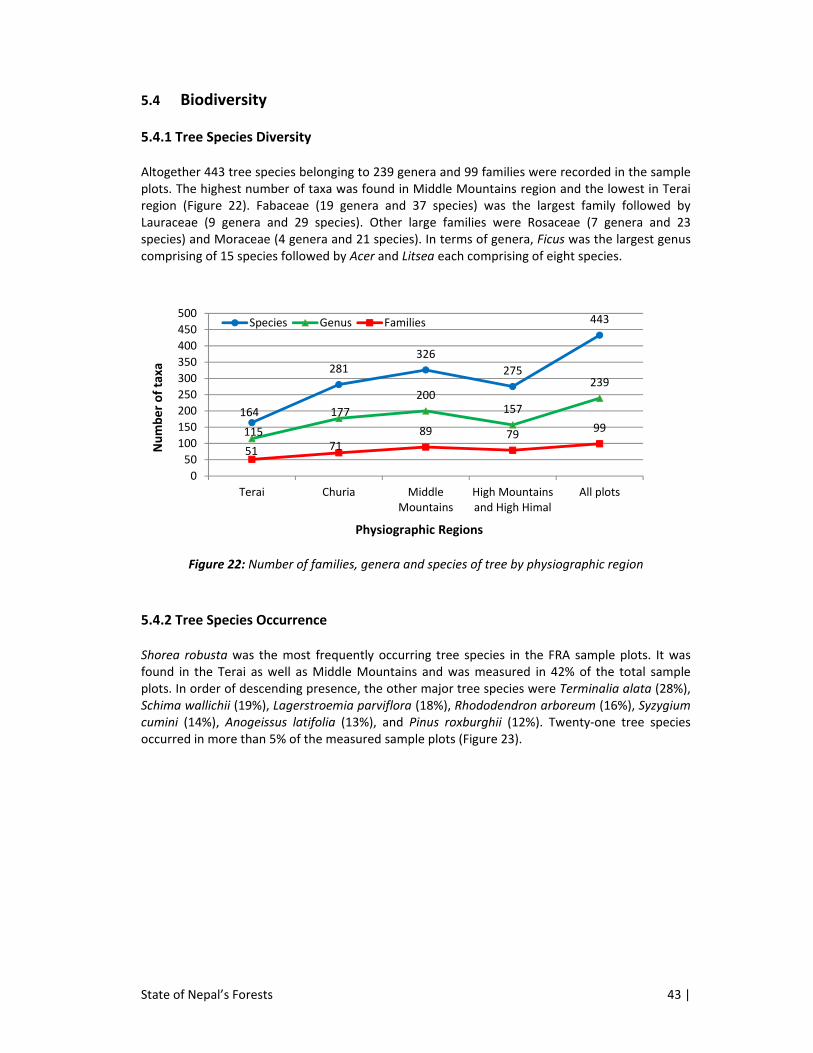
State of Nepal’s Forests 43 |
5.4 Biodiversity
5.4.1 Tree Species Diversity
Altogether 443 tree species belonging to 239 genera and 99 families were recorded in the sample plots. The highest number of taxa was found in Middle Mountains region and the lowest in Terai region (Figure 22). Fabaceae (19 genera and 37 species) was the largest family followed by Lauraceae (9 genera and 29 species). Other large families were Rosaceae (7 genera and 23 species) and Moraceae (4 genera and 21 species). In terms of genera, Ficus was the largest genus comprising of 15 species followed by Acer and Litsea each comprising of eight species.
Figure 22: Number of families, genera and species of tree by physiographic region
5.4.2 Tree Species Occurrence
Shorea robusta was the most frequently occurring tree species in the FRA sample plots. It was found in the Terai as well as Middle Mountains and was measured in 42% of the total sample plots. In order of descending presence, the other major tree species were Terminalia alata (28%), Schima wallichii (19%), Lagerstroemia parviflora (18%), Rhododendron arboreum (16%), Syzygium cumini (14%), Anogeissus latifolia (13%), and Pinus roxburghii (12%). Twenty‐one tree species occurred in more than 5% of the measured sample plots (Figure 23).
164
281326
275
443
115
177
200157
239
51 7189 79
99
0
50
100
150
200
250
300
350
400
450
500
Terai Churia MiddleMountains
High Mountainsand High Himal
All plots
Number of taxa
Physiographic Regions
Species Genus Families
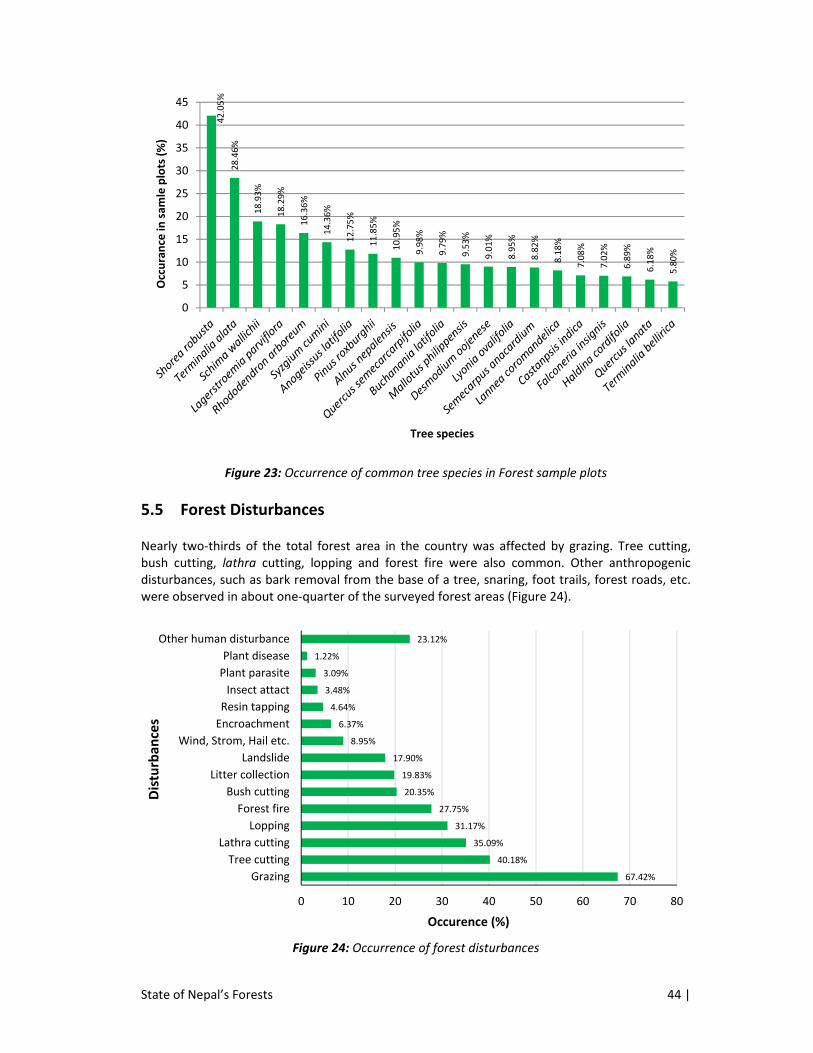
State of Nepal’s Forests 44 |
Figure 23: Occurrence of common tree species in Forest sample plots
5.5 Forest Disturbances
Nearly two‐thirds of the total forest area in the country was affected by grazing. Tree cutting, bush cutting, lathra cutting, lopping and forest fire were also common. Other anthropogenic disturbances, such as bark removal from the base of a tree, snaring, foot trails, forest roads, etc. were observed in about one‐quarter of the surveyed forest areas (Figure 24).
Figure 24: Occurrence of forest disturbances
42.05%
28.46%
18.93%
18.29%
16.36%
14.36%
12.75%
11.85%
10.95%
9.98%
9.79%
9.53%
9.01%
8.95%
8.82%
8.18%
7.08%
7.02%
6.89%
6.18%
5.80%
0
5
10
15
20
25
30
35
40
45
Occurance in
sam
le plots (%)
Tree species
67.42%
40.18%
35.09%
31.17%
27.75%
20.35%
19.83%
17.90%
8.95%
6.37%
4.64%
3.48%
3.09%
1.22%
23.12%
0 10 20 30 40 50 60 70 80
Grazing
Tree cutting
Lathra cutting
Lopping
Forest fire
Bush cutting
Litter collection
Landslide
Wind, Strom, Hail etc.
Encroachment
Resin tapping
Insect attact
Plant parasite
Plant disease
Other human disturbance
Occurence (%)
Disturban
ces
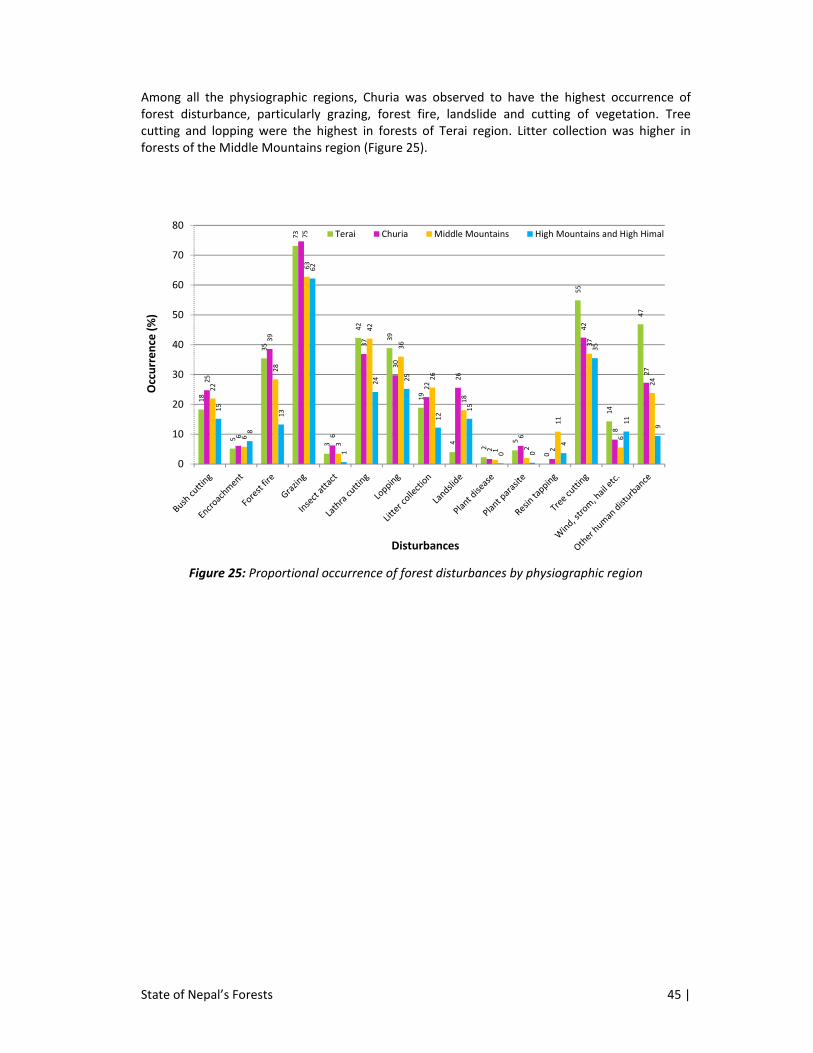
State of Nepal’s Forests 45 |
Among all the physiographic regions, Churia was observed to have the highest occurrence of forest disturbance, particularly grazing, forest fire, landslide and cutting of vegetation. Tree cutting and lopping were the highest in forests of Terai region. Litter collection was higher in forests of the Middle Mountains region (Figure 25).
Figure 25: Proportional occurrence of forest disturbances by physiographic region
18
5
35
73
3
42
39
19
4
2
5
0
55
14
47
25
6
39
75
6
37
30
22
26
2
6
2
42
8
27
22
6
28
63
3
42
36
26
18
1 2
11
37
6
24
15
8
13
62
1
24 25
12
15
0 0
4
35
11
9
0
10
20
30
40
50
60
70
80
Occurrence (%)
Disturbances
Terai Churia Middle Mountains High Mountains and High Himal
State of Nepal’s Forests 46 |
6 WAY FORWARD
Forest Resource Assessment of 2010–2014 has generated comprehensive and up‐to‐date national level forest information which is summarised in this report. This report provides information on wall to wall mapping of land cover (Forest, Other Wooded Land and Other Land), growing stock (number of stems, basal area, volume, and biomass), carbon stock (of tree component, forest soil, litter and debris), occurrence of tree species and forest disturbance.
Information generated from the assessment will help the government and concerned stakeholders in decision‐making towards sustainable forest resource management. The results are equally important for international reporting by Nepal under various multilateral environmental conventions and for Global Forest Resource Assessment (GFRA).
During the assessment, permanent sample plots were established in all physiographic regions, and re‐measurement of these plots will provide a basis for assessing temporal changes in forest characteristics. The results will also serve as a baseline for REDD+ measurement, reporting and verification (MRV) process.
In the course of Forest Resource Assessment of 2010–2014, a fully functional RS/GIS laboratory with trained personnel and hardware, software and data support, has been established. Furthermore, not only the capacity of government staff to plan and carry out field inventory has been enhanced but DFRS is also now equipped with advanced tools and technology for forest resource assessment. This institutional capacity should be continuously enhanced to undertake periodic forest resource assessment in the future.
State of Nepal’s Forests 47 |
REFERENCES
Baatz, M. and Schape, A. 2000. Multi‐resolution Segmentation: An Optimization Approach for High Multi‐ Scale Image Segmentation. AngewandtGeographische Information sverarbeitung XII. Beitragezum AGIT Symposium Salzburg 200 Karlsruhe.
Bhuju U. R., Shakya, P. R., Basnet, T. and Shrestha, S. 2007. Nepal Biodiversity Resource Book:
Protected Areas, Ramsar Sites and World Heritage Sites (1st ed.). International Centre for Integrated Mountain Development, Kathmandu, Nepal.
BPP. 1995. Biodiversity Profile Project (BPP). Government of Nepal, Ministry of Forests and Soil
Conservation, Kathmandu, Nepal. Carson, B., Shah, P. B. and Maharjan, P. L. 1986. Land Systems Report: The Soil Landscapes of
Nepal. Land Resources Mapping Project/Kenting Earth Sciences Limited, Canada. CBS. 2011. Nepal Population Report. Central Bureau of Statistics (CBS), Kathmandu, Nepal. CBS. 2012. National Population and Housing Census 2011: National Report. Central Bureau of
Statistics (CBS), Kathmandu, Nepal. Chaturvedi, A. N. 1982. Forest Mensuration. International Book Distributors, Dehradun, India. Champion, H. G. 1936. A Preliminary Survey of the Forest Types of India and Burma. Indian
Forester, 63(9): 613–615. Cochran, W. G. 1977. Sampling Techniques (3rd ed.). John Wiley and Sons Inc, New York, USA. DFRS. 1999. Forest Resources of Nepal (1987–1998). Ministry of Forests and Soil Conservation,
Department of Forest Research and Survey (DFRS), Kathmandu, Nepal. DFRS. 2014a. Terai Forests of Nepal. Forest Resource Assessment Nepal Project/Department of
Forest Research and Survey (DFRS), Kathmandu, Nepal. DFRS. 2014b. Churia Forests of Nepal. Forest Resource Assessment Nepal Project/Department of
Forest Research and Survey (DFRS), Kathmandu, Nepal. DFRS. 2015a. Middle Mountains Forests of Nepal. Forest Resource Assessment Nepal
Project/Department of Forest Research and Survey (DFRS), Kathmandu, Nepal. DFRS. 2015b. High Mountains and High Himal Forests of Nepal. Forest Resource Assessment
Nepal Project/Department of Forest Research and Survey (DFRS), Kathmandu, Nepal. DFRS/FRA. 2014. Standard Guidelines for Forest Cover and Forest Types Mapping. Forest
Resource Assessment Nepal Project, Technical Report No. 3. Department of Forest Research and Survey (DFRS), Kathmandu, Nepal.
DoF. 2005. Forest Cover Change Analysis of the Terai Districts 1990/91–2000/01. Department of
Forests (DoF), Kathmandu, Nepal. DoS. 2001. National Topographical Base Maps. Department of Survey (DoS), Kathmandu, Nepal.
State of Nepal’s Forests 48 |
DPR. 2007. Medicinal Plants of Nepal (Revised ed.), Bulletin No. 28. Department of Plant
Resources (DPR), Kathmandu, Nepal. Edwards, D. M. 1996. Non‐timber Forest Product from Nepal: Aspects of the Trade in Medicinal
and Aromatic Plants. FORESC Monograph No. 1/96. Forest Research and Survey Centre, Kathmandu, Nepal.
FRA Nepal. 2010. Forest Resource Assessment in Nepal: Final Revised Project Document. Forest
Resource Assesment Nepal (FRA) Project, Kathmandu, Nepal. FAO. 2006. Guidelines for Soil Description (4th ed.). Food and Agriculture Organization of the
United Nations (FAO), Rome, Italy. FRS. 1967. Forest Statistics for the Terai and Adjoining Regions 1967. Publication No. 4. Forest
Resources Survey (FRS), Kathmandu, Nepal. Gautam, A. P., Edward L. W., and Apisit E. 2002. GIS assessment of land use/land cover changes
associated with community forestry implementation in the middle hills of Nepal. Mountain Research and Development, 22(1): 63–69.
GOFC‐GOLD. 2013. A Sourcebook of Methods and Procedures for Monitoring and Reporting
Anthropogenic Greenhouse Gas Emissions and Removals associated with Deforestation, Gains and Losses of Carbon Stocks in Forests remaining Forests, and Forestation. GOFC‐GOLD Report version COP19‐2. GOFC‐GOLD Land Cover Project Office, Wageningen University, The Netherlands.
GoN. 2015. Forest Policy 2071. Government of Nepal (GoN), Ministry of Forests and Soil
Conservation, Kathmandu, Nepal. GoN. 2014. National Biodiversity Strategy and Action Plan: 2014–2020. Government of Nepal
(GoN), Ministry of Forests and Soil Conservation, Kathmandu, Nepal. Heinonen, J., Saramaki, J. and Sekeli, P.M. 1996. A polynomial taper curve function for Zambian
exotic tree plantations. Journal of Tropical Forest Science, 8(3): 339–354. IPCC. 2006a. IPCC Guidelines for National Greenhouse Gas Inventories. Eggleston H.S., Buendia L.,
Miwa K., Ngara T. and Tanabe K. (eds). National Greenhouse Gas Inventories Programme, IGES, Japan.
IPCC. 2006b. Good Practice Guidance for National Greenhouse Gas Inventories. Agriculture,
Forestry and Other Land Uses (Vol. 4). Inter‐Governmental Panel on Climate Change (IPCC), Geneva, Switzerland.
Jaquet, S., Schwilch, G., Hartung‐Hofmann, F., Adhikari, A. and Sudmeier‐Rieux, K. 2015. Does
outmigration lead to land degradation? Labour shortage and land management in a western Nepal watershed. Applied Geography, 62: 157–170.
Kharal, D. K. and Fujiwara, T. 2012. Growth and yield estimation of Chamaecyparis spp. through
tree ring analysis. Banko Janakari, 22(2): 36–42.
State of Nepal’s Forests 49 |
Kleinn, C. 1994. Forest Resources Inventories in Nepal: Status Quo, Needs, Recommendations. FRISP. His Majesty’s Government of Nepal, Kathmandu, Nepal.
LRMP. 1986. Land System Report. Land Resource Mapping Project (LRMP), Kenting Earth Science,
Canada. Mehtatalo, L. 2012. Forest Biometrics Functions of Lauri Mehtatalo ‐ lmfor package. Retrieved
from http://joyx.joensuu.fi/~lamehtat/documents/lmfor.pdf MPFS. 1989. Master Plan for the Forestry Sector (MPFS). Main Report. Ministry of Forests and Soil
Conservation, Kathmandu, Nepal. Niraula, R. R., Gilani, H., Pokharel, B. K. and Qamer, F. M. 2013. Measuring impacts of community
forestry program through repeat photography and satellite remote sensing in the Dolakha district of Nepal. Journal of Environmental Management, 126: 20–29.
NPC. 2013. Thirteenth Plan 2013/14–2015/16. National Planning Commission (NPC), Kathmandu,
Nepal. Pariyar, D. 2008. Country Pasture/Forage Resource Profiles. FAO Country Profile Nepal.
Kathmandu, Nepal. Paudel, K. P., Tamang, S. and Shrestha, K. K. 2014. Transforming land and livelihood: analysis of
agricultural land abandonment in the Mid Hills of Nepal. Journal of Forest and Livelihood, 12(1): 11–19.
Poudel, N. R., Fuwa, N. and Otsuka, K. 2015. The impacts of a community forestry program on
forest conditions, management intensity and revenue generation in the Dang district of Nepal. Environment and Development Economics, 20(2): 259–281.
Press, J. R., Shrestha, K. K. and Sutton D. A. 2000. Annotated Checklist of the Flowering Plants of
Nepal. The Natural History Museum, London, UK. Pribyl, D. W. 2010. A critical review of the conventional SOC to SOM conversion factor. Geoderma,
156: 75–83. Richter, R. 1998. Correction of satellite imagery over mountainous terrain. Applied Optics, 18:
4004–4015. Sharma, E. R. and Pukkala, T. 1990. Volume Equations and Biomass Prediction of Forest Trees of
Nepal (Publication No. 47). Forest Survey and Statistics Division, Kathmandu, Nepal. Sharma, L. N., Vetaas, O. R., Chaudhary, R. P. and Maren, I. E. 2014. Pastoral abandonment, shrub
proliferation and landscape changes: a case study from Gorkha, Nepal. Landscape Research, 39(1): 53–69.
Shrestha, M. B., Tamrakar, N. K., and Miyazaki, T. 2008. Morphometry and sediment dynamics of
the Churiya River area, Siwalik Range in Nepal. Morfometria y dinamica de los sedimentosen el area del Rio t, Serrania de Siwalik en Nepal. Boletin de Geología, 30: 35–48.
Stainton , J. D. A. 1972. Forests of Nepal. John Murray, London, UK.
State of Nepal’s Forests 50 |
TISC. 2002. Forest and Vegetation Types of Nepal. Department of Forests, Tree Improvement and
Silviculture Component (TISC), Kathmandu, Nepal. Toutin, T. 2004. Geometric processing of remote sensing images: models, algorithms and
methods. International Journal of Remote Sensing, 25(10): 1893–1924. Upreti, B. N. 1999. An overview of the stratigraphy and tectonics of the Nepal Himalaya. Journal of
Asian Earth Sciences, 17: 577–606. Walkley, A. and Black, I. A. 1934. An examination of the digitize method for determining soil
organic matters, and a proposed modification of the chromic acid tiltration method. Soil Science, 37: 29–38.
WECS. 2011. Water Resources of Nepal in the Context of Climate Change. Aryal, R. S. and Rajkarnikar, G (eds.). Water and Energy Commission Secretariat (WECS), Kathmandu, Nepal.
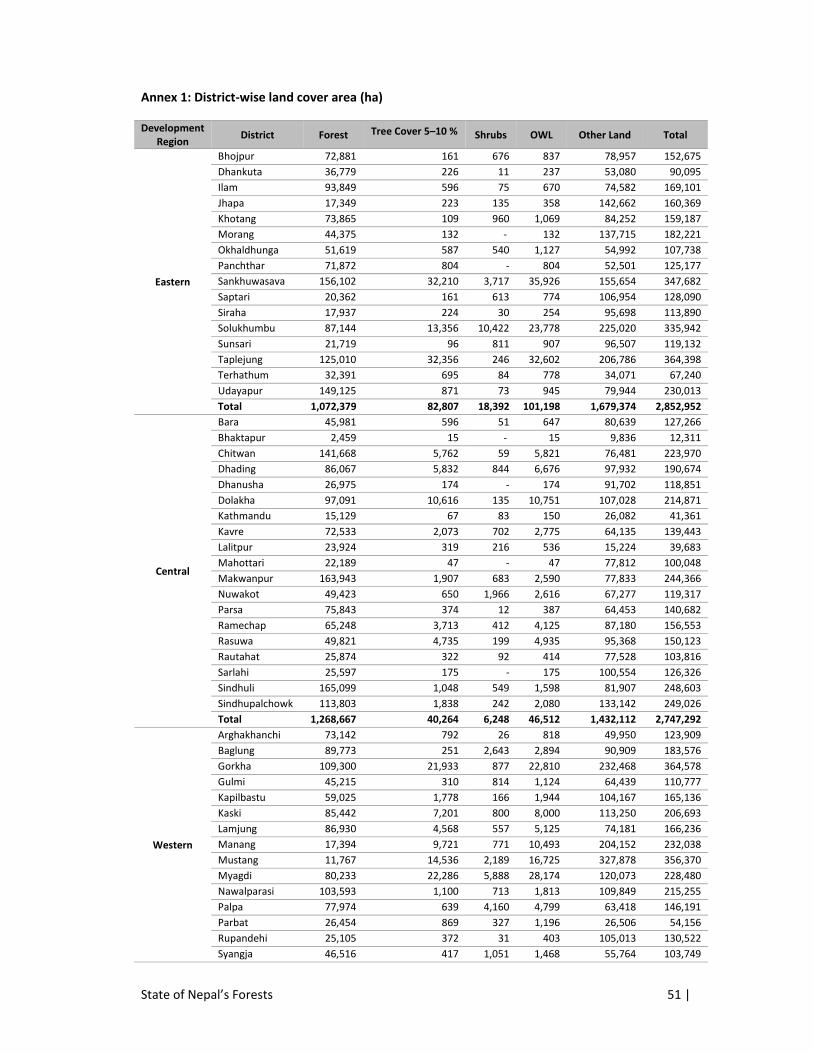
State of Nepal’s Forests 51 |
Annex 1: District‐wise land cover area (ha)
Development Region
District Forest Tree Cover 5–10 % Shrubs OWL Other Land Total
Eastern
Bhojpur 72,881 161 676 837 78,957 152,675
Dhankuta 36,779 226 11 237 53,080 90,095
Ilam 93,849 596 75 670 74,582 169,101
Jhapa 17,349 223 135 358 142,662 160,369
Khotang 73,865 109 960 1,069 84,252 159,187
Morang 44,375 132 ‐ 132 137,715 182,221
Okhaldhunga 51,619 587 540 1,127 54,992 107,738
Panchthar 71,872 804 ‐ 804 52,501 125,177
Sankhuwasava 156,102 32,210 3,717 35,926 155,654 347,682
Saptari 20,362 161 613 774 106,954 128,090
Siraha 17,937 224 30 254 95,698 113,890
Solukhumbu 87,144 13,356 10,422 23,778 225,020 335,942
Sunsari 21,719 96 811 907 96,507 119,132
Taplejung 125,010 32,356 246 32,602 206,786 364,398
Terhathum 32,391 695 84 778 34,071 67,240
Udayapur 149,125 871 73 945 79,944 230,013
Total 1,072,379 82,807 18,392 101,198 1,679,374 2,852,952
Central
Bara 45,981 596 51 647 80,639 127,266
Bhaktapur 2,459 15 ‐ 15 9,836 12,311
Chitwan 141,668 5,762 59 5,821 76,481 223,970
Dhading 86,067 5,832 844 6,676 97,932 190,674
Dhanusha 26,975 174 ‐ 174 91,702 118,851
Dolakha 97,091 10,616 135 10,751 107,028 214,871
Kathmandu 15,129 67 83 150 26,082 41,361
Kavre 72,533 2,073 702 2,775 64,135 139,443
Lalitpur 23,924 319 216 536 15,224 39,683
Mahottari 22,189 47 ‐ 47 77,812 100,048
Makwanpur 163,943 1,907 683 2,590 77,833 244,366
Nuwakot 49,423 650 1,966 2,616 67,277 119,317
Parsa 75,843 374 12 387 64,453 140,682
Ramechap 65,248 3,713 412 4,125 87,180 156,553
Rasuwa 49,821 4,735 199 4,935 95,368 150,123
Rautahat 25,874 322 92 414 77,528 103,816
Sarlahi 25,597 175 ‐ 175 100,554 126,326
Sindhuli 165,099 1,048 549 1,598 81,907 248,603
Sindhupalchowk 113,803 1,838 242 2,080 133,142 249,026
Total 1,268,667 40,264 6,248 46,512 1,432,112 2,747,292
Western
Arghakhanchi 73,142 792 26 818 49,950 123,909
Baglung 89,773 251 2,643 2,894 90,909 183,576
Gorkha 109,300 21,933 877 22,810 232,468 364,578
Gulmi 45,215 310 814 1,124 64,439 110,777
Kapilbastu 59,025 1,778 166 1,944 104,167 165,136
Kaski 85,442 7,201 800 8,000 113,250 206,693
Lamjung 86,930 4,568 557 5,125 74,181 166,236
Manang 17,394 9,721 771 10,493 204,152 232,038
Mustang 11,767 14,536 2,189 16,725 327,878 356,370
Myagdi 80,233 22,286 5,888 28,174 120,073 228,480
Nawalparasi 103,593 1,100 713 1,813 109,849 215,255
Palpa 77,974 639 4,160 4,799 63,418 146,191
Parbat 26,454 869 327 1,196 26,506 54,156
Rupandehi 25,105 372 31 403 105,013 130,522
Syangja 46,516 417 1,051 1,468 55,764 103,749
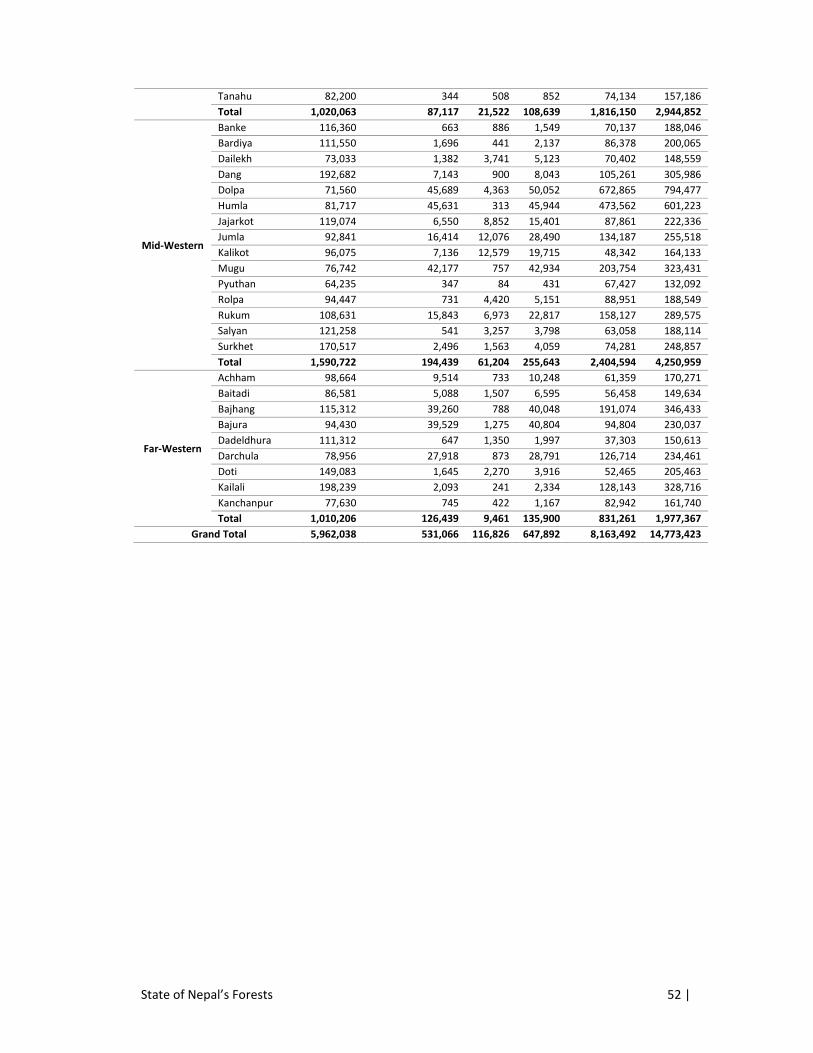
State of Nepal’s Forests 52 |
Tanahu 82,200 344 508 852 74,134 157,186
Total 1,020,063 87,117 21,522 108,639 1,816,150 2,944,852
Mid‐Western
Banke 116,360 663 886 1,549 70,137 188,046
Bardiya 111,550 1,696 441 2,137 86,378 200,065
Dailekh 73,033 1,382 3,741 5,123 70,402 148,559
Dang 192,682 7,143 900 8,043 105,261 305,986
Dolpa 71,560 45,689 4,363 50,052 672,865 794,477
Humla 81,717 45,631 313 45,944 473,562 601,223
Jajarkot 119,074 6,550 8,852 15,401 87,861 222,336
Jumla 92,841 16,414 12,076 28,490 134,187 255,518
Kalikot 96,075 7,136 12,579 19,715 48,342 164,133
Mugu 76,742 42,177 757 42,934 203,754 323,431
Pyuthan 64,235 347 84 431 67,427 132,092
Rolpa 94,447 731 4,420 5,151 88,951 188,549
Rukum 108,631 15,843 6,973 22,817 158,127 289,575
Salyan 121,258 541 3,257 3,798 63,058 188,114
Surkhet 170,517 2,496 1,563 4,059 74,281 248,857
Total 1,590,722 194,439 61,204 255,643 2,404,594 4,250,959
Far‐Western
Achham 98,664 9,514 733 10,248 61,359 170,271
Baitadi 86,581 5,088 1,507 6,595 56,458 149,634
Bajhang 115,312 39,260 788 40,048 191,074 346,433
Bajura 94,430 39,529 1,275 40,804 94,804 230,037
Dadeldhura 111,312 647 1,350 1,997 37,303 150,613
Darchula 78,956 27,918 873 28,791 126,714 234,461
Doti 149,083 1,645 2,270 3,916 52,465 205,463
Kailali 198,239 2,093 241 2,334 128,143 328,716
Kanchanpur 77,630 745 422 1,167 82,942 161,740
Total 1,010,206 126,439 9,461 135,900 831,261 1,977,367
Grand Total 5,962,038 531,066 116,826 647,892 8,163,492 14,773,423


![Nepal's Telecom User reaches 84.77% [infographics]](https://static.fdocuments.in/doc/165x107/540317658d7f72d64a8b4892/nepals-telecom-user-reaches-8477-infographics.jpg)