Financial Reforms – Preliminary Initiative Review of the municipal finances By Urban Reforms Cell.

Consolidated report for the 2019/20 mid-year assessments and s71 report Page 1
State of municipal finances including S71 reports for the period ending
31 December 2019
Consolidated report for the 2019/20 mid-year assessments and s71 report Page 2
Table of Contents
1 Introduction .................................................................................................................................................. 7
2 Purpose ........................................................................................................................................................ 7
3 Background ................................................................................................................................................. 8
4 Brief Discussion of Monitoring Process (Techniques) .......................................................................... 8
5 Mid-year assessment ................................................................................................................................. 9
5.1 Logistical arrangements .................................................................................................... 10
5.1.1 Project site visits dates and projects ..................................................................................... 10
5.1.2 Engagements dates ................................................................................................................. 11
5.1.3 Mid-Year Budget Performance Assessments ...................................................................... 12
5.2 Key Focus Areas of the Mid-Year Engagement ................................................................. 13
5.2.1 Institutional Arrangements ...................................................................................................... 13
5.2.2 Political and Administrative Interface .................................................................................... 15
5.2.3 Administrative Opportunities ................................................................................................... 16
5.2.4 Use of Consultants ................................................................................................................... 16
6 Financial Health ........................................................................................................................................ 18
6.1 Operational financial performance ..................................................................................... 18
6.1.1 Operating Revenue and Expenditure .................................................................................... 18
6.1.2 Capital spending and sources of finance .............................................................................. 21
6.1.3 Cash Flow .................................................................................................................................. 22
6.1.4 Debt Management .................................................................................................................... 22
6.1.5 Performance indicators ............................................................................................................ 26
6.1.6 Spending on Conditional Grant .............................................................................................. 28
6.1.7 Revenue management ............................................................................................................ 29
6.1.8 Water revenue challenges ...................................................................................................... 31
7 Financial Governance .............................................................................................................................. 32
7.1 Monitoring Audit Action Plans ........................................................................................... 34
7.2 Progress on the top Ten Risks .......................................................................................... 34
7.3 Internal Audit ..................................................................................................................... 36
7.4 Consequence Management .............................................................................................. 36
7.5 mSCOA ............................................................................................................................. 37
8 Service Delivery Performance ................................................................................................................ 45
8.1 Service Delivery Performance ........................................................................................... 45
Consolidated report for the 2019/20 mid-year assessments and s71 report Page 3
8.2 Service Delivery Backlogs ................................................................................................. 45
8.3 Provision of Free Basic Services ....................................................................................... 46
8.4 Critical Challenges Affecting Sustainability ........................................................................ 46
9 Summary and Conclusion ....................................................................................................................... 53
10 Recommendations ............................................................................................................................... 54
Appendices 57 - 66
Table 1: Project site visit schedule .................................................................................................. 10
Table 2: Schedule of mid-year engagements .................................................................................. 11
Table 3: Senior Management Composition ...................................................................................... 14
Table 4: Operating Revenue per district .......................................................................................... 18
Table 5: Operating Expenditure per district ..................................................................................... 20
Table 6: Capital Expenditure per district .......................................................................................... 21
Table 7: Source of Finance for Capital Expenditure ........................................................................ 21
Table 8: Cash Flow ......................................................................................................................... 22
Table 9: Debtors Age Analysis ........................................................................................................ 22
Table 10: Debtors by Customer per district ..................................................................................... 24
Table 11: Creditors Age Analysis per District .................................................................................. 25
Table 12: Financial Ratios ............................................................................................................... 27
Table 13: MIG Conditional Grants ................................................................................................... 29
Table 14: Audit Outcomes ............................................................................................................... 33
Table 15: Top Ten Risks ................................................................................................................. 35
Table 16: Systems Operations ........................................................................................................ 39
Table 17: Module availability and usage .......................................................................................... 41
Table 18: mSCOA governance structure ......................................................................................... 43
Graph 1: MM and CFO attendance ................................................................................................. 12
Graph 2: Revenue per Income Group ............................................................................................. 19
Graph 3: Expenditure per Item ........................................................................................................ 20
Graph 4: Debtors by Customer Group ............................................................................................. 24
Graph 5: Creditors by group ............................................................................................................ 25
Graph 6: Audit Outcomes ................................................................................................................ 32
Graph 7: Top Ten Risks .................................................................................................................. 36
Graph 8: mSCOA system operations .............................................................................................. 40
Graph 9: mSCOA module availability and usage ............................................................................. 42
Graph 10: mSCOA Governance structure ....................................................................................... 44
Graph 11: Sustainability challenges at a provincial level ................................................................. 47
Graph 12: Critical Issues – Capricorn District .................................................................................. 48
Graph 13: Critical Issues – Mopani District ..................................................................................... 49
Graph 14: Critical Issues - Sekhukhune District............................................................................... 50
Graph 15: Critical Issues - Vhembe District ..................................................................................... 51
Graph 16: Critical Issues – Waterberg District ................................................................................. 52

Consolidated report for the 2019/20 mid-year assessments and s71 report Page 4

Consolidated report for the 2019/20 mid-year assessments and s71 report Page 5
Disclaimer This report contains information in summary form and is therefore intended for general guidance. It is not
intended to be a substitute for detailed research or the exercise of professional judgment. Limpopo Provincial
Treasury hereby disclaims any and all responsibility for any loss, injury, damages, or expense directly or
indirectly arising out of or relating to the use or reliance on this publication or the material contained therein.
This report has been prepared for Capricorn, Mopani, Sekhukhune, Vhembe and Waterberg Districts and
their local Municipalities, Limpopo Legislature, Provincial and National Treasuries. Provincial Treasury does
not accept responsibility to any other party to whom it may be shown, or who on their own volition, may
decide to rely on it. This report has been compiled based on preliminary information obtained from the
National Treasury Local Government Database, assessments performed by the department and
engagements held with the municipalities. The information provided, accounting records and financial
information of the municipalities have not been audited and accordingly the Limpopo Provincial Treasury
can express no assurances thereon. This publication is in compliance with, amongst others, Section 71 of
the Municipal Finance Management Act No. 56 of 2003, and is not to be used for any other purpose.
All information in this report is based on:
Mid-year assessments performed by Limpopo Provincial Treasury and engagements held with the municipalities; and
Section 71 MFMA reports that each Municipal Manager and Chief Financial Officer was required submit to National Treasury. Therefore, any queries on the budget, revenue or expenditure figures reflected in the report must be referred to the relevant Municipal Manager or Chief Financial Officer.
This report may not be copied in whole or in part without the written consent of the Limpopo Provincial Treasury.

Consolidated report for the 2019/20 mid-year assessments and s71 report Page 6
Acronyms AFS Annual Financial Statements AGSA Auditor-General of South Africa CFO Chief Financial Officer CoGHSTA Department of Cooperative Governance, Human Settlement and Traditional Affairs DCoG Department of Cooperative Governance and Traditional Affairs DM District Municipality FMCMM Financial Management Capability Maturity Model FMG Financial Management Grant GRAP Generally Recognised Accounting Practice IDP Integrated Development Plan LM Local Municipality LPT Limpopo Provincial Treasury LED Local Economic Development MFMA Municipal Finance Management Act MFIP Municipal Finance Improvement Programme MIG Municipal Infrastructure Grant MISA Municipal Infrastructure Support Agency (MISA) MM Municipal Manager MTREF Medium Term Revenue and Expenditure Framework mSCOA Municipal Standard Chart of Accounts NT National Treasury PT Provincial Treasury SCM Supply Chain Management UIF` Unauthorised, Fruitless and Wasteful expenditure

Consolidated report for the 2019/20 mid-year assessments and s71 report Page 7
1 Introduction
The National Treasury has delegated 26 of 27 municipalities to Limpopo Provincial Treasury to
carry out its functions stated out in the MFMA. In terms of section 5, Chapter 2 of Municipal
Finance Management Act of 2003, National Treasury must:
(a) Fulfill its responsibilities in terms of Chapter 13 of the Constitution and this Act;
(b) Promote the object of this Act as stated in section 2-
(i) Within the framework of co-operative government set out in Chapter 3 of the
Constitution; and
(ii) When coordinating intergovernmental financial and fiscal relations in terms of the
Intergovernmental Fiscal Relations Act, 1997 (ActNo.97 of 1997), the annual
Division of Revenue Act and the Public Finance Management Act; and
(c) Enforce compliance with measures established in terms of section 216 (1) of the
Constitution, including those established in terms of this Act.
The Municipal Finance Chief Directorate is responsible for providing support on risk management,
internal audit, supply chain management, internship Programme and other MFMA related matters
to municipalities and municipal entities. The Chief Directorate’s function is to provide direction,
support and guidance to enable municipalities to implement and maintain effective systems of risk
management, Internal audit function, supply chain management, internship Programme and
general compliance with the MFMA.
2 Purpose
The purpose of this report is to provide an overview of the state of municipal finances. This report
includes the activities performed by the department in the quarter under review and actual
information from the municipal In-Year financial monitoring system (i.e. section 71 reports).

Consolidated report for the 2019/20 mid-year assessments and s71 report Page 8
3 Background
Section 154 (1) of The Constitution of the Republic of South Africa, 1996 (Act 108 of 1996)
provides for national and provincial spheres of government to support and strengthen the capacity
of municipalities to manage their own affairs, to exercise their powers and to perform their
functions.
Section 72(1) (a) of the Municipal Finance Management Act (MFMA) Act of 2003 (Act 56 of 2003)
requires the accounting officer to assess the municipality’s performance for the first six months of
the financial year by 25 January of each year. The assessment inform the preparation of the
municipality’s adjustments budget in terms of section 28 of the MFMA. The outcome of the
assessment is submitted via a report, in the format prescribed as per the Municipal Budget and
Reporting Regulations, to the Mayor of the municipality, the National Treasury (NT) and the
relevant provincial treasury.
Section 5 (3) of the MFMA further provides for the provincial treasuries to resume the oversight
responsibility of monitoring and supporting municipalities on financial management related
matters.
The NT institutionalized a process to comprehensively assess municipalities’ and municipal
entities’ mid-year performance to give effect to the constitutional monitoring and oversight
responsibilities of a treasury. This process, referred to as the “Mid-year Budget and Performance
Assessment Visit” is an annual strategic engagement undertaken by both NT and provincial
treasuries to strengthen the quality and oversight of municipal budgeting and performance.
4 Brief Discussion of Monitoring Process (Techniques)
The primary reason for municipal mid-year performance assessments is to review the
municipalities’ and municipal entities’ mid-year performance for the first six months of a particular
financial year. These assessments are important in performance monitoring and decision making
regarding future focus of various programmes and support mechanisms by various stakeholders.

Consolidated report for the 2019/20 mid-year assessments and s71 report Page 9
The mid-year budget and performance assessment engagements were scheduled to take place
over thirteen days, from the 11th to 26th February 2019 as per approved programme which was
discussed with Department of Cooperative Governance, Housing and Traditional Affairs
(CoGSHTA) in the province. Project site visits were planned from the 27th January 2020 and 4th
February 2020 in conjunction with CoGSHTA. The mid-year performance assessment result are
based on focus areas aligned to the assessment template used for individual assessment.
5 Mid-year assessment
Provincial Treasury assessed mid-year performance for municipalities. The review focused on,
amongst other things, the annual report outcome and key achievements for the previous year,
the current year performance as measured against priorities in the Integrated Development Plan
(IDP) and the targets set in the Service Delivery Budget Implementation Plan (SDBIP), spending
on all national and provincial grants and progress made in achieving grant conditions. The
preparation of the adjustments budget and inputs thereto, the status of the forthcoming budget
preparation process as approved by Council, financial management issues such as the
institutional arrangements in the Budget and Treasury Office, MFMA Issues, Section 139
interventions, etc. and risk management within the municipality. The process included
infrastructure site visits.
Consolidated report for the 2019/20 mid-year assessments and s71 report Page 10
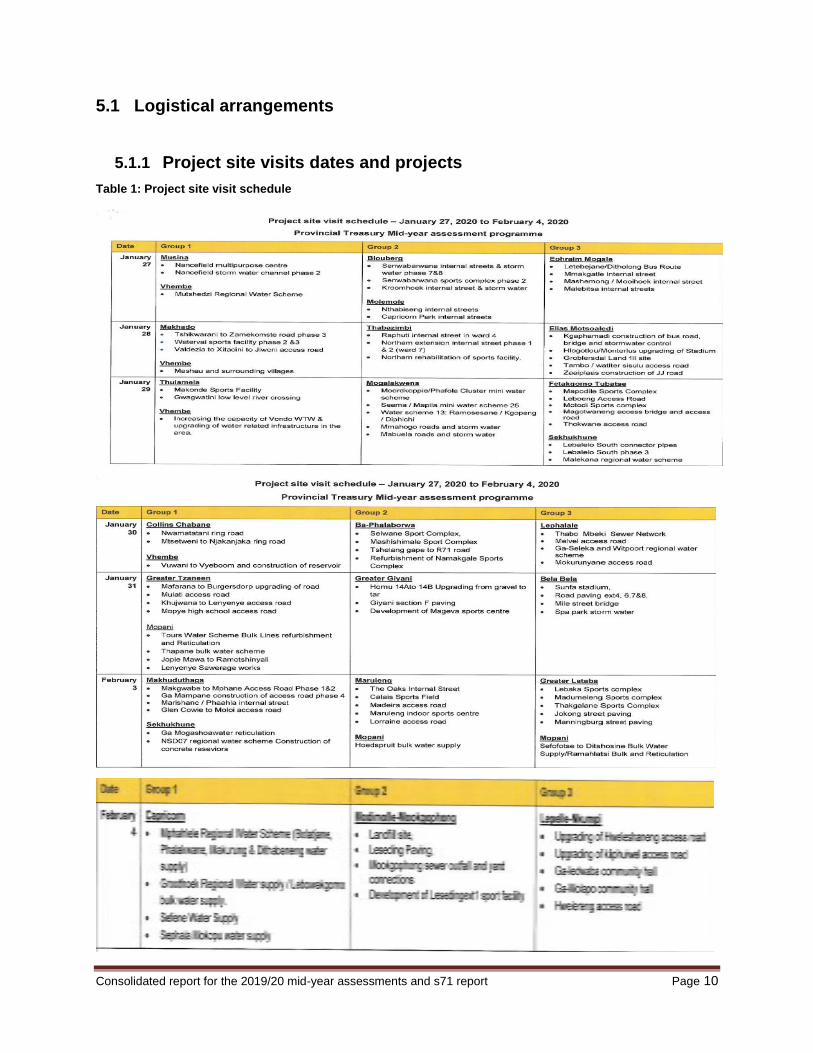
5.1 Logistical arrangements
5.1.1 Project site visits dates and projects
Table 1: Project site visit schedule
Consolidated report for the 2019/20 mid-year assessments and s71 report Page 11
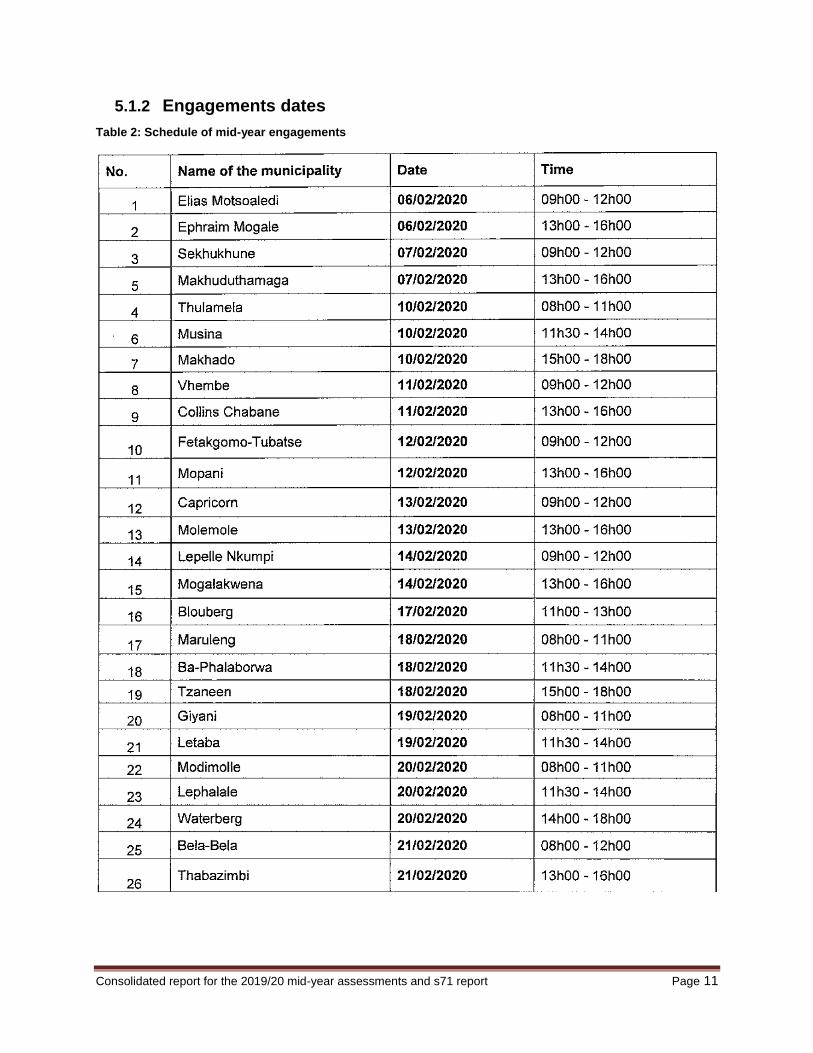
5.1.2 Engagements dates
Table 2: Schedule of mid-year engagements
Consolidated report for the 2019/20 mid-year assessments and s71 report Page 12
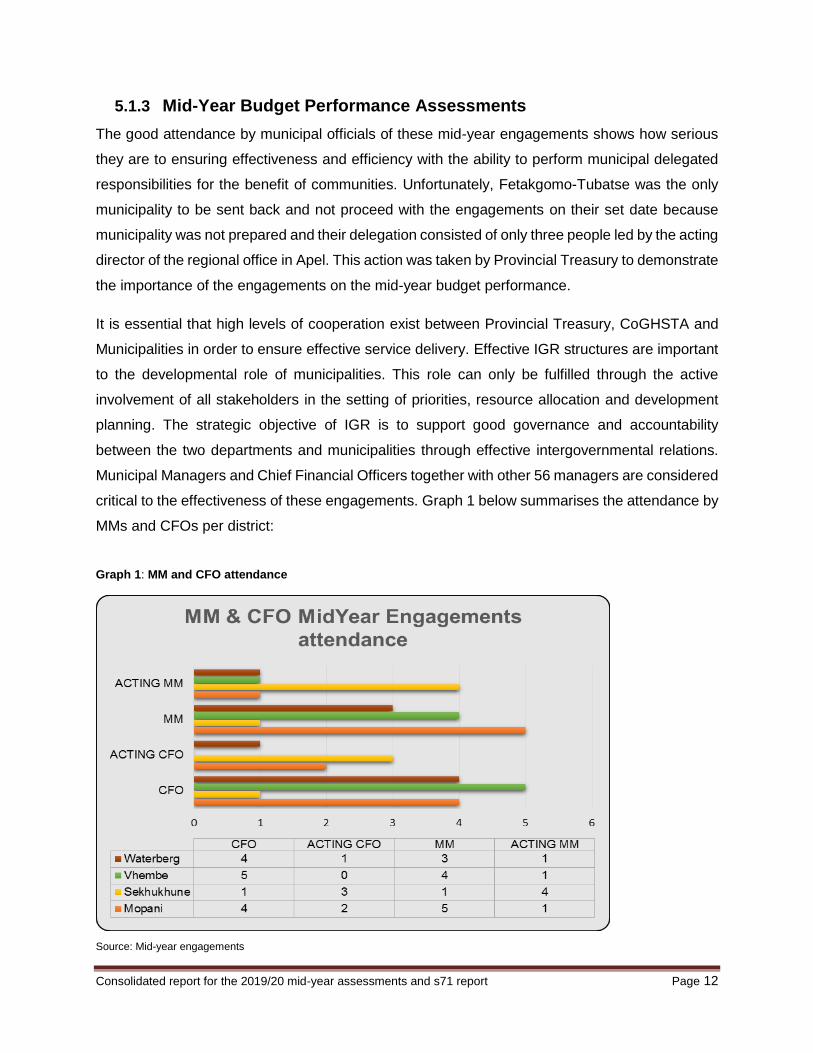
5.1.3 Mid-Year Budget Performance Assessments
The good attendance by municipal officials of these mid-year engagements shows how serious
they are to ensuring effectiveness and efficiency with the ability to perform municipal delegated
responsibilities for the benefit of communities. Unfortunately, Fetakgomo-Tubatse was the only
municipality to be sent back and not proceed with the engagements on their set date because
municipality was not prepared and their delegation consisted of only three people led by the acting
director of the regional office in Apel. This action was taken by Provincial Treasury to demonstrate
the importance of the engagements on the mid-year budget performance.
It is essential that high levels of cooperation exist between Provincial Treasury, CoGHSTA and
Municipalities in order to ensure effective service delivery. Effective IGR structures are important
to the developmental role of municipalities. This role can only be fulfilled through the active
involvement of all stakeholders in the setting of priorities, resource allocation and development
planning. The strategic objective of IGR is to support good governance and accountability
between the two departments and municipalities through effective intergovernmental relations.
Municipal Managers and Chief Financial Officers together with other 56 managers are considered
critical to the effectiveness of these engagements. Graph 1 below summarises the attendance by
MMs and CFOs per district:
Graph 1: MM and CFO attendance
Source: Mid-year engagements
Consolidated report for the 2019/20 mid-year assessments and s71 report Page 13
5.2 Key Focus Areas of the Mid-Year Engagement
The 2019/20 municipal mid-year engagements focused on the four pillars, namely
Institutional arrangements focusing on institutional gaps that impede performance,
structural impediments and business processes;
Financial health with focus on revenue and expenditure performance and conditional grant
performance;
Financial governance which emphasised on audit outcomes, repeat audit findings, UIF
and consequence management;
Service delivery which included high Level performance per Services – (Water, Sanitation,
Roads, Electricity, and Housing) with main focus on DP Objective, Project description,
performance indicator as well as the budget/costing and project visits.
5.2.1 Institutional Arrangements
Municipalities must, within their administrative and finance capacity, establish and organise their
administration so as to be responsive to the needs of local communities. Section 51 of the
Municipal Systems Act identifies the various institutional objectives applicable to municipalities.
The objectives are linked to the particular needs of the municipality and necessitate the
implementation of appropriate organisational structures. Municipalities need to ensure that
procedures are adopted to guide institutional transformation and ensure capacity development
and that all posts are filled by competent staff.
The Municipal Manager as the accounting officer at the municipality is the implementer of
approved Council policies. “As head of administration the municipal manager of the municipality
is subject to the policy directions of the municipal council, responsible and accountable for”. A
municipal council, after consultation with the municipal manager, appoints a manager directly
accountable to the municipal manager. It is important to have these key managerial positions filled
in a municipality, as it has a direct impact on ensuring effective and efficient organisation with the
ability to perform its delegated responsibilities. Table 3 below indicate the status as at midyear:

Consolidated report for the 2019/20 mid-year assessments and s71 report Page 14
Table 3: Senior Management Composition
Municipality Filled Posts/Vacant (Male/Female) Municipal
Manager Chief Financial Officer
Corporate Services
LED & Planning
Community Services
Infrastructure Development
Electrical Services
Blouberg Filled Filled Filled Filled Filled Vacant N/A
Lepelle-Nkumpi Vacant Vacant Vacant Vacant Filled (Male) Filled (Male) N/A
Molemole Filled Filled Filled Vacant Filled Filled N/A
Capricorn Filled Filled Filled Filled Vacant Filled N/A
Ba-Phalaborwa Filled(Female) Filled(Male) Filled(Female) Filled(Male) Filled(Male) Filled (Male) N/A
Giyani Filled(Male) Filled(Male Filled(Male) Filled(Female) Filled(Male) Filled(Male N/A
Letaba Filled(Male) Filled(Female) Filled(Female) Filled(Female) Filled(Male) Filled(Male N/A
Maruleng Filled(Male) Vacant Filled(Male) Vacant Vacant Filled(Male) N/A
Tzaneen Filled(Male) Filled(Female) Filled(Male) Filled(Male) Filled(Male) Filled(Male) N/A
Mopani Filled(Male) Vacant Filled(Male) Filled(Female) Filled(Male) Filled(Male) N/A
Elias Motsoaledi Filled
(Female)
Suspended
Vacant
Filled (Male) Filled
(Male)
Filled
(Female)
Filled
(Female)
N/A
Ephraim Mogale Filled (Female)
Suspended
Vacant Filled
(Male)
Vacant Filled
(Male)
Filled
(Male)
N/A
Fetakgomo-Tubatse
Vacant Vacant Vacant Filled
(Female)
Filled (Female) Filled
(Male)
N/A
Makhuduthamaga Filled (Female) Filled (Male) Filled (Female) Filled (Male) Filled
(Female)
Filled
(Male)
N/A
Sekhukhune Vacant Filled (male) Filled
(Male)Suspended
Filled
(Female)
Filled
(Male)
Vacant N/A
Makhado Filled
(Male)
Filled
(Male)
Vacant Vacant
Vacant Vacant N/A
Musina Filled (Male) Filled (Male) Filled (Male) Filled
(Male)
Filled
(Male)
Filled
(Male)
N/A
Collins Chabane Vacant Filled (Female) Filled
Male
Filled
Male
Filled
(Male)
Filled
(Female)
N/A
Thulamela Filled (Male) Filled (Male) Filled (male) Filled (Male) Filled
Male
Filled
(Female)
N/A
Vhembe Filled (Female) Filled (Female) Vacant Filled (Male) Filled
(Male)
Vacant N/A
BelaBela Filled (Male) Filled (Male) Filled (Female) Filled (Male) Filled (Male) Filled (Female) N/A
Lephalale Vacant Vacant N/A
Mogalakwena Filled (Female) Filled (Male) Filled (Female) Filled (Male) Vacant Vacant Vacant
Modimolle-Mookgophong
Vacant Filled Filled Filled Vacant Filled N/A
Thabazimbi Filled (Male) Filled (Male) Filled Filled Filled Vacant N/A
Waterberg Vacant Filled (Female) Filled Filled Filled Filled N/A
There were 157 senior manager positions (including Municipal Manager) approved across all
municipalities. However, municipalities are having challenges filling positions, generally most of
them recognised the need to fast track filling of vacant positions especially those which may affect
conditional grants roll-overs when required spending for the year is not attained. As can be seen

Consolidated report for the 2019/20 mid-year assessments and s71 report Page 15
from Table 3 above, Out of the total approved posts, 119 posts were filled, while 38 posts were
vacant. All municipalities with vacant posts have made arrangements to have temporarily
appointed officials in an acting capacity to perform the responsibilities of a section 56 manager.
Most of the municipalities still do not have women managers appointed in senior positions, as
most appointments tended to focus on male managers. The appointment of women strives to
achieve gender equality and aims to increase the involvement of women in policy formulation and
strategic decision making. During the mid-year of the 2019/20 financial year, there were 19
municipalities with women appointed at the senior management level. This positive trend shows
that it is not only about the increasing number of municipalities with women in senior position
but it is about the municipalities that in greater measure trusted women in management positions.
5.2.2 Political and Administrative Interface
The role of Political Governance is to ensure that democratic principles are upheld and adhered
to. The Municipal Council, being the highest authority within a municipality, must focus on
legislative, oversight and participatory role and must ensure that the Municipality meets its
legislative obligations without partaking in the daily operational side of the municipality. During
the mid-year assessments, political governance in most municipalities in the Province was stable.
However, during the engagements, it was observed that municipalities have governance
structures that are mainly functional but the effectiveness of these structures in a number of
municipalities is questionable. The Provincial Executive had to intervene in Mogalakwena
Municipality in terms of Section 139 (1) (b) of the Constitution.
During the mid-year performance assessment we observed that Modimolle-Mookgophong,
Vhembe, Musina, Mopani, Sekhukhune, Mogalakwena and Fetakgomo Tubatse governance
structures especially the political structures are not interfacing well with the administrative
governance structures. This is rendering the municipalities non-functional and causes community
dissatisfaction towards the municipalities prompting continued service delivery protests. However,
though Mogalakwena does not experience sustained and violent community service delivery
protests, the municipality poor financial discipline and failure of municipal political oversight over
administrative operations have collapsed the municipality at least at service delivery level hence
it was placed under intervention as per section 139 (1) (b) of the Constitution of South Africa.
Consolidated report for the 2019/20 mid-year assessments and s71 report Page 16
The coalition political governance structures in Modimolle-Mookgophong are not functioning
normally and this puts a lot of strain on the administrative governance. The Provincial Executive
once intervened through section 139 (1) (b) of the Constitution, but even that did not help turn
around the municipality from being dysfunctional. It was observed that in municipalities where
political structures were not interfacing well with administrative governance structures, there was
a direct negative impact on the ability of the municipality to carry out is duties effectively, thus
poor service delivery and poor financial sustainability.
Table 3 reflects the coverage of the filled positions at Senior Management level in all the
municipalities. The statistics show that the number of vacant posts outweigh the filled ones
implying that there is a lot of acting on section 56 positions, in some instances there are people
acting on the acting position. This picture clearly shows that administrative stability is far-fetched.
On paper it may seem as if there is stability in some municipalities but with hindsight of the mid-
year assessment discussions, Provincial Treasury and CoGHSTA concluded that the 7% vacancy
has shown that the municipalities in the province are fairly stable administratively and able to
perform their delegated responsibilities.
5.2.3 Administrative Opportunities
A municipality with a stable Administrative Stability brings along Administrative Opportunities such
as credible budgeting and planning processes with priority to providing basic services to
communities in a sustainable manner; to promote social and economic development; to promote
a safe and healthy environment; and to encourage the involvement of communities and
community organisations in the matters of the municipality. A good example of how to take
advantage of administrative opportunities is Thabazimbi Municipality. This municipality had
literally collapsed because both political and administrative governance structures were
dysfunctional. The municipality was insolvent and its bank account was attached by creditors.
During the mid-year assessments, it was observed that the municipality has been turned around
and is s showing signs of normalcy to a certain extent. The turnaround was made possible by the
good political and administrative relations in the wake of adversity.
5.2.4 Use of Consultants
Consolidated report for the 2019/20 mid-year assessments and s71 report Page 17
A municipality or municipal entity may only appoint consultants if an assessment of the needs and
requirements confirms that the affected municipality does not have the requisite skills or resources
in its full -time employ to perform the function. When consultants are appointed, an accounting
officer must - appoint consultants on a time and cost basis with specific start and end dates; where
practical, appoint consultants on an output- specified basis, subject to specific measurable
objectives and associated remuneration. Contracts with consultants should include overall cost
ceilings by specifying whether the contract price is inclusive or exclusive of travel and subsistence
disbursements; ensure the transfer of skills by consultants to the relevant officials of a municipality
and develop consultancy reduction plans to reduce the reliance on consultants. It is also a
requirement that all contracts with consultants must include a fee retention or penalty clause for
poor performance. In the mid-year engagements with municipalities, it was determined that
municipalities are generally utilising the services of consultants due to lack of capacity in the
following departments;
Technical Services designs, monitoring and construction of projects
Planning & LED – Registration of sites, maintenance of the valuation roll and land survey
services
Community Services – Management of Municipal Landfill site.
Budget and Treasury - Assets management, AFS preparation and Revenue
enhancements
The usage of consultants in the areas of engineering is common because a number of
municipalities especially the rural set up do not have the financial capacity to attract qualified
engineers in their full time employee. More alarming is that over a quarter of the municipalities
were assisted with their financial reporting by consultants for 3 to 4 years. Such dependence on
consultants has been a challenge for many years and mostly because municipalities depend on
consultancy services for financial reporting. Not to disclaim the above, this also speaks to the
difficulty municipalities experience in getting specialized management and accounting skills and
keeping them for the long term. All 26 municipalities used consultants of one form or another.
Consolidated report for the 2019/20 mid-year assessments and s71 report Page 18
6 Financial Health
Financial viability is crucial in determining a municipality’s ability to ensure effective service
delivery to its citizens. There are two factors that determine the financial viability of all
municipalities. The factors are availability of adequate funding and prudent financial management.
The following sub-sections provide the financial performance at mid-year for the mid-year period
ending 31 December 2019.
6.1 Operational financial performance
6.1.1 Operating Revenue and Expenditure
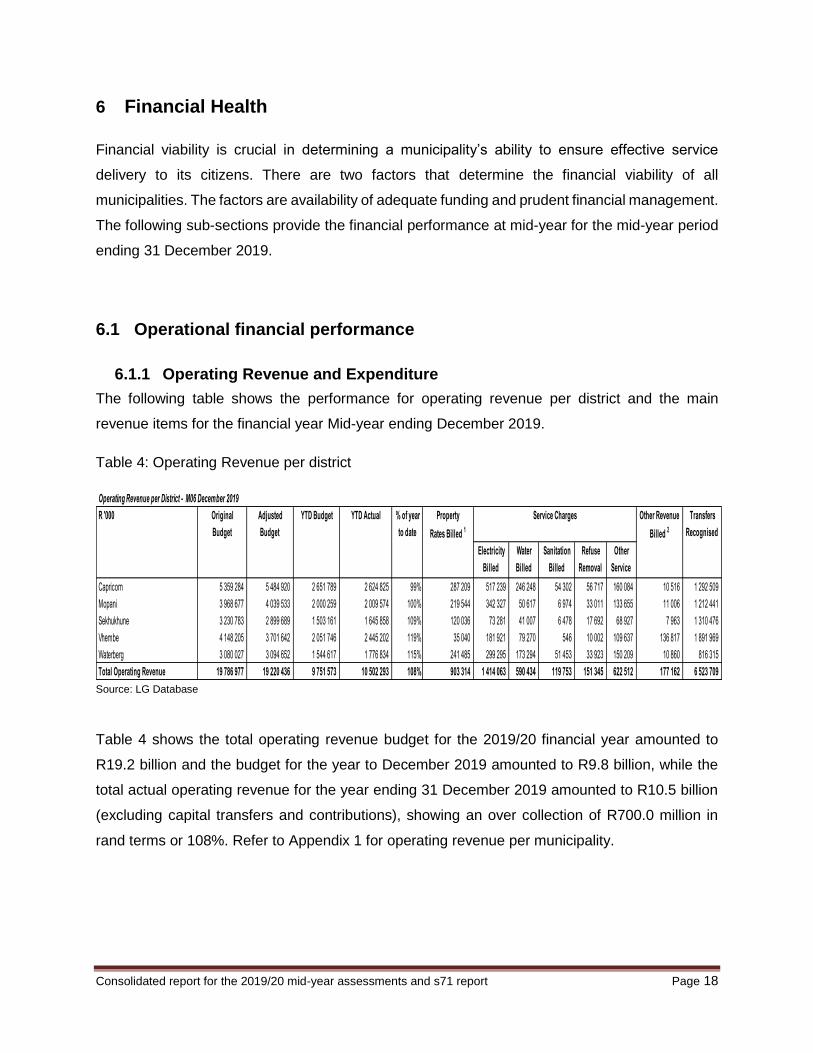
The following table shows the performance for operating revenue per district and the main
revenue items for the financial year Mid-year ending December 2019.
Table 4: Operating Revenue per district
Operating Revenue per District - M06 December 2019
Electricity
Billed
Water
Billed
Sanitation
Billed
Refuse
Removal
Billed
Other
Service
Charges Capricorn 5 359 284 5 484 920 2 651 789 2 624 825 99% 287 209 517 239 246 248 54 302 56 717 160 084 10 516 1 292 509
Mopani 3 968 677 4 039 533 2 000 259 2 009 574 100% 219 544 342 327 50 617 6 974 33 011 133 655 11 006 1 212 441
Sekhukhune 3 230 783 2 899 689 1 503 161 1 645 858 109% 120 036 73 281 41 007 6 478 17 692 68 927 7 963 1 310 476
Vhembe 4 148 205 3 701 642 2 051 746 2 445 202 119% 35 040 181 921 79 270 546 10 002 109 637 136 817 1 891 969
Waterberg 3 080 027 3 094 652 1 544 617 1 776 834 115% 241 485 299 295 173 294 51 453 33 923 150 209 10 860 816 315
Total Operating Revenue 19 786 977 19 220 436 9 751 573 10 502 293 108% 903 314 1 414 063 590 434 119 753 151 345 622 512 177 162 6 523 709
R '000 Original
Budget
Adjusted
Budget
YTD Actual % of year
to date
Transfers
Recognised
Other Revenue
Billed 2
Property
Rates Billed 1 Service Charges YTD Budget
Source: LG Database
Table 4 shows the total operating revenue budget for the 2019/20 financial year amounted to
R19.2 billion and the budget for the year to December 2019 amounted to R9.8 billion, while the
total actual operating revenue for the year ending 31 December 2019 amounted to R10.5 billion
(excluding capital transfers and contributions), showing an over collection of R700.0 million in
rand terms or 108%. Refer to Appendix 1 for operating revenue per municipality.
Consolidated report for the 2019/20 mid-year assessments and s71 report Page 19
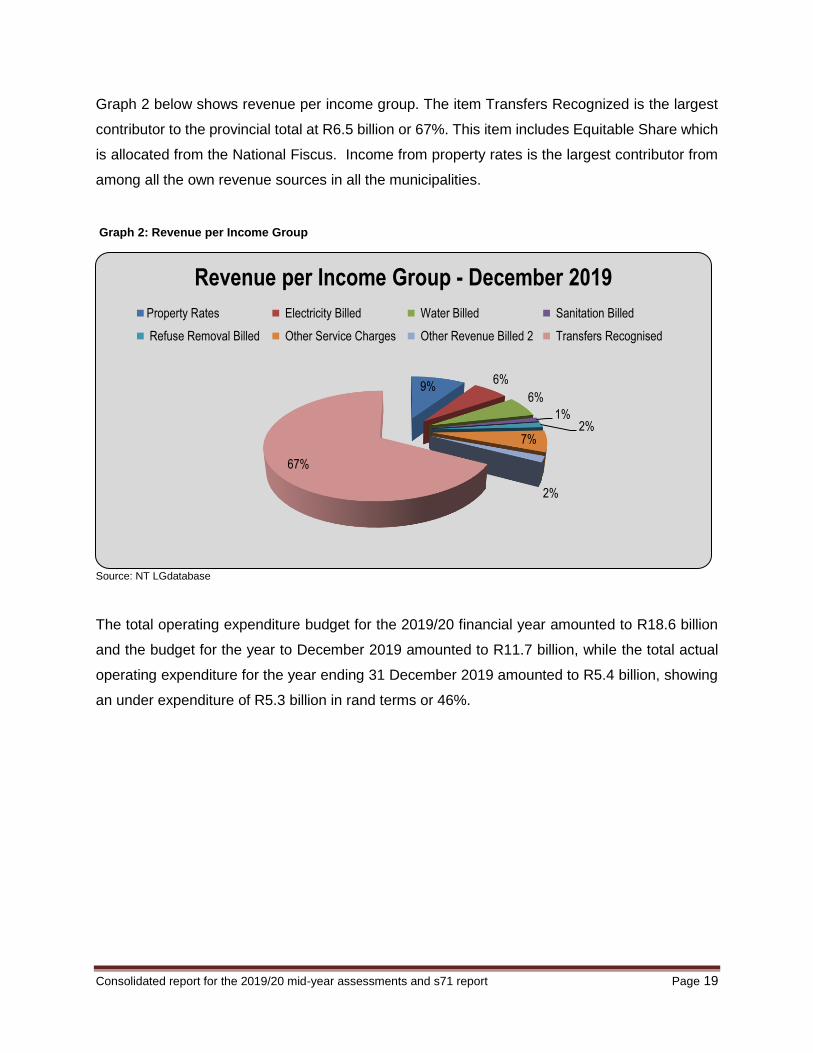
Graph 2 below shows revenue per income group. The item Transfers Recognized is the largest
contributor to the provincial total at R6.5 billion or 67%. This item includes Equitable Share which
is allocated from the National Fiscus. Income from property rates is the largest contributor from
among all the own revenue sources in all the municipalities.
Graph 2: Revenue per Income Group
Source: NT LGdatabase
The total operating expenditure budget for the 2019/20 financial year amounted to R18.6 billion
and the budget for the year to December 2019 amounted to R11.7 billion, while the total actual
operating expenditure for the year ending 31 December 2019 amounted to R5.4 billion, showing
an under expenditure of R5.3 billion in rand terms or 46%.
9%6%
6%
1%2%
7%
2%
67%
Revenue per Income Group - December 2019
Property Rates Electricity Billed Water Billed Sanitation Billed
Refuse Removal Billed Other Service Charges Other Revenue Billed 2 Transfers Recognised

Consolidated report for the 2019/20 mid-year assessments and s71 report Page 20
Table shows the operating expenditure for the mid-year ending 31 December 2019. Table 5: Operating Expenditure per district
Operating Expenditure per District - M06 December 2019
Capricorn 5 158 199 5 115 922 5 089 714 1 647 974 32% 670 156 40 578 38 499 45 162 32 552 547 884 29 021 2 940 241 182
Mopani 3 547 891 4 039 533 2 000 259 974 500 49% 365 040 49 760 - 78 865 2 659 185 972 24 411 6 364 261 429
Sekhukhune 2 619 154 2 720 138 1 366 521 880 995 64% 428 034 54 623 2 763 56 568 1 242 127 659 20 132 7 661 182 313
Vhembe 3 227 829 3 466 394 1 658 532 897 569 54% 447 713 30 660 9 245 66 214 1 586 96 224 35 460 8 396 202 073
Waterberg 3 309 378 3 213 596 1 594 135 1 041 071 65% 466 673 31 651 (80) 1 053 37 211 308 032 12 428 87 184 017
Total Operating Expenditure 17 862 451 18 555 582 11 709 160 5 442 109 46% 2 377 615 207 272 50 427 247 862 75 250 1 265 771 121 452 25 448 1 071 014
Source: NT Local Government Database
Contracted
Services R '000
Original
Budget
Adjusted
Budget
YTD Actual % of YTD
Budget
Employee
Related Cost
Councillor
Remuneratio
n
Debt
Impairment
Bulk
Purchases
YTD Budget Other
Expenditure
Other
Materials
Transfers
and
Subisidies
Depreciatio
n and Asset
Impairment
Graph 3 below shows a provincial overview for Actual expenditure item for the period ending
December 2019. Employee Related Costs was the highest at 45% or R2.4 billion compared to
the year to date budget of R11.7 billion. The assessment report however, indicated that the
municipalities will under spend the overall expenditure budget. Refer to Appendix 2 for operating
revenue per municipality.
Graph 3: Expenditure per Item
Source: NT LG Database
45%
4%1%
5%
1%
24%
20%
Expenditure per Item - December 2019
Employee Related Cost Councillor Remuneration
Debt Impairment Depreciation and Asset Impairment
Bulk Purchases Contracted Services
Other Expenditure
Consolidated report for the 2019/20 mid-year assessments and s71 report Page 21
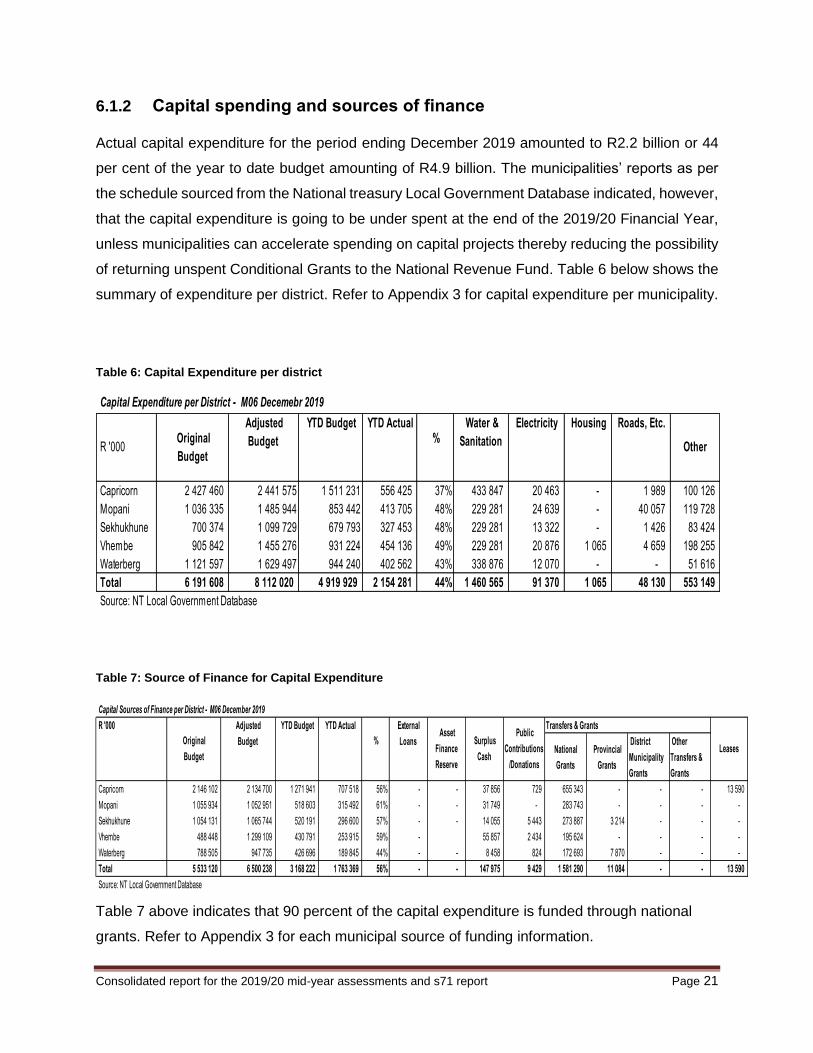
6.1.2 Capital spending and sources of finance
Actual capital expenditure for the period ending December 2019 amounted to R2.2 billion or 44
per cent of the year to date budget amounting of R4.9 billion. The municipalities’ reports as per
the schedule sourced from the National treasury Local Government Database indicated, however,
that the capital expenditure is going to be under spent at the end of the 2019/20 Financial Year,
unless municipalities can accelerate spending on capital projects thereby reducing the possibility
of returning unspent Conditional Grants to the National Revenue Fund. Table 6 below shows the
summary of expenditure per district. Refer to Appendix 3 for capital expenditure per municipality.
Table 6: Capital Expenditure per district
Capital Expenditure per District - M06 Decemebr 2019
Electricity Housing Roads, Etc.
Capricorn 2 427 460 2 441 575 1 511 231 556 425 37% 433 847 20 463 - 1 989 100 126
Mopani 1 036 335 1 485 944 853 442 413 705 48% 229 281 24 639 - 40 057 119 728
Sekhukhune 700 374 1 099 729 679 793 327 453 48% 229 281 13 322 - 1 426 83 424
Vhembe 905 842 1 455 276 931 224 454 136 49% 229 281 20 876 1 065 4 659 198 255
Waterberg 1 121 597 1 629 497 944 240 402 562 43% 338 876 12 070 - - 51 616
Total 6 191 608 8 112 020 4 919 929 2 154 281 44% 1 460 565 91 370 1 065 48 130 553 149
Source: NT Local Government Database
OtherR '000 Original
Budget
Adjusted
Budget
YTD Budget %
Water &
Sanitation
YTD Actual
Table 7: Source of Finance for Capital Expenditure
Table 7 above indicates that 90 percent of the capital expenditure is funded through national
grants. Refer to Appendix 3 for each municipal source of funding information.
Capital Sources of Finance per District - M06 December 2019
R '000 Transfers & Grants
National
Grants
Provincial
Grants
District
Municipality
Grants
Other
Transfers &
Grants
Capricorn 2 146 102 2 134 700 1 271 941 707 518 56% - - 37 856 729 655 343 - - - 13 590
Mopani 1 055 934 1 052 951 518 603 315 492 61% - - 31 749 - 283 743 - - - -
Sekhukhune 1 054 131 1 065 744 520 191 296 600 57% - - 14 055 5 443 273 887 3 214 - - -
Vhembe 488 448 1 299 109 430 791 253 915 59% - 55 857 2 434 195 624 - - - -
Waterberg 788 505 947 735 426 696 189 845 44% - - 8 458 824 172 693 7 870 - - -
Total 5 533 120 6 500 238 3 168 222 1 763 369 56% - - 147 975 9 429 1 581 290 11 084 - - 13 590
Source: NT Local Government Database
Original
Budget
Adjusted
Budget
YTD Budget
% Public
Contributions
/Donations
Asset
Finance
Reserve
Surplus
Cash
External
Loans
YTD Actual
Leases
Consolidated report for the 2019/20 mid-year assessments and s71 report Page 22
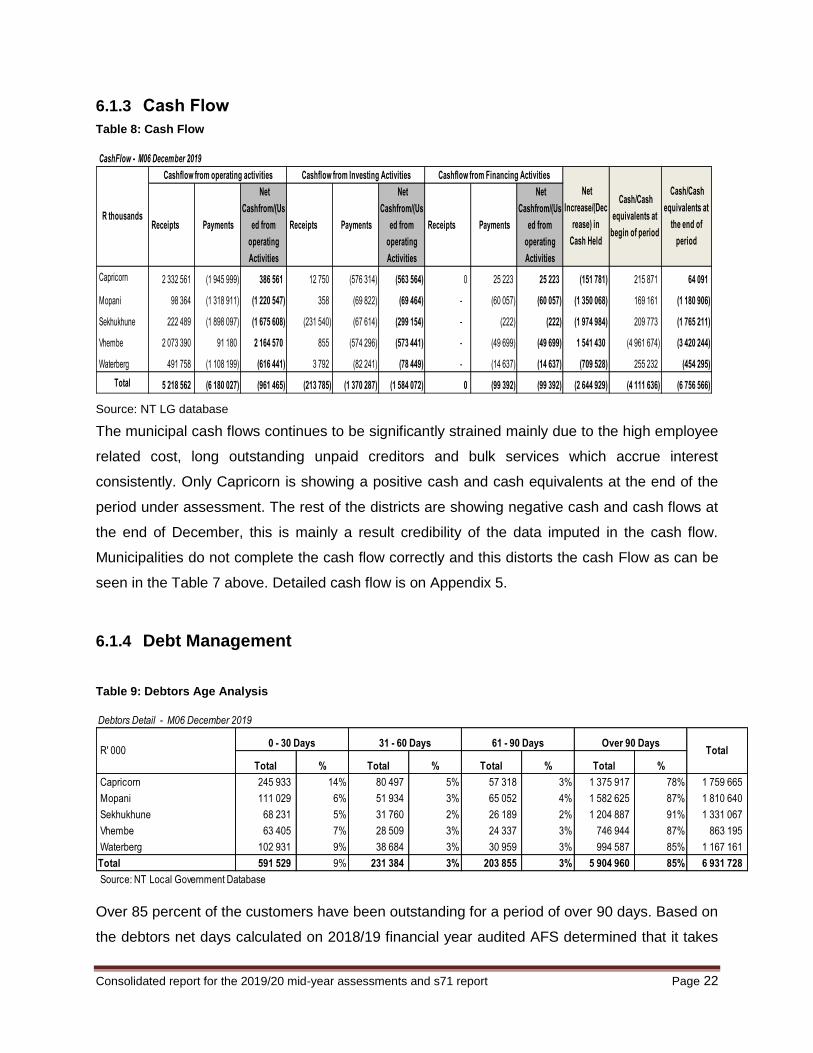
6.1.3 Cash Flow
Table 8: Cash Flow
CashFlow - M06 December 2019
Receipts Payments
Net
Cashfrom/(Us
ed from
operating
Activities
Receipts Payments
Net
Cashfrom/(Us
ed from
operating
Activities
Receipts Payments
Net
Cashfrom/(Us
ed from
operating
Activities
Capricorn 2 332 561 (1 945 999) 386 561 12 750 (576 314) (563 564) 0 25 223 25 223 (151 781) 215 871 64 091
Mopani 98 364 (1 318 911) (1 220 547) 358 (69 822) (69 464) - (60 057) (60 057) (1 350 068) 169 161 (1 180 906)
Sekhukhune 222 489 (1 898 097) (1 675 608) (231 540) (67 614) (299 154) - (222) (222) (1 974 984) 209 773 (1 765 211)
Vhembe 2 073 390 91 180 2 164 570 855 (574 296) (573 441) - (49 699) (49 699) 1 541 430 (4 961 674) (3 420 244)
Waterberg 491 758 (1 108 199) (616 441) 3 792 (82 241) (78 449) - (14 637) (14 637) (709 528) 255 232 (454 295)
Total 5 218 562 (6 180 027) (961 465) (213 785) (1 370 287) (1 584 072) 0 (99 392) (99 392) (2 644 929) (4 111 636) (6 756 566)
Cashflow from Financing Activities
Net
Increase/(Dec
rease) in
Cash Held
Cash/Cash
equivalents at
begin of period
Cash/Cash
equivalents at
the end of
period
R thousands
Cashflow from operating activities Cashflow from Investing Activities
Source: NT LG database
The municipal cash flows continues to be significantly strained mainly due to the high employee
related cost, long outstanding unpaid creditors and bulk services which accrue interest
consistently. Only Capricorn is showing a positive cash and cash equivalents at the end of the
period under assessment. The rest of the districts are showing negative cash and cash flows at
the end of December, this is mainly a result credibility of the data imputed in the cash flow.
Municipalities do not complete the cash flow correctly and this distorts the cash Flow as can be
seen in the Table 7 above. Detailed cash flow is on Appendix 5.
6.1.4 Debt Management
Table 9: Debtors Age Analysis
Over 85 percent of the customers have been outstanding for a period of over 90 days. Based on
the debtors net days calculated on 2018/19 financial year audited AFS determined that it takes
Total % Total % Total % Total %
Capricorn 245 933 14% 80 497 5% 57 318 3% 1 375 917 78% 1 759 665
Mopani 111 029 6% 51 934 3% 65 052 4% 1 582 625 87% 1 810 640
Sekhukhune 68 231 5% 31 760 2% 26 189 2% 1 204 887 91% 1 331 067
Vhembe 63 405 7% 28 509 3% 24 337 3% 746 944 87% 863 195
Waterberg 102 931 9% 38 684 3% 30 959 3% 994 587 85% 1 167 161
Total 591 529 9% 231 384 3% 203 855 3% 5 904 960 85% 6 931 728
Source: NT Local Government Database
Debtors Detail - M06 December 2019
R' 000Over 90 Days
Total31 - 60 Days 61 - 90 Days0 - 30 Days

Consolidated report for the 2019/20 mid-year assessments and s71 report Page 23
an average of 211 days to turn debtors into cash. This put municipalities under a huge financial
strain.

Consolidated report for the 2019/20 mid-year assessments and s71 report Page 24
Table 10: Debtors by Customer per district
Total % Total % Total % Total %
Capricorn 239 532 14% 425 968 24% 1 094 165 62% - 0% 1 759 665
Mopani 903 341 50% 68 104 4% 747 249 41% 91 946 5% 1 810 640
Sekhukhune 432 249 32% 185 896 14% 732 369 55% (19 447) -1% 1 331 067
Vhembe 88 386 10% 137 083 16% 637 726 74% - 0% 863 195
Waterberg 1 167 101 100% 60 0% - 0% - 0% 1 167 161
Total 2 830 609 41% 817 111 12% 3 211 509 46% 72 499 1% 6 931 728
Source: NT Local Government Database
Total
Debtors by Customer Group - M06 December 2019
R '000Government Business Household Other
The table above indicates that the total debtors for the 2019/20 financial year categorised by
customer group amounted to R6.9 billion. Outstanding debtors in respect of Households are the
highest at R3.2 billion or 46 per cent of the total. Water services and property rates are contributing
the largest share of the debt. Refer to Appendix 6 and for detailed debtors’ age analysis and by
customer group respectively.
Graph 4: Debtors by Customer Group
Source: NT LG database
Graph 4 indicates that government entities contribute the second largest share at 41 per cent or
R2.8 billion. In this regard, Provincial Treasury and Coghsta formed a Debt Recovery Task team.
The Task team was established to facilitate the payment of outstanding government debt owed
by the government entities. CoGHSTA facilitates and chairs the provincial debt forum.
41%
12%
46%
1%
Debtors by Customer Group - December 2019Government Business Household Other

Consolidated report for the 2019/20 mid-year assessments and s71 report Page 25
Table 11: Creditors Age Analysis per District
Total % Total % Total % Total %
Capricorn 149 735 81% 7 612 4% 21 0% 26 403 14% 183 771
Mopani 301 529 64% 25 382 5% 16 728 4% 129 530 27% 473 169
Sekhukhune 29 113 0% 17 180 0% 151 245 0% 10 0% 197 548
Vhembe 15 301 55% 1 573 6% 383 1% 10 570 38% 27 827
Waterberg 62 170 9% 11 192 2% 9 007 1% 598 719 88% 681 088
Total 557 848 36% 62 939 4% 177 384 11% 765 232 49% 1 563 403
Source: NT Local Government Database
Creditor Age Analysis - M06 December 2019
R' 0000 - 30 Days 31 - 60 Days 61 - 90 Days Over 90 Days
Total
Table 9 above indicates that the total creditors for the 2019/20 financial year categorised by district
amounted to R1.6 billion. Outstanding creditor’s overs 90 days are the highest at R765.2 million
or 49 per cent of the total. Waterberg district is showing the highest share of the amount the total
liability at R598.7 million of 88 per cent. Refer to Appendix 8 for detailed creditors’ age analysis.
Graph 5: Creditors by group
Source: NT LG Database
The assessment of the creditor’s data as submitted by municipalities to the National Treasury
Local Government database revealed that the data in incomplete, thus not credible. Municipalities
are completing the schedules incorrectly. Sometimes there is just no information completed at all
while is clear that municipalities are owing creditors.
6%10%
1%
0%
0%0%
75%
1% 7%
Creditors by Customer Group Bulk Electricity Bulk Water PAYE Deductions
VAT Pensions/Retirement Loan Repayments
Trade Creditors Auditor General Other
Consolidated report for the 2019/20 mid-year assessments and s71 report Page 26
6.1.5 Performance indicators
All the performance, financial and liquidity indicators show that there was no municipality that was
Bankrupt in the 2018/19 financial year. There eight municipalities that (Bela-Bela, Elias
Motsoaledi, Makhuduthamaga, Modimolle-Mokgopoong, Musina, Sekhukhune, Thabazimbi and
Vhembe) were insolvent implying that it would be difficult to pay creditors from the available cash
and investments. In the solvent ratio category, there were eight municipalities (Blouberg, Ba-
phalaborwa, Molemole, Greater Giyani, Greater Letaba, Greater Tzaneen, Mopani and
Lephalale). In this category, the liquidity ratio was above 1:1, but the municipalities were still
unable to pay creditors from cash and investments available.
Fetakgomo Tubatse was the only municipality in the constraint liquidity ratio; liquidity ratio of less
than 1:1, but had sufficient cash and investments to pay creditors. The last category is the short
to medium term viability, the liquidity ratio is above 1:1 and there was sufficient cash and
investments to pay creditors. There eight municipalities in this category (Collins Chabane, Lepell-
Nkumpi, Carpricorn, Maruleng, Ephraim Mogale, Makhado, Thulamela and Water berg)

Consolidated report for the 2019/20 mid-year assessments and s71 report Page 27
Table 12: Financial Ratios
Source: 2019 Audited AFS
Number Municipality Number Municipality Number Municipality
Bankrupt" - Solvency
ratio of less than 1:1
(total liabilities
exceed total assets)
0 None 0 None 0
Mopani, Elias Motsoaledi,
Sekhukhune, MusinaMopani, Elias Motsoaledi, Makhuduthamaga, Belabela, Elias Motsoaledi
8Vhembe, Belabela, Modimolle-
Mokgophoong10 Fetakgomo-Tubatse, Sekhukhune, Musina, 8 Makhuduthamaga, Modimolle-Mookgophong
Thabazimbi Vhembe, Belabela, Modimolle Mookgophong Musina, Sekhukhune
Thabazimbi Thabazimbi, and Vhembe
Polokwane, Ba-Phalaborwa,
Greater Tzaneen, Bllouberg, Polokwane Ba-Phalaborwa, Blouberg, Ba-Phalaborwa, Molemole
7Fetakgomo-Tubatse, Makhado,
Lephalale10 Greater Letaba, Maruleng, Greater Tzaneen, Makhado8 Greater Giyani, Greater Letaba, Greater Tzaneen
Mogalakwena Greater Giyani, Lephalale, Mogalakwena Mopani, Lephalale
None 1 Lepelle-Nkumpi 1 Fetakgomo-Tubatse
Blouberg, Lepelle-Nkumpi,
Molemole, CapricornMolemole, Capricorn, Ephrain Mogale Collins Chabane, Lepelle-Nkumpi, Capricorn
Giyani, greater Letaba, Maruleng,
Ephraim MogaleCollins Chabane, Thulamela, Waterberg Maruleng, Ephraim Mogale, Makhado
12Makhuduthamaga, Collins
Chabane Thulamela6 8 Thulamela and Waterberg
Waterberg
Outstanding Audit
OpinionsNone None 2 Mogalakwena and Polokwane
27 27 27
2018/19
Insolvent - Liquidity
ratio of less than1:1
and unable to pay
creditors from
available cash and
investments
Constraint Liquidity
Ratio" - Liquidity
ratio of less than 1:1
but sufficient cash
and investments
available to pay
creditors
Short to Medium
Term Viability -
Liquidity ratio above
1:1 and sufficient
cash and investments
available to pay
creditors
2017/182016/17
Solvent - Unable to
Pay Creditors -
Liquidity ratio above
1:1 but unable to pay
creditors from
available cash and
investments
Consolidated report for the 2019/20 mid-year assessments and s71 report Page 28
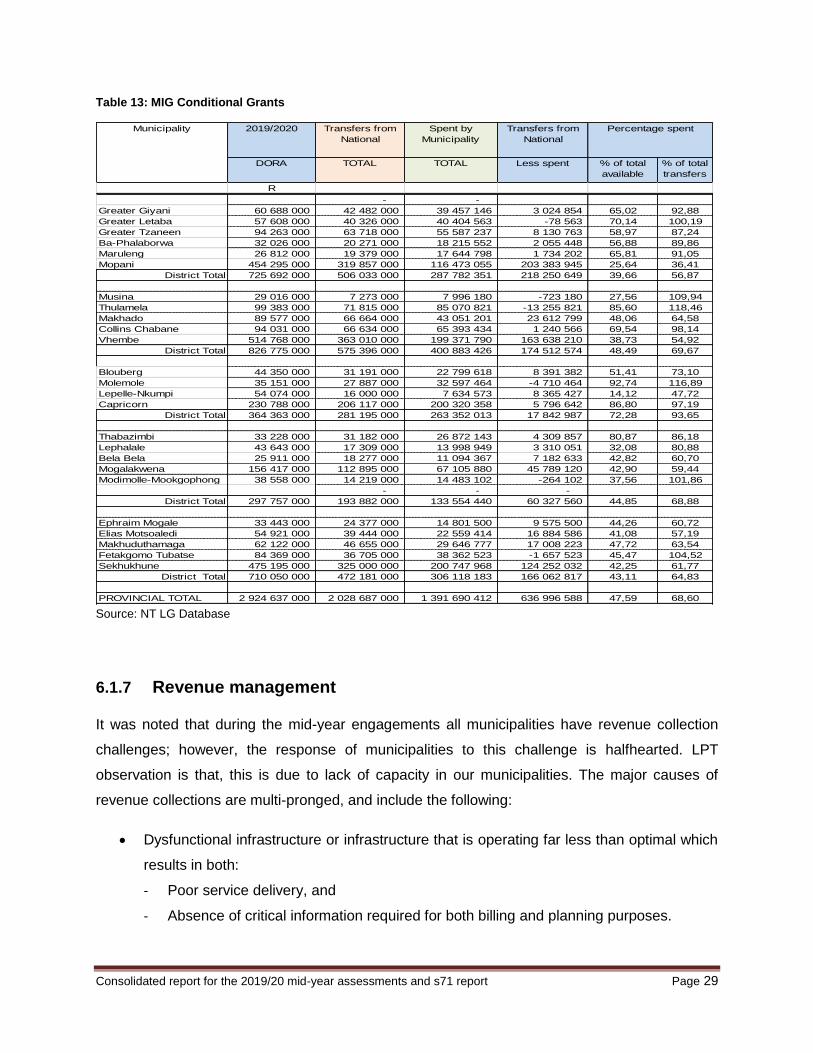
6.1.6 Spending on Conditional Grant
By December 2019, provincial spending on MIG amounted to R1.3 million or 47.6 per cent against
the allocation of R2.9 billion. Capricorn District spent 72.3 per cent (R263 million against the
allocation of R364.4 million) Lepelle-Nkumpi was the only municipality in the district that
performed poorly during the period of six months. Low spending was noted in the following
municipalities:
Mopani district municipality reported expenditure of R116.5 million or 25.6 percent against
the allocation of R474.3 million;
Musina local municipality reported expenditure of R7.9 million or 27.6 percent against the
allocation of R29 million;
Vhembe district municipality reported expenditure of R199.4 million or 38.7 percent
against the allocation of R514.8 million;
Lepelelle - Nkumpi local municipality reported R7.6 million or 14.1 percent against the
allocation of R54.1 million.
Lephalale local municipality reported expenditure of R13.9 million or 32.1 percent against
the allocation of 43.6 million; and
Modimolle – Mokgopoong reported expenditure of R14.5 million or 37.6 percent against
the allocation of R38.6 million
Low spending on capital projects will result in municipalities to surrendering the unspent portion
of Condition Grants to the National Revenue fund, if the rollover applications are not considered
by National Treasury. Furthermore, delays on the implementation of capital projects affect the
service delivery which may cause protests in the municipalities.
As at the end of February 2020, municipalities in the province spent R1.9 billion or 64 percent on
MIG against the allocation of R2.9 billion. Limpopo Provincial Treasury noted that all municipalities
in the province reported different set of figures to National Treasury (R1.8 billion) and CoGHSTA
(R1.6 billion). National Treasury takes incorrect decisions based on the incorrect information
submitted by provincial municipalities on the LG Database. LPT conducts analysis on quarterly
basis and advises the municipalities to submit correct information and improve spending on
allocations to avoid surrendering of unspent portion on conditional grants. CoGHSTA hold
quarterly session on MIG spending with municipalities to assist with technical challenges that may
be faced during the implementation.
Consolidated report for the 2019/20 mid-year assessments and s71 report Page 29
Table 13: MIG Conditional Grants
2019/2020 Transfers from
National
Spent by
Municipality
Transfers from
National
DORA TOTAL TOTAL Less spent % of total
available
% of total
transfers
R
- -
Greater Giyani 60 688 000 42 482 000 39 457 146 3 024 854 65,02 92,88
Greater Letaba 57 608 000 40 326 000 40 404 563 -78 563 70,14 100,19
Greater Tzaneen 94 263 000 63 718 000 55 587 237 8 130 763 58,97 87,24
Ba-Phalaborwa 32 026 000 20 271 000 18 215 552 2 055 448 56,88 89,86
Maruleng 26 812 000 19 379 000 17 644 798 1 734 202 65,81 91,05
Mopani 454 295 000 319 857 000 116 473 055 203 383 945 25,64 36,41
District Total 725 692 000 506 033 000 287 782 351 218 250 649 39,66 56,87
Musina 29 016 000 7 273 000 7 996 180 -723 180 27,56 109,94
Thulamela 99 383 000 71 815 000 85 070 821 -13 255 821 85,60 118,46
Makhado 89 577 000 66 664 000 43 051 201 23 612 799 48,06 64,58
Collins Chabane 94 031 000 66 634 000 65 393 434 1 240 566 69,54 98,14
Vhembe 514 768 000 363 010 000 199 371 790 163 638 210 38,73 54,92
District Total 826 775 000 575 396 000 400 883 426 174 512 574 48,49 69,67
Blouberg 44 350 000 31 191 000 22 799 618 8 391 382 51,41 73,10
Molemole 35 151 000 27 887 000 32 597 464 -4 710 464 92,74 116,89
Lepelle-Nkumpi 54 074 000 16 000 000 7 634 573 8 365 427 14,12 47,72
Capricorn 230 788 000 206 117 000 200 320 358 5 796 642 86,80 97,19
District Total 364 363 000 281 195 000 263 352 013 17 842 987 72,28 93,65
Thabazimbi 33 228 000 31 182 000 26 872 143 4 309 857 80,87 86,18
Lephalale 43 643 000 17 309 000 13 998 949 3 310 051 32,08 80,88
Bela Bela 25 911 000 18 277 000 11 094 367 7 182 633 42,82 60,70
Mogalakwena 156 417 000 112 895 000 67 105 880 45 789 120 42,90 59,44
Modimolle-Mookgophong 38 558 000 14 219 000 14 483 102 -264 102 37,56 101,86
- - -
District Total 297 757 000 193 882 000 133 554 440 60 327 560 44,85 68,88
Ephraim Mogale 33 443 000 24 377 000 14 801 500 9 575 500 44,26 60,72
Elias Motsoaledi 54 921 000 39 444 000 22 559 414 16 884 586 41,08 57,19
Makhuduthamaga 62 122 000 46 655 000 29 646 777 17 008 223 47,72 63,54
Fetakgomo Tubatse 84 369 000 36 705 000 38 362 523 -1 657 523 45,47 104,52
Sekhukhune 475 195 000 325 000 000 200 747 968 124 252 032 42,25 61,77
District Total 710 050 000 472 181 000 306 118 183 166 062 817 43,11 64,83
PROVINCIAL TOTAL 2 924 637 000 2 028 687 000 1 391 690 412 636 996 588 47,59 68,60
Percentage spentMunicipality
Source: NT LG Database
6.1.7 Revenue management
It was noted that during the mid-year engagements all municipalities have revenue collection
challenges; however, the response of municipalities to this challenge is halfhearted. LPT
observation is that, this is due to lack of capacity in our municipalities. The major causes of
revenue collections are multi-pronged, and include the following:
Dysfunctional infrastructure or infrastructure that is operating far less than optimal which
results in both:
- Poor service delivery, and
- Absence of critical information required for both billing and planning purposes.
Consolidated report for the 2019/20 mid-year assessments and s71 report Page 30
Poor or non-existent land use management which result in poor or non-existence of critical
land information for billing purposes.
Poor or non-existent customer management.
Inadequate investment in the internal business processes’ capability that carry and
process revenue management activity which include:
- People.
- Working tools.
- Technology
These deficiencies translate to the following revenue management issues:
- Poor billing and collection resulting in excessive revenue losses which keep on
growing. This is due to poor or sometimes non-existent customer, land and
consumption information.
- Excessive water and electricity losses which keep on growing.
- Poor or non-existent demand and consumption data which render revenue planning
nearly impossible.
- Poor bulk buying practices that not driven by the demand side but by supply side.
- Poor or non-existent customer education, customer communication and customer
interaction practices.
- Poor or non-existent services’ cost information which render revenue planning nearly
impossible.
Generally, municipal budgets do not reflect an appetite to investment in infrastructure
maintenance, land management, end-to-end internal business process, customer management
etc to turn around the situation at this stage. This may be understandable as most municipalities
are in financial distress, and do not have the financial muscle to make the necessary investment.
Interactions between LPT and municipalities identified that municipalities do not have internal
capability to address these complex and expensive challenges.
Both Provincial Treasury and COGHSTA advised municipalities to attend to the situation on an
urgent basis before the further deterioration which will lead to service delivery challenges.
Municipalities should also take advantage of the support provided by other institutions such as
MISA and MFIP programme.
Consolidated report for the 2019/20 mid-year assessments and s71 report Page 31
6.1.8 Water revenue challenges
Districts Municipalities (DMs), except Waterberg District Municipality are Water Services
Authorities as legislation allows. This means they are charged, by law, with the responsibility of
delivering water services to respective districts. DMs opted to enter into water provision
arrangements with local municipalities. The local municipalities are expected to render certain
services which are agreed upon, either through understanding or a signed Service Level
Agreement.
In all cases the understanding is that water services infrastructure is managed by the DM while
the local municipality is mainly supposed to bill and collect on behalf of the DM. A management
fee is supposed to be paid to LM for their services. This arrangement looks simple and possible,
but it is actually operationally complex due to it being multi layered and requires far more
significant integration of systems and sophisticated business process to enable proper
management of the business that of delivering water services. This is however not the case.
The DMs, with their knowledge, decided to abdicate their responsibilities and did not build
sufficient capability to deliver the service and collect revenue for the service DMs should still build
infrastructure maintenance capability and fully integrate that with the LMs for billing and collection
purposes. There is however little evidence that this is done effectively. The business model, as it
stands, is unworkable and tensions have increased between DMs and LMs because LMs argue
that the expenses relating provision of water services is expensive; on the other side, LMs do not
transferring collected funds to the DMs.
Over and above that the AG, rightfully so, questions the expenses incurred by LMs in this respect
as being fruitless and wasteful as there is no value for money. The budgets of DMs do not reflect
the required investment to turn around the situation due to lack of financial muscle to make the
necessary investment. It is however advisable for the DMs to review the service level agreements
with LMs and ensure that there is a clear business process of provision water, maintenance of
related infrastructure and collection of revenue. It is in the interest of both DMs and LMs that
process is open and fair and monitored regularly.
Consolidated report for the 2019/20 mid-year assessments and s71 report Page 32
7 Financial Governance
Graph 6: Audit Outcomes
Source: AGSA
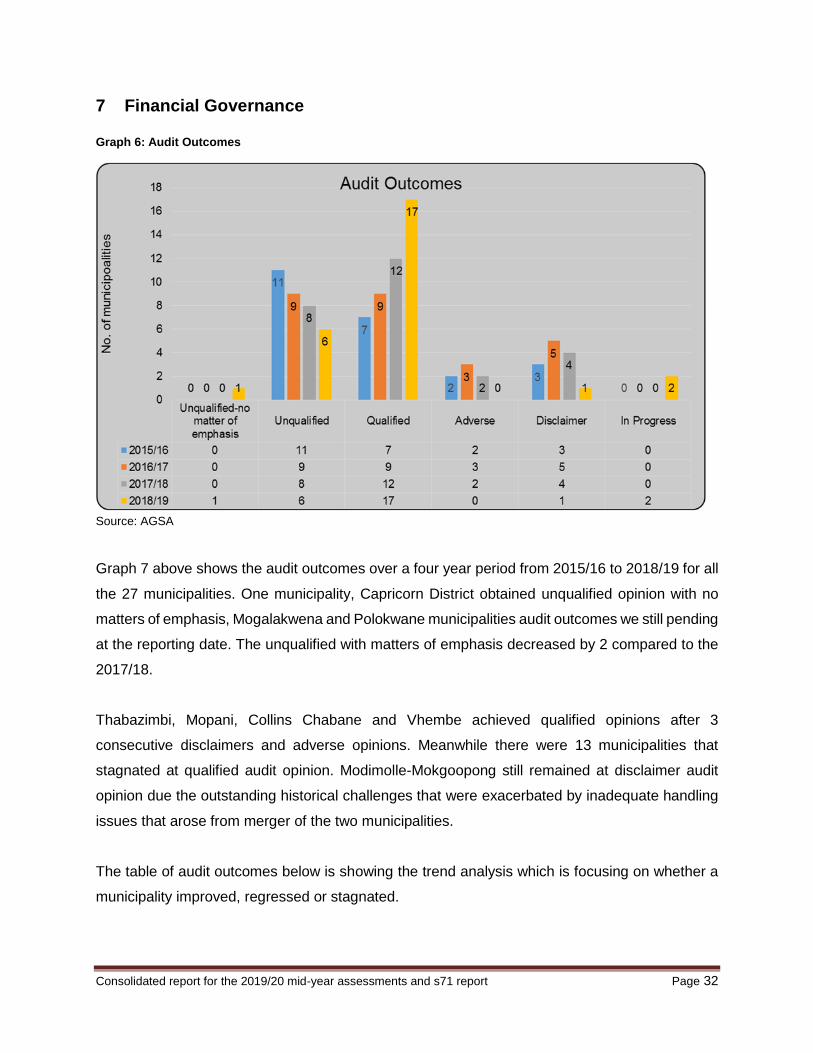
Graph 7 above shows the audit outcomes over a four year period from 2015/16 to 2018/19 for all
the 27 municipalities. One municipality, Capricorn District obtained unqualified opinion with no
matters of emphasis, Mogalakwena and Polokwane municipalities audit outcomes we still pending
at the reporting date. The unqualified with matters of emphasis decreased by 2 compared to the
2017/18.
Thabazimbi, Mopani, Collins Chabane and Vhembe achieved qualified opinions after 3
consecutive disclaimers and adverse opinions. Meanwhile there were 13 municipalities that
stagnated at qualified audit opinion. Modimolle-Mokgoopong still remained at disclaimer audit
opinion due the outstanding historical challenges that were exacerbated by inadequate handling
issues that arose from merger of the two municipalities.
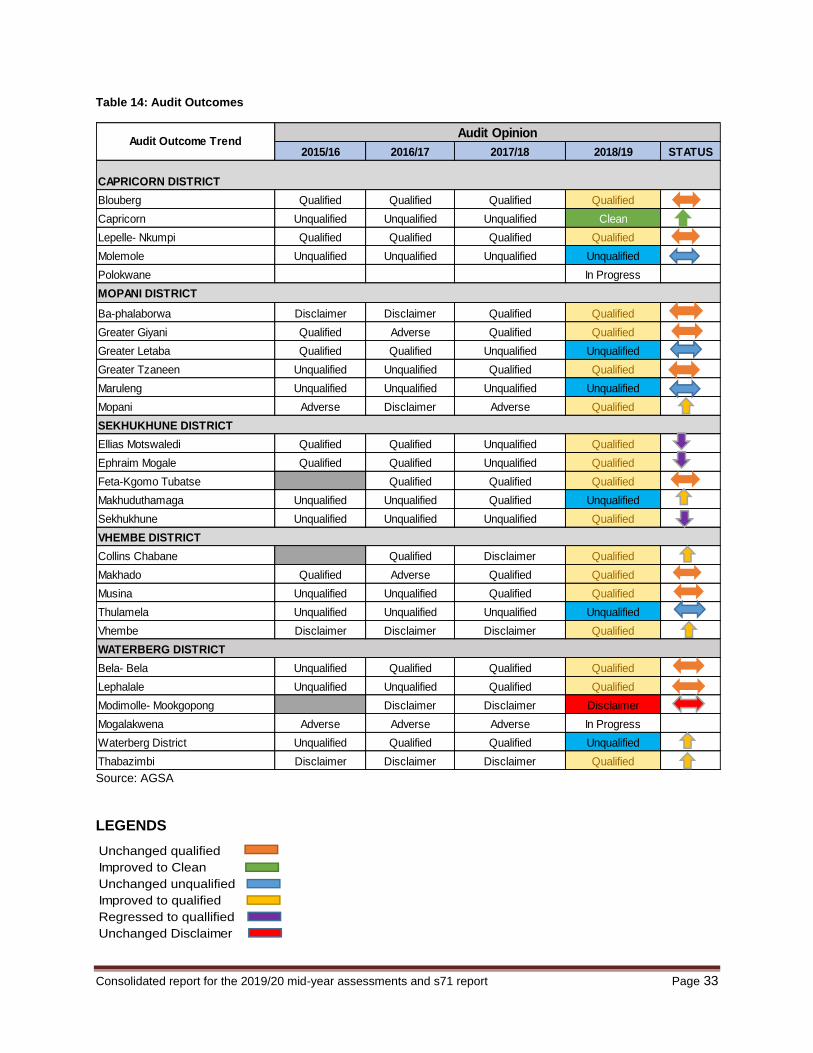
The table of audit outcomes below is showing the trend analysis which is focusing on whether a
municipality improved, regressed or stagnated.
Consolidated report for the 2019/20 mid-year assessments and s71 report Page 33
Table 14: Audit Outcomes
Source: AGSA
LEGENDS
2015/16 2016/17 2017/18 2018/19 STATUS
CAPRICORN DISTRICT
Blouberg Qualified Qualified Qualified Qualified
Capricorn Unqualified Unqualified Unqualified Clean
Lepelle- Nkumpi Qualified Qualified Qualified Qualified
Molemole Unqualified Unqualified Unqualified Unqualified
Polokwane In Progress
MOPANI DISTRICT
Ba-phalaborwa Disclaimer Disclaimer Qualified Qualified
Greater Giyani Qualified Adverse Qualified Qualified
Greater Letaba Qualified Qualified Unqualified Unqualified
Greater Tzaneen Unqualified Unqualified Qualified Qualified
Maruleng Unqualified Unqualified Unqualified Unqualified
Mopani Adverse Disclaimer Adverse Qualified
SEKHUKHUNE DISTRICT
Ellias Motswaledi Qualified Qualified Unqualified Qualified
Ephraim Mogale Qualified Qualified Unqualified Qualified
Feta-Kgomo Tubatse Qualified Qualified Qualified
Makhuduthamaga Unqualified Unqualified Qualified Unqualified
Sekhukhune Unqualified Unqualified Unqualified Qualified
VHEMBE DISTRICT
Collins Chabane Qualified Disclaimer Qualified
Makhado Qualified Adverse Qualified Qualified
Musina Unqualified Unqualified Qualified Qualified
Thulamela Unqualified Unqualified Unqualified Unqualified
Vhembe Disclaimer Disclaimer Disclaimer Qualified
WATERBERG DISTRICT
Bela- Bela Unqualified Qualified Qualified Qualified
Lephalale Unqualified Unqualified Qualified Qualified
Modimolle- Mookgopong Disclaimer Disclaimer Disclaimer
Mogalakwena Adverse Adverse Adverse In Progress
Waterberg District Unqualified Qualified Qualified Unqualified
Thabazimbi Disclaimer Disclaimer Disclaimer Qualified
Audit Outcome TrendAudit Opinion
Unchanged qualified
Improved to Clean
Unchanged unqualified
Improved to qualified
Regressed to quallified
Unchanged Disclaimer
Consolidated report for the 2019/20 mid-year assessments and s71 report Page 34
Makhuduthamaga, Waterberg District Municipality improved from qualified to unqualified with
findings. Ephraim Mogale, Elias Motsoaledi and Sekhukhune regressed from unqualified to
qualified being the only three to have regressed apart from Mogalakwena and Polokwane whose
audit opinions were still outstanding at the time of reporting date.
This has been a very uninspiring achievement which was explained by a number of municipalities
that vacant posts and lack of capacity in the budget and Treasury office as well as the blatant
disregard for SCM regulations played a big role as well as lack of coercive leadership from top
administrative management in municipalities that regressed and those that stagnated.
7.1 Monitoring Audit Action Plans
In the engagements, it was collectively reported by all municipalities have developed audit action
plans, reviewed policies, procedure manuals and plans including a system of delegations for
monitoring. The Action Plans are reviewed by Internal Audit on a weekly basis and feedback is
provided to Management on a weekly basis. Feedback to the Audit Committee is provided on a
quarterly basis. As management updates progress made in resolving the audit findings, the
Internal Audit Unit verifies the submitted evidence and make a presentation to the Executive
Management through the meetings that are held on a weekly basis. The Audit Committee reports
progress made in implementing the Audit Action Plan on a quarterly basis to Council. Though
these processes and actions are taken by municipalities, the audit opinions are not reflecting such
measures. There is therefore a need to critically interrogate whether corrective measures put in
place are effective to prevent recurrence of audit findings and new ones.
7.2 Progress on the top Ten Risks
The table below shows the top ten risks that were common among the municipalities that
presented at the mid-year engagements. A number of municipalities are at risk with a number of
risks identified like low revenue collection being the common risk affecting almost all
municipalities. Management has mechanisms of identifying and mitigating risks (existing and
emerging) and that the risk assessments are conducted during the departmental strategic
planning sessions where all employees are involved.

Consolidated report for the 2019/20 mid-year assessments and s71 report Page 35
The risk register is prepared and monitored on a quarterly basis through the risk committee and
the emerging risk register is compiled on a quarterly basis.
Table 15: Top Ten Risks
Source: Mid-year engagements
Low
rev
enue
colle
ctio
n
Non
- com
plia
nce
with
regu
latio
n m
SC
OA
regu
latio
n
Non
- com
plia
nce
with
SP
LUM
A
Non
- com
plia
nce
with
SC
M
Frau
d an
d co
rrup
tion
Unf
avou
rabl
e au
dit
opin
ion
Age
ing
infr
astr
uctu
re
Illeg
al o
ccup
atio
n an
d
land
use
Illeg
al c
onne
ctio
ns,
thef
t and
van
dalis
atio
n
Non
- com
plia
nce
with
law
s pe
rtai
ning
to
frui
tless
, was
tefu
l and
1 2 3 4 5 6 7 8 9 10
CAPRICORN DISTRICT
Blouberg Yes Yes No Yes Yes No Yes Yes No Yes
Capricorn Yes No No No No No Yes Yes No Yes
Lepelle- Nkumpi Yes Yes Yes No No No Yes Yes No No
Molemole Yes No Yes Yes No No Yes No No No
MOPANI DISTRICT
Ba-phalaborwa Yes Yes
Greater Giyani Yes No No No Yes No Yes Yes No No
Greater Letaba Yes No No Yes Yes No Yes Yes Yes Yes
Greater Tzaneen Yes Yes No Yes Yes No Yes Yes Yes Yes
Maruleng Yes No No No No No Yes Yes No No
Mopani Yes Yes
SEKHUKHUNE DISTRICT
Ellias Motswaledi Yes Yes
Ephraim Mogale Yes Yes Yes Yes Yes Yes
Feta-Kgomo Tubatse Yes Yes Yes Yes Yes No Yes Yes No Yes
Makhuduthamaga Yes No Yes Yes
Sekhukhune Yes No Yes Yes Yes Yes Yes
VHEMBE DISTRICT
Collins Chabane Yes Yes No Yes Yes No Yes No No Yes
Makhado Yes Yes Yes Yes Yes No Yes No Yes Yes
Musina Yes Yes No Yes Yes No Yes Yes Yes Yes
Thulamela Yes Yes No Yes Yes No Yes No Yes Yes
Vhembe Yes Yes No Yes Yes No Yes Yes No Yes
WATERBERG DISTRICT
Bela- Bela Yes No No Yes No No Yes Yes No Yes
Lephalale Yes Yes
Modimolle- Mookgopong Yes No No Yes No Yes Yes Yes No Yes
Mogalakwena Yes No No Yes Yes Yes Yes Yes Yes Yes
Waterberg District Yes No No Yes No No Yes No No Yes
Thabazimbi Yes Yes
Number of municipalities per risk 26 10 5 15 14 2 26 14 8 14
Top Ten Risks
Consolidated report for the 2019/20 mid-year assessments and s71 report Page 36
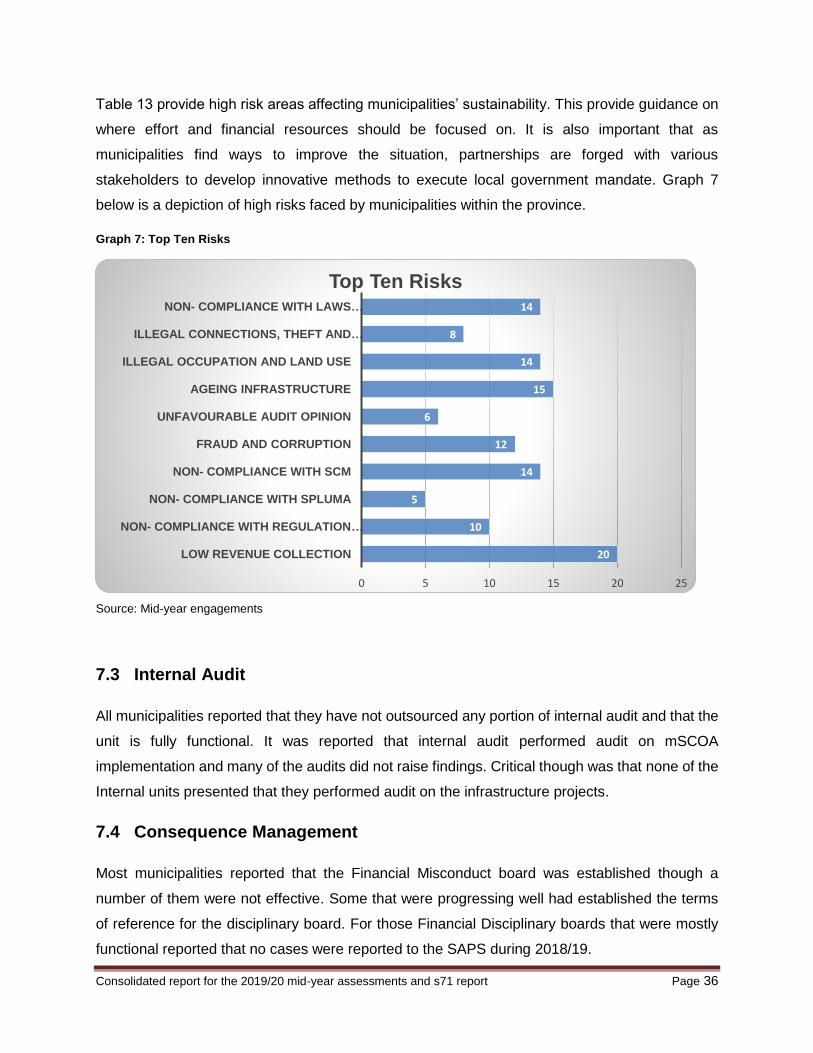
Table 13 provide high risk areas affecting municipalities’ sustainability. This provide guidance on
where effort and financial resources should be focused on. It is also important that as
municipalities find ways to improve the situation, partnerships are forged with various
stakeholders to develop innovative methods to execute local government mandate. Graph 7
below is a depiction of high risks faced by municipalities within the province.
Graph 7: Top Ten Risks
Source: Mid-year engagements
7.3 Internal Audit
All municipalities reported that they have not outsourced any portion of internal audit and that the
unit is fully functional. It was reported that internal audit performed audit on mSCOA
implementation and many of the audits did not raise findings. Critical though was that none of the
Internal units presented that they performed audit on the infrastructure projects.
7.4 Consequence Management
Most municipalities reported that the Financial Misconduct board was established though a
number of them were not effective. Some that were progressing well had established the terms
of reference for the disciplinary board. For those Financial Disciplinary boards that were mostly
functional reported that no cases were reported to the SAPS during 2018/19.
20
10
5
14
12
6
15
14
8
14
0 5 10 15 20 25
LOW REVENUE COLLECTION
NON- COMPLIANCE WITH REGULATION …
NON- COMPLIANCE WITH SPLUMA
NON- COMPLIANCE WITH SCM
FRAUD AND CORRUPTION
UNFAVOURABLE AUDIT OPINION
AGEING INFRASTRUCTURE
ILLEGAL OCCUPATION AND LAND USE
ILLEGAL CONNECTIONS, THEFT AND …
NON- COMPLIANCE WITH LAWS …
Top Ten Risks
Consolidated report for the 2019/20 mid-year assessments and s71 report Page 37
7.5 mSCOA
Significant progress has been made by municipalities to implement mSCOA. It is however noted
that there are still teething problems on implementation of this reform. LPT performed a
comparison between the Sec 71 Quarter 2 and the C Schedule for month 6 (M06) for
municipalities to test if the two sets of data compare to each other. The focus was on the schedule
C4 – Financial Performance, schedule C5 – CAPEX, schedule C6 – Financial Position & and
schedule C7 – Cash flow. We succeeded in performing an assessment on 21 of the 27
Municipalities which had C Schedules. It was generally found that municipalities are able to align
the schedule C to s71 data strings on at least second attempt. Out of the 21 verifications
performed only 4 Municipalities being Blouberg, Elias Motsoaledi, Sekhukhune and Vhembe were
found that the C Schedule aligned to the data strings of the Sec 71.
In most cases municipalities struggled with the schedule C5 and schedule C6 although
succeeding with the schedule C4 to some extent. The conclusion on this was that the C Schedule
was not generated from the core financial system, thus being generated manually. Budgets are
not locked on the core financial system as per assessments conducted on the budgets. In all
cases the budget was overridden manually, while integration from sub systems such as Pay Roll
& Assets expenditure overrode the budget figure without considering the budget amount.
Municipalities were found to be transacting against Expenditure Items with a zero amount budget.
An excellent example of all of these findings is Collins Chabane (more specific on the
overspending of Contracted Services to the amount of R27 million).
Incomplete usage of the mSCOA chart and segments during transactions are still evident and
Municipalities were alerted on this anomaly. Integration from sub system such as Pay Roll and
Asset Management remains a serious challenge and concern. Several Municipalities were alerted
during the engagement about the incomplete data strings on Employee Related Expenses and
Depreciation on Assets. These expenses might be on the sub-system but due to the lack of
integration the actuals do not appear on the core General Leger and in some cases such as
BelaBela, the municipality manually added these actual figures on the C Schedule.
The assessment highlights the challenges that municipalities are experiencing in being fully
mSCOA compliant which is contrary to the results of the presentations made by all municipalities
during the mid-year engagements. If a municipality has not achieved the level of implementation
Consolidated report for the 2019/20 mid-year assessments and s71 report Page 38
as mentioned in Circular 98, then the implementation of mSCOA in the municipality should be
accelerated. Towards this end:
A road map must be provided to Provincial Treasury to indicate how the municipality will
be become mSCOA compliant;
The municipality’s mSCOA Project Steering Committee (chaired by the Accounting
Officer) must meet at least monthly (if not more often) to track the progress against the
road map and take corrective action where required;
The Provincial Treasury (in the case of delegated municipalities) should be invited to the
mSCOA Project Steering Committee meeting; and
Progress against the road map should be presented at the Mid-Year Budget and
Performance and Budget Benchmark engagements
The following mSCOA sub-sections provide status of the following areas of focus per municipality:
Systems operations
Financial system module availability and usage
Governance structure

Consolidated report for the 2019/20 mid-year assessments and s71 report Page 39
Table 16: Systems Operations
Source: Mid-year engagements
Table 14 above indicate the state of municipalities’ usage of mSCOA and the related reporting.
Generally, most municipalities are struggling to directly generate required scheduled from the
system and linkage to the CSD. As a result more reliant is still placed on system vendors.
Financial governance (Systems
Operations)
Number of
municipalitiesMunicipality
1
Has hardware, software and licences
required to be and remain mSCOA
compliant being acquired/ upgraded? 23
All municipalities except Blouberg and Lepelle-Nkumpi
2
Is budgeting, transacting and reporting
being done on all 6 legislated mSCOA
segments and directly on the core financial
system?22
Boluberg, Molemole, Capricorn, Greater Giyani, Greater Tzaneen, Maruleng,
Mopani, Elias Motswaledi, Ephraim Mogale, Fetakgomo Tubatse,
Makhuduthamaga, Sekhukhune, Collins Chabane, Thulamela, Makhado, Musina,
Bela-Bela, Lephalale, Modimolle-Mokgophong, Mogalakwena, Thabazimbi,
Waterberg
3
Is the adopted budget locked down on the
core financial system before ORGB data
string is submitted to the LG portal?
23
Boluberg, Molemole, Capricorn, Greater Giyani, Greater Letaba, Greater
Tzaneen, Maruleng, Mopani, Elias Motswaledi, Ephraim Mogale, Fetakgomo
Tubatse, Makhuduthamaga, Sekhukhune, Collins Chabane, Thulamela,
Makhado, Musina, Bela-Bela, Lephalale, Modimolle-Mokgophong, Mogalakwena,
Thabazimbi, Waterberg
4
Is month-end closed before submitting the
monthly data strings to the LG portal?
24
Boluberg, Molemole, Capricorn, Ba-pharaborwa, Greater Giyani, Greater Letaba,
Greater Tzaneen, Maruleng, Mopani, Elias Motswaledi, Ephraim Mogale,
Fetakgomo Tubatse, Makhuduthamaga, Sekhukhune, Collins Chabane,
Thulamela, Makhado, Vhembe, Musina, Bela-Bela, Lephalale, Modimolle-
Mokgophong, Mogalakwena, Thabazimbi, Waterberg
5
Are the regulated Schedules (A, B, C)
generated directly from the core municipal
financial systems?13
Boluberg, Molemole, Greater Letaba, Maruleng, Mopani, Ephraim Mogale,
Makhuduthamaga, Sekhukhune, Collins Chabane, Musina, Bela-Bela, Lephalale,
Thabazimbi
6
Are the required data strings submitted
directly from the core financial system to the
LG Portal? 23
All municipalities except Blouberg and Lepelle-Nkumpi
7
Is the core financial system linked to CSD?
11
Capricorn, Ba-pharaborwa, Greater Giyani, Greater Letaba, Greater Tzaneen,
Mopani, Ephraim Mogale, Sekhukhune, Collins Chabane, Thulamela, Makhado,
Vhembe, Musina, Lephalale, Waterberg
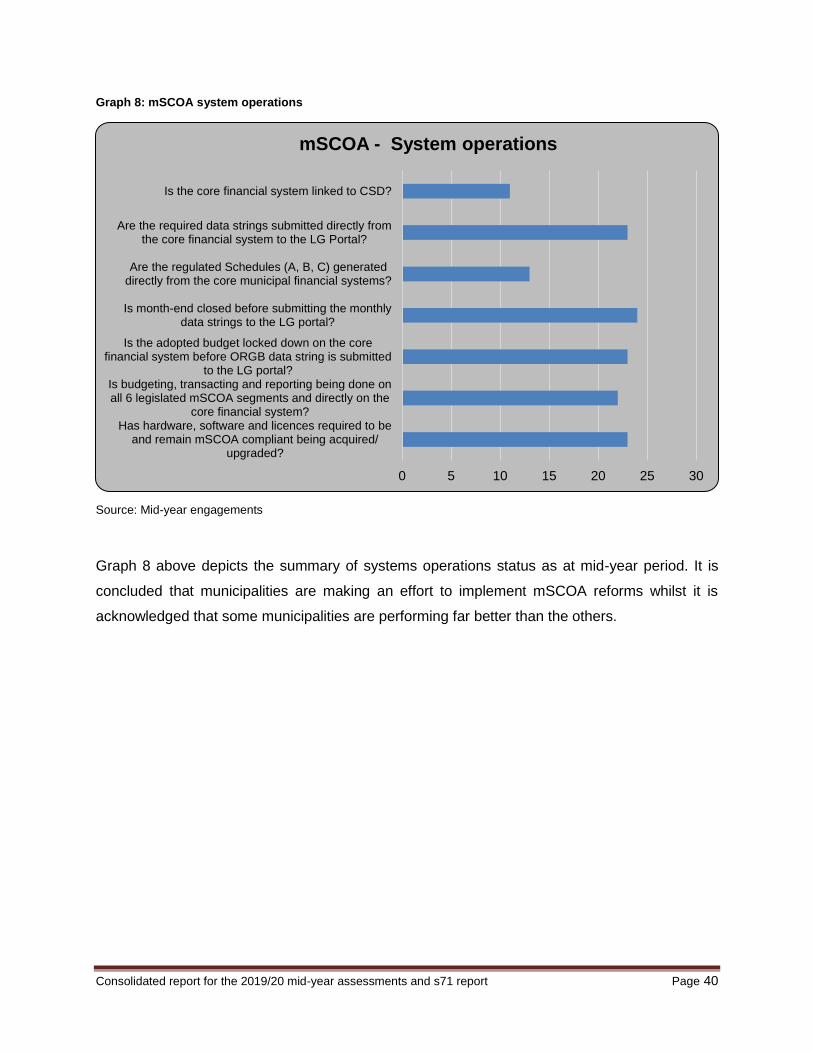
Consolidated report for the 2019/20 mid-year assessments and s71 report Page 40
Graph 8: mSCOA system operations
Source: Mid-year engagements
Graph 8 above depicts the summary of systems operations status as at mid-year period. It is
concluded that municipalities are making an effort to implement mSCOA reforms whilst it is
acknowledged that some municipalities are performing far better than the others.
0 5 10 15 20 25 30
Has hardware, software and licences required to beand remain mSCOA compliant being acquired/
upgraded?
Is budgeting, transacting and reporting being done onall 6 legislated mSCOA segments and directly on the
core financial system?
Is the adopted budget locked down on the corefinancial system before ORGB data string is submitted
to the LG portal?
Is month-end closed before submitting the monthlydata strings to the LG portal?
Are the regulated Schedules (A, B, C) generateddirectly from the core municipal financial systems?
Are the required data strings submitted directly fromthe core financial system to the LG Portal?
Is the core financial system linked to CSD?
mSCOA - System operations

Consolidated report for the 2019/20 mid-year assessments and s71 report Page 41
Table 17: Module availability and usage
Source: Mid-year engagements
Number of
municipalities Municipalities
Number of
municipalities Municipalities
IDP (Projects)
24
Capricorn, Ba-phalaborwa, Greater Giyani,
Greater Letaba, Greater Tzaneen, Maruleng,
Mopani, Elias Motsoaledi, Ephraim Mogale,
Fetakgomo-Tubatse, Makhuduthamaga,
Sekhukhune, Collins Chabane, Makhado,
Musina, Thulamela, Vhembe, Bela-Bela,
Lephalale, Modimolle-Mokgopoong,
Mogalakwena, Waterberg Thabazimbi 19
Blouberg, Capricorn, Molemole, Greater Giyani,
Gretaer Tzaneen, Maruleng, Mopani, Elias
Motsoaledi, Ephraim Mogale, Fetakgomo-
Tubatse, Makhuduthamaga, Sekhukhune,
Makhado, Musina, Vhembe, Bela-Bela,
Lephalale, Modimolle-Mokgopoong, Waterberg,
Thabazimbi
Budget management
24
Blouberg, Capricorn, Molemole, Ba-phalaborwa,
Greater Giyani, Greater Letaba, Greater
Tzaneen, Maruleng, Mopani, Elias Motsoaledi,
Ephraim Mogale, Fetakgomo-Tubatse,
Makhuduthamaga, Sekhukhune, Collins
Chabane, Makhado, Musina, Thulamela, Bela-
Bela Lephalale, Modimole-Mokgopoong,
Mogalakwena, Waterberg, Thabazimbi
20
Blouberg, Capricorn, Molemole,Greater Giyani,
Gretaer Tzaneen, Maruleng, Mopani, Elias
Motsoaledi, Ephraim Mogale, Fetakgomo-
Tubatse, Makhuduthamaga, Sekhukhune, Collins
Chabane, Makhado, Musina, Vhembe, Bela-Bela,
Lephalale, Modimolle-Mokgopoong, Waterberg,
Thabazimbi
SCM
23
Blouberg, Capricorn, Molemole, Ba-phalaborwa,
Greater Giyani, Greater Letaba, Greater
Tzaneen, Maruleng, Mopani, Elias Motsoaledi,
Ephraim Mogale, Fetakgomo-Tubatse,
Makhuduthamaga, Sekhukhune, Collins
Chabane, Makhado, Musina, Thulamela, Bela-
Bela Lephalale, Waterberb, Thabazimbi
20
Capricorn, Molemole, Ba-phalaborwa, Greater
Giyani, Greater Tzaneen, Maruleng, Mopani,
Elias Motsoaledi, Ephraim Mogale, Fetakgomo-
Tubatse, Makhuduthamaga, Sekhukhune, Collins
Chabane, Makhado, Musina, Thulamela,
Vhembe, Bela-Bela, Lephalale, Waterberg
Billing and
Receipting
22
Blouberg, Molemole, Ba-phalaborwa, Greater
Letaba, Greater Tzaneen, Maruleng, Mopani,
Elias Motsoaledi, Ephraim Mogale, Fetakgomo-
Tubatse, Makhuduthamaga, Sekhukhune, Collins
Chabane, Makhado, Musina, Thulamela,
Vhembe, Bela-Bela, Lephalale, Mogalakwena,
Waterberg, Thabazimbi 20
Blouberg, Molemole, Ba-phalaborwa, Greater
Tzaneen, Maruleng, Mopani, Elias Motsoaledi,
Ephraim Mogale, Fetakgomo-Tubatse,
Makhuduthamaga, Sekhukhune, Collins
Chabane, Makhado, Musina, Thulamela,
Vhembe, Bela-Bela, Mogalakwena, Waterberg,
Thabazimbi
General Ledger
23
Blouberg, Capricorn, Molemole, Ba-phalaborwa,
Greater Giyani, Greater Letaba, Greater
Tzaneen, Maruleng, Elias Motsoaledi, Ephraim
Mogale, Fetakgomo-Tubatse, Makhuduthamaga,
Sekhukhune, Collins Chabane, Makhado,
Musina, Thulamela, Vhembe, Bela-Bela,
Lephalale, Mogalakwena, Waterberg, Thabazimbi
22
Blouberg, Capricorn, Molemole, Ba-phalaborwa,
Greater Giyani, Greater Tzaneen, Maruleng, Elias
Motsoaledi, Ephraim Mogale, Fetakgomo-
Tubatse, Makhuduthamaga, Sekhukhune, Collins
Chabane, Makhado, Musina, Thulamela,
Vhembe, Bela-Bela, Lephalale, Mogalakwena,
Waterberg, Thabazimbi
Inventory 17
Blouberg, Capricorn, Greater Tzaneen,
Maruleng, Elias Motsoaledi, Fetakgomo-Tubatse,
Makhuduthamaga, Sekhukhune, Collins
Chabane, Makhado, Musina, Thulamela,
Vhembe, Lephalale, Mogalakwena, Waterberg,
Thabazimbi
13
Capricorn, Elias Motsoaledi, Fetakgomo-Tubatse,
Makhuduthamaga, Sekhukhune, Collins
Chabane, Makhado, Musina, Thulamela,
Vhembe, Lephalale, Mogalakwena, Thabazimbi
Asset Mgt 16
Blouberg, Molemole, Greater Giyani, Greater
Tzaneen, Maruleng, Mopani, Elias Motsoaledi,
Fetakgomo-Tubatse, Makhuduthamaga,
Sekhukhune, Collins Chabane, Musina,
Thulamela, Lephalale, Waterberg, Thabazimbi
9
Molemole, Greater Giyani, Mopani, Fetakgomo-
Tubatse, Makhuduthamaga, Sekhukhune, Collins
Chabane, Thulamela, Waterberg
Payroll 7Blouberg, Capricorn, Greater Tzaneen,
Makhado, Vhembe, Mogalakwena, Thabazimbi7
Capricorn, Greater Tzaneen, Elias Motsoaledi,
Makhado, Vhembe, Mogalakwena, Thabazimbi
Creditors 24
Blouberg, Capricorn, Molemole, Ba-phalaborwa,
Greater Giyani, Greater Letaba, Greater
Tzaneen, Maruleng, Mopani, Elias Motsoaledi,
Ephraim Mogale, Fetakgomo-Tubatse,
Makhuduthamaga, Sekhukhune, Collins
Chabane, Makhado, Musina, Thulamela,
Vhembe, Bela-Bela Lephalale, Mogalakwena,
Waterberg, Thabazimbi
22
Blouberg, Capricorn, Molemole, Greater Giyani,
Greater Letaba, Greater Tzaneen, Maruleng,
Mopani, Elias Motsoaledi, Ephraim Mogale,
Fetakgomo-Tubatse, Makhuduthamaga,
Sekhukhune, Collins Chabane, Makhado,
Musina, Thulamela, Vhembe, Bela-Bela
Lephalale, Mogalakwena, Waterberg, Thabazimbi
Module availability
Core System
Module usage
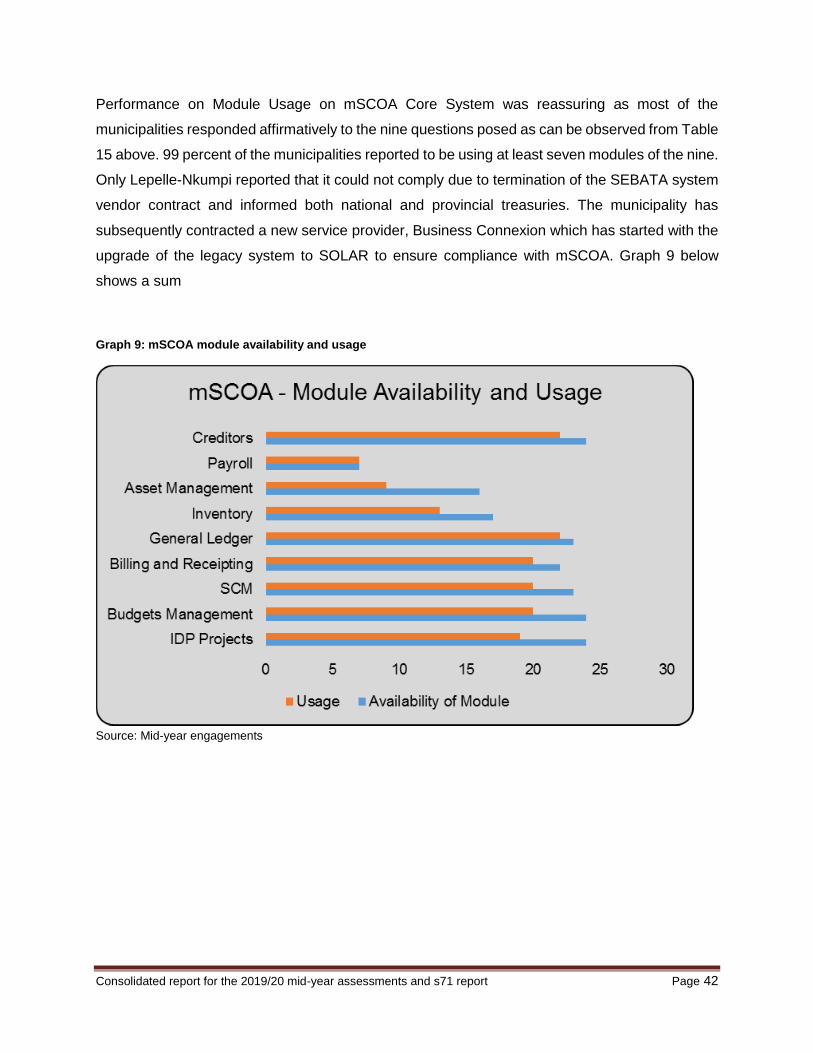
Consolidated report for the 2019/20 mid-year assessments and s71 report Page 42
Performance on Module Usage on mSCOA Core System was reassuring as most of the
municipalities responded affirmatively to the nine questions posed as can be observed from Table
15 above. 99 percent of the municipalities reported to be using at least seven modules of the nine.
Only Lepelle-Nkumpi reported that it could not comply due to termination of the SEBATA system
vendor contract and informed both national and provincial treasuries. The municipality has
subsequently contracted a new service provider, Business Connexion which has started with the
upgrade of the legacy system to SOLAR to ensure compliance with mSCOA. Graph 9 below
shows a sum
Graph 9: mSCOA module availability and usage
Source: Mid-year engagements

Consolidated report for the 2019/20 mid-year assessments and s71 report Page 43
Table 18: mSCOA governance structure
Source: Mid-year engagements
This section of the mSCOA implementation looks at the planning and management of the process.
The successful and effective implementation of the mSCOA is largely dependent on this process.
It is therefore imperative that a municipality should already have done the following by this time
regarding the Project steering committee, the project management team and the management of
the mSCOA as whole for the successful implementation of mSCOA. Project governance ensures
that mSCOA project is done well and includes policies, regulations, functions, processes,
procedures and responsibilities that generally should define the establishment, management and
control of projects. In this regard the municipality’s mSCOA steering committee play an important
role in executing project governance. During the engagements it was shown that most
municipalities are on track towards the implementation of the mSCOA project as can be seen
from the tabled results below. Lepelle-Nkumpi is the only municipality still lagging behind in the
implementation of the mSCOA. A summary of governance structure status is shown in Graph 10
below:
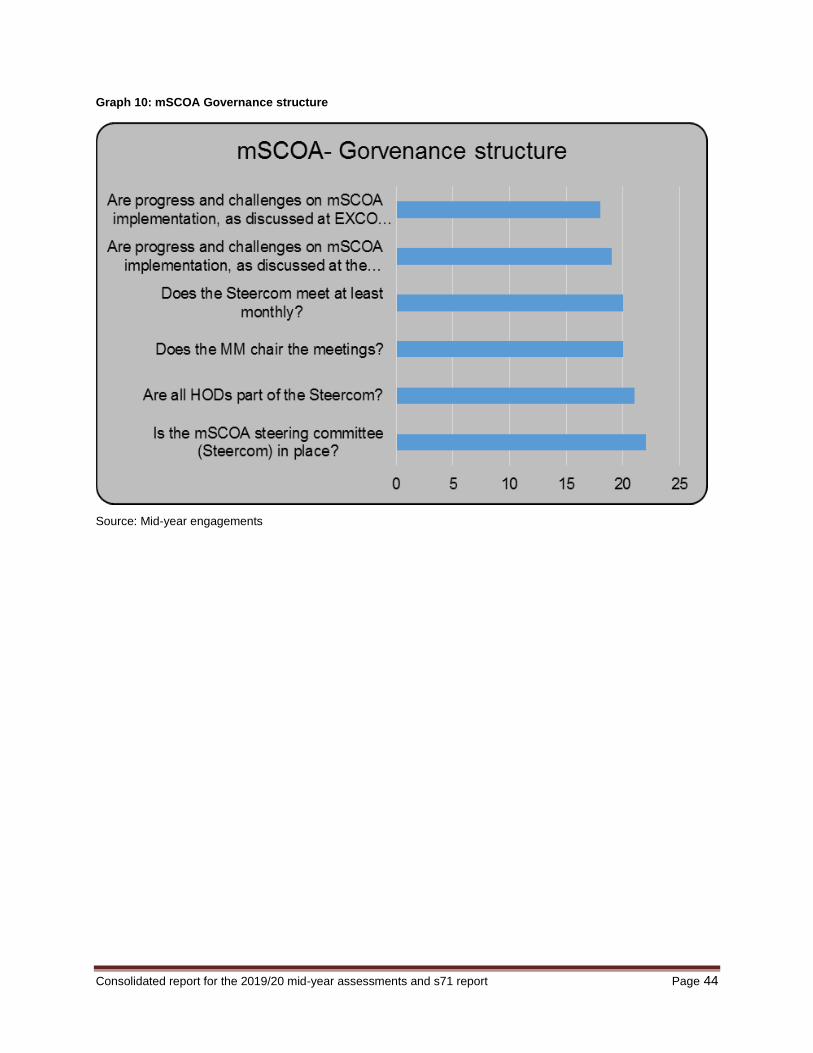
Consolidated report for the 2019/20 mid-year assessments and s71 report Page 44
Graph 10: mSCOA Governance structure
Source: Mid-year engagements

Consolidated report for the 2019/20 mid-year assessments and s71 report Page 45
8 Service Delivery Performance
8.1 Service Delivery Performance
Municipalities have the responsibility to ensure that all citizens are provided with services to
satisfy their basic needs. This has put greater pressure on municipalities to deliver on their
mandates and to ensure effective service delivery. The historical backlogs in the provision of basic
infrastructure for service delivery require that municipalities establish a delicate balance between
delivering and improving current services, maintaining existing infrastructure and extending the
infrastructure to eradicate service delivery backlogs. During the mid-year performance
engagements, most municipalities reported performance above 50% of the seven standard Key
performance Areas. Mogalakwena was the only municipality to have performed below 50%
achieving only an average of 48% across the board. Performance on KPAs is an indicator of how
a municipality being the closest to communities is tasked primarily with developing and
implementing sustainable ways that meets community needs to improve the quality of their lives
with the provision of basic services, i.e. water, electricity, sanitation and solid waste. Municipalities
are at the forefront of attempts to achieve high levels of service delivery. Service delivery has
assumed centre stage across the country, due to highly publicised protests within various
communities.
8.2 Service Delivery Backlogs
During the engagements municipalities presented that service delivery backlogs varied from one
Municipality to another. Municipalities have backlogs in different locations in the municipal area,
especially in farms and privately owned lands. It was reported that while much has been achieved
in the rollout of municipal infrastructure over the period, significant work remains to be done, both
to eradicate backlogs in access to services and to ensure that services are properly operated and
maintained over the long-term. The eradication of service delivery backlogs is a continuous
struggle for municipalities. This is exacerbated by the migration patterns and the influx of people
into major towns seeking a better life.
This has a direct impact on the delivery of services and the escalating costs of service provision,
infrastructure development and maintenance. The increasing number of backyard dwellers,
informal settlements, lack of rain and ground water and high electricity costs are some of the
challenges with which municipalities are faced.

Consolidated report for the 2019/20 mid-year assessments and s71 report Page 46
8.3 Provision of Free Basic Services
In an attempt to address the plight of the poor and ensure that all citizens have access to basic
services, the Free Basic Services Programme was created. The intention was to provide free
access to basic services in the fight against poverty. It requires that municipalities adopt indigent
policies and draw up registers of indigent households that are within their jurisdiction in order to
provide free basic services to those people who had been registered as indigent. For those
citizens who are unable to afford basic services, a social package has been put in place for all
municipalities’ country wide, which provides indigent households with free basic services, which
includes 6KL of water, 50 kWh of electricity, free sanitation and a weekly refuse removal.
Municipalities presented that they continued to provide free basic services to registered indigent
households within their areas during the 2019/20 mid-year. None of the municipalities reported
that it provided services over and above the stipulated standards in their policies. Mogalakwena
was the only municipality which reported providing 6kl free basic water across the board and not
only to registered indigents.
8.4 Critical Challenges Affecting Sustainability
Provincial Treasury assessed mid-year performance for municipalities. The review focused on,
amongst other things, the annual report outcome and key achievements for the previous year,
the current year performance as measured against priorities in the Integrated Development Plan
(IDP) and the targets set in the Service Delivery Budget Implementation Plan (SDBIP). During the
assessment a number of emerging challenging and existing trends, in particular with regard to
poor delivery of services to the communities, were identified. The trends are analysed in the
consolidated Provincial graphical detail below.

Consolidated report for the 2019/20 mid-year assessments and s71 report Page 47
Graph 11: Sustainability challenges at a provincial level
Source: Mid-year engagements
The graphical analysis reflects that the most common challenges were in the category “Other”
which included areas such as Low level revenue collection caused by dysfunctional or
infrastructure operating below capacity, Basic Service Backlogs (Water, Waste, and Electricity)
The next common critical issues were Governance, comprising of the increasing irregular,
Fruitless and Wasteful expenditure threatening the integrity of the financial governance,
enforcement of municipal by-laws, and high vacancy rate at top management, Poor contract
Management and Overreliance on consultants.
Waterberg district municipalities highlighted all issues as challenges they are facing in detail as
can be seen from the graph. The appetite to reflect challenges can be seen in Vhembe, Mopani,
Capricorn and lastly Sekhukhune districts. It was noted that all municipalities that were engaged
with during the mid-year engagements have revenue collection challenges which comprises the
greater part of the component other in the critical issues on the graph. The major causes of
revenue collections are multi-pronged, and include dysfunctional infrastructure or infrastructure
that is operating far less than optimal which results in both poor service delivery, and absence of
critical information required for both billing and planning purposes. Poor or non-existent land use
management which result in poor or non-existence of critical land information for billing purposes.
Poor or non-existent customer management and inadequate investment in the internal business
0 2 4 6 8 10 12 14 16 18 20
water and sanitation
refuse (including land fill sites)
Roads
property rates (including land issues)
infrastructure delivery
Conditional grants
Governance
Political
Electricity
Other
Critical issues - Province
Waterberg Vhembe Sekhukhune Mopani Capricorn
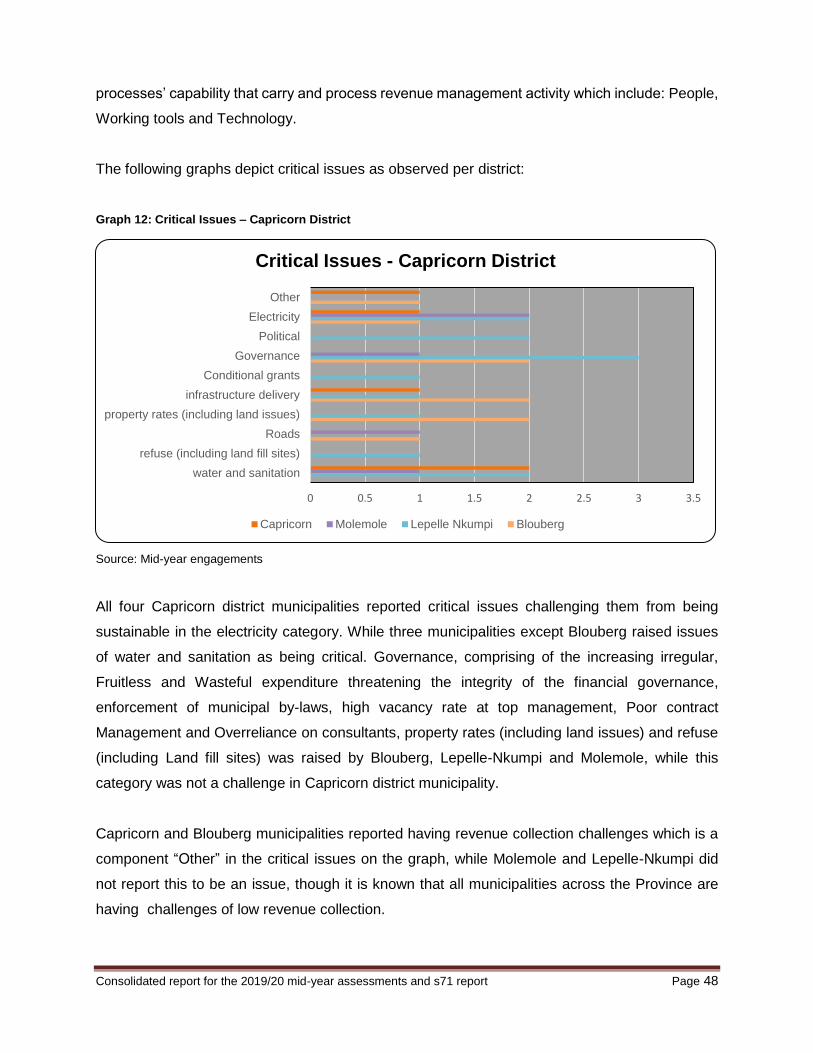
Consolidated report for the 2019/20 mid-year assessments and s71 report Page 48
processes’ capability that carry and process revenue management activity which include: People,
Working tools and Technology.
The following graphs depict critical issues as observed per district:
Graph 12: Critical Issues – Capricorn District
Source: Mid-year engagements
All four Capricorn district municipalities reported critical issues challenging them from being
sustainable in the electricity category. While three municipalities except Blouberg raised issues
of water and sanitation as being critical. Governance, comprising of the increasing irregular,
Fruitless and Wasteful expenditure threatening the integrity of the financial governance,
enforcement of municipal by-laws, high vacancy rate at top management, Poor contract
Management and Overreliance on consultants, property rates (including land issues) and refuse
(including Land fill sites) was raised by Blouberg, Lepelle-Nkumpi and Molemole, while this
category was not a challenge in Capricorn district municipality.
Capricorn and Blouberg municipalities reported having revenue collection challenges which is a
component “Other” in the critical issues on the graph, while Molemole and Lepelle-Nkumpi did
not report this to be an issue, though it is known that all municipalities across the Province are
having challenges of low revenue collection.
0 0.5 1 1.5 2 2.5 3 3.5
water and sanitation
refuse (including land fill sites)
Roads
property rates (including land issues)
infrastructure delivery
Conditional grants
Governance
Political
Electricity
Other
Critical Issues - Capricorn District
Capricorn Molemole Lepelle Nkumpi Blouberg
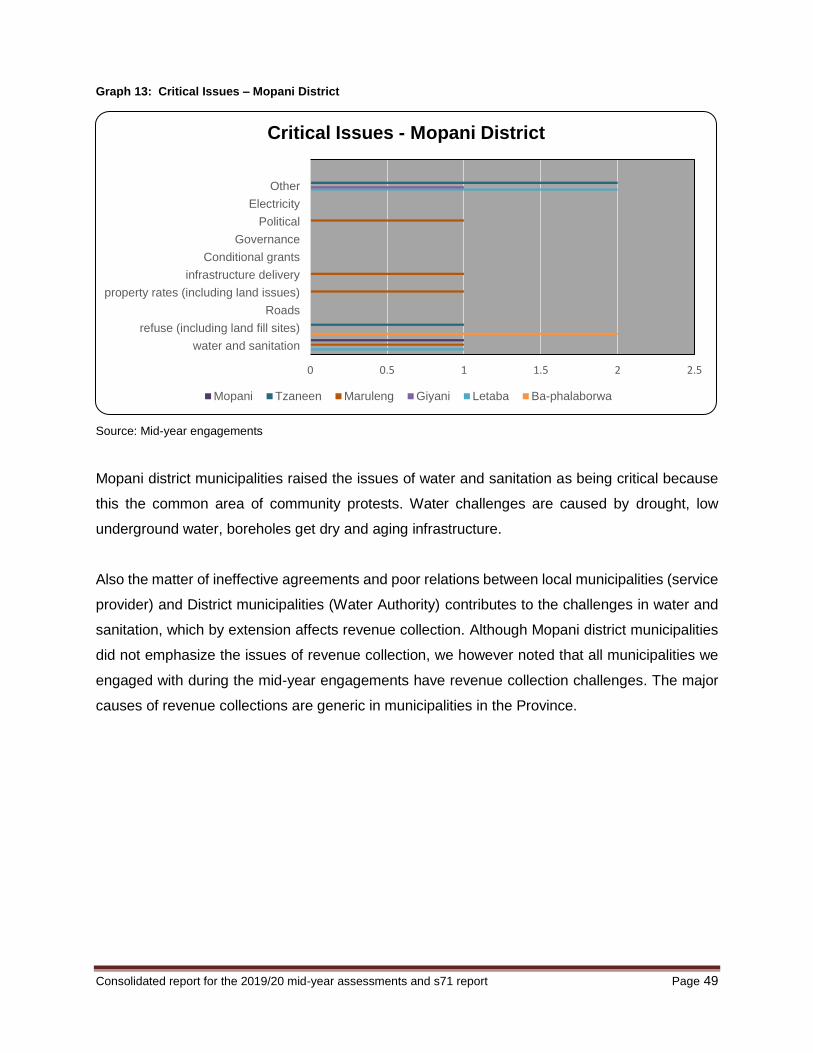
Consolidated report for the 2019/20 mid-year assessments and s71 report Page 49
Graph 13: Critical Issues – Mopani District
Source: Mid-year engagements
Mopani district municipalities raised the issues of water and sanitation as being critical because
this the common area of community protests. Water challenges are caused by drought, low
underground water, boreholes get dry and aging infrastructure.
Also the matter of ineffective agreements and poor relations between local municipalities (service
provider) and District municipalities (Water Authority) contributes to the challenges in water and
sanitation, which by extension affects revenue collection. Although Mopani district municipalities
did not emphasize the issues of revenue collection, we however noted that all municipalities we
engaged with during the mid-year engagements have revenue collection challenges. The major
causes of revenue collections are generic in municipalities in the Province.
0 0.5 1 1.5 2 2.5
water and sanitation
refuse (including land fill sites)
Roads
property rates (including land issues)
infrastructure delivery
Conditional grants
Governance
Political
Electricity
Other
Critical Issues - Mopani District
Mopani Tzaneen Maruleng Giyani Letaba Ba-phalaborwa
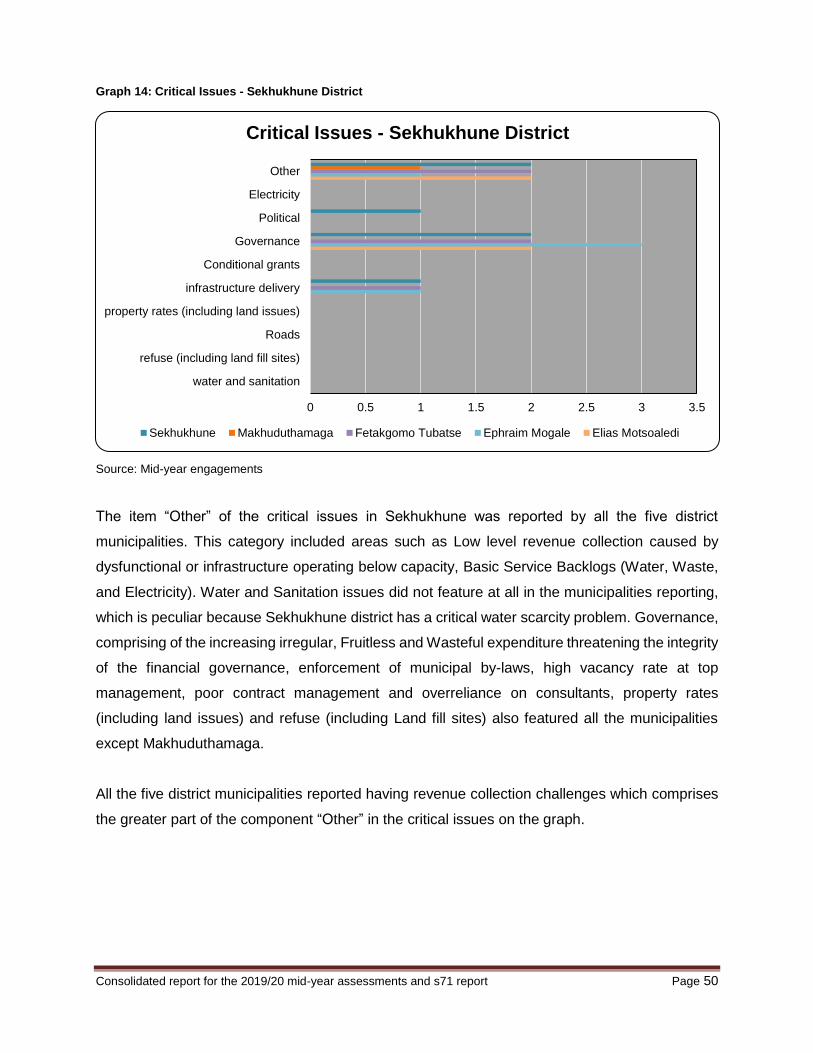
Consolidated report for the 2019/20 mid-year assessments and s71 report Page 50
Graph 14: Critical Issues - Sekhukhune District
Source: Mid-year engagements
The item “Other” of the critical issues in Sekhukhune was reported by all the five district
municipalities. This category included areas such as Low level revenue collection caused by
dysfunctional or infrastructure operating below capacity, Basic Service Backlogs (Water, Waste,
and Electricity). Water and Sanitation issues did not feature at all in the municipalities reporting,
which is peculiar because Sekhukhune district has a critical water scarcity problem. Governance,
comprising of the increasing irregular, Fruitless and Wasteful expenditure threatening the integrity
of the financial governance, enforcement of municipal by-laws, high vacancy rate at top
management, poor contract management and overreliance on consultants, property rates
(including land issues) and refuse (including Land fill sites) also featured all the municipalities
except Makhuduthamaga.
All the five district municipalities reported having revenue collection challenges which comprises
the greater part of the component “Other” in the critical issues on the graph.
0 0.5 1 1.5 2 2.5 3 3.5
water and sanitation
refuse (including land fill sites)
Roads
property rates (including land issues)
infrastructure delivery
Conditional grants
Governance
Political
Electricity
Other
Critical Issues - Sekhukhune District
Sekhukhune Makhuduthamaga Fetakgomo Tubatse Ephraim Mogale Elias Motsoaledi
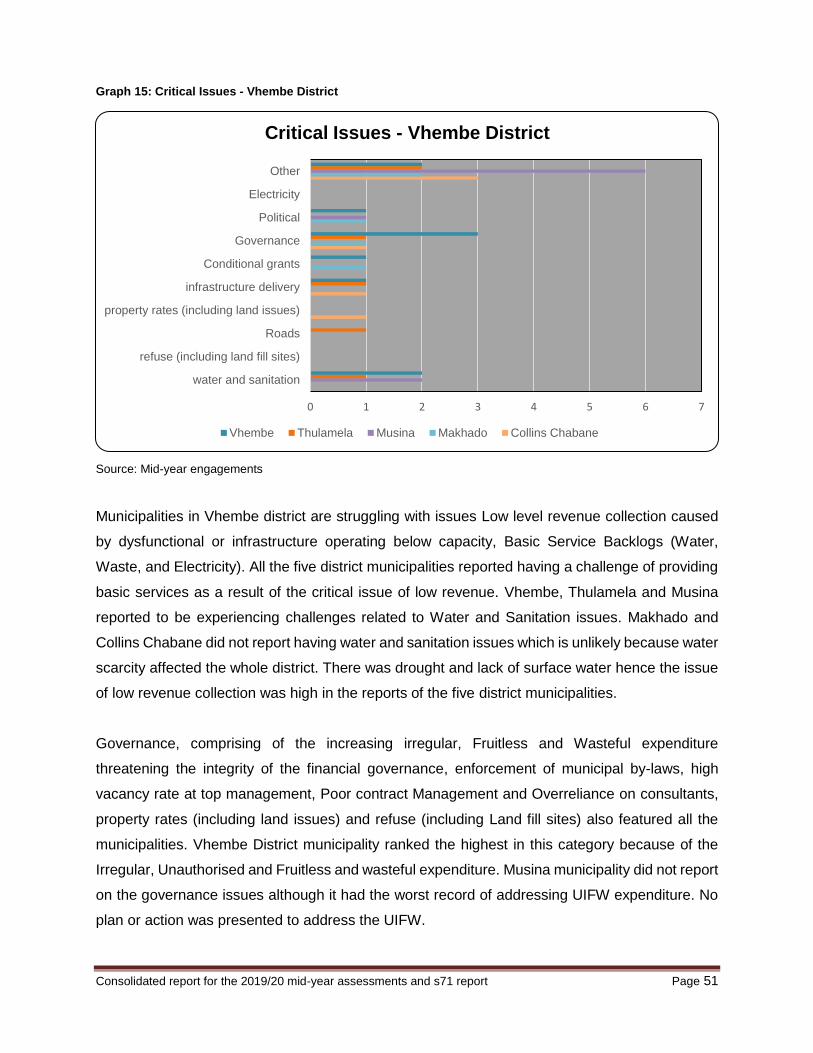
Consolidated report for the 2019/20 mid-year assessments and s71 report Page 51
Graph 15: Critical Issues - Vhembe District
Source: Mid-year engagements
Municipalities in Vhembe district are struggling with issues Low level revenue collection caused
by dysfunctional or infrastructure operating below capacity, Basic Service Backlogs (Water,
Waste, and Electricity). All the five district municipalities reported having a challenge of providing
basic services as a result of the critical issue of low revenue. Vhembe, Thulamela and Musina
reported to be experiencing challenges related to Water and Sanitation issues. Makhado and
Collins Chabane did not report having water and sanitation issues which is unlikely because water
scarcity affected the whole district. There was drought and lack of surface water hence the issue
of low revenue collection was high in the reports of the five district municipalities.
Governance, comprising of the increasing irregular, Fruitless and Wasteful expenditure
threatening the integrity of the financial governance, enforcement of municipal by-laws, high
vacancy rate at top management, Poor contract Management and Overreliance on consultants,
property rates (including land issues) and refuse (including Land fill sites) also featured all the
municipalities. Vhembe District municipality ranked the highest in this category because of the
Irregular, Unauthorised and Fruitless and wasteful expenditure. Musina municipality did not report
on the governance issues although it had the worst record of addressing UIFW expenditure. No
plan or action was presented to address the UIFW.
0 1 2 3 4 5 6 7
water and sanitation
refuse (including land fill sites)
Roads
property rates (including land issues)
infrastructure delivery
Conditional grants
Governance
Political
Electricity
Other
Critical Issues - Vhembe District
Vhembe Thulamela Musina Makhado Collins Chabane
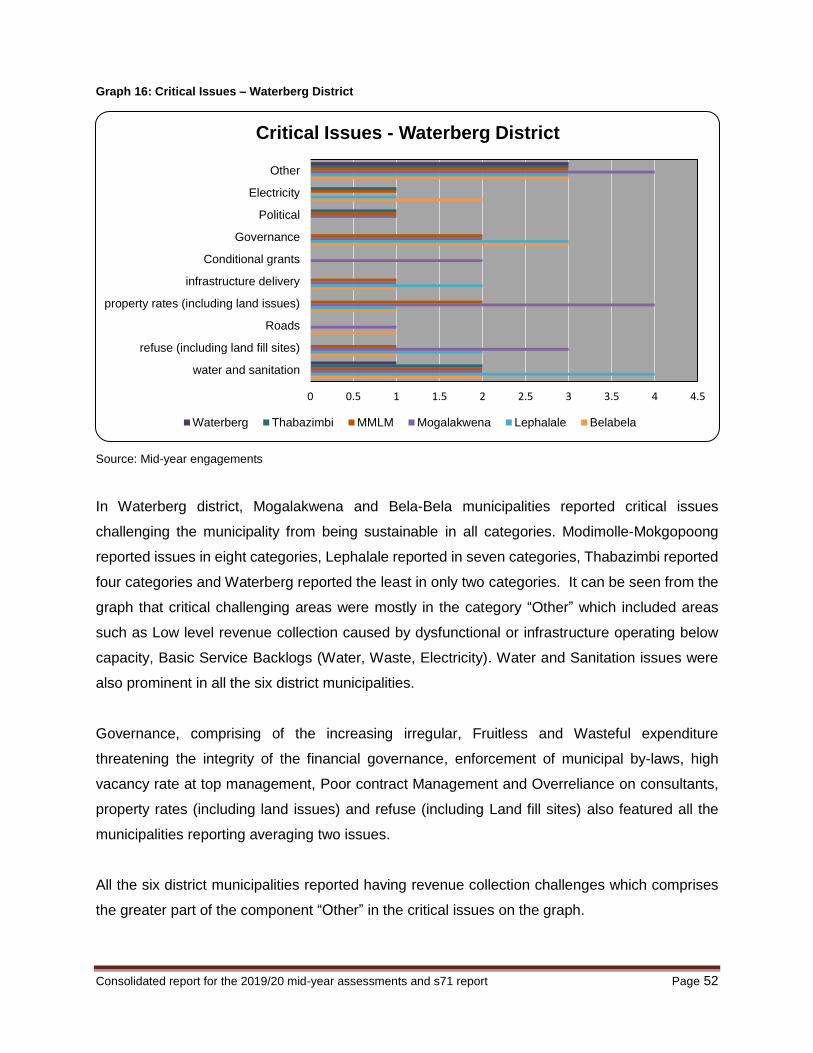
Consolidated report for the 2019/20 mid-year assessments and s71 report Page 52
Graph 16: Critical Issues – Waterberg District
Source: Mid-year engagements
In Waterberg district, Mogalakwena and Bela-Bela municipalities reported critical issues
challenging the municipality from being sustainable in all categories. Modimolle-Mokgopoong
reported issues in eight categories, Lephalale reported in seven categories, Thabazimbi reported
four categories and Waterberg reported the least in only two categories. It can be seen from the
graph that critical challenging areas were mostly in the category “Other” which included areas
such as Low level revenue collection caused by dysfunctional or infrastructure operating below
capacity, Basic Service Backlogs (Water, Waste, Electricity). Water and Sanitation issues were
also prominent in all the six district municipalities.
Governance, comprising of the increasing irregular, Fruitless and Wasteful expenditure
threatening the integrity of the financial governance, enforcement of municipal by-laws, high
vacancy rate at top management, Poor contract Management and Overreliance on consultants,
property rates (including land issues) and refuse (including Land fill sites) also featured all the
municipalities reporting averaging two issues.
All the six district municipalities reported having revenue collection challenges which comprises
the greater part of the component “Other” in the critical issues on the graph.
0 0.5 1 1.5 2 2.5 3 3.5 4 4.5
water and sanitation
refuse (including land fill sites)
Roads
property rates (including land issues)
infrastructure delivery
Conditional grants
Governance
Political
Electricity
Other
Critical Issues - Waterberg District
Waterberg Thabazimbi MMLM Mogalakwena Lephalale Belabela
Consolidated report for the 2019/20 mid-year assessments and s71 report Page 53
9 Summary and Conclusion
Generally, there was an improvement in municipalities’ response to the mid-year engagement
sessions. This assessment report comprises the progress and accomplishments of Limpopo
municipalities as per the 2019/20 mid-year assessment. It also served to examine the
advancements made in meeting the needs of communities and enhancing the functioning of
municipalities.
Municipal achievements for the period under review included:
• Political and administrative governance in municipalities in the Province was predominantly
stable; however, the Provincial Executive had to intervene in ‘Mogalakwena by approving a sec
139 (1) (b) intervention.
• Of the 157 senior management positions, 119 posts were filled while 38 positions were vacant
A key priority for the municipalities is the eradication of poverty. In line with this, the priority was
placed on the delivery of services to the communities. Basic services (water, electricity, sanitation
and refuse removal) are provided by all municipalities. For the period under review, free service
delivery was available to all households as per respective municipality’s indigent register.
Provincial Treasury identified good governance as a key priority to improve effective functionality
of municipalities. The Auditor General's Report for 2019/20 reflected that there were
improvements in some of the Municipalities’ audit outcomes. Capricorn municipality is the only
municipality that received an unqualified audit opinion “clean audit” in the province. Six
municipalities received unqualified audits with findings down from 8 in the previous year. Only
Modimolle-Mokgopong received a disclaimer compared to four municipalities in the previous year.
Mogalakwena and Polokwane audits were still in progress at the time of reporting date. There
was relative improvement in the implementation of mSCOA.
At the most basic level, municipalities are expected to:
a) Put people and their concerns first and ensure constant and effective service to communities
b) Create conditions for decent living by consistently delivering municipal services to the right
quality and standard. This includes planning for and delivery of infrastructure and amenities,

Consolidated report for the 2019/20 mid-year assessments and s71 report Page 54
maintenance and upkeep, including the budgeting to do this. Significantly reduce failures in
services and, where there are, restore with urgency.
c) Be well-governed and demonstrate good governance and administration – cut wastage, spend
public funds prudently, hire competent staff, ensure transparency and accountability.
d) Ensure sound financial management and accounting, and prudently manage resources so as
to sustainably deliver services and bring development to communities.
e) Build and maintain sound institutional and administrative capabilities administered and
managed by dedicated and skilled personnel at all levels.
This can be achieved through astute attention to the risks and critical areas identified in this
document.
Provincial Treasury and CoGHSTA have an important role to play in ensuring well-functioning
municipalities. The departments is committed to intensify monitoring and support to municipalities
and where there is evidence of dysfunctionality, assistance will be provided in developing a
Financial Recovery Plan. Existing structures like Premier, Mayor Intergovernmental Forum, MECs
and Mayor Technical Forums and HoDs and Municipal Managers will also be used to monitor and
review progress of municipalities.
10 Recommendations
That:
1. The report regarding the 2019/20 Mid-Year Performance and Budget assessment and s71
of the Limpopo Municipalities, be noted.
2. The Legislature to take note of the importance of collaboration between Provincial Treasury
and the Department of Cooperative Governance (DCoG) in relation to oversight and
enforcement of compliance tools and the back to basics programme to improve municipal
sustainability.

Consolidated report for the 2019/20 mid-year assessments and s71 report Page 55
The figure below shows, the back to basics approach based on five pillars which sets clear
benchmarks of municipal performance, namely:
3. The Legislature take note on the sound financial management and accounting pillar, the
game changers which intends to focus on initiatives by provincial treasuries in enhancing
support to municipalities. These are matters of importance to municipalities across the
country and are central to negative audit findings. The diagram below depicts the six game
changers and the nature of support each provides to municipalities.
Put people and their concerns first – listen & communicate
Deliver municipal
services to the right quality and standard
Good governance and
sound administration
Sound financial management
and accounting
Building institution and administrative
capabilities
1 2 3 4 5
Consolidated report for the 2019/20 mid-year assessments and s71 report Page 56
4. The Legislature to utilize the 2019/20 Mid-Year Performance and Budget assessment and
s71 of the Limpopo Municipalities, as a basis for future engagements with municipalities
with specific emphasis on struggling municipalities like Mogalakwena, Modimolle-
Mookgophong, Sekhukhune, Musina,and Mopani.
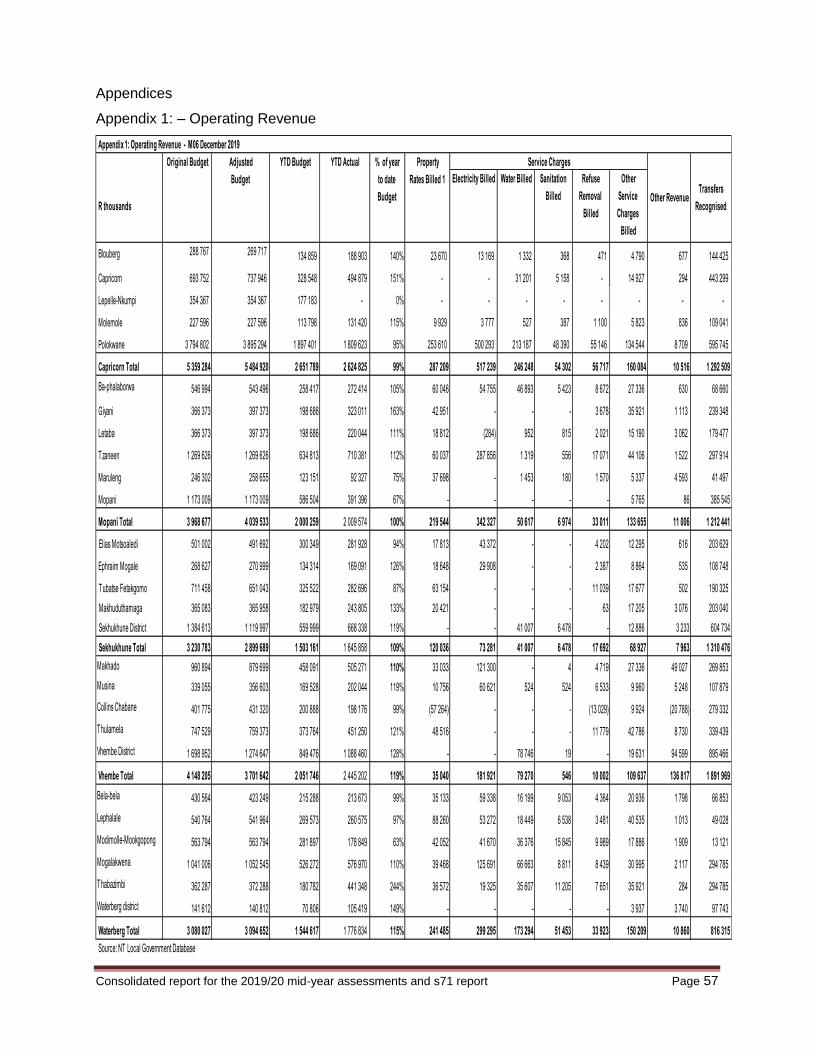
Consolidated report for the 2019/20 mid-year assessments and s71 report Page 57
Appendices
Appendix 1: – Operating Revenue
R thousands
Electricity Billed Water Billed Sanitation
Billed
Refuse
Removal
Billed
Other
Service
Charges
Billed
Blouberg 288 767 269 717 134 859 188 903 140% 23 670 13 169 1 332 368 471 4 790 677 144 425
Capricorn 693 752 737 946 328 548 494 879 151% - - 31 201 5 158 - 14 927 294 443 299
Lepelle-Nkumpi 354 367 354 367 177 183 - 0% - - - - - - - -
Molemole 227 596 227 596 113 798 131 420 115% 9 929 3 777 527 387 1 100 5 823 836 109 041
Polokwane 3 794 802 3 895 294 1 897 401 1 809 623 95% 253 610 500 293 213 187 48 390 55 146 134 544 8 709 595 745
Capricorn Total 5 359 284 5 484 920 2 651 789 2 624 825 99% 287 209 517 239 246 248 54 302 56 717 160 084 10 516 1 292 509
Ba-phalaborwa 546 994 543 496 258 417 272 414 105% 60 046 54 755 46 893 5 423 8 672 27 336 630 68 660
Giyani 366 373 397 373 198 686 323 011 163% 42 951 - - - 3 678 35 921 1 113 239 348
Letaba 366 373 397 373 198 686 220 044 111% 18 812 (284) 952 815 2 021 15 190 3 062 179 477
Tzaneen 1 269 626 1 269 626 634 813 710 381 112% 60 037 287 856 1 319 556 17 071 44 106 1 522 297 914
Maruleng 246 302 258 655 123 151 92 327 75% 37 698 - 1 453 180 1 570 5 337 4 593 41 497
Mopani 1 173 009 1 173 009 586 504 391 396 67% - - - - - 5 765 86 385 545
Mopani Total 3 968 677 4 039 533 2 000 259 2 009 574 100% 219 544 342 327 50 617 6 974 33 011 133 655 11 006 1 212 441
Elias Motsoaledi 501 002 491 692 300 349 281 928 94% 17 813 43 372 - - 4 202 12 295 616 203 629
Ephraim Mogale 268 627 270 999 134 314 169 091 126% 18 648 29 908 - - 2 387 8 864 535 108 748
Tubatse Fetakgomo 711 458 651 043 325 522 282 696 87% 63 154 - - - 11 039 17 677 502 190 325
Makhuduthamaga 365 083 365 958 182 979 243 805 133% 20 421 - - - 63 17 205 3 076 203 040
Sekhukhune District 1 384 613 1 119 997 559 999 668 338 119% - - 41 007 6 478 - 12 886 3 233 604 734
Sekhukhune Total 3 230 783 2 899 689 1 503 161 1 645 858 109% 120 036 73 281 41 007 6 478 17 692 68 927 7 963 1 310 476
Makhado 960 894 879 699 458 091 505 271 110% 33 033 121 300 - 4 4 719 27 336 49 027 269 853
Musina 339 055 356 603 169 528 202 044 119% 10 756 60 621 524 524 6 533 9 960 5 248 107 879
Collins Chabane 401 775 431 320 200 888 198 176 99% (57 264) - - - (13 029) 9 924 (20 788) 279 332
Thulamela 747 529 759 373 373 764 451 250 121% 48 516 - - - 11 779 42 786 8 730 339 439
Vhembe District 1 698 952 1 274 647 849 476 1 088 460 128% - - 78 746 19 - 19 631 94 599 895 466
Vhembe Total 4 148 205 3 701 642 2 051 746 2 445 202 119% 35 040 181 921 79 270 546 10 002 109 637 136 817 1 891 969
Bela-bela 430 564 423 249 215 288 213 673 99% 35 133 59 338 16 199 9 053 4 364 20 936 1 798 66 853
Lephalale 540 764 541 964 269 573 260 575 97% 88 260 53 272 18 449 6 538 3 481 40 535 1 013 49 028
Modimolle-Mookgopong 563 794 563 794 281 897 178 849 63% 42 052 41 670 36 376 15 845 9 989 17 886 1 909 13 121
Mogalakwena 1 041 006 1 052 545 526 272 576 970 110% 39 468 125 691 66 663 8 811 8 439 30 995 2 117 294 785
Thabazimbi 362 287 372 288 180 782 441 348 244% 36 572 19 325 35 607 11 205 7 651 35 921 284 294 785
Waterberg district 141 612 140 812 70 806 105 419 149% - - - - - 3 937 3 740 97 743
Waterberg Total 3 080 027 3 094 652 1 544 617 1 776 834 115% 241 485 299 295 173 294 51 453 33 923 150 209 10 860 816 315
Source: NT Local Government Database
Other Revenue
Appendix 1: Operating Revenue - M06 December 2019
Property
Rates Billed 1
Service Charges
Transfers
Recognised
Original Budget Adjusted
Budget
YTD Budget % of year
to date
Budget
YTD Actual

Consolidated report for the 2019/20 mid-year assessments and s71 report Page 58
Appendix 2: – Operating Expenditure
R thousands
Blouberg 312 413 313 511 156 755 103 367 66% 53 526 8 226 - - - 17 389 937 - 23 289
Capricorn 786 032 742 658 873 206 243 527 28% 144 057 7 172 - 37 115 80 25 251 3 786 - 26 067
Lepelle-Nkumpi 304 275 304 275 304 275 19 768 6% - - - - - - - - 19 768
Molemole 205 549 205 549 205 549 86 051 42% 42 122 6 205 3 309 8 033 8 7 155 2 266 - 16 954
Polokwane 3 549 931 3 549 931 3 549 931 1 195 261 34% 430 451 18 976 35 190 15 32 464 498 090 22 032 2 940 155 105
Total 5 158 199 5 115 922 5 089 714 1 647 974 32% 670 156 40 578 38 499 45 162 32 552 547 884 29 021 2 940 241 182
Ba-phalaborwa 541 179 532 421 263 481 193 615 73% 84 244 6 665 - 24 969 130 32 522 119 - 44 968
Giyani 372 191 369 206 184 603 136 413 74% 88 985 15 267 - - - - 3 472 600 28 089
Letaba 313 788 313 788 156 896 163 178 104% 53 686 10 955 - 16 736 - 15 643 5 164 - 60 993
Tzaneen 1 313 897 1 313 897 656 952 335 039 51% 131 808 8 423 - 45 2 450 112 556 11 020 5 764 62 973
Maruleng 220 804 230 917 110 402 35 470 32% 6 317 1 278 - - - - 850 - 27 025
Mopani 786 032 742 658 873 206 110 784 13% - 7 172 - 37 115 80 25 251 3 786 - 37 380
Total 3 547 891 3 502 888 2 245 539 974 500 43% 365 040 49 760 - 78 865 2 659 185 972 24 411 6 364 261 429
Elias Motsoaledi 482 595 485 305 247 168 158 414 64% 74 881 12 110 - - 1 173 38 241 8 706 1 262 22 042
Ephraim Mogale 298 375 292 096 149 188 85 877 58% 39 431 6 690 - - 52 17 484 538 - 21 683
Tubatse Fetakgomo 576 104 616 560 308 279 149 398 48% 87 868 16 562 390 - 17 - 1 330 31 43 199
Makhuduthamaga 337 027 339 028 168 312 84 283 50% 31 847 11 322 - 14 094 - - 32 3 825 23 163
Sekhukhune District 925 053 987 148 493 573 403 023 82% 194 008 7 939 2 373 42 473 - 71 934 9 526 2 543 72 226
Total 2 619 154 2 720 138 1 366 521 880 995 64% 428 034 54 623 2 763 56 568 1 242 127 659 20 132 7 661 182 313
Makhado 958 974 940 435 479 241 342 275 71% 115 111 10 706 442 30 520 66 94 724 10 376 - 80 330
Musina 339 055 354 808 169 528 18 533 11% - - - - 1 306 1 500 1 484 198 14 045
Colllins Chabane 218 577 349 189 125 670 103 692 83% 53 868 13 051 - 10 711 - - 4 221 3 460 18 382
Thulamela 676 528 686 588 338 264 80 906 24% (0) - 8 803 24 983 - - 6 753 4 738 35 629
Vhembe 1 034 694 1 135 374 545 829 352 163 65% 278 733 6 903 - - 214 - 12 627 - 53 687
Total 3 227 829 3 466 394 1 658 532 897 569 54% 447 713 30 660 9 245 66 214 1 586 96 224 35 460 8 396 202 073
Bela-bela 424 047 418 223 212 009 108 077 51% 14 490 624 (45) 216 2 343 60 583 4 370 - 25 496
Lephalale 574 261 539 306 247 687 237 162 96% 81 627 4 431 - 811 29 529 55 411 1 233 (31) 64 151
Modimolle-Mookgopong 704 658 704 658 352 329 168 234 48% 101 930 6 304 13 4 - 30 666 655 - 28 661
Mogalakwena 1 040 177 995 720 497 856 321 733 65% 152 995 10 799 (49) 22 - 115 614 5 110 118 37 124
Thabazimbi 397 250 365 618 196 370 134 180 68% 62 739 4 349 - - 5 339 45 758 57 - 15 938
Waterberg district 168 985 190 071 87 884 71 685 82% 52 891 5 144 - - - - 1 002 - 12 647
Total 3 309 378 3 213 596 1 594 135 1 041 071 65% 466 673 31 651 (80) 1 053 37 211 308 032 12 428 87 184 017
Source: NT Local Government Database
YTD Budget
Appendix 2: Operating Expenditure - M06 December 2019
Original
Budget
Adjusted
Budget
YTD Actual % of Budget Employee
Related Cost
Councillor
Remuneration
Debt
Impairment
Bulk
Purchases
Other
Expenditure
Contracted
Services
Depreciation
and asset
impairment
Other
Materials
Transfers
and
Subsidies

Consolidated report for the 2019/20 mid-year assessments and s71 report Page 59
Appendix – 3: Capital Source
R thousands National
Grants
Provincial
Grants
District
Municipality
Grants
Other
Transfers &
Grants
Blouberg 69 533 64 385 32 192 23 221 72% 918 392 21 911 - - -
Capricorn 27 776 377 048 234 870 185 730 79% - - 185 730 - - -
Lepelle-Nkumpi 104 166 104 166 52 083 - 0% - - - - - -
Molemole 55 441 55 441 27 721 31 497 114% 4 224 - 27 274 - - -
Polokwane 1 889 186 1 533 659 925 075 467 069 50% 32 714 336 420 428 - - 13 590
Total 2 146 102 2 134 700 1 271 941 707 518 56% - - 37 856 729 655 343 - - - 13 590 -
Ba-phalaborwa 47 225 46 973 19 297 14 494 75% 1 390 - 13 104 - - -
Giyani 104 204 94 105 47 052 28 849 61% 2 219 - 26 630 - - -
Letaba 151 354 151 354 75 677 39 483 52% 20 318 - 19 165 - - -
Tzaneen 142 720 142 720 71 360 36 625 51% 7 181 - 29 444 - - -
Maruleng 46 701 54 069 23 351 28 936 124% - - 28 936 - - -
Mopani 563 730 563 730 281 865 167 104 59% 641 - 166 463 - - -
Total 1 055 934 1 052 951 518 603 315 492 61% - - 31 749 - 283 743 - - - - -
Elias Motsoaledi 77 399 113 090 43 864 39 516 90% - 5 443 34 073 - - -
Ephraim Mogale 34 537 34 537 17 268 13 422 78% - - 13 422 - - -
Tubatse Fetakgomo 155 357 163 092 81 546 35 833 44% 7 518 - 25 101 3 214 - -
Makhuduthamaga 77 713 72 752 36 376 24 390 67% 4 047 - 20 343 - - -
Sekhukhune District 709 125 682 273 341 136 183 439 54% 2 491 - 180 948 - - -
Total 1 054 131 1 065 744 520 191 296 600 57% - - 14 055 5 443 273 887 3 214 - - - -
Makhado 95 118 132 620 59 651 16 022 27% - - 16 022 - - -
Musina 39 016 39 016 19 508 12 072 162% - 2 434 9 638 - - -
Collins Chabane 183 931 277 002 126 115 95 098 75% 29 702 - 65 396 - - -
Thulamela 170 383 172 168 85 192 99 738 117% 23 196 - 76 542 - - -
Vhembe - 678 303 140 325 30 984 22% 2 959 - 28 025 - - -
Total 488 448 1 299 109 430 791 253 915 59% - 55 857 2 434 195 624 - - - - -
Bela-bela 75 615 84 315 37 808 19 935 53% - - 19 935 - - -
Lephalale 97 568 153 373 60 182 29 623 49% 3 311 - 26 313 - - -
Modimolle-Mookgopong 59 630 59 630 29 815 15 097 51% - - 15 097 - - -
Mogalakwena 515 363 529 936 264 968 109 756 41% 4 906 824 104 026 - - -
Thabazimbi 30 000 111 076 28 560 15 192 53% - - 7 322 7 870 - -
Waterberg district 10 328 9 405 5 364 241 5% 241 - - - - -
Total 788 505 947 735 426 696 189 845 44% - - 8 458 824 172 693 7 870 - - - -
Source: NT Local Government Database
Appendix 3: Capital Source of Finance - M06 December 2019
Original Budget Adjusted
Budget
Year To Date
Budget
% of Budget YTD Actual
Borrowing Other
External
Loans Asset
Finance
Reserve
Internally
Generated
funds
Public
Contribution
s/Donations
Transfers & Grants

Consolidated report for the 2019/20 mid-year assessments and s71 report Page 60
Appendix – 4: Capital Expenditure
R thousands
Blouberg 69 533 64 385 32 192 23 221 72% 11 873 - - 78 369 - 10 902
Capricorn 309 134 683 924 474 160 242 246 51% - 229 281 - - 6 338 6 627 -
Lepelle-Nkumpi 104 166 104 166 52 083 - 0% - - - - - - -
Molemole 55 441 55 441 27 721 31 497 114% 490 - 29 587 - 706 714 -
Polokwane 1 889 186 1 533 659 925 075 467 069 50% 8 100 204 566 138 572 1 912 13 152 11 543 89 225
Total 2 427 460 2 441 575 1 511 231 764 033 51% 20 463 433 847 168 159 1 989 20 564 18 884 100 126
Ba-phalaborwa 203 378 283 166 122 878 32 504 26% 4 857 - - 272 5 090 406 21 879
Giyani 109 370 98 355 49 177 2 289 224 4655% 12 152 - - 39 785 2 109 072 128 020 196
Letaba 156 386 156 386 78 193 39 483 50% 448 - - - 899 9 487 28 648
Tzaneen 142 720 142 720 71 360 36 625 51% 7 181 - - - - - 29 444
Maruleng 115 347 121 393 57 673 44 485 77% - - - - 2 608 2 315 39 561
Mopani 309 134 683 924 474 160 242 246 51% - 229 281 - - 6 338 6 627 -
Total 1 036 335 1 485 944 853 442 2 684 566 315% 24 639 229 281 - 40 057 2 124 007 146 855 119 728
Elias Motsoaledi 95 654 113 090 54 348 48 664 90% 12 856 - - 626 539 - 34 643
Ephraim Mogale 50 217 50 361 25 108 14 965 60% 467 - - - 104 13 14 381
Tubatse Fetakgomo 155 357 163 092 81 546 35 833 44% - - - 800 29 315 249 5 470
Makhuduthamaga 90 013 89 261 44 631 31 743 71% - - - - 2 813 - 28 930
Sekhukhune District 309 134 683 924 474 160 242 246 51% - 229 281 - - 6 338 6 627 -
Total 700 374 1 099 729 679 793 373 451 55% 13 322 229 281 - 1 426 39 110 6 889 83 424
Makhado 203 378 283 166 122 878 32 504 26% 4 857 - - 272 5 090 406 21 879
Musina 39 016 39 016 122 878 32 504 26% 4 857 - - 272 5 090 406 21 879
Collins Chabane 183 931 277 002 126 115 111 868 89% 11 161 - - 3 936 16 556 17 725 62 490
Thulamela 170 383 172 168 85 192 99 738 117% - - - 180 28 7 523 92 007
Vhembe District 309 134 683 924 474 160 242 246 51% - 229 281 - - 6 338 6 627 -
DC 18 Total 905 842 1 455 276 931 224 518 860 56% 20 876 229 281 - 4 659 33 102 32 687 198 255
Bela-bela 75 615 84 315 37 808 17 088 45% 4 544 1 568 2 585 - - 1 581 6 810
Lephalale 98 626 160 616 61 065 29 623 49% 1 582 9 172 7 664 - 1 239 172 9 795
Modimolle-Mookgopong 59 630 59 630 61 065 29 623 49% 1 582 9 172 7 664 - 1 239 172 9 795
Mogalakwena 515 363 529 936 264 968 109 756 41% 3 773 82 952 853 - - 11 735 10 443
Thabazimbi 63 228 111 076 45 174 34 902 77% 590 6 732 7 870 - - 4 939 14 771
Waterberg district 309 134 683 924 474 160 242 246 0% - 229 281 - - 6 338 6 627 -
DC 18 Total 1 121 597 1 629 497 944 240 463 238 49% 12 070 338 876 26 635 - 8 816 25 226 51 616
Source: NT Local Government Database
Appendix 4: Capital Expenditure - M06 December 2019
Economic and
environmental
services
Original
Budget
Adjusted
Budget
Year To Date
Budget
Water
Management
Energy
Sources
Waste
Management
(Refuse)
% of Budget YTD Actual Waste Water
Management
Tr
Municipal
governance
and
administration
Community
and public
safety

Consolidated report for the 2019/20 mid-year assessments and s71 report Page 61
Appendix – 5: Cash Flow

Consolidated report for the 2019/20 mid-year assessments and s71 report Page 62
Appendix – 6: Debtors Age Analysis
Total % Total % Total % Total %
Blouberg 2 535 2% 1 131 1% 964 1% 140 732 97% 145 362
Capricorn 0% 0% 0% 0% -
Lepelle-Nkumpi 0% 0% 0% 0% -
Molemole 2 752 2% 2 626 2% 2 478 2% 125 233 94% 133 089
Polokwane 240 646 16% 76 740 5% 53 876 4% 1 109 952 75% 1 481 214
Total 245 933 14% 80 497 5% 57 318 3% 1 375 917 78% 1 759 665
Ba-phalaborwa 38 536 5% 18 107 2% 34 061 4% 679 519 88% 770 223
Giyani 9 486 3% 11 715 3% 7 561 2% 330 664 92% 359 426
Letaba 0% 0% 0% 0% -
Tzaneen 63 007 9% 22 112 3% 23 430 3% 572 442 84% 680 991
Maruleng - 0% - 0% - 0% - 0% -
Mopani 0% 0% 0% 0% -
Total 111 029 6% 51 934 3% 65 052 4% 1 582 625 87% 1 810 640
Elias Motsoaledi 17 379 18% 2 676 3% 2 514 3% 74 285 77% 96 854
Ephraim Mogale 12 838 10% 2 511 2% 2 486 2% 107 770 86% 125 605
Tubatse Fetakgomo 13 099 3% 13 442 3% 8 937 2% 445 722 93% 481 200
Makhuduthamaga 5 996 1% 6 407 2% 6 510 2% 397 277 95% 416 190
Sekhukhune District 18 919 9% 6 724 3% 5 742 3% 179 833 85% 211 218
Total 68 231 5% 31 760 2% 26 189 2% 1 204 887 91% 1 331 067
Makhado - 0% - 0% - 0% - 0% -
Musina 0% 0% 0% 0% -
Collins Chabane 5 673 6% 2 503 3% 2 475 3% 78 495 88% 89 146
Thulamela 24 161 4% 10 347 2% 9 277 2% 497 993 92% 541 778
Vhembe District 33 571 14% 15 659 7% 12 585 5% 170 456 73% 232 271
Total 63 405 7% 28 509 3% 24 337 3% 746 944 87% 863 195
Bela-bela 0% 0% 0% 0% -
Lephalale 29 186 10% 14 719 5% 8 733 3% 248 287 83% 300 925
Modimolle-Mookgopong 0% 0% 0% 0% -
Mogalakwena 73 685 9% 23 965 3% 22 226 3% 746 300 86% 866 176
Thabazimbi 0% 0% 0% 0% -
Waterberg district 60 100% - 0% - 0% - 0% 60
Total 102 931 9% 38 684 3% 30 959 3% 994 587 85% 1 167 161
Source: NT Local Government Database
Appendix 6: Debtors Age Analysis - M06 December 2019
0 - 30 Days 31 - 60 Days 61 - 90 Days Over 90 Days Total
R '000
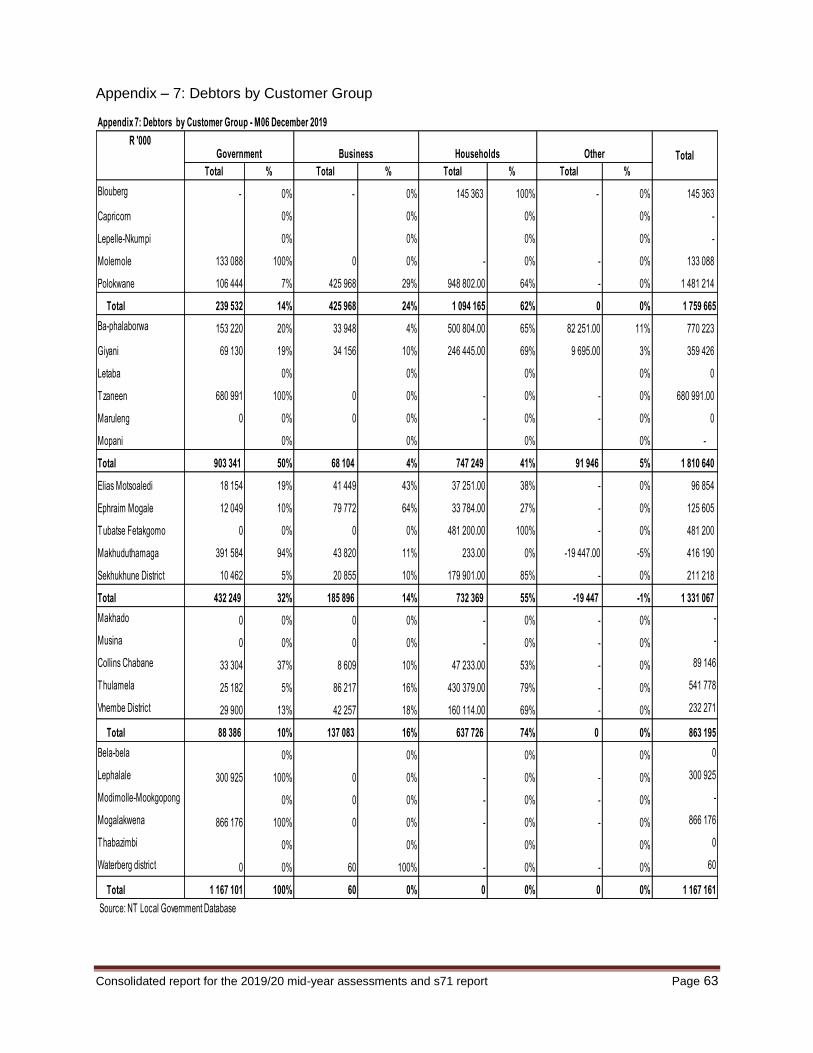
Consolidated report for the 2019/20 mid-year assessments and s71 report Page 63
Appendix – 7: Debtors by Customer Group
Total % Total % Total % Total %
Blouberg - 0% - 0% 145 363 100% - 0% 145 363
Capricorn 0% 0% 0% 0% -
Lepelle-Nkumpi 0% 0% 0% 0% -
Molemole 133 088 100% 0 0% - 0% - 0% 133 088
Polokwane 106 444 7% 425 968 29% 948 802.00 64% - 0% 1 481 214
Total 239 532 14% 425 968 24% 1 094 165 62% 0 0% 1 759 665
Ba-phalaborwa 153 220 20% 33 948 4% 500 804.00 65% 82 251.00 11% 770 223
Giyani 69 130 19% 34 156 10% 246 445.00 69% 9 695.00 3% 359 426
Letaba 0% 0% 0% 0% 0
Tzaneen 680 991 100% 0 0% - 0% - 0% 680 991.00
Maruleng 0 0% 0 0% - 0% - 0% 0
Mopani 0% 0% 0% 0% -
Total 903 341 50% 68 104 4% 747 249 41% 91 946 5% 1 810 640
Elias Motsoaledi 18 154 19% 41 449 43% 37 251.00 38% - 0% 96 854
Ephraim Mogale 12 049 10% 79 772 64% 33 784.00 27% - 0% 125 605
Tubatse Fetakgomo 0 0% 0 0% 481 200.00 100% - 0% 481 200
Makhuduthamaga 391 584 94% 43 820 11% 233.00 0% -19 447.00 -5% 416 190
Sekhukhune District 10 462 5% 20 855 10% 179 901.00 85% - 0% 211 218
Total 432 249 32% 185 896 14% 732 369 55% -19 447 -1% 1 331 067
Makhado 0 0% 0 0% - 0% - 0% -
Musina 0 0% 0 0% - 0% - 0% -
Collins Chabane 33 304 37% 8 609 10% 47 233.00 53% - 0% 89 146
Thulamela 25 182 5% 86 217 16% 430 379.00 79% - 0% 541 778
Vhembe District 29 900 13% 42 257 18% 160 114.00 69% - 0% 232 271
Total 88 386 10% 137 083 16% 637 726 74% 0 0% 863 195
Bela-bela 0% 0% 0% 0% 0
Lephalale 300 925 100% 0 0% - 0% - 0% 300 925
Modimolle-Mookgopong 0% 0 0% - 0% - 0% -
Mogalakwena 866 176 100% 0 0% - 0% - 0% 866 176
Thabazimbi 0% 0% 0% 0% 0
Waterberg district 0 0% 60 100% - 0% - 0% 60
Total 1 167 101 100% 60 0% 0 0% 0 0% 1 167 161
Source: NT Local Government Database
Appendix 7: Debtors by Customer Group - M06 December 2019
Government Business Households Other Total
R '000

Consolidated report for the 2019/20 mid-year assessments and s71 report Page 64
Appendix – 8: Creditors Age Analysis
Total % Total % Total % Total %
Blouberg 0 0% - 0% - 0% - 0% -
Capricorn 0 0% - 0% 21 111% -2 -11% 19
Lepelle-Nkumpi 0% 0% 0% 0% -
Molemole 2 2% - 0% - 0% 80 98% 82
Polokwane 149 733 82% 7 612 4% - 0% 26 325 14% 183 670
Total 149 735 81% 7 612 4% 21 0% 26 403 14% 183 771
Ba-Phalaborwa 106 0% 4 096 19% 10 201 46% 7 603 35% 22 006
Greater Giyani 0 0% -94 -12% 135 17% 739 95% 780
Greater Letaba 0% 0% 0% 0% -
Greater Tzaneen 1 168 1% 13 578 10% 6 392 4% 121 188 85% 142 326
Maruleng 1 100% - 0% - 0% - 0% 1
Mopani 300 254 97% 7 802 3% - 0% - 0% 308 056
Total 301 529 64% 25 382 5% 16 728 4% 129 530 27% 473 169
Elias Motsoaledi 0 0% - 0% - 0% - 0% -
Ephraim Mogale 0 0% - 0% - 0% - 0% -
Tubatse Fetakgomo 1 591 28% 4 065 72% - 0% 10 0% 5 666
Makhuduthamaga -528 -48% 1 631 148% - 0% - 0% 1 103
Sekhukhune District 28 050 15% 11 484 6% 151 245 79% - 0% 190 779
Total 29 113 15% 17 180 9% 151 245 77% 10 0% 197 548
Makhado 398 50% - 0% - 0% 396 50% 794
Musina 0% 0% 0% 0%
Collins Chabane 5 345 50% 1 279 12% 332 3% 3 700 35% 10 656
Thulamela 0 0% - 0% - 0% - 0% -
Vhembe District 9 558 58% 294 2% 51 0% 6 474 40% 16 377
Total 15 301 55% 1 573 6% 383 1% 10 570 38% 27 827
Bela-bela 18 255 35% - 0% 4 550 9% 28 851 56% 51 656
Lephalale 8 361 46% 57 0% 572 3% 9 374 51% 18 364
Modimolle-Mookgopong 26 0% 169 0% 261 0% 494 218 100% 494 674
Mogalakwena 21 580 100% - 0% - 0% - 0% 21 580
Thabazimbi 13 948 15% 10 966 12% 3 624 4% 66 276 70% 94 814
Waterberg district 0 0% - 0% - 0% - 0% -
Total 62 170 9% 11 192 2% 9 007 1% 598 719 88% 681 088
Source: NT Local Government Database
Appendix 8: Creditors Age Analysis - M06 December 2019
0 - 30 Days 31 - 60 Days 61 - 90 Days Over 90 Days Total
R '000
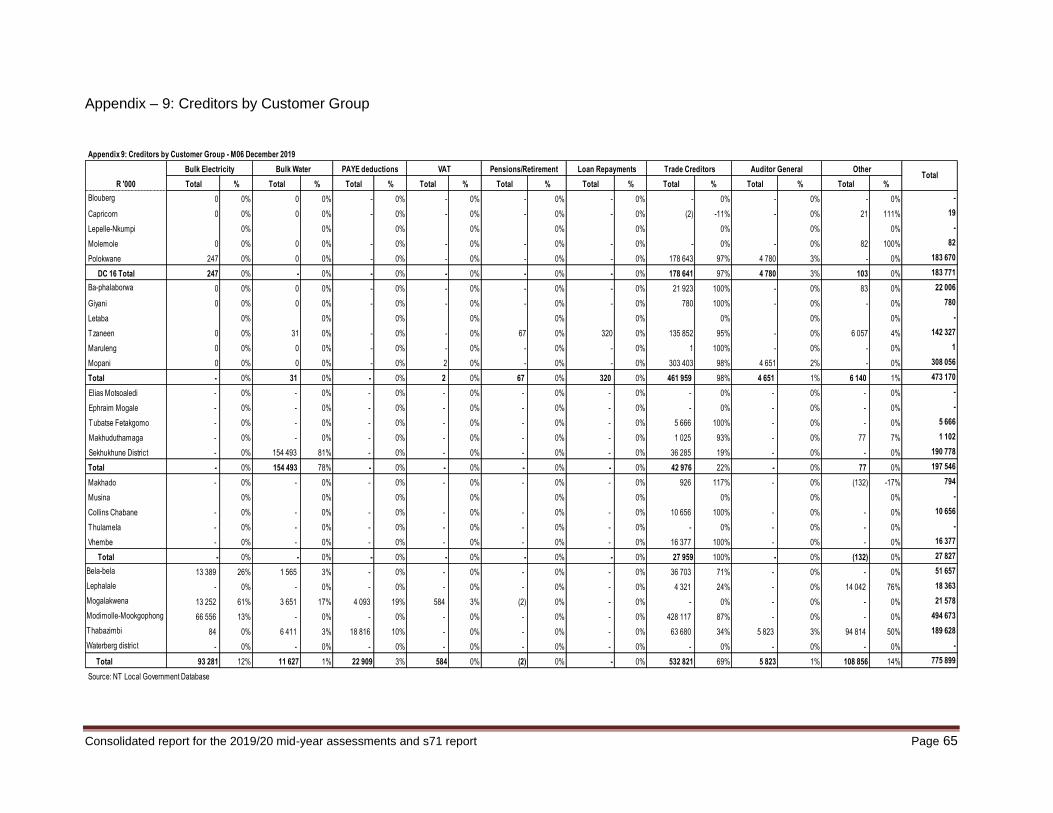
Consolidated report for the 2019/20 mid-year assessments and s71 report Page 65
Appendix – 9: Creditors by Customer Group
R '000 Total % Total % Total % Total % Total % Total % Total % Total % Total %
Blouberg 0 0% 0 0% - 0% - 0% - 0% - 0% - 0% - 0% - 0% -
Capricorn 0 0% 0 0% - 0% - 0% - 0% - 0% (2) -11% - 0% 21 111% 19
Lepelle-Nkumpi 0% 0% 0% 0% 0% 0% 0% 0% 0% -
Molemole 0 0% 0 0% - 0% - 0% - 0% - 0% - 0% - 0% 82 100% 82
Polokwane 247 0% 0 0% - 0% - 0% - 0% - 0% 178 643 97% 4 780 3% - 0% 183 670
DC 16 Total 247 0% - 0% - 0% - 0% - 0% - 0% 178 641 97% 4 780 3% 103 0% 183 771
Ba-phalaborwa 0 0% 0 0% - 0% - 0% - 0% - 0% 21 923 100% - 0% 83 0% 22 006
Giyani 0 0% 0 0% - 0% - 0% - 0% - 0% 780 100% - 0% - 0% 780
Letaba 0% 0% 0% 0% 0% 0% 0% 0% 0% -
Tzaneen 0 0% 31 0% - 0% - 0% 67 0% 320 0% 135 852 95% - 0% 6 057 4% 142 327
Maruleng 0 0% 0 0% - 0% - 0% - 0% - 0% 1 100% - 0% - 0% 1
Mopani 0 0% 0 0% - 0% 2 0% - 0% - 0% 303 403 98% 4 651 2% - 0% 308 056
Total - 0% 31 0% - 0% 2 0% 67 0% 320 0% 461 959 98% 4 651 1% 6 140 1% 473 170
Elias Motsoaledi - 0% - 0% - 0% - 0% - 0% - 0% - 0% - 0% - 0% -
Ephraim Mogale - 0% - 0% - 0% - 0% - 0% - 0% - 0% - 0% - 0% -
Tubatse Fetakgomo - 0% - 0% - 0% - 0% - 0% - 0% 5 666 100% - 0% - 0% 5 666
Makhuduthamaga - 0% - 0% - 0% - 0% - 0% - 0% 1 025 93% - 0% 77 7% 1 102
Sekhukhune District - 0% 154 493 81% - 0% - 0% - 0% - 0% 36 285 19% - 0% - 0% 190 778
Total - 0% 154 493 78% - 0% - 0% - 0% - 0% 42 976 22% - 0% 77 0% 197 546
Makhado - 0% - 0% - 0% - 0% - 0% - 0% 926 117% - 0% (132) -17% 794
Musina 0% 0% 0% 0% 0% 0% 0% 0% 0% -
Collins Chabane - 0% - 0% - 0% - 0% - 0% - 0% 10 656 100% - 0% - 0% 10 656
Thulamela - 0% - 0% - 0% - 0% - 0% - 0% - 0% - 0% - 0% -
Vhembe - 0% - 0% - 0% - 0% - 0% - 0% 16 377 100% - 0% - 0% 16 377
Total - 0% - 0% - 0% - 0% - 0% - 0% 27 959 100% - 0% (132) 0% 27 827
Bela-bela 13 389 26% 1 565 3% - 0% - 0% - 0% - 0% 36 703 71% - 0% - 0% 51 657
Lephalale - 0% - 0% - 0% - 0% - 0% - 0% 4 321 24% - 0% 14 042 76% 18 363
Mogalakwena 13 252 61% 3 651 17% 4 093 19% 584 3% (2) 0% - 0% - 0% - 0% - 0% 21 578
Modimolle-Mookgophong 66 556 13% - 0% - 0% - 0% - 0% - 0% 428 117 87% - 0% - 0% 494 673
Thabazimbi 84 0% 6 411 3% 18 816 10% - 0% - 0% - 0% 63 680 34% 5 823 3% 94 814 50% 189 628
Waterberg district - 0% - 0% - 0% - 0% - 0% - 0% - 0% - 0% - 0% -
Total 93 281 12% 11 627 1% 22 909 3% 584 0% (2) 0% - 0% 532 821 69% 5 823 1% 108 856 14% 775 899
Source: NT Local Government Database
Auditor General Loan Repayments
Appendix 9: Creditors by Customer Group - M06 December 2019
Bulk Electricity Bulk Water PAYE deductions VAT Total
Pensions/Retirement Trade Creditors Other
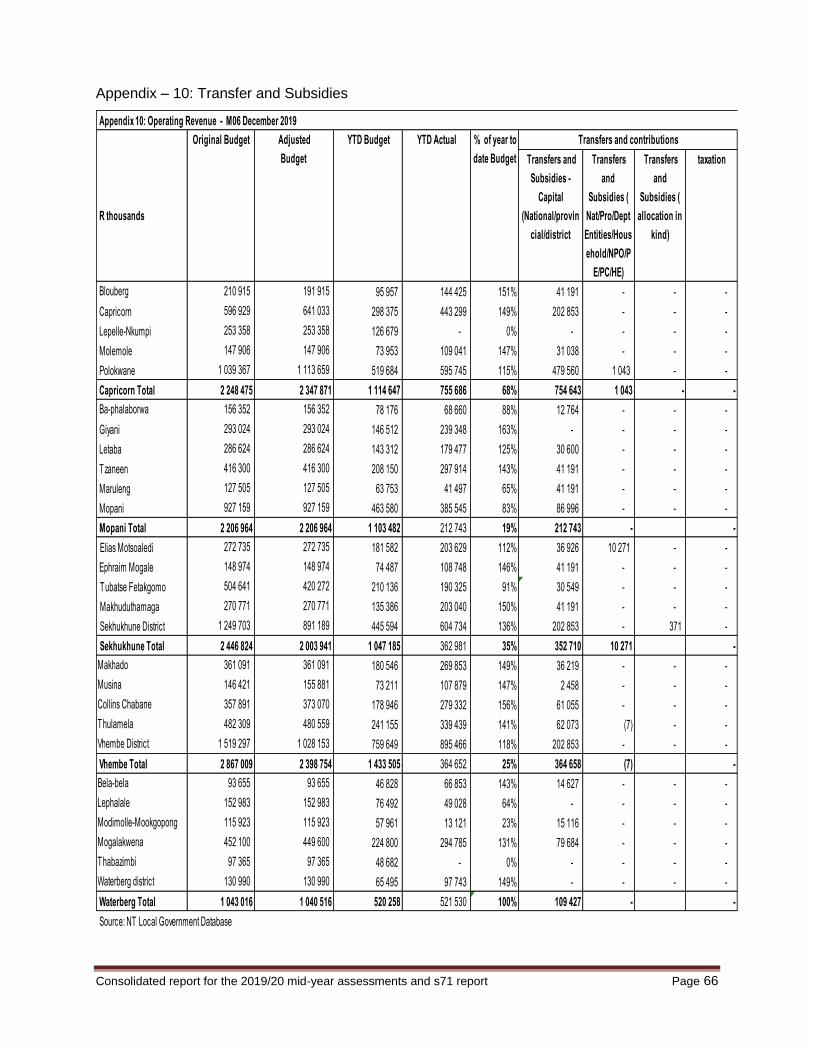
Consolidated report for the 2019/20 mid-year assessments and s71 report Page 66
Appendix – 10: Transfer and Subsidies
R thousands
Transfers and
Subsidies -
Capital
(National/provin
cial/district
Transfers
and
Subsidies (
Nat/Pro/Dept
Entities/Hous
ehold/NPO/P
E/PC/HE)
Transfers
and
Subsidies (
allocation in
kind)
taxation
Blouberg 210 915 191 915 95 957 144 425 151% 41 191 - - -
Capricorn 596 929 641 033 298 375 443 299 149% 202 853 - - -
Lepelle-Nkumpi 253 358 253 358 126 679 - 0% - - - -
Molemole 147 906 147 906 73 953 109 041 147% 31 038 - - -
Polokwane 1 039 367 1 113 659 519 684 595 745 115% 479 560 1 043 - -
Capricorn Total 2 248 475 2 347 871 1 114 647 755 686 68% 754 643 1 043 - -
Ba-phalaborwa 156 352 156 352 78 176 68 660 88% 12 764 - - -
Giyani 293 024 293 024 146 512 239 348 163% - - - -
Letaba 286 624 286 624 143 312 179 477 125% 30 600 - - -
Tzaneen 416 300 416 300 208 150 297 914 143% 41 191 - - -
Maruleng 127 505 127 505 63 753 41 497 65% 41 191 - - -
Mopani 927 159 927 159 463 580 385 545 83% 86 996 - - -
Mopani Total 2 206 964 2 206 964 1 103 482 212 743 19% 212 743 - -
Elias Motsoaledi 272 735 272 735 181 582 203 629 112% 36 926 10 271 - -
Ephraim Mogale 148 974 148 974 74 487 108 748 146% 41 191 - - -
Tubatse Fetakgomo 504 641 420 272 210 136 190 325 91% 30 549 - - -
Makhuduthamaga 270 771 270 771 135 386 203 040 150% 41 191 - - -
Sekhukhune District 1 249 703 891 189 445 594 604 734 136% 202 853 - 371 -
Sekhukhune Total 2 446 824 2 003 941 1 047 185 362 981 35% 352 710 10 271 -
Makhado 361 091 361 091 180 546 269 853 149% 36 219 - - -
Musina 146 421 155 881 73 211 107 879 147% 2 458 - - -
Collins Chabane 357 891 373 070 178 946 279 332 156% 61 055 - - -
Thulamela 482 309 480 559 241 155 339 439 141% 62 073 (7) - -
Vhembe District 1 519 297 1 028 153 759 649 895 466 118% 202 853 - - -
Vhembe Total 2 867 009 2 398 754 1 433 505 364 652 25% 364 658 (7) -
Bela-bela 93 655 93 655 46 828 66 853 143% 14 627 - - -
Lephalale 152 983 152 983 76 492 49 028 64% - - - -
Modimolle-Mookgopong 115 923 115 923 57 961 13 121 23% 15 116 - - -
Mogalakwena 452 100 449 600 224 800 294 785 131% 79 684 - - -
Thabazimbi 97 365 97 365 48 682 - 0% - - - -
Waterberg district 130 990 130 990 65 495 97 743 149% - - - -
Waterberg Total 1 043 016 1 040 516 520 258 521 530 100% 109 427 - -
Source: NT Local Government Database
Appendix 10: Operating Revenue - M06 December 2019
Original Budget Adjusted
Budget
YTD Budget YTD Actual % of year to
date Budget
Transfers and contributions