State of Municipal Education in Mumbai
41
1 State of Municipal Education in Mumbai WHITE PAPER State of Municipal Education in Mumbai December 2014 Supported by FORD FOUNDATION MADHU MEHTA FOUNDATION
Transcript of State of Municipal Education in Mumbai

1 State of Municipal Education in Mumbai
WHITE PAPER
State of Municipal Education in Mumbai
December 2014
Supported by
FORD FOUNDATION
MADHU MEHTA FOUNDATION

2 State of Municipal Education in Mumbai
Table of Contents
Foreword ...........................................................................................................................................4
I. Data from Household Survey ...........................................................................................................6
II. Summary of RTI Data ......................................................................................................................9
A. Outcome Indicators ....................................................................................................................9
B. Annual Municipal Budget for Education .................................................................................... 14
C. Monitoring and Evaluation ....................................................................................................... 17
D. Compliance with norms laid down under Right to Education Act ............................................... 23
III. Deliberation by Municipal Councillors .......................................................................................... 26
IV. Ward-wise Data .......................................................................................................................... 30
Annexure 1 – Survey Methodology ................................................................................................... 35
Annexure 2 – Socio Economic Classification (SEC) Note ..................................................................... 36
Annexure 3 – Inspection Report Form ............................................................................................... 37
Annexure 4 – Continuous Comprehensive Evaluation Form ............................................................... 39
Annexure 5- Questions asked by MLAs on Education in the 12th Assembly ......................................... 40
Charts and Tables
Chart 1: Reasons for not being happy with Municipal School (%) .........................................................8
Table 1: Current Medium of Education (%) ..........................................................................................6
Table 2: Respondents from Table 1 whose current medium of education is other than English and
would want to change to English medium (%) .....................................................................................6
Table 3: Respondents taking private tuitions/coaching classes (%) ......................................................7
Table 4: Details on source of Tuitions (%) ............................................................................................7
Table 5: Percentage happy with the School .........................................................................................7
Table 6: Total Enrolments in Mumbai’s Municipal Schools 2009 - 2014 ................................................9
Table 7: Total Dropouts in Mumbai’s Municipal Schools 2009 - 2014 ................................................. 10
Table 8: Transition Rate of Students from Class 7 to Class 8 in 2013-14 .............................................. 11
Table 9: Retention Rate in Municipal Schools- Class 1 to Class 7 ........................................................ 11
Table 10: Change in Class I Enrolments 2009 to 2014 ......................................................................... 12
Table 11: Medium-wise Class I Enrolments 2009 to 2014 ................................................................... 12
Table 12: Comparison between MCGM and Private Schools: SSC Results ........................................... 13
Table 13: Comparison between Private and MCGM Schools: Scholarships for 4th and 7th Standard ... 13
Table 14: Annual Municipal Budget and Per-capita allocation for Students ........................................ 14
3 State of Municipal Education in Mumbai
Table 15: Per-child Allocation and Expenditure (In Rs. Crore)............................................................. 15
Table 16: Budgeted vs. Actual Expenditure Summary 2013-14 (In Rs. Crore) ...................................... 16
Table 17: Strength of the School Inspection Unit 2013-14 .................................................................. 18
Table 18: Inspection norms for School Inspectors .............................................................................. 18
Table 19: Medium-wise Inspectors 2013-14 ...................................................................................... 18
Table 20: G/N Ward, L and P/South ward Teacher Inspection Data .................................................... 19
Table 21: CCE data for Wards L, G/N, P/S, T, C, and D for 2013-14 ...................................................... 21
Table 22: Percentage of Students graded ‘E2’ i.e. continuously absent in wards L, G/N, P/S, T, C, and D
in 2013-14........................................................................................................................................ 21
Table 23: Compliance with Infrastructure and other norms under RTE ............................................... 23
Table 24: Student Classroom Ratio (SCR) in MCGM Schools ............................................................... 24
Table 25: Medium Wise Student Teacher Ratio in 2013-14 ................................................................ 25
Table 26: Schools with School Management Committees in 2013-14 ................................................. 25
Table 27: Number of questions asked by Councillors on Education in all Committees ........................ 26
Table 28: Category wise number of Questions asked by Councillors on Education .............................. 26
Table 29: Questions asked by Education Committee Members in 2012-13 and 2013-14 ..................... 27
Table 30: Ward-wise questions asked by councillors on Education in the year April’13 to March’14 ... 28
Table 31: Issues raised/Questions asked by Councillors in the year April’13 to March’14 ................... 29
Table 32: Ward-wise Total Number of Students in Municipal Schools in Mumbai ............................... 30
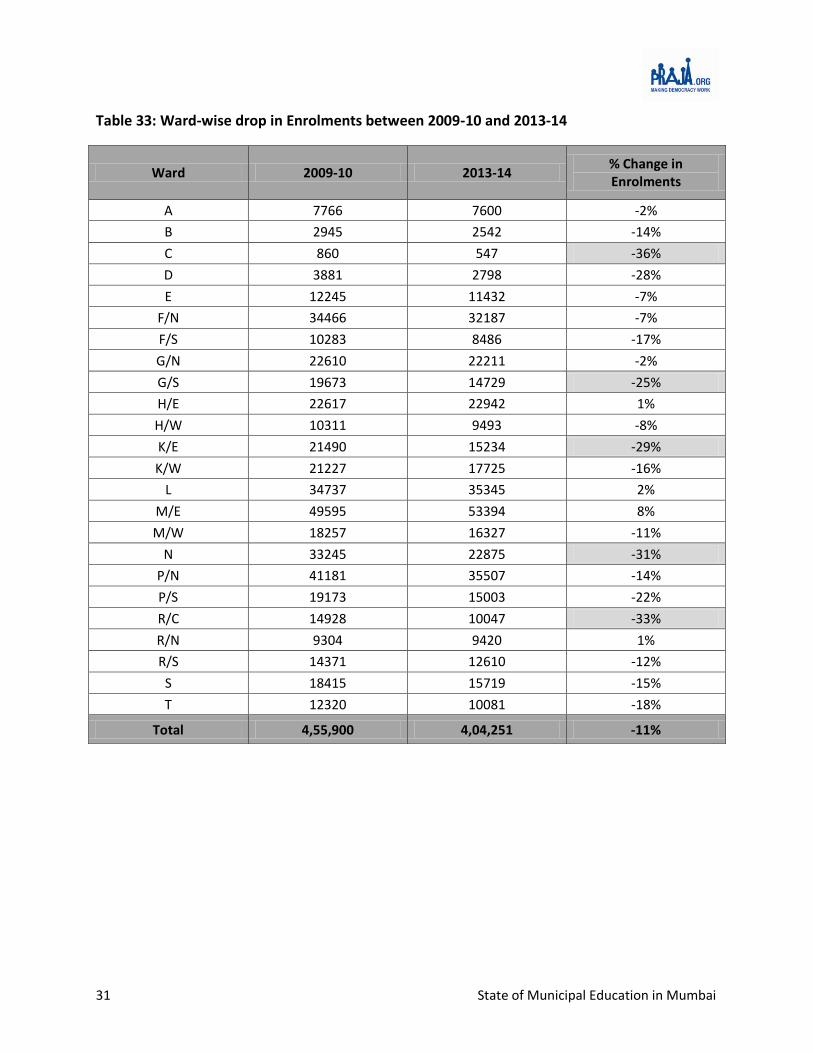
Table 33: Ward-wise drop in Enrolments between 2009-10 and 2013-14 ........................................... 31
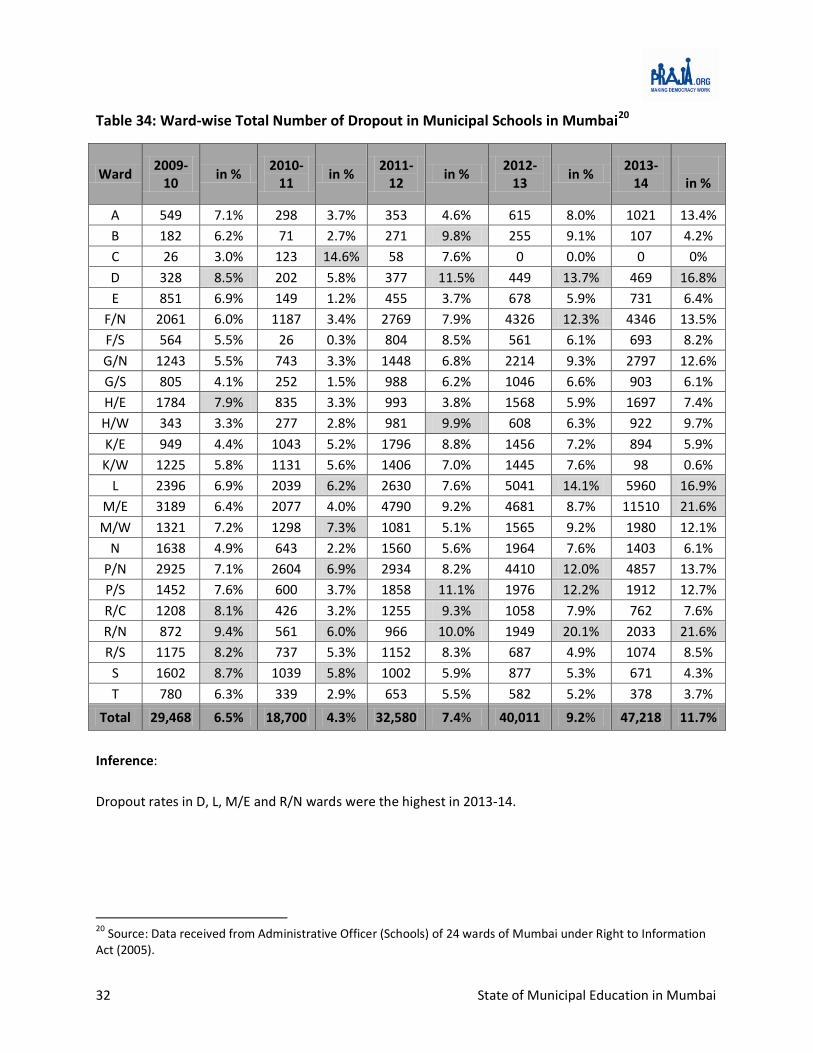
Table 34: Ward-wise Total Number of Dropout in Municipal Schools in Mumbai ............................... 32
Table 35: Ward-wise Total Number of Teachers in Municipal Schools in Mumbai ............................... 33
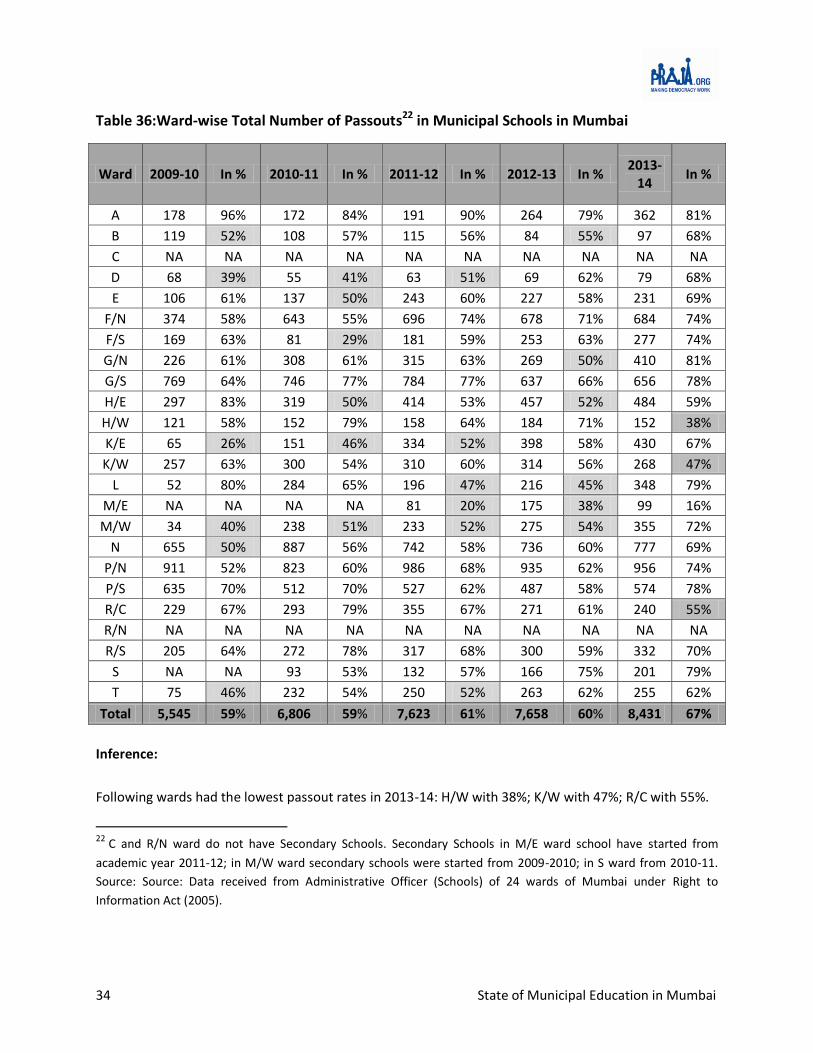
Table 36:Ward-wise Total Number of Passouts in Municipal Schools in Mumbai ................................ 34
4 State of Municipal Education in Mumbai
Foreword
There is something terrible in the state of the Education Department of the MCGM (Municipal
Corporation of Greater Mumbai) and no one is taking responsibility.
In the last five years (2009-10 to 2013-14), 51,649 children have dropped out of Municipal Schools, and
in the corresponding five years the Municipal Budget allocation to the Education department has more
than doubled from Rs.1,255 crores to Rs.2,534 crores. In 2009-10, 67,477 children enrolled in Class I in
Municipal schools, whereas in 2013-14 this dropped to 39,663; and only four questions were asked by
the Municipal Councillors on dropouts. At the current rate, the number of students in Class I will likely
fall to 23,072 by 2016-17.
If this trend continues we will not have any children left in Municipal schools.
The question we have to ask ourselves as citizens of this city is, why has this happened and what are the
reasons for this to have reached such a state?
If we look at the current situation in Municipal schools as per RTE (Right to Education) related norms,
the department is required to self-evaluate on the basis of 3 criteria:
1. Infrastructure Norms 2. Teachers’ Evaluation 3. CCE or Continuous Comprehensive Evaluation of the Children
The MCGM schools are doing quite well –Infrastructure-wise they are nearly 100% compliant. In the
Teachers’ Evaluations the teachers are mostly rated as ‘good’ or ‘very good’ on all parameters. In the
CCE 62% students in 4th Standard and 69% in 7th get more than 60% marks.
When you compare the performance of the MCGM school children with other school children (Private
aided, Private Unaided and Unrecognised) there is a huge difference. In 2013-14, students from
Municipal schools have a pass out rate of 67% compared to 83% for students from other schools in Class
X (SSC). In the State Government run scholarship exams only 1.3% and 0.1% Municipal school students
receive scholarships in 4th and 7th standard, while 9.4% and 8.1% students from other schools receive
scholarships.
In our household surveys of more than 22,000 households, we asked the parents of the children
studying in Municipal schools whether given an opportunity, they would change to a private school,
83% affirmed that they would. Asked further why they had not changed yet, 89% of them (of the 83%)
said that financial constraints were the main reason not to.
The Municipal Corporation gives 27 free items to every child; from note books to umbrellas and
raincoats. Children are provided with flavoured milk and a nourishing midday meal. No fees are charged
and yet there is a massive dropout rate.
5 State of Municipal Education in Mumbai
Clearly, Education has been neglected and orphaned. Nobody talks about the quality of education,
which is what parents ultimately want. They are not interested in 27 free items; they want good quality
education for their children.
We need to bring the focus back on Good Quality Education. To do this we will need to bring in more
Accountability and Transparency in the department. For starters, we need to get an independent third
party to evaluate the performance of Teachers and children as per the RTE norms, and stop self-
evaluation by the department. We need to focus on more teacher trainings and also free the teachers
from extra governmental work, such as Census work and Election duty.
We are at a very crucial stage and if we do not do something now to prevent this rot we will be letting
our children down, especially children who come from economically weaker sections. Our Prime
Minister has been talking about the potential of the youth of this country, but if we do not improve the
state of affairs of the Education department and the quality of education, we will lose this potential.
Nitai Mehta, Founder & Managing Trustee, Praja Foundation

6 State of Municipal Education in Mumbai
I. Data from Household Survey
Praja Foundation had commissioned a household survey to Hansa Research which was conducted in
March-April 2014 across the city of Mumbai. The total sample size for the survey was 22,580
households. Out of the total sample size of 22,580 households, 4,276 households had children going to
school. Hence, the education questionnaire was administered further with those (4,276) households
only. For details on the survey methodology and Socio Economic Classification (SEC) of households, refer
to Annexure 1 and Annexure 2.
Following are the key findings of the survey:
Table 1: Current Medium of Education (%)
Language
All SEC A SEC B SEC C SEC D SEC E
English Public 3 2 5 4 3 3
Private 68 90 81 72 61 37
Marathi Public 5 2 2 3 7 14
Private 10 3 3 8 14 17
Hindi Public 6 0 4 7 6 13
Private 3 2 3 3 4 5
Gujarati Public 0 0 0 1 0 1
Private 1 0 0 1 0 3
Urdu Public 2 0 0 1 2 4
Private 2 0 1 0 3 3
Other Indian Language Public 0 0 0 0 0 1
Private 0 0 0 0 0 0
Inference:
Incidence of parents sending their children to English medium private schools is the highest followed by
Marathi medium private schools. Regional languages like Hindi and Marathi are more prevalent in lower
Socio Economic Categories.
Table 2: Respondents from Table 1 whose current medium of education is other than English and would want to change to English medium (%)
Language All SEC A SEC B SEC C SEC D SEC E
English 55 57 54 54 56 54
Inference:
Amongst the households which are not sending their child to English medium schools, 55% of them
want to send their children to English medium schools. No clear differences are observed across
different Socio Economic Categories.
7 State of Municipal Education in Mumbai
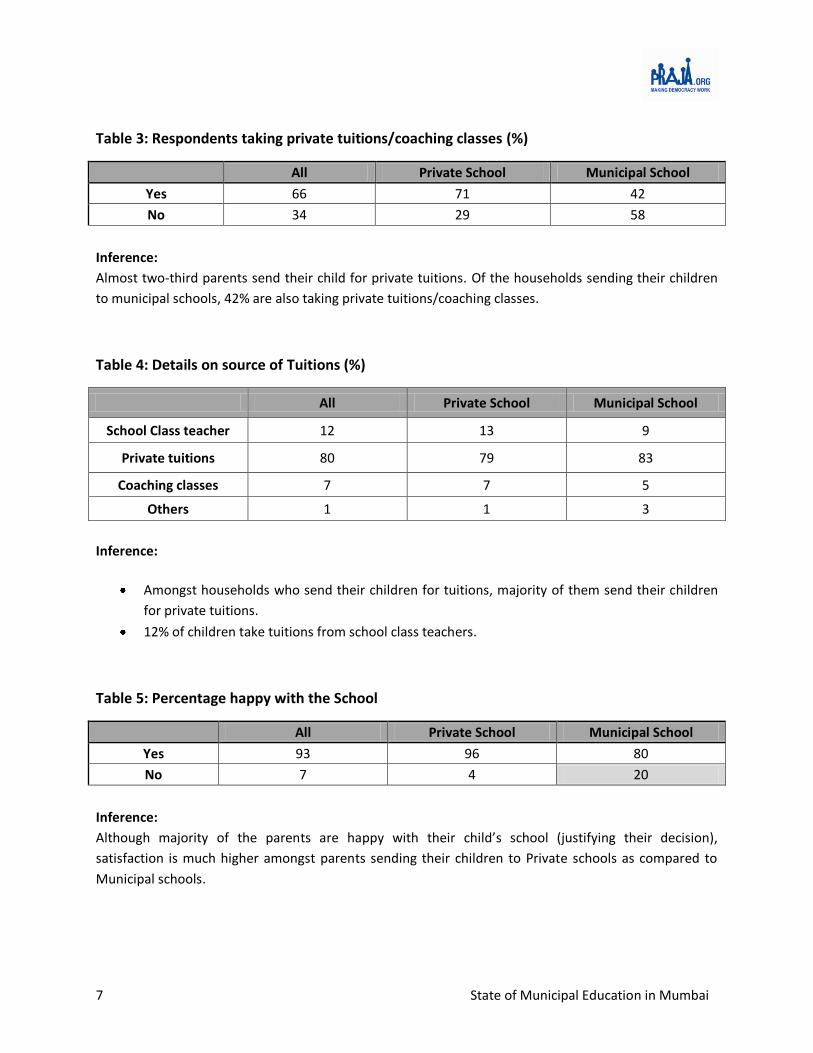
Table 3: Respondents taking private tuitions/coaching classes (%)
All Private School Municipal School
Yes 66 71 42
No 34 29 58
Inference:
Almost two-third parents send their child for private tuitions. Of the households sending their children
to municipal schools, 42% are also taking private tuitions/coaching classes.
Table 4: Details on source of Tuitions (%)
All Private School Municipal School
School Class teacher 12 13 9
Private tuitions 80 79 83
Coaching classes 7 7 5
Others 1 1 3
Inference:
Amongst households who send their children for tuitions, majority of them send their children
for private tuitions.
12% of children take tuitions from school class teachers.
Table 5: Percentage happy with the School
All Private School Municipal School
Yes 93 96 80
No 7 4 20
Inference:
Although majority of the parents are happy with their child’s school (justifying their decision),
satisfaction is much higher amongst parents sending their children to Private schools as compared to
Municipal schools.

8 State of Municipal Education in Mumbai
Chart 1: Reasons for not being happy with Municipal School (%)
Inference:
Quality of education, teachers and infrastructure form the three big reasons cited by parents for not
being happy with municipal schools.
63
4436
33
29
Quality of education is not very good
The teachers are not that good
Infrastructure facilities of the school are very poor
Facilities provided to students are not very good
Future scope is very limited
9 State of Municipal Education in Mumbai
II. Summary of RTI Data
A. Outcome Indicators
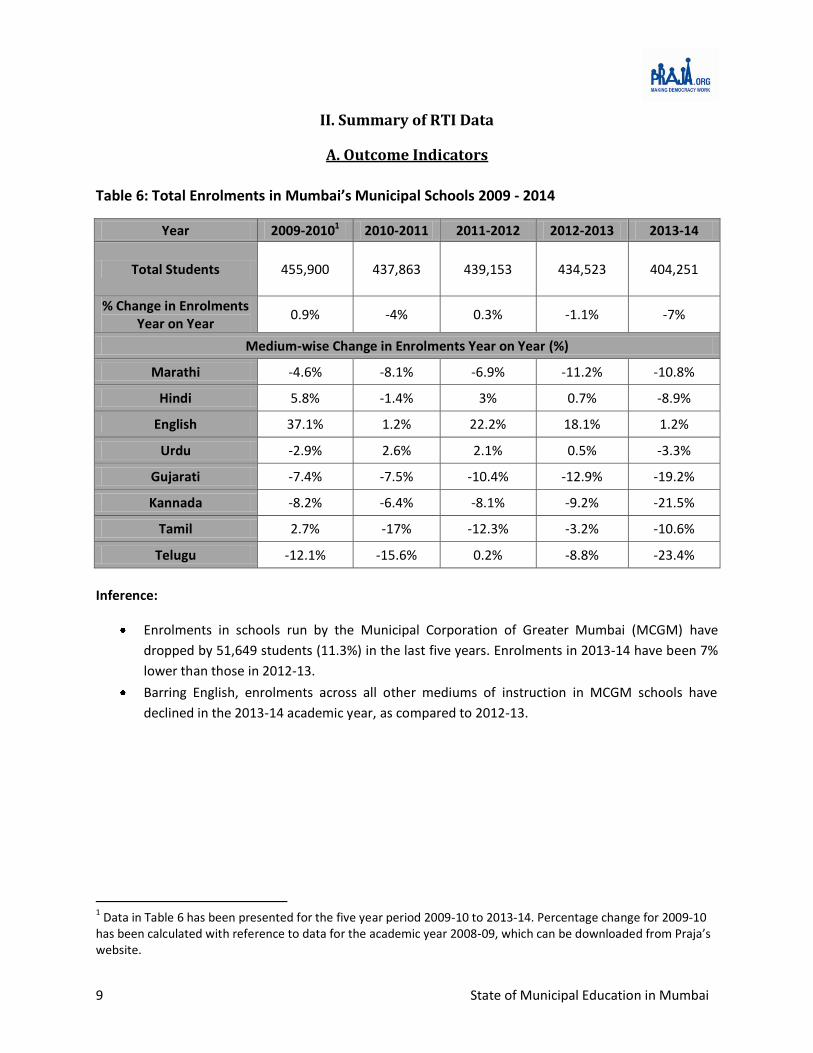
Table 6: Total Enrolments in Mumbai’s Municipal Schools 2009 - 2014
Year 2009-20101 2010-2011 2011-2012 2012-2013 2013-14
Total Students 455,900 437,863 439,153 434,523
404,251
% Change in Enrolments Year on Year
0.9% -4% 0.3% -1.1% -7%
Medium-wise Change in Enrolments Year on Year (%)
Marathi -4.6% -8.1% -6.9% -11.2% -10.8%
Hindi 5.8% -1.4% 3% 0.7% -8.9%
English 37.1% 1.2% 22.2% 18.1% 1.2%
Urdu -2.9% 2.6% 2.1% 0.5% -3.3%
Gujarati -7.4% -7.5% -10.4% -12.9% -19.2%
Kannada -8.2% -6.4% -8.1% -9.2% -21.5%
Tamil 2.7% -17% -12.3% -3.2% -10.6%
Telugu -12.1% -15.6% 0.2% -8.8% -23.4%
Inference:
Enrolments in schools run by the Municipal Corporation of Greater Mumbai (MCGM) have
dropped by 51,649 students (11.3%) in the last five years. Enrolments in 2013-14 have been 7%
lower than those in 2012-13.
Barring English, enrolments across all other mediums of instruction in MCGM schools have
declined in the 2013-14 academic year, as compared to 2012-13.
1 Data in Table 6 has been presented for the five year period 2009-10 to 2013-14. Percentage change for 2009-10
has been calculated with reference to data for the academic year 2008-09, which can be downloaded from Praja’s website.
10 State of Municipal Education in Mumbai
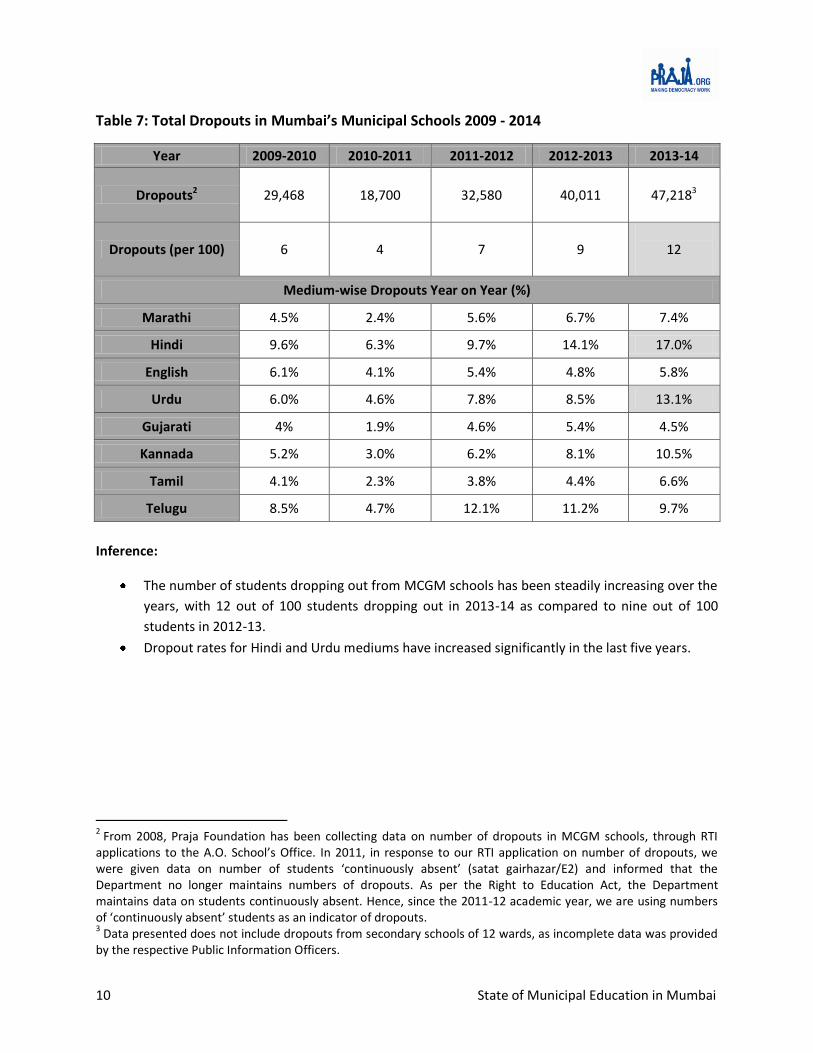
Table 7: Total Dropouts in Mumbai’s Municipal Schools 2009 - 2014
Year 2009-2010 2010-2011 2011-2012 2012-2013 2013-14
Dropouts2 29,468 18,700 32,580 40,011
47,2183
Dropouts (per 100) 6 4 7 9
12
Medium-wise Dropouts Year on Year (%)
Marathi 4.5% 2.4% 5.6% 6.7% 7.4%
Hindi 9.6% 6.3% 9.7% 14.1% 17.0%
English 6.1% 4.1% 5.4% 4.8% 5.8%
Urdu 6.0% 4.6% 7.8% 8.5% 13.1%
Gujarati 4% 1.9% 4.6% 5.4% 4.5%
Kannada 5.2% 3.0% 6.2% 8.1% 10.5%
Tamil 4.1% 2.3% 3.8% 4.4% 6.6%
Telugu 8.5% 4.7% 12.1% 11.2% 9.7%
Inference:
The number of students dropping out from MCGM schools has been steadily increasing over the
years, with 12 out of 100 students dropping out in 2013-14 as compared to nine out of 100
students in 2012-13.
Dropout rates for Hindi and Urdu mediums have increased significantly in the last five years.
2 From 2008, Praja Foundation has been collecting data on number of dropouts in MCGM schools, through RTI applications to the A.O. School’s Office. In 2011, in response to our RTI application on number of dropouts, we were given data on number of students ‘continuously absent’ (satat gairhazar/E2) and informed that the Department no longer maintains numbers of dropouts. As per the Right to Education Act, the Department maintains data on students continuously absent. Hence, since the 2011-12 academic year, we are using numbers of ‘continuously absent’ students as an indicator of dropouts. 3 Data presented does not include dropouts from secondary schools of 12 wards, as incomplete data was provided by the respective Public Information Officers.

11 State of Municipal Education in Mumbai
Table 8: Transition Rate of Students from Class 7 to Class 8 in 2013-14
Standard Academic Year Total Enrolment Transition Rate
7 2012-13 49,217 33%
8 2013-14 16,042
Inference:
The Transition Rate4 of students studying in Class 7 in 2012-13 to Class 8 in 2013-14 in MCGM schools
was only 33% in 2013-14.
Table 9: Retention Rate in Municipal Schools- Class 1 to Class 7
Standard Academic Year Total Enrolments Retention Rate (%)
Year on Year
1 2009-10 67,477 -
2 2010-11 61,071 90.5%
3 2011-12 59,691 88.5%
4 2012-13 59,160 87.7%
5 2013-14 53,056 78.6%
6 2014-15* 47,653 70.6%
7 2015-16* 42,901 63.6%
Inference:
Retention Rate of students at the primary level is only 79% i.e. 21% of the students who enrolled in class I in 2009-10, did not make it to class 5 in 2013-14.
(*) Using a time-series regression we have tried to estimate the year on year trend in retention rates and extrapolate this to the next two academic years 2014-15 and 2015-16. We find that at the current rate, only 63.6% of students who enrolled in Class I in 2009-10 will make it to class 7 in 2015-16.
4 The number of students admitted to the first grade of a higher level of education in a given year, expressed as a
percentage of the number of pupils (or students) enrolled in the final grade of the lower level of education in the previous year.

12 State of Municipal Education in Mumbai
Table 10: Change in Class I Enrolments 2009 to 2014
Year 2009-10 2010-11 2011-12 2012-13 2013-14 2014-15* 2015-16* 2016-17*
No. of students enrolled in Class I
67,477 62,587 53,729 46,913 39,663 33,169 27,753 23,072
% Change Year on
Year 6.4% -7.2% -14.2% -12.7% -15.5% -16.4% -16.3% -16.9%
Inference:
The number of students enrolling in Class I of MCGM schools has been steadily declining
between 2009-10 and 2013-14. In the last five years, enrolments have gone down by 41%. This
implies that if 100 students enrolled in Class I in 2009-10, in comparison only 59 students
enrolled in Class I in 2013-14.
Enrolments in 2013-14 were 15.5% lower than those in 2012-13.
(*) Using a time-series regression we have estimated the year on year trend in Class I
enrolments and extrapolated this to the next three academic years 2014-15, 2015-16 and 2016-
17. We find that at the current rate, enrolments in Class I of MCGM schools are likely to dip to
23,072 students only.
Table 11: Medium-wise Class I Enrolments 2009 to 2014
Medium of Instruction
% Change 08-09 to 09-10
% Change 09-10 to 10-11
% Change 10-11 to 11-12
% Change 11-12 to 12-13
% Change 12-13 to 13-14
Marathi -2.0% -20.9% -20.9% -19.3% -15.3%
Hindi 9.8% -4.6% -15.6% -17.3% -18.9%
English 40.6% 5.1% 5.1% 2.1% -9.1%
Urdu 1.2% -5.3% -16.0% -9.5% -16.5%
Gujarati 0.4% -18.1% -26.8% -18.6% -19.0%
Kannada -3.2% -18.8% -16.5% -28.8% -23.7%
Tamil -1.5% -28.2% -18.1% -24.6% -1.6%
Telugu -9.3% -9.7% -20.1% -27.5% -17.2%
Inference:
There has been a consistent drop in Class I enrolments across all mediums of instruction, except English,
between 2009-10 and 2013-14.
13 State of Municipal Education in Mumbai
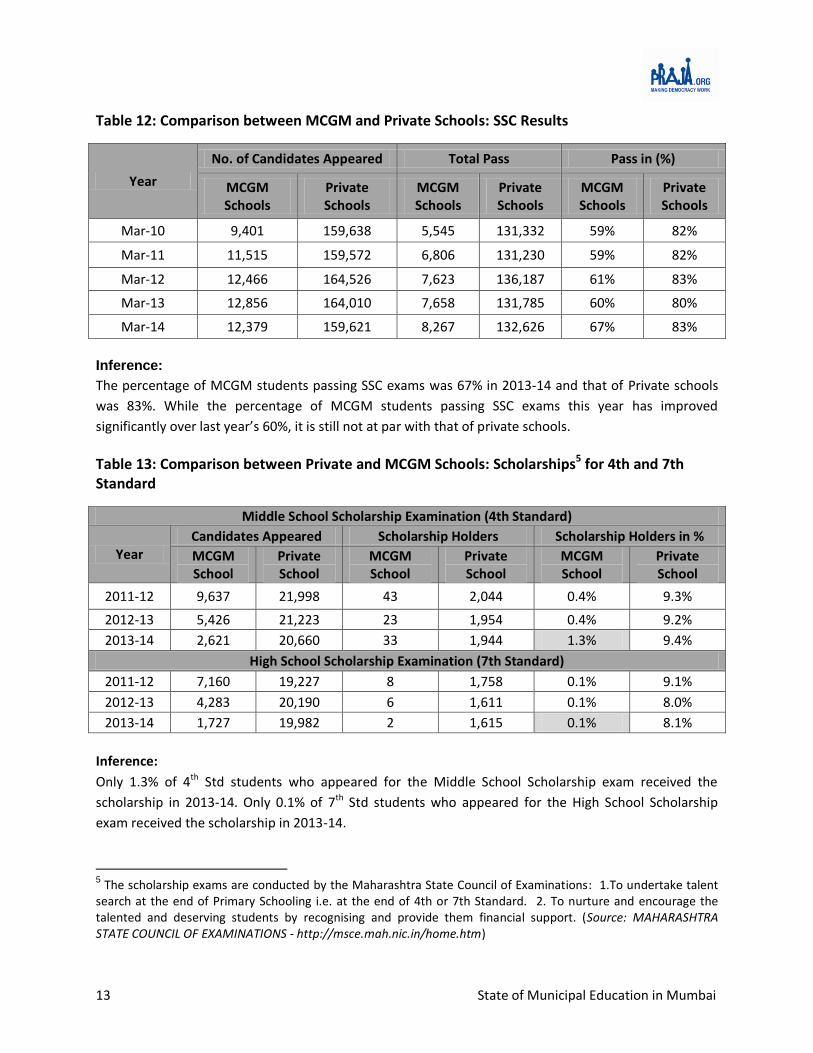
Table 12: Comparison between MCGM and Private Schools: SSC Results
Year
No. of Candidates Appeared Total Pass Pass in (%)
MCGM Schools
Private Schools
MCGM Schools
Private Schools
MCGM Schools
Private Schools
Mar-10 9,401 159,638 5,545 131,332 59% 82%
Mar-11 11,515 159,572 6,806 131,230 59% 82%
Mar-12 12,466 164,526 7,623 136,187 61% 83%
Mar-13 12,856 164,010 7,658 131,785 60% 80%
Mar-14 12,379 159,621 8,267 132,626 67% 83%
Inference:
The percentage of MCGM students passing SSC exams was 67% in 2013-14 and that of Private schools
was 83%. While the percentage of MCGM students passing SSC exams this year has improved
significantly over last year’s 60%, it is still not at par with that of private schools.
Table 13: Comparison between Private and MCGM Schools: Scholarships5 for 4th and 7th Standard
Middle School Scholarship Examination (4th Standard)
Year Candidates Appeared Scholarship Holders Scholarship Holders in %
MCGM School
Private School
MCGM School
Private School
MCGM School
Private School
2011-12 9,637 21,998 43 2,044 0.4% 9.3%
2012-13 5,426 21,223 23 1,954 0.4% 9.2%
2013-14 2,621 20,660 33 1,944 1.3% 9.4%
High School Scholarship Examination (7th Standard)
2011-12 7,160 19,227 8 1,758 0.1% 9.1%
2012-13 4,283 20,190 6 1,611 0.1% 8.0%
2013-14 1,727 19,982 2 1,615 0.1% 8.1%
Inference:
Only 1.3% of 4th Std students who appeared for the Middle School Scholarship exam received the
scholarship in 2013-14. Only 0.1% of 7th Std students who appeared for the High School Scholarship
exam received the scholarship in 2013-14.
5 The scholarship exams are conducted by the Maharashtra State Council of Examinations: 1.To undertake talent
search at the end of Primary Schooling i.e. at the end of 4th or 7th Standard. 2. To nurture and encourage the talented and deserving students by recognising and provide them financial support. (Source: MAHARASHTRA STATE COUNCIL OF EXAMINATIONS - http://msce.mah.nic.in/home.htm)
14 State of Municipal Education in Mumbai
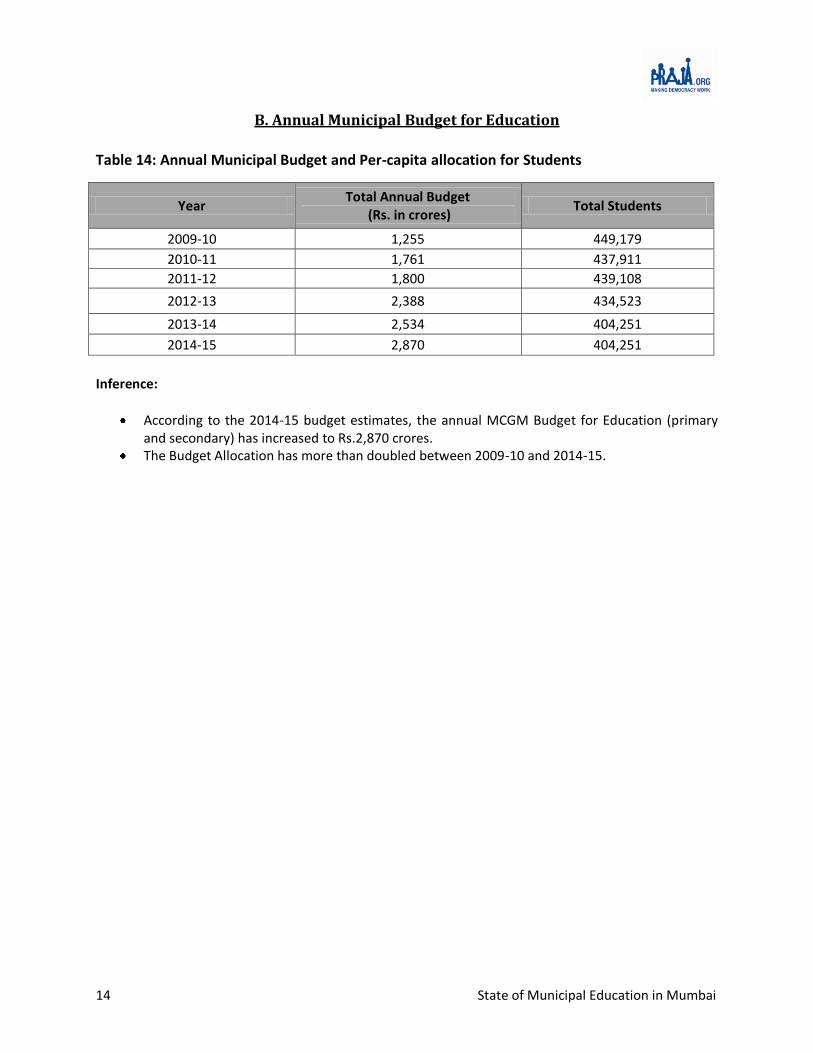
B. Annual Municipal Budget for Education
Table 14: Annual Municipal Budget and Per-capita allocation for Students
Year Total Annual Budget
(Rs. in crores) Total Students
2009-10 1,255 449,179
2010-11 1,761 437,911
2011-12 1,800 439,108
2012-13 2,388 434,523
2013-14 2,534 404,251
2014-15 2,870 404,251
Inference:
According to the 2014-15 budget estimates, the annual MCGM Budget for Education (primary and secondary) has increased to Rs.2,870 crores.
The Budget Allocation has more than doubled between 2009-10 and 2014-15.

15 State of Municipal Education in Mumbai
Table 15: Per-child Allocation and Expenditure (In Rs. Crore)
Account Head
Budget Estimates 2012-13
Actual expenditu
re 2012-13
Budget Estimates 2013-14
Actual expendi
ture 2013-14
Budget Estimates 2014-15
Primary Education
Total Revenue Expenses 1,976 1,585 2,176 1,329 2,313
Total Project works/Capital Expenses (A) 287 163 217 127 345
Total Primary education (i) 2,263 1,748 2,394 1,456 2,658
Secondary Education
Total Revenue Expenses 124 135 138 83 208
Total Project works/Capital Expenses (B) 2 1 2 1 4
Total secondary education (ii) 126 136 140 84 212
Total Education Budget (C) (i + ii = C) 2,388 1,884 2,534 1,540 2,870
% Utilisation 79% 61% -
Less: Grants to Private Primary aided School (D)
254 200 283 242 415
Total (C-D) 2,135 1,683 2,251 1,298 2,455
Total students 434,523 434,523 404,251 404,251 404,251
Per Capita cost for every student6 (in rupees)
49,127 38,742 55,676 32,118 60,729
Less: Total Project works/Capital Expenses and Grants(A+B+D=E)
542 364 503 370 765
Total (C-E) 1,846 1,520 2,031 1,170 2,106
Per Capita cost for every student (in rupees)
42,478 34,972 50,247 28,945 52,086
Inference:
Per-child allocation for municipal school students has increased to Rs.60,729 as per Budget Estimates 2014-15 (excluding grants to private primary aided schools), as compared to Rs.55,676 per child in 2013-14. This estimate takes into account revenue expenses as well as capital expenses/project works.
Even after deducting capital expenses from the budget, we find that per child allocation has increased to Rs.52,086 in 2014-15, as compared to Rs.50,247 in 2013-14.
Per-child actual expenditure in 2013-14 was Rs.28,945, as compared to Rs.34,972 in 2012-13.
Utilisation of the budget in 2013-14 dipped to 61%, as compared to 79% in 2012-13.
6 Since the number of students for academic year 2014-15 is not available, the number of students for 2013-14 has been used to estimate per child allocation for 2014-15.

16 State of Municipal Education in Mumbai
Table 16: Budgeted vs. Actual Expenditure Summary 2013-14 (In Rs. Crore)
Sr. No Account Head Budgeted7 Actual % Utilisation
1. Establishment Expenses 917 716 78%
2. Administrative Expenses 65 53 83%
3. Operation and Maintenance 271 71 26%
4. Finance and Interest Charges 0.5 0.5 98%
5. Programme Expenses 23 7 28%
6. Revenue Grants, Contribution & Subsidies 967 720 75%
7. Depreciation & Others - 16 -
8. Prior Period 71 172 -
Total Revenue Expenses 2,315 1,412 61%
Project Works/Capital Expenses 219 128 58%
Grand Total 2,534 1,540 61%
Inference:
In Table 15, we have analysed the account head-wise actual expenditure in 2013-14, in comparison with
the budget allocation for the main account heads.
Utilisation of the revenue budget was 61% in 2013-14, while utilisation of the capital budget was
58%.
Only 28% of the budget for Programme Expenses, and 26% of the budget for operations and
maintenance was utilised in 2013-14. Programme Expenses include education related
programmes, training courses for teachers, Balkotsav, sports events, excursions, bus fare to
students, scouting related activities and so on.
7 As per consumable budget 2013-14.
17 State of Municipal Education in Mumbai
EducationOfficer
Administrative Setup
Deputy Education Officers
Administrative Officer (A.O.
Schools)
Head Clerks and Clerks
Academic Setup
Superintendent (Schools)
School Inspectors
Schools, HM, Dy. HM, Teachers
etc.
C. Monitoring and Evaluation
The MCGM Department of Education is broadly divided into two wings: the Administrative wing and the
Academic Wing. The Municipal Commissioner is at the top of its hierarchy, followed by the Additional
Municipal Commissioner (Education), the Deputy Municipal Commissioner (Education) and the
Education Officer, in that order. Following is the hierarchy8 of the two wings:
Out of the 50-odd functions9 assigned to a School Inspector of the MCGM Education Department, some of the important functions are as follows:
Pay 40 surprise visits to all MPS/Primary/Secondary/Private Primary Schools in a month
Check monthly reports of schools, prepare a compiled report for the senior management
Compile all statistical information received from schools
Collect information related to the Right to Information Act
Act as the Representative of the Education Department in the School Management/Parent
Teacher Committees of Secondary schools
Check all schools bills such as electricity, broadband, other accounts of schools etc.
Conduct 100% evaluation of all students with respect to the three R’s- reading, writing and
basic arithmetic and ensure that all students meet basic learning outcomes with respect to them
Ensure that no student drops out of school and provide guidance to Headmasters/Principals to
achieve the same
Ensure compliance of schools with the norms laid down under Section 19 and Section 25 of the
Right to Education Act.
Thus, Inspectors form a critical link between the Education Department and schools on the ground.
They are entrusted with various important roles and responsibilities that are indispensable in the
academic and administrative setup of the Department. However, we find that apart from the pivotal
functions of keeping a check on the teaching-learning processes in classrooms, school inspectors are
saddled with a wide range of administrative duties.
8 The chart has been simplified for representation purposes. Hence, some levels of hierarchy have not been shown separately. Source: http://portal.mcgm.gov.in/irj/go/km/docs/documents/MCGM%20Department%20List/Education%20Officer/RTI%20Manuals/Education_Officer_RTI_E01.pdf 9 Source: Information received from Department of Education, MCGM under Right to Information Act (2005).
18 State of Municipal Education in Mumbai
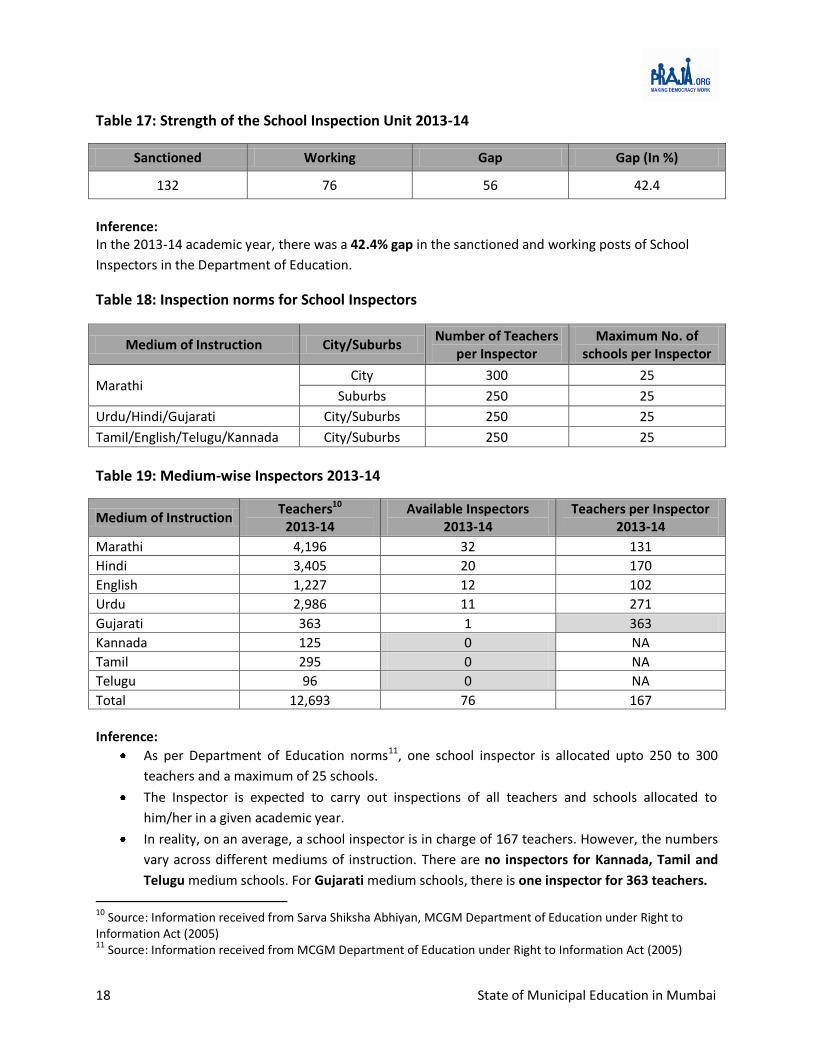
Table 17: Strength of the School Inspection Unit 2013-14
Sanctioned Working Gap Gap (In %)
132 76 56 42.4
Inference: In the 2013-14 academic year, there was a 42.4% gap in the sanctioned and working posts of School
Inspectors in the Department of Education.
Table 18: Inspection norms for School Inspectors
Medium of Instruction City/Suburbs Number of Teachers
per Inspector Maximum No. of
schools per Inspector
Marathi City 300 25
Suburbs 250 25
Urdu/Hindi/Gujarati City/Suburbs 250 25
Tamil/English/Telugu/Kannada City/Suburbs 250 25
Table 19: Medium-wise Inspectors 2013-14
Medium of Instruction Teachers10
2013-14 Available Inspectors
2013-14 Teachers per Inspector
2013-14
Marathi 4,196 32 131
Hindi 3,405 20 170
English 1,227 12 102
Urdu 2,986 11 271
Gujarati 363 1 363
Kannada 125 0 NA
Tamil 295 0 NA
Telugu 96 0 NA
Total 12,693 76 167
Inference:
As per Department of Education norms11, one school inspector is allocated upto 250 to 300
teachers and a maximum of 25 schools.
The Inspector is expected to carry out inspections of all teachers and schools allocated to
him/her in a given academic year.
In reality, on an average, a school inspector is in charge of 167 teachers. However, the numbers
vary across different mediums of instruction. There are no inspectors for Kannada, Tamil and
Telugu medium schools. For Gujarati medium schools, there is one inspector for 363 teachers.
10
Source: Information received from Sarva Shiksha Abhiyan, MCGM Department of Education under Right to Information Act (2005) 11 Source: Information received from MCGM Department of Education under Right to Information Act (2005)
19 State of Municipal Education in Mumbai
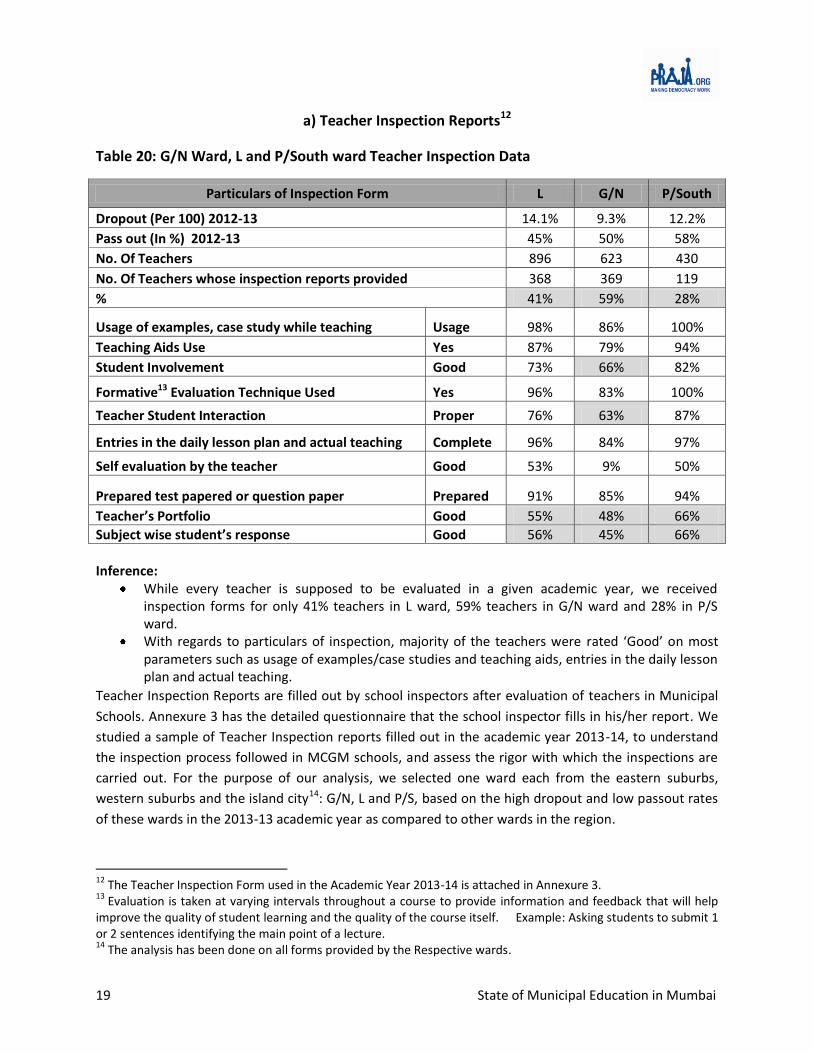
a) Teacher Inspection Reports12
Table 20: G/N Ward, L and P/South ward Teacher Inspection Data
Particulars of Inspection Form L G/N P/South
Dropout (Per 100) 2012-13 14.1% 9.3% 12.2%
Pass out (In %) 2012-13 45% 50% 58%
No. Of Teachers 896 623 430
No. Of Teachers whose inspection reports provided 368 369 119
% 41% 59% 28%
Usage of examples, case study while teaching Usage 98% 86% 100%
Teaching Aids Use Yes 87% 79% 94%
Student Involvement Good 73% 66% 82%
Formative13 Evaluation Technique Used Yes 96% 83% 100%
Teacher Student Interaction Proper 76% 63% 87%
Entries in the daily lesson plan and actual teaching Complete 96% 84% 97%
Self evaluation by the teacher Good 53% 9% 50%
Prepared test papered or question paper Prepared 91% 85% 94%
Teacher’s Portfolio Good 55% 48% 66%
Subject wise student’s response Good 56% 45% 66%
Inference: While every teacher is supposed to be evaluated in a given academic year, we received
inspection forms for only 41% teachers in L ward, 59% teachers in G/N ward and 28% in P/S ward.
With regards to particulars of inspection, majority of the teachers were rated ‘Good’ on most parameters such as usage of examples/case studies and teaching aids, entries in the daily lesson plan and actual teaching. [ [
Teacher Inspection Reports are filled out by school inspectors after evaluation of teachers in Municipal
Schools. Annexure 3 has the detailed questionnaire that the school inspector fills in his/her report. We
studied a sample of Teacher Inspection reports filled out in the academic year 2013-14, to understand
the inspection process followed in MCGM schools, and assess the rigor with which the inspections are
carried out. For the purpose of our analysis, we selected one ward each from the eastern suburbs,
western suburbs and the island city14: G/N, L and P/S, based on the high dropout and low passout rates
of these wards in the 2013-13 academic year as compared to other wards in the region.
12 The Teacher Inspection Form used in the Academic Year 2013-14 is attached in Annexure 3. 13 Evaluation is taken at varying intervals throughout a course to provide information and feedback that will help improve the quality of student learning and the quality of the course itself. Example: Asking students to submit 1 or 2 sentences identifying the main point of a lecture. 14 The analysis has been done on all forms provided by the Respective wards.
20 State of Municipal Education in Mumbai
b) Enquiries conducted against Teaching staff (Teachers/HMs) and suspensions
We filed an RTI application with the Education Department regarding enquiries conducted against
teaching staff and the reasons for the same. We also asked for information on whether any staff
member’s services were terminated and the reasons for the same. Our objective was to get a better
understanding of the accountability mechanisms in place in the Education Department; whether
teaching staff is held accountable for not performing their duties. We found that in the academic years
2011-12, 2012-13 and 2013-14:
Enquiries were conducted against 51 staff members (headmasters, Dy. Headmasters and
teacher/trainers)
Six staff members were terminated from services for various reasons.
c) Continuous Comprehensive Evaluation
Continuous and Comprehensive Evaluation (CCE) refers to a system of school-based assessment of students that is designed to cover all aspects of students' development. The new evaluation system was introduced under the Right to Education Act (2009). It is a developmental process of assessment which emphasizes on two fold objectives, continuity in evaluation, and assessment of broad based learning and behavioural outcomes. The scheme is thus a curricular initiative, attempting to shift emphasis from memorizing to holistic learning. It aims at creating citizens possessing sound values, appropriate skills and desirable qualities besides academic excellence. It is hoped that this will equip the learners to meet the challenges of life with confidence and success. It is the task of school based co-scholastic assessment to focus on holistic development that will lead to lifelong learning. As per the guidelines for evaluation, teachers should aim at helping the child to obtain minimum C2 grade. It will be compulsory for a teacher and school to provide extra guidance and coaching to children who score grade D or below, and help them attain minimum C2 grade. Under any circumstances, no child should be detained in the same class.
We studied CCE forms of students studying in the 4th and 7th Std of MCGM schools in the following six wards: C, D,
E, G/N, P/S and L. Following is the marking scheme used under CCE:
A1 and A2 as A (marks between 100% to 81%),
B1and B2 as B (marks between 80% to 61%)
C1 and C2 as C (marks between 60% to 40%),
Less than C2 is below 40%.
‘Less than C2’ in turn includes three grades: D, E1 and E2
D: 33% to 40%
E1: Students that have never been enrolled in a school. This is an indicator of out of school children.
E2: As per RTE norms, students continuously absent for a month or more are graded as E2 under the
CCE system. This is an indicator of students who are irregular in their attendance.
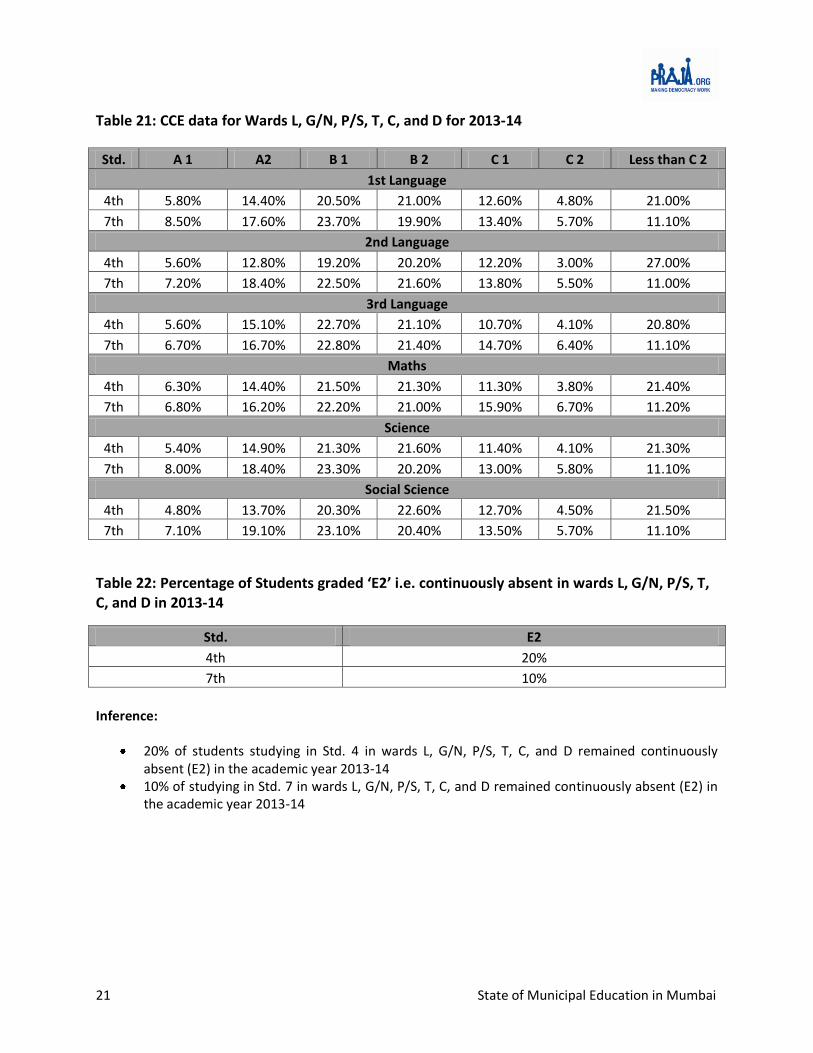
21 State of Municipal Education in Mumbai
Table 21: CCE data for Wards L, G/N, P/S, T, C, and D for 2013-14
Std. A 1 A2 B 1 B 2 C 1 C 2 Less than C 2
1st Language
4th 5.80% 14.40% 20.50% 21.00% 12.60% 4.80% 21.00%
7th 8.50% 17.60% 23.70% 19.90% 13.40% 5.70% 11.10%
2nd Language
4th 5.60% 12.80% 19.20% 20.20% 12.20% 3.00% 27.00%
7th 7.20% 18.40% 22.50% 21.60% 13.80% 5.50% 11.00%
3rd Language
4th 5.60% 15.10% 22.70% 21.10% 10.70% 4.10% 20.80%
7th 6.70% 16.70% 22.80% 21.40% 14.70% 6.40% 11.10%
Maths
4th 6.30% 14.40% 21.50% 21.30% 11.30% 3.80% 21.40%
7th 6.80% 16.20% 22.20% 21.00% 15.90% 6.70% 11.20%
Science
4th 5.40% 14.90% 21.30% 21.60% 11.40% 4.10% 21.30%
7th 8.00% 18.40% 23.30% 20.20% 13.00% 5.80% 11.10%
Social Science
4th 4.80% 13.70% 20.30% 22.60% 12.70% 4.50% 21.50%
7th 7.10% 19.10% 23.10% 20.40% 13.50% 5.70% 11.10%
Table 22: Percentage of Students graded ‘E2’ i.e. continuously absent in wards L, G/N, P/S, T, C, and D in 2013-14
Std. E2
4th 20%
7th 10%
Inference:
20% of students studying in Std. 4 in wards L, G/N, P/S, T, C, and D remained continuously absent (E2) in the academic year 2013-14
10% of studying in Std. 7 in wards L, G/N, P/S, T, C, and D remained continuously absent (E2) in the academic year 2013-14
22 State of Municipal Education in Mumbai
Notes on Data: The data presented in Tables 19 and 20 has been compiled from two applications to the Administrative Officer of Schools of wards L, G/N, P/S, T, C, and D under the Right to Information Act:
We had applied to the Administrative Officer (A.O.) of Schools for copies of the Continuous Comprehensive Evaluation (CCE) reports of students of std. 4 and std. 7 of all schools in their wards. In our application, we had also specifically asked for number of students graded as ‘E2’ i.e. students continuously absent as per RTE norms. However, incomplete data was provided to us, as CCE reports for all schools were not furnished. Only the summary tables were provided for most schools (i.e. Grades A1 to Less than C2); the number of ‘E2’ students was not provided by all schools. The data presented in Table 20 for grades ‘A1, A2, B1, B2, C1, C2 and Less than C2’ has been compiled from the above source.
The compiled data for all schools about the progress reports of children as per CCE was not available with the A.O. Schools office. Moreover, even in case of data collected from schools, 100% data has not been provided. Data on the number of students graded as ’E2’ in Table 20 was collected also collected from the A.O.s, under a separate application asking for continuously absent students.
This is a telling comment on the quality of monitoring and evaluation at the administrative level, as the data recording, collation and management systems are found to be weak.

23 State of Municipal Education in Mumbai
D. Compliance with norms laid down under Right to Education Act
Table 23: Compliance with Infrastructure and other norms under RTE15
Indicator : Schools with Infrastructure Facilities Available
Govt. and Local bodies
Pvt. Aided Pvt. Unaided
Un-recognised
Total Schools 1266 443 653 110
Building Number 1266 443 653 110
% 100.00 100.00 100.00 100.00
Office cum store cum HM room
Number 1212 416 620 105
% 95.73 93.91 94.95 95.45
One class room for every teacher
Number 1006 265 295 78
% 79.46 59.82 45.18 70.91
Ramp Number 1125 394 503 44
% 88.86 88.94 77.03 40.00
Separate Toilet for Boys
Number 1261 426 614 108
% 99.61 96.16 94.03 98.18
Separate Toilet for Girls
Number 1264 433 635 107
% 99.84 97.74 97.24 97.27
Drinking Water Facility
Number 1266 443 653 110
% 100.00 100.00 100.00 100.00
Kitchen Shed (Govt. &Aided Schools)
Number 1071 383 615 106
% 84.60 86.46 94.18 96.36
Boundary Wall Number 1221 394 593 81
% 96.45 88.94 90.81 73.64
Playground Number 1183 386 538 79
% 93.44 87.13 82.39 71.82
Indicator: Outcomes MCGM Private
SSC Number 8,267 132,626
% 67% 83%
Middle School Scholarship (4th)
Number 33 1,944
% 1.3% 9.4%
High School Scholarship (7th)
Number 2 1,615
% 0.1% 8.1%
15 Norms of Schools with Infrastructure facilities available , as specified under section 19 of "The right of children
to free and compulsory education Act,2009"

24 State of Municipal Education in Mumbai
Inference:
A significant proportion of MCGM schools adhere to the infrastructure norms specified under the Right
to Education Act. However, good infrastructure facilities have not translated into the desired learning
outcomes as indicated by the Scholarship and SSC results of these schools. The SSC passing rate of
MCGM Schools is just 67% and scholarship holders are just 1.3% and 0.1% (4th and 7th standard
respectively) of those who have appeared for the scholarship exams.
Class Size Class size is defined as the number of pupils in a class with one teacher. This measurement is particularly
useful in providing information on the size of class an average teacher will have to teach and therefore
gives an insight into classroom processes. Smaller classes are often perceived as allowing teachers to
focus more on the needs of individual students and reducing the amount of class time needed to deal
with disruptions.
a) Student Classroom Ratio16 Average number of pupils (students) per classroom in primary/upper primary/secondary schools in a
given school-year.
Table 24: Student Classroom Ratio (SCR) in MCGM Schools
Indicators 2013-14
Number of classrooms(1 to 8) 15,742
Number of classrooms(9 to 10) 557
Student Classroom Ratio (SCR) 25
Primary schools having SCR more than 30 Number 26
Upper Primary /Sec./Higher Sec. schools having SCR more than 35
Number 149
Inference:
In 175 municipal schools, the Student Classroom Ratio is higher than that specified under the Right to
Education Act i.e. 30 for primary schools and 35 for upper primary, secondary and higher secondary
schools.
16
Source: Educational Indicators: http://www.ncert.nic.in/html/pdf/educationalsurvey/Manual_on_Statistics_and_Indicators_of_School_Education/Educational_Indicators___Final___2.pdf
25 State of Municipal Education in Mumbai
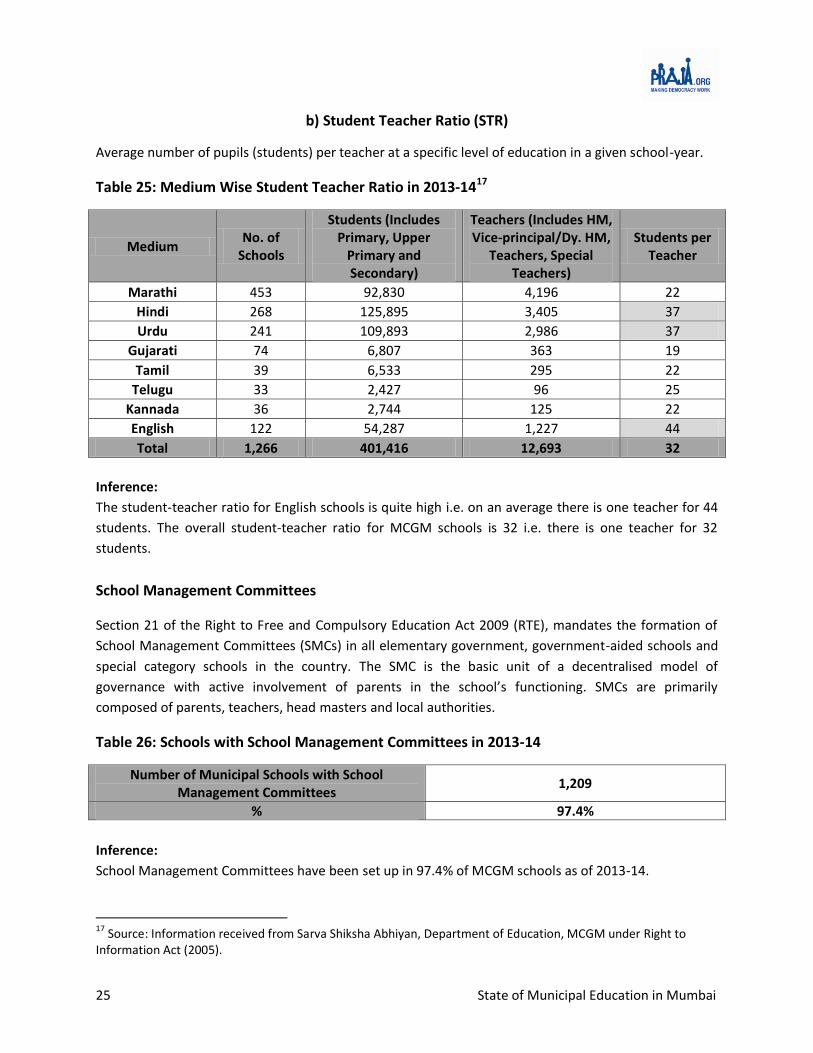
b) Student Teacher Ratio (STR)
Average number of pupils (students) per teacher at a specific level of education in a given school-year.
Table 25: Medium Wise Student Teacher Ratio in 2013-1417
Medium No. of
Schools
Students (Includes Primary, Upper
Primary and Secondary)
Teachers (Includes HM, Vice-principal/Dy. HM,
Teachers, Special Teachers)
Students per Teacher
Marathi 453 92,830 4,196 22
Hindi 268 125,895 3,405 37
Urdu 241 109,893 2,986 37
Gujarati 74 6,807 363 19
Tamil 39 6,533 295 22
Telugu 33 2,427 96 25
Kannada 36 2,744 125 22
English 122 54,287 1,227 44
Total 1,266 401,416 12,693 32
Inference:
The student-teacher ratio for English schools is quite high i.e. on an average there is one teacher for 44
students. The overall student-teacher ratio for MCGM schools is 32 i.e. there is one teacher for 32
students.
School Management Committees
Section 21 of the Right to Free and Compulsory Education Act 2009 (RTE), mandates the formation of
School Management Committees (SMCs) in all elementary government, government-aided schools and
special category schools in the country. The SMC is the basic unit of a decentralised model of
governance with active involvement of parents in the school’s functioning. SMCs are primarily
composed of parents, teachers, head masters and local authorities.
Table 26: Schools with School Management Committees in 2013-14
Number of Municipal Schools with School Management Committees
1,209
% 97.4%
Inference:
School Management Committees have been set up in 97.4% of MCGM schools as of 2013-14.
17 Source: Information received from Sarva Shiksha Abhiyan, Department of Education, MCGM under Right to Information Act (2005).

26 State of Municipal Education in Mumbai
III. Deliberation by Municipal Councillors
Table 27: Number of questions asked by Councillors on Education in all Committees
Name of Committee No. of
Questions 2012-13
No. of Questions 2013-14
MCGM General Body Meeting (GBM) 32 45
Education Committee 62 45
Ward Committee 23 29
Other Committees 17 14
Total 134 133
Inference:
133 questions were asked by MCGM Councillors on Education in all meetings of the Corporation
between April 2013 and March 2014, as compared to 134 questions in the previous year.
Table 28: Category wise number of Questions asked by Councillors on Education
No. of Questions Asked No. of Councillors
2012-13 No. of Councillors
2013-14
0 164 157
1 35 43
2 to 4 23 21
Above 4 5 6
Total 227 227
Inference:
157 Councillors have not asked a single question on the subject of Education, while another 43
Councillors have only asked one question each between April 2013- March 2014.
27 State of Municipal Education in Mumbai
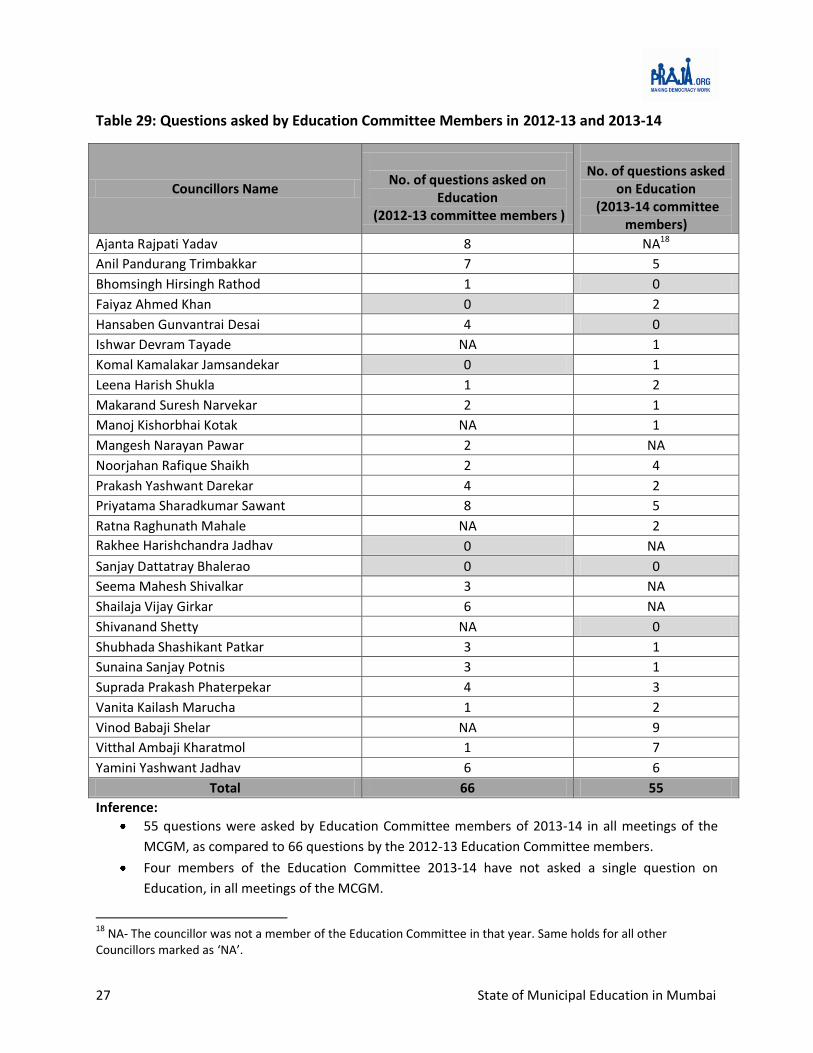
Table 29: Questions asked by Education Committee Members in 2012-13 and 2013-14
Councillors Name
No. of questions asked on
Education (2012-13 committee members )
No. of questions asked
on Education (2013-14 committee
members)
Ajanta Rajpati Yadav 8 NA18
Anil Pandurang Trimbakkar 7 5
Bhomsingh Hirsingh Rathod 1 0
Faiyaz Ahmed Khan 0 2
Hansaben Gunvantrai Desai 4 0
Ishwar Devram Tayade NA 1
Komal Kamalakar Jamsandekar 0 1
Leena Harish Shukla 1 2
Makarand Suresh Narvekar 2 1
Manoj Kishorbhai Kotak NA 1
Mangesh Narayan Pawar 2 NA
Noorjahan Rafique Shaikh 2 4
Prakash Yashwant Darekar 4 2
Priyatama Sharadkumar Sawant 8 5
Ratna Raghunath Mahale NA 2
Rakhee Harishchandra Jadhav 0 NA
Sanjay Dattatray Bhalerao 0 0
Seema Mahesh Shivalkar 3 NA
Shailaja Vijay Girkar 6 NA
Shivanand Shetty NA 0
Shubhada Shashikant Patkar 3 1
Sunaina Sanjay Potnis 3 1
Suprada Prakash Phaterpekar 4 3
Vanita Kailash Marucha 1 2
Vinod Babaji Shelar NA 9
Vitthal Ambaji Kharatmol 1 7
Yamini Yashwant Jadhav 6 6
Total 66 55
Inference:
55 questions were asked by Education Committee members of 2013-14 in all meetings of the
MCGM, as compared to 66 questions by the 2012-13 Education Committee members.
Four members of the Education Committee 2013-14 have not asked a single question on
Education, in all meetings of the MCGM.
18 NA- The councillor was not a member of the Education Committee in that year. Same holds for all other Councillors marked as ‘NA’.

28 State of Municipal Education in Mumbai
Table 30: Ward-wise questions asked by councillors on Education in the year April’13 to March’14
Ward No. of
Students No. of
councillors
No. of Councillors who asked
questions on Education
Total questions asked on Education
A 7600 4 2 2
B 2542 3 1 1
C 547 4 1 1
D 2798 7 2 2
E 11432 8 4 11
F/N 32187 10 2 3
F/S 8486 7 1 1
G/N 22211 11 2 2
G/S 14729 9 3 4
H/E 22942 11 4 12
H/W 9493 6 1 3
K/E 15234 15 2 2
K/W 17725 13 5 9
L 35345 15 8 15
M/E 53394 13 8 26
M/W 16324 8 3 7
N 22875 12 2 2
P/N 35507 16 5 14
P/S 15003 8 1 1
R/C 10047 10 2 3
R/N 9420 7 3 4
R/S 12610 11 3 3
S 15719 13 4 4
T 10081 6 1 1
Total 404251 227 70 133
Inference:
Out of 227 councillors, only 70 councillors have asked questions on the subject of Education between
April’13 to March’14. Overall, 133 questions were asked by the 70 councillors.

29 State of Municipal Education in Mumbai
Table 31: Issues raised/Questions asked by Councillors in the year April’13 to March’14
Issues Question asked
Closure of schools 2
Dropout rate 4
Fees/ Donation Related 1
Human Resources Related 7
Higher/Technical Education 2
Infrastructure issues 39
Municipal School Related 23
Primary education 1
Private and Trust school related 4
Schemes/Policies in Education Related 39
Secondary education 2
Student issues related 4
Syllabus/Curriculum 2
Up gradation/reduction of Standards and section of school 3
Total 133
Inference:
In spite of the high dropout rates of students in MCGM schools, only four questions were raised on the
issue during April’13 to March’14.
30 State of Municipal Education in Mumbai
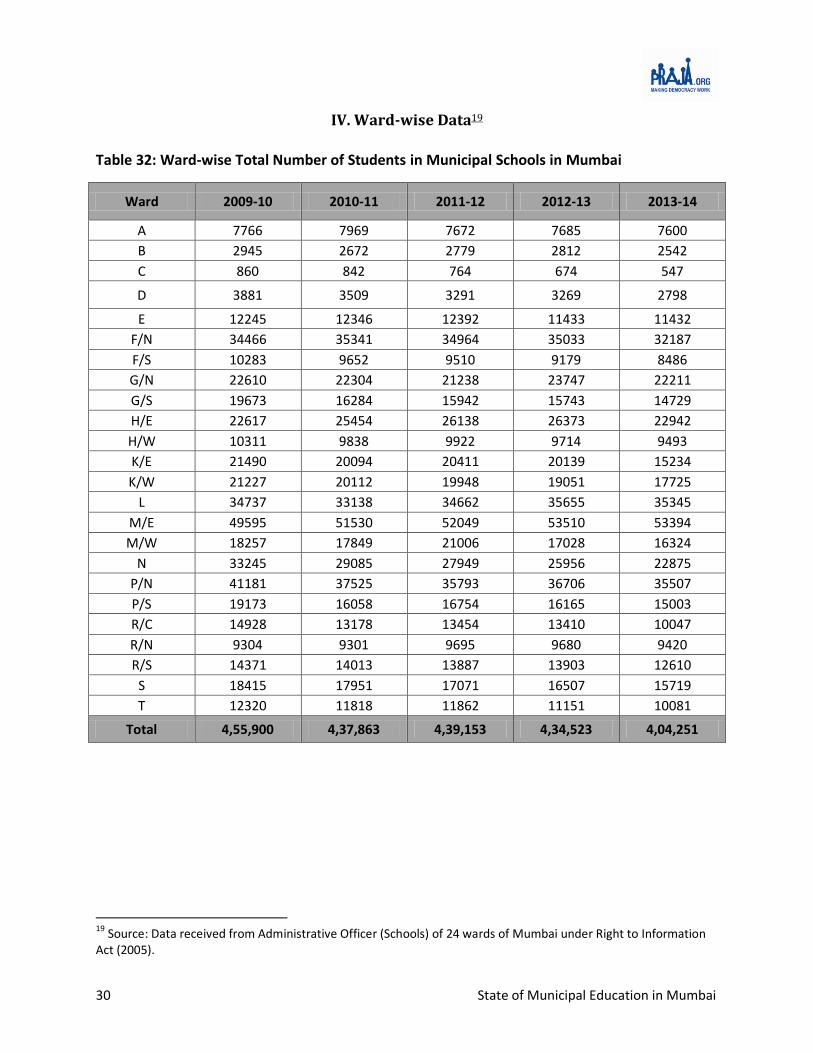
IV. Ward-wise Data19
Table 32: Ward-wise Total Number of Students in Municipal Schools in Mumbai
Ward 2009-10 2010-11 2011-12 2012-13 2013-14
A 7766 7969 7672 7685 7600
B 2945 2672 2779 2812 2542
C 860 842 764 674 547
D 3881 3509 3291 3269 2798
E 12245 12346 12392 11433 11432
F/N 34466 35341 34964 35033 32187
F/S 10283 9652 9510 9179 8486
G/N 22610 22304 21238 23747 22211
G/S 19673 16284 15942 15743 14729
H/E 22617 25454 26138 26373 22942
H/W 10311 9838 9922 9714 9493
K/E 21490 20094 20411 20139 15234
K/W 21227 20112 19948 19051 17725
L 34737 33138 34662 35655 35345
M/E 49595 51530 52049 53510 53394
M/W 18257 17849 21006 17028 16324
N 33245 29085 27949 25956 22875
P/N 41181 37525 35793 36706 35507
P/S 19173 16058 16754 16165 15003
R/C 14928 13178 13454 13410 10047
R/N 9304 9301 9695 9680 9420
R/S 14371 14013 13887 13903 12610
S 18415 17951 17071 16507 15719
T 12320 11818 11862 11151 10081
Total 4,55,900 4,37,863 4,39,153 4,34,523 4,04,251
19 Source: Data received from Administrative Officer (Schools) of 24 wards of Mumbai under Right to Information Act (2005).
31 State of Municipal Education in Mumbai
Table 33: Ward-wise drop in Enrolments between 2009-10 and 2013-14
Ward 2009-10 2013-14 % Change in Enrolments
A 7766 7600 -2%
B 2945 2542 -14%
C 860 547 -36%
D 3881 2798 -28%
E 12245 11432 -7%
F/N 34466 32187 -7%
F/S 10283 8486 -17%
G/N 22610 22211 -2%
G/S 19673 14729 -25%
H/E 22617 22942 1%
H/W 10311 9493 -8%
K/E 21490 15234 -29%
K/W 21227 17725 -16%
L 34737 35345 2%
M/E 49595 53394 8%
M/W 18257 16327 -11%
N 33245 22875 -31%
P/N 41181 35507 -14%
P/S 19173 15003 -22%
R/C 14928 10047 -33%
R/N 9304 9420 1%
R/S 14371 12610 -12%
S 18415 15719 -15%
T 12320 10081 -18%
Total 4,55,900 4,04,251 -11%
32 State of Municipal Education in Mumbai
Table 34: Ward-wise Total Number of Dropout in Municipal Schools in Mumbai20
Ward 2009-
10 in %
2010-11
in % 2011-
12 in %
2012-13
in % 2013-
14
in %
A 549 7.1% 298 3.7% 353 4.6% 615 8.0% 1021 13.4%
B 182 6.2% 71 2.7% 271 9.8% 255 9.1% 107 4.2%
C 26 3.0% 123 14.6% 58 7.6% 0 0.0% 0 0%
D 328 8.5% 202 5.8% 377 11.5% 449 13.7% 469 16.8%
E 851 6.9% 149 1.2% 455 3.7% 678 5.9% 731 6.4%
F/N 2061 6.0% 1187 3.4% 2769 7.9% 4326 12.3% 4346 13.5%
F/S 564 5.5% 26 0.3% 804 8.5% 561 6.1% 693 8.2%
G/N 1243 5.5% 743 3.3% 1448 6.8% 2214 9.3% 2797 12.6%
G/S 805 4.1% 252 1.5% 988 6.2% 1046 6.6% 903 6.1%
H/E 1784 7.9% 835 3.3% 993 3.8% 1568 5.9% 1697 7.4%
H/W 343 3.3% 277 2.8% 981 9.9% 608 6.3% 922 9.7%
K/E 949 4.4% 1043 5.2% 1796 8.8% 1456 7.2% 894 5.9%
K/W 1225 5.8% 1131 5.6% 1406 7.0% 1445 7.6% 98 0.6%
L 2396 6.9% 2039 6.2% 2630 7.6% 5041 14.1% 5960 16.9%
M/E 3189 6.4% 2077 4.0% 4790 9.2% 4681 8.7% 11510 21.6%
M/W 1321 7.2% 1298 7.3% 1081 5.1% 1565 9.2% 1980 12.1%
N 1638 4.9% 643 2.2% 1560 5.6% 1964 7.6% 1403 6.1%
P/N 2925 7.1% 2604 6.9% 2934 8.2% 4410 12.0% 4857 13.7%
P/S 1452 7.6% 600 3.7% 1858 11.1% 1976 12.2% 1912 12.7%
R/C 1208 8.1% 426 3.2% 1255 9.3% 1058 7.9% 762 7.6%
R/N 872 9.4% 561 6.0% 966 10.0% 1949 20.1% 2033 21.6%
R/S 1175 8.2% 737 5.3% 1152 8.3% 687 4.9% 1074 8.5%
S 1602 8.7% 1039 5.8% 1002 5.9% 877 5.3% 671 4.3%
T 780 6.3% 339 2.9% 653 5.5% 582 5.2% 378 3.7%
Total 29,468 6.5% 18,700 4.3% 32,580 7.4% 40,011 9.2% 47,218 11.7%
Inference:
Dropout rates in D, L, M/E and R/N wards were the highest in 2013-14.
20 Source: Data received from Administrative Officer (Schools) of 24 wards of Mumbai under Right to Information Act (2005).

33 State of Municipal Education in Mumbai
Table 35: Ward-wise Total Number of Teachers in Municipal Schools in Mumbai21
Ward 2009-
10
Student teacher
ratio
2010-11
Student teacher
ratio
2011-12
Student teacher
ratio
2012-13
Student teacher
ratio
2013-
14
Student teacher
ratio
A 186 42 175 46 175 44 175 44 130 58
B 90 33 86 31 83 33 81 35 83 31
C 35 25 37 23 32 24 30 22 27 20
D 133 29 118 30 109 30 113 29 113 25
E 398 31 328 38 354 35 391 29 390 29
F/N 863 40 856 41 806 43 881 40 807 40
F/S 297 35 286 34 286 33 336 27 315 27
G/N 628 36 533 42 573 37 650 37 623 36
G/S 590 33 519 31 503 32 480 33 480 31
H/E 649 35 585 44 570 46 630 42 634 36
H/W 294 35 264 37 253 39 264 37 257 37
K/E 595 36 570 35 545 37 658 31 495 31
K/W 580 37 545 37 531 38 547 35 479 37
L 893 39 827 40 873 40 978 36 896 39
M/E 1039 48 1018 51 1035 50 1147 47 1137 47
M/W 459 40 431 41 460 46 463 37 476 34
N 831 40 830 35 885 32 837 31 819 28
P/N 865 48 852 44 841 43 875 42 868 41
P/S 426 45 382 42 400 42 422 38 430 35
R/C 405 37 406 32 383 35 379 35 326 31
R/N 227 41 225 41 256 38 250 39 264 36
R/S 349 41 362 39 353 39 420 33 393 32
S 535 34 522 34 527 32 558 30 542 29
T 399 31 385 31 401 30 432 26 366 28
Total 11,766 39 11,142 39 11,234 39 11,997 36 11,350 36
Inference:
Student-Teacher Ratio in 58 in A ward, 40 in F/N ward, 47 in M/E ward and 41 in P/N ward.
21 Source: Data received from Administrative Officer (Schools) of 24 wards of Mumbai under Right to Information Act (2005). We have not taken Headmasters into account for the calculation of student teacher ratio.
34 State of Municipal Education in Mumbai
Table 36:Ward-wise Total Number of Passouts22 in Municipal Schools in Mumbai
Ward 2009-10 In % 2010-11 In % 2011-12 In % 2012-13 In % 2013-
14 In %
A 178 96% 172 84% 191 90% 264 79% 362 81%
B 119 52% 108 57% 115 56% 84 55% 97 68%
C NA NA NA NA NA NA NA NA NA NA
D 68 39% 55 41% 63 51% 69 62% 79 68%
E 106 61% 137 50% 243 60% 227 58% 231 69%
F/N 374 58% 643 55% 696 74% 678 71% 684 74%
F/S 169 63% 81 29% 181 59% 253 63% 277 74%
G/N 226 61% 308 61% 315 63% 269 50% 410 81%
G/S 769 64% 746 77% 784 77% 637 66% 656 78%
H/E 297 83% 319 50% 414 53% 457 52% 484 59%
H/W 121 58% 152 79% 158 64% 184 71% 152 38%
K/E 65 26% 151 46% 334 52% 398 58% 430 67%
K/W 257 63% 300 54% 310 60% 314 56% 268 47%
L 52 80% 284 65% 196 47% 216 45% 348 79%
M/E NA NA NA NA 81 20% 175 38% 99 16%
M/W 34 40% 238 51% 233 52% 275 54% 355 72%
N 655 50% 887 56% 742 58% 736 60% 777 69%
P/N 911 52% 823 60% 986 68% 935 62% 956 74%
P/S 635 70% 512 70% 527 62% 487 58% 574 78%
R/C 229 67% 293 79% 355 67% 271 61% 240 55%
R/N NA NA NA NA NA NA NA NA NA NA
R/S 205 64% 272 78% 317 68% 300 59% 332 70%
S NA NA 93 53% 132 57% 166 75% 201 79%
T 75 46% 232 54% 250 52% 263 62% 255 62%
Total 5,545 59% 6,806 59% 7,623 61% 7,658 60% 8,431 67%
Inference:
Following wards had the lowest passout rates in 2013-14: H/W with 38%; K/W with 47%; R/C with 55%.
22 C and R/N ward do not have Secondary Schools. Secondary Schools in M/E ward school have started from
academic year 2011-12; in M/W ward secondary schools were started from 2009-2010; in S ward from 2010-11.
Source: Source: Data received from Administrative Officer (Schools) of 24 wards of Mumbai under Right to
Information Act (2005).

35 State of Municipal Education in Mumbai
Annexure 1 – Survey Methodology
Praja Foundation had commissioned the household survey to Hansa Research and the survey
methodology followed is as below:
In order to meet the desired objectives of the study, we represented the city by covering a sample
from each of its 227 wards. Target Group for the study was :
Both Males & Females
18 years and above
Belonging to that particular ward.
Sample quotas were set for representing gender and age groups on the basis of their split available
through Indian Readership Study (Large scale baseline study conducted nationally by Media
Research Users Council (MRUC) & Hansa Research group) for Mumbai Municipal Corporation
Region.
The required information was collected through face to face interviews with the help of structured
questionnaire.
In order to meet the respondent within a ward, following sampling process was followed:
5 prominent areas in the ward were identified as the starting point
In each starting point about 20 individuals were selected randomly and the questionnaire was
administered with them.
Once the survey was completed, sample composition of age & gender was corrected to match the
population profile using the baseline data from IRS. This helped us to make the survey findings more
representatives in nature and ensured complete coverage.
The total study sample was 22,508.

36 State of Municipal Education in Mumbai
Annexure 2 – Socio Economic Classification (SEC) Note
SEC is used to measure the affluence level of the sample, and to differentiate people on this basis and study their
behaviour / attitude on other variables.
While income (either monthly household or personal income) appears to be an obvious choice for such a purpose,
it comes with some limitations:
Respondents are not always comfortable revealing sensitive information such as income.
The response to the income question can be either over-claimed (when posturing for an interview) or
under-claimed (to avoid attention). Since there is no way to know which of these it is and the extent
of over-claim or under-claim, income has a poor ability to discriminate people within a sample.
Moreover, affluence may well be a function of the attitude a person has towards consumption rather
than his (or his household’s) absolute income level.
Attitude to consumption is empirically proven to be well defined by the education level of the Chief Wage Earner
(CWE*) of the household as well as his occupation. The more educated the CWE, the higher is the likely affluence
level of the household. Similarly, depending on the occupation that the CWE is engaged in, the affluence level of
the household is likely to differ – so a skilled worker will be lower down on the affluence hierarchy as compared to
a CWE who is businessman.
Socio Economic Classification or SEC is thus a way of classifying households into groups’ basis the education and
occupation of the CWE. The classification runs from A1 on the uppermost end thru E2 at the lower most end of the
affluence hierarchy. The SEC grid used for classification in market research studies is given below:
EDUCATION
OCCUPATION Illiterate
literate but no
formal schooling
/ School up to 4th
School
5th
– 9th
SSC/
HSC
Some College
but not Grad
Grad/ Post-
Grad Gen.
Grad/ Post-
Grad Prof.
Unskilled Workers E2 E2 E1 D D D D
Skilled Workers E2 E1 D C C B2 B2
Petty Traders E2 D D C C B2 B2
Shop Owners D D C B2 B1 A2 A2
Businessmen/
Industrialists with
no. of employees
None D C B2 B1 A2 A2 A1
1 – 9 C B2 B2 B1 A2 A1 A1
10 + B1 B1 A2 A2 A1 A1 A1
Self-employed Professional D D D B2 B1 A2 A1
Clerical / Salesman D D D C B2 B1 B1
Supervisory level D D C C B2 B1 A2
Officers/ Executives Junior C C C B2 B1 A2 A2
Officers/ExecutivesMiddle/ Senior B1 B1 B1 B1 A2 A1 A1
*CWE is defined as the person who takes the main responsibility of the household expenses.

37 State of Municipal Education in Mumbai
Annexure 3 – Inspection Report Form

38 State of Municipal Education in Mumbai
39 State of Municipal Education in Mumbai
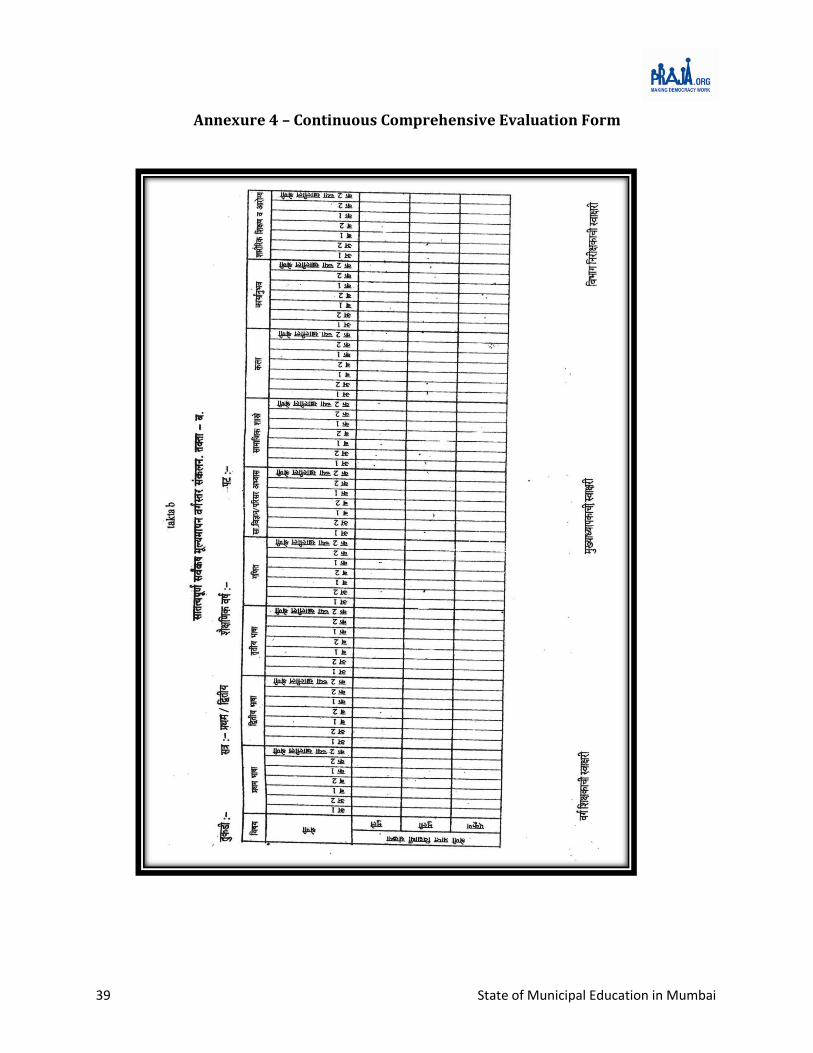
Annexure 4 – Continuous Comprehensive Evaluation Form

40 State of Municipal Education in Mumbai
Annexure 5- Questions asked by MLAs on Education in the 12th Assembly
Name of MLA Political Party Area Mumbai
related Edu. Questions
Total Questions on
Education
Abu Azmi SP Mankhurd Shivaji Nagar 4 101
Amin Patel INC Mumbadevi 46 227
Annie Shekhar INC Colaba 3 5
Ashok Jadhav INC Andheri West 15 65
Aslam Shaikh INC Malad West 29 142
Bala Nandgaonkar MNS Shivadi 72 454
Baldev Khosa INC Versova 2 6
Chandrakant Handore INC Chembur 2 4
Gopal Shetty BJP Borivali 24 96
Jagannath Shetty INC Sion Koliwada 14 68
Kalidas Kolambkar INC Wadala 10 36
Kripashankar Singh INC Kalina 1 5
Krishnakumar Hegde INC Vile Parle 3 14
Madhukar Chavan INC Byculla 27 90
Mangal Prabhat Lodha BJP Malabar Hill 21 122
Mangesh Sangle MNS Vikhroli 67 391
Milind Kamble NCP Kurla (SC) 4 22
Nawab Malik NCP Anushakti Nagar 10 48
Nitin Sardesai MNS Mahim 30 140
Prakash Sawant SS Vandre East 44 210
Prakash Maheta BJP Ghatkopar East 7 19
Pravin Darekar MNS Magathane 39 207
Rajhans Singh INC Dindoshi 10 37
Ramchandra Kadam MNS Ghatkopar West 15 90
Ramesh Thakur INC Kandivali East 18 82
RavindraWaikar SS Jogeshwari East 61 246
Sardar Singh BJP Mulund Amboli 22 147
Shishir Shinde MNS Bhandup West 32 160
Subhash Desai SS Goregaon 47 334
Vinod Ghosalkar SS Dahisar 55 290
Yogesh Sagar BJP Charkop 22 150
Ziyauddin Sidikki INC Vandre West 7 26
Total
763 4034
41 State of Municipal Education in Mumbai
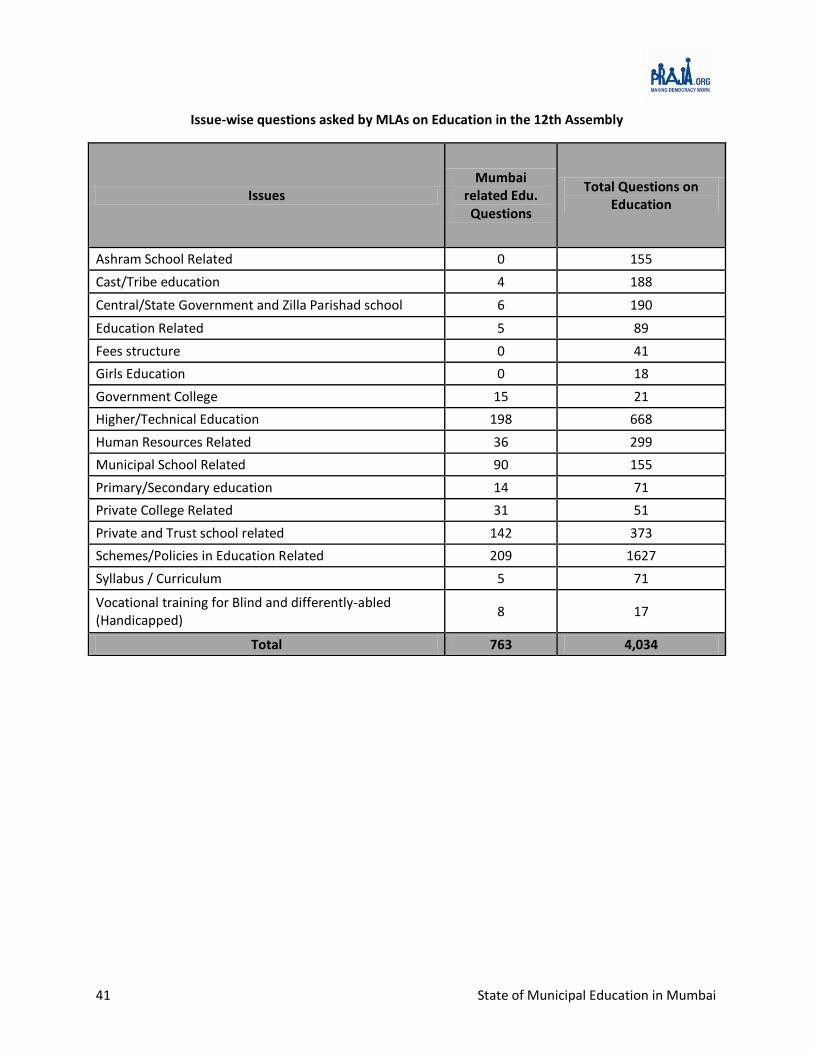
Issue-wise questions asked by MLAs on Education in the 12th Assembly
Issues Mumbai
related Edu. Questions
Total Questions on Education
Ashram School Related 0 155
Cast/Tribe education 4 188
Central/State Government and Zilla Parishad school 6 190
Education Related 5 89
Fees structure 0 41
Girls Education 0 18
Government College 15 21
Higher/Technical Education 198 668
Human Resources Related 36 299
Municipal School Related 90 155
Primary/Secondary education 14 71
Private College Related 31 51
Private and Trust school related 142 373
Schemes/Policies in Education Related 209 1627
Syllabus / Curriculum 5 71
Vocational training for Blind and differently-abled (Handicapped)
8 17
Total 763 4,034


![IELRC.ORG - Brihan Mumbai Municipal Corporation Act, 1888 · This Act may be cited as the '[Mumbai Municipal Corporation] Act. [It] extends only to [Brihan Mumbai]. ... receives the](https://static.fdocuments.in/doc/165x107/608406d4514dd2482753c8c1/ielrcorg-brihan-mumbai-municipal-corporation-act-this-act-may-be-cited-as-the.jpg)