State of Hawaii DEPARTMENT OF LAND AND NATURAL … · On the mainland, subsidence due to...
44
GEOLOGIC HAZARDS IMPACT ANALYSIS OF POTENTIAL GEOTHERMAL RESOURCE AREAS Circular C-107 State of Hawaii DEPARTMENT OF LAND AND NATURAL RESOURCES Division of Water and Land Development Honolulu, Hawaii September 1984
Transcript of State of Hawaii DEPARTMENT OF LAND AND NATURAL … · On the mainland, subsidence due to...

GEOLOGIC HAZARDS IMPACT ANALYSIS
OF POTENTIAL GEOTHERMAL RESOURCE AREAS
Circular C-107
State of Hawaii DEPARTMENT OF LAND AND NATURAL RESOURCES
Division of Water and Land Development
Honolulu, Hawaii September 1984

GEORGE R. ARIYOSHI Governor
BOARD OF LAND AND NATURAL RESOURCES
SUSUMU ONO, Chairperson, Member at Large
ROLAND H. HIGASHI, Hawaii Member
THOMAS S. YAGI, Maui Member
J. DOUGLAS ING, Oahu Member
MOSES W. KEALOHA, Member at Large
LEONARD H. ZALOPANY, Kauai Member
DEPARTl\lENT OF LAND AND NATURAL RESOURCES
SUSUMU ONO, Chairperson and l\lember Board of Land and Natural Resources
EDGAR A. HAl\lASU, Deputy to the Chairperson
ROBERT T. CHUCK, Manager-Chief Engineer Division of Water and Land Development
ii

PREFACE
Act 296, Session Laws of Hawaii 1983, as amended by Act 151,
SLH 1984, requires that the Board of Land and Natural Resources
examine various factors when designating subzone areas for the
exploration, development, and production of geothermal resources.
These factors include potential for production, prospects for
utilization, geologic hazards, social and environmental impacts, land
use compatibility, and economic benefits. The Department of Land and
Natural Resources has prepared a series of reports which addresses
each of the subzone factors. This report analyzes the major geologic
hazards and their resultant effects within potential geothermal areas.
Effects include risks to people and property. Available hazard
mitigation techniques will also be described.
This report was prepared by Joseph Kubacki, Energy Specialist,
in collaboration with Dr. George Walker, Volcanologist with the Hawaii
Institute of Geophysics, and under the general direction of Manabu
Tagomori, Chief Water Resources and Flood Control Engineer, Division
of Water and Land Development, Department of Land and Natural
Resources.
iii

CONTENTS
PREFACE .. . . . . . . . . . . SUMMARY. . . . . . . . . . . . . . . . . . . . . . . . . GEOLOGIC HAZARDS IN HAWAII: THEIR DESCRIPTION AND EFFECT
Lava Flows • . . . . . • • • Pyroclastic Fallout . Ground Cracks .... Ground Subsidence . . Earthquakes . . . . Tsunami . . • . .
. . . . . .
MEASURES TO MITIGATE DAMAGE FROM GEOLOGIC HAZARDS
PAST ATTEMPTS TO MITIGATE GEOLOGIC HAZARDS
Construction of Walls to Restrict Lava Flows in
iii
vii
1 2 3 4 4 5
5
Kapoho, Hawaii . . . • • • • . . • . . • . . • 9 Use of Lava Diversion Walls and Explosives
on Mount Etna, Italy • • • • • . • • . . • • • • • • • 10 Pumping Water on Lava Flows in Kapoho, Hawaii . • • • . 11 Pumping Water on Lava Flows on Heimaey Island, Iceland • 11 Bombing Lava Channels on Mauna Loa, Hawaii. • . • • 12 Emergency Planning at the Geothermal Development
in Krafla, Iceland • • . . . . . . . . . • . 12
GEOLOGIC HAZARD ANALYSIS
Maui
Haleakala Southwest Rift Zone Haleakala East Rift Zone . . . . .
Hawaii
Hualalai . . . . . . . . . Mauna Loa Southwest Rift Zone Mauna Loa Northeast Rift Zone Kilauea Southwest Rift Zone Kilauea Upper East Rift Zone Kilauea Lower East Rift Zone
REFERL~ CES . . . . . . . . . . . . . .
v
13
13 13
14
14 14 15 16 17 20
37

Figure
1
2
3
4
5
6
7
8
9
10
11
12
13
14
15
16A
16B
16C
FIGURES
Map of the Kilauea summit area, showing extent of pumice blanket from Kilauea Iki vent in 1959
Map of part of the east rift zone of Kilauea showing faults, cracks, and lava flows formed in 1961 . .
Map showing the pattern of faults in the Hilina fault system, on the southern flank of Kilauea volcano
Formation of pit craters
Rainfall of Kilauea
Map of the southwestern part of Haleakala volcano, island of Maui, showing the lava flows of the 1790 eruption and the spatter cones at their vents
Map of Haleakala volcano, showing vents of the Kula and Hana Volcanic Series . . • . . • . . . . .
Map of the island of Hawaii, showing the five major volcanoes that make up the island, and the historic lava flows . • . • . . . . . • . . .
Summary of Kilauea's eruption history during the last 1500 years . . . . • . . . • . . . . . • . .
Percentage of ground covered by lava flows, from 1954 to 1984, as it varies with distance north and south of Kilauea's east rift zone axis . . . . . . . . . . . . .
Map showing volcanic rift zones and faults on the island of Hawaii . . . . . . . . . . . .
Zones of relative risk from lava-flow burial
Zones of relative risk from falling volcanic fragments
Volcano rift and shoreline zones subject to relatively high risk from subsidence . • . . . . • . . . .
General areas of high, medium, and low risk from surface ruptures • • . • .
1983 lava flow on Mt. Etna in Italy
Cross-section of explosives placement area
Typical barrier cross-section . . . . . . . . . . . . . . Vi
21
22
23
24
25
26
27
28
29
30
31
32
33
34
35
36
36
36

I
I I
SUMMARY
The same volcanic activity which provide~ the source of
geothermal heat may also create a hazard to people and property.
Volcanic hazards include lava _flows, pyroclastic fallout, ground
deformatiqn, cracking, and subsidence. With proper evacuation
planning, lava flows should not be a great d~Ing~r to peopl~ because __ of
their usually slow speed and somewhat pre_dictable paths; however,
su:bst~tial property damage is a possibility. , -.The table. below
summarizes past eruptive activity.
Historic Eruptions Within Geqtberm~ Resource Areas
Number of Average· Eruptions A rep
Location Since 1750 (km)
Kilauea Upper East Rift* 21 6
Kilauea Lower East Rift* 5 11
Kilauea Southwest Rift 5 7
Mauna Loa. N6rtheast Rift 7 37
Mauna Loa Southwest Rift 7 34
Hualalai 1 46
Haleakala Southwest Rift 1 6
Haleakala East Rift . 0
A . significant phenomenon is unique to Kilauea: the southern
flanks of its rift zones are much more prone to be covered by lava
flows than are the north flanks due to topography. This is clearly
depicted by the chronological maps in figure 9 and by the graph in
figure 10.
*An imaginary line extending approximately north of Kalapana distinguishes the lower and upper east rift zone. Caldera eruptions were not considered.
Vii

Removal of cooled lava would be feasible if the flows were
sufficiently thin and friable, and if the eruption was not lengthy.
Using Kilauea as an example, since 1800, the average duration of an
eruption has been about 60 days, with many lasting only one day and
some, such as the Mauna Ulu and the current Pu'u 0 eruptions,
lasting years.
Since the crust tends to insulate underlying lava, cooling time for
lava increases exponentially with the thickness of the flow. It would
take about 200 days for 1 meter (1000 days for 4 meters) of lava to
cool to 200°C (extrapolated from Peck, 1974). However, cooling time
can be significantly reduced if great amounts of water are applied to a
cooling flow area. (See section on lava cooling effort at Heimaey
Island, Iceland.)
Thus, recovery from a deep or long enduring flow could take
many months. Mitigation techniques may significantly reduce risk from
flows. A long recovery time would not be acceptable to a damaged
electric utility power plant unless sufficient reserve capacity were
available.
Past volcanic activity can suggest future activity, however it is
not possible to detail the specific time and place of future eruptions.
Summit swelling and increasing swarms of volcanic earthquakes can
warn of impending eruptions.
PYROCLASTIC FALLOUT
Explosive eruption fountains may eject rock fragments of many
sizes and types. The weight and depth of fallout can be appreciable
as far as even 500 or 1000 m away from an eruptive vent or fissure.
Large fragments tend to fall close to the vent building cones that may
be tens of meters high. Smaller particles can form a long, narrow,
blanket many feet thick downwind of the vent. Figure 1 shows a
pumice blanket originating from Kilauea Iki vent. Cones tend to be
higher and fallout more extensive on older volcanoes, such as
Haleakala than on Mauna Loa or Kilauea; some cones on Haleakala
exceed 100 meters high.
-2-

The probability of an eruption being powerfully explosive (with
resultant increased debris) increases as the coast is approached and is
near 100% for a vent within about 1 km of the coast. Steam generated
by magma from the near-surface groundwater promotes such
explosiveness. An example of potential damage from pyroclastic fallout
is given by the 1960 Kapoho eruption where some buildings were
destroyed because of the weight of cinder and ash upon their roofs
(Macdonald, 1962). Other dangers from fallout include lung irritation,
poor visibility, anxiety or panic, blockage of escape routes, and
severe cleanup problems.
GROUND CRACKS
Cracks, which may open as much as several feet, can be the
surface expression of dikes that fail to reach the surface. These
cracks can produce a surface graben several meters wide and deep in
which the ground is let down between two parallel cracks. This type
of cracking related to magma movements is concentrated in volcanic rift
zones which are clearly defined and narrow features (see figure 2).
Cracks could also open outside a rift zone; not enough information is
available to access the probability, but it decreases rapidly as the
distance from the rift zone increases.
Ground cracking can also be associated with earthquakes, result
ing from tectonic activity. Their formation is often accompanied by a
relative vertical or lateral displacement of the ground on either side.
Tectonic ground cracking is usually localized in definable zones; e.g.
the Hilina and Koae fault systems at Kilauea (see figure 3) .
Ground cracking across a geothermal plant could cause a suspen
sion of operation, depending on the extent and location of damages.
Pipes carrying steam between the wells and plant are likely to
remain undamaged by moderate ground cracking, since they are
designed with expansion joints at regular intervals.
Ground cracking close to a well bore might open up an alternate
path for the steam and cause its loss from the well. It is unlikely for
-3-

a crack to intercept a well bore due to the vertical pitch of most
cracks.
GROUND SUBSIDENCE
On the mainland, subsidence due to contraction of clay or sand
formations may result from the withdrawal of geothermal fluids in those
formations. In Hawaii, subsidence from geothermal fluid withdrawal is
not likely to be problem; since the islands are generally composed of
dense, yet porous, self-supporting basaltic rock, especially in
geothermal production zones. Of more concern is the volcanic or
tectonic subsidence which usually occurs on or about active rift zones,
e.g. Kilauea.
Small to large grabens may result with the subsidence of rock
blocks (usually rectangular) which are downthrown along or between
cracks, e.g. 1960 Kapoho graben (see section on ground cracks).
Subsidence and cracking may also be associated with tectonic
earthquakes, e.g. subsiding slump blocks in Hilina fault system at
Kilauea (figure 3) .
Collapsing pit craters and lava tubes can result in very severe
localized subsidence. Pit craters usually occur within a summit or
upper rift zone of a volcano. Figure 4 explains their formation which
can result in subsidence up to hundreds of feet. Fragile,
near-surface lava tubes (usually found in pahoehoe flows) are subject
to collapse from heavy surface activity. A geologic site survey could
reveal these hazards.
Aside from the immediate effects subsidence may have on the
foundation and contents of a power plant; subsidence also increases
the hazards from lava flows since flows usually seek lower areas.
EARTHQUAKES
Most earthquakes in Hawaii are volcanic; resulting from
near-surface magma movements. They are small in magnitude and
. usually cause little direct damage. Larger earthquakes tend to be
tectonic, generally resulting from the movement of large rock bodies.
-4-

The largest Hawaiian earthquake occurred on the island of Hawaii in
1868, having a magnitude of 7. 5.
Major earthquake shaking can easily damage buildings; especially
those poorly constructed. Indirect damage may be caused by the
smaller but more frequent volcanic earthquakes; e.g. collapse of lava
tubes, landslides, and compaction (Mullineaux and Peterson, 197 4). It
is recommended that power plants be constructed to withstand shaking
from a 7.5 magnitude earthquake (Stearns).
TSUNAMI
Tsunamis are large sea waves usually generated by movement of
large submarine rock masses although some are caused by volcanic
eruptions. These devastating waves can travel great distances at
speeds of almost 500 mph and move on shore turbulently or merely rise
quietly. The highest reported wave of 60 feet above sea-level resulted
from a local earthquake on the island of Hawaii in 1868 (Macdonald et
al, 1983). Much larger tsunamis have been reported elsewhere.
Thus tsunami hazard is probably localized to a zone of land at
most 2 km wide around the coast, and at elevations below about 75
feet. This should not pose a significant danger to geothermal
developments which are likely to be situated at higher elevations.
MEASURES TO 1\IITIGATE DAMAGE FROM GEOLOGIC HAZARDS
Various methods which could be used to mitigate dangers from
geologic hazards are listed below. No attempt is made to prioritize
methods since priorities may differ with the risks at each specific site.
A survey should be conducted on each development site to closely
examine topography and structural integrity of the surface and sub
surface areas.
• Keep the power plant as far outside the rift zone as is possible
since volcanic activity is concentrated there, e.g. lava flows, lava
-5-

tubes, cracking, subsidence, pit craters, grabens, swelling. The
piping distance from the well field to the power plant is limited
due to increased thermal losses with distance; for example, the
Kahauale'a site development map shows a maximum distance of
about 21 miles from its farthest well to a power plant.
• Power plants and wells should be constructed on the highest
ground available. Even a very small hill or ridge could offer
considerable protection from lava flows. Channels and valleys '
should be avoided, even if upslope, as lava flows tend to be
channeled into and be deepest in these relatively low areas.
• If a sufficiently large hill is not available, a plant or well could
be protected by constructing an earth-and-rock platform several
meters high. Depending on the perceived risk from flow hazard,
wells or plants can be sufficiently fortified to withstand almost
any lava flow (Mullineaux and Peterson, 1974). A cost/risk
analysis would have to be made.
• Another well-protection alternative is to enclose the well-head in a
concrete cellar allowing the lava to flow above rather than around
the well-head. Recovering a well covered with a thick flow could
be quite arduous and time consuming. The precise effect the
lava's heat would have on the well-head mechanisms is not known.
• To complement the platform a berm or wall could be constructed
to divert lava flows. The embankment should be several meters
high around the upslope and cross-slope sides of the structure.
(See section on diversion walls below.)
• Available information indicates that the northern flank of Kilauea's
rift zones are safer than the southern. For example, ground
movements are more frequent on the Kilauea east rift zone's
southern flank. By referring to figure 9 it is apparent that over
the past 250 years the vast majority of erupted lava on Kilauea's
rift zones has flowed over the southern slopes. Figure 10 depicts
the percentage of ground covered by lava in the past 30 years,
as distance varies north and south of the Kilauea east rift zone
axis. A similar relationship does not appear to apply to volcanoes
at other proposed geothermal areas in Hawaii.
-6-

tubes, cracking, subsidence, pit craters, grabens, swelling. The
piping distance from the well field to the power plant is limited
due to increased thermal losses with distance; for example, the
Kahauale'a site development map shows a maximum distance of
about 2! miles from its farthest well to a power plant.
• Power plants and wells should be constructed on the highest
ground available. Even a very small hill or ridge could offer
considerable protection from lava flows. Channels and valleys
should be avoided, even if upslope, as lava flows tend to be
channeled into and be deepest in these relatively low areas.
• If a sufficiently large hill is not available, a plant or well could
be protected by constructing an earth-and-rock platform several
meters high. Depending on the perceived risk from flow hazard,
wells or plants can be sufficiently fortified to withstand almost
any lava flow (Mullineaux and Peterson, 1974). A cost/risk
analysis would have to be made.
• Another well-protection alternative is to enclose the well-head in a
concrete cellar allowing the lava to flow above rather than around
the well-head. Recovering a well covered with a thick flow could
be quite arduous and time consuming. The precise effect the
lava's heat would have on the well-head mechanisms is not known.
• To complement the platform a berm or wall could be constructed
to divert lava flows. The embankment should be several meters
high around the upslope and cross-slope sides of the structure.
(See section on diversion walls below.)
• Available information indicates that the northern flank of Kilauea's
rift zones are safer than the southern. For example, ground
movements are more frequent on the Kilauea east rift zone's
southern flank. By referring to figure 9 it is apparent that over
the past 250 years the vast majority of erupted lava on Kilauea's
rift zones has flowed over the southern slopes. Figure 10 depicts
the percentage of ground covered by lava in the past 30 years,
as distance varies north and south of the Kilauea east rift zone
axis. A similar relationship does not appear to apply to volcanoes
at other proposed geothermal areas in Hawaii.
-6-

• A geologic survey may identify near-surface lava tubes which
could collapse under construction.
• Power plants should be modular and somewhat portable so that, if
all fortifications fail, units might be salvaged and reused. This
tends to encourage use of smaller decentralized plants.
• Steam transmission piping may be protected from a thin, fluid
pahoehoe flow by installing downslope support structures. Thick
aa flows would probably disrupt surface piping. Underground
piping may offer more protection but installation and maintenance
would be quite costly.
• Comprehensive evacuation plans should be designed to assure
worker safety. Warning time prior to inundation can be as little
as one hour (Moore, 1984). Procedures should be established to
protect equipment. Multiple access roads should be provided in
the event one gets covered by a flow.
• The development should coordinate contingency planning with
government field geologists (e.g. Hawaiian Volcano Observatory)
and local civil defense authorities to ascertain when an eruption
appears imminent and what subsequent action should be taken.
Escape and abandonment procedures may be flexible but should be
predetermined and clear. The developers have been giving this
area their attention.
• If a lava flow is impending during well drilling, the well can be
fitted with a pressure and temperature resistant "bridge plug" to
safely isolate and protect the lower, resource-bearing, portion of
the well. These plugs can be installed in one hour (Niimi, 1984).
• Trip wires, placed in the expected path of a lava flow, can alert
development personnel as to the distance and speed of the oncom
ing flow. The crew can then take appropriate action in accord
with their preexisting evacuation plan (Niimi, 1984).
• Protecting structures or machinery against damage by pyroclastic
fallout might be achieved by enclosing those parts vulnerable to
abrasion or contamination. Building roofs should be strong,
having a sufficient pitch so that pyroclastic fallout does not
-7-

accumulate. Access to roofs should be easy so that, if neces
sary, they can be manually kept cleared of pyroclastic material.
• Plant generators can be specifically designed to be adjustable to
some ground surface tilting or subsidence (Capuano, 1984).
• Steam transmission piping can be made with expansion joints to
accommodate appreciable subsidence and ground movements.
• Plants should be constructed to withstand an earthquake of 7. 5
(Stearns).
• Power plants should not be constructed in coastal regions, if risk
from tsunami is to be avoided.
• In extraordinary and particular situations, bombing a lava channel
may cut the feed to a flow-front and prevent or slow further
advance in the front area (see section on bombing lava channels).
• If warranted by volcanic risk, adequate spacing between
developments should be maintained so that one eruption would not
likely endanger more than one development. It is a common
utility practice to maintain reserves sufficient to prevent a major
blackout. Reserve requirements (and associated costs) may be
limited by using small decentralized power plants rather than one
large plant.
• If geothermal development investors assume a major portion of the
economic risk of loss resulting from geologic hazards, then
developers would have a clear economic incentive to utilize
appropriate mitigation measures and to select sites which offer the
optimum balance of safety and productivity.
• It is generally assumed that the resource developers will bear the
risks of loss associated with their activities. However, if the
utility owns the power plant, there may be some question as to
whether the investors or the rate-payers will bear the risks of
loss. This assumption of risk would be reflected in the cost of
electricity from geothermal plants. It may be better that this
cost be apparent "up front" rather than be delayed and possibly
deferred to rate-payers in the event of a catastrophe. In the
past, there have been some 'instances where hazard losses were
recovered by the utility from rate revenues (e.g. Hilo tsunami of
-8-

1960). Policy regarding assigning and clarifying risks of loss
may be implemented by imposing conditions to be met by
development investors prior to the granting of a geothermal
resource permit by the State (conservation district) or Counties
(urban, rural, or agriculture districts).
PAST ATTEMPTS TO MITIGATE GEOLOGIC HAZARDS
CONSTRUCTION OF WALLS TO RESTRICT LAVA FLOWS IN KAPOHO, HAWAII
Macdonald (1962) wrote an excellent article on walls built to
restrict lava flows during the 1959 and 1960 Kilauea eruptions. The
1960 eruption resulted in a flow of 113 million m3 of lava, burying
about 6 km2 of land including most of Kapoho village. Both dams
(which tend to impound flows) and diversion barriers (which alter flow
course) were constructed. Diversion barriers are more likely to be
successful in most situations.
Some of Macdonald's conclusions regarding the effectiveness and
nature of the walls are presented:
- Walls must be constructed of heavy materials; not cinder as lava
tends to burrow under it. Lava-rock is preferred; especially aa
clinker since it is easily bulldozed and its spiny character allow
them to bind well.
- Walls must have a broad base and adequate height to prevent
overflow; e.g. if flow is 10 m thick, the base should be about
30 m wide.
Outwide walls should be gently sloped to lessen erosion should an
overflow develop.
If the wall is a diversion barrier, a smooth unobstructed path or
channel should be along the inside of the wall to promote diverted
flow. In addition, the channel must also have sufficient slope to
promote flow, i.e. at least 2 percent.
-9-

Yielding of walls to lava pressure was limited to only a few places
where wall was built from light cinder.
Macdonald summarizes the success of the Kapoho walls by noting
that "they have demonstrated that properly constructed walls will
endure the thrust of even thick lava flows without yielding; and that
walls with adequately sloping clear channels behind them will success
fully change the course of a flow." Others believe that "structures of
sufficient size and strength could be constructed to divert lava flows
as large as any historic flow ... if the need were great enough a
carefully planned, small-scale system might be f~asible and effective"
(Mullineaux and Peterson, 1974).
USE OF LAVA DIVERSION WALLS AND EXPLOSIVES ON MOUNT ETNA, ITALY
In 1983, lava flows from Mt. Etna in Italy threatened two towns
downslope of an active vent (Figure 16A). In response to the
situation, a lava diversion program was initiated to mitigate damages
from the lava flows. This included two diversion barriers and the use
of explosives.
With explosives, it was intended to create a significant diverting
leak in a channel supplying lava to the flow front. A portion of the
lava channel was removed by heavy equipment to provide for proper
placement of the explosives (Figure 16B). It was observed that
efforts to cool the drill (using. water and dry ice) cooled the lava,
thereby reducing the cross-sectional area of the lava tube and causing
the lava to "back-up" and overflow the lava tube; this resulted in
some unintended but welcomed lava diversion. 400 kg of explosives
were finally inserted and detonated which caused a small lava flow
away from the main lava tube.
The diversion barriers were quite substantial (Figure 16C); one
being 150,000 m 3 and 500 m long, the other 120,000 m 3 and 300 m
long. Work continued while lava was accumulating on the interior of
the diversion wall. The first barrier, though eventually overtopped,
-10-

caused major channels to be diverted from one town. The second
barrier also succeeded in diverting the lava away from a second town.
This effort was quite substantial, utilizing 100 pieces of major
equipment and over 100 men (working 90 hours per week), at a cost of
$3 million. However, savings due to prevention of property loss were
estimated at $5-25 million. (See Williams and Moore, 1977.)
PUMPING WATER ON LAVA FLOWS IN KAPOHO, HAWAII
Water may chill and partially congeal a flow margin. During the
1960 Kapoho flow, the Hawaii Fire Department pumped water on the
flow margin. Macdonald (1962) found that "it was possible to locally
check the advance of the flow margin. Although the check is tempo
rary, it is sometimes possible in that way to gain the short time--up to
several hours--that may be needed to remove furnishings or other
materials from a building, or even to remove the building itself."
This has obvious application to a geothermal development. If
warranted, a sufficient supply of water might be kept on hand for lava
cooling purposes; possibly from the same source as the power plant
cooling water. The amount of rainfall in geothermal areas should also
be considered (e.g. figure 5).
PUMPING WATER ON LAVA FLOWS ON HEil\1AEY ISLAND, ICELAND
In 1973, when lava flows threatened a coastal town on Heimaey
Island, Iceland, a program was designed to: (1) slow advancing lava
by pumping great volumes of seawater over the flow and (2) divert the
lava flow using a diversion barrier. The water-pumping program was
the largest ever attempted. Seventy-five men working at times around
the clock, sprayed approximately 7. 3 million cubic yards of seawater
onto the lava flow at a cost of $1.5 million. The pumped water
converted 5. 5 million cubic of molten lava into solid rock, cooling the
lava 50 to 100 times more rapidly than self-cooling. A specialized
system of pumps and piping was utilized. (See Lockwood, 1983.)
-11-

BOMBING OF LAVA CHANNELS ON MAUNA LOA, HAWAII
This technique can only be used in appropriate situations, i.e. to
break-down walls of near-vent lava channels, clogging them, thereby
lessening the supply of lava to distal lava flow fronts. This would
promote spreading of the flow in the bombed areas. Bombing of Mauna
Loa flows was tried twice; but was not particularly useful in those sit
uations (Macdonald, 1962). The legal ramifications of damages caused
by diverting flow paths should be explored.
EMERGENCY PLANNING AT THE GEOTHERMAL DEVELOPMENT IN KRAFLA, ICELAND
In 1975 an emergency situation developed at Krafla, in Northern
Iceland. A geothermal power plant under construction was located
within 1 km of the locus of ground deformation and seismic activity of
the type that proceeds volcanic eruptions. This activity continued for
over five years with construction proceeding normally though several
small lava eruptions occurred within 2 km of the plant. Careful
contingency plans were designed for the evacuation of site workers,
but the lava flows did not directly contact the power plant. On one
occasion lava did rise into one of the well bore-holes without
significant effect. Construction was concluded and the geothermal
development is now operating.
This particular development is sited in a rift zone similar to the
Hawaiian rift zones. Detailed emergency planning should draw upon
the contingency plans which resulted from this experience in Iceland
(see Tryggvason, 1973).
-12-

GEOLOGIC HAZARD ANALYSIS
MAUl
A Maui volcanic hazard map has been prepared by D. Crandell
(1983) which describes the frequency of past eruptions.
Haleakala Southwest Rift Zone
Flows range from 200 to 20,000 years old. Six flows have
erupted in this area within the last 1000 years. Based on past
activity, the average rate of eruption is one per 150-200 years. The
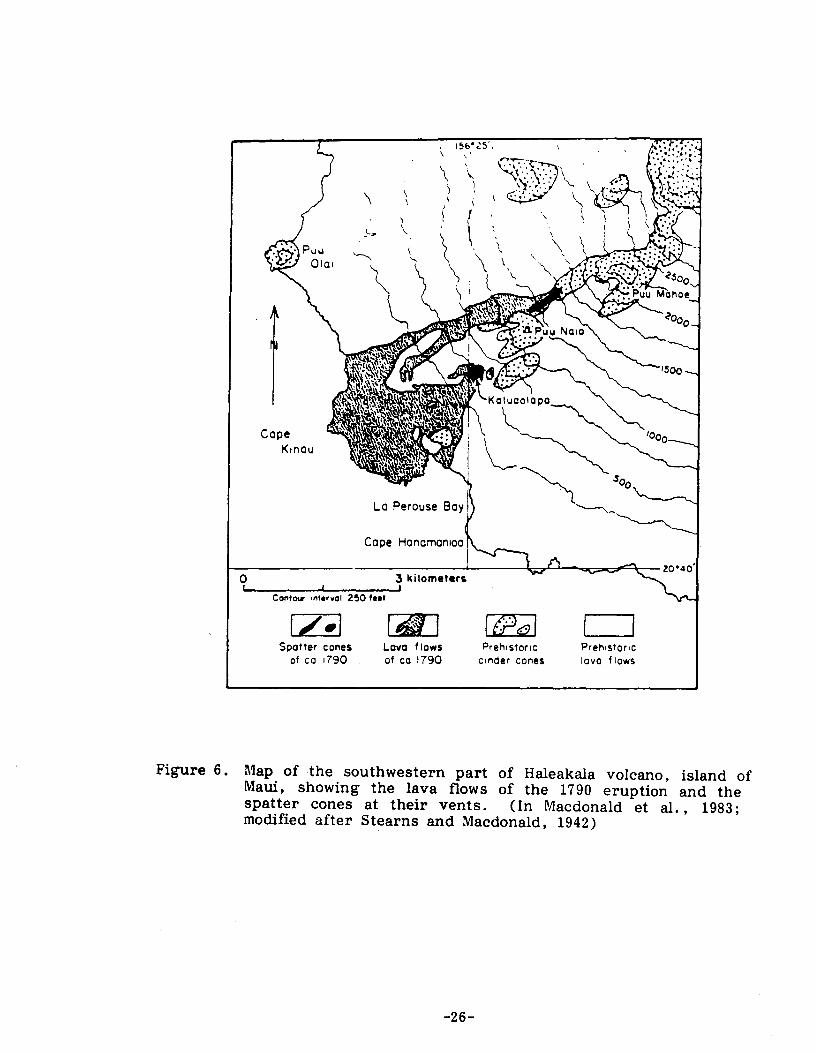
last flow occurred in 1790 by the coast; it was the largest (6 km2) of
the more recent flows. See figures 6 and 7.
Haleakala East Rift Zone
The most recent flow on the east side of Haleakala is just north
of this geothermal resource area between Olopawa and Puu Puou; it is
about 500 years old. Based on past activity, the average rate of
eruption is one per 10,000 years.
The above risk from volcanic hazards includes dangers from lava
flows and other attendant phenomenon such as pyroclastic fallout,
cracking, subsidence, swelling, and emission of volcanic gases.
The most recent earthquake near Maui occurred in 1938, 40 miles
off the northern coast of East Maui. Some damage to roads and build
ings on Maui and Molokai was reported (Macdonald et al, 1983).
Cracking and subsidence may also be associated with large earth
quakes.
Crandall (1983) states that although Haleakala's "eruptive history
suggests that an eruption could occur on Haleakala within the next
hundred years, there is as yet no way to predict a specific time or
place of the next eruption."
-13-

HAWAII
Figures 8 through 11 show the locations of historic lava flows and
fault systems. Figures 12 through 15 show relative zones of risk from
flows, fallout, subsidence, and ruptures.
Hualalai
The only historic eruption of Hualalai occurred in 1801. It
produced two large flows covering 46 km2 east and north towards the
ocean.
Sev.eral thousand earthquakes, from a source beneath Hualalai,
shook the island in 1929. This may indicate subsurface magmatic
movement or a readjustment or settling of the mountain.
Eruptions and earthquakes (and associated cracking, fallout,
subsidence, etc.) may occur here in the future but it is not possible
to predict the precise time and place of future activity.
Mauna Loa Southwest Rift Zone
o There have been 7 eruptions on the southwest rift zone since
1832; an average of one eruption every 22 years.
o The latest and largest flow occurred in 1950 covering an area of
91 km2. The average flow has been about 34 km2.
o Hawaii's largest earthquake (magnitude 7. 5) occurred in 1868 near
the southern tip of the island.
o Eruptions and earthquakes (and associated hazards of ash fallout,
ground deformation, cracking, and subsidence) are likely to occur
here in the future but it is not possible to predict the precise
time and location of future activity.
o There is no danger from tsunami in this geothermal resource area
since its lowest elevation is about 1500 feet.
-14-

Historic Eruptions of Mauna Loa Southwest Rift
Repose since last Altitude Area of Volume Average
Duration eruption of vent flow2 (m3) thickness
Date (da~s) (months) (m) (km ) (m)
Mar. 1868 15 990 223.7 140,000,000 5.9
Jan. 1887 10 226 1710 29.4 220,000,000 7.5
Jan. 1907 15 240 1860 21.1 75,000,000 3.5
May 1916 14 112 2220 17.2 60,000,000 3.5
Sept. 1919 42 41 2310 23.9 255,000,000 10.7
Apr. 1926 14 77 2280 34.8 110,000,000 3.2
June 1950 23 290 2400 91.0 440,000,000 4.8
Total 95 986 241.1 1,300,000,000
Average 14 164 1967 34.4 186,000,000 6.3 (13. 7 yrs) (21 ft)
Source: Modified after Macdonald, et al, (1983).
Mauna Loa Northeast Rift Zone
o There have been 7 eruptions on the northeast rift zone since
1832; an average of one every 22 years. Most eruptions
originated at elevations higher than the proposed 7000' resource
area cut-off; but flows commonly travel into this area.
o The largest flow, in 1880, covered an area of 62 km 2. The 2
average flow has been about 37 km
o The most recent flow, in Spring 1984, covered an area of over 30 2
km and stopped close to Hilo, Hawaii.
o Earthquakes with magnitudes above 6 have occurred in the saddle
area between Mauna Loa and Kilauea, e.g. magnitude 6. 7 in
November 1983.
o Eruptions and earthquakes (and associated hazards of ash fallout,
ground deformation, cracking, subsidence, etc.) are likely to
occur here in the future but it is not possible to predict the
precise time and place of future activity.
-15-
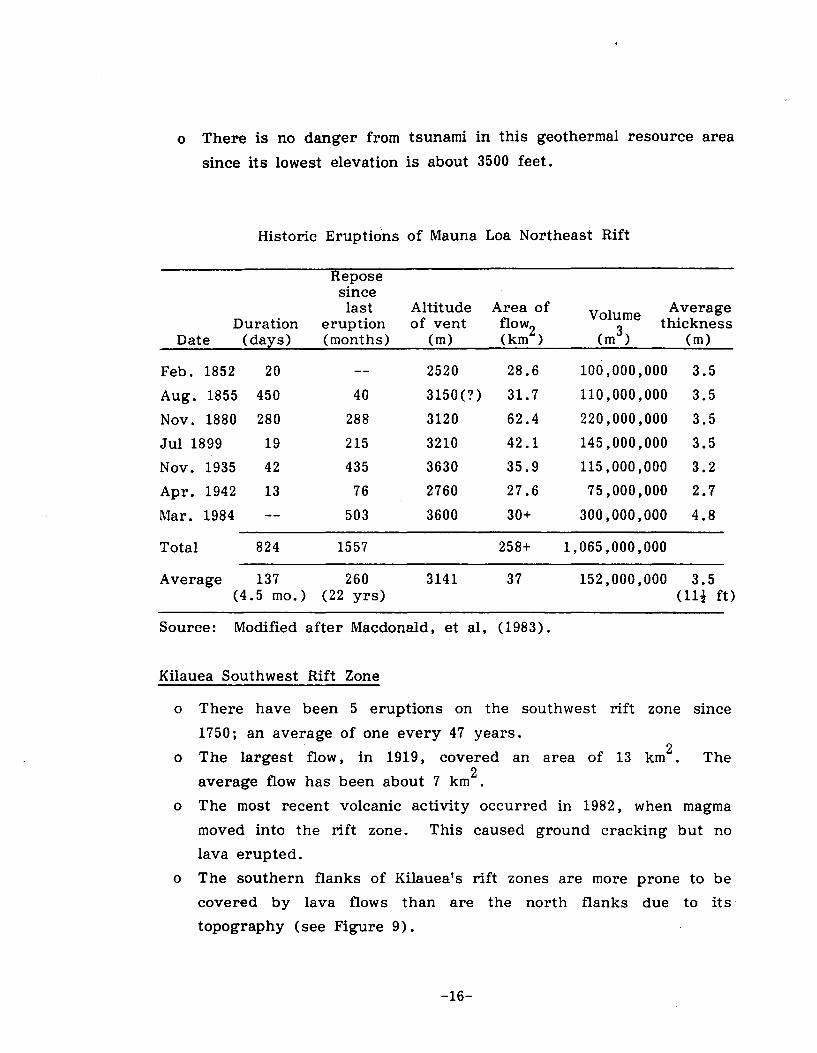
o There is no danger from tsunami in this geothermal resource area
since its lowest elevation is about 3500 feet.
Historic Eruptions of Mauna Loa Northeast Rift
Duration Date (days)
Feb. 1852 20
Aug. 1855 450
Nov. 1880 280
Jul 1899 19
Nov. 1935 42
Apr. 1942 13
Mar. 1984
Total 824
Repose since last
eruption (months)
40
288
215
435
76
503
1557
Average 137 260 (4.5 mo.) (22 yrs)
Altitude Area of of vent flow2 (m) (km )
2520 28.6
3150(?) 31.7
3120 62.4
3210 42.1
3630 35.9
2760 27.6
3600 30+
258+
3141 37
Source: Modified after Macdonald, et al, (1983).
Kilauea Southwest Rift Zone
Volume Average
(m3) thickness
(m)
100,000,000 3.5
110,000,000 3.5
220,000,000 3.5
145,000,000 3.5
115,000,000 3.2
75,000,000 2.7
300,000,000 4.8
1,065,000,000
152,000,000 3.5 (11! ft)
o There have been 5 eruptions on the southwest rift zone since
1750; an average of one every 47 years. 2 o The largest flow, in 1919, covered an area of 13 km . The
2 average flow has been about 7 km .
o The most recent volcanic activity occurred in 1982, when magma
moved into the rift zone. This caused ground cracking but no
lava erupted.
o The southern flanks of Kilauea's rift zones are more prone to be
covered by lava flows than are the north flanks due to its
topography (see Figure 9) .
-16-

o Earthquakes with magnitudes above 6 have occurred in the saddle
area between Mauna Loa and Kilauea, the largest being of mag
nitude 6. 7 in November 1983.
o Eruptions and earthquakes (and associated hazards of ash fallout,
ground deformation, cracks, subsidence, etc.) are likely to occur
here in the future; but it is not possible to predict the precise
time and place of future activity. Intervals between historic
eruptions in the southwest rift zone have varied from 3 years
(1971 to 1974) to 52 years (1919 to 1971).
o There may be some danger from tsunami and ground subsidence
in the coastal portion of this geothermal resource area.
Historic Eruptions of Kilauea Southwest Rift
Repose since last Altitude Area of Volume Average
Duration eruption of vent flow2 (m3) thickness
Date (days) (months) (m) (km ) (m)
May 1823 Short 400 10 11,000,000 1.1
Apr. 1868 Short 539 770 .1 183,000 1.8
Dec. 1919 221 620 900 13 45,300,000 3.5
Sep 1971 5 615 1000 3.9 7,700,000 2.0
Dec. 197 4 1 38 1080 7.5 14,300,000 1.9
Total 1812 34.5 78,483,000
Average Short 453 830 6.9 16,000,000 2.7 (38 yrs) (9 ft)
Source: Modified after l\lacdonald, et al, (1983).
Kilauea Upper East Rift Zone
For purposes of this hazard analysis the east rift zone is divided
into upper and lower segments. A line extending roughly north of
Kala pan a distinguishes these two areas (see line A-A, figure 8).
Eruptions at the caldera area were not considered as a rift zone
eruption.
-17-

o There have been 21 eruptions on the upper east rift zone since
1750; an average of one every 11 years.
o The largest flow, the Mauna Ulu flow of 1972, covered an area of
0
2 2 35 km . The average flow has been about 6 km . However, the
greater volumes of the more recent eruptions may be a better
guide to future events than the generally small-volume historic
eruptions prior to 1969.
The current Pu'u 0 eruption has covered an area over 30 km2.
This eruption began in January 1983 and has been through 23
phases so far. The localized present danger will subside after
the Pu'u 0 eruption is determined to have ended by qualified
geologists.
o The southern flanks of Kilauea's rift zones are much more prone
to be covered by lava flows than are the north flanks due to its
topography (see Figure 9) . Figure 10 graphically depicts the
percentage of ground covered by lava flows, from 1954 to 1984,
as it varies with distance north and south of the rift zone axis.
o The largest recent earthquake (magnitude 7.2) occurred in 1975
about 5 km southwest of Kalapana. It resulted in cracking,
subsidence, and tsunami (Macdonald et al, 1983).
o Most volcanic cracking and subsidence are centered about the rift
zone. However, there is considerable faulting associated with the
Koae and Hilina fault system south of the caldera (See Figure 3).
o There may be some danger from tsunami and ground subsidence
in the coastal portion of this geothermal resource area.
o As Kilauea is highly active, eruptions and earthquakes (and asso
ciated hazards of ash fallout, ground deformation, cracks,
subsidence, etc.) will occur here in the future; but it is not
possible to predict the precise time and place of future activity.
Intervals between historic eruptions in the upper east rift zone
have varied from days apart (1973) to 38 years (1923 to 1961).
-18-

Historic Eruptions of Kilauea Upper East Rift*
Duration Date (days)
Repose since last
eruption (months)
Altitude Area of of vent flow2 (m) (km )
Average thickness
(m}
May 1840 "" 26
May 1922 2
900 3.4**
983 800 .1
41,000,000** 12
?
Aug. ~923 1 16 900 .5 73,000 .2
Sep 1961 3 456 500 .8 2,200,000 2.8
Dec. 1962 2
Aug. 1963 2
Oct. 1963 1
Mar. 1965 10
Dec. 1965 1
Aug. 1968 5
Oct. 1968
Feb. 1969
May 1969
Feb. 1972
May 1973
15
6
867
455
1
15 950 .1 310,000
9 900 .2 800,000
2 900 3.4 6,600,000
17 750 7.8 16,800,000
9 920 .6 850,000
40 650 .1 130,000
2 850 2.1 6,600,000
4 900 6.0 16,100,000
3 940 12.5 176,700,000
4 940 35.1 119,600,000
0 990 .3 1,200,000
Nov. 1973 30 6 925 1.0 2,700,000
Dec. 1973 203 0 940 8.1 28,700,000
July 1974 3 0 1040 3.1 6,600,000
Sep. 1977 18 38 550 7.8 32,900,000
Nov. 1979 1 25 970 . 3 580,000
3.1
4.0
1.9
2.2
1.4
1.3
3.1
2.7
14.1
3.4
4.0
2. 7 .
3.5
2.1
4.2
1.9
Jan. 1983 520+ 39 750 30+ 200,000,000+ 6.7 ----------------------------------~~~------~--
Total 520+ 1668 126 667,643,000
Average 103 83 855 6 32,000,000 7.6 (3.5 mo.) (7 yrs) (25 ft)
* In this report, a line extending roughly north of Kalapana distinguishes the lower and upper east rift zone (see Figure 8). Eruptions in the caldera area were not considered as a rift zone eruption.
**The 1840 flow occurred roughly 1/5 within the upper east rift and 4/5 within the lower east rift; the appropriate fractional portion is shown in the table.
Source: Modified after Macdonald, et al (1983).
-19-

Kilauea Lower East Rift Zone o There have been 5 eruptions on the lower east rift zone since
0
0
0
0
0
1750; an average of one every 47 years. 2 The largest flow, in 1955, covered2 an area of 16 km . The average flow has been about 11 km • The most recent flow, in 1960, covered an area of about 11 km
2
near and in Kapoho. The southern flanks of Kilauea's rift zones are much more prone to be covered by lava flows than are the north flanks due to its topography (see Figure 9). Figure 10 graphically depicts the percentage of ground covered by lava flows, from 1954 to 1984, as it varies with distance north and south of the rift zone axis. Intervals between historic eruptions have varied from 5 years (1955 to 1960) to 115 years (1840 to 1955). It is not possible to predict the precise time and place of future eruptions. The earthquake of 1868 on the southern tip of the island was the largest earthquake in this area (magnitude 7. 5).
0 There may be some danger from tsunami and ground subsidence in the coastal portion of this geothermal resource area.
Historic Eruptions of Kilauea Lower East Rift*
Duration Date (days)
1750 (?)
1790 (?)
May 1840
Feb. 1955
Jan. 1960
Total
Average
26
88
36
50
Repose since last
eruption (months)
480
605
1384
56
2525
631 (53 yrs)
Altitude of vent
(m)
510
300
350
175
35
274
Area of flow2 (km )
4.1
7.9
13.8**
15.9
10.7
52.4
10.5
Average thickness
(m)
14,200,000 3.5
27,500,000 3.5
164,000,000** 11.9
87,600,000 5.5
113,200,000 10.6
406,500,000
81,000,000 9.5 (31 ft)
* In this report, a line extending rqughly north of Kalapana distinguishes the lower and upper east rift zone (see Figure 8) • Eruptions in the caldera area were not considered as a rift zone eruption.
**The 1840 flow occurred roughly 1/5 within the upper east rift and 4 I 5 within the lower east rift; the appropriate fractional portion is shown in the table.
Source: Modified after Macdonald, et al, p. 64 (1983)
-20-

EXPLANATION .. Laft.t __ ... ,....., ...
•~ Of' NOVaM•••.o•c• .. ••• •••• IIIII CJ ~........ ...'-cl .......... _ --v ... ,.._ __ ~ .............. ....... , .. , ..... ..,., .......,.. ..... _.....,.
KI~UEA
N
0 ~OF'EET
0 IOOOMETitU
Figure 1. Map of the Kilauea summit area, showing extent of pumice blanket from Kilauea Iki vent in 1959. (In Mullineaux and Peterson, 1974, from Richter and others, 1970)
-21-

,,.30·-----·
,.,, , , ...... --· ,_, .. .,., ___., ___ ....... ....,.,,., ~ Eruoto .. "•-•·--
0 !5 kilometers . o c • ...,.,-_.,.-.__ ____ __, iliJ ..... c ....
Figure 2. Map of part of the east rift zone of Kilauea showing faults, cracks, and lava flows formed in 1961. (In Holcomb, 1980; modified after Richter et al., 1964)
-22-

, .'
• o\)' 0
,, Fault, dashed where 1nferred;
symbol shows s1de that moved down
0 Pit crater
----+-------------19•15 0 Cinder and spatter cone
Fissure 0
knomerera
Figure 3. Map showing the pattern of faults in the Hilina fault system, on the southern flank of Kilauea volcano. (In Macdonald et al., 1983; modified after Stearns and Macdonald, 1946)
-23-

A WEST
8 - ·- -·-
c
D 0
-~-:------·----------~
' ' ' '
1 kilometer
EAST
Meters A Dove Seo L.evel
·900
00
00
Diagram showing the manner of formation of
Makaopuhi, a double pit crater. A. A subcircular fault block sinks. leaving a crater at the surface. (The position and attitude of tht- faults is hypothetical.) The upper walls of the crater collapse to form talus<"s (pilt"s of rock fragments) that hide the lower walls. B. Lava pouring into the cratt-r collects in a deep pool. the surface of which solidifies to form a nt-arly flat floor. C. A second block sinks. making a second crater that cuts across the westem edgt- of the first one. The pool of lava in the bottom of the second crater is from a small eruption in 192 2. D. :\ much Ia r~er eruption (in 19fi5) forms a poo\90 meters dt't'p in tht• st·cond crater.
Noh' tht> slump Sl'<Hps at tht• ed~e of tht· nt·w Ia' '' floor. fornwd as la,·a in tht' c:t•ntral part of the crater dr<~lll~ l>.tck into undnh ·
in~ wnts.
Figure 4. Formation of pit craters. (Macdonald et al. , 1983)
-24-

f o...._, _ ___._'P-~2..0 Km.
. Figure 5. Rainfall of Kilauea. (In Holcomb, 1980; after Taliaferro 1959)
-25-
0
Cope Ktnou
\ \
\ \
\
' 156 \ ..
\ ' \, ! \
3 kilometer$
Conto.. ontervat 250 feet
!7·1 Spotter cones
of co 1790
141 Lava flows of co 1790
~ '. . ·.'. \ -.: .. . ~.,"""-::"·:\g·· ,~ ... ' "\..,
\~ \
Preht stor IC ctnder cones
PrehtstortC tovo flows
Figure 6. Map of the southwestern part of Haleakala volcano, island of Maui, showing the lava flows of the 1790 eruption and the spatter cones at their vents. (In Macdonald et al., 1983; modified after Stearns and Macdonald, 1942)
-26-

I I I I
0
0
-t- 0
0 0 1 ~
0
.,:) /
0 -<\ 0
0 ..-\0
0 0
00 0 0 0
0 0
0 0
0
0 0 0
0
xx X X X
"x X
X X
"' X
Figure 7. Map of Haleakala volcano, showing vents of the Kula (circles) and Hana (crosses) Volcanic Series. i\Iolokini Islet is a t·uff cone on the southwest rift zone of Haleakala. (In l\1acdonald et al., 1983; after Stearns and Macdonald, 1942)
-27-

N '~
o._:::::a;;;;c::ii0._ _ _..20 Kilometers
OC=-o::::::.' •lii:0'=======20 M i I e s Contour intervol 1000 feet
Figure 8. Map of the island of Hawaii, showing the five major volcanoes that make up the island, and the historic lava flows. (Macdonald et al., 1983)
-28-

I
500 - 1000 rra. ·~·
250 - 100 yra. ·~·
• Type A, 8 eruptlonl
C-JJ Type c eruption•
110 - 210 yra ......
eo - 110 yra. a . .-.
0 - 50 yra. B.P.
• Type D eruption•
lEttfJ Type E eruption•
[3 Younger lava flowl
0 Older lava flowe
Figure 9. Summary of Kilauea's eruption history during the last 1500 years. (Holcomb, 1980)
-29-

az -60-
so-
~ -60-
40-
30 ..
/0 ..
+ 8
Kilauea Lower East Rift Zone
Kilauea Upper East Rift Zone
+ 2.
Km south of rift zone axis ' 0 2. 4 6
Km north of rift zone axis
Figure 10. Percentage of ground covered by lava flows, from 1954 to 1984, as it varies with distance north and south of Kilauea's east rift zone axis. If 30 years is the assumed life of a geothermal power plant, these figures suggest the probability that sites may be threatened by burial during their lifetime, as based on Kilauea's history from 1954 to 1984.
-30-
8

0 10
0 10 20
Contour tnllrvol 1000 lett
't' \"
't' \"'
't'
20 "'•les
~ y .-<.
\"'(
"( ~
""
.. ..
't' y
190 .~::~;:~------~~~--~======::::t:::::::::::::~ '(" •• • •• •• • Pr•nC•DOI r~ft ZO"I
~ '< •• • • • • • • • SYIIordtnote r.fl zone LOIHI '< -r-- Known foyil syatem (lylflbol SEAMOUNT o ind•cotes downtllrown s•del
---- s .. specltd foul! system
..1.. ..I.. ..1.. Mo1or ,,.Dmor.ne slump Do,.noor.n
Figure 11. Map showing volcanic rift zones and faults on the island of Hawaii. (In Macdonald et al., 1983; submarine slumps after Normark et al., 1978)
-31-

--- Physit:al boundary, approximately located
-----Judgmental boundary
• I
" . ,._
I I I
• .. .......
Figure 12. Zones of relative risk from lava-flow burial. Risk increases from "a" through "f". (Mullineaux and Peterson, 1974)
-32-

---Judgmental bounda-ry
L
·--·
• . ·-I " ! • .:. ....... •
Figure 13. Zones of relative risk from falling volcanic fragments: H, high; M, medium; L, low. (Mullineaux and Peterson, 197 4)
-33-

...... . . .. •
• I • . ·-
" ............
Figure 14. Volcano rift and shoreline zones subject to relatively high risk from subsidence (cross hachured). (Mullineaux and Peterson, 1974)
-34-

----Judgmental boundary
• I • . --
1 .:. ......... •
Figure 15. General areas of high (H), medium (M); and low (L) risk from surface ruptures. (Mullineaux and Peterson, 1974)
-35-

16a
DRILLHOLES
16b
......
16c
Figure 16A. 1983 lava flow on Mt. Etna in Italy. Figure 16B. Cross-section of explosives placement area. Figure 16C. Typical barrier cross-section
(Figures from Lockwood, 1983)
-36-

REFERENCES
Capuano, Jr., L. E., 1983-84, Testimony before the Board of Land and Natural Resources regarding the Campbell Estate conservation district use application.
Crandell, D. R., 1983, Potential Hazards from Future Volcanic Eruptions on the Island of Mau, Hawaii, United States Geological Survey Mise. Investigation Series Map No. l-1442.
Heisey, C. E., 1983-84, Testimony before the Board of Land and Natural Resources regarding the Campbell Estate conservation district use application.
-Holcomb, R. T., 1980, Kilauea Volcano, Hawaii: Chronolo and Morphology of the Super icial Lava Flows, Dissertation submitted to Dept. of Geology, Stanford Univ.
Lockwood, J.P., 1983, Diversion of Lava Flows at Mt. Etna, Volcano Views, no. 15, p. 5.
Lorins, A. and L. H., 1983, The Fraflity of Domestic Energy, The Atlantic Monthly, Nov. 1983, p. 118-12 .
Macdonald, G. A. , Abbott, A. T. , and Peterson, F. L. , 1983, Volcanoes in the Sea: The Geology of Hawaii, 2d ed., Honolulu, University of Hawaii Press.
Macdonald, G. A., 1962, The 1959 and 1960 Erlttions of Kilauea Volcano, Hawaii, and the Construction of Walls to estrict the Spread of the Lava Flows, Hawaii Institute of Geophysics Contribution No. 42.
application.
Mullineaux, D. R., and Peterson, D. W., 1974, Volcanic Hazards on the Island of Hawaii, United States Geologia! Survey open-file report 74-239.
Niimi, G., 1984, Evidence of Geothermal Potential in Kahaualm, Thermasource, Inc.
Niimi, G., 1983-84, Testimony before the Board of Land and Natural Resources re ardin the Cam bell Estate conservation district use app ICahon.
Peck, D. L. , Thermal properties of basaltic ma~ma: results and tJractical ex1;rrience from study of Hawaiian lava akes, Proceedings of
• S. -Japan oint Science Seminar on Volcano Energy, Hila, Hawaii.
-37-

Sean Report, March 1984, Mauna Loa Volcano, U.S.G.S. Hawaiian Volcano Observatory.
Stearns, H. T. , not dated, The Geothermal Well Field in the Puna District, Hawaii, report prepared for the Hawaiian Electric Company.
True/Mid-Pacific Geothermal Venture, 1982, Revised Environmental Impact Statement for the Kahauale' a Geothermal Project , prepared by R. M. Towill Corp. , Honolulu.
Tryggvason, E., 1979, Rifting of the Plate Boundary in North Iceland 1975-1978, Journal of Geophysical Research, Vol. 84, p. 3029.
Williams, R. S. and Moore, J. G. , 1977, the Eruption on Heimaey, U.S. Geological Survey Publication.
-38-